Download - Charter Schools Annual Report - TN
INSERT STOCK PHOTO HERE
Charter Schools Annual Report Tennessee Department of Education | Office of School Models and Programs | May 2019
1

Introduction Each year, the Tennessee Department of Education produces an annual report on charter schools
operating in the State. In compliance with Tennessee Code Annotated, Title 49, Chapter 13, the
report provides information on the charter school landscape in Tennessee, charter school
numbers, academic performance, enrollment, and student characteristics. All data presented in
the following report is 2017-18 school year data unless otherwise noted.
Additional information regarding public charter schools is available on the Tennessee
Department of Education’s website, including a list of currently operating public charter schools,
application and authorization materials, and answers to frequently asked questions.
Tennessee Charter School Quick Facts for 2017-18 • A total of 110 Tennessee charter schools were located within the geographic boundaries
of four (4) school districts across the State: Hamilton County, Metro Nashville, Shelby
County, and Knox County.
• Six (6) entities acting as local education agencies (LEAs) authorized charter schools to
operate: Hamilton County, Metro Nashville, Shelby County, and Knox County, along with
the Achievement School District (ASD) and the Tennessee State Board of Education
(SBOE).
• Four (4) new charter schools began operating in 2017 and three (3) charter schools were
closed at the end of the 2017-2018 school year.
• The SBOE heard two (2) appeals regarding LEA decisions on new applications and upheld
both decisions.
• Tennessee charter schools enrolled over 37,000 students, roughly 4% of the student
population statewide.
• Approximately 60% of the student population at charter schools was deemed
economically disadvantaged, and over 90% of students belonged to racial and ethnic
minority groups. Charter schools enrolled, on average, 28% more minorities than district-
run schools and 16% more economically disadvantaged students than district-run
schools.
• Approximately 73% of Tennessee charter schools were elementary and middle schools,
while only 27% were high schools.
• 40% of charter schools were identified as TVAAS Level 5 “Most Effective” as compared to
29% of district-run schools.
2
---
• The average charter high school graduation rate was 2% higher than the average high
school graduation rate at district-run schools.
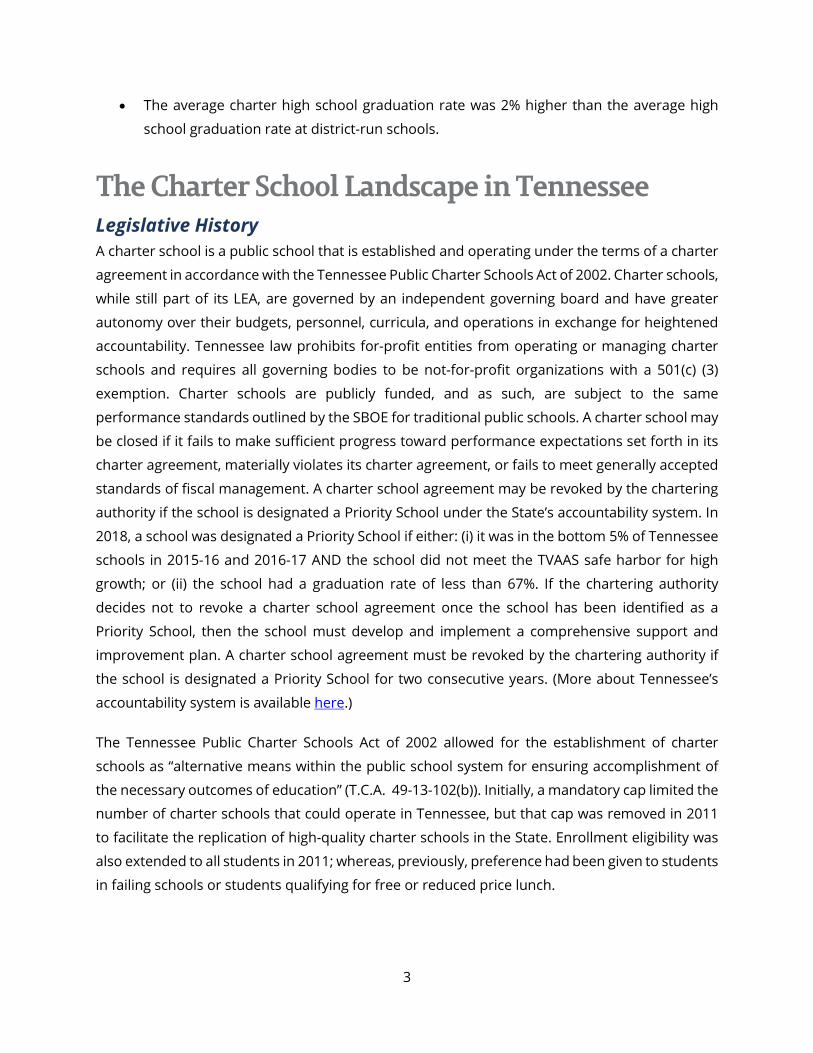
The Charter School Landscape in Tennessee Legislative History A charter school is a public school that is established and operating under the terms of a charter
agreement in accordance with the Tennessee Public Charter Schools Act of 2002. Charter schools,
while still part of its LEA, are governed by an independent governing board and have greater
autonomy over their budgets, personnel, curricula, and operations in exchange for heightened
accountability. Tennessee law prohibits for-profit entities from operating or managing charter
schools and requires all governing bodies to be not-for-profit organizations with a 501(c) (3)
exemption. Charter schools are publicly funded, and as such, are subject to the same
performance standards outlined by the SBOE for traditional public schools. A charter school may
be closed if it fails to make sufficient progress toward performance expectations set forth in its
charter agreement, materially violates its charter agreement, or fails to meet generally accepted
standards of fiscal management. A charter school agreement may be revoked by the chartering
authority if the school is designated a Priority School under the State’s accountability system. In
2018, a school was designated a Priority School if either: (i) it was in the bottom 5% of Tennessee
schools in 2015-16 and 2016-17 AND the school did not meet the TVAAS safe harbor for high
growth; or (ii) the school had a graduation rate of less than 67%. If the chartering authority
decides not to revoke a charter school agreement once the school has been identified as a
Priority School, then the school must develop and implement a comprehensive support and
improvement plan. A charter school agreement must be revoked by the chartering authority if
the school is designated a Priority School for two consecutive years. (More about Tennessee’s
accountability system is available here.)
The Tennessee Public Charter Schools Act of 2002 allowed for the establishment of charter
schools as “alternative means within the public school system for ensuring accomplishment of
the necessary outcomes of education” (T.C.A. 49-13-102(b)). Initially, a mandatory cap limited the
number of charter schools that could operate in Tennessee, but that cap was removed in 2011
to facilitate the replication of high-quality charter schools in the State. Enrollment eligibility was
also extended to all students in 2011; whereas, previously, preference had been given to students
in failing schools or students qualifying for free or reduced price lunch.
3

Enacted in 2017, the Tennessee High-Quality Charter Schools Act was aimed at increasing the
number of high-performing charter schools in Tennessee. This Act required charter authorizers
to adopt high-quality authorizing practices and established an authorizer fee to be paid by
charter schools to the LEA for costs associated with charter authorizing. It also clarified funding
procedures for charter schools and established a grant that could be used by charter schools to
purchase school facilities or to pay for renovation and maintenance costs for existing facilities.
Local boards of education, the ASD, and the SBOE serve as charter school authorizers in
Tennessee. Local boards of education authorize the majority of charter schools and were once
the only charter authorizers in Tennessee. The SBOE receives requests for appeals from charter
school applicants that have been denied by their local boards of education. The SBOE can choose
to uphold or overturn a local board’s denial. The SBOE can only serve as the authorizer for charter
schools whose applications are denied by a local board with at least one Priority School operated
by the district. If the district does not have a Priority School, a reversal by the SBOE upon appeal
will result in the local board serving as the authorizer for the school. The establishment of the
ASD in 2012 created a State-run entity with the power to authorize charters for schools
designated as Priority Schools; in 2017-18, it authorized 24 charter schools.
Charter Schools by the Numbers
Six (6) authorizing entities exist in Tennessee. Local boards of 110 charter schools education acting as authorizers include Hamilton County, Knox
operated during the County, Metro Nashville, and Shelby County. Charter schools are 2017-18 school year, also authorized by the ASD and the SBOE. In 2017-18, a total of
110 charter schools operated within the geographic bounds of serving 37,327 the school districts above, serving 37,327 students. students. Figure 1 depicts the change in total number of charter schools statewide since the first charter
school opened in 2003-04.
4

• I ■ ■ ■
T T T T T T T
100
3
Figure 1. Openings and Closings of Charter Schools over Time N
umbe
r of
Sch
ools 80
60
40
20
0 4 3 5 0 1 4 5 9 10 11 20
14 22
4 110 4
7 12 11 12
16 20
29 39
47 63
76 98
99
0 0
0 0 1 0
0
1
0
0
3
3
2004 2005 2006 2007 2008 2009 2010 2011 2012 2013 2014 2015 2016 2017 2018
Figure 2 shows the corresponding growth in charter school enrollment since 2010 with the
number of students expanding nearly 550%, from around 5,000 to over 37,000 students.
Figure 2. Growth in Charter School Enrollment over Time
Number Opened Number Continuing Number Closed
4,844 5,473
8,731
12,044
15,839
22,143
29,508
33,799
37,327
0
5,000
10,000
15,000
20,000
25,000
30,000
35,000
40,000
2010 2011 2012 2013 2014 2015 2016 2017 2018
Num
ber
of s
tude
nts
5

Even with the growth in students enrolled in charter schools, charter enrollments still only
account for approximately 4% of the total 975,222 public school students in the State. Table 1
below breaks down charter enrollment across the authorizers at the end of the 2017-18 school
year.
Table 1. Charter School Enrollment by Authorizer, EOY 2017-18
Number of Charters
Charter only Enrollment
Total Enrollment
% Charter Enrollment
Hamilton County 4 1,134 43,830 2.6%
Metro Nashville 29 11,409 82,424 13.8%
Shelby County 51 15,259 106,381 14.3%
Achievement School District
24 8,995 10,979 81.9%
Knox County 1 374 59,365 0.01%
Tennessee State Board of Education 1 156 n/a n/a
Tennessee 110 37,327 975,222 3.8%
Eleven (11) charter schools have closed since enabling legislation was enacted. Nine (9) of those
closures occurred during the last five (5) years. At the same time, authorizers have set a high bar
for charter approval. Table 2 documents the ratio of new applications submitted compared to
new applications approved, as well as the ratio of the number of appeals to the SBOE compared
to the number of successful appeals. To date, 36% of charter school applications have been
approved by their respective local boards of education, and only 29% of charter school appeals
to the SBOE have been successful.
6

Table 2. Charter School Applications, Approvals, and Appeals
Year # New Applications:
# Approved # SBOE Appeals: #
Successful # ASD Applications:
# Approved
2002 8:4 3:0 --2003 18:4 8:1 --2004 14:7 2:1 --2005 3:0 1:0 --2006 5:2 1:0 --2007 10:4 1:0 --2008 12:6 1:1 --2009 28:8 9:0 --2010 23:11 6:2 --2011 38:6 20:15 9:2 2012 15:5 5:1 10:8 2013 22:4 3:0 18:9 2014 26:17 6:0 7:1 2015 25:11 6:2 8:2 2016 17:8 1:1 --2017 21:4 2:0 --2018 20:9 4:0 --Total 305:110 78:23 52:22
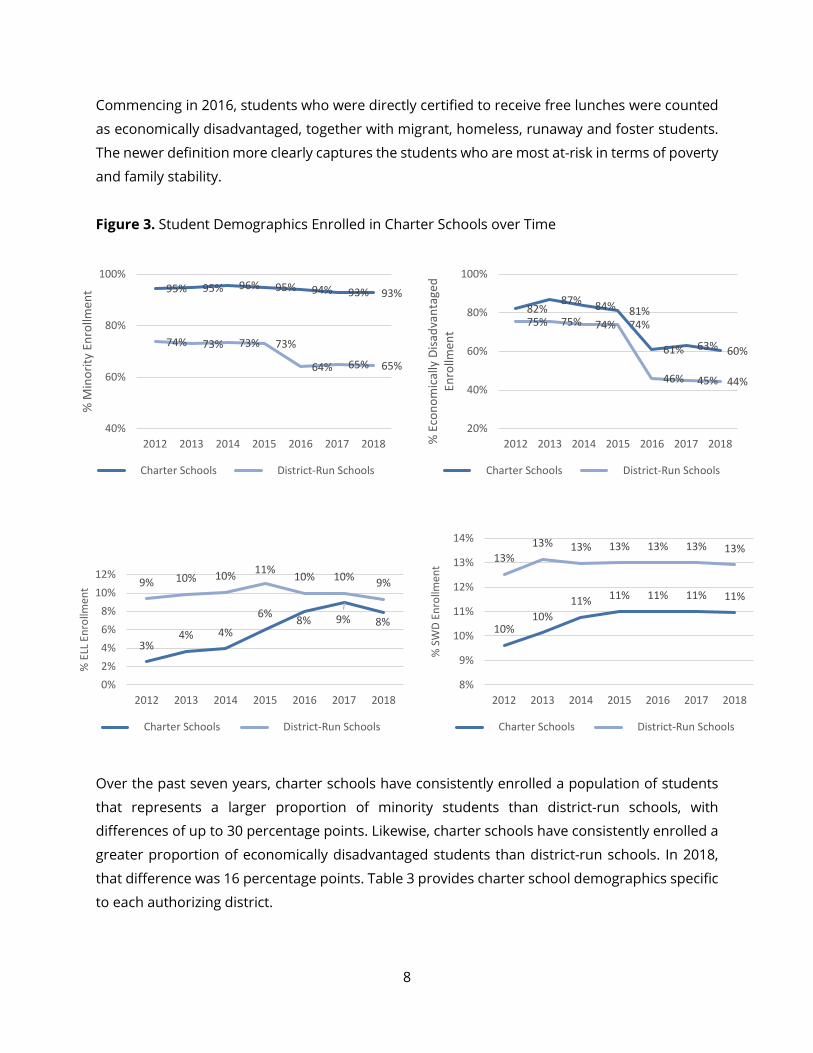
Student Characteristics The following sections compare the demographics of students in charter schools to the
demographics of students in non-charter schools within the same district. Throughout this
report, the non-charter public schools within districts that authorize charter schools are referred
to as “district-run” schools. Total charter comparisons reflect students in all charter schools
compared to students in non-charter, traditional public schools in districts with charter schools.
Compared to district-run schools, Tennessee’s charter schools enroll a larger proportion of
minority and economically disadvantaged students. Figure 3 depicts the percentages of minority
students, economically disadvantaged students, English language learners (ELL), and students
with disabilities (SWD) enrolled in charter schools compared to district-run schools since 2012.
The drastic reduction of students identified as economically disadvantaged from 2015 to 2016
resulted when the State redefined the term. In previous years, the State's definition of
"economically disadvantaged" counted all students receiving free or reduced-priced lunches.
7
'=--------
~,,,,. _________ _ -
% E
LL E
nrol
lmen
t %
Min
ority
Enr
ollm
ent
Commencing in 2016, students who were directly certified to receive free lunches were counted
as economically disadvantaged, together with migrant, homeless, runaway and foster students.
The newer definition more clearly captures the students who are most at-risk in terms of poverty
and family stability.
Figure 3. Student Demographics Enrolled in Charter Schools over Time
100% 100%
% S
WD
Enro
llmen
t %
Eco
nom
ical
ly D
isadv
anta
ged 96%95% 95% 95% 94% 93% 93%
75% 75% 74% 74%
60%
82% 87% 84% 81%
61% 63%
80% 80%
73% 73% 73%74%
64%
Enro
llmen
t
60% 65% 65%
60% 46% 45% 44%40%
40% 20% 2012 2013 2014 2015 2016 2017 2018 2012 2013 2014 2015 2016 2017 2018
Charter Schools District-Run Schools Charter Schools District-Run Schools
14% 13% 13% 13% 13% 13% 13% 13%13%11%12% 10% 10% 10% 10%9% 9% 12%10% 11% 11% 11% 11%11%
8% 6% 4% 2%
3% 4% 4%
6% 8% 9% 8% 11%
10%
10% 10%
9%
0% 8% 2012 2013 2014 2015 2016 2017 2018 2012 2013 2014 2015 2016 2017 2018
Charter Schools District-Run Schools Charter Schools District-Run Schools
Over the past seven years, charter schools have consistently enrolled a population of students
that represents a larger proportion of minority students than district-run schools, with
differences of up to 30 percentage points. Likewise, charter schools have consistently enrolled a
greater proportion of economically disadvantaged students than district-run schools. In 2018,
that difference was 16 percentage points. Table 3 provides charter school demographics specific
to each authorizing district.
8

Table 3. Demographics of Charter Schools by Authorizer, 2018
Hamilton County MNPS Shelby County ASD Knox County
Charter Schools
District-Run
Schools
Charter Schools
District-Run
Schools
Charter Schools
District-Run
Schools
Charter Schools
District-Run
Schools
Charter Schools
District-Run
Schools
% White 20% 54% 19% 31% 1% 8% 2% 2% 15% 71% % Black 55% 30% 48% 41% 88% 75% 92% 96% 79% 16% % Hispanic 24% 13% 32% 24% 10% 15% 6% 2% 6% 9% % Asian <1% 3% 2% 5% <1% 2% <1% <1% N/A 3% %Hawaiian/ Pacific Islander N/A <1% <1% <1% <1% <1% <1% N/A N/A <1%
% Economically Disadvantaged
34% 38% 52% 46% 61% 56% 73% 85% 59% 28%
% ELL 13% 6% 15% 17% 5% 8% 4% <1% 4% 5%
% SWD 9% 13% 12% 13% 9% 12% 14% 11% 11% 14%
School Size and Structure Charter schools have the freedom to organize and structure themselves in the manner they
determine to be most effective for educating students. Many use the same models as traditional
district-run schools, organizing into Elementary, Middle, and High schools.
Figure 4 shows the planned grade configurations of all 2017-18 operating charters as indicated
in their original charter applications. As illustrated, most charters planned to operate as either
Elementary or Middle schools. However, there are eight (8) schools that planned to span
Elementary and Middle school grades, nine (9) that planned to span Middle and High school
grades, and one (1) that planned to span Elementary, Middle, and High school.
9

-
Figure 4. Grade Configurations of Charter Schools
40 36 36
Num
ber
of S
choo
ls 30
20
10
0
20
8 9
1
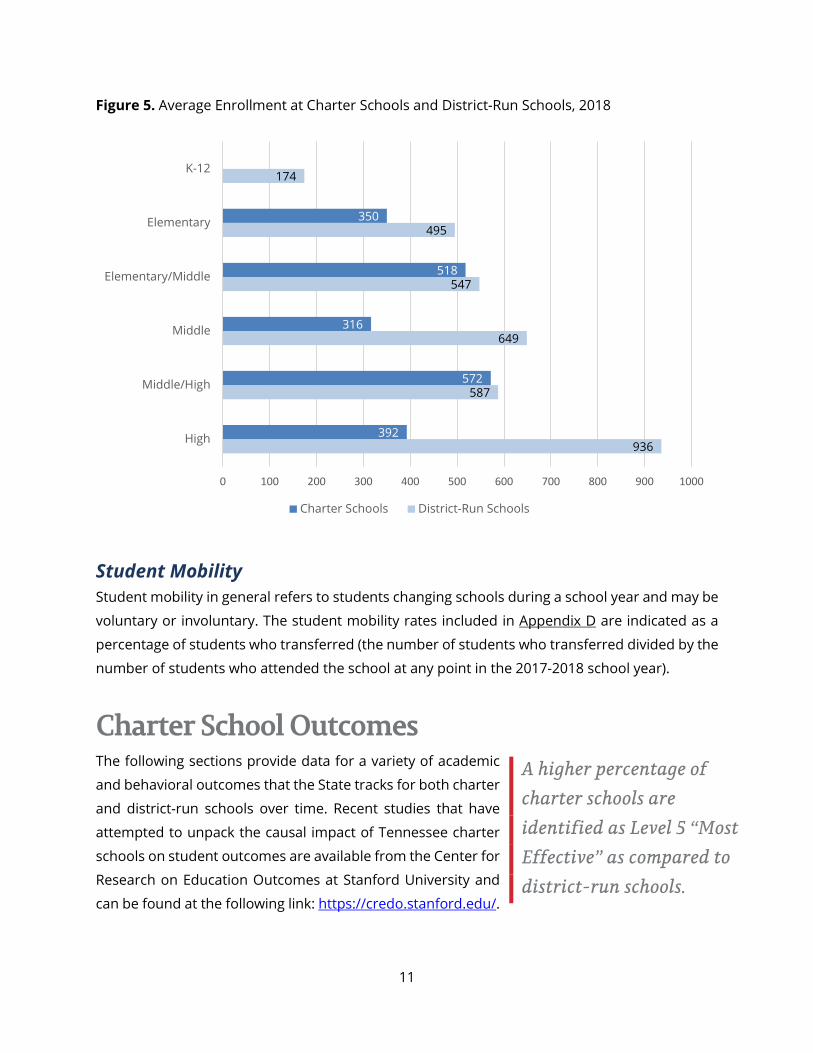
Charter schools in Tennessee tend to enroll fewer students than comparable district-run schools
(Figure 5). Only charter schools that have reached their full grade span are included in the total
school enrollment average (31 charter schools that had not reached their full grade span were
excluded). Many new charter schools tend to scale up over time, often starting with only a single
grade and taking multiple years to reach a planned grade configuration. Characteristics of
individual charter schools are listed in Appendix A.
10
■ ■
Figure 5. Average Enrollment at Charter Schools and District-Run Schools, 2018
K-12
Elementary
Elementary/Middle
Middle
Middle/High
High 936
587
649
547
495
174
392
572
316
518
350
0 100 200 300 400 500 600 700 800 900 1000
Charter Schools District-Run Schools
Student Mobility Student mobility in general refers to students changing schools during a school year and may be
voluntary or involuntary. The student mobility rates included in Appendix D are indicated as a
percentage of students who transferred (the number of students who transferred divided by the
number of students who attended the school at any point in the 2017-2018 school year).
Charter School Outcomes The following sections provide data for a variety of academic
and behavioral outcomes that the State tracks for both charter
and district-run schools over time. Recent studies that have
attempted to unpack the causal impact of Tennessee charter
schools on student outcomes are available from the Center for
Research on Education Outcomes at Stanford University and
can be found at the following link: https://credo.stanford.edu/.
A higher percentage of charter schools are identified as Level 5 “Most Effective” as compared to district-run schools.
11

■ ■
Value-Added Measures of School Effectiveness Tennessee’s accountability system holds schools accountable for the academic performance of
their students. The Tennessee Value Added Assessment System (TVAAS) provides measures of
school effectiveness by estimating the impact teachers and schools have on their students’
academic progress.
TVAAS measures growth in student achievement from one year to the next. Schools earn
composite TVAAS scores each year ranging from Level 1 to Level 5. Level 1 schools are described
as “Least Effective,” while Level 5 schools are “Most Effective." A Composite TVAAS score of 3
indicates that students are making expected levels of growth across a year. Composite TVAAS
scores measure growth in math, reading, science, and social studies on TNReady exams for
schools serving grades 3-8. For schools offering end-of-course (EOC) exams, Composite TVAAS
scores measure students’ growth in English I, English II, English III, Algebra I, Algebra II, Biology,
and U.S. History.
As shown in Figure 6, both charter schools and district-run schools display variation in overall
effectiveness as measured by Composite TVAAS scores. Approximately 63% of charter schools
received TVAAS scores that suggest students were making expected or greater than expected
growth (TVAAS 3-5). Most notably, a significantly higher percentage of charter schools (40%) are
identified as Level 5 “Most Effective” as compared to district-run schools (only 29%). Composite
TVAAS scores for individual schools, where available, are included in Appendices B and C.
Figure 6. Composite TVAAS Scores, 2017-18
40% 40%
33% 31%
29%
19% 20%
7%
16%
7% 9% 9%
0% 1 2 3 4 5
Charter Schools District-Run Schools
12
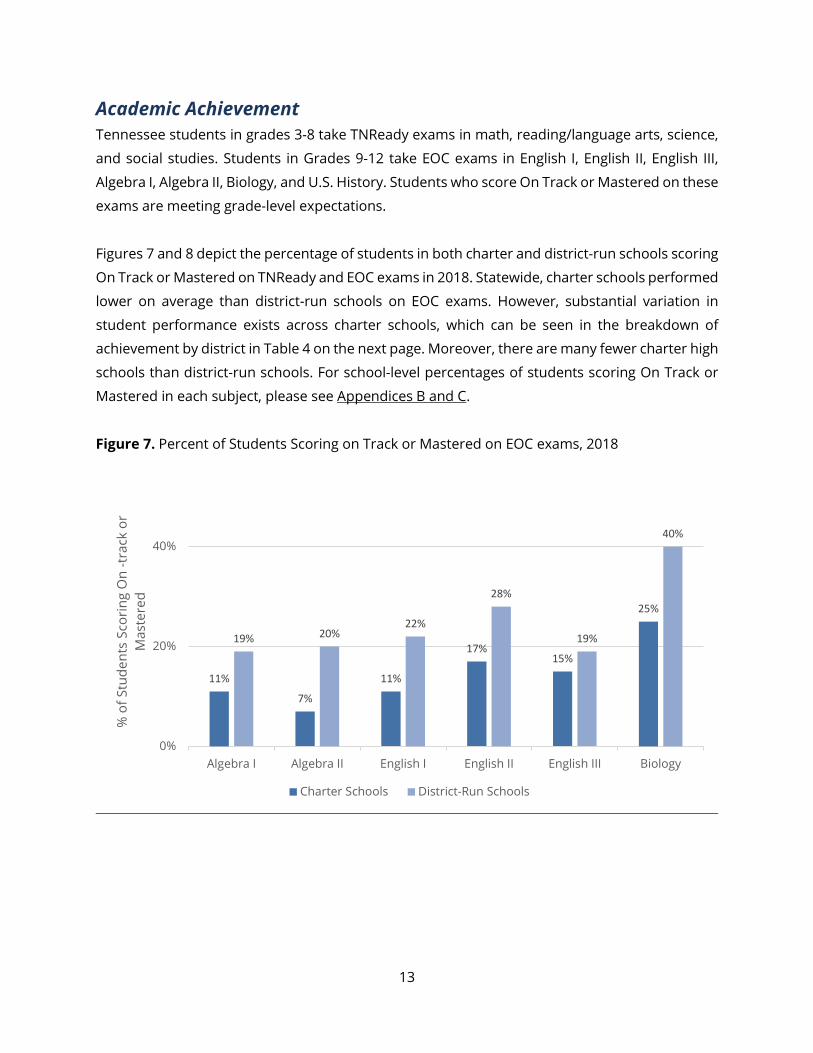
Academic Achievement Tennessee students in grades 3-8 take TNReady exams in math, reading/language arts, science,
and social studies. Students in Grades 9-12 take EOC exams in English I, English II, English III,
Algebra I, Algebra II, Biology, and U.S. History. Students who score On Track or Mastered on these
exams are meeting grade-level expectations.
Figures 7 and 8 depict the percentage of students in both charter and district-run schools scoring
On Track or Mastered on TNReady and EOC exams in 2018. Statewide, charter schools performed
lower on average than district-run schools on EOC exams. However, substantial variation in
student performance exists across charter schools, which can be seen in the breakdown of
achievement by district in Table 4 on the next page. Moreover, there are many fewer charter high
schools than district-run schools. For school-level percentages of students scoring On Track or
Mastered in each subject, please see Appendices B and C.
Figure 7. Percent of Students Scoring on Track or Mastered on EOC exams, 2018
40% 40%
28%
■ ■
15%
11%
25%
17%
22% 20%19% 19%20%
11%
7%
0% Algebra I Algebra II English I English II English III Biology
Charter Schools District-Run Schools
% o
f Stu
dent
s Sc
orin
g O
n -t
rack
or
Mas
tere
d
13

■ ■
Figure 8. Percent of Students Scoring On Track or Mastered on 3-8 TNReady exams, 2018
60%
48% 50% 47%
21% 19%
24%
29% 29% 31%
0%
10%
20%
30%
40%
% o
f Stu
dent
s Sc
orin
g O
n -t
rack
or
Mas
tere
d
Math ELA Science Social Studies
Charter Schools District-Run Schools
Table 4. Percent of Students Scoring On Track or Mastered on TNReady and EOC Exams by
District
Hamilton County MNPS Shelby County ASD Knox County
Charter Schools
District-Run
Schools
Charter Schools
District-Run
Schools
Charter Schools
District-Run
Schools
Charter Schools
District-Run
Schools
Charter Schools
District-Run
Schools TNReady
Reading 22% 34% 30% 26% 16% 23% 8% 6% 21% 38%
Math 17% 36% 35% 23% 16% 24% 10% 7% 19% 38%
EOC Exams
Algebra I 13% 22% 35% ** 8% 11% ** ** N/A 28%
Algebra II 23% 20% 16% ** 5% 13% ** ** N/A 33%
English I 24% 24% 19% 18% 8% 15% ** ** N/A 33%
English II 33% 30% 28% 22% 15% 18% ** 5% N/A 43%
English III 33% 22% 17% 12% 15% 16% 10% ** N/A 30%
Biology I ** 42% 31% 31% 28% 32% 6% ** N/A 60% **District-level results suppressed when there are fewer than 30 valid tests or when percentage On
Track/Mastered is greater than 95% or less than 5%.
14

Chronic Absenteeism and Graduation
Chronic absenteeism is identified as the percentage of students who miss at least 10% of school
days, or about eighteen (18) days if enrolled the full year. Table 5 shows rates of student chronic
absenteeism and graduation across charters and district-run schools in 2018.
Table 5. Chronic Absenteeism and Graduation Rates 2018
Chronic Absenteeism Graduation Charter Schools 15.1% 84% District-Run Schools 15.7% 82%
Chronic absenteeism rates are similar between charter school
and district-run schools. Although high school graduation
rates have in the past been significantly higher in charter
schools as compared to district-run schools, over the last
several years, that gap has largely closed as the graduation
rates at district-run schools have improved.
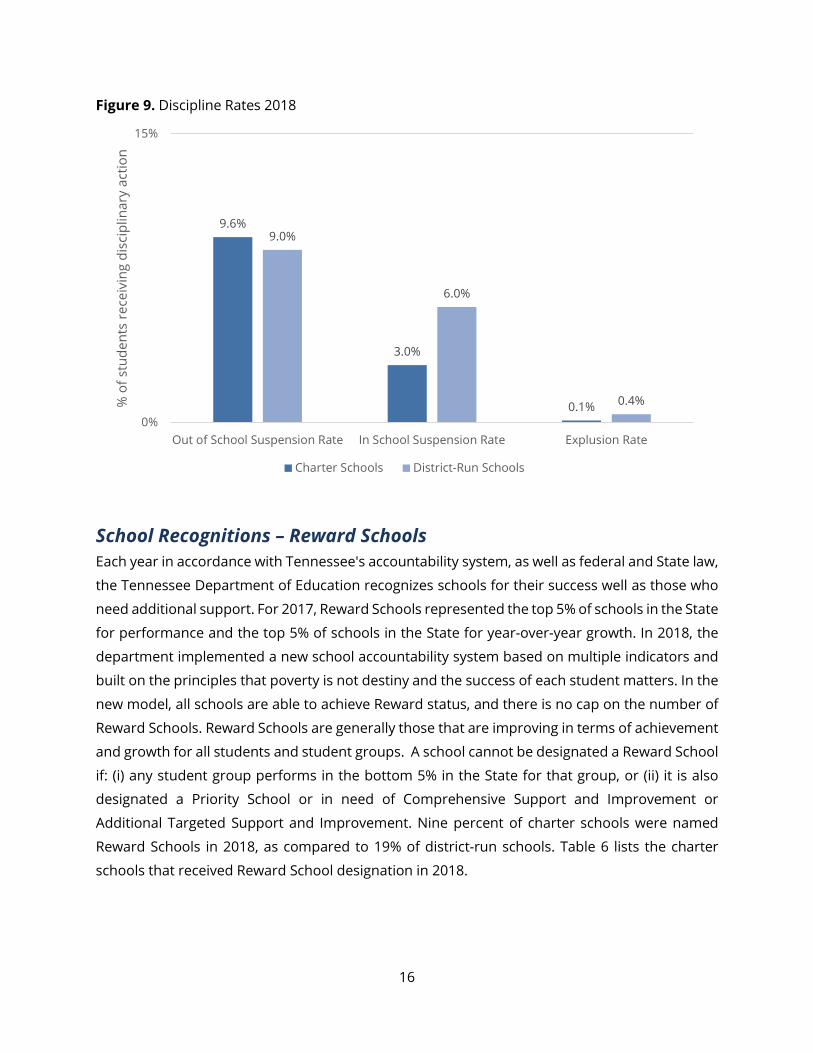
Discipline
The charter high school graduation rate is slightly higher than the district-run high school graduation rate.
Each year, Tennessee schools report on disciplinary incidents experienced by students, including
the reason for the incident and the type of disciplinary action taken. The rates for in-school
suspensions, out-of-school suspensions, and expulsions are calculated as the total number of
students who receive at least one of the specific type of discipline divided by the total number of
students in the specific school overall. This rate takes into account any disciplinary instances
issued to a particular student while that student was enrolled in the particular school throughout
the year. Figure 9 depicts the percentage of students who received disciplinary action (out of
school suspension, in school suspension, or expulsion) during the 2017-18 school year. These
percentages represent all students and all grade levels in charter schools and in district-run
schools.
15
-- -■ ■
Figure 9. Discipline Rates 2018
15% re
ceiv
ing
disc
iplin
ary
actio
n
9.6% 9.0%
6.0%
stud
ents
3.0%
% o
f
0% 0.1% 0.4%
Out of School Suspension Rate In School Suspension Rate Explusion Rate
Charter Schools District-Run Schools
School Recognitions – Reward Schools Each year in accordance with Tennessee's accountability system, as well as federal and State law,
the Tennessee Department of Education recognizes schools for their success well as those who
need additional support. For 2017, Reward Schools represented the top 5% of schools in the State
for performance and the top 5% of schools in the State for year-over-year growth. In 2018, the
department implemented a new school accountability system based on multiple indicators and
built on the principles that poverty is not destiny and the success of each student matters. In the
new model, all schools are able to achieve Reward status, and there is no cap on the number of
Reward Schools. Reward Schools are generally those that are improving in terms of achievement
and growth for all students and student groups. A school cannot be designated a Reward School
if: (i) any student group performs in the bottom 5% in the State for that group, or (ii) it is also
designated a Priority School or in need of Comprehensive Support and Improvement or
Additional Targeted Support and Improvement. Nine percent of charter schools were named
Reward Schools in 2018, as compared to 19% of district-run schools. Table 6 lists the charter
schools that received Reward School designation in 2018.
16
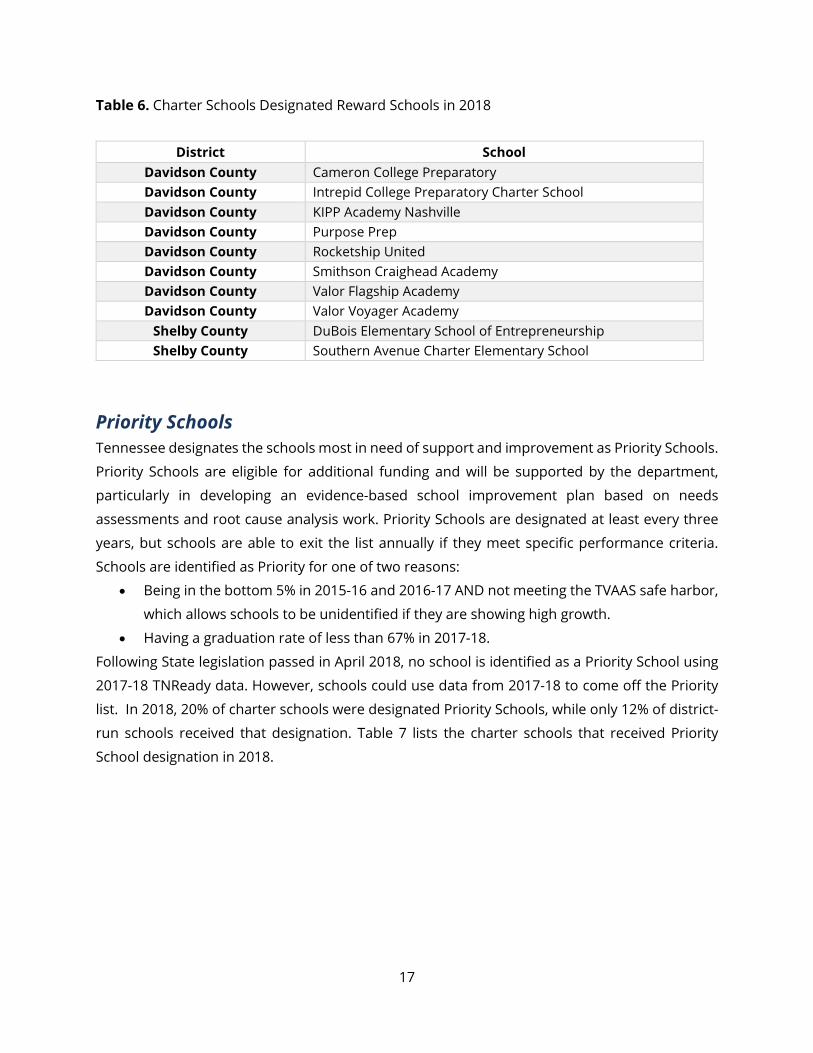
Table 6. Charter Schools Designated Reward Schools in 2018
District School Davidson County Cameron College Preparatory Davidson County Intrepid College Preparatory Charter School Davidson County KIPP Academy Nashville Davidson County Purpose Prep Davidson County Rocketship United Davidson County Smithson Craighead Academy Davidson County Valor Flagship Academy Davidson County Valor Voyager Academy
Shelby County DuBois Elementary School of Entrepreneurship Shelby County Southern Avenue Charter Elementary School
Priority Schools Tennessee designates the schools most in need of support and improvement as Priority Schools.
Priority Schools are eligible for additional funding and will be supported by the department,
particularly in developing an evidence-based school improvement plan based on needs
assessments and root cause analysis work. Priority Schools are designated at least every three
years, but schools are able to exit the list annually if they meet specific performance criteria.
Schools are identified as Priority for one of two reasons:
• Being in the bottom 5% in 2015-16 and 2016-17 AND not meeting the TVAAS safe harbor,
which allows schools to be unidentified if they are showing high growth.
• Having a graduation rate of less than 67% in 2017-18.
Following State legislation passed in April 2018, no school is identified as a Priority School using
2017-18 TNReady data. However, schools could use data from 2017-18 to come off the Priority
list. In 2018, 20% of charter schools were designated Priority Schools, while only 12% of district-
run schools received that designation. Table 7 lists the charter schools that received Priority
School designation in 2018.
17
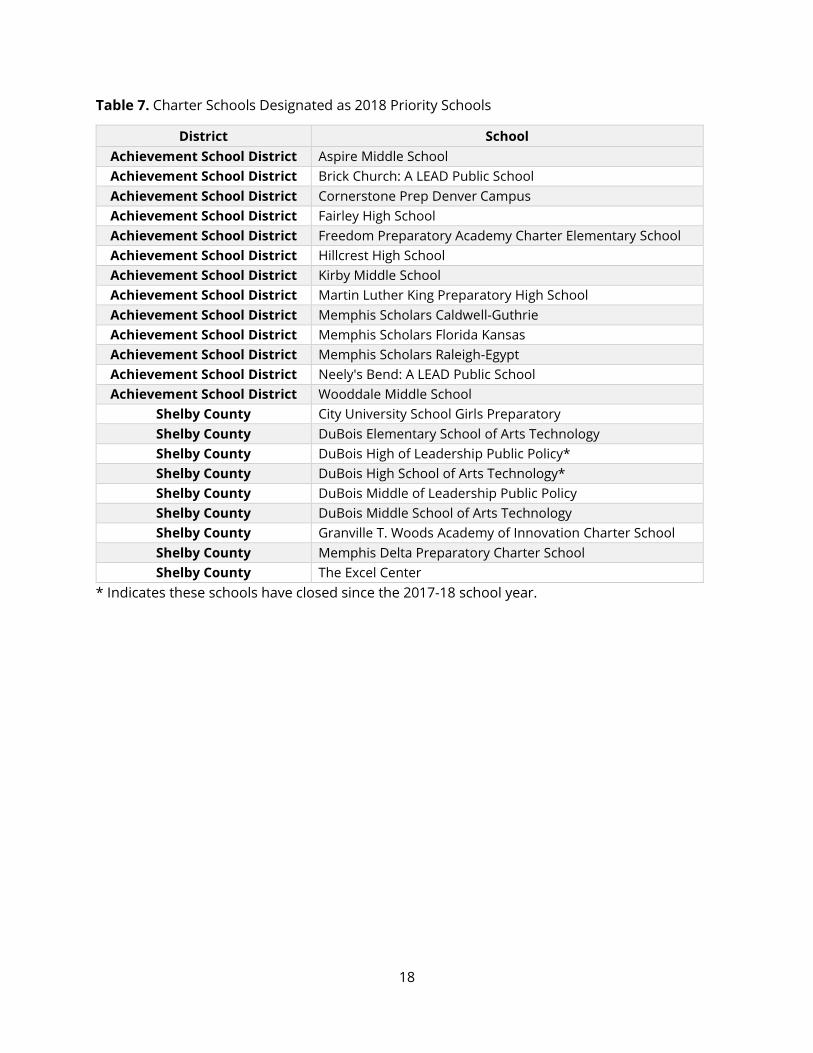
Table 7. Charter Schools Designated as 2018 Priority Schools
District School Achievement School District Aspire Middle School Achievement School District Brick Church: A LEAD Public School Achievement School District Cornerstone Prep Denver Campus Achievement School District Fairley High School Achievement School District Freedom Preparatory Academy Charter Elementary School Achievement School District Hillcrest High School Achievement School District Kirby Middle School Achievement School District Martin Luther King Preparatory High School Achievement School District Memphis Scholars Caldwell-Guthrie Achievement School District Memphis Scholars Florida Kansas Achievement School District Memphis Scholars Raleigh-Egypt Achievement School District Neely's Bend: A LEAD Public School Achievement School District Wooddale Middle School
Shelby County City University School Girls Preparatory Shelby County DuBois Elementary School of Arts Technology Shelby County DuBois High of Leadership Public Policy* Shelby County DuBois High School of Arts Technology* Shelby County DuBois Middle of Leadership Public Policy Shelby County DuBois Middle School of Arts Technology Shelby County Granville T. Woods Academy of Innovation Charter School Shelby County Memphis Delta Preparatory Charter School Shelby County The Excel Center
* Indicates these schools have closed since the 2017-18 school year.
18

Appendices Appendix A. Charter School Enrollment, Type, and Grades Served
Hamilton County
School Enrollment Charter Type Year
Opened
Grades Served (2018)
Chattanooga Girls Leadership Academy 359 Start-up 2009-10 6-12 Ivy Academy, Inc. 216 Start-up 2009-10 6-12 Chattanooga Charter School of Excellence 380 Start-up 2011-12 K-5 Chattanooga Charter School of Excellence Middle School 179 Start-up 2015-16 6-8
Metro Nashville Public Schools
School Enrollment Charter Type Year
Opened
Grades Served (2018)
Smithson Craighead Academy 185 Start-up 2003-04 K-4 KIPP Academy Nashville 363 Start-up 2005-06 5-8 Lead Academy 415 Start-up 2007-08 9-12 New Vision Academy 205 Start-up 2010-11 5-8
Liberty Collegiate Academy 460 Start-up 2011-12 5-8 STEM Prep Academy 524 Start-up 2011-12 5-8 Nashville Prep 384 Start-up 2011-12 5-8 East End Preparatory School 750 Start-up 2011-12 K-6 Cameron College Preparatory 626 Conversion 2011-12 5-8 KIPP Nashville Collegiate High School 333 Start-up 2014-15 9-12 Knowledge Academy 292 Start-up 2012-13 5-8 LEAD Prep Southeast 616 Start-up 2013-14 5-9 KIPP Nashville College Prep 343 Start-up 2013-14 5-8 Nashville Classical 377 Start-up 2013-14 K-4 Valor Flagship Academy 485 Start-up 2014-15 5-9 Purpose Prep 341 Start-up 2013-14 K-4 Intrepid College Preparatory Charter School 492 Start-up 2013-14 5-9 Rocketship Nashville Northeast Elementary 418 Start-up 2014-15 K-4 Nashville Academy of Computer Science 407 Start-up 2014-15 5-8 Explore Community School 227 Start-up 2015-16 K-2 Knowledge Academies High School 289 Start-up 2015-16 9-11 Rocketship United 530 Start-up 2015-16 K-4 STEM Prep High School 377 Start-up 2015-16 9-11
A-1
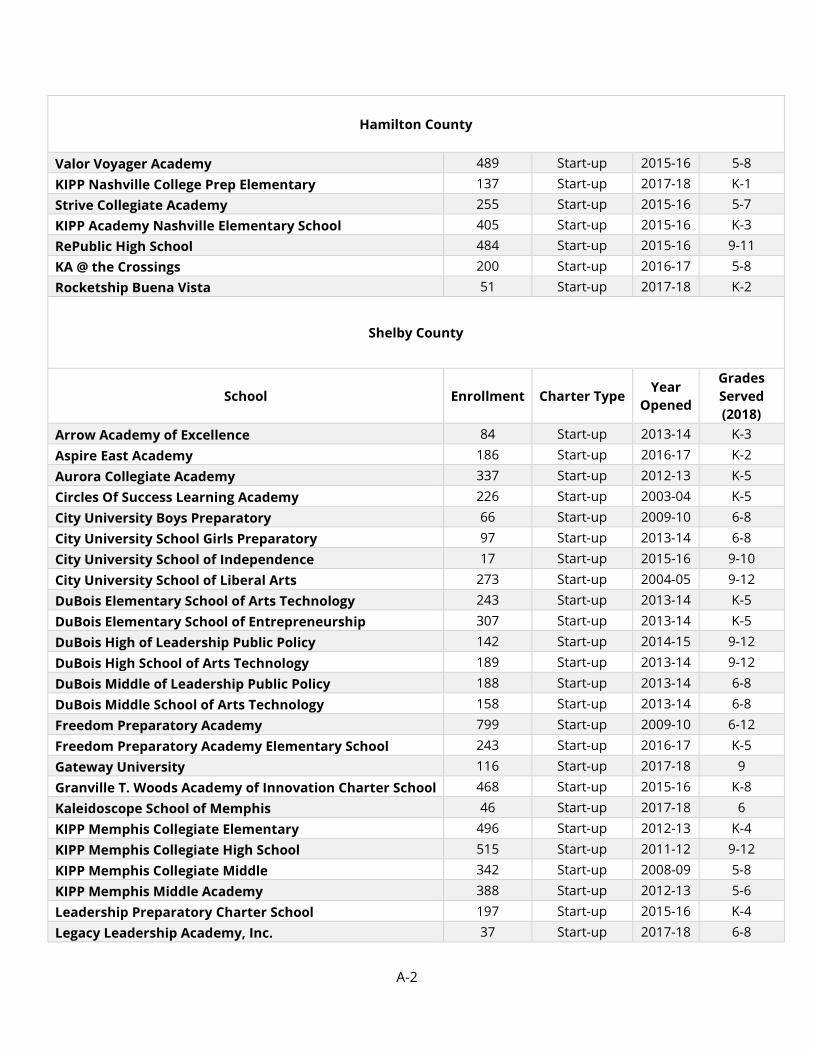
Hamilton County
Valor Voyager Academy 489 Start-up 2015-16 5-8 KIPP Nashville College Prep Elementary 137 Start-up 2017-18 K-1 Strive Collegiate Academy 255 Start-up 2015-16 5-7 KIPP Academy Nashville Elementary School 405 Start-up 2015-16 K-3 RePublic High School 484 Start-up 2015-16 9-11 KA @ the Crossings 200 Start-up 2016-17 5-8 Rocketship Buena Vista 51 Start-up 2017-18 K-2
Shelby County
School Enrollment Charter Type Year
Opened
Grades Served (2018)
Arrow Academy of Excellence 84 Start-up 2013-14 K-3 Aspire East Academy 186 Start-up 2016-17 K-2 Aurora Collegiate Academy 337 Start-up 2012-13 K-5 Circles Of Success Learning Academy 226 Start-up 2003-04 K-5 City University Boys Preparatory 66 Start-up 2009-10 6-8 City University School Girls Preparatory 97 Start-up 2013-14 6-8 City University School of Independence 17 Start-up 2015-16 9-10 City University School of Liberal Arts 273 Start-up 2004-05 9-12 DuBois Elementary School of Arts Technology 243 Start-up 2013-14 K-5 DuBois Elementary School of Entrepreneurship 307 Start-up 2013-14 K-5 DuBois High of Leadership Public Policy 142 Start-up 2014-15 9-12 DuBois High School of Arts Technology 189 Start-up 2013-14 9-12 DuBois Middle of Leadership Public Policy 188 Start-up 2013-14 6-8 DuBois Middle School of Arts Technology 158 Start-up 2013-14 6-8 Freedom Preparatory Academy 799 Start-up 2009-10 6-12 Freedom Preparatory Academy Elementary School 243 Start-up 2016-17 K-5 Gateway University 116 Start-up 2017-18 9 Granville T. Woods Academy of Innovation Charter School 468 Start-up 2015-16 K-8 Kaleidoscope School of Memphis 46 Start-up 2017-18 6 KIPP Memphis Collegiate Elementary 496 Start-up 2012-13 K-4 KIPP Memphis Collegiate High School 515 Start-up 2011-12 9-12 KIPP Memphis Collegiate Middle 342 Start-up 2008-09 5-8 KIPP Memphis Middle Academy 388 Start-up 2012-13 5-6 Leadership Preparatory Charter School 197 Start-up 2015-16 K-4 Legacy Leadership Academy, Inc. 37 Start-up 2017-18 6-8
A-2

Hamilton County
Memphis Academy of Health Sciences 280 Start-up 2003-04 6-8 Memphis Academy of Health Sciences High School 436 Start-up 2008-09 9-12 Memphis Academy Of Science Engineering Middle/High 503 Start-up 2003-04 6-12 Memphis Business Academy Elementary School 367 Start-up 2011-12 K-5 Memphis Business Academy High School 460 Start-up 2008-09 9-12 Memphis Business Academy Middle 451 Start-up 2005-06 6-7 Memphis College Preparatory 279 Start-up 2010-11 K-5 Memphis Delta Preparatory Charter School 284 Start-up 2016-17 K-5 Memphis Grizzlies Preparatory Charter School 326 Start-up 2012-13 5-8 Memphis Rise Academy 438 Start-up 2014-15 6-10 Memphis School of Excellence 548 Start-up 2013-14 6-12 Memphis School of Excellence Elementary 68 Start-up 2017-18 K-3 Memphis STEM Academy 122 Start-up 2016-17 K-3 Nexus STEM Academy Elementary School 92 Start-up 2017-18 K Nexus STEM Academy Middle School 211 Start-up 2016-17 6-7 Power Center Academy Elementary School 534 Start-up 2015-16 K-3 Power Center Academy High School 648 Start-up 2010-11 9-12 Power Center Academy Middle 458 Start-up 2011-12 6-8 Promise Academy 396 Start-up 2008-09 K-5 Soulsville Charter School 649 Start-up 2005-06 6-12 Southern Avenue Charter School of Academic Excellence Creative Arts 441 Start-up 2005-06 K-5
Southwest Early College High School 99 Start-up 2017-18 9 Star Academy 246 Start-up 2010-11 K-5 The Excel Center 330 Start-up 2015-16 9-12 Veritas College Preparatory 146 Start-up 2004-05 6-8 Vision Preparatory Charter School 287 Start-up 2014-15 K-4
Knox County
School Enrollment Charter Type Year
Opened
Grades Served (2016)
Emerald Academy 374 Start-up 2015-16 K-6
Achievement School District
A-3

Hamilton County
School Enrollment Charter Type Year Opened
Grades Served (2016)
Aspire Coleman 568 Conversion 2014-15 PK-7 Aspire Hanley Elementary 495 Conversion 2013-14 PK-5 Aspire Middle School 225 Conversion 2013-14 6-8 Brick Church: A LEAD Public School 327 Conversion 2012-13 5-8 Cornerstone Prep - Lester Campus 380 Conversion 2012-13 PK-5 Cornerstone Prep Denver Campus 578 Conversion 2015-16 PK-5 Fairley High School 519 Conversion 2014-15 9-12 Freedom Preparatory Academy Charter Elementary School
569 Conversion 2014-15 PK-5
Hillcrest High School 442 Conversion 2017-18 9-12 Humes Preparatory Academy Middle School 254 Conversion 2013-14 6-8 KIPP Memphis Academy Elementary 426 Conversion 2013-14 K-4 KIPP Memphis Preparatory Elementary 313 Conversion 2015-16 K-3 KIPP Memphis Preparatory Middle 392 Conversion 2013-14 5-8 Kirby Middle School 393 Conversion 2016-17 6-8 Lester Prep 219 Conversion 2014-15 6-8 Libertas School 220 Conversion 2015-16 PK-3 Martin Luther King Preparatory High School 576 Conversion 2014-15 9-12 Memphis Scholars Caldwell-Guthrie 526 Conversion 2016-17 K-5 Memphis Scholars Florida Kansas 242 Conversion 2015-16 PK-6 Memphis Scholars Raleigh-Egypt 99 Conversion 2016-17 6-8 Neely's Bend: A LEAD Public School 444 Conversion 2015-16 5-8 Promise Academy - Spring Hill 336 Conversion 2014-15 PK-4 Wooddale Middle School 401 Conversion 2015-16 6-8
Tennessee State Board of Education
School Enrollment Charter Type Year
Opened
Grades Served (2018)
Bluff City High School 156 Start-up 2017-18 9
A-4

Appendix B. Charter School Performance, Grades 3-8
Hamilton County
School Composite TVAAS
% On Track or Mastered
Reading Math Science
Chattanooga Girls Leadership Academy 5 24% 26% 57% Chattanooga Charter School of Excellence 1 10% 5% 13% Chattanooga Charter School of Excellence Middle School 1 18% 19% 26% Ivy Academy, Inc. 1 37% 21% 66%
Metro Nashville Public Schools
School Composite
TVAAS
% On Track or Mastered
Reading Math Science
KIPP Academy Nashville 5 33% 50% 70% Liberty Collegiate Academy 5 28% 30% 60% STEM Prep Academy 5 29% 35% 68% Nashville Prep 5 25% 21% 48% Cameron College Preparatory 5 17% 20% 55% Knowledge Academy 5 16% 15% 48% LEAD Prep Southeast 5 21% 27% 67% KIPP Nashville College Prep 5 23% 41% 57% Valor Flagship Academy 5 66% 75% 92% Rocketship Nashville Northeast Elementary 5 17% 12% N/A Rocketship United 5 32% 40% N/A Valor Voyager Academy 5 48% 59% 82% Strive Collegiate Academy 5 31% 18% 54% Smithson Craighead Academy 4 21% 21% N/A Purpose Prep 4 57% 65% N/A Intrepid College Preparatory Charter School 3 28% 44% 75% New Vision Academy 1 21% 12% 47% East End Preparatory School 1 38% 41% 88% Nashville Classical 1 49% 55% N/A Nashville Academy of Computer Science 1 22% 16% 39% KA @ the Crossings 1 15% 9% 34% KIPP Academy Nashville Elementary School N/A 11% 26% N/A
B-1

Hamilton County
Shelby County
School Composite TVAAS
% On Track or Mastered Reading Math Science
Circles Of Success Learning Academy 5 31% 31% 53% Freedom Preparatory Academy 5 18% 17% 54% Freedom Preparatory Academy Elementary School 5 14% 13% 13% KIPP Memphis Collegiate Middle 5 9% 7% 41% KIPP Memphis Middle Academy 5 10% ** 30% Memphis Academy Of Health Sciences 5 7% 8% 43% Memphis Business Academy Elementary School 5 19% 24% 38% Memphis College Preparatory 5 16% 21% 11% Memphis Grizzlies Preparatory Charter School 5 19% 12% 57% Memphis Rise Academy 5 22% 48% 76% Power Center Academy Middle 5 26% 21% 72% Soulsville Charter School 5 15% 14% 60% Southern Avenue Charter School Of Academic Excellence Creative Arts
5 18% 27% 41%
City University School Girls Preparatory 4 ** ** 26% DuBois Middle School of Arts Technology 4 ** ** 37% Granville T. Woods Academy of Innovation Charter School 4 6% 6% 32% Veritas College Preparatory 4 8% 7% 23% Arrow Academy of Excellence 3 27% 18% N/A DuBois Elementary School of Arts Technology 3 8% 14% ** DuBois Elementary School of Entrepreneurship 3 25% 23% 22% DuBois Middle of Leadership Public Policy 3 10% ** 21% KIPP Memphis Collegiate Elementary 3 13% 21% N/A Legacy Leadership Academy, Inc. 3 22% 8% 16% Memphis Delta Preparatory Charter School 3 11% 18% 18% Memphis School of Excellence 3 17% 19% 44% City University Boys Preparatory 2 12% 9% 28% Kaleidoscope School of Memphis 2 16% 5% 50% Leadership Preparatory Charter School 2 21% 27% N/A Aurora Collegiate Academy 1 24% 32% 35% Memphis Academy Of Science Engineering Middle/High 1 14% 10% 56% Memphis Business Academy Middle 1 13% 14% 37% Nexus STEM Academy Middle School 1 17% 7% 34%
B-2

Hamilton County
Power Center Academy Elementary School 1 20% 21% N/A Promise Academy 1 17% 25% 13% Star Academy 1 24% 32% 11% Vision Preparatory Charter School 1 22% 9% N/A
Knox County
School Composite
TVAAS % On Track or Mastered
Reading Math Science Emerald Academy 3 21% 19% 36%
Achievement School District
School Composite
TVAAS % On Track or Mastered
Reading Math Science Aspire Middle School 5 5% ** 31% Cornerstone Prep Denver Campus 5 9% 18% 16% Kirby Middle School 5 10% 11% 37% Lester Prep 5 8% 11% 29% Memphis Scholars Raleigh-Egypt 5 ** 5% 24% Neely's Bend: A LEAD Public School 5 13% 15% 33% Promise Academy - Spring Hill 5 15% 12% N/A Wooddale Middle School 5 7% 7% 29% Brick Church: A LEAD Public School 4 7% 8% 16% Aspire Coleman 3 11% 10% 21% Cornerstone Prep - Lester Campus 3 11% 20% 42% Freedom Preparatory Academy Charter Elementary School 3 11% 11% ** KIPP Memphis Academy Elementary 3 13% 14% 12% Memphis Scholars Florida Kansas 3 ** 7% 10% Aspire Hanley Elementary 2 5% 11% 15% KIPP Memphis Preparatory Elementary 2 12% 8% N/A Memphis Scholars Caldwell-Guthrie 2 5% 5% 15% Humes Preparatory Academy Middle School 1 5% ** 32% KIPP Memphis Preparatory Middle 1 7% 6% 16% Libertas School N/A 7% 5% **
Note: ** Indicates that results were suppressed due to FERPA regulations.
B-3

B-4

Appendix C. Charter School Performance, Grades 9-12
Hamilton County
School Composite
TVAAS Graduation
Rate % On Track or Mastered
Alg I Alg II Eng I Eng II Eng III Bio I Chattanooga Girls Leadership Academy
5 89% 9% 23% 17% 30% 32% N/A
Ivy Academy, Inc. 1 97% 32% 22% 50% 41% 33% 42%
Metro Nashville Public Schools
School Composite
TVAAS Graduation
Rate % On Track or Mastered
Alg I Alg II Eng I Eng II Eng III Bio I Lead Academy 5 96% N/A N/A 11% 18% 14% 36% Lead Prep Southeast
5 N/A N/A N/A 28% N/A N/A N/A
STEM Prep High School
3 ** N/A N/A 29% 40% 25% 39%
KIPP Nashville Collegiate High School
1 85% 26% 40% 14% 29% 19% 42%
Knowledge Academies High School
1 N/A ** ** 12% 19% 6% 24%
RePublic High School
1 ** N/A ** 18% 28% 22% 22%
Shelby County
School Composite
TVAAS Graduation
Rate % On Track or Mastered
Alg I Alg II Eng I Eng II Eng III Bio I City University School Of Liberal Arts
5 89% 6% 5% 10% 15% 10% 33%
DuBois High of Leadership Public Policy
5 82% ** ** ** 18% 6% 25%
Freedom Preparatory Academy
5 87% 22% 24% 9% 19% 39% 35%
Memphis Rise Academy
5 N/A 18% N/A 24% N/A N/A N/A
Note: * Indicates that results were masked due to FERPA regulations.
C-1

Hamilton County
Soulsville Charter School
5 98% N/A N/A 16% 16% 16% 50%
Southwest Early College High School
5 N/A ** N/A 11% N/A N/A 47%
Memphis School of Excellence
3 100% 15% 8% 10% 27% 29% 41%
City University School of Independence
2 N/A N/A N/A N/A N/A ** N/A
DuBois High School of Arts Technology
1 79% ** ** 10% 15% ** 28%
Gateway University
1 N/A ** N/A ** N/A N/A 12%
KIPP Memphis Collegiate High School
1 99% 5% ** ** 12% N/A 24%
Memphis Academy of Health Sciences High School
1 94% ** ** ** 8% 11% 8%
Memphis Academy Of Science Engineering Middle/High
1 97% 13% 13% 7% 25% 26% 41%
Memphis Business Academy High School
1 96% ** 5% 8% 13% 16% 35%
Power Center Academy High School
1 98% 6% ** 9% 13% 5% 21%
The Excel Center 1 9% ** ** ** 5% ** **
Achievement School District
School Composite TVAAS
Graduation Rate
% On Track or Mastered Alg I Alg II Eng I Eng II Eng III Bio I
Fairley High School
1 77% ** ** ** ** 8% 6%
C-2
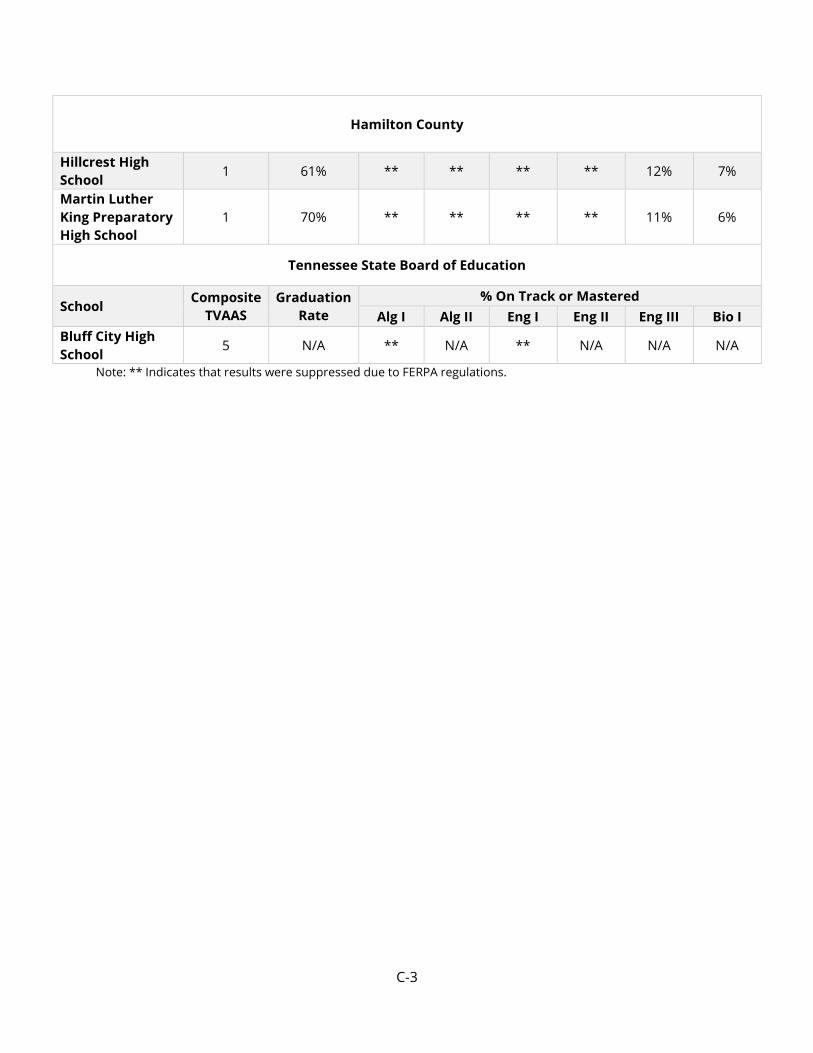
Hamilton County
Hillcrest High School 1 61% ** ** ** ** 12% 7%
Martin Luther King Preparatory High School
1 70% ** ** ** ** 11% 6%
Tennessee State Board of Education
School Composite TVAAS
Graduation Rate
% On Track or Mastered Alg I Alg II Eng I Eng II Eng III Bio I
Bluff City High School
5 N/A ** N/A ** N/A N/A N/A
Note: ** Indicates that results were suppressed due to FERPA regulations.
C-3
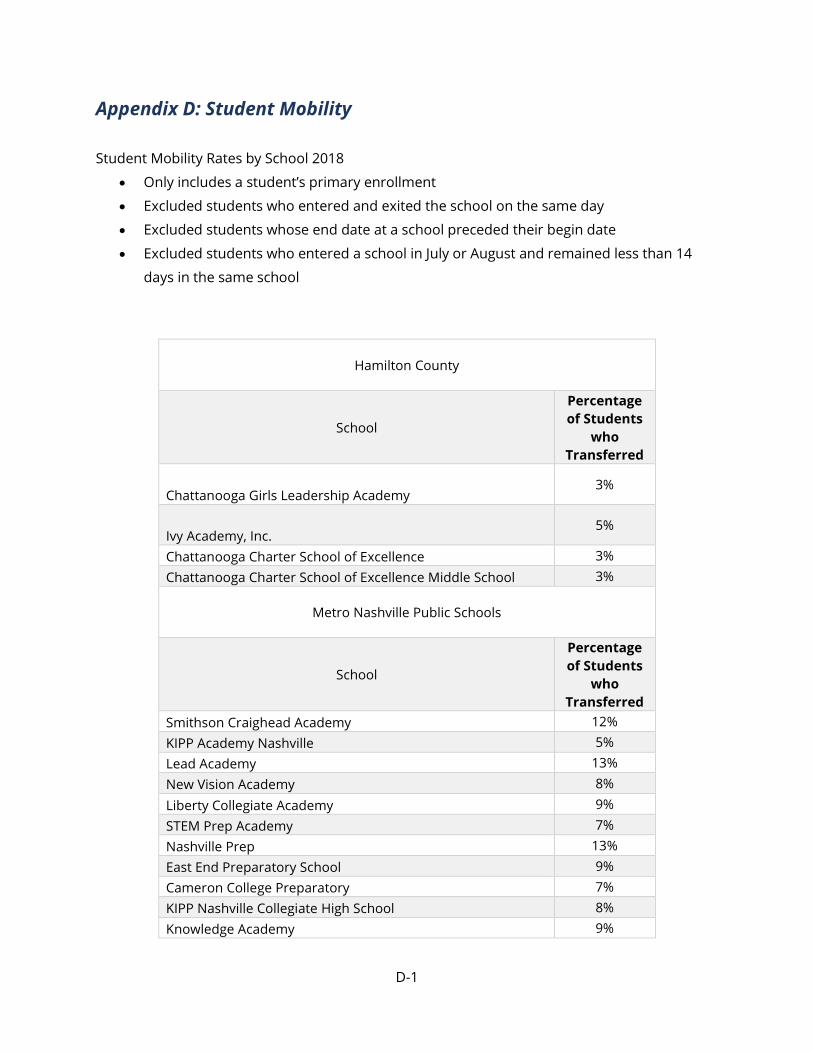
Appendix D: Student Mobility
Student Mobility Rates by School 2018
• Only includes a student’s primary enrollment
• Excluded students who entered and exited the school on the same day
• Excluded students whose end date at a school preceded their begin date
• Excluded students who entered a school in July or August and remained less than 14
days in the same school
Hamilton County
School
Percentage of Students
who Transferred
Chattanooga Girls Leadership Academy 3%
Ivy Academy, Inc. 5%
Chattanooga Charter School of Excellence 3% Chattanooga Charter School of Excellence Middle School 3%
Metro Nashville Public Schools
School
Percentage of Students
who Transferred
Smithson Craighead Academy 12% KIPP Academy Nashville 5% Lead Academy 13% New Vision Academy 8%
Liberty Collegiate Academy 9% STEM Prep Academy 7% Nashville Prep 13% East End Preparatory School 9% Cameron College Preparatory 7% KIPP Nashville Collegiate High School 8% Knowledge Academy 9%
D-1

Hamilton County
LEAD Prep Southeast 7% KIPP Nashville College Prep 14% Nashville Classical 9% Valor Flagship Academy 5% Purpose Prep 9% Intrepid College Preparatory Charter School 6% Rocketship Nashville Northeast Elementary 20% Nashville Academy of Computer Science 7% Explore Community School 8% Knowledge Academies High School 13% Rocketship United 12% STEM Prep High School 9% Valor Voyager Academy 4% KIPP Nashville College Prep Elementary 13% Strive Collegiate Academy 11% KIPP Academy Nashville Elementary School 13% RePublic High School 13% KA @ the Crossings 9% Rocketship Buena Vista 52%
Shelby County
School
Percentage of Students
who Transferred
Arrow Academy of Excellence 4% Aspire East Academy 17% Aurora Collegiate Academy 6%
Circles Of Success Learning Academy 10%
City University Boys Preparatory 2%
City University School Girls Preparatory 2%
City University School of Independence 24%
City University School of Liberal Arts 7%
DuBois Elementary School of Arts Technology 5%
D-2

Hamilton County
DuBois Elementary School of Entrepreneurship 4%
DuBois High of Leadership Public Policy 20%
DuBois High School of Arts Technology 21%
DuBois Middle of Leadership Public Policy 8%
DuBois Middle School of Arts Technology 6%
Freedom Preparatory Academy 12%
Freedom Preparatory Academy Elementary School 16% Gateway University 12% Granville T. Woods Academy of Innovation Charter School 23%
Kaleidoscope School of Memphis 10%
KIPP Memphis Collegiate Elementary 16%
KIPP Memphis Collegiate High School 18%
KIPP Memphis Collegiate Middle 22%
KIPP Memphis Middle Academy 19%
Leadership Preparatory Charter School 19%
Legacy Leadership Academy, Inc. 14%
Memphis Academy of Health Sciences 6%
Memphis Academy of Health Sciences High School 16%
Memphis Academy Of Science Engineering Middle/High 9%
Memphis Business Academy Elementary School 7%
Memphis Business Academy High School 7%
Memphis Business Academy Middle 9%
Memphis College Preparatory 12%
Memphis Delta Preparatory Charter School 27%
D-3

Hamilton County
Memphis Grizzlies Preparatory Charter School 13%
Memphis Rise Academy 5%
Memphis School of Excellence 7%
Memphis School of Excellence Elementary 9%
Memphis STEM Academy 9%
Nexus STEM Academy Elementary School 9%
Nexus STEM Academy Middle School 14% Power Center Academy Elementary School 7% Power Center Academy High School 7% Power Center Academy Middle 7% Promise Academy 22% Soulsville Charter School 4% Southern Avenue Charter School of Academic Excellence Creative Arts
12%
Southwest Early College High School 14% Star Academy 7% The Excel Center 67% Veritas College Preparatory 6% Vision Preparatory Charter School 13%
Knox County
School
Percentage of Students
who Transferred
Emerald Academy 15%
Achievement School District
School
Percentage of Students
who Transferred
Aspire Coleman 12% Aspire Hanley Elementary 10%
D-4
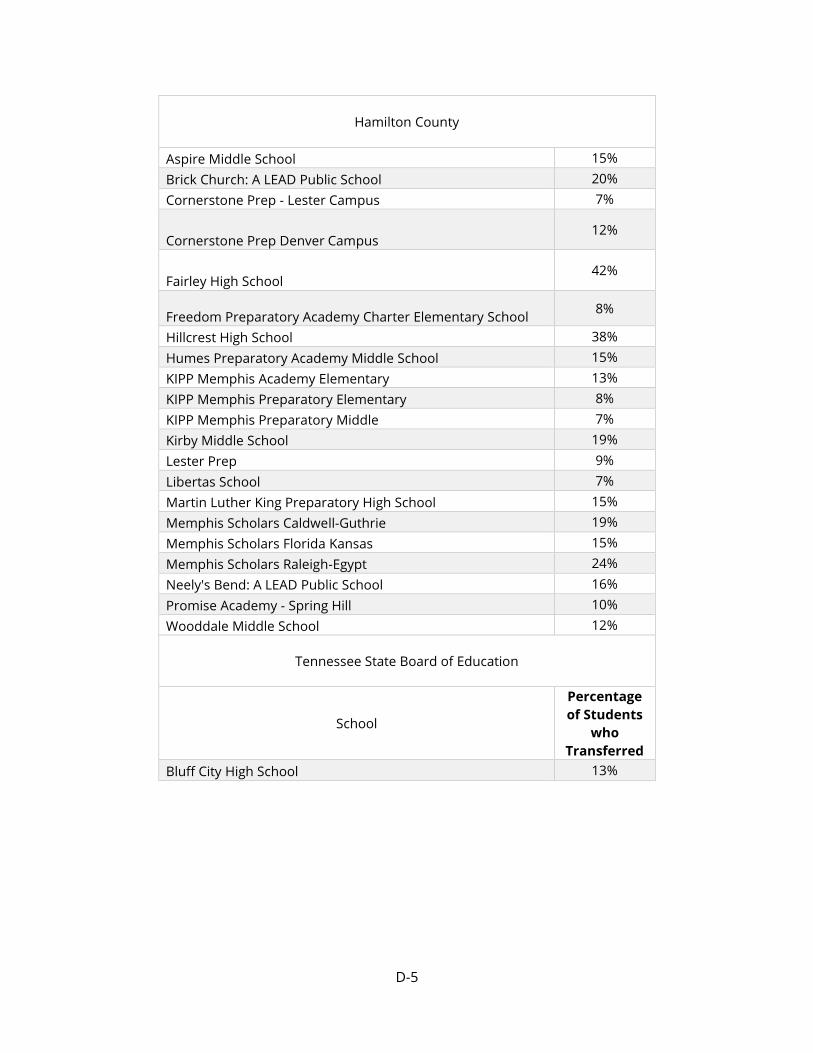
Hamilton County
Aspire Middle School 15% Brick Church: A LEAD Public School 20% Cornerstone Prep - Lester Campus 7%
Cornerstone Prep Denver Campus 12%
Fairley High School 42%
Freedom Preparatory Academy Charter Elementary School 8%
Hillcrest High School 38% Humes Preparatory Academy Middle School 15% KIPP Memphis Academy Elementary 13% KIPP Memphis Preparatory Elementary 8% KIPP Memphis Preparatory Middle 7% Kirby Middle School 19% Lester Prep 9% Libertas School 7% Martin Luther King Preparatory High School 15% Memphis Scholars Caldwell-Guthrie 19% Memphis Scholars Florida Kansas 15% Memphis Scholars Raleigh-Egypt 24% Neely's Bend: A LEAD Public School 16% Promise Academy - Spring Hill 10% Wooddale Middle School 12%
Tennessee State Board of Education
School
Percentage of Students
who Transferred
Bluff City High School 13%
D-5


