
2012
Central Support, Information and Surveillance Division
& Family Health Division
Niagara Region Public Health
Children’s Oral Health Overview
Photo Source: Healthy Smiles Ontario

2
Contents Background ............................................................................................................................................................................ 4
Introduction………………………………………………………………………………………………………………………………………………………………….4
Ontario Public Health Standards…………………………………………………………………………………………………………...........................4
Methods……………………………………………………………………………………………………………………………………………………………………….4
Limitations……………………………………………………………………………………………………………………………………………………………………5
Dental Caries in Childhood ..................................................................................................................................................... 6
Prevalence of deft/DMFT……………………………………………………………………………………………………………………...........................6
Figure 1: Prevalence of deft/DMFT by School Year ....................................................................................................... 7
Prevalence of Total Gross Decay by Grade…………………………………………………………………………………………………………………….7
Figure 2: Prevalence of Total Gross Decay by Grade .................................................................................................... 8
Table 1: Prevalence of Total Gross Decay by Grade ..................................................................................................... 8
Prevalence of Filled Due to Caries by Grade………………………….………………………………………………………………………………………9
Figure 3: Prevalence of Filled Due to Caries by Grade .................................................................................................. 9
Table 2: Prevalence of Filled Due to Caries by Grade ................................................................................................... 9
Prevalence of Current Decay by Grade…………………………………….…………………………………………………………………………………10
Figure 4: Prevalence of Current Decay by Grade ........................................................................................................ 10
Table 3: Prevalence of Current Decay by Grade ......................................................................................................... 10
Prevalence of Missing Due to Caries by Grade……………………….……………………………………………………………………………………11
Figure 5: Prevalence of Missing Due to Caries by Grade ............................................................................................. 11
Table 4: Prevalence of Missing Due to Caries by Grade ............................................................................................. 11
Severity of Dental Decay………………………………………………………..……………………………………………………………………………………12
Figure 6: Average deft/DMFT Score by School Year.................................................................................................... 12
Severity of Dental Decay by Grade………………………………..…………………………………………………………………………………………….12
Figure 7: Average deft/DMFT Score by Grade ............................................................................................................ 13
Fluoride and Dental Caries Prevention ................................................................................................................................. 13
Prevalence of Fluorosis…………………………….…………………………………………………………………………………………………………………13
Figure 9: Prevalence of Fluorosis by School Year ........................................................................................................ 14
Prevalence of Fluorosis by Grade……………………………………………………………………………………………………………………………….14
Figure 10: Prevalence of Fluorosis by Grade ............................................................................................................... 15
Publicly Funded Dental Programs in Niagara Region ........................................................................................................... 15
Children in Need of Treatment (CINOT)……………………….……………………………………………………………………………………………..16
Healthy Smiles Ontario (HSO)………………………………………………….………………………………………………………………………………….16
Ontario Works (OW)……………………………………………………………………………..……………………………………………………………………16
Ontario Disability Support Program (ODSP)……………………………………………………………….…………………………………...........16
Assistance for Children with Severe Disabilities (ACSD) .............................................................................................. 16
Non-Insured Health Benefits (NIHB)…………………………………………………………………………………………………............................17
References ............................................................................................................................................................................ 18

3

4
Background
Introduction
Oral health is an important part of general health and a determining factor for quality of life (WHO,
2010).1 Although largely preventable, dental cavities represent a significant health issue worldwide with
60-90% of school-aged children and most adults being affected 2. Research continues to show an
association between poor oral health, systemic diseases and premature, low birth weight babies 1, 3.
Many children and youth do not visit a dentist until treatment is needed, causing them to miss
opportunities for preventive care and education. Dental problems can become more than just a
toothache. Untreated tooth decay is progressive and can be devastating to children and youth’s long-
term health, educational achievements, self-image and overall success 1-3.
Given the important implications of oral health on the overall health of the population, it is important to
actively monitor oral health status. Through the Niagara Region Public Health (NRPH) Dental Screening
program, oral health data is collected during school screenings performed on children in Junior
Kindergarten (JK), Senior Kindergarten (SK), and Grades 2, 4, 6 and 8. This data is presented in this brief
overview. The intention of this short report is to provide a broad picture of the trends in oral health
status among Niagara Region children over a series of three school years (2006-2007, 2007-2008 and
2008-2009).
Ontario Public Health Standards
NRPH is mandated to provide programs and services that promote good oral health. The Ontario Public
Health Standards (OPHS) outline the minimum requirements for programs that each health unit in
Ontario is required to provide for their residents. Oral health is included in the OPHS under the area of
Family Health. Activities mandated through the OPHS include increasing public awareness, providing
outreach to priority populations, conducting surveillance in schools and referrals for children at risk, and
providing clinical preventive oral health services as well as the Children in Need of Treatment (CINOT)
program. The OPHS also include more detailed protocols for childhood dental screening, the
administration of the CINOT program, and the monitoring of water fluoridation levels in municipal water
systems.
Methods
The data reported in this overview were collected using the Dental Indices Survey (DIS). The DIS was
created by the Ontario Ministry of Health and Long-Term Care in 1971 and by 1997 all Boards of Health
were required to conduct the survey as per the DIS Protocol4. As part of this surveillance process,
children in JK, SK, Grades 2, 4, 6 and 8 undergo an oral health screening by a team of both a registered
dental hygienist (RDH) and certified dental assistant (CDA). The results are then recorded in the DIS.

5
The objectives of the DIS are as follows5:
To provide a means of measuring dental health status of Ontario school entrants;
To identify “at risk” segments of the school aged child population who would most benefit from targeted oral health education and preventive programs;
To determine the prevalence of dental disease and to determine needs for prevention and treatments;
To help determine the best allocation of provincial resources for oral health programs;
To assist with program planning;
To provide a means to evaluate the effectiveness of existing programs;
To monitor provincial trends and allow for interprovincial comparisons in the oral health status of school entrants.
Limitations
There are several limitations of the DIS which should be kept in mind while reading this overview. The
first is that children who are absent from school on the day during which screening is conducted are
excluded, as are children whose parents decline the screening process. Children who are home schooled
are also omitted from the data4. A final limitation is that in the Niagara Region, not all children had their
screening results entered into the DIS, but rather every seventh record was entered into the database.
Data in this overview are reported for the school years 2006-2007, 2007-2008 and 2008-2009. The
methods of data collection for oral health surveillance were changed during the 2009-2010 school year
and were not included in this report. Data from 2009-2010 were withheld given the inability to
accurately compare measures across the data sources. As of the 2010-2011 school year, the Ontario
Ministry of Health and Long-Term Care implemented a new method for collecting oral health screening
data: the Oral Health Information Support System (OHISS). Moving forward, this will enable consistent
and accurate data collection and therefore facilitate trending of children’s oral health status in the
future.

6
Dental Caries in Childhood
Dental caries (commonly known as dental cavities) are the most common chronic disease of children
and youth aged six to 19 years, and are four times more common than asthma among youth 14 to 17
years of age. Dental caries are caused by bacteria on teeth that breakdown foods and produce acid that
destroys tooth enamel. Dental caries lead to difficulties sleeping, self-esteem issues, decreased school
attendance, pain, discomfort, and infection6.
The DMFT Index is considered to be a reliable indicator of general oral health status. The index considers
only permanent teeth and refers to the number of teeth that are “d”ecayed, “m”issing due to caries and
“f”illed. The deft Index is used for baby teeth, where the “e” represents teeth that have been extracted
due to caries.
Prevalence of deft/DMFT
Overall, more than one-third of Niagara Region children examined by RDHs during the school screening
program had experienced dental caries between the 2006-2007 and 2008-2009 school years. However,
the prevalence of total gross decay among children screened declined steadily during each of the three
school years presented. The change in prevalence across the reporting period, from the 2006-2007
school year to the 2008-2009 school year was statistically significant.
The prevalence of children with teeth filled due to caries and the prevalence of children with current
decay also declined across each of the years. Similarly to total gross decay, the prevalence of filled due
to caries experienced a statistically significant decline from 2006-2007 to 2008-2009. The prevalence of
current decay declined significantly from the 2007-2008 school year to the 2008-2009 school year. The
prevalence of children with teeth missing due to caries remained relatively stable across the three year
period. See Figure 1 below for further details of the prevalence of deft/DMFT over the three year period.
Total gross decay is the proportion of screen children who had teeth filled due to caries, or
current decay or missing teeth due to caries.

7
Figure 1: Prevalence of deft/DMFT by School Year
Prevalence of Total Gross Decay by Grade The prevalence of total gross decay among children varies by grade. It is apparent that there is a
consistent pattern of total gross decay prevalence by grade as depicted below in Figure 2 and Table 1.
Children in Grade 4 consistently experienced the highest prevalence of total gross decay across the
three year period, with children in JK/SK having the lowest prevalence. The reason for this trend is
potentially a result of children losing their baby teeth, a process which is usually complete by the time a
child reaches Grade 6. Children may have baby teeth recorded as decayed, but they then lose them,
contributing to a decline in prevalence.
While overall, total gross decay declined significantly across the three year period, when parsed out by
grade, the decline, while evident is not statistically significant in most instances. However, the decline
across the three year period from 2006-2007 to 2008-2009 among children in Grade 8 (39.2% to 28.0%)
was statistically significant.
42.8 39.8
37.2
34.7
32.0 30.1
13.7 13.5
11.3*
5.5 5.1 5.2
0.0
5.0
10.0
15.0
20.0
25.0
30.0
35.0
40.0
45.0
2006/07 2007/08 2008/09
% (
of
child
ren
scr
een
ed)
School Year
total grossdecayfilled due tocariescurrentdecaymissing dueto caries
* indicates significant difference from previous year § indicates significant difference from 2006/07 to 2008/09

8
Figure 2: Prevalence of Total Gross Decay by Grade
Table 1: Prevalence of Total Gross Decay by Grade
2006-2007 2007-2008 2008-2009
JK/SK 30.5 27.7 26.6
Grade 2 51.2 48.9 47.8
Grade 4 58.9 56.0 53.8
Grade 6 44.4 41.4 39.9
Grade 8 39.2 34.6 28.0§
0.0
10.0
20.0
30.0
40.0
50.0
60.0
70.0
2006/07 2007/08 2008/09
% (
of
child
ren
scr
een
ed)
School Year
JK/SK
Grade 2
Grade 4
Grade 6
Grade 8
* indicates significant difference from previous year § indicates significant difference from 2006/07 to 2008/09

9
Prevalence of Filled Due to Caries by Grade
Across the three year period, the prevalence of children with teeth filled due to caries also varied by
grade. Similar to total gross decay, the prevalence was highest among children in Grade 4 and lowest
among those in JK/SK. The prevalence remained relatively constant across the three year period, with
slight declines noticeable amongst most grades. There was however, a statistically significant decline in
prevalence among children in Grade 8 from 34.6% in 2006-2007 to 25.0% in 2008-2009. See Figure 3
and Table 2 below for additional details.
Figure 3: Prevalence of Filled Due to Caries by Grade
Table 2: Prevalence of Filled Due to Caries by Grade
2006-2007 2007-2008 2008-2009
JK/SK 17.7 16.5 16.6
Grade 2 44.1 42.2 38.9
Grade 4 50.9 46.5 46.8
Grade 6 39.0 35.8 35.0
Grade 8 34.6 30.7 25.0§
0.0
10.0
20.0
30.0
40.0
50.0
60.0
2006/07 2007/08 2008/09
% (
of
child
ren
scr
een
ed)
School Year
JK/SK
Grade 2
Grade 4
Grade 6
Grade 8
* indicates significant difference from previous year § indicates significant difference from 2006/07 to 2008/09

10
Prevalence of Current Decay by Grade
In terms of current decay, children in Grade 8 consistently had the lowest prevalence across the three
year period. Again, Grade 4 children had the highest prevalence across all years. While JK/SK students
had the lowest rates of total gross decay (Figure 2), they had the second highest prevalence of current
decay both in 2006-2007 and 2007-2008 (Figure 4, Table 3). The decline in current decay from 2006-
2007 to 2008-2009 was statistically significant among both JK/SK students and students in Grade 8.
Figure 4: Prevalence of Current Decay by Grade
Table 3: Prevalence of Current Decay by Grade
2006-2007 2007-2008 2008-2009
JK/SK 16.4 16.0 12.3§
Grade 2 15.4 15.6 14.1
Grade 4 17.9 18.5 17.3
Grade 6 10.6 11.6 9.1
Grade 8 8.0 5.0 4.2§
0.0
5.0
10.0
15.0
20.0
25.0
2006/07 2007/08 2008/09
% (
of
child
ren
scr
een
ed
)
School Year
JK/SK
Grade 2
Grade 4
Grade 6
Grade 8
* indicates significant difference from previous year § indicates significant difference from 2006/07 to 2008/09

11
Prevalence of Missing Due to Caries by Grade
There was a considerable difference in the prevalence of children with teeth missing due to caries
among those in Grades 2 and 4, compared to those in JK/SK, Grade 6 and Grade 8. Over the three year
period, children in Grades 2 and 4 consistently had a much higher prevalence of missing due to caries.
Though fluctuation is apparent, none of the changes were statistically significant. See Figure 5 and Table
4 below for additional details.
Figure 5: Prevalence of Missing Due to Caries by Grade
Table 4: Prevalence of Missing Due to Caries by Grade
2006-2007 2007-2008 2008-2009
JK/SK 4.9 3.0 4.2
Grade 2 10.0 10.8 10.4
Grade 4 9.3 10.3 8.4
Grade 6 2.6 3.0 2.7
Grade 8 2.3 1.1 1.6
0.0
2.5
5.0
7.5
10.0
12.5
15.0
2006/07 2007/08 2008/09
% (
of
child
ren
scr
een
ed)
School Year
JK/SK
Grade 2
Grade 4
Grade 6
Grade 8
* indicates significant difference from previous year § indicates significant difference from 2006/07 to 2008/09

12
Severity of Dental Decay
The deft/DMFT index allows for the assessment of the severity of dental caries in a population by
calculation of the average number of teeth affected. On average over this three year period in the
Niagara Region, children had a mean deft/DMFT score of 1.5. This means that on average, children who
were screened each had 1.5 teeth affected by dental caries. A slight, but statistically significant decline
in the number of teeth with dental caries is shown below in Figure 6, changing from 1.60 in 2006-2007
to 1.42 in 2008-2009.
Figure 6: Average deft/DMFT Score by School Year
Severity of Dental Decay by Grade
The average deft/DMFT score among children who were screened varied by grade over the three year
period. The data suggests there is a peak in the number of affected teeth in Grade 2 and Grade 4. This
trend is consistent with the prevalence of total gross decay, missing due to caries and filled due to
caries, all of which are highest among children in Grade 2 and Grade 4 (Figure 2, Figure 3 & Figure 5
respectively). The average number of teeth affected appears to be relatively similar among children in
JK/SK, Grade 6 and 8, with little variance across the three year period (Figure 7).
1.60 1.52
1.42
0.00
0.25
0.50
0.75
1.00
1.25
1.50
1.75
2.00
2006/07 2007/08 2008/09
Ave
rage
Nu
mb
er o
f T
ee
th A
ffe
cte
d
School Year
* indicates significant difference from previous year § indicates significant difference from 2006/07 to 2008/09

13
Figure 7: Average deft/DMFT Score by Grade
Fluoride and Dental Caries Prevention
Community water fluoridation is a population-based intervention to prevent dental caries. No
municipalities in the Niagara region have had fluoridated community water since 1999. Natural levels of
fluoride in the Niagara region are much lower than the recommended levels to prevent cavities. Niagara
Region Public Health recommends that all residents brush their teeth twice daily with fluoride
toothpaste.
Prevalence of Fluorosis
Fluorosis is a result of overexposure to fluoride; it is manifested in the form of mottling and/or loss of
enamel on teeth7. Fluorosis appears together in pairs of teeth that develop at the same time. Both teeth
of a pair must be affected in the same manner to be fluorosis. Those conducting the DIS are asked to
score the worst bilateral pair of homologous teeth that can be seen5.
1.3
2.2
2.5
1.3
1.1 1.1
2.4
2.3
1.3
1.0
1.1
2.1
2.3
1.2
0.8
0.00
0.50
1.00
1.50
2.00
2.50
JK/SK 2 4 6 8
Ave
rage
Nu
mb
er o
f Te
eth
Grade
2006/07
2007/08
2008/09
* indicates significant difference from previous year § indicates significant difference from 2006/07 to 2008/09
14
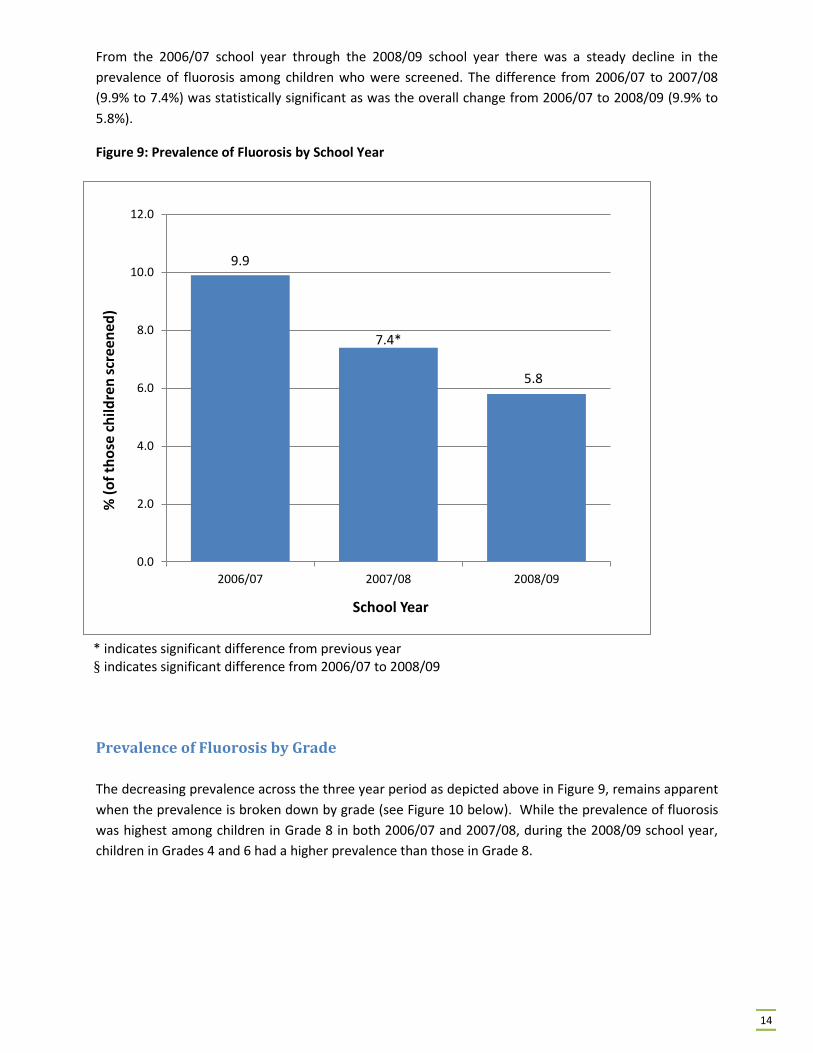
From the 2006/07 school year through the 2008/09 school year there was a steady decline in the
prevalence of fluorosis among children who were screened. The difference from 2006/07 to 2007/08
(9.9% to 7.4%) was statistically significant as was the overall change from 2006/07 to 2008/09 (9.9% to
5.8%).
Figure 9: Prevalence of Fluorosis by School Year
Prevalence of Fluorosis by Grade
The decreasing prevalence across the three year period as depicted above in Figure 9, remains apparent
when the prevalence is broken down by grade (see Figure 10 below). While the prevalence of fluorosis
was highest among children in Grade 8 in both 2006/07 and 2007/08, during the 2008/09 school year,
children in Grades 4 and 6 had a higher prevalence than those in Grade 8.
9.9
7.4*
5.8
0.0
2.0
4.0
6.0
8.0
10.0
12.0
2006/07 2007/08 2008/09
% (
of
tho
se c
hild
ren
scr
een
ed)
School Year
* indicates significant difference from previous year § indicates significant difference from 2006/07 to 2008/09

15
* indicates significant difference from previous year § indicates significant difference from 2006/07 to 2008/09
Figure 10: Prevalence of Fluorosis by Grade
Publicly Funded Dental Programs in Niagara Region
Having dental insurance coverage is one of the main factors that determine whether or not individuals
go to see a dental professional for dental care1. Dental care may be covered through private dental
insurance, employer dental insurance plans, publicly funded government programs or paid completely
out-of-pocket by the client.
There are currently six publicly funded programs for children and youth, each with different eligibility
criteria. These include Healthy Smiles Ontario (HSO), Children in Need of Treatment (CINOT), Ontario
Works (OW), Ontario Disability Support Program (ODSP), Assistance for Children with Severe Disabilities
(ACSD) and Non-insured Dental Benefits (NIHB) 8.
1.6
7.7
10.7 11.0
12.7
0.8
6.1 5.9*
8.8
10.4
0.5
3.2
7.0
8.1
6.4
0.0
2.0
4.0
6.0
8.0
10.0
12.0
14.0
JK/SK 2 4 6 8
% (
of
tho
se c
hild
ren
scr
een
ed)
Grade
2006/07
2007/08
2008/09

16
Children in Need of Treatment (CINOT)
CINOT is a program that provides funding to cover urgent dental treatments of children and youth 17
years and younger. To be eligible, a child 17 or younger must:
Be identified as having an urgent dental condition (large cavities, toothache, etc.) by a Public
Health Registered Dental Hygienist.
Be a resident of Ontario
Not have dental insurance
Have parents declare that paying for dental care would create financial hardship8.
CINOT is funded by the Ministry of Health and Long Term Care and administered by Niagara Region
Public Health.
Healthy Smiles Ontario (HSO)
HSO is a program covers regular visits to a registered dental care provider to establish and maintain
good oral health. It covers a full range of preventive and early treatment dental services including
check-ups, cleaning, fillings, x-rays, scaling and more. To be eligible, a child 17 or younger must:
Be a resident of Ontario
Not have dental insurance
Live in a household with an adjusted family net income of $20,000 per year or below8.
HSO is also funded by the Ministry of Health and Long Term Care and administered by Niagara Region
Public Health.
Ontario Works (OW)
OW is a provincial program that delivers social assistance to residents of Ontario who are in financial need and is administered through Niagara Region Community Services. The OW program provides basic dental care for children of OW recipients up to 17 years of age8. Ontario Disability Support Program (ODSP)
The ODSP helps people with disabilities who are in financial need for living expenses, like food and
housing. ODSP provides basic dental care for children of ODSP recipients up to 17 years of age8.
Assistance for Children with Severe Disabilities (ACSD)
ASCD is a direct funding program that assists low and moderate income families caring for a child with a
severe disability, under the age of 18, living at home. ASCD provides basic dental care for children up to
17 years of age8.

17
Non-Insured Health Benefits (NIHB)
The NIHB program provides eligible First Nations and Inuit with limited range of medically necessary
health related goods and services not provided through private insurance plans, provincial health or
social programs or other publicly funded programs. The dental component covers dental services
including: diagnostic, preventive, restorative, endodontic, periodontal, prosthodontics, oral surgery,
orthodontic and adjunctive services8.
18
References
1. Kwan S. and Petersen P.E. Oral health: equity and social determinants (pp 159-176). In: Blas E.
and Sivasankara Kurup A. (Eds). Equity, social determinants and public health programmes.
Geneva: World Health Organization. (2010).
2. Petersen, P.E., Bourgeois, D., Ogawa, H., Estupinan-Day, S. & Ndiaye (2005). The global burden
of oral diseases and risks to oral health. Bulletin of the World Health Organization, 83, p. 9.
3. Health Canada (2010). Summary report on the findings of the oral health component of the
Canadian health measure survey 2007–2009. Ottawa, ON.
4. Association of Public Health Epidemiologists of Ontario [APHEO](2006). Dental health data.
Available from: http://www.apheo.ca/index.php?pid=203
5. Ontario Ministry of Health and Long-Term Care (1997). Dental indices software program
manual. Toronto, ON.
6. Centers for Disease Control and Prevention [CDC] (2009). Hygiene-related diseases: Dental caries
(tooth decay). Available from:
http://www.cdc.gov/healthywater/hygiene/disease/dental_caries.html
7. Bennett, S (1996). Results from the 1993-94 Ontario Dental Health Indices Survey. Public Health
and Epidemiology Report Ontario, 355-358.
8. Ministry of Health and Long-Term Care (2012). Oral health – more than just cavities. A report by
Ontario’s Chief Medical Officer of Health. Available from:
http://www.health.gov.on.ca/en/common/ministry/publications/reports/oral_health/oral_heal
th.pdf


