
China Timber Market
Lu Wenming
Professor on Timber Trade
Chinese Academy of Forestry

General Overview of Asian Softwood
Markets
Timber Market in China
Softwood Market in China
Content

General Overview of General Overview of Asian Softwood MarketsAsian Softwood Markets

Key softwood producers: China, India, Japan and TurkeyKey softwood consumers: China, India and JapanKey softwood importers: China, Japan and Korea, mainly from Russia, and then New Zealand, US and CanadaOther countries: Not significant, mainly tropical hardwood
General Overview of Asian Softwood Markets

Timber Market in ChinaTimber Market in China

China is one of the leading producers, importers and exporters of timber and timber productsProduction: Government data is quite inaccurateGovernment data: Around 66 million cumDemanding: Sharp increase due to economic growth, and big gap remainsImport: Number 2 in the world, following US, mainly softwood from Russia and tropical hardwood from Malaysia, PNG, African countriesExport: Plywood, other panels, furniture
Timber Market in China


Government data for timber production (10,000 cum)Government data for timber production (10,000 cum)
5006 1126611.7820064105 5565 966.201998
5375 0235 560.3120054605 9356 394.791997
4854 7125 197.3320046376 0736 710.271996
4394 3204 758.8720035206 2476 766.901995
3094 1274 436.0720026056 0106 615.101994
3554 1974 552.0320014315 8616 392.201993
3284 3964 723.9720005475 6276 173.601992
3884 8485 236.8019995185 2895 807.301991
FuelwoodIndustrialFuelwoodIndustrial
Of which
ProductionYear
Of which
ProductionYear

0
1000
2000
3000
4000
5000
6000
7000
8000
1991 1992 1993 1994 1995 1996 1997 1998 1999 2000 2001 2002 2003 2004 2005 2006
�m
3 ���������
Government data for timber production1991-2006 (10,000 cum)

Year Production Import Consumption Percent
1989 92880 14500 107380 13.0%
1998 113526 43184 156711 27.6%
2004 142350 99109 241459 41.0%
2006 150000 100198 250198 40.0%
(Estimated for 2006)
China’s Timber Consumption(Excluding export; 1,000 cum)

ChinaChina’’s timber import (main countries) (10,000 cum)s timber import (main countries) (10,000 cum)
� � � � � � � � � � � � � � � � � � � � � � 1996 65.30 4 852.2 253.24 40 925.7 318.55 45 778.01997 95.54 6 936.0 350.69 60 766.8 446.23 67 702.91998 148.63 9 547.4 333.68 50 316.7 482.30 59 909.11999 457.34 27 482.8 556.23 97 380.4 1 013.57 124 863.12000 640.07 37 885.9 721.11 127 628.1 1 361.17 165 564.12001 914.22 54 191.4 772.15 115 206.3 1 686.38 169 397.72002 1 578.30 99 716.4 855.01 114 109.5 2 433.30 213 826.02003 1 501.97 94 515.7 1 043.57 150 199.2 2 545.55 244 714.92004 1 600.37 116 849.3 1 030.49 163 582.5 2 630.85 280 431.82005 1 827.00 138798.0 1 109.80 185556.0 2 936.80 324 354.02006 1970.8 171200 1244..5 221700 3215.29 392926.21996/
2006(%) 2932.3 3428.4 392.1 441.7 909.4 758.3

319
3215
0
500
1000
1500
2000
2500
3000
3500
19961997199819992000200120022003200420052006
�m
3 � � � �
� � � �
� � � � � �

392926
45778
0
90000
180000
270000
360000
450000
1996
1997
1998
1999
2000
2001
2002
2003
2004
2005
2006
��
� � � � �
� � � �
� � � � � �

Russia 21826 67.9% +8.8%PNG 2046 6.4% +12.5%Malaysia 1412 4.4% -24.1%Myanmar 1027 3.2% -9.4%Gabon 958 3.0% +17.7%NZ 905 2.8% +41.1%Solomon 775 2.4% +18.7%Germany 468 1.5% +5.3%Australia 390 1.2% +65.3%Equ. Genera 381 1.2% +25.3%
China’s Timber Import in 2006Top 10, 1,000 cum

� 1996� 2006� � � � � � � � � � � m3� � US$� � � � � � � � � 1996 1997 1998 1999 2000 2001 2002 2003 2004 2005 2006
93.85 133.15 169.03 275.64 361.37 403.41 548.37 559.81 605.17 597.30 615.35
18 008.726 811.034 826.066 193.698 203.198 851.8
116 746.2119 878.9138 714.4150 778.81697715
1996/2006� %� 555.7 842.7

� 2006� � � � � � � � � � � � � � � � � m3� � � � � � � � � � � � �
� � � 117.4 19.3 11.1� � 102.2 16.8 20.0� � 70.7 11.7 -7.2� � � � � 45.0 7.4 -37.5� � � 39.8 6.5 13.7� � � � 37.6 6.2 -20.8� � 34.1 5.6 21.8� � � 28.1 4.6 29.5� � 17.8 2.9 -44.5� � 13.2 2.2 -7.7

Wood used for construction and decoration: 5400, 21.6%used for furniture manufacturing: 2700, 10.8%Wood used for paper making: 7500, 30%Wood used for agriculture and housing in rural areaThe rest: 3600, 14.4%Total: 25000, 100%
Wood Consumption in ChinaWood Gross Consumption
(2001)

Logs: 4436.07, -2.55%Sawnwood: 851.61, +11.49%Wood-based panel: 2930.18, +38. 79%– Plywood: 1135.21, +25.51%– Fibreboard: 767.42, +34.61%– Particleboard: 369.31, +7.19%– The other WBP (blockboard etc): 658.24, +125.33%
Wooden furniture: 54.9532 million pieces, +9.94%Machined paper and paperboard: 35.0134 million ton, +23.29%Wooden pulp : 2.14 million ton, +7.00%
Wood Consumption in ChinaWood Production (2002)

Wood Consumption in ChinaWood Consumption in ChinaImport
Figure1 China's Log Imports 1998-2003
4823
1013613612
16863
24333 25456
0
5000
10000
15000
20000
25000
30000
1998 1999 2000 2001 2002 2003Year
1000m3

Wood Consumption in ChinaWood Consumption in ChinaImport
Figure2 China's Sawnwood Imports 1998-2003
1690
2756. 4
3613. 74034. 1
5396 5598. 1
0
1000
2000
3000
4000
5000
6000
1998 1999 2000 2001 2002 2003Year
1000m3

Wood Consumption in ChinaWood Consumption in ChinaImport
Figure3 China's Plywood Imports 1998-2003
1690. 6
1042. 4 1001. 8
650. 9 636. 1797. 8
0
400
800
1200
1600
2000
1998 1999 2000 2001 2002 2003Year
1000m3

Wood Consumption in ChinaWood Consumption in ChinaExport
Figure 4 China's Plywood Exports 1998-2003
176. 9422. 5
687965. 4
1792. 92040. 5
0
500
1000
1500
2000
2500
1998 1999 2000 2001 2002 2003Year
1000m3
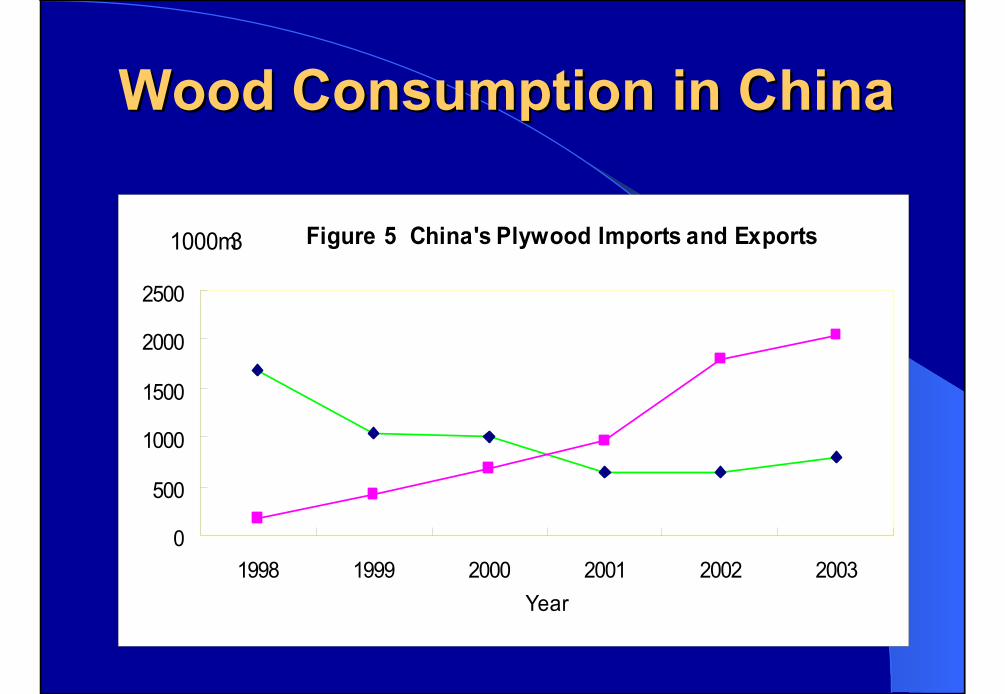
Wood Consumption in ChinaWood Consumption in China
Figure 5 China's Plywood Imports and Exports
0
500
1000
1500
2000
2500
1998 1999 2000 2001 2002 2003Year
1000m3

General situation�wood market is maturing gradually, imported wood is becoming the main supply source for domestic wood market, and the regional characteristic is appearing gradually. Price: fluctuating continually, generally increasingDetail: vary with production area, marketing area and time
Prices in Wood Market in China

The demand is increasing steadily and continuallyDomestic supply will decrease continually, then become steady, then increase (plantation)Import will increase continuallyExports of plywood and furniture will increase continuallyWood price will fluctuate continually, but not rise dramatically– The decrease of forestry taxation will reduce the price of
domestic wood– The price of imported wood will increase (money�
transportation etc.�
Trends in Wood Market in China

Softwood Market in ChinaSoftwood Market in China

Domestic production: No classification on softwood or hardwoodMain species:– Northeast: Pine (Korean pine, Mongolian Scotch
pine), fir, birch etc; popular– South: Pine (Monson pine), fir (Chinese fir);
eucalyptus etcPrice: Increase, partially due to demand, and partially due to inflationImport of logs: Mainly from Russia (Larix and Mongolian Scotch pine, 21.6 m, 68% total or 90% softwood), New Zealand (Radiate pine, 0.9 m) and Australia and USImport of sawnwood: Russia, US, Canada, NZ and ChileUses: Construction, furniture and decoration
Softwood Market in China

� 1996� 2006� � � � � � � � � � � m3� � US$� � � � � � � � � 1996 1997 1998 1999 2000 2001 2002 2003 2004 2005 2006
93.85 133.15 169.03 275.64 361.37 403.41 548.37 559.81 605.17 597.30 615.35
18 008.726 811.034 826.066 193.698 203.198 851.8
116 746.2119 878.9138 714.4150 778.81697715
1996/2006� %� 555.7 842.7

� 2006� � � � � � � � � � � � � � � � � m3� � � � � � � � � � � � �
� � � 117.4 19.3 11.1� � 102.2 16.8 20.0� � 70.7 11.7 -7.2� � � � � 45.0 7.4 -37.5� � � 39.8 6.5 13.7� � � � 37.6 6.2 -20.8� � 34.1 5.6 21.8� � � 28.1 4.6 29.5� � 17.8 2.9 -44.5� � 13.2 2.2 -7.7

Some cases of softwood priceFebruary 2007– Radiate pine: 1300 yuan, or US$ 175– Larix: 1200 yuan or US$ 160– Mongolian Scotch pine: 1300 yuan, or US$
175– Korean pine: 1600 yuan, or US$ 210– Monson pine: 900 yuan, or US$ 120– Chinese fir: 950 yuan, or US$ 125
Softwood Market in China

Thank You Thank You ��


