
Chip integrated strategies for acoustic separation and manipulation of cellsand particles
Thomas Laurell,* Filip Petersson and Andreas Nilsson
Received 29th September 2006
First published as an Advance Article on the web 7th December 2006
DOI: 10.1039/b601326k
Acoustic standing wave technology combined with microtechnology opens up new areas for the
development of advanced particle and cell separating microfluidic systems. This tutorial review
outlines the fundamental work performed on continuous flow acoustic standing wave
separation of particles in macro scale systems. The transition to the microchip format is
further surveyed, where both fabrication and design issues are discussed. The acoustic technology
offers attractive features, such as reasonable throughput and ability to separate particles in a
size domain of about tenths of micrometers to tens of micrometers. Examples of different
particle separation modes enabled in microfluidic chips, utilizing standing wave technology,
are described along a discussion of several potential applications in life science research and in
the medical clinic. Chip integrated acoustic standing wave separation technology is still in its
infancy and it can be anticipated that new laboratory standards very well may emerge from
the current research.
Introduction
Spatial control and manipulation of particulate matter in
fluids by means of ultrasonic standing waves is an area that is
gaining increased attention. A driving factor is the simulta-
neous progress within microfabrication and microfluidics,
which now offers methods for precision engineering of acoustic
resonators as an integrated part of microfluidic networks.
Ultrasonic standing wave manipulation offers a non-contact
mode of particle handling, which makes it an attractive tool in
cell handling microsystems as a minimum of mechanical stress
is induced by the applied acoustic forces. All types of particles
can be affected by ultrasonic standing wave forces as long as
they differ from the surrounding medium in regards to its
acoustic properties.
Acoustic standing waves were already described by Kundt1
in the 19th century with his famous tube experiment, where
cork dust was moved by an acoustic wave in a resonating air
column, illustrating the standing wave pattern. Ultrasonic
standing waves are generated either by the use of two opposing
sound sources or more commonly by a single ultrasonic
transducer which is facing a sound reflector. The ultrasonic
sources commonly used are piezo ceramic elements that either
are directly coupled into the liquid or via a coupling layer. An
optional way of generating acoustic standing waves in aDept. Electrical Measurements, Lund University, P.O. Box 118,S-221 00, Lund, Sweden
Thomas Laurell received hisPhD degree at the Departmentof Electrical Measurements,Lund University in 1995 andwas appointed Professor inMedical and Chemical Micro-sensors at the Department ofElectrical Measurements, LundUniversity in 2000. Laurellcurrently leads the nanobiotech-nology group at the department.His research focuses on Lab-on-a-Chip technologies forbiomedical monitoring/analysis,implantable neural electrodesand micro components for
liquid/cell sample handling in chemical microsystems. A strongfocus is currently set on acoustic separation of particles andbiological matter in microfluidic systems and the development ofnew nanoproteomics technology.
Filip Petersson, born in 1977,received his Master of Sciencedegree in Engineering Physicsin 2001 at Lund Institute ofTechnology (LTH), Sweden.He currently holds a positionas PhD student in micro-technology and ultrasoundphysics at the Department ofElectrical Measurements,LTH. His main research areais in acoustic particle separa-tion in microfluidic systems.The research findings haveresulted in several nationalawards, among these the
SKAPA award in memory of Alfred Nobel. He is also apartner in ErySave AB, a spin-off company developing asystem for blood recycling.
Thomas Laurell Filip Petersson
TUTORIAL REVIEW www.rsc.org/csr | Chemical Society Reviews
492 | Chem. Soc. Rev., 2007, 36, 492–506 This journal is � The Royal Society of Chemistry 2007

defined compartment is to design the resonator for a half
wavelength standing wave (or a multiple thereof) whereafter
the complete device is excited mechanically from an arbitrary
coupling point. When subsequently tuning the excitation
frequency to match the resonator compartment, a standing
wave is formed. This mode of operation, coined the Lund
method, was first explored by Nilsson2 et al. in a continuous
flow-through format for particle and cell separation.
The fundamental theory on acoustic standing wave forces
on particles has been described extensively by King,3 Yosioka
and Kawasima,4 Gorkov5 and Nyborg6 among others. The
force induced on particles in an acoustic standing wave field is
the result of both the primary and secondary radiation forces,
where the primary force originates from the standing wave and
the secondary forces are due to sound waves scattered by the
particles. The primary radiation force (PRF) is, in general,
responsible for the strongest acoustic force exerted on the
suspended particles in a standing wave field. Secondary forces
are commonly orders of magnitudes smaller and are only
influential at very short distances between particles, i.e. at very
high particles densities. As an example Ter Haar and Wyard7
showed the relative magnitude of acoustic forces on red blood
cells to be 2 6 10212 N for the PRF, the secondary
interparticle force to be 2 6 1029 N for cells in contact and
10214 N for cells 10 mm apart.
Theory
The primary radiation force
The primary radiation force can be divided into the axial
component and the transverse component, Fig. 1. The axial
PRF acts in the direction of the propagation of the acoustic
wave field and is stronger than the transverse PRF.
The axial PRF translates particles or cells to either the nodes
or the antinodes of the standing wave. The transverse PRF is
subsequently responsible for packing the particles closer
together and to withhold their positions. The equation of the
axial PRF (eqn 1), states that the acoustic force is proportional
to the acoustic pressure amplitude p0 squared and to the
volume of the particle Vc. As the size dependency scales with
the particle volume, the cube of the radius, the induced
primary force is strongly dependent on particle size and thus,
as the particle diameter is reduced, the acoustic force
diminishes rapidly. The acoustic contrast factor (eqn 2),
represented by w in eqn 1, depends on both the particle
density (rc) and its compressibility (bc) in relation to the
corresponding properties of the surrounding medium (rw, bw).
The wave number, k, is defined by 2p/l and x is the distance
from a pressure node.
Fr~{pp2
0Vcbw
2l
� �:w b,rð Þ:sin 2kxð Þ (1)
w b,rð Þ~ 5rc{2rw
2rczrw
{bc
bw
(2)
A most notable aspect of the acoustic contrast factor is
the possible sign change depending on the densities and
compressibilities, which determines the direction of the
acoustic force and thus whether the particle will move towards
the standing wave pressure node or the antinode. Generally,
solid particles in aqueous media are moved towards a pressure
node while e.g. gas bubbles are moved towards the pressure
antinode. Because of the acoustic contrast factor, even
particles which are neutrally buoyant can experience an
acoustic force as long as the compressibility differs from the
surrounding medium. The pressure amplitude in eqn 1 is
proportional to the supplied voltage when actuating with a
piezoelectric ceramic.8
Secondary acoustic forces
When multiple particles in a suspension are exposed to a
standing wave field, they will not only experience the primary
acoustic force, but also the secondary forces caused by waves
scattered by other particles. The interparticle forces are
sometimes called Bjerknes forces, after the pioneering work
by Bjerknes.9 A simplified equation for the interparticle forces
(eqn 3), when the acoustic wavelength is much greater than the
particle radius and the distance between the particles, was
derived by Weiser et al.10 This work was based on results from
Crum,11 which showed that it is possible to superposition the
Fig. 1 Acoustic forces that act on a particle: FAx is the axial
component of the primary radiation force, FTr is the transverse
component and FB are the interparticle forces (Bjerknes forces). At
time T1 the acoustic forces have just begun to act on the particles and
by time T2 a steady state has been reached.
Andreas Nilsson
Andreas Nilsson received hisMaster of Science in ElectricalEngineering at Lund Institute ofTechnology in 2002. He iscurrently a PhD student atthe department of ElectricalMeasurement in Lund and hisresearch is mainly focused onacoustic particle and cell mani-pulation in microfluidic chan-nels. He has received severalnational innovation awardsincluding the SKAPA award2003. He is currently involvedin ErySave AB, a spin-off com-pany commercializing acousticblood-washing technology.
This journal is � The Royal Society of Chemistry 2007 Chem. Soc. Rev., 2007, 36, 492–506 | 493
equation for the force on a rigid sphere with the corresponding
force for a compressible sphere.
FB xð Þ~
4pa6 rc{rwð Þ2 3cos2h{1� �
6rwd4v2 xð Þ{ v2rw bc{bwð Þ2
9d2p2 xð Þ
" #(3)
In eqn 3, a is the radius of the particle, d is the distance
between the particles and h is the angle between the centre line
of the particles and the direction of propagation of the incident
acoustic wave. The sign of the force is to be interpreted such
that a negative sign means an attractive interparticle force and
a positive sign means a repulsive force. The left side of the
equation depends on the particle velocity amplitude v(x) and
the right side depends on the acoustic pressure amplitude p(x).
When particles are lined up in the direction of the acoustic
wave propagation (h = 0u) the velocity-dependent term is
repulsive, and likewise attractive when the particles are
perpendicular (h = 90u) to the incident wave propagation.
The pressure-dependent term is not affected by particle
orientation at all and is always attractive. It is notable that
the velocity-dependent term diminishes as particles are driven
to the velocity node (pressure antinode), as in the case of air
bubbles and lipid vesicles. In a similar way the pressure-
dependent term diminishes as particles are driven towards the
pressure node (velocity antinode), as are most solid particles in
aqueous solutions. The influence of the secondary forces is
usually very weak, due to the distance term d in the
denominator, which means that it is only effective when the
distance between particles is very small. The secondary force
becomes important in aggregation and sedimentation applica-
tions, where particles initially are gathered in nodes by
the PRF, and as interparticle distances become smaller the
secondary forces assist in a further aggregation until the
clusters finally become heavy enough for the gravity to
overcome the buoyancy and start the sedimentation process.
Acoustic resonator modelling
Building the ideal acoustic resonator has proven to be a
complex task. Much care must be taken in designing and
assembling the different parts of the resonator in such a way
that an optimal coupling of acoustic energy into the fluid
chamber is obtained. Extensive modelling and research on
designing acoustic resonator systems have been reported.
Groschl12 describe the acoustic system performance in layered
resonators, starting from the electrical properties of the
piezoelectric actuator, including the coupling layers, and
finally to the generated acoustic field quantities of the
resonator. Further acoustic resonator model developments
have provided advisory design criteria in regards to selecting
the thickness in terms of l/2 and l/4 for a) the acoustic
coupling layer, b) the fluid layer and c) the reflector. The
numerous configurations presented predict the position of
the pressure node in the fluid chamber and also indicate the
obtained acoustic energy density therein.13 More recent model
developments have provided the ability to place the pressure
nodal plane at different positions in the resonator by tuning
the excitation frequency. The model also takes into account
the phenomenon of frequency splitting, i.e. when the dimen-
sion of the resonator chamber is matched to the transducers
resonance frequency.14 In this case the system resonance
occurs at two frequencies, one lower and one higher than the
original l/2 criterion of the fluid chamber. Further modelling
of resonators operated close to the frequency splitting
criterion, also denoted coincidence resonance, emphasises the
system sensitivity to small changes in resonator design.15
Macro scale acoustic standing wave particlemanipulation
To a large extent, previous work on acoustic standing wave
manipulation of particle suspensions has targeted batch
volume systems or fluidised bed systems rather than micro-
fluidic systems. One extensively researched topic is to utilize
acoustic standing waves to aggregate cells in clusters whereby
sedimentation takes place. Limaye16 et al. used a circular
transducer at the end of a tube containing suspended particles
(yeast or Escherichia coli bacteria). Initially the ultrasound was
applied continuously while the cells lined up in periodic
aggregates, l/2 apart, along the central axis in the tube. This
was followed by a period of pulsed ultrasound, allowing the
cells to sediment and the clarified supernatant was then
removed from the top. Cousins17 et al. used a similar model
comprising a glass tube and a circular ultrasonic transducer
system to separate plasma from whole blood. The glass tube
contained 4 ml whole blood which was sonicated. The PRF
concentrated the red cells to a level where secondary forces
caused the cells to aggregate more strongly, making them too
heavy to sustain their buoyant position and thus inducing
sedimentation. Blood separation by aggregation and sedimen-
tation was also done by Peterson18 et al. They used a
continuous system where blood entering a chamber from the
bottom was exposed to a travelling wave, which forced the red
blood cells from one side of the chamber to the other, where
aggregation and sedimentation took place. The enriched
erythrocytes were removed at an outlet parallel to the inlet
and the clarified plasma was removed from the top. A similar
design was used by Hawkes and Coakley,19 who used the
device to concentrate yeast suspensions.
Both Groschl et al.,20 Trampler et al.21 and Pui et al.22 have
used the aggregation and sedimentation technique in a cell
culture fermentation device. Hybridoma cells were used in a
bioreactor and fed with nutrient solution. Antibody-rich
solution was harvested through an outlet channel which
included an ultrasonic trap. The hybridoma cells were forced
together in the ultrasonic standing wave field and sedimented
back into the bioreactor and thus eliminating a loss of cells in
the harvesting procedure.
The aggregation and sedimentation techniques are all
dependent on gravity to work. Continuous separators with
flow splitters are not burdened by this. An h-shaped separator
was presented by Benes23 et al. where particles were focused in
plane with the inlet channel in a multi node standing wave. The
flow channel was expanded and divided into two outlets
downstream. By balancing the outlet flows, across a flow
splitter, a clear medium was withdrawn at the outlet closest to
the transducer and the particle suspension was collected at the
494 | Chem. Soc. Rev., 2007, 36, 492–506 This journal is � The Royal Society of Chemistry 2007
outlet furthest away from the transducer. The h-shape
separator has also been tested in microgravity proving that
it works well without the presence of gravity.24 Particle
extraction efficiencies of 91–97% were reported at flow rates
of 14 l per day, with 48% of the flow exiting through the
enriched flow outlet.
Gupta25,26 et al. and Grossner27 et al. used a flow chamber
filled with a porous medium. Unconsolidated glass bead beds,
aluminium meshes and polymeric foam were used as a porous
stationary phase. As the suspended particles passed through
the porous medium, secondary forces were believed to
cause the particles to stick onto the surface of the porous
medium. The particles were trapped in the medium as long as
the ultrasound was active. When the ultrasound was switched
off, the particles were released and washed away. The
limitation of this system is that the porous mesh will eventually
become saturated and the separation efficiency will drop. This
porous medium ultrasonic separator has also been used to
separate oil droplets from aqueous emulsions.28
Continuous separation of suspended particles utilizing flow
splitters in combination with a laminar flow has also been
described. The acoustic standing wave will cause a band or
multiple bands of particles to form according to the position of
the nodes or antinodes in the flow-through resonator.29,30 By
proper flow balancing of the outlets and the spatial positioning
of the standing wave, a band of particles can be directed into a
selected channel while a cleared medium is collected in other
channels. This mode of operation represents an attractive
way of implementing acoustically controlled continuous flow
separators. Different types of flow splitters have been used.
Yasuda et al. used a capillary inserted in their separation
chamber to act as a flow splitter to collect the separated
particles.31
Fractionation of suspended particles in a standing wave field
utilizing the fact that particles with dissimilar size or physical
properties are affected differently by the radiation force has
also been reported by several groups. Larger particles will for
example experience a larger acoustic radiation force than
smaller ones, which means that they will move faster to a node
or an antinode than the smaller ones. By the use of flow
splitters at the outlet and balanced flows it is possible to
separate the large particles from the smaller ones since they
have travelled different distances.32–34
It is also possible to separate particles of the same size if they
have different compressibility or density, thus defining each
particle type by its unique acoustic contrast factor W. Gupta35
et al. demonstrated that this separation was possible if the
carrier medium was balanced in such a way that the acoustic
contrast factors of the two particle types were of different
signs. This mode of particle separation follows a binary
clustering of particles having either positive or negative
acoustic contrast factors. In order to obtain a higher degree
of differentiation, sequential steps of media balancing and
acoustic separation are required.
A further iteration on particle sizing was proposed by
Mandralis36 et al. who used a combination of frequency
switching of higher harmonics with flow cycle switching.
Mandralis utilized the fact that smaller particles move
considerably slower in an acoustic standing wave field than a
corresponding larger particle. If this fact is implemented in a
laminar flow profile, particles that move fast into the high flow
rate zone are also shifted a longer distance along the flow
direction as compared to smaller particles in the same period
of time. If subsequently the acoustic excitation is shifted to the
first harmonic of the resonator, two nodes are formed,
withdrawing particles from the centre and the high flow rate
regime of the channel. By altering the acoustic driving
conditions between the fundamental resonance and the first
harmonic, synchronised with an oscillating parabolic flow, a
net transport of particles exceeding a defined size will be
enriched towards one end of the fluidic system and the smaller
particles are concentrated at the other end of the separation
device. This principle was also demonstrated to work in a
continuous separation mode.
Microscale acoustic standing wave particlemanipulation
An advantage of working in the microscale domain is that the
flow is predominantly laminar, making flow splitter based
fractionation systems efficient in continuous flow particle
separation. Microscale is also beneficial when utilizing acoustic
standing waves to manipulate particles as smaller channels and
thus reduced resonator dimensions inherently lead to higher
resonance frequencies. This in turn yields stronger radiation
forces on the particles since the primary radiation force is
proportional to the frequency and thus a stronger particle
focusing and consequently a better separation performance.
On the other hand as the particles become smaller the primary
radiation force is rapidly decreased. The particle sizes that
commonly allow manipulation by the primary radiation
force range between a few tenths of micrometers to tens of
micrometers when considering aqueous based solutions (speed
of sound #1500 m s21). In that case, the upper size limit is set
by practical aspects such as sedimentation or channel blocking.
Also, the fact that as the channel size approaches the upper
size limit the primary radiation force becomes too weak to
offer a stable separation performance. Typical channel
dimensions in the standing wave direction range from a
millimetre to a few tens of micrometers, which approximately
corresponds to an operating frequency in the 100 kHz to the
10 MHz range. These effective operating domains indicate
that the microscale is a preferred dimensional regime to
design acoustic separation systems. Further benefits of the
miniaturisation of acoustic microfluidic separator systems is
the ease of integration with more advanced microfluidic
networks and downstream analytical components, accomplish-
ing complete lab-on-a-chip systems for microparticle, e.g. bead
or cell based, analysis and separation.
Microfluidic acoustic separators have been developed by
several groups in the recent years. Hawkes30 et al. presented a
microfluidic separation device realized in stainless steel by wire
electro discharge machining followed by fine polishing of the
acoustic surfaces. The separator was realised both in the form
of an h-separator as outlined by Benes23 and as a Y-shaped
separator similar to the design reported by Nilsson et al. In
contrast Nilsson37 et al. demonstrated a continuous particle
concentration device based on wet etched silicon and a bonded
This journal is � The Royal Society of Chemistry 2007 Chem. Soc. Rev., 2007, 36, 492–506 | 495

glass lid to create the separation channels. The ultrasonic
transducer was applied underneath the channel, utilizing the
propagation mode conversion of the sound wave to create a
standing wave field in the flow channel orthogonal to the
incident acoustic excitation. Harris et al. used both aniso-
tropically wet etched silicon and isotropically etched glass to
create a separation device which comprised a single inlet
through a silicon chip and a flow-through cavity, etched in an
opposing glass chip. The glass recess had smoothly curved
sidewalls due to the isotropic etch and was not suitable for
standing wave formation in this direction. However, the
bottom of the recess was flat and served well as acoustic
reflector, forming a resonator between the transducer surface
and the glass recess and focusing the incoming particles into a
sheet. The device had two outlets via the silicon chip, enabling
the balancing of the outlet flows such that the particle enriched
fraction excited via one of the outlets and the clear fraction
through the other.38–40 In these papers the acoustic properties
of the device were both measured and modelled.
Kapishnikov34 et al. demonstrated a microfluidic acoustic
separator realised by photolithography in SU-8, where particle
sizing was accomplished by utilizing the particle specific
migration velocities across the flow channel. The channel
was terminated by a flow splitter to collect particles in two
different size fractions.
Lilliehorn41 et al. described a microsystem that used SU-8
photolithography defined microchannels on a glass plate. The
SU-8/glass flow channel was clamped onto a printed circuit
board holding integrated miniature piezoceramic transducers,
forming local acoustic resonator zones in the flow channel.
Each resonator zone generated a pressure node in the centre of
the flow channel, which could trap and enrich particles and
cells in a continuous flow system. Lilliehorn42 also presented a
paper where the ultrasonic trapping microarray was used to
trap microbeads in zones accessible for different fluids via
multiple microchannels connected to the trapping zone.
Thereby a non-contact and continuous flow bioassaying
system utilizing e.g. antibody-activated microbeads was
enabled. Wiklund43 demonstrated a fused silica capillary
integrated with an acoustic standing wave resonator in the
capillary length direction. This configuration enabled trapping
of microparticles in several standing wave nodes along the
capillary. Particle size selection was also performed by
matching Stokes drag force to the trapping force, which scales
with the volume of the particle. In a different configuration
Wiklund44 et al. also used ultrasonic standing waves to trap
and concentrate cells in single-layer aggregates at well
defined positions in a 96-well microtitre plate format for high
sensitivity bioanalysis utilizing confocal fluorescence micro-
scopy. Confocal fluorescence detection of acoustically con-
centrated and aggregated beads for human thyroid hormone
assaying was reported at a limit of detection of 20 fM.
Designing microfluidic acoustic resonators
When designing an acoustic resonator for suspended particle
separations the choice of construction material is of major
importance. A key aspect concerns the accomplishment of a
mechanical system that efficiently transmits the acoustic power
from the piezo ceramic device into the fluid filled resonator
chamber. This is commonly done via a matching layer of a
suitable material. A clear option in coupling the acoustic signal
into the fluidic system is to design the resonator in such a way
that one of the walls between which the acoustic standing wave
is induced is the actual acoustic actuator.41 Iterations of this
design include either two opposing transducers that are phase
matched to position the acoustic pressure node at a certain
position in the resonance chamber34 and the Lund method
(further described below) where a resonator chamber is excited
mechanically from an arbitrary position at a frequency that
corresponds to n*l/2 of the resonator width. The choice of
material in all the above cases favours the use of high Q-value
materials, i.e. materials that transmit sound waves at low
losses. The material should also display good acoustic
reflection properties when the sound wave transits from the
fluidic media (usually aqueous) into the boundary wall
(reflection). Low acoustic losses in the bulk material inherently
also offer a low temperature rise which otherwise may be a
problem if increased acoustic power input is needed.
In this perspective silicon has proven a well suited material.
Table 1 provides material property data for some potential
material choices where the compressibility and Young’s
modulus are good indicators on suitable materials. It can also
be commented that silicon displays good thermal conductivity
properties. Based on the given material data glass also turns
out as a good candidate material in resonator constructions.
Since glass and silicon are a frequently used material
combination in microfabrication, a close to ideal material
match is found for the design of microfluidic based acoustic
separation systems. PMMA and PC are less suitable in
acoustic resonators but are listed for comparison.
The favourable microfabrication properties of silicon also
make it the material of choice. A fundamental requirement in
the design of a good resonator is that the two opposing
reflector surfaces are truly parallel in order to obtain a good
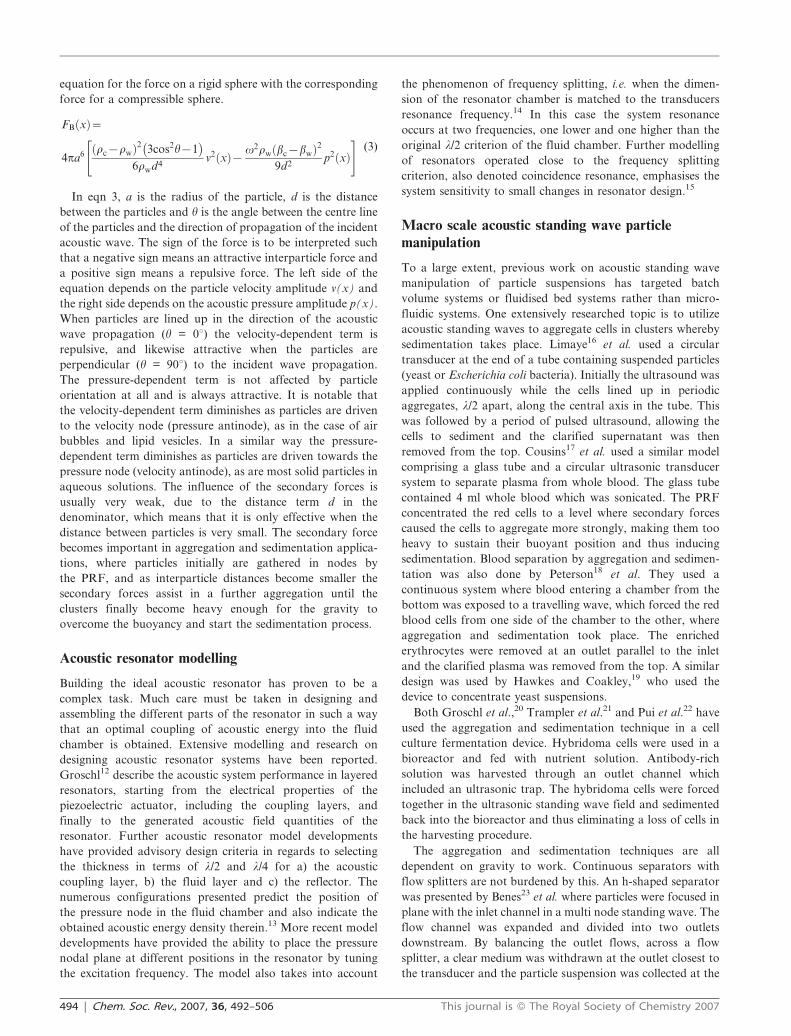
acoustic standing wave. The monocrystalline properties of
industrial silicon wafers further assist in the design of ideal
acoustic reflector walls. As monocrystalline silicon is available
in cuts of various crystal orientations, e.g. S110T and S100T, as
defined by their Miller indices, a multitude of design options
are available (Fig. 2). The crystal orientation is of importance
when fabrication processes based on standard anisotropic wet
etching are used. If deep reactive ion etching (DRIE) is
employed to fabricate vertical channel walls as acoustic
reflector surfaces, wafer crystal orientation is of no impor-
tance. It can, however, be pointed out that the tolerance
requirements when employing the DRIE-process to fabricate
acoustic resonators are highly critical in regards to reflector
Table 1 Physical material properties of some materials used inacoustic resonator designs
Density/kg m23
Compressibility/Pa21
Speed ofsound/m s21
Young’smodulus/GPa
Silicon 2330 6,0E-12 8430 130Steel 7900 3,8E-12 5790 200Pyrex glass 2330 1,4E-12 5500 63PMMA 1150 1,3E-12 2590 3PC 1200 1,8E-10 2160 2
496 | Chem. Soc. Rev., 2007, 36, 492–506 This journal is � The Royal Society of Chemistry 2007
wall aspect ratio. It is therefore recommended that conven-
tional anisotropic wet etching is performed when resonator
designs are made that include two opposing reflector walls in
the bulk silicon material, which is the case for systems based on
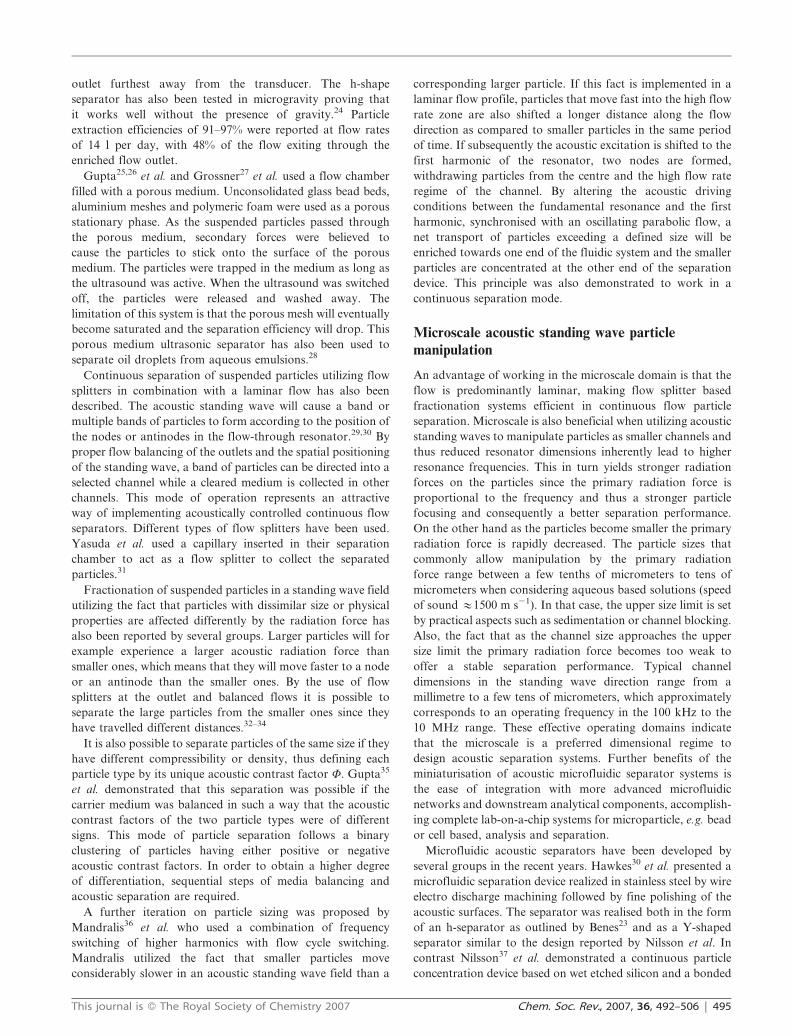
the Lund-method. Fig. 3 shows three parallel anisotropically
etched microchannels, in an S100T-oriented wafer, with
perfectly flat and parallel side-walls. The side walls also define
slow etch directions, when using KOH as the etchant. The
fundamental processes for performing the microfabrication
and manufacturing of acoustic resonator flow channels are
more extensively outlined in the literature.45
When actuating a well designed resonator channel at its
fundamental resonance frequency the particles will be focused
in a single pressure node, forming a confined streaming band
of concentrated particles in the centre with particle free
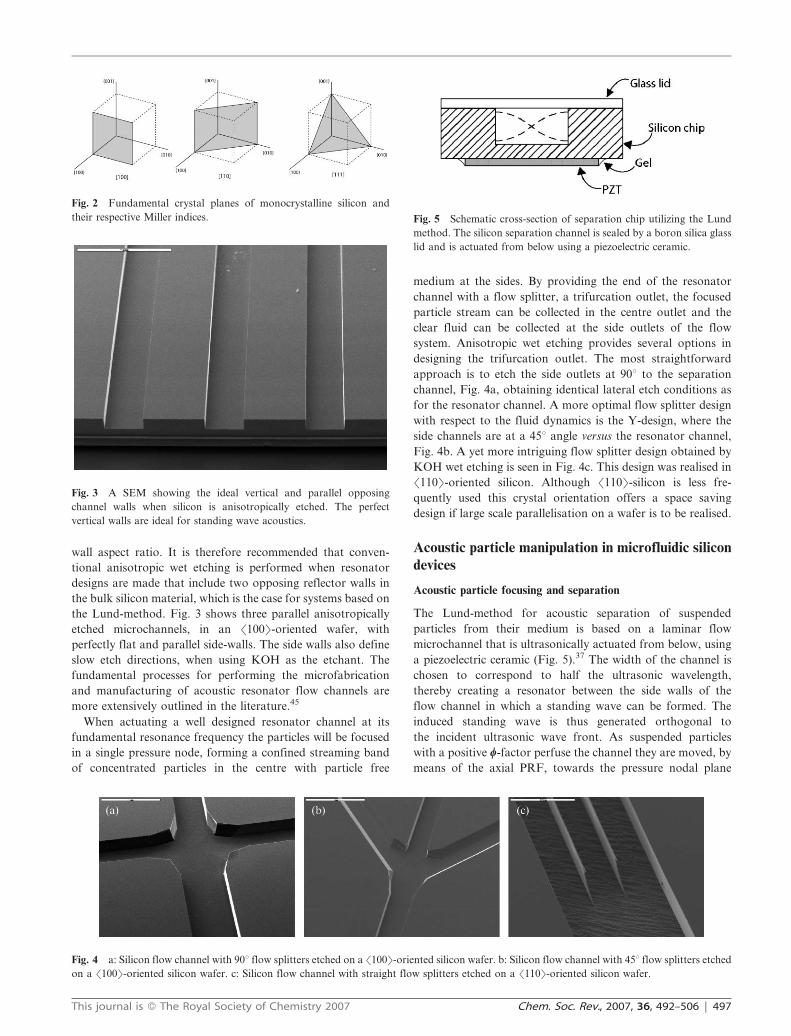
medium at the sides. By providing the end of the resonator
channel with a flow splitter, a trifurcation outlet, the focused
particle stream can be collected in the centre outlet and the
clear fluid can be collected at the side outlets of the flow
system. Anisotropic wet etching provides several options in
designing the trifurcation outlet. The most straightforward
approach is to etch the side outlets at 90u to the separation
channel, Fig. 4a, obtaining identical lateral etch conditions as
for the resonator channel. A more optimal flow splitter design
with respect to the fluid dynamics is the Y-design, where the
side channels are at a 45u angle versus the resonator channel,
Fig. 4b. A yet more intriguing flow splitter design obtained by
KOH wet etching is seen in Fig. 4c. This design was realised in
S110T-oriented silicon. Although S110T-silicon is less fre-
quently used this crystal orientation offers a space saving
design if large scale parallelisation on a wafer is to be realised.
Acoustic particle manipulation in microfluidic silicon
devices
Acoustic particle focusing and separation
The Lund-method for acoustic separation of suspended
particles from their medium is based on a laminar flow
microchannel that is ultrasonically actuated from below, using
a piezoelectric ceramic (Fig. 5).37 The width of the channel is
chosen to correspond to half the ultrasonic wavelength,
thereby creating a resonator between the side walls of the
flow channel in which a standing wave can be formed. The
induced standing wave is thus generated orthogonal to
the incident ultrasonic wave front. As suspended particles
with a positive w-factor perfuse the channel they are moved, by
means of the axial PRF, towards the pressure nodal plane
Fig. 3 A SEM showing the ideal vertical and parallel opposing
channel walls when silicon is anisotropically etched. The perfect
vertical walls are ideal for standing wave acoustics.
Fig. 4 a: Silicon flow channel with 90u flow splitters etched on a S100T-oriented silicon wafer. b: Silicon flow channel with 45u flow splitters etched
on a S100T-oriented silicon wafer. c: Silicon flow channel with straight flow splitters etched on a S110T-oriented silicon wafer.
Fig. 5 Schematic cross-section of separation chip utilizing the Lund
method. The silicon separation channel is sealed by a boron silica glass
lid and is actuated from below using a piezoelectric ceramic.
Fig. 2 Fundamental crystal planes of monocrystalline silicon and
their respective Miller indices.
This journal is � The Royal Society of Chemistry 2007 Chem. Soc. Rev., 2007, 36, 492–506 | 497
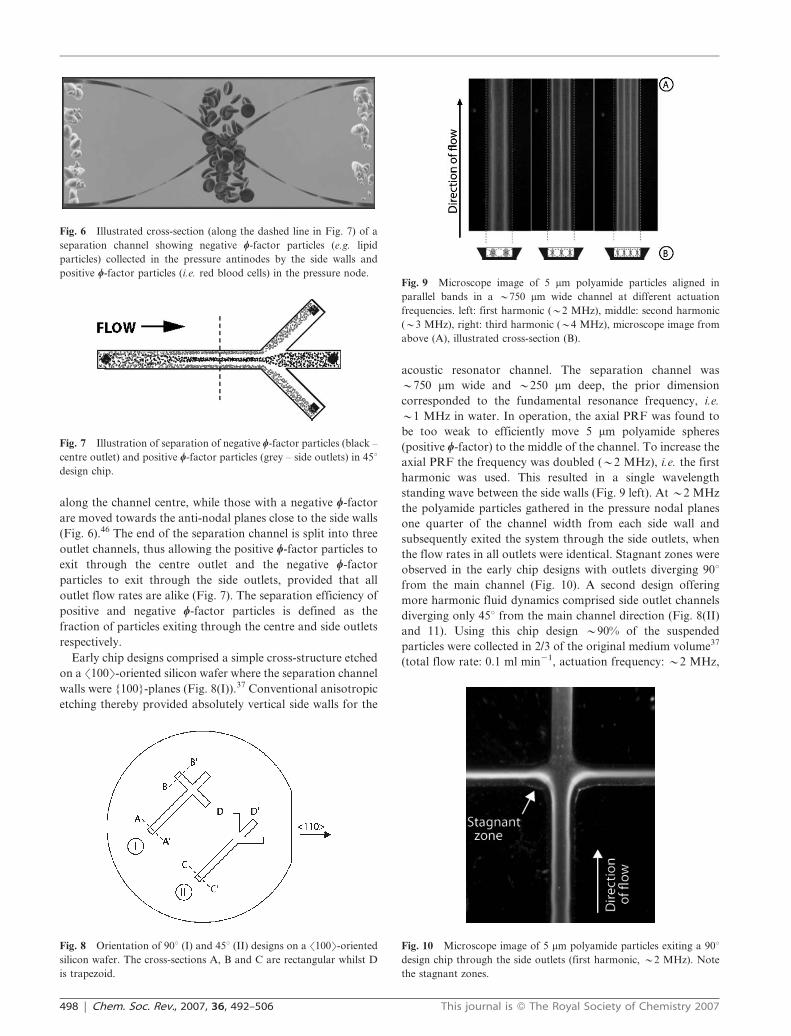
along the channel centre, while those with a negative w-factor
are moved towards the anti-nodal planes close to the side walls
(Fig. 6).46 The end of the separation channel is split into three
outlet channels, thus allowing the positive w-factor particles to
exit through the centre outlet and the negative w-factor
particles to exit through the side outlets, provided that all
outlet flow rates are alike (Fig. 7). The separation efficiency of
positive and negative w-factor particles is defined as the
fraction of particles exiting through the centre and side outlets
respectively.
Early chip designs comprised a simple cross-structure etched
on a S100T-oriented silicon wafer where the separation channel
walls were {100}-planes (Fig. 8(I)).37 Conventional anisotropic
etching thereby provided absolutely vertical side walls for the
acoustic resonator channel. The separation channel was
y750 mm wide and y250 mm deep, the prior dimension
corresponded to the fundamental resonance frequency, i.e.
y1 MHz in water. In operation, the axial PRF was found to
be too weak to efficiently move 5 mm polyamide spheres
(positive w-factor) to the middle of the channel. To increase the
axial PRF the frequency was doubled (y2 MHz), i.e. the first
harmonic was used. This resulted in a single wavelength
standing wave between the side walls (Fig. 9 left). At y2 MHz
the polyamide particles gathered in the pressure nodal planes
one quarter of the channel width from each side wall and
subsequently exited the system through the side outlets, when
the flow rates in all outlets were identical. Stagnant zones were
observed in the early chip designs with outlets diverging 90ufrom the main channel (Fig. 10). A second design offering
more harmonic fluid dynamics comprised side outlet channels
diverging only 45u from the main channel direction (Fig. 8(II)
and 11). Using this chip design y90% of the suspended
particles were collected in 2/3 of the original medium volume37
(total flow rate: 0.1 ml min21, actuation frequency: y2 MHz,
Fig. 6 Illustrated cross-section (along the dashed line in Fig. 7) of a
separation channel showing negative w-factor particles (e.g. lipid
particles) collected in the pressure antinodes by the side walls and
positive w-factor particles (i.e. red blood cells) in the pressure node.
Fig. 7 Illustration of separation of negative w-factor particles (black –
centre outlet) and positive w-factor particles (grey – side outlets) in 45udesign chip.
Fig. 8 Orientation of 90u (I) and 45u (II) designs on a S100T-oriented
silicon wafer. The cross-sections A, B and C are rectangular whilst D
is trapezoid.
Fig. 9 Microscope image of 5 mm polyamide particles aligned in
parallel bands in a y750 mm wide channel at different actuation
frequencies. left: first harmonic (y2 MHz), middle: second harmonic
(y3 MHz), right: third harmonic (y4 MHz), microscope image from
above (A), illustrated cross-section (B).
Fig. 10 Microscope image of 5 mm polyamide particles exiting a 90udesign chip through the side outlets (first harmonic, y2 MHz). Note
the stagnant zones.
498 | Chem. Soc. Rev., 2007, 36, 492–506 This journal is � The Royal Society of Chemistry 2007
actuation voltage: 15 Vpp (peak-to-peak), particle concentra-
tion: 2% by volume).
Since the y2 MHz axial PRF was sufficient to move 5 mm
polyamide particles, a chip design with the corresponding
fundamental resonance frequency was fabricated.46 In this
design, the channel width was y350 mm (depth y125 mm),
corresponding to half a wavelength at y2 MHz. Conse-
quently, the polyamide particles now exited through the centre
outlet while most of the suspending medium exited through the
side outlets, provided that the flow rates in all outlets were
identical. When the voltage applied to the piezoelectric ceramic
was increased, the acoustic force also increased and the
particles were gathered in a narrower band. At 12 V virtually
all particles exited through the centre outlet together with
1/3 of the suspending medium (Fig. 12, total flow rate:
0.3 ml min21, actuation frequency: y2 MHz, actuation
voltage: 12 Vpp, particle concentration: 2% by volume). The
maximum applicable voltage was determined by the heating of
the chip due to losses in the actuator and by trapping of
particles in the flow channel, the latter most likely a result of
the transverse PRF.47 If the flow rate was increased the particle
band became wider since the particles resided in the standing-
wave field for a shorter period of time, resulting in a reduced
separation efficiency (Fig. 13). A higher concentration of
suspended particles also had a negative effect on the separation
efficiency since more particles demanded a stronger acoustic
force and because the centre outlet was overloaded (Fig. 14).
One of the first applications of the acoustic separation
method targeted blood washing in open-heart surgery.46,48,49
In general, blood shed in the chest cavity during surgery, e.g.
coronary bypass, is collected and returned to the patient via a
filter. This blood is commonly contaminated by triglycerides
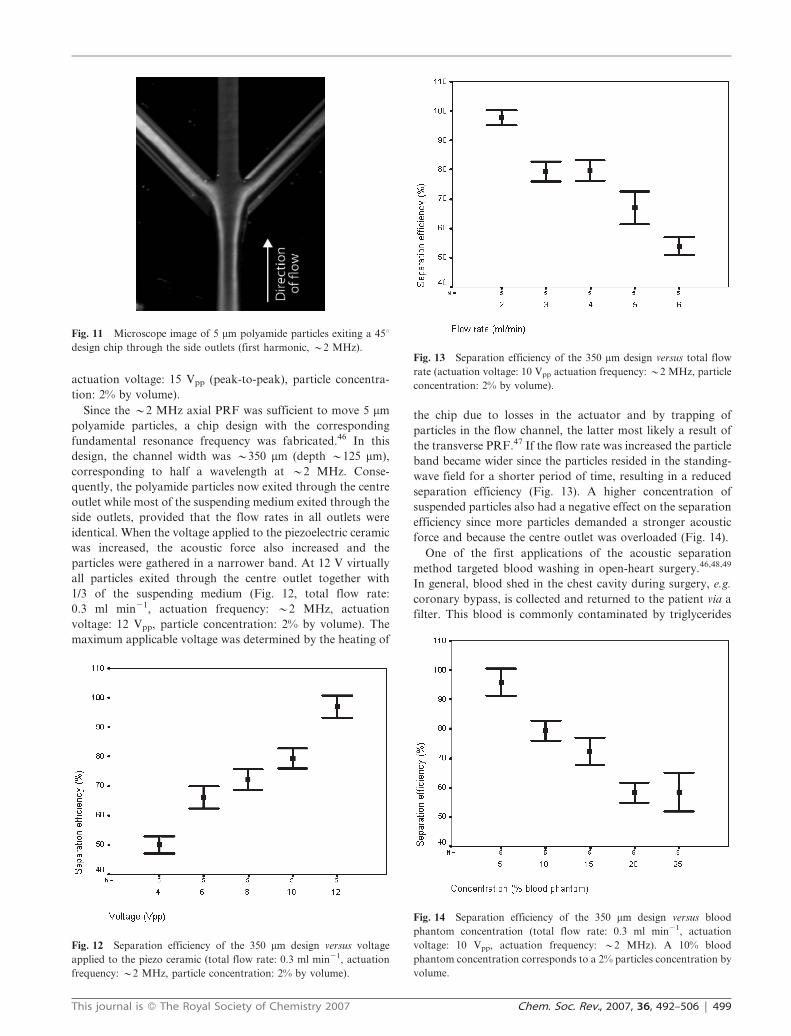
Fig. 11 Microscope image of 5 mm polyamide particles exiting a 45udesign chip through the side outlets (first harmonic, y2 MHz).
Fig. 12 Separation efficiency of the 350 mm design versus voltage
applied to the piezo ceramic (total flow rate: 0.3 ml min21, actuation
frequency: y2 MHz, particle concentration: 2% by volume).
Fig. 13 Separation efficiency of the 350 mm design versus total flow
rate (actuation voltage: 10 Vpp actuation frequency: y2 MHz, particle
concentration: 2% by volume).
Fig. 14 Separation efficiency of the 350 mm design versus blood
phantom concentration (total flow rate: 0.3 ml min21, actuation
voltage: 10 Vpp, actuation frequency: y2 MHz). A 10% blood
phantom concentration corresponds to a 2% particles concentration by
volume.
This journal is � The Royal Society of Chemistry 2007 Chem. Soc. Rev., 2007, 36, 492–506 | 499

from adipose tissue undergoing surgery. However, when
autotransfusion is performed, millions of small lipid particles
(lipid microemboli) pass straight through the filter and are
introduced into the patient’s circulatory system, resulting in
microembolisation of the capillary network in the bodily
organs and subsequent local ischemic tissue damage. This
becomes most obvious with regard to the brain.50 Elevated
levels of cognitive dysfunction have been linked to lipid micro-
embolisation of the brain.51 No dedicated methods to remove
lipid microemboli are currently available. Autotransfusion is
clearly preferred in spite of the aspects of microembolisation
since returning the patient’s own blood reduces the strain
on the blood banks. In addition, it eliminates transfusion
transmitted disease, immunologic reactions and the risk of
blood group incompatibility. In the case of extensive blood
loss, blood wash devices based on centrifuges can be used.
These are, however, burdened with a number of drawbacks.
They can only handle large volumes of blood, they expose the
blood cells to harmful mechanical stress (high g-levels) and are
non continuous. Fortunately, lipid particles display a negative
w-factor (y 20.3) while being positive for erythrocytes (w #y0.3). This means that, while passing through a y350 mm
wide separation channel actuated at y2 MHz, lipid particles
will move towards the side walls and exit the system via the
side outlets while erythrocytes move to the centre and exit
through the centre outlet (Fig. 15). The fraction of the
suspending medium that exits the system together with the
lipid particles will be determined by the flow speeds set for
the different outlets.
In a study on lipid microemboli separation, a sonicated
emulsion of tritium-labeled trioleine in saline solution was
used to evaluate the lipid particle separation efficiency. The
measurements were performed by detecting the radioactivity of
the waste and enrichment fractions. It was shown that about
85% of the lipid particles were removed independent of the
concentration of erythrocytes, while the erythrocyte recovery
decreased at elevated hematocrit levels (Fig. 16 and 17,
total flow rate: 0.3 ml min21, actuation frequency: y2 MHz,
actuation voltage: 10 Vpp, erythrocyte concentration: 2.5–
10.0% by volume, lipid concentration: 1% by volume).46 The
concept of increasing the throughput by using several parallel
channels was later demonstrated (Fig. 18). The mean separa-
tion efficiency, for both erythrocytes and lipid particles, was
found to be around 80% in the investigated concentration
range (5–30% erythrocytes and 0.5–2.0% lipid particles by
volume, eight parallel channels, centre outlet flow rate:
0.5 ml min21, total side outlet flow rate: 0.5 ml min21, actua-
tion frequency: y2 MHz, actuation voltage: 18–28 Vpp).48 A
parameter to take into account regarding the erythrocyte
separation efficiency is overloading of the centre outlet at
higher hematocrit levels. The first step in improving the
characteristics comprises balancing of the waste and enrich-
ment flow rates. The implementation of serially linked
separation channels can further improve the situation. Fig. 19
Fig. 15 Microscope image showing human lipid (fat) particles being
separated from red blood cells (erythrocytes).
Fig. 16 Erythrocyte separation efficiency versus erythrocyte concen-
tration (total flow rate: 0.3 ml min21, actuation frequency: y2 MHz,
actuation voltage: 10 Vpp, lipid concentration: 1% by volume).
Fig. 17 Separation efficiency of lipid particles versus erythrocyte
concentration (total flow rate: 0.3 ml/ min21, actuation frequency:
y2 MHz, actuation voltage: 10 Vpp, lipid concentration: 1% by
volume).
500 | Chem. Soc. Rev., 2007, 36, 492–506 This journal is � The Royal Society of Chemistry 2007
shows the basic design of a chip for serial processing in three
steps. The three centre outlets are enrichment outlets.
In addition to separating lipid particles from erythrocytes,
the method has a clear potential in handling other blood
component therapy tasks, i.e. it can be anticipated that the
method can be further developed to enable separation of
different blood cells and to produce clinically clean plasma.
The Lund method is a generic continuous-flow separation
platform, offering low mechanical stress and non-contact
processing of micrometer sized suspended particles. In theory,
the only prerequisite is that the axial PRF is non zero, which is
the case if the acoustic contrast factor is non-zero. By
manipulating the density of the medium the contrast factor
can be altered to some extent. Heating of temperature-sensitive
samples due to losses in the piezo ceramic actuator and in the
bulk material of the resonator can be avoided by cooling the
chip, e.g. with a Peltier element.
A commonly raised issue in regards to cell handling in
acoustic standing-wave fields is the potential harm that could
be caused. In this respect viability studies supporting that
ultrasonic manipulation of bioparticles is harmless have been
performed by several researchers.22,48,52 Thus, acoustic stand-
ing-wave technology seems to be a highly potent candidate for
the development of new high performance platforms for
manipulation and separation of cells. In the above described
work performed on lipid microemboli separation from
erythrocytes the degree of induced hemolysis was also
investigated, showing that no significant increase in hemolysis
could be detected after passing through the acoustic separa-
tor.48 Also, unpublished results by M. Evander of the Lund-
group, using the acoustic trapping device reported by
Lilliehorn,41 have recently shown that cells divide and
proliferate in acoustic standing wave fields.
Aspects on system scaling
A generally raised concern regarding particle separation
performed in microchip formats is the limited throughput of
the systems presented. This is a fact that is inherently linked to
the microscale environment in which the separation is
performed. On the other hand, microscale is generally a
prerequisite that offers the beneficial physical properties as
such, where favourable scaling laws can be capitalized upon,
e.g. laminar flow, which is a dominating flow regime in the
microchip format. In regards to acoustic standing wave based
particle separation, again, the scaling laws favour downscaling
as the primary acoustic radiation force is directly proportional
to the particle volume (radius to the 3rd power), which should
enable the separation of similar particles sizes. Furthermore,
the acoustic force on a particle is directly proportional to the
employed frequency. Hence, as the dimension of the separa-
tion channel is reduced the fundamental resonance frequency
is raised, suggesting that dimensions should be reduced when
higher acoustic forces are sought. This in turn aligns well with
efforts and needs in separation science for particle sizes
ranging in the submicron range, 0.1–1.0 mm. It should also be
acknowledged that as smaller particles are being processed the
scaling laws strongly counteract favourable separation condi-
tions due to the 3rd power dependency of the particle size for
the PRF. This size domain is a very challenging area, where
field flow fractionation,53 FFF, currently is one of the
dominating separation technology platforms, which yet
requires a highly skilled approach for a successful outcome.
Although far from proven, it can be hypothesized that acoustic
separation may actually offer a viable way forward in the
domain of nanoparticle separation. Along this line follows
further dimensional reduction in order to match requirements
on acoustic force in regards to the decreased particle size.
Mixing effects due to induced acoustic streaming, which grows
with reduced dimension, must also be suppressed along this
development.
The benefits of microscale in regards to acoustic particle
separation are evident and also fundamental to the separation
performance. At the same time these facts clearly counteract
the requirements on volumetric throughput of such systems.
When designing systems for analytical purposes the actual
miniaturisation is not really a problem in regards to
throughput. On the other hand, a major part of the anticipated
applications are seen in fields where a preparative scale is
highly desired, as e.g. described in the cases of blood washing
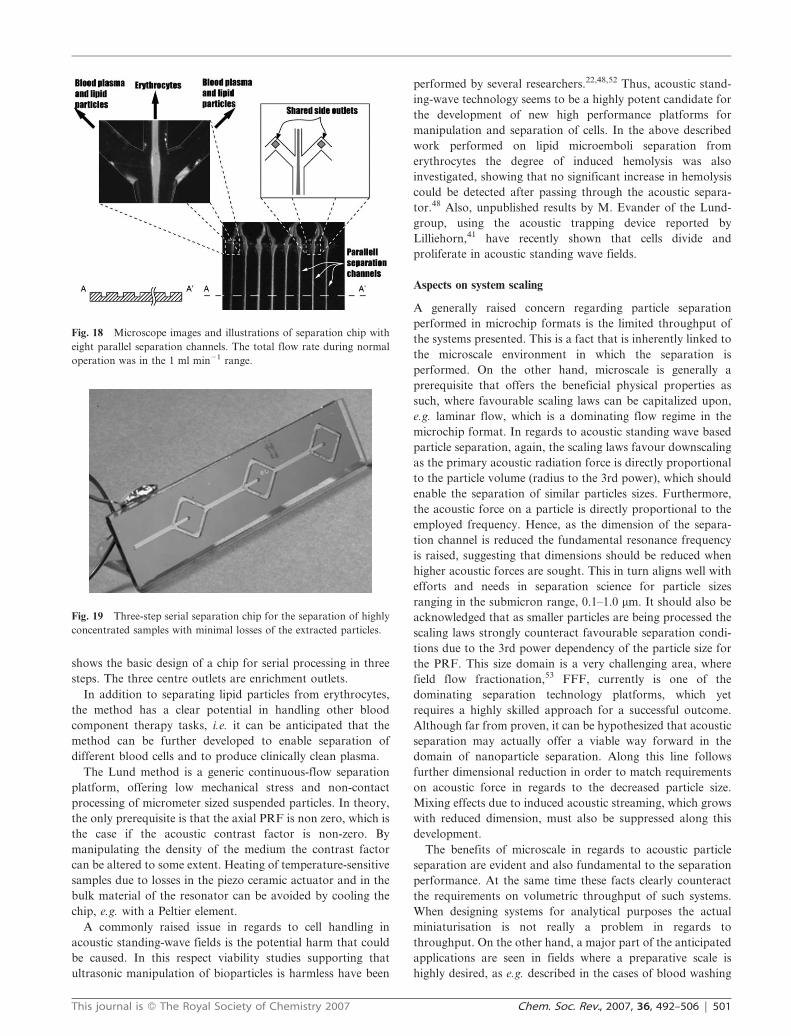
Fig. 18 Microscope images and illustrations of separation chip with
eight parallel separation channels. The total flow rate during normal
operation was in the 1 ml min21 range.
Fig. 19 Three-step serial separation chip for the separation of highly
concentrated samples with minimal losses of the extracted particles.
This journal is � The Royal Society of Chemistry 2007 Chem. Soc. Rev., 2007, 36, 492–506 | 501
in thoracic surgery or post surgery blood salvage. Clear areas
are also seen in the blood banking units where blood
component fractionation is a major task with throughput
requirements of litres per hour or higher. An approach to
meet these demands, which yet comply with the basic ideas
of miniaturisation, is to implement a design that holds
identical multiple parallel channels connected in a bifurcation
structure such that the unit separation structure is simply
replicated in a 2n order, Fig. 20. Fig. 21 shows the layout of an
eight-channel bifurcation erythrocyte extractor used in the
thoracic surgery blood washing development,48 where the inlet
and outlet region of a silicon microdevice is seen in the SEM
insert images.
A clear benefit of the transverse acoustic mode of operation
described by the Lund group is the fact that the adaptation
of the volumetric throughput can be done by increasing
the number of parallel channels using the same piezoceramic
actuator. Whereas the original single channel separator
typically offered throughputs in the range of 100 ml min21
the eight channel separator yielded flow rates in the order of
1 ml min21.
Medium exchange through acoustic particle switching
Laminar flow microchannels offer the possibility to laminate
different liquid media in a streaming system. This, combined
with acoustic particle manipulation, can be utilized to move
particles from one suspending medium to another by means of
the axial PRF.54,55 A particle suspension enters a rectangular
cross-section microchannel, similar to the one used to separate
lipid particles from erythrocytes,46 through two side inlets
(Fig. 22–24). A second, particle free, medium enters through a
single centre inlet, whereby the centre fluid is laminated
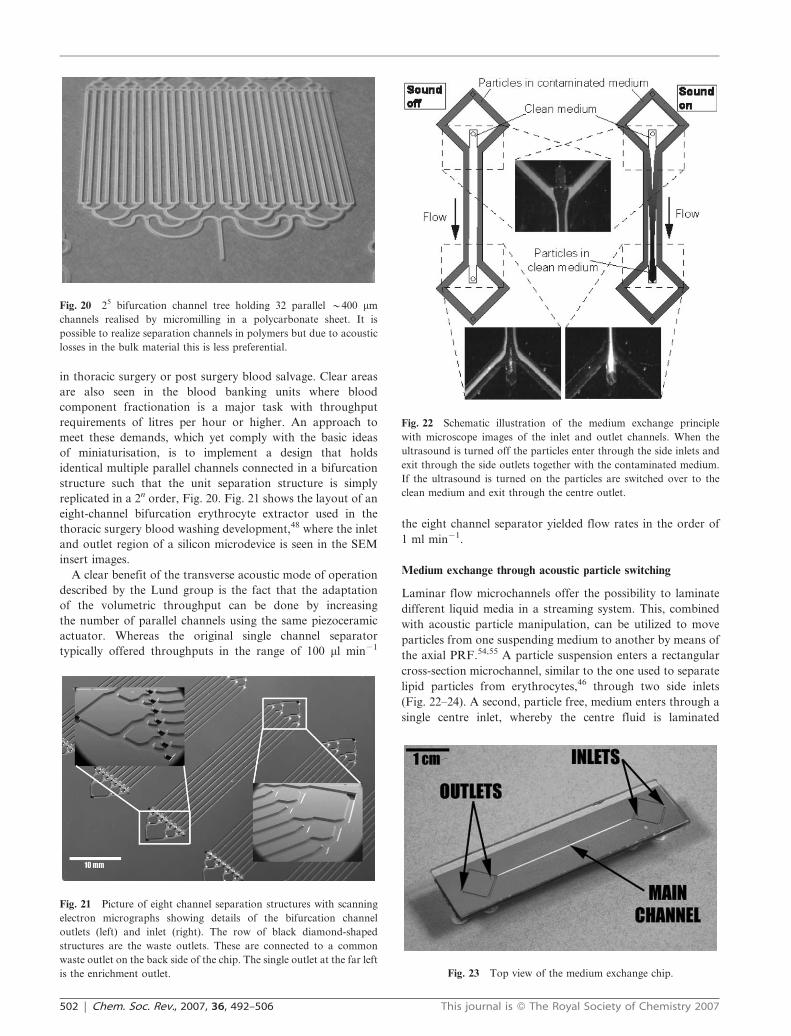
Fig. 20 25 bifurcation channel tree holding 32 parallel y400 mm
channels realised by micromilling in a polycarbonate sheet. It is
possible to realize separation channels in polymers but due to acoustic
losses in the bulk material this is less preferential.
Fig. 21 Picture of eight channel separation structures with scanning
electron micrographs showing details of the bifurcation channel
outlets (left) and inlet (right). The row of black diamond-shaped
structures are the waste outlets. These are connected to a common
waste outlet on the back side of the chip. The single outlet at the far left
is the enrichment outlet.
Fig. 22 Schematic illustration of the medium exchange principle
with microscope images of the inlet and outlet channels. When the
ultrasound is turned off the particles enter through the side inlets and
exit through the side outlets together with the contaminated medium.
If the ultrasound is turned on the particles are switched over to the
clean medium and exit through the centre outlet.
Fig. 23 Top view of the medium exchange chip.
502 | Chem. Soc. Rev., 2007, 36, 492–506 This journal is � The Royal Society of Chemistry 2007
between the side inlet streams. If the particles have a positive
w-factor they will move from their original medium into the
centre inlet stream, when a half wavelength standing wave is
applied, and subsequently exit with the new medium through
the centre outlet. This mode of operation can be used as a
continuous particle washing system. The original medium exits
via the two side outlets. Likewise, in cases where the particles
have a negative w-factor these are supplied via the centre inlet
and are subsequently switched over to a clean medium entering
through the side inlets.
When two media are laminated some lateral mixing will
always occur due to diffusion. In the case of on-line particles
washing, as described above in the medium exchange principle,
diffusional mixing may induce undesired cross-contamination
between the laminated streams. However, this problem can be
eliminated by balancing the exit flow rates, ensuring that the
diffusional mixing zone in the clear medium is directed to the
waste outlet. When accounting for mixing effects, Rayleigh
mixing56 should also be considered. This becomes especially
pronounced at low flow rate and high acoustic intensities
and high frequencies. In separation systems where micrometer-
sized particles are used and at the flow rates commonly used
Reyleigh mixing can, in principle, be neglected.
The principle of medium exchange was demonstrated by
translating 5 mm polyamide particles from a medium spiked
with Evans blue to a clear medium. About 95% of the
contaminant was removed (flow rate: 0.1 ml min21 through
side inlets and centre outlet and 0.17 ml min21 through centre
inlet and side outlets, actuation frequency: y2 MHz, actuation
voltage: 10 Vpp, particle concentration: 1.5% by volume,
contaminant concentration: 360 mg ml21).54 Similar medium
exchange efficiencies were obtained when erythrocytes were
translated from whole blood, spiked with Evans blue, to clean
blood plasma. The balanced outlet flow eliminated diffusional
cross-contamination and was an underlying reason to the high
wash efficiency. It should, however, be noted that the medium
exchange efficiency was found to decrease with increasing
particle concentration. The sources of this contamination are
assumed to be the hydrodynamic drag from each particle
transiting the media boundaries and contaminants weakly
adsorbed on the particle surfaces.
The described medium exchange method can be used to
extend the applicability of the above described blood wash
method to include post surgery blood recycling, i.e. when the
patient is still bleeding in the post surgery intensive care
and the shed blood is collected via a drain tube in the
chest cavity. In this case the blood plasma can be heavily
contaminated by drugs, immunologically active substances
and coagulation factors that should not be returned to the
patient. To avoid this, the erythrocytes can be moved from the
contaminated plasma to clean plasma or saline solution for
safe re-infusion.
Binary acoustic particle valving
The combination of the axial PRF and laminar flow micro-
channels can also be employed to realize valve-less particle
switches for controlled distribution of particles in microfluidic
networks. Today, this is most commonly done through
dielectrophoretic methods.57 However, it is possible to apply
the already described particle wash chips in binary switching
networks. Unfortunately, that design does not allow this to be
done in-plane with the microchip since the centre outlet must
be connected to one of the succeeding inlets via an out-of-plane
U-link. The design can, however, easily be modified to allow
in-plane switching networks.58 This is done by using only two
inlets and two outlet channels (Fig. 25). Several of these
switches can be interconnected in order to solve different
particle distribution tasks. A four-outlet particle distribution
chip design is described in Fig. 26 and the four binary settings
of the chip in operation are shown. In this case transducer C1
was operated at y1.9 MHz (y380 mm wide channel) and
transducer C2 at y1.6 MHz (y420 mm wide channel). The
two operating frequencies were selected to avoid acoustic
cross-talk between the two resonators. More complex
particle handling tasks can be managed by integrating other
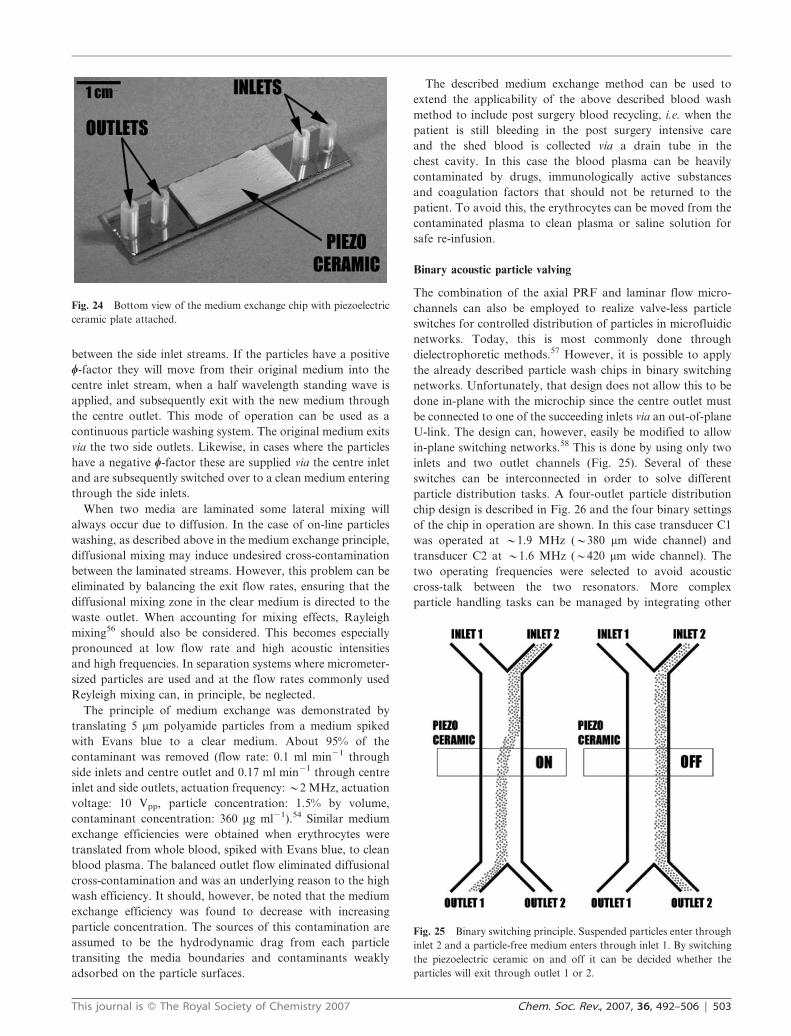
Fig. 24 Bottom view of the medium exchange chip with piezoelectric
ceramic plate attached.
Fig. 25 Binary switching principle. Suspended particles enter through
inlet 2 and a particle-free medium enters through inlet 1. By switching
the piezoelectric ceramic on and off it can be decided whether the
particles will exit through outlet 1 or 2.
This journal is � The Royal Society of Chemistry 2007 Chem. Soc. Rev., 2007, 36, 492–506 | 503

components and procedures into the tree structure, e.g.
acoustic particle traps41 and medium exchange channels.54
For particle binary switching trees to reach their full
potential some aspects must be accounted for. First of all, it
is desirable to be able to operate the switches independently of
the others. This can be done, as realised above, by operating
the piezoelectric ceramic actuators at non interfering
frequencies or by isolating them acoustically from each other.
The latter can be done either by mounting several switching
chips in a rig with interconnecting tubing or by attenuating the
acoustic coupling between the actuators in the switching
network. Secondly, the parabolic flow profile can cause
problems when samples are transported through switching
trees since particles travelling close to the top and bottom of
the channel will travel slower than the ones in the centre. This
can be addressed by applying a standing wave between the
top and bottom of the channel, as well as between the channel
side-walls, in order to keep the particles close together in
the channel centre, thus reducing the particle velocity
distributions. However, lagging particles will not be a problem
if the sample volumes injected are small compared to the
total volumetric flow rate and the number of consecutive
switches is low.
The acoustic valving/binary switching concept inherently
opens up an attractive area of automated on-chip particle
sorting. The microfluidic system can be continuously inspected
optically and thus a chip integrated rare event sorting/selection
system can be realised. By defining an optical inspection point
single particles with a characteristic optical property, e.g. a
fluorescent label, can be selected from a dilute stream of
particles by activating the channel acoustically as the
fluorescent particle passes. This mode of operation has clear
implications in cell sorting applications. When tailoring the
acoustic valving concept to the selection and counting of cells,
identified by fluorescently labelled cell-specific antibodies, an
on-chip fluorescent activated cell sorting (FACS) system can
be realised. In contrast to conventional FACS instrumentation
cell/particle differentiation can in this case be implemented not
only based on fluorescently labelled entities but also with
respect to the acousto-physical properties of the cells/particles.
This may possibly hold promise of developing multiplex
FACS-systems on chip that provide higher degrees of
differentiation than current FACS-systems. Fig. 27 shows the
principal operation of an optically triggered particle selection
based on the acoustic valving principle. Fig. 28 indicates the
power of the chip integrated format in the sense that high
levels of multiplex particle/cell differentiation can be realised.
A frequent argument with respect to chip based microfluidic
FACS-systems is that the throughput is commonly orders of
magnitude lower than which can be accomplished with con-
ventional FACS-instrumentation. The acoustic valving appro-
ach, however, both displays a quite rapid acoustic switching of
particles, typical transit time to the centre of a channel is in the
order of 10–100 ms, and the fact that the concept is prone to
massive parallelisation opens up the possibility to increase
throughput by at least an order of magnitude.
Acoustic particle separation through frequency switching
By alternating between different channel resonance frequen-
cies, matching the n*l/2 criteria, particles can be separated
from each other.59 This is made possible by the fact that the
magnitude of the axial PRF differs between dissimilar particle
types and spatial position in the standing-wave field. In the
simplest case large and dense particles (positive w-factor) are
mixed with small and light (positive w-factor) and enter the
separation chip in Fig. 23 through the side inlets while a
particle-free medium enters through the centre inlet. At time
T1 (Fig. 29) a single wavelength standing wave (second
harmonic, y4 MHz) is applied, thus the particles are gathered
Fig. 26 Left: One possible design of a four-outlet binary switching
tree. Suspended particles enter through inlet 1 while a particle-free
medium enters through inlets 2, 3 and 4. By turning the piezo ceramics
C1 and C2 on and off, in a binary code sequence, the particles can be
directed to one of the four outlets A–D. Right: Microscope images of
5 mm polyamide particles exiting through one of the four outlet
channels A–D. The field of vision corresponds to the grey square in the
figure to the left.
Fig. 27 Principle scheme for rare event particle sorting based on
acoustic valving.
504 | Chem. Soc. Rev., 2007, 36, 492–506 This journal is � The Royal Society of Chemistry 2007

in the pressure nodal planes one quarter of the channel width
from each side wall. When switching over to the fundamental
resonance frequency (half wavelength, y2 MHz) the particles
will start to migrate towards the pressure nodal plane in the
centre of the channel (T2). The larger particles move faster
because they are affected by a stronger axial PRF. If the
frequency is switched back at the right moment the larger
particles will be located close to the centre of the channel,
where the axial PRF is at its minimum (T3). The smaller
particles, on the other hand, will have moved only a small
distance and, at time T3, start to move back to their position
seen at time T1. After switching again (T4) the larger particles
will be closer to the centre than at T2 while the smaller ones will be at approximately the same position as at T2. If the
switching continues the larger particles will end up in the
middle of the channel and the smaller ones one quarter of
the channel width from each side wall when they reach the
outlets (Fig. 30 and 31). Using this method, it was demon-
strated that at least 80% of the particles can be collected
in the intended outlets when separating 3 mm polystyrene
(1.05 g cm213) and 8 mm polymethylmethacrylate (1.22 g cm23)
particles. The fundamental resonance and the second
harmonic were typically active for 800 and 200 ms respectively
(total flow rate: 90 ml min21).
Conclusions and outlook
The possibility to spatially control the positioning of
particulate matter in continuously streaming microfluidic
networks utilizing acoustic standing-wave forces opens the
route to develop a whole set of new separation devices for
Fig. 29 Frequency switching separation principle. T0 is the situation
before the frequency switching starts. At T1 and T3 the frequency
corresponds to the first harmonic of the channel (two pressure nodes).
At T2 and T4 it corresponds to the fundamental resonance (one
pressure node). When exiting the system the particles will have reached
stable positions (Tlater).
Fig. 30 Microscope image of the situation when the ultrasound is
turned off. Both 3 mm and 8 mm particles exit through the side outlets.
Fig. 31 Microscope image of the situation when the ultrasound is
turned on. The 8 mm particles are focused in the fundamental
resonance pressure node and exit through the centre outlet while the
3 mm particles are gathered in the first harmonic pressure nodes and
exit through the side outlets.
Fig. 28 Schematic layout for a 3 level acoustic valving set-up for
multi-particle rare event sorting, having 8 outlet categories.
This journal is � The Royal Society of Chemistry 2007 Chem. Soc. Rev., 2007, 36, 492–506 | 505
bioanalytical applications. The current review outlines several
potential pathways for these developments, where e.g.
differentiation of bioparticles that exhibit large differences in
the acoustic contrast factor are easily separated as exemplified
in the lipid microemboli separation from erythrocytes. On-line
particle washing is also described as a possible way of
performing continuous blood washing in situations where the
blood plasma may be heavily contaminated by coagulation
factors or inflammatory components. More intricate modes of
operation are given in the acoustic binary valving concept for
on-chip particle addressing, which also comprises the possibi-
lity of developing an acoustically controlled multiplex FACS-
system. Furthermore, the new findings in acoustic frequency
switching offer an electronically controlled mode of particle
sizing which in a binary tree configuration could offer a system
for continuous 2n fraction particle size separation. Further
developments based on continuous flow acoustic standing
wave technology hold promise both of co-integration with
elaborate lab-on-a-chip functionalities and interfacing to batch
scale systems for analysis or meso scale preparative processing
of bioparticulate matter.
Acknowledgements
The Swedish Research Council, Crafoordstiftelsen, Carl
Trygger Foundation, Royal Physiographic Society in Lund,
and Knut & Alice Wallenberg Foundation are greatly
acknowledged for their financial support.
References
1 A. Kundt and O. Lehmann, Ann. Phys. Chem., 1874, 153, 1.2 A. Nilsson, F. Petersson, H. W. Persson, H. Jonsson and T. Laurell,
in Micro Total Analysis Systems 2002, Kluwer AcademicPublishers, Nara, Japan, 2002, p. 751.
3 L. V. King, Proc. R. Soc. London, Ser. A, 1934, A147, 212–240.4 K. Yosioka and Y. Kawasima, Acustica, 1955, 5, 167.5 L. P. Gorkov, Sov. Phys. Dokl. (Engl. Transl.), 1962, 6, 773.6 W. L. Nyborg, J. Acoust. Soc. Am., 1967, 42, 947.7 G. T. Haar and S. J. Wyard, Ultrasound Med. Biol., 1978, 4, 111.8 T. Masudo and T. Okada, Anal. Sci., 2001, 17, 1341.9 V. F. K. Bjerknes, in Die Kraftfelder, Braunschweig, Germany,
1909.10 M. A. H. Weiser, R. E. Apfel and E. A. Neppiras, Acustica, 1984,
56, 114.11 L. A. Crum, J. Acoust. Soc. Am., 1971, 50, 157.12 M. Groschl, Acustica, 1998, 84, 432.13 J. J. Hawkes, M. Groschl, E. Benes, H. Nowotny and
T. W. Coakley, Proc. Forum Acusticum 2002 Sevilla, Sevilla,Spain, September 16–20, 2002.
14 M. Hill, J. Acoust. Soc. Am., 2003, 114, 2654.15 M. Hill, Y. J. Shen and J. J. Hawkes, Ultrasonics, 2002, 40, 385.16 M. S. Limaye, J. J. Hawkes and W. T. Coakley, J. Microbiol.
Methods, 1996, 27, 211.17 C. M. Cousins, P. Holownia, J. J. Hawkes, M. S. Limaye,
C. P. Price, P. J. Keay and W. T. Coakley, Ultrasound Med. Biol.,2000, 26, 881.
18 S. Peterson, G. Perkins and C. Baker, IEEE/Eighth AnnualConference of the Engineering in Medicine and Biology Society,1986, p. 154.
19 J. J. Hawkes and W. T. Coakley, Enzyme Microb. Technol., 1996,19, 57.
20 M. Groschl, W. Burger, B. Handl, O. Doblhoff-Dier, T. Gaida andC. Schmatz, Acustica, 1998, 84, 815.
21 F. Trampler, S. A. Sonderhoff, P. W. S. Pui, D. G. Kilburn andJ. M. Piret, Bio-Technology, 1994, 12, 281.
22 P. W. S. Pui, F. Trampler, S. A. Sonderhoff, D. G. Kilburn andJ. M. Piret, Biotechnol. Prog., 1995, 11, 146.
23 E. Benes, M. Groschl, H. Nowotny, F. Trampler, T. Keijzer,H. Bohm, S. Radel, L. Gherardini, J. J. Hawkes, R. Konig andC. Delouvroy, Ultrasonics Symposium, 2001 IEEE, 2001, 1, 649.
24 H. Bohm, L. G. Briarty, K. C. Lowe, J. B. Power, E. Benes andM. R. Davey, Biotechnol. Bioeng., 2003, 82, 74.
25 S. Gupta and D. L. Feke, Ultrasonics, 1997, 35, 131.26 S. Gupta and D. L. Feke, AIChE J., 1998, 44, 1005.27 M. T. Grossner, A. E. Penrod, J. M. Belovich and D. L. Feke,
Ultrasonics, 2003, 41, 65.28 G. D. Pangu and D. L. Feke, Chem. Eng. Sci., 2004, 59, 3183.29 M. Groschl, Acustica, 1998, 84, 632.30 J. J. Hawkes and W. T. Coakley, Sens. Actuators, B, 2001, 75, 213.31 K. Yasuda, S. Umemura and K. Takeda, Jpn. J. Appl. Phys. Part 1,
1995, 34, 2715.32 D. A. Johnson and D. L. Feke, Sep. Technol., 1995, 5, 251.33 M. Kumar, D. L. Feke and J. M. Belovich, Biotechnol. Bioeng.,
2005, 89, 129.34 S. Kapishnikov, V. Kantsler and V. Steinberg, Journal of Statistical
Mechanics-Theory and Experiment, 2006.35 S. Gupta, D. L. Feke and I. Manas-Zloczower, Chem. Eng. Sci.,
1995, 50, 3275.36 Z. I. Mandralis and D. L. Feke, AIChE J., 1993, 39, 197.37 A. Nilsson, F. Petersson, H. Jonsson and T. Laurell, Lab Chip,
2004, 4, 131.38 N. Harris, M. Hill, Y. Shen, R. J. Townsend, S. Beeby and
N. White, Ultrasonics, 2004, 42, 139.39 N. R. Harris, M. Hill, S. Beeby, Y. Shen, N. M. White, J. J. Hawkes
and W. T. Coakley, Sens. Actuators, B, 2003, 95, 425.40 M. Hill, J. J. Hawkes, N. R. Harris and M. B. McDonnell, Proc.
IEEE Sens. 2004, IEEE Int. Conf. Sens., 2004, 794.41 T. Lilliehorn, U. Simu, M. Nilsson, M. Almqvist, T. Stepinski,
T. Laurell, J. Nilsson and S. Johansson, Ultrasonics, 2005, 43, 293.42 T. Lilliehorn, M. Nilsson, U. Simu, S. Johansson, M. Almqvist,
J. Nilsson and T. Laurell, Sens. Actuators, B, 2005, 106, 851.43 M. Wiklund, P. Spegel, S. Nilsson and H. M. Hertz, Ultrasonics,
2003, 41, 329.44 M. Wiklund, J. Toivonen, M. Tirri, P. Hanninen and H. M. Hertz,
J. Appl. Phys., 2004, 96, 1242.45 M. Elwenspoek and H. V. Jansen, Silicon Micromachining,
Cambridge University Press, Cambridge, UK, 1998.46 F. Petersson, A. Nilsson, C. Holm, H. Jonsson and T. Laurell,
Analyst, 2004, 129, 938.47 S. M. Woodside, B. D. Bowen and J. M. Piret, AIChE J., 1997, 43,
1727.48 H. Jonsson, C. Holm, A. Nilsson, F. Petersson, P. Johnsson and
T. Laurell, Ann. Thoracic Surgery, 2004, 78, 1572.49 F. Petersson, A. Nilsson, C. Holm, H. Jonsson and T. Laurell,
Lab Chip, 2005, 5, 20.50 D. M. Moody, W. R. Brown, V. R. Challa, D. A. Stump,
D. M. Reboussin and C. Legault, Ann. Thoracic Surgery, 1995, 59,1304.
51 E. P. Mahanna, J. A. Blumenthal, W. D. White, N. D. Croughwell,C. P. Clancy, R. Smith and M. F. Newman, Ann. Thoracic Surgery,1996, 61, 1342.
52 D. Bazou, L. A. Kuznetsova and W. T. Coakley, Ultrasound Med.Biol., 2005, 31, 423.
53 J. C. Giddings, Science, 1993, 260, 1456.54 F. Petersson, A. Nilsson, H. Jonsson and T. Laurell, Anal. Chem.,
2005, 77, 1216.55 J. J. Hawkes, R. W. Barber, D. R. Emerson and W. T. Coakley,
Lab Chip, 2004, 4, 446.56 M. Bengtsson and T. Laurell, Anal. Bioanal. Chem., 2004, 378,
1716.57 T. Muller, G. Gradl, S. Howitz, S. Shirley, T. Schnelle and G. Fuhr,
Biosens. Bioelectron., 1999, 14, 247.58 M. Sundin, A. Nilsson, F. Petersson and T. Laurell, in Micro Total
Analysis Systems 2004, Malmo, Sweden, Royal Society ofChemistry, Cambridge, UK, 2004, p. 662.
59 C. Siversson, F. Petersson, A. Nilsson and T. Laurell, in MicroTotal Analysis Systems 2004, Malmo, Sweden, Royal Society ofChemistry, Cambridge, UK, 2004, p. 330.
506 | Chem. Soc. Rev., 2007, 36, 492–506 This journal is � The Royal Society of Chemistry 2007


