Christina A. Roberto, Ph.D.Departments of Social & Behavioral Sciences
and Nutrition
Designing Nutrition Labels
Simple, Salient, Meaningful Nutrition Labels
–Restaurant menu labeling
–Front-of-package labeling
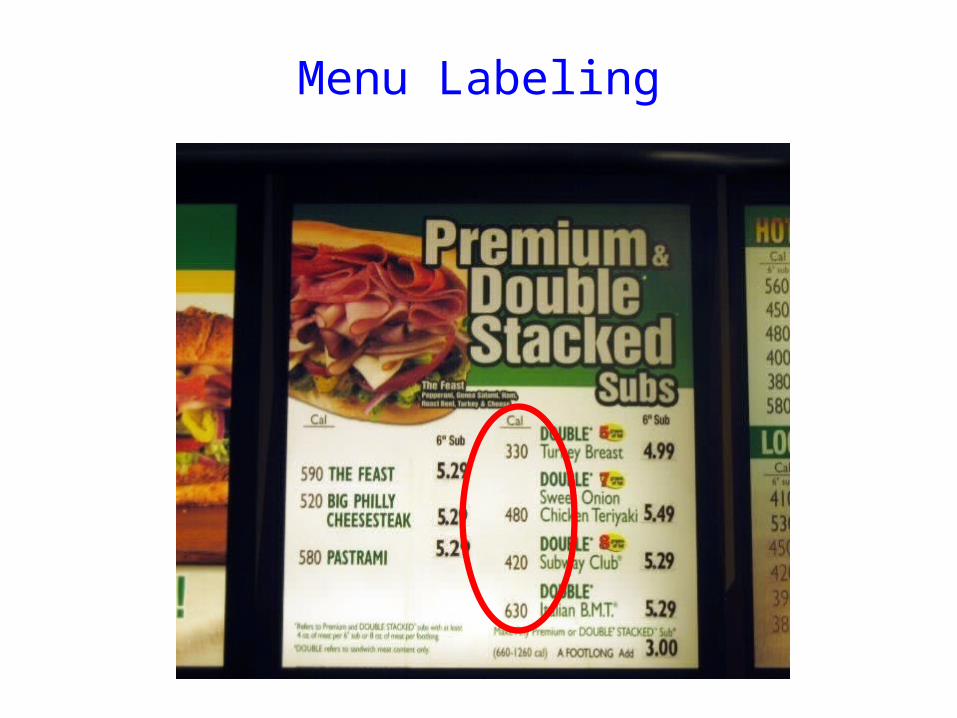
Menu Labeling
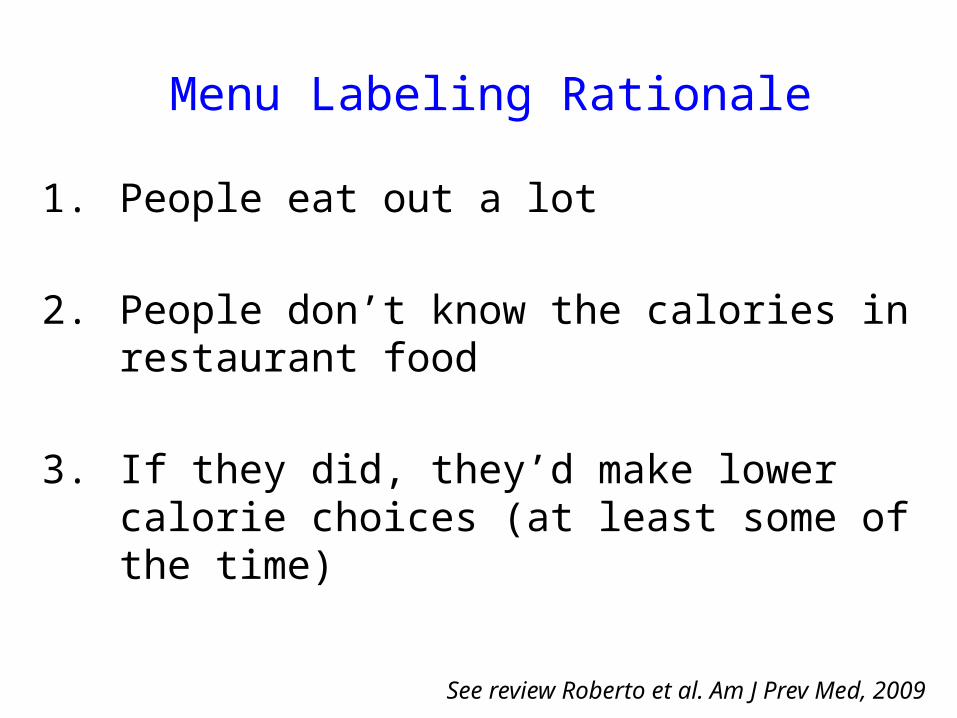
Menu Labeling Rationale
1. People eat out a lot
2. People don’t know the calories in restaurant food
3. If they did, they’d make lower calorie choices (at least some of the time)
See review Roberto et al. Am J Prev Med, 2009
But nutrition information is already available?
Research study - counted people at
Roberto et al. Am J Public Health, 2009
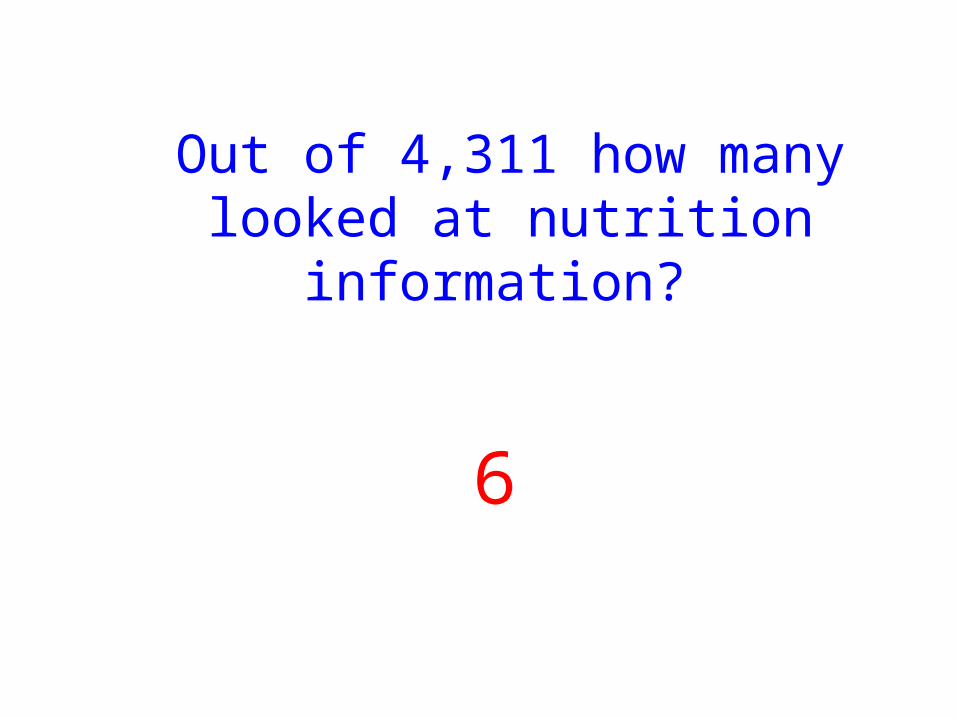
Out of 4,311 how many looked at nutrition
information?
6
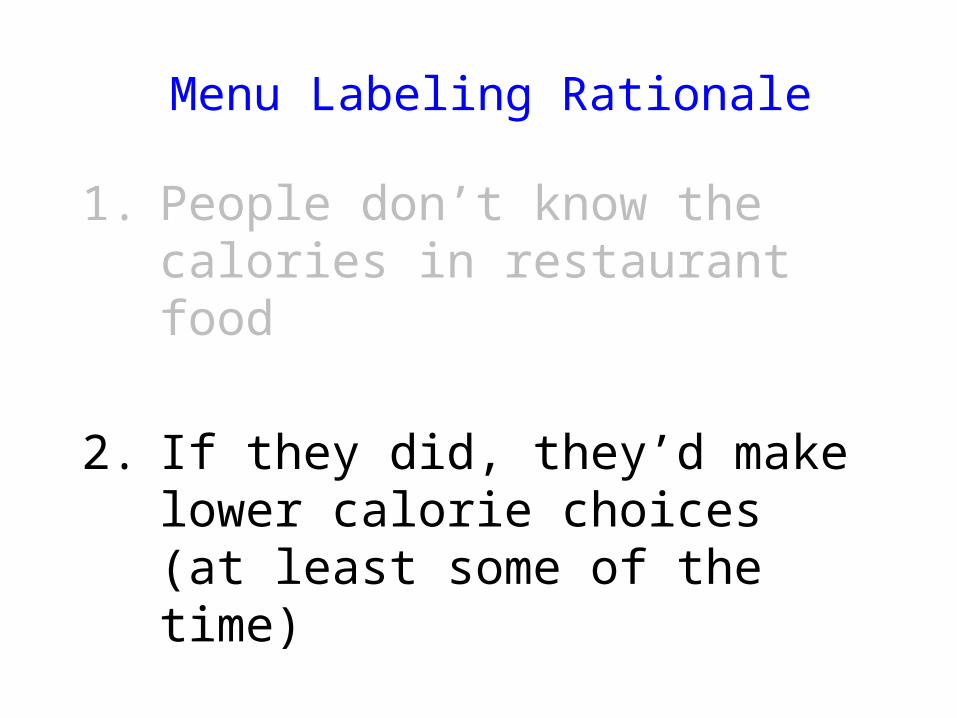
Menu Labeling Rationale
1. People don’t know the calories in restaurant food
2. If they did, they’d make lower calorie choices (at least some of the time)
Test Menu Labeling’s Impact on Behavior in the Lab
Roberto et al, Am J Public Health, 2010
Menu Labeling in a Restaurant Lab
303 adults for market research study
Randomized to 1 of 3 menus
Focus group, ordered & ate food, dietary recall
Roberto et al, Am J Public Health, 2010
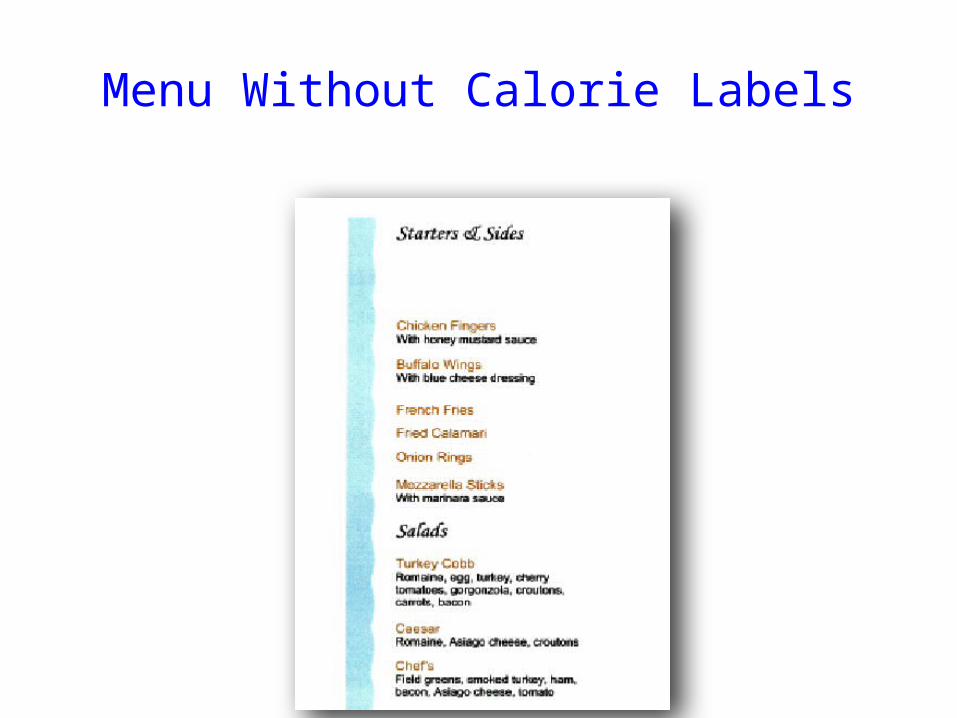
Menu Without Calorie Labels
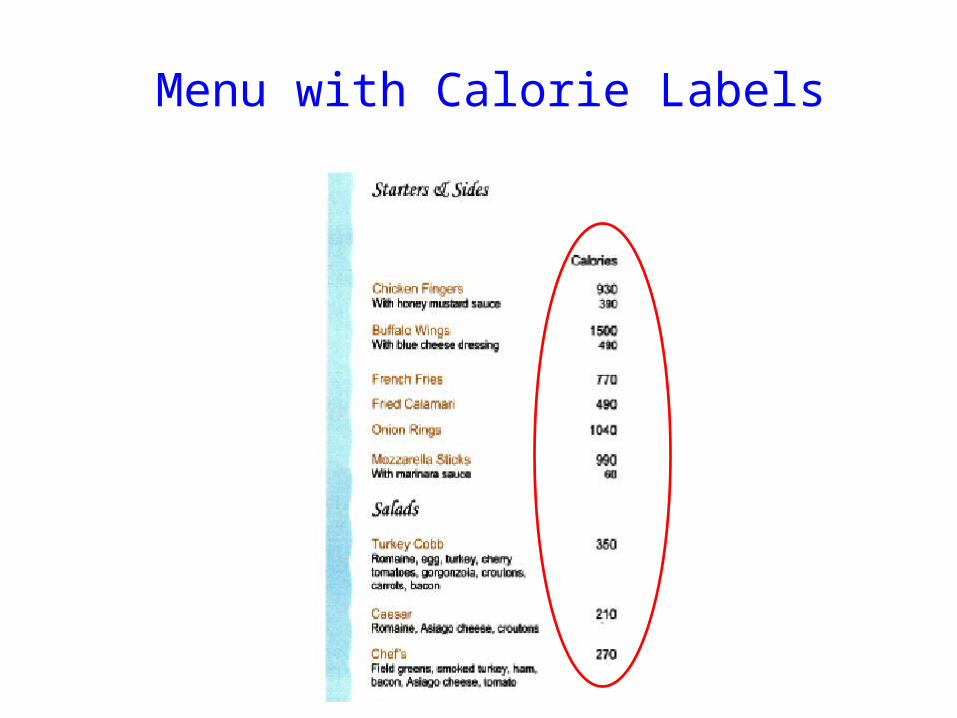
Menu with Calorie Labels
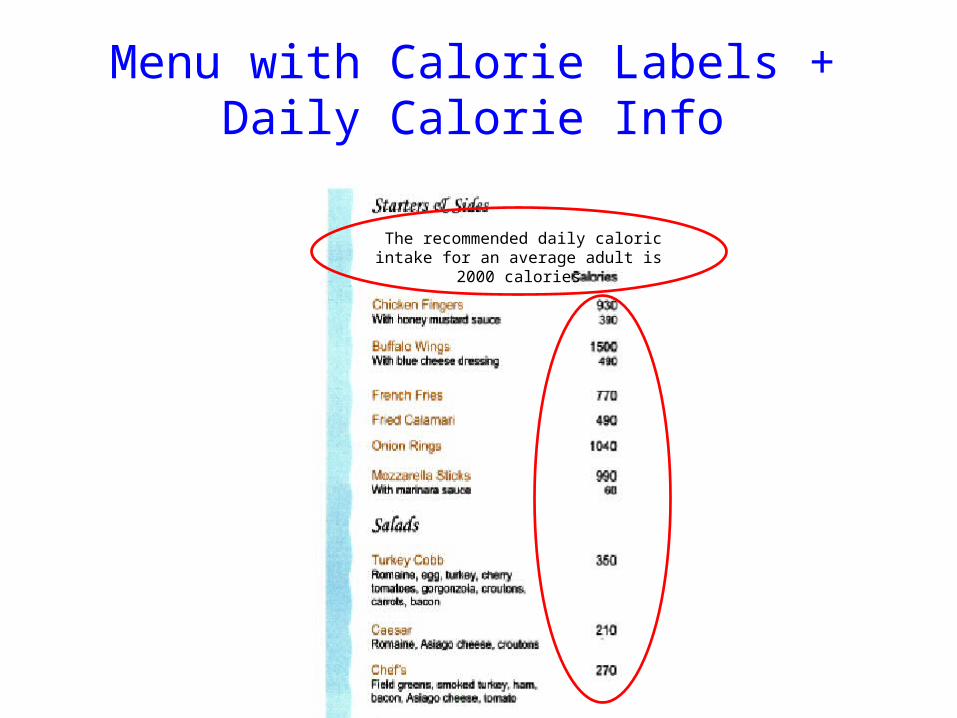
Menu with Calorie Labels + Daily Calorie Info
The recommended daily caloric intake for an average adult is 2000 calories
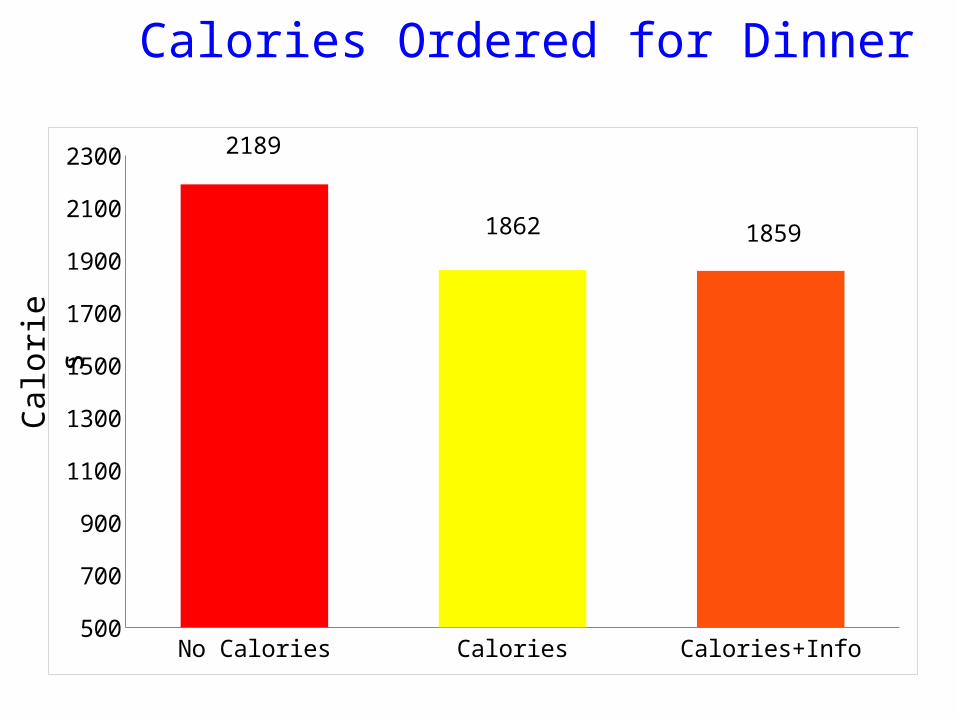
Calories Ordered for Dinner C
alor
ies
No Calories Calories Calories+Info500
700
900
1100
1300
1500
1700
1900
2100
2300 2189
1862 1859
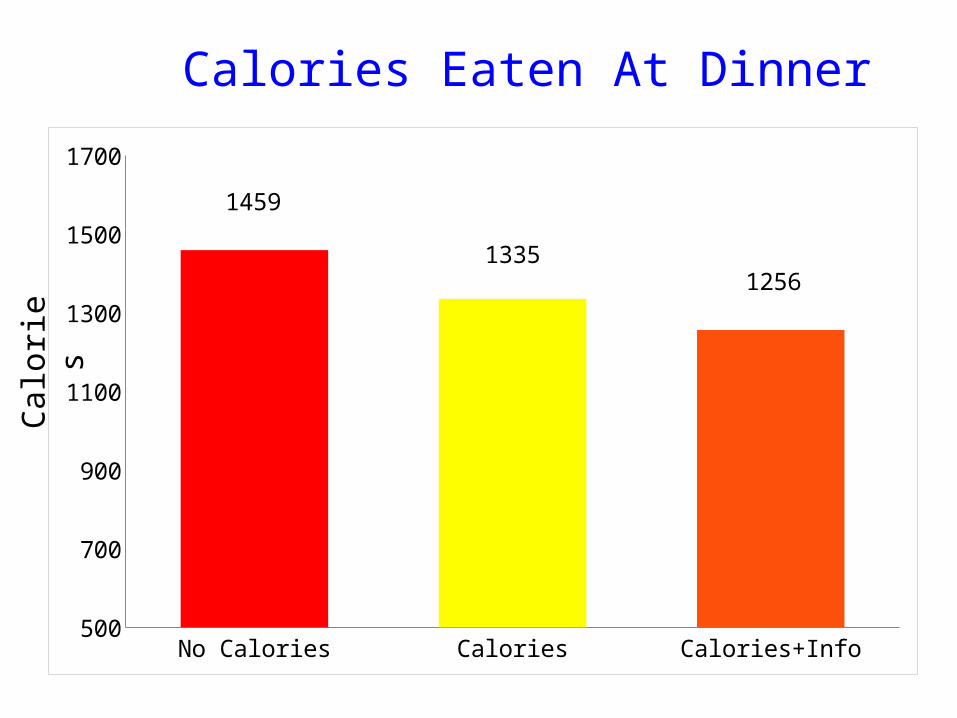
Calories Eaten At Dinner
No Calories Calories Calories+Info500
700
900
1100
1300
1500
1700
1459
13351256
Cal
orie
s
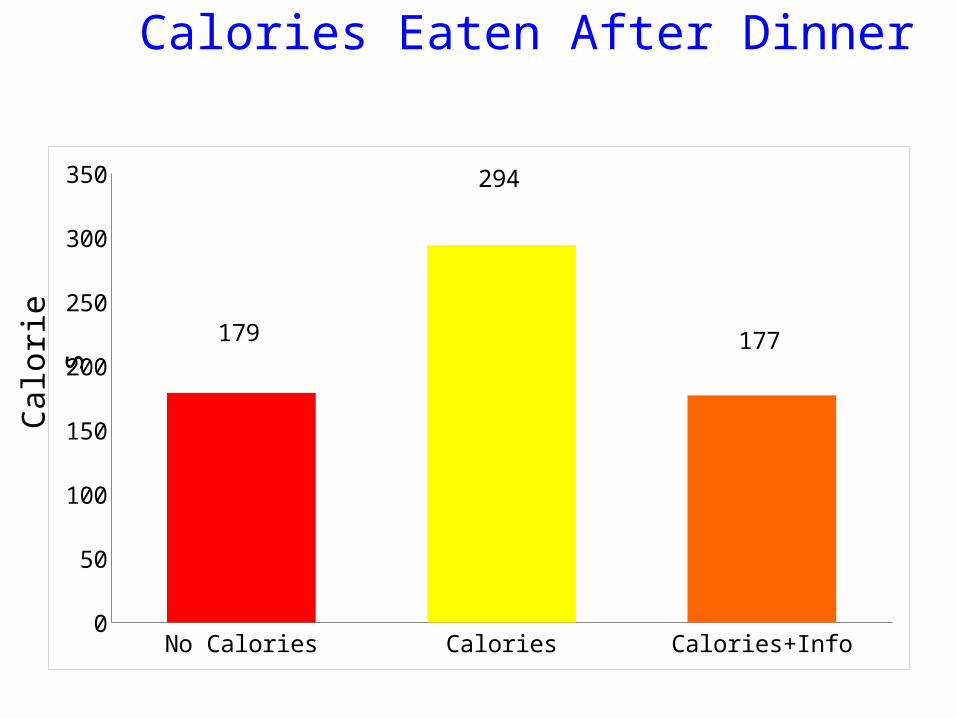
Calories Eaten After Dinner
No Calories Calories Calories+Info0
50
100
150
200
250
300
350
179
294
177
Cal
orie
s
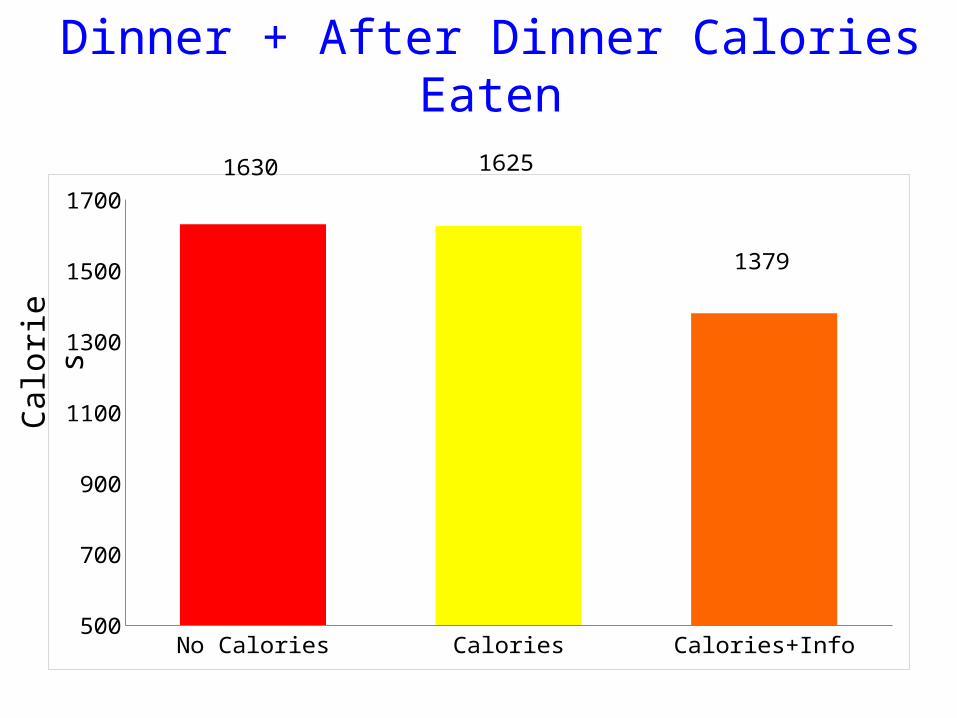
Dinner + After Dinner Calories Eaten
No Calories Calories Calories+Info500
700
900
1100
1300
1500
17001630 1625
1379
Cal
orie
s
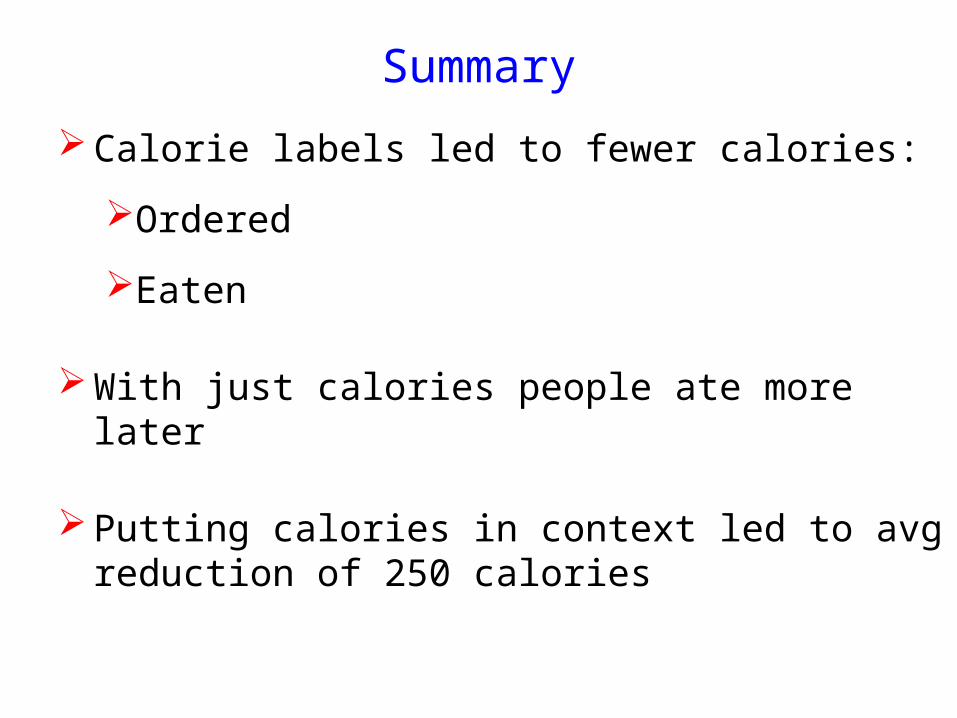
Summary
Calorie labels led to fewer calories:
Ordered
Eaten
With just calories people ate more later
Putting calories in context led to avg reduction of 250 calories
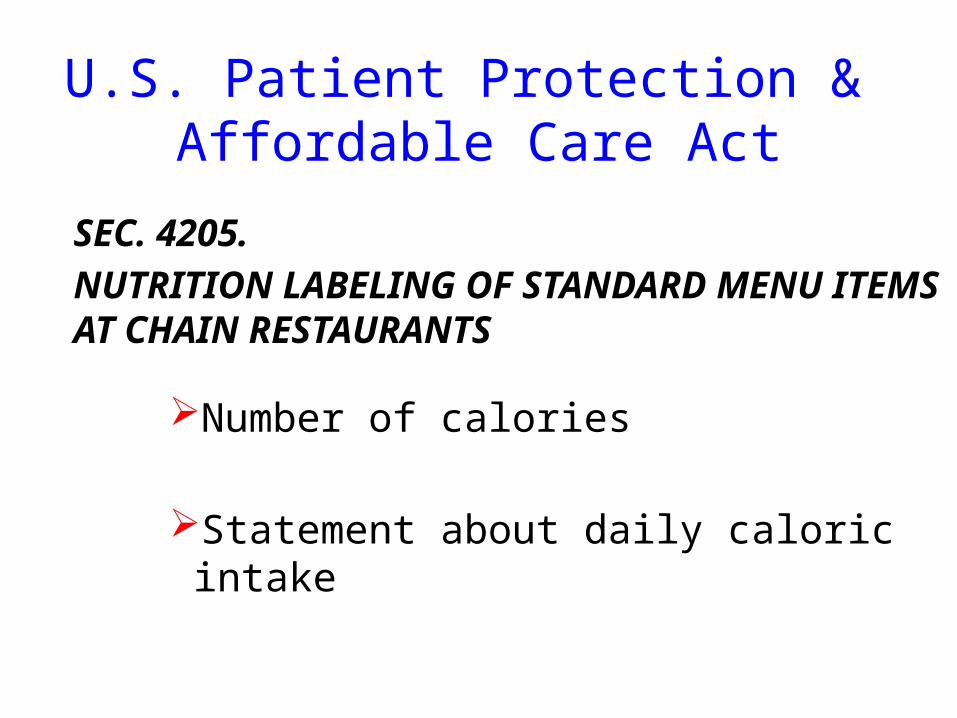
U.S. Patient Protection & Affordable Care Act
SEC. 4205. NUTRITION LABELING OF STANDARD MENU ITEMS AT CHAIN RESTAURANTS
Number of calories
Statement about daily caloric intake
Product Reformulation
Front-of-PackageNutrition Labeling
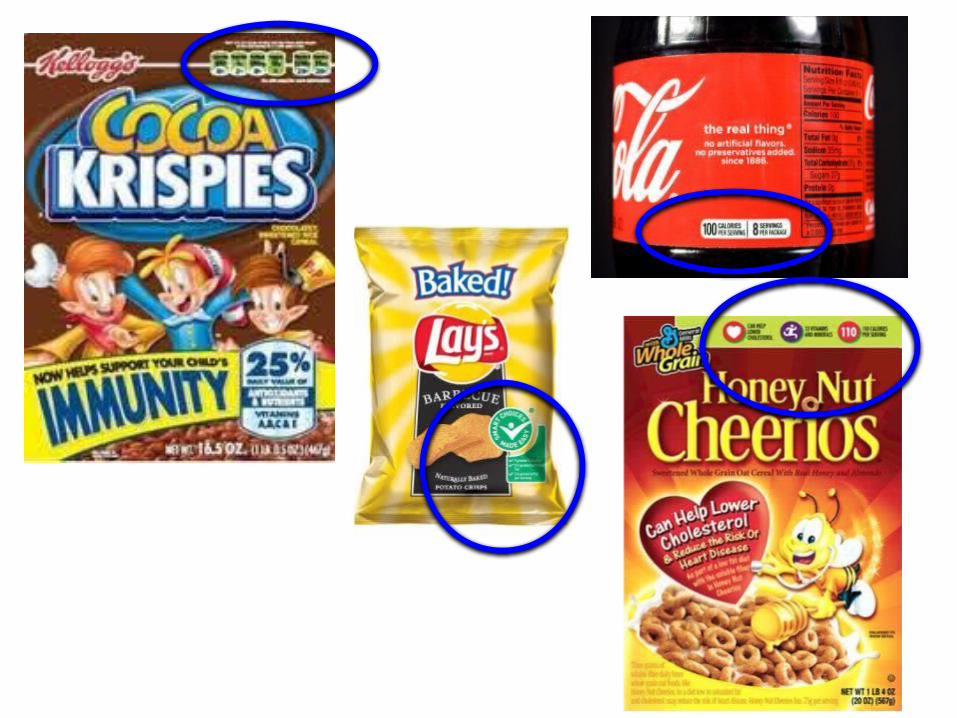
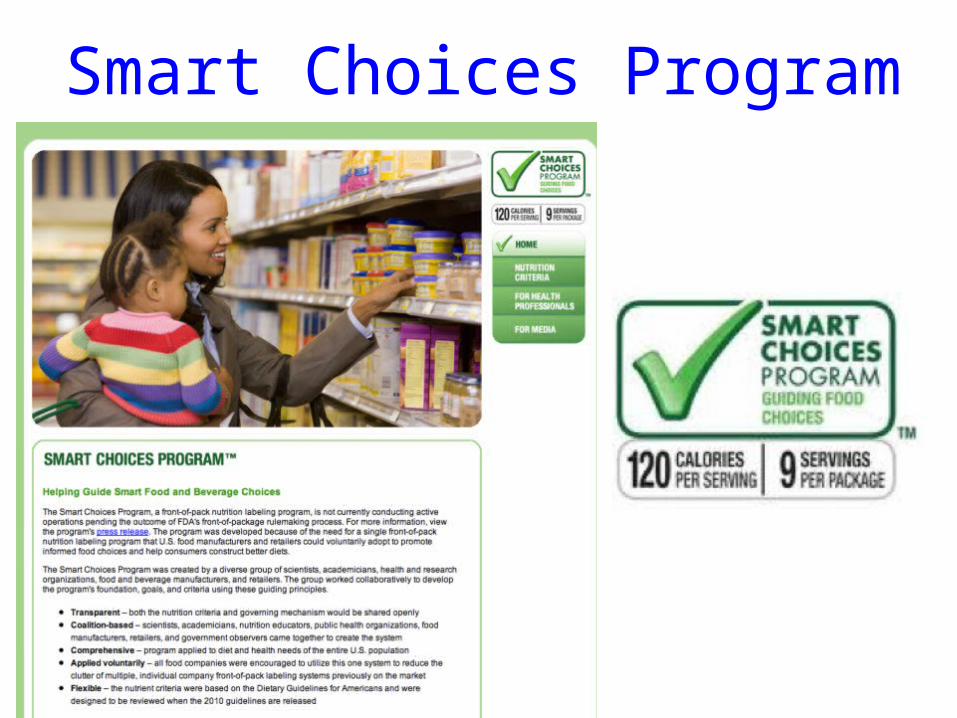
Smart Choices Program
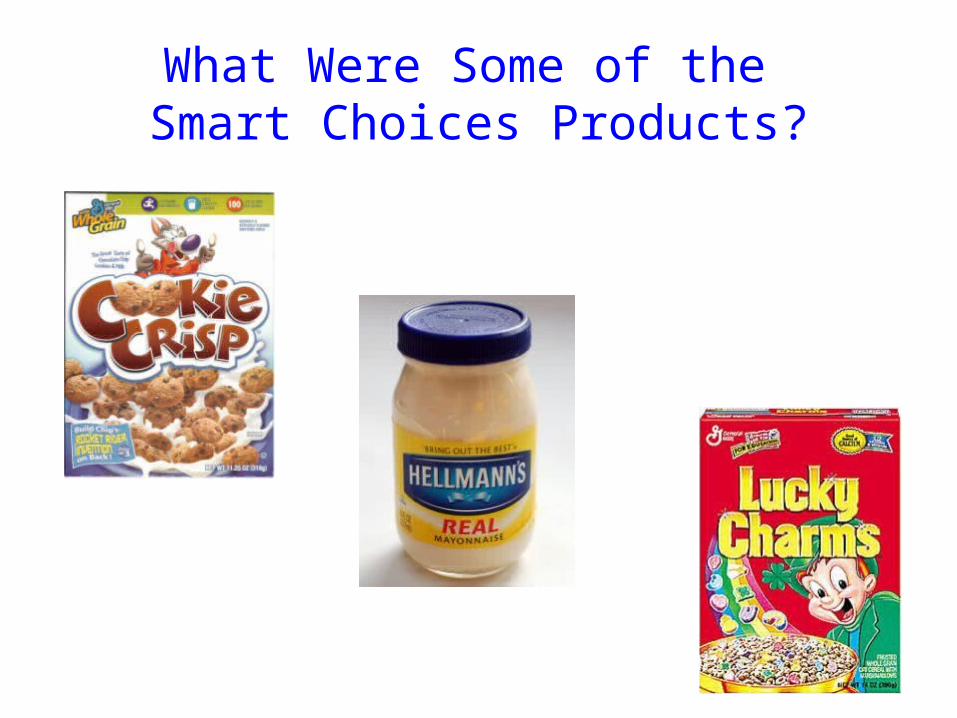
What Were Some of the Smart Choices Products?
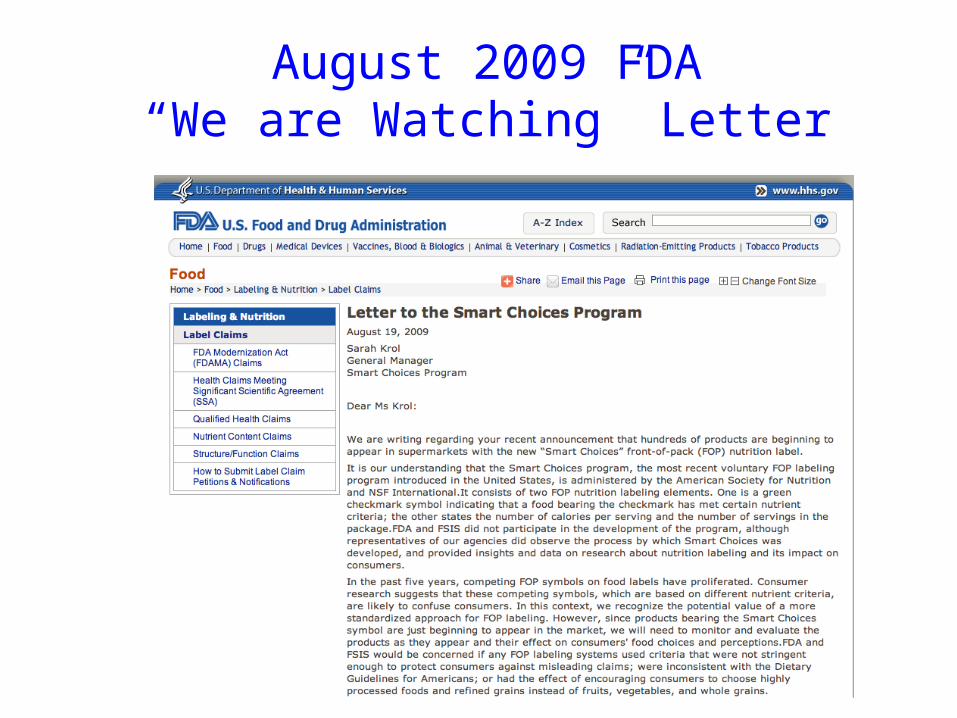
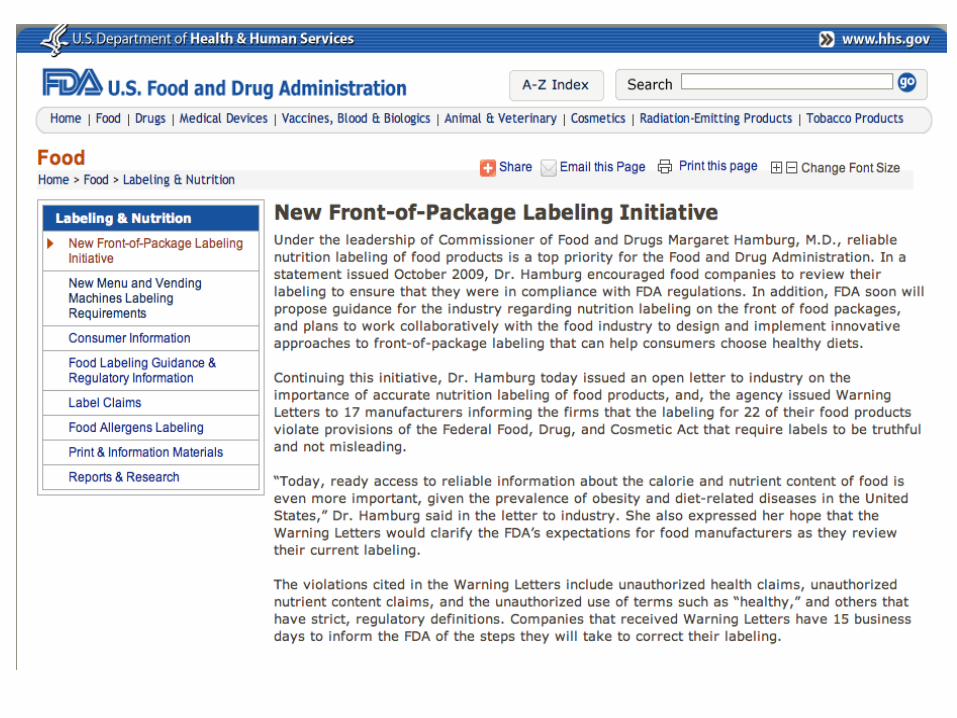
August 2009 FDA“We are Watching” Letter
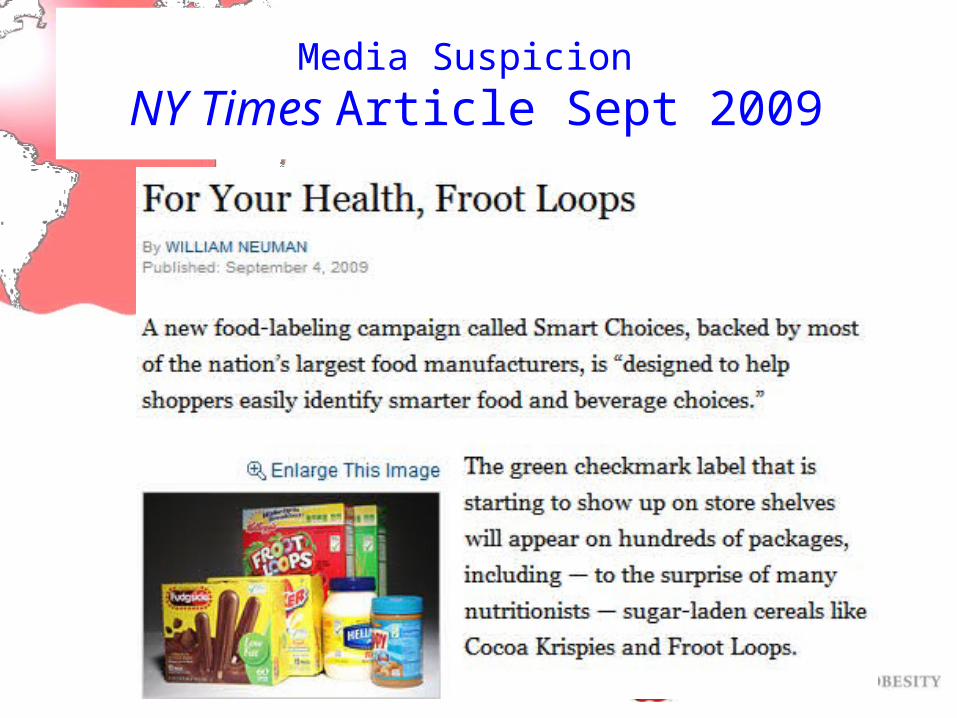
Media Suspicion
NY Times Article Sept 2009
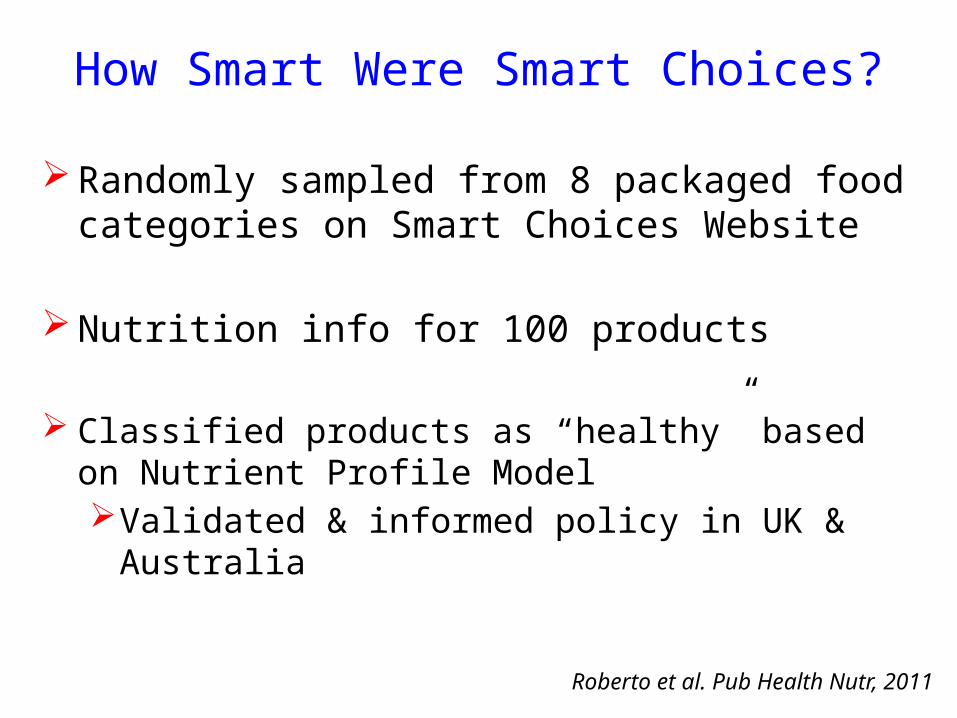
How Smart Were Smart Choices?
Randomly sampled from 8 packaged food categories on Smart Choices Website
Nutrition info for 100 products
Classified products as “healthy” based on Nutrient Profile Model Validated & informed policy in UK & Australia
Roberto et al. Pub Health Nutr, 2011
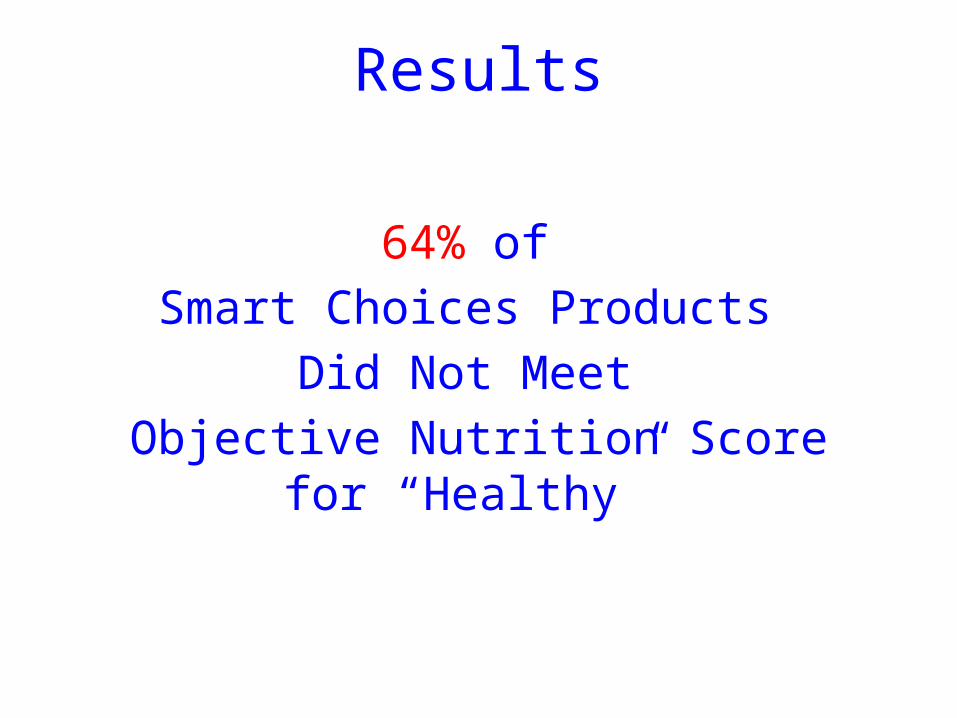
64% of Smart Choices Products
Did Not Meet Objective Nutrition Score for
“Healthy”
Results
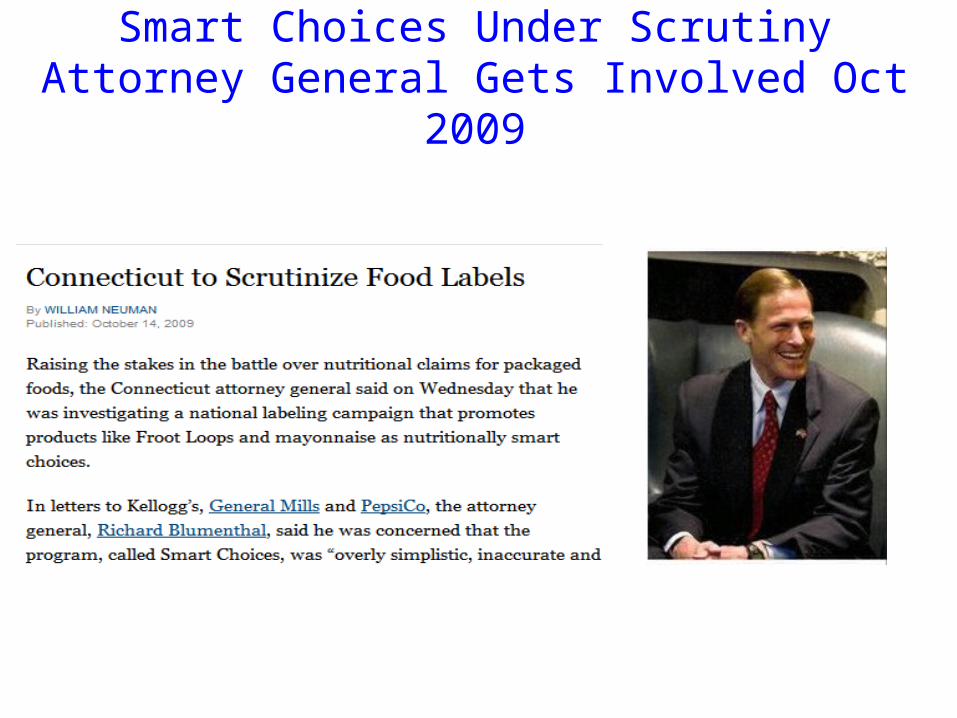
Smart Choices Under ScrutinyAttorney General Gets Involved Oct 2009
– Institute of Medicine Released First Report
–Working on Second Report
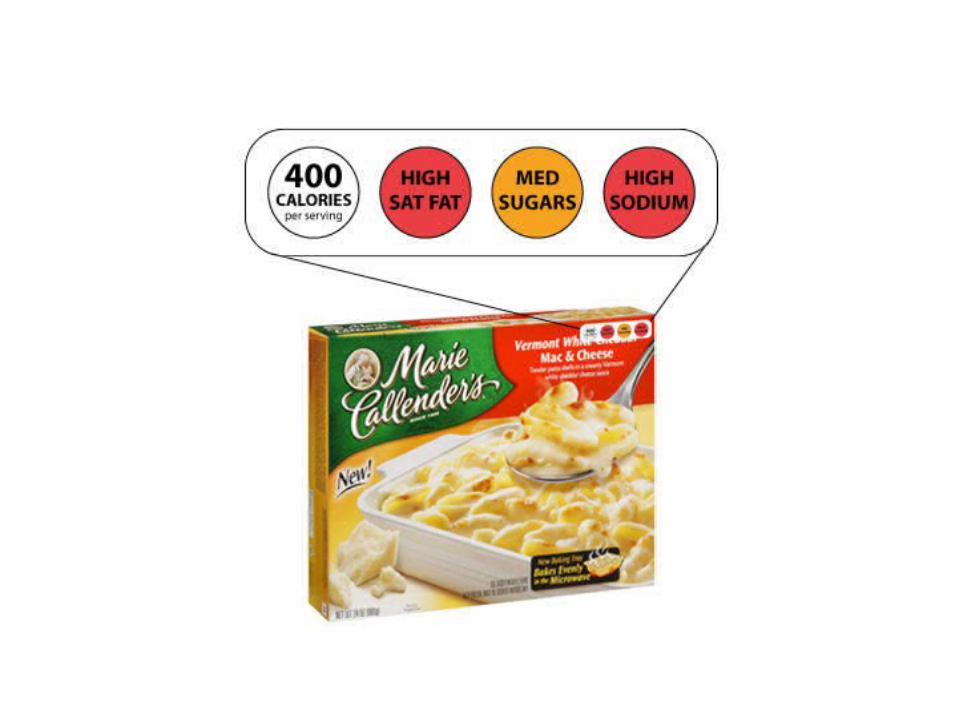
–Food industry releases Facts Up Front
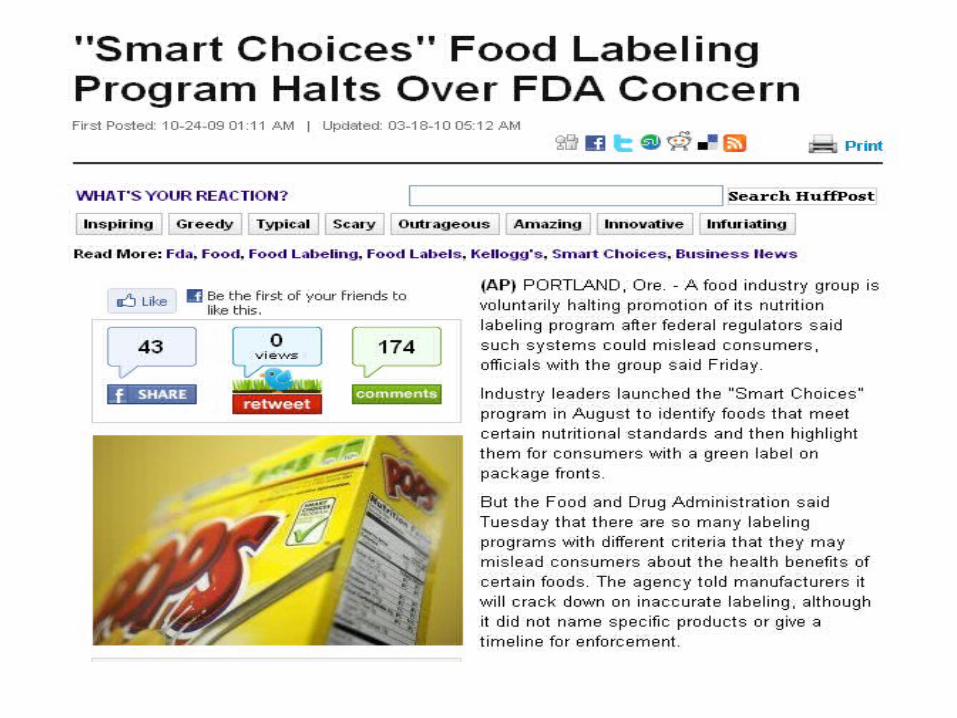
In the meantime…
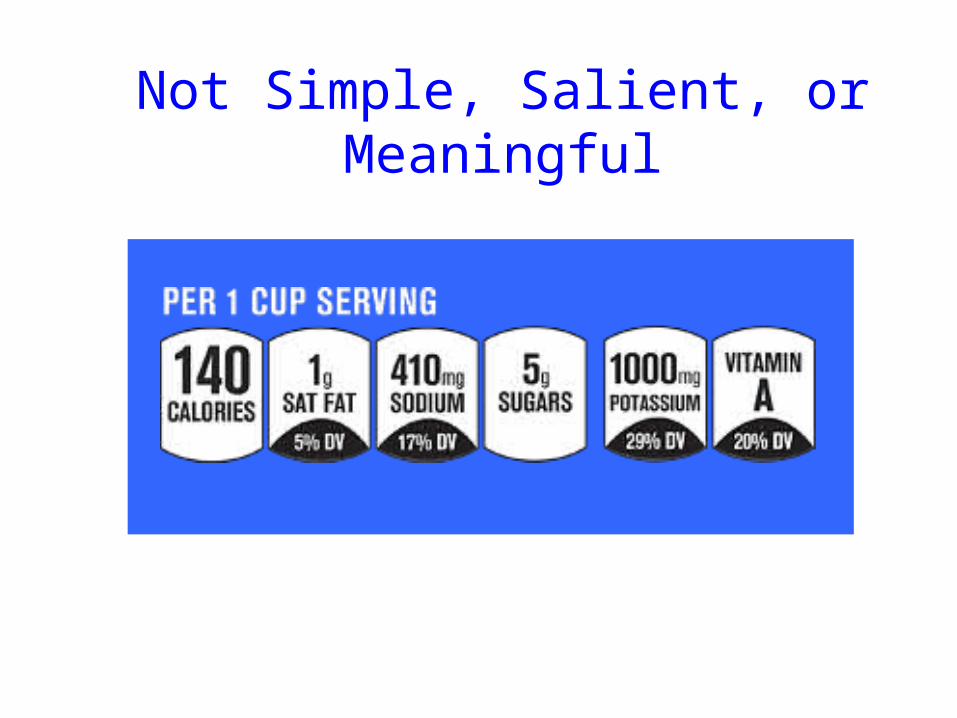
Not Simple, Salient, or Meaningful
Cautionary Tale of Industry Self-Regulation for
Front-of-Package Labeling
Greens Mean Go
Red Means Stop
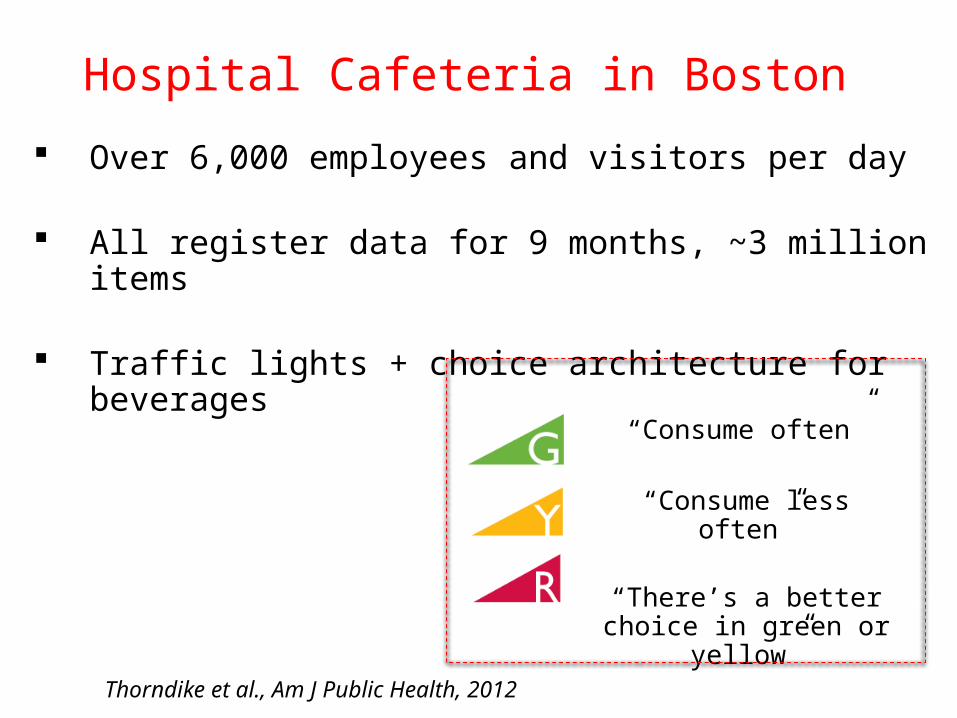
Hospital Cafeteria in Boston
Over 6,000 employees and visitors per day
All register data for 9 months, ~3 million items
Traffic lights + choice architecture for beverages
“Consume often”
“Consume less often”
“There’s a better choice in green or
yellow”
Thorndike et al., Am J Public Health, 2012
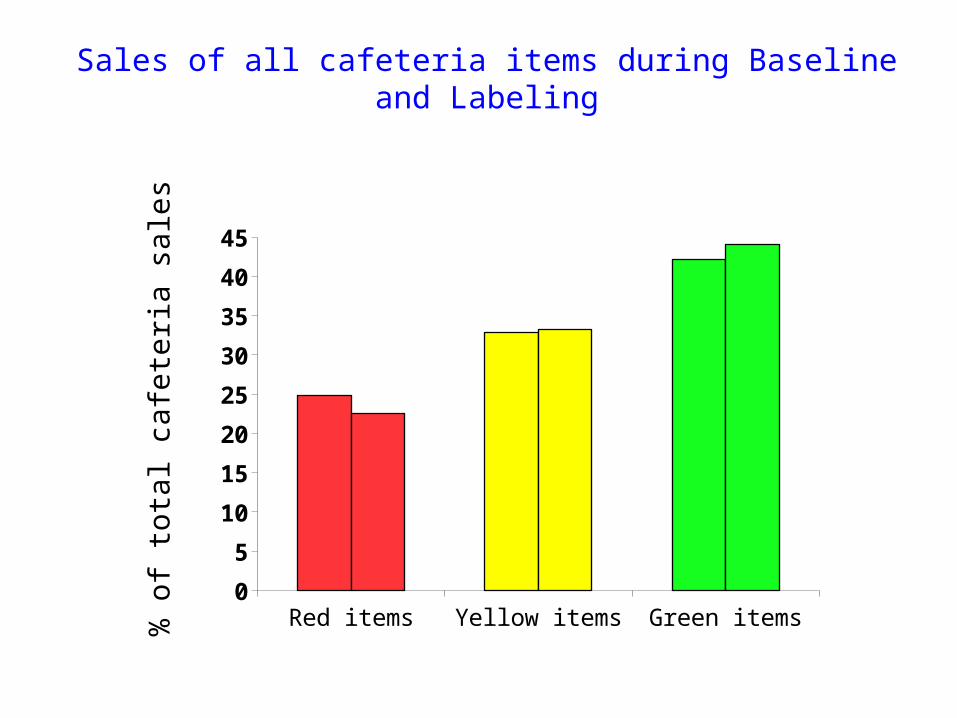
Sales of all cafeteria items during Baseline and Labeling
Red items Yellow items Green items0
5
10
15
20
25
30
35
40
45
% o
f to
tal ca
fete
ria s
ale
s
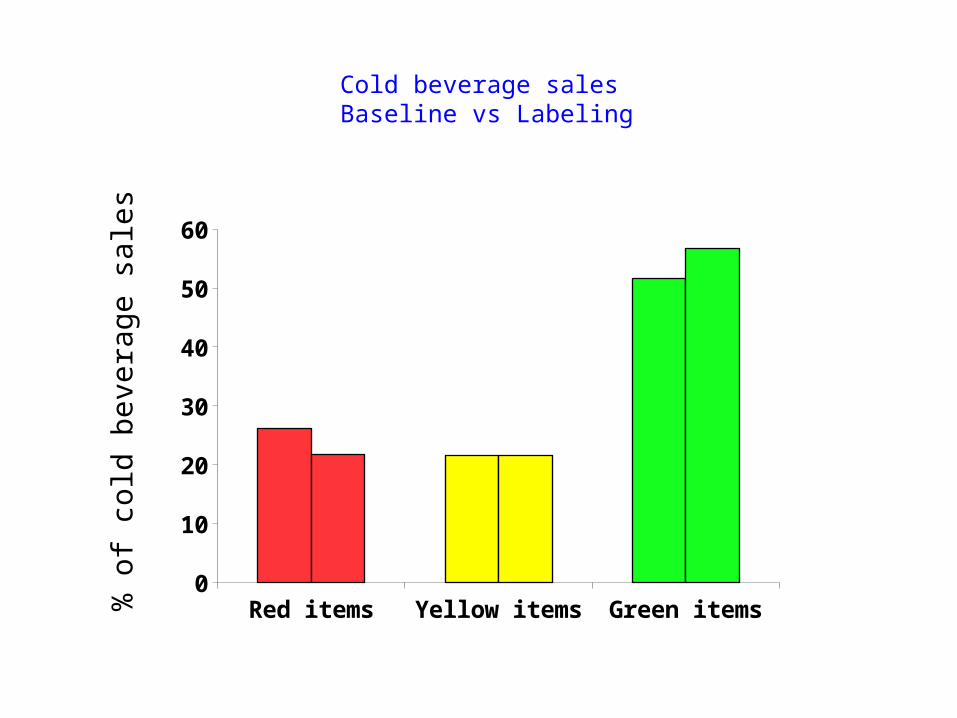
Cold beverage sales Baseline vs Labeling
Red items Yellow items Green items0
10
20
30
40
50
60
% o
f co
ld b
evera
ge s
ale
s
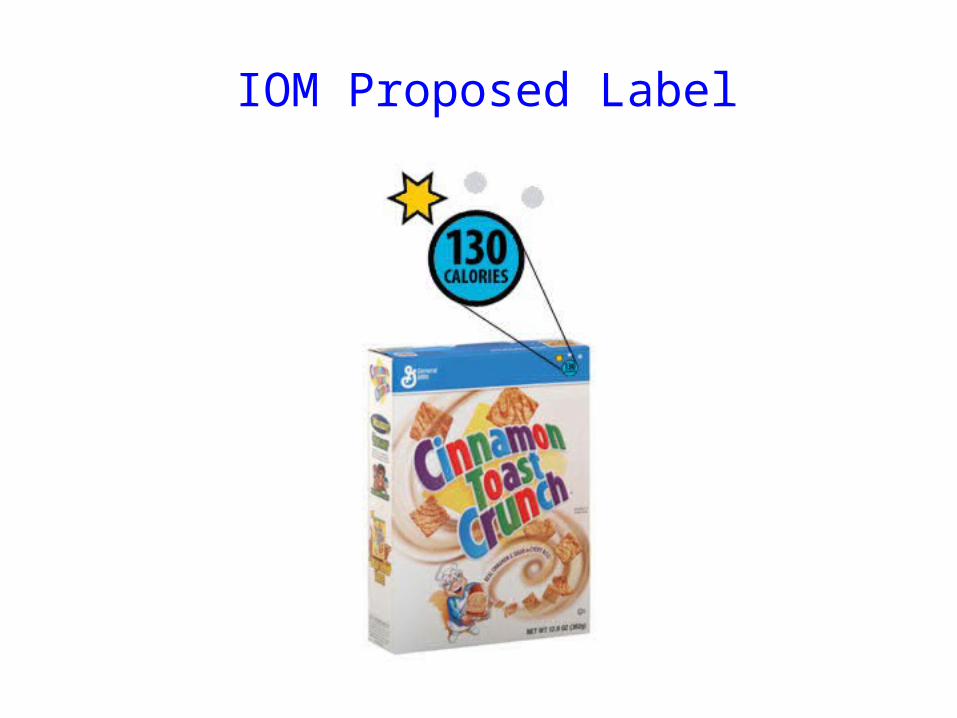
IOM Proposed Label
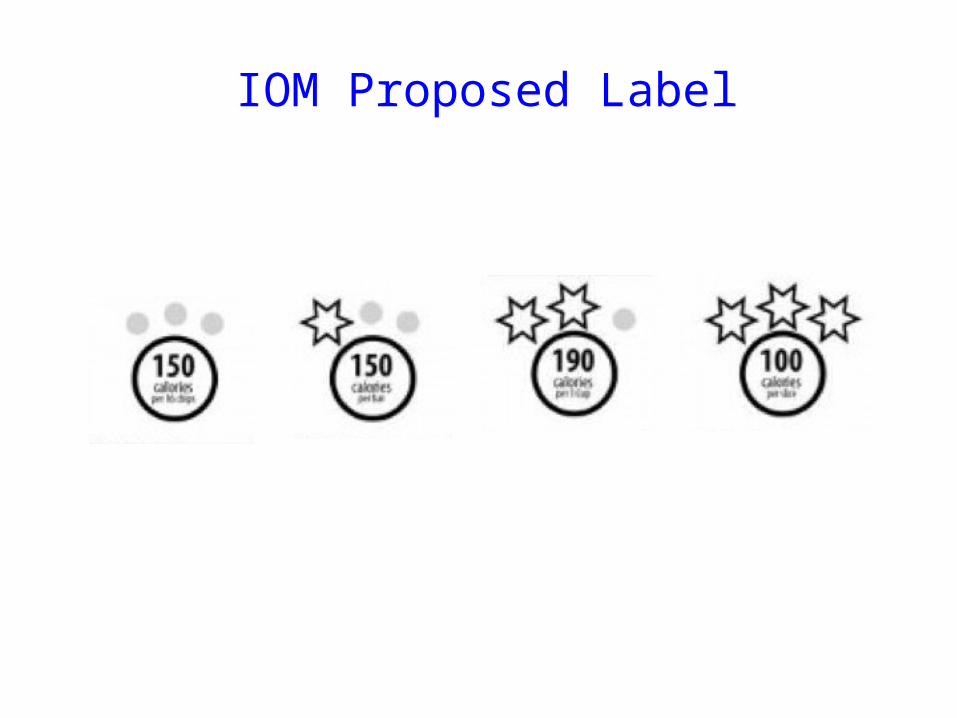
IOM Proposed Label
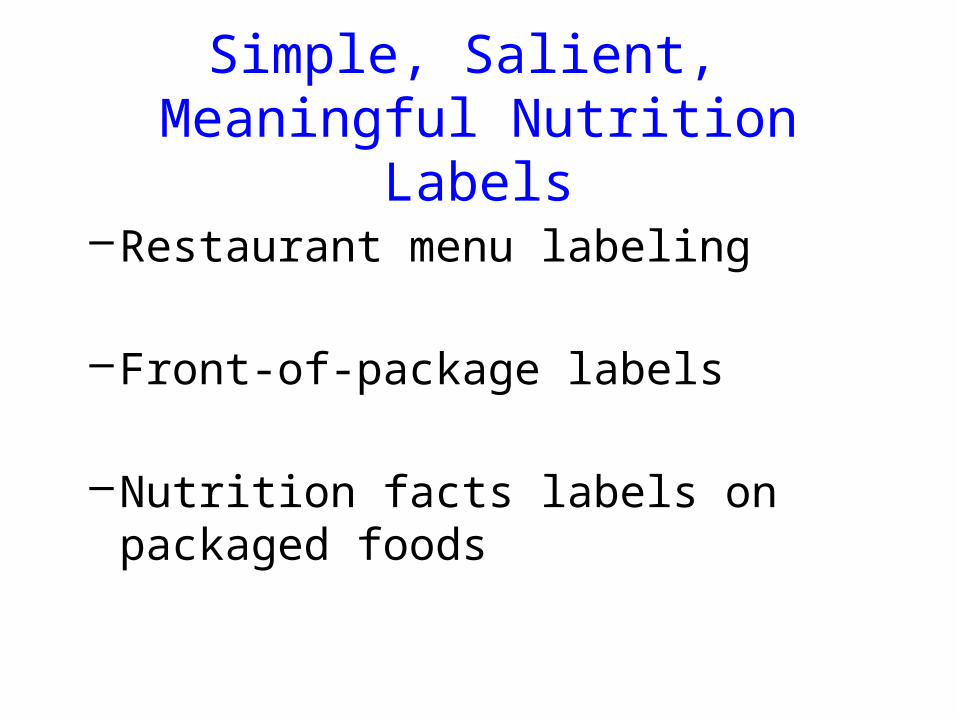
Simple, Salient, Meaningful Nutrition Labels
–Restaurant menu labeling
–Front-of-package labels
–Nutrition facts labels on packaged foods