
Church Street Socially Sustainable BehaviorTEAM 3 Prepared by:Aaron Regla BretonSteve GrootaertMiss Emily Lowery
ARCH 5550 LA 5405 Optimizing the Building/Landscape InterfaceENVISIONING THE SUSTAINABLE CAMPUS
Integrating carbon, energy, and water management strategies toward zero- and net-positive designInstructors: Loren Abraham & Barry Lehrman

The designs, plans, and building forms shown herein are the work of students enrolled in the School of Architecture at the University of Minnesota. None of these designs or plans shall be used by, or disclosed to any person, organization or company, for any purpose without the written express permission of the Col-lege of Design of the University of Min-nesota, Minneapolis, Minnesota.
© 2011 College of Design University of Minnesota 89 Church Street SE Minneapolis, Minnesota 55455
Table of Contents
performance metrics Simulation of Baseline ConditionsDesign & Performance ParametersBenefits & Limitations
design strategies
site inventory Site PlanContext Cultural EcologicalClimate Precipitation Wind SunInfrastructure Buildings Utilities CirculationVegetation Existing Greenspace
sources Bibliography Data sources
ManifestoMission Statement
case studies Ryneck Glowney - PolandPlaza Hidalgo - MexicoPlazza Navona - ItalyPlaza Santa Ana - SpainBryant Park - USA

site inventorySite Plan
Site concept plan of north Church street.
Begin one way vehicle traffic with the exception of parking ramp entrance. This area could mark the beginning of the pedestrian mall with changes in paving materials, curb separation, vegetation, signage and lighting.
Bike pasture: using under utilized space for public services such as bicycle parking and public gathering that also demonstrates site water management.
Off grid Street lighting for pedestrian and bicycle traffic increasing safety. Offer spaces for interactive learning of site strategies for utilizing solar energy and water. Begin to characterize this area as innovation boulevard countering the traditional aesthetic of the Northrop
Waste water biology pond treatment demonstration area with collected rainwater from proposed green roof.
N

site inventoryContext
Our scope of investigation focuses on the northern portion of Church St. serving as both a gateway and a transition zone between pedestrian mall and automotive right of way. Currently the landscape between buildings is unplanned and as a result many of the spaces are not meeting their potential as public space.
Bike racks east side of Church Street
Possible bike pasture zone Bike racks west side of Church Street
Where pedestrian zone meets vehicular zone
Material differentiation Example of driver confusion
Only sign differentiating vehicular and pedestiran zones
Church St. looking North Northrop Mall looking North
Seating area SW of Rapson Hall
Seating area on the crossing between Church St + Scholars Walk

site inventoryClimate
+ Sun, wind and precipitation
+ Amount of daylight per year
+ Shade studies and micro climate
+ Average yearly rainfall: 26” + Average yearly temperature: 45.4 ˚ F
Wind + Solar + Rainfall Studies
Bioclimatic Conditions
Average temp range: 68ºF - 73ºFSummer
Average temp range: 40ºF - 59ºFSpring
FallAverage temp range: 32ºF - 61ºF
WinterAverage temp range: 13ºF - 20ºF

site inventoryInfrastructure
+ Current lighting locations.
+ The circulation of traffic.
+ Capacities and boundaries.
+ System descriptions.
+ Utilities on the site and buildings
Water Manhole
Water Manhole
Electric Manhole
Fiber Optics Manhole
Fire Hydrant
Fire Lane
Small Light
“City Beautiful” Street Light
Street Light
Small Tree
Mature Tree

site inventoryExisting greenspace

case studiesRynek Glowney – Main Square, Krakow, Poland
Uses + Activities: •Diversity of social groups •Shopping facilities •Cafés and restaurants •Within walking distance of museums, university facilities, churches, etc.
Access + Linkages: •Located in the middle of the city •Accessible from 11 different streets •Main tourist attraction •Accessible by foot
Comfort + Image: •Benches to sit in throughout •Patios outside of cafés (located on the perimeter of the square) •Regular policing •Regular Maintenance •No access to vehicles
Sociability: •Meeting point for diverse social groups •Multiplicity of activity
Images source: http://www.pps.org/great_public_spaces//one?public_place_id=730

case studiesPlaza Hidalgo, Coyoacan, Mexico City, Mexico
Uses + Activities: •Market on the weekends •Street vendors throughout •Diversity of social groups.
Access + Linkages: •Center of Plaza is only accessible by foot •Streets lead to it but divert cars •Sidewalks lead directly to it
Comfort + Image: •People presence makes it feel safe •Maintained
Sociability: •Propensity of chance encounters •Comfortable interaction •Strong sense of local pride •Attachment to the community
Images source: http://www.pps.org/great_public_spaces//one?public_place_id=756

case studiesPiazza Navona, Rome, Italy
Uses + Activities: •Bernini’s Fountain •Markets •Cafés •Street performers.
Access + Linkages: • Accessible by foot •Streets lead to it but divert cars
Comfort + Image: •Seating available throughout •Well maintained •Policing •No vehicular traffic
Sociability: •Comfortable interaction •Diversity of social groups
Top Image source: http://prounione.files.wordpress.com/2009/11/2005_01_08_day232-navona.jpg
Bottom Image source: http://www.pps.org/great_public_spaces//one?public_place_id=911#

case studiesPlaza Santa Ana, Madrid, Spain
Uses + Activities: •Copious amenities •Restaurants •Playgrounds
Access + Linkages: •Near center of the city •Narrow channels of traffic •Accessible by foot
Comfort + Image: •Calmed streets (vehicular traffic) •Oasis in the city •Tree lined promenade
Sociability: •Comfortable interaction •Diversity of social groups from old to young
Images source: http://www.pps.org/great_public_spaces//one?public_place_id=905

+ City park that supports individual and group activities with movable furniture and variety of seating areas.
+ People go to people watch, play bocce ball or ping pong and find respite from street noise.
+ Simple movable furniture, accommodates individuals and groups.
+ Surrounding vegetation and raised elevation of park allow for noise buffering.
+ Once an unsafe park, it was transformed into a cultural icon and beloved city park.
case studies Bryant Park, NYC. Olin Studio.

design strategies Manifesto
Planet Earth is comprised of people, wildlife and natural resources

Industry is supported by people and natural resources
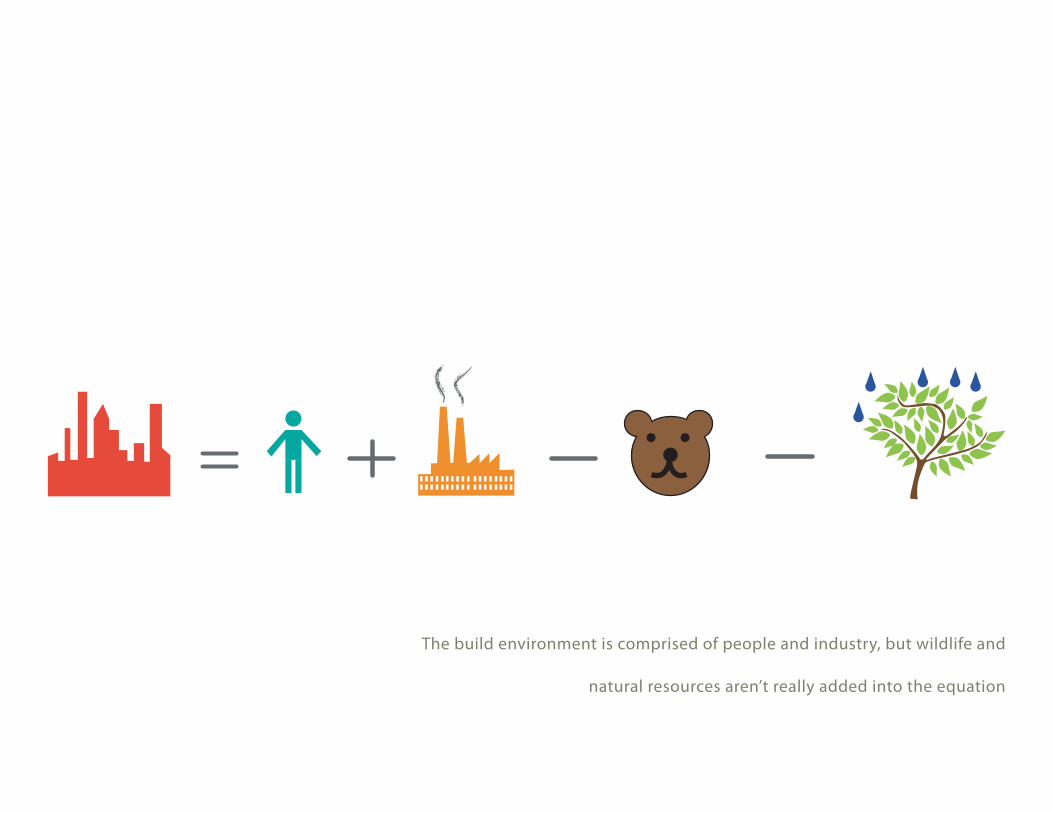
The build environment is comprised of people and industry, but wildlife and
natural resources aren’t really added into the equation

$Profit is made by people, industry and natural resources
$ $$$
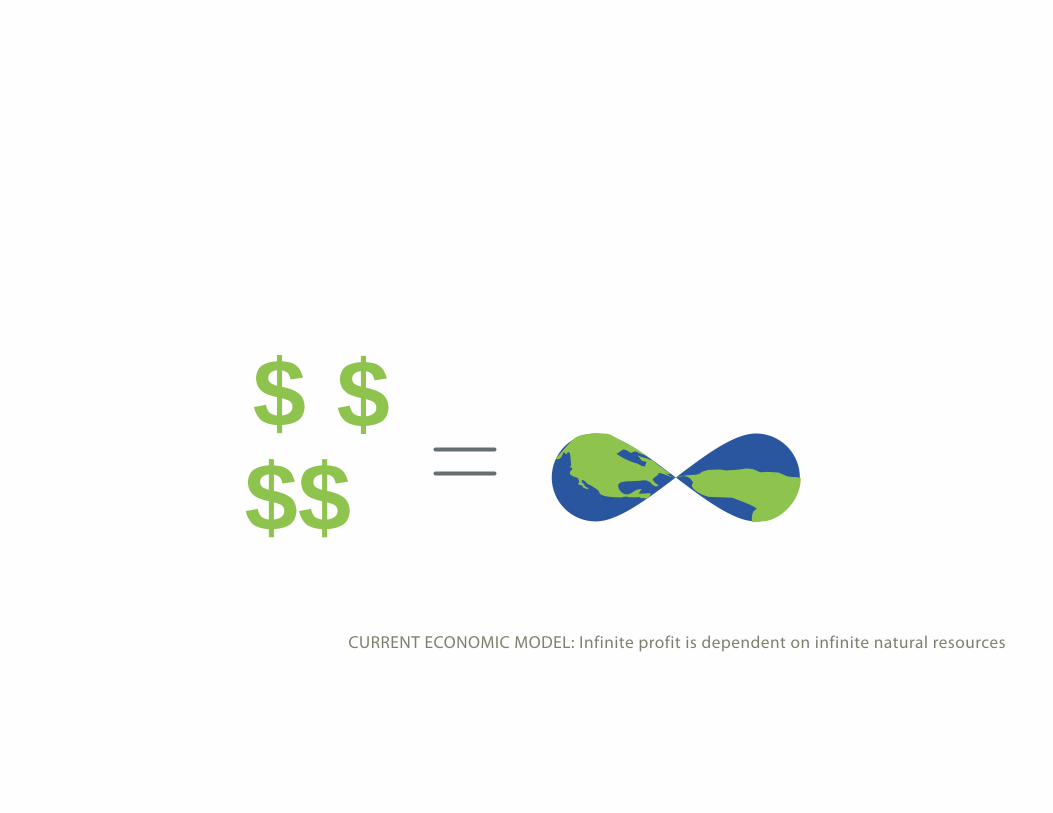
CURRENT ECONOMIC MODEL: Infinite profit is dependent on infinite natural resources
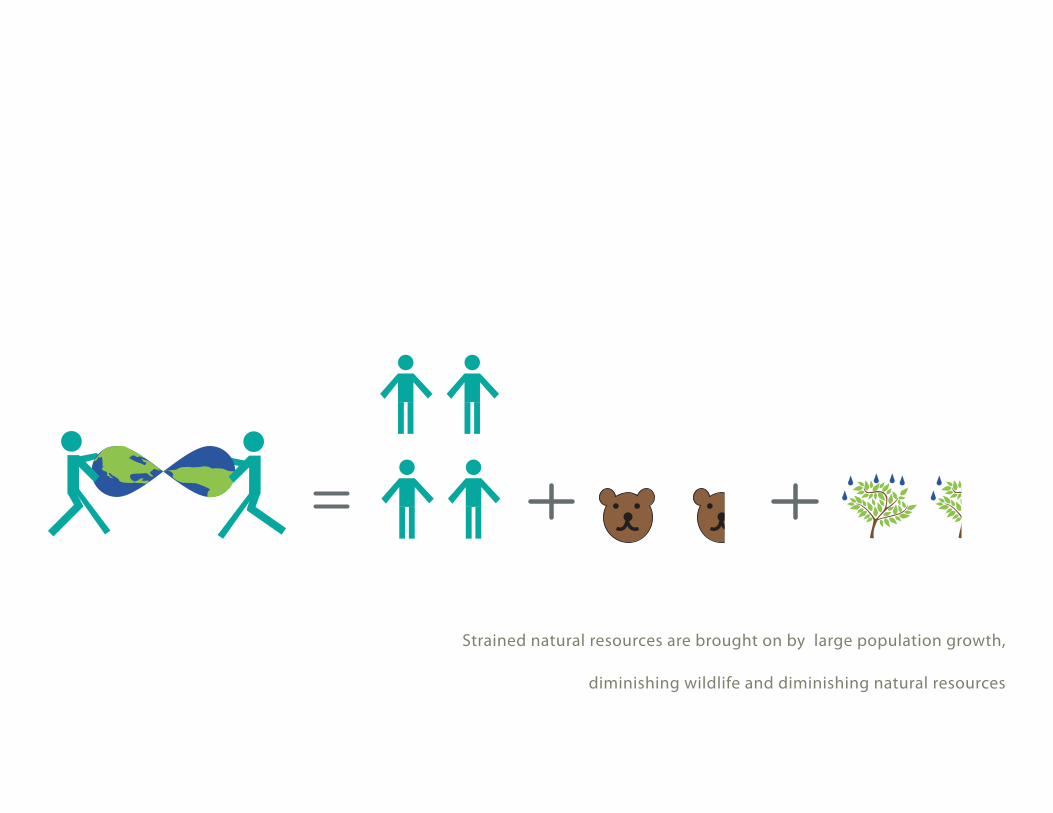
Strained natural resources are brought on by large population growth,
diminishing wildlife and diminishing natural resources

Earth doesn’t have an infinite amount of natural resources

?
$$
$$
$$
$$
Current Economic Model is worth more
than the world’s resources vs.
An economic model that values the
world’s resources more than risky

!

$
mission statementEnhancing wellness, productivity and interaction within campus life by addressing mobility and accessibility, built conditions
and ambient conditions. Technology is the built environment in which people work and live. It came out of an economic
investment for greater productivity, however research has taught us that technological investment and implementation are
dependent on changes in behavior modification. In this project we address the social sustainability and it’s social return on
investment.

Accessibility/Mobility
Aligning outdoor space with University values by designing for wellness, productivity and interaction.
Social Investigations Metrics Outcomes
Built Conditions
Ambient Conditions
Level of daily and seasonal occupancy
Seating availability (Number, size, distance, type)
Safety (Perceived/Real)
Spatial necessities and access for wellness and productivity
Types of nature, interaction of nature and impact on attention span, wellness and productivity
Access to nature (Existing and potential greenspace)
Modes of transportation (Bicycles, service deliveries, waste collection)Public/Private (Perceived/Real)
Decibel level/sound (Affects on attention span and desicisoin making)
Amenities
Material Use
Impact of biodiversity (Global effects, local economy, environmental impact)
metrics

accessibility and mobilityIs it worth the effort?
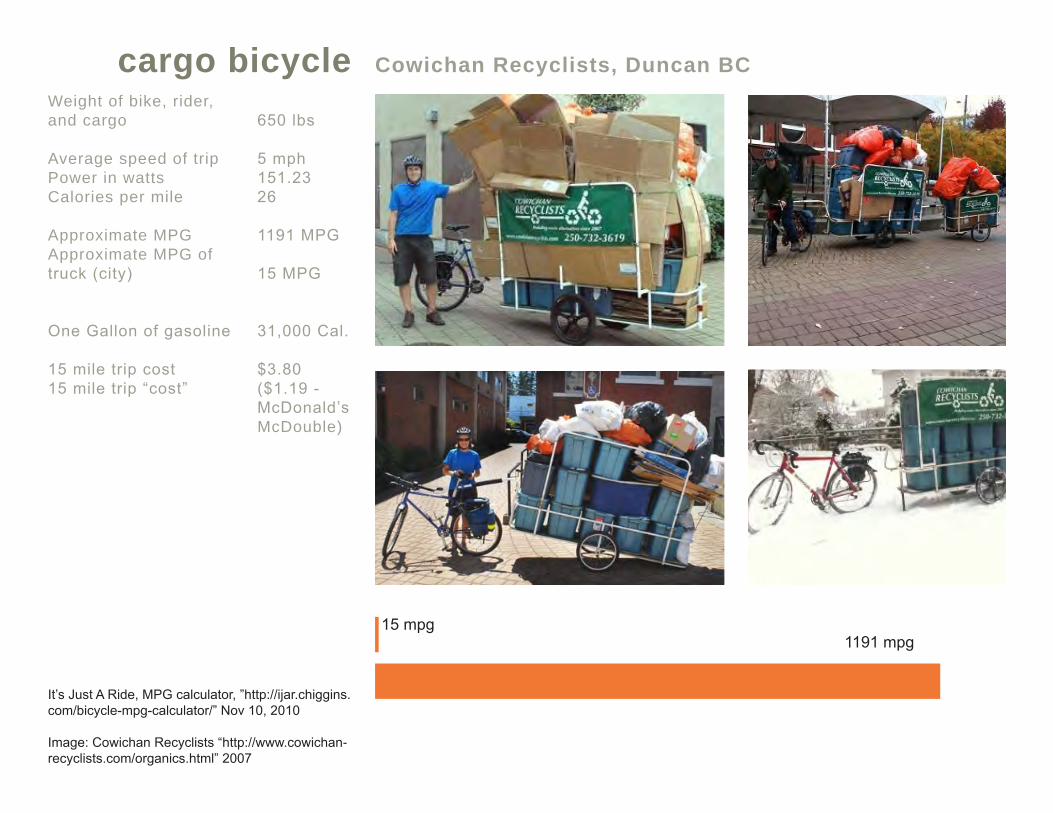
Weight of bike, rider, and cargo Average speed of trip Power in watts Calories per mile Approximate MPG Approximate MPG of truck (city)
One Gallon of gasoline
15 mile trip cost15 mile trip “cost”
650 lbs
5 mph151.2326
1191 MPG
15 MPG
31,000 Cal.
$3.80($1.19 -McDonald’sMcDouble)
cargo bicycle Cowichan Recyclists, Duncan BC
It’s Just A Ride, MPG calculator, ”http://ijar.chiggins.com/bicycle-mpg-calculator/” Nov 10, 2010
Image: Cowichan Recyclists “http://www.cowichan-recyclists.com/organics.html” 2007
15 mpg1191 mpg

Buildings share dumpsters for trash and recycling collection.
Morrill HallTate Lab of Physics recycling ~300 lbs per day per typeVincent and Murphy HallFord Hall recycling ~300 lbs per day per typeGrounds - campus wide recycling 180 lbs. 6 cubic yds
Collection every Monday, Wednesday Collection daily
2 mile route from Church St. to 3009 Como Ave. Truck route performs 80 stops campus wide- 17,000 lbs a day.
FM staff empty bins into collection room, consolidated into dumpster and picked up by packer truck bound for recycling center.
Landcare collects trash and deposits it in building dumpster, recycling is consolidated on truck bound for recycling center.
truck collection From bin to recycling center : amounts and scopeBuildings (FM) Grounds (Landcare)

Buildings share dumpsters for trash and recycling collection.
Morrill HallTate Lab of Physics recycling ~300 lbs per day per type
Vincent and Murphy HallFord Hall recycling ~300 lbs per day per typeGrounds - campus wide recycling 180 lbs. 6 cubic yds organics unknown weight
Collection daily Collection daily
2 mile route from Church St. to 3009 Como Ave. Truck route performs 80 stops campus wide- 17,000 lbs a day.
FM staff empty bins into collection room, recycling is picked up by bike hauler for each building then bound for recycling center.
Landcare bikes with haulers, in teams of two (one for trash and one for recycling), collect waste around campus and part ways.
bike collection From bin to recycling center : amounts and scopeBuildings (FM) Grounds (Landcare)

Cost of recycling collection in 2010 $145 per ton
Total recovered recycling in 2009 3666.59 tons
Total cost of recycling collection in 2009 (estimate based on 2010 rate) $531,655.55
Cost per month ~ $44,304.63
Cost per month for 2 collection zones on Church St. ~ 2000 lbs. per day ~730,000 lbs (365 tons annual)
Estimated cost of recycling collection for Church St. $52,925 (annually) $4410 (monthly) $145 (daily)
Initial cost ~$20,000 pick-up truck
Additional costsFuel ~4 miles round trip (2 per wk) ~35 miles a month (6.5 gal) ~$8.62 a month in gasoline.Maintenance ~$40 oil change (3,000 miles)
Number of employees needed ~1 (salary, insurance unknown)
Operational cost (8 month fuel,maintenance) $69, $4 = $73
$35,280 spent during 8 month period. Potential savings after initial investment is $23 annually.
Initial cost of bike ~$600 bike, helmet ~$1200 cargo hauler
Fuel ~34 miles a month ~844 calories Maintenance ~$50 tune up (annually)
Number of employees needed ~2 (salary, insurance unknown)
Operational cost (8 month fuel,maintenance) $nominal ,$50 = $50
cost comparisonTrucks
Environmental and Social Benefits emissions savings carbon savings health benefits sustainable awareness minimal intrusion on site additional uses such as Landcare or campus deliveries waste pick-up daily - potential for organics pick-up
Bikes
Donatucci, Dana. Interview by author. Minneapolis, MN., June 8th, 2011
Facilities Management, University of Minnesota “http://www.facm.umn.edu/about/central-services/recycling/index.htm” May 5th 2011
Tony’s Trailers, Hoar, Tony “http://www.tonystrailers.com/cargo/” 2000-2010
1 2 3 4 5 6 7 8 9 10 11 12 Bike collection from April - March. With the possibility for year round operations expansion
For recycling in 5 buildings near Church Street

built conditionsWhy should I go there?

“Where Town meets Gown”What makes a public space successful on campus?
4. Successful campuses improve the town/ grown relationship
1. They bring people and ideas together 3. Successful campuses balance concerns about flexibility and control
2. They are places not just facilities
6. Well designed campuses can solve traffic and parking woes
5. Campuses can sow the seeds of sustainability
Source:http://www.arlingtonvirginiausa.com/docs/GMU_workshop_summary_june07.pdf

built conditions
Concrete is the most used material behind water
26 billion tons of CO2/ year 5% of which comes from concrete
3rd largest source of anthropogenic CO2
12.5 billon tons of concrete/ year

built conditions Carbon footprint
Carbon Footprint = (Amount of CO2 embodied in each ingredient lb/yards) X (Mass)
Ordinary Concrete:
Portland Cement + Water + Fine Aggregate + Coarse Aggregate = 537 lb CO2/yard
High Volume Fly Ash (50/%)
Portland Cement + Water + Fine Aggregate + Coarse Aggregate + Fly Ash = 302 lb CO2/yard
Carbonate Mineral Concrete:
Portland Cement (80%)+ Carbonate Mineral Supplementary Cementitious Material “CM-CSM” (20%) + Fly Ash (20%) = 293 lb CO2/yard
Carbon Neutral Concrete:
Portland Cement + Water + Fine Aggregate + Fly Ash + CM-CSM + Fine Synthetic Aggregates “SA”= 0.9 lb CO2/ yard
Calera Cement:

Being less bad is not good enough... - William McDonough

built conditions Carbon footprint
Carbon Footprint = (Amount of CO2 embodied in each ingredient lb/yards) X (Mass)
“Negative-Carbon” Concrete:
Portland Cement + Water + Fly Ash + Fine SA + Coarse SA = -1,146 lb CO2/yard

built conditions Church Street CO2 release
~336.11 Cubic Yards assuming the pour is of 4 inches deep. Church street would require 672 Tons of concrete.
Ordinary Concrete:
= 549.42 Tons CO2
High Volume Fly Ash (50/%)
= 308.18 Tons CO2
Carbonate Mineral Concrete:
= 299.78 Tons CO2
Carbon Neutral Concrete:
= 0.92 Tons CO2
Calera Cement:

built conditionsWorld View: Concrete is the most widely used building material in the world...
Current:
Future???
1,175
Developing World
28 Billion tons/ year
CO2
CO2

how can we change?Environmentally Sustainable Behavior (ESB)
+ People’s propensity to engage in environmentally sustainable behavior is primarily determined by whether or not it is in their financial interest to do so.
- “Social Dilemma” is used to describe the situation in which private interest are at odds with collective interests.
- “Tragedy of the commons” is used to describe the situation in which choices made for personal gain are deterrent to the collective interest which rely on shared resources.
+ Individuals require “Persuasive communication.” That is, not only does one need to make conservation a more economically viable act, one must also convince individuals that economic benefits exist and that they warrant changes in behavior.
$$$
$$$
$$$

how can we change?Environmentally Sustainable Behavior (ESB)
+ Motivators of environmentally responsible behavior are more effective when they have a direct impact on people’s needs and concerns.
+ Community based social marketing indicates that initiatives to promote behavior change are most often effective when they are carried out at the community level and involve direct contact with people.
$ $$$
$$$

built conditions Access to Nature- Wellness
Wellness is a journey towards optimal health that an only be realized through the integration of various dimensions; wellness is characterized by a balance of the physical, emotional, social, spiritual, occupational and intellectual dimensions.
Physical:
Emotional:
Social:
Spiritual: Intellectual:
Occupational:

built conditions Access to Nature
Trees Existing Open Green Space Potential Active Green Space

built conditions Public vs. Private Space
LowMedium High

(proposed) built conditions Amenities
CHURCH
Bike Racks
Bike Repair Center
Seating
Water Fountains
Access to WiFi
Food (Seasonal)
Artificial Light
Power Outlets
Trash/Recycle Bins

Impact of Biodiversityambient conditions
Ecological process attracts human ->
?
Human becoms attached to ecological process ->
Ecological process becomes part of human identity -> Human acts on “new” identity.

ambient conditionsHow does Church Street feel?

Tem
pera
ture
Rural Suburban RuralSuburbanDowntownUrbanResidential
UrbanResidential
ParkPond Warehouse or Industrial
Surface Temperature (Day)
Surface Temperature (Night)
Air Temperature (Day)
Air Temperature (Night)
Impact of biodiversityambient conditions

ambient conditions
Existing and Possible Tree Canopy as Percent of L d A f N i hb h dLand Area for Neighborhoods
Existing and Possible Tree Canopy as Percent of Land Area for Neighborhoods. Proposed tree plantings will increase canopy cover by 10% and could effect temperature by up to 3˚F. The National Wildlife Federation states that a 3˚ rise of overall temperature in Minnesota could triple heat related deaths.
University of Minnesota
Bauer, Kilberg, Martin. “ Classification and Mapping of Urban Tree Cover: City of Minneapolis.” 2011.
The Urban Heat Island: Tree Canopy and Impact on Human and Environmental Wellness.

RED OAK
≈ 534 species
≈ 534species
≈ 150species
PINOAK
LITTLE LEAFLIDEN
Impact of biodiversityambient conditions
Number of species that each tree could provide habitat for. (These are not regionally specific).
Wind rustling through trees is approximately 50 decibels, the equivalent to the decibel level of a car.
The proposed 11 new trees will reduce surrounding air temperature by up to 3˚F.
Little leaf lindens flower attract bees with pollen with they flower
Tallamy, Douglas W., “Bringing Nature Home: How You Can Sustain Wildlife with Native Plants”. Timber Press. London. 2007)

RED OAK
PINOAK
LITTLE LEAFLIDEN
Proposed Canopy Rainwater Captureambient conditions
710
Small Industrial Site
18501
710
3232
710
3774
710
Large Industrial Site
19697
710
3232
710
3774
3” DBH
18” DBH
3” DBH
18” DBH
3” DBH
18” DBH
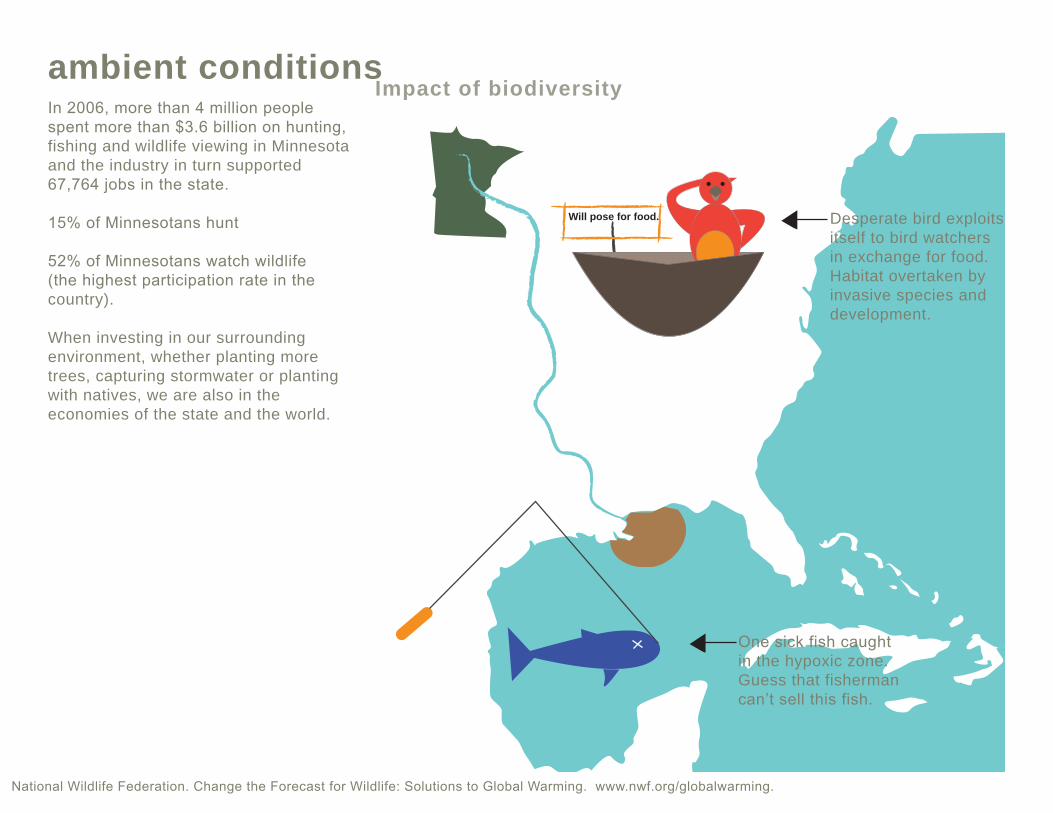
Will pose for food.
Impact of biodiversity ambient conditionsIn 2006, more than 4 million people spent more than $3.6 billion on hunting, fishing and wildlife viewing in Minnesota and the industry in turn supported 67,764 jobs in the state.
15% of Minnesotans hunt
52% of Minnesotans watch wildlife (the highest participation rate in the country).
When investing in our surrounding environment, whether planting more trees, capturing stormwater or planting with natives, we are also in the economies of the state and the world.
One sick fish caught in the hypoxic zone. Guess that fisherman can’t sell this fish.
Desperate bird exploits itself to bird watchers in exchange for food. Habitat overtaken by invasive species and development.
National Wildlife Federation. Change the Forecast for Wildlife: Solutions to Global Warming. www.nwf.org/globalwarming.

ambient conditions
After viewing a frightening movie and were then shown a video of either a natural or built environment. The results indicate that participants perceived the natural environments as more beautiful than built environments. In addition, viewing natural environments elicited greater improvement in mood and marginally better concentration than viewing built environments. Affective restoration accounted for a substantial proportion of the preference for the natural over the built environments. Conclusion: views of natural environments calm stress more than built environments.

ambient conditionsTypes of Nature and Effect on Wellness
Patients with a view of the urban environment with trees recovered faster, needed less pain medication and had a smaller hospital bill.
Patients with a view of urban scenes without trees took longer to recover, needed more pain medication and had a larger hospital bill.
$
$ $ $(Ulrich, Roger S., 2006. Human responses to vegetation and landscapes).

?
!
ambient conditionsImpact of nature on productivity
Access to nature can increase productivity by up to 18%. Those with a view of the built environment are generally found to be less productive than those with a view of the built environment with trees.
Kaplan, Rachel., 1993. The Role of Nature in the Context of the Workplace.

ambient conditionsBuilding attributes that matter the most...if it matters inside, it matters outside.
Clean Air
Lighting
Thermal Comfort
Ergonomics
Privacy
Access to Nature
Land Use
Noise
Social Interaction Mobility
Loftness, Vivian. 2005. e-BIDS: Linking Energy and Productivity to Human Health.

ambient conditionsHow noise, temperature and light affect us
Other studies also reveal that people may be less likely to help strangers in noisy environments and are more likely to try to escape by walking faster and gazing straight ahead, thus avoiding other people.
Unpleasantly noisy environments are linked with higher arrest rates, aggression, decreased care for the environment.
More errors made with simple tasks in the presence of noise.
Comfort levels and mood are highly dependent on temperature.
Lighting effects perceived safety, real safety, mood and productivity level.

ambient conditionsNodes of Noise
With approximately 430 Annual Average Daily Trips, vehicular circulation on Church Street.
Motorists, services vehicles, pedestrians and bicyclists merge together just outside of Rapon Hall and the Scholar’s Walk.

24'-3"
3'-6"
24'-1"
9'-0"
28'-2"
8'-0"
10'-0"
7'-4"
10'-5"
4'-11"
5’-0”
5’-0”
3’-0”
3’-0”
3’-0”
3’-0”
4’-0”
3’-0”
3’-0”
1’-6”
3’-0”
1’-6”
3’-0”
1’-6”
3’-0”
3’-0”
3’-0”
3’-0”
3’-0”
9'-7"
14'-6"
4'-2" 5'-7"
25'-8"
8'-0"
6'-3"
33'-3"
17'-6"
2'-8"
11'-7"
14'-3"
10'-0"
7'-0"
27'-8"
15'-0"
49'-1"
45'-6"
33'-8"
6'-8"
1'-3"
1'-0"


A+
in conclusion...An under-utilized outdoor space is the equivalent to a classroom without students or teachers.

a look to the future...of socially sustainable behavior

sourcesProject for Public Spaces, “What Makes a Successful Place?” http://www.pps.org/articles/grplacefeat/ (accessed 06.06.11).
Lennart, Sobiecki. “Rynek Glowney – Main Square.” http://www.pps.org/great_public_spaces//one?public_place_id=730 (accessed 06.07.11).
Shin-pei, Tsay. “Plaza Hidalgo.” http://www.pps.org/great_public_spaces//one?public_place_id=756 (accessed 06.07.11).
Project for Public Spaces, “Piazza Navona.” http://www.pps.org/great_public_spaces/one?public_place_id=911 (accessed 06.07.11).
Ethan , Kent. “Plaza Santa Ana.” http://www.pps.org/great_public_spaces//one?public_place_id=905 (accessed 06.07.11).
Project for Public Spaces, “GEORGE MASON UNIVERSITY PUBLIC PLAZA - Design Workshop Summary (2007), http://www.arlingtonvirginiausa.com/docs/GMU_workshop_summary_june07. pdf. (accessed June 7, 2011).
Environmental Protection Agency, “Inventory of U.S. Greenhouse Gas Emissions and Sinks: 1990–2008(2008), http://www.epa.gov/climatechange/emissions/downloads10/508_Complete_ GHG _1990_2008.pdf. (accessed June 8, 2011).
Brent, Constantz. “Sequestering Carbon Dioxide in the Built Environment: a Revolutionary Cement Technology .” 02.18.09. http://energyseminar.stanford.edu/node/67 (accessed 06.08.11).
Calera Corporation, “Calera Corporation: Sequestering CO2 in the Built Environment.” http://calera.com/index.php/home/ (accessed 06.08.11).
Bibliography


