1
Citigroup Global Markets Limited
Pillar 3 Disclosures
31 December 2016
2
Table Of Contents
1. Overview .......................................................................................................................................................... 5
2. Risk Management Objectives and Policies ....................................................................................................... 9
2.1 Credit Risk Management .......................................................................................................................... 11
2.2 Market Risk Management..................................................................................................................... 12
2.3 Operational Risk Management ............................................................................................................. 13
2.4 Liquidity Risk Management .................................................................................................................. 13
2.5 Conduct Risk Management .................................................................................................................. 14
3. Own Funds ..................................................................................................................................................... 16
4. Capital Adequacy ........................................................................................................................................... 18
4.1 Leverage Ratio ..................................................................................................................................... 19
4.2 Capital Buffers ...................................................................................................................................... 21
5. Credit Risk ...................................................................................................................................................... 23
5.1 Credit Risk Management ...................................................................................................................... 23
5.2 Counterparty Risk ................................................................................................................................ 26
5.3 Credit Risk ........................................................................................................................................... 28
5.4 Credit Quality Analysis ......................................................................................................................... 33
5.5 Credit Risk Mitigation ........................................................................................................................... 35
6. Market Risk .................................................................................................................................................... 37
6.1 Market Risk Management..................................................................................................................... 37
6.2 Market Risk Regulatory Capital ............................................................................................................ 37
7. Operational Risk ............................................................................................................................................. 42
8. Non-Trading Book Exposures ......................................................................................................................... 43
8.1 Non-Trading Book Equity Exposures .................................................................................................... 43
8.2 Interest Rate Risk in the Non-Trading Book ......................................................................................... 43
9. Securitisation Activity ..................................................................................................................................... 44
10. 2016 Remuneration Statement ....................................................................................................................... 47
11. Appendix 1: UK Senior Management and Board Disclosures ......................................................................... 57
12. Appendix 2: 2016 asset encumbrance disclosures for CGML ......................................................................... 59
13. Appendix 3: 2015 asset encumbrance disclosures for CGML ......................................................................... 60
14. Appendix 4: Capital Instruments main features template ................................................................................ 61
15. Glossary ......................................................................................................................................................... 62

3
Table of Figures
Figure 1: Key Metrics for CGML as at 31 December 2016 ....................................................................................... 6
Figure 2: Extract from UK Organisation Chart as at 31 December 2016 .................................................................. 7
Figure 3: Subsidiaries of CGML as at 31 December 2016........................................................................................ 8
Figure 4: Risk Management Organisation .............................................................................................................. 11
Figure 5: CGML combined VaR for Businesses within the IMA Scope 2016 .......................................................... 40
Figure 6: CGML combined VaR for Businesses within the IMA Scope 2015 .......................................................... 40

4
List of Tables
Table 1: Own Funds ............................................................................................................................................... 16
Table 2: Reconciliation of Own funds to the balance sheet .................................................................................... 17
Table 3: Minimum capital requirements .................................................................................................................. 18
Table 4: Minimum capital requirements in respect of credit risk under the standardised approach ......................... 19
Table 5: Leverage Ratio ......................................................................................................................................... 20
Table 6: Leverage exposure split of on-balance sheet exposures (excluding derivatives, SFT's) ........................... 21
Table 7: Reconciliation of Leverage Exposure to accounting assets¹ ..................................................................... 21
Table 8: Geographical distribution of credit exposures relevant for the calculation of the countercyclical buffer ............................................................................................................................. 22
Table 9: Amount of institution-specific countercyclical buffer .................................................................................. 22
Table 10: OTC Derivative Exposures ..................................................................................................................... 26
Table 11: Notional value of CGML’s CDS Transactions ......................................................................................... 28
Table 12: Credit Exposures .................................................................................................................................... 29
Table 13: EAD with geographical analysis by exposure class 2016 ....................................................................... 29
Table 14: EAD with geographical analysis by exposure class 2015 ....................................................................... 29
Table 15: EAD with sector analysis ........................................................................................................................ 30
Table 16: EAD with maturity breakdown by exposure class as at 31 December 2016 ............................................ 30
Table 17: EAD with maturity breakdown by exposure class as at 31 December 2015 ............................................ 30
Table 18: Impaired Wholesale Exposures .............................................................................................................. 32
Table 19: Credit quality assessment scale ............................................................................................................. 33
Table 20: Simplified summary of risk weightings by Credit Quality Step................................................................. 33
Table 21: Credit Quality Step analysis of Exposure before and after Credit Risk Mitigation ................................... 34
Table 22: Exposures covered by eligible Credit Risk Mitigation ............................................................................. 36
Table 23: CGML Key VaR Metrics in 2016 ............................................................................................................. 39
Table 24: CGML Key VaR Metrics in 2015 ............................................................................................................. 39
Table 25: Non-Trading Book Equity Exposures ...................................................................................................... 43
Table 26: Aggregate amount of trading book securitisation positions held ............................................................. 45
Table 27: Capital Treatment applied to CGML’s trading book securitisation positions as at 31 December 2016 ..................................................................................................................................... 45
Table 28: Capital treatment applied to CGML’s trading book securitisation positions as at 31 December 2015 ..................................................................................................................................... 45
Table 29: Fixed and Variable Compensation of Citi PRA Code Staff for the 2016 Performance Year .................... 54
Table 30: Fixed and Variable Compensation of Citi PRA Code Staff for the 2015 Performance Year .................... 55
Table 31: 2016 Remuneration Banding for Annual Compensation of Individuals Earning at Least EUR 1 Million ......................................................................................................................................... 56
5
1. Overview
This document contains the Pillar 3 disclosures for Citigroup Global Markets Limited (CGML), the principal UK operating subsidiary of Citigroup (Citi), for 2016.
The Capital Requirements Directive (CRD IV) package, which came into effect on 1 January 2014 and implements the provisions of the Basel Capital Accord in the EU, mandates a framework of capital adequacy regulation for banks and investment firms incorporating three distinct pillars.
Pillar 1 prescribes the minimum capital requirements for such firms;
Pillar 2 addresses the associated supervisory review process; and
Pillar 3 specifies further public disclosure requirements in respect of their capital and risk profile
In accordance with the requirements set out in CRD IV, the focus of the disclosures is on European Economic Area (EEA) parent institutions and firms which are significant subsidiaries of EEA parent institutions.
The disclosures have been published in the Investor Relations section of Citi’s website and complement both the group level materials included in the Citigroup Annual Report, and CGML’s own 2016 financial statements.
The basis of disclosures for CGML is on a consolidated basis. Apart from CGML itself, the remaining entities in the CGML group have minimal balance sheet assets and have not been determined to be material subsidiaries for the purposes of these Pillar 3 disclosures, and therefore will not be disclosed separately.
See Figure 3 for further details of the entities included in the CGML consolidated group.
We are aware of no material practical or legal impediment to the prompt transfer of capital resources or repayment of liabilities among these entities, beyond the normal requirements imposed by company and other legislation.
CGML maintains own funds which are comfortably above the regulatory minimum requirements.
Citigroup Inc. (Citi)
Citi is a global diversified financial services organisation whose businesses provide consumers, corporations, governments and institutions with a broad range of financial products and services, including consumer banking and credit, corporate and investment banking, securities brokerage, trade and securities services and wealth management. Citi has approximately 200 million customer accounts and does business in more than 160 countries and jurisdictions.
The mission of Citi is to responsibly provide financial services that enable economic growth and progress as a trusted partner to its clients and to deliver sustainable, growing earnings across all of its businesses while protecting capital and liquidity.
Citi currently operates, for management reporting purposes, via two primary business segments: Citicorp, consisting of Citi’s Global Consumer Bank (GCB) and Institutional Clients Group (ICG) businesses; and Citi Holdings, consisting of businesses and portfolios of assets that Citi has determined are not central to its core Citicorp businesses.
Citi Holdings is no longer a separately reported business segment; it is now reported as corporate/other.
Citicorp
Citicorp is a relationship-focused global bank serving businesses and consumers. It includes “core” Citi properties and has a presence in high-growth emerging markets around the world. Citicorp has worldwide deposit-taking capabilities that can be put to work with consumer and institutional customers in a diversified way to produce the highest returns, giving it a unique ability to deliver global capabilities locally and serve local clients globally.
In 2016, Citicorp’s UK business was almost entirely transacted on the books of CGML, Citibank Europe PLC (CEP) UK branch and Citibank NA London branch. The last two fall outside the scope of these disclosures.
CGML’s business comprises activities falling within the Markets and Securities Services, Capital Markets Origination (CMO) and Investment Banking segments.
Institutional Clients Group (ICG)
Citi’s ICG business comprises the following:
Markets and Securities Services
6
The main businesses within Markets and Securities Services are as follows:
Commodities
Credit
Equities
Foreign Exchange
Investor Services
Multi Asset Group
Rates
Securitised Markets
Banking
Citi’s banking businesses comprise the following:
Capital Markets Origination (CMO)
Corporate and Investment Banking
Corporate Portfolio Management
Private Bank
Treasury and Trade Solutions (TTS)
These business lines allow Citi to provide corporations, governments, institutions and investors with a broad range of products and services, including investment banking, securities trading, advisory services, foreign exchange, structured products, derivatives and lending.
CGML is Citi’s primary international broker-dealer. It has a major presence as a dealer, market maker and underwriter in equity and fixed income securities and offers risk-based solutions to producers, consumers and investors in commodity markets. CGML also provides advisory services to a wide range of corporate, institutional and government clients. CGML’s trading activities encompass cash, exchange traded and over the counter (OTC) derivative markets. Its major counterparties are banks, investment banks, investment managers, insurers and hedge funds. It also has moderate trading exposure to corporate clients.
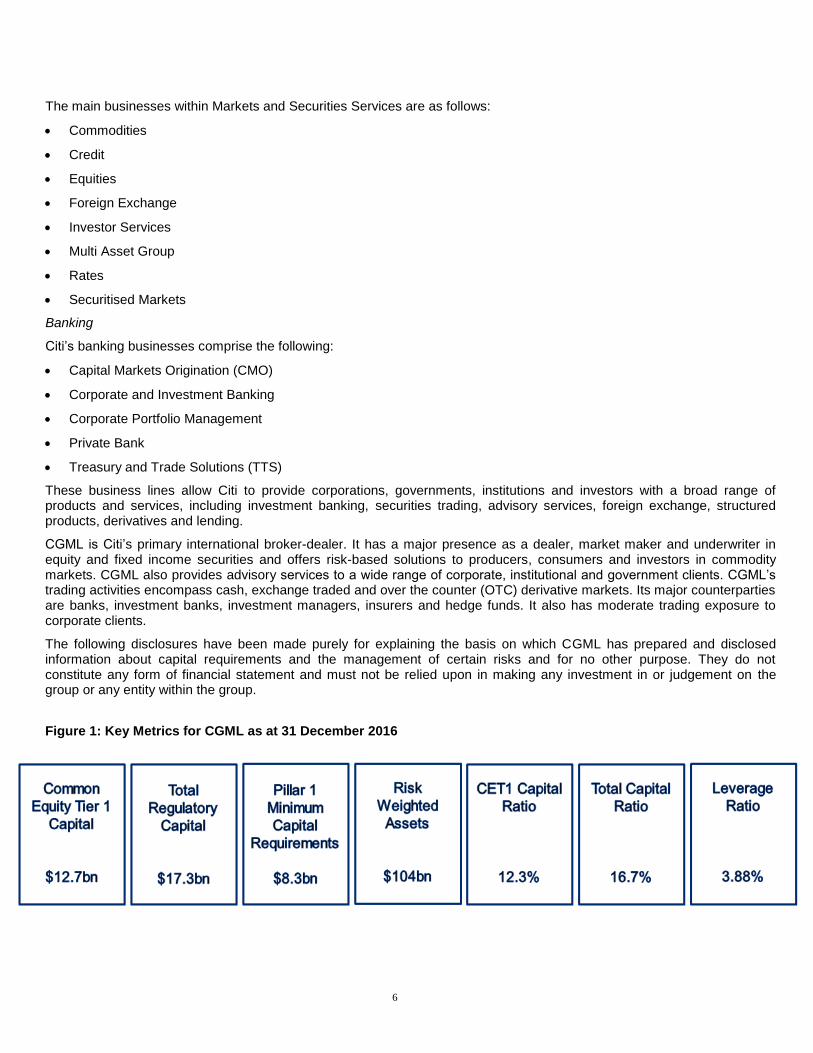
The following disclosures have been made purely for explaining the basis on which CGML has prepared and disclosed information about capital requirements and the management of certain risks and for no other purpose. They do not constitute any form of financial statement and must not be relied upon in making any investment in or judgement on the group or any entity within the group.
Figure 1: Key Metrics for CGML as at 31 December 2016

7
Figure 2: Extract from UK Organisation Chart as at 31 December 2016

8
Figure 3: Subsidiaries of CGML as at 31 December 2016
Subsidiary Date
Established Description
Citigroup South Africa Credit Products (PTY) Limited
2004
Established by Emerging Markets Credit Trading to offer investment products to South African investors.
Citigroup South Africa Credit Products (PTY) Limited has had a very limited amount of transactions booked on the vehicle and is in the process
of being wound down, there are no active trades on the books.
Citi Global Wealth Management Societe Anonyme
Monegasque (SAM) (Monaco)
2007
Established as a Citi Private Bank advisor, chartered and headquartered in Monaco. Formed as an asset management company to serve family offices and ultra-high net worth individuals resident in Monaco with a full range of global investment products and tailored financial solutions, through the Citi Private Bank.
Incorporated to meet regulations that stipulate that only a local onshore registered and approved/authorized legal entity and its local registered employees are permitted to procure clients and/or provide local Monaco resident investment advisory services.
The entity has no onshore booking, deposit taking or lending capability. Local clients book into the existing Citi Private Bank booking centres in Citibank N.A., Jersey, Citibank N.A. London, Citibank (Switzerland) and Citibank Europe plc.
Citigroup Global Markets Luxembourg SARL
2011
Established by the Prime Finance business to carry out Securities Lending and Delta One activity.
Incorporated in the form of a SARL, or limited liability company.
Citigroup Global Markets Funding Luxembourg SCA and GP SARL
2012
Established as a Euro Medium Term Note (EMTN) issuance vehicle for the Multi Asset Group.
Established due to CGML itself being unable to publically issue debt as a private limited company.
A Luxembourg subsidiary was required in order to meet Luxembourg listing and corporate law requirements. Two Luxembourg entities were incorporated:
- ‘SCA’ (a form of partnership) the issuance vehicle; and
- ‘SARL’ (a limited company) set up as an unlimited shareholder and manager.
The SCA issues the notes but transfers the risks to CGML via Total Return swaps.
9
2. Risk Management Objectives and Policies
Effective risk management is of primary importance to CGML and accordingly, CGML seeks to maintain a comprehensive risk management process. CGML utilises Citi’s risk management model and organisation, with its multi-dimensional risk oversight and its people, processes and systems to ensure robust oversight of entity risks. In addition, CGML has entity specific risk management and controls, to ensure local challenge to risk-taking and to ensure that Citi’s approach is appropriate for the entity.
Risk management must be built on a foundation of ethical culture. Under Citi’s mission and value proposition, which was developed by Citi’s senior leadership and distributed throughout the firm, Citi strives to serve as a trusted partner to its clients by responsibly providing financial services that enable growth and economic progress while earning and maintaining the public’s trust by constantly adhering to the highest ethical standards. As such, Citi asks all employees to ensure that their decisions pass three tests: they are in our clients’ interests, create economic value and are always systemically responsible.
Additionally, Citi evaluates employees’ performance against a series of behavioural expectations set out in Citi’s leadership standards, which were designed in part to effectuate Citi’s mission and value proposition. Other culture-related efforts in connection with conduct risk, ethics and leadership, escalation and treating customers fairly also help Citi to execute its mission and value proposition.
While the management of risk is the collective responsibility of all employees, Citi assigns accountability into three lines of defence:
First line of defence: the business owns all of its risks, and is responsible for the management of those risks.
second line of defence: Citi’s control functions (e.g., risk, finance, compliance, etc.) establish and monitors standards for the management of risks and effectiveness of controls; and
third line of defence: Citi’s internal audit function independently provides assurance, based on a risk-based audit plan, that processes are reliable and governance and controls are effective.
CGML applies Citi’s global risk management framework, tailored as appropriate for the entity, based on the following principles established by the Chief Risk Officer:
a defined risk appetite, aligned with business strategy;
accountability through a common framework to manage risks;
risk decisions based on transparent, accurate and rigorous analytics;
a common risk capital model to evaluate risks;
expertise, stature, authority and independence of risk managers; and
risk managers empowered to make decisions and escalate issues.
The Chief Risk Officer reports directly to the Citi CEO. The Risk Management organisation is structured so as to facilitate the management of risk across three dimensions: businesses, regions and critical products.
Each of the major business groups has a Business Chief Risk Officer who is the focal point for risk decisions such as setting risk limits or approving transactions in the business. There are Business Chief Risk Officers for Global Commercial, Global Consumer, the Institutional Clients Group and the Private Bank. The majority of the staff in Citi’s independent Risk Management organisation report to these Business Chief Risk Officers.
Regional Chief Risk Officers, appointed in each of Asia, EMEA and Latin America, are accountable for all the risks in their geographic areas and are the primary risk contacts for the regional business heads and local regulators. In addition, there are Product Chief Risk Officers for a number of those risk areas of critical importance to Citi: currently fundamental credit, market and real estate risk, treasury, model validation and systemic risks. The Product Chief Risk Officers are accountable for the risks within their speciality and focus on specific issues across businesses and regions. The Product Chief Risk

10
Officers serve as a resource to the Chief Risk Officer, as well as to the Business and Regional Chief Risk Officers, thereby better enabling them to focus on the day-to-day management of risks and responsiveness to business flow.
Each of the Business, Regional and Product Risk Officers, as well as the heads of groups in the Business Management team, report to Citi’s CRO.
The Regional Chief Risk Officer (EMEA CRO) acts as the CRO for CGML. The EMEA CRO reports directly to the Global CRO. The EMEA CRO role is formally inclusive of all divisions and aligned with the regional management structure to foster a more integrated approach to cross-divisional risks.
CGML's risk appetite framework includes principle-based qualitative boundaries to guide behaviour and quantitative boundaries within which the firm will operate, focusing on ensuring that it has sufficient capital resources in light of the risks to which the entity could be exposed. The legal entity risk appetite is set by the CGML Board, and incorporates management judgement regarding prudent risk taking and growth in light of the business environment within which the entity operates. The CGML Board of Directors, with input from senior Citi and CGML management, sets overarching expectations and holds management accountable for ensuring the risk profile remains within this appetite. Legal entity risk appetite considerations include assessments of current capital levels, planned capital actions and excess buffers or requirements.
The Risk Committee for CGML assists the entity’s Board in fulfilling its responsibilities including an oversight of the risks the entity faces, including its credit, market, liquidity, operational and certain other risks. The Committee ensures an alignment between entity strategy, capital adequacy, the macroeconomic environment and the development of a strategy to manage those risks in line with Citi’s global risk strategy. The Risk Committee meets at a minimum quarterly and is attended by the executive and non-executive directors as well as representatives from Legal, Risk, Internal Audit, Compliance and Finance.
A Citi-wide (including an EMEA-based) Business Practices Committee (BPC) (composed of regional senior management including the EMEA CRO) reviews practices involving potentially significant reputational or franchise issues. This committee reviews whether Citi’s business practices have been designed and implemented in a way that meets the highest standards of professionalism, integrity and ethical behaviour.
Additional committees ensure that product risks are identified, evaluated and determined to be appropriate for Citi and its customers, and incorporate the necessary approvals, controls and accountabilities.
The New Product Approval Committee (NPAC) is designed to ensure that significant risks, including reputational and franchise risks, in a new ICG product, service or complex transaction are identified and evaluated, determined to be appropriate, properly recorded for risk aggregation purposes, effectively controlled and have accountabilities in place.
The UK Business Risk and Control committee holds monthly discussions with entity management around emerging risks facing Citi’s UK entities.
The Manufacturing Product Approval Committee (MPAC) is responsible for reviewing new or modified products or transactions created by Citi that are distributed to retail investors as well as third-party retail distributors and
The Distribution Product Approval Committee (DPAC) which approves new investment products and services, including those created by third parties as part of Citi’s “open architecture” distribution model, before they are offered to retail investors via Citi distribution businesses.
CGML senior management consider the Risk Management infrastructure as described in the subsequent chapters of this document as being adequate to capture and measure the risks taken as a result of the entity’s business profile and strategy.

11
Figure 4: Risk Management Organisation
The EMEA CRO acts as the CRO for CGML and is the designated SMR for risk management under the Senior Managers Regime. As noted above, CGML utilises Citi’s over-arching risk management model, policies and organisation, with its multi-dimensional risk oversight, people, processes and systems in order to ensure robust oversight of entity risks. The CGML Risk Manager is responsible for the day-to-day management of risk on CGML, overseen by the EMEA CRO, along with the risk managers for the different risk types (market risk, liquidity risk, credit risk and operational risk) and product risk managers responsible for the risks within their specialities.
2.1 Credit Risk Management
Credit Risk Management Objectives and Policies
Credit risk is the potential for financial loss resulting from the failure of a borrower or counterparty to honour its financial or contractual obligations.
Credit risk arises in many of the CGML’s business activities, including:
Chief Risk Officer
Product Chief Risk Officers
Chief Credit Officer
Cross Asset Portfolio Risk Management
Operational Risk Management
Business Chief Risk Officers
Institutional Clients Group
Private Bank
Global Commercial
Global Consumer
Regions / Legal Entities
Asia
EMEA and CGML
Citibank N.A.
Latin America
Global Risk Management
Franchise Risk Architecture
Fundamental Credit Risk
Head of Cyber Risk
Risk Management Infrastructure
CRO initiatives Regulatory Coord & Quality Assurance
12
sales and trading;
derivatives;
securities transactions;
settlement;
when CGML acts as an intermediary on behalf of its clients and other third parties; and
when acting as underwriter or within a capital raising capacity.
An explanation of Citi’s credit risk management policy can be found in “Managing Global Risk – Credit Risk” in Citi’s 2016 Form 10-K, available on the Citigroup website.
Corporate Credit Risk
For corporate clients and investment banking activities across Citi, the credit process is grounded in a series of fundamental policies, including:
Joint business and independent Risk Management responsibility for managing credit risks;
A single centre of control for each credit relationship, which coordinates credit activities with each client;
Portfolio limits to ensure diversification and maintain risk/capital alignment;
A minimum of two authorised credit officer signatures required on most extensions of credit, one of which must be from a credit officer in Credit Risk Management;
Risk rating standards, applicable to every obligor and facility; and
Consistent standards for credit origination documentation and remedial management.
Credit risk is one of the most significant risks the Company faces as an institution. As a result, CGML has a well-established framework in place for managing credit risk across all businesses. This includes a defined risk appetite, credit policies, and counterparty credit risk limits which are monitored daily. CGML’s credit risk management also includes processes and policies with respect to problem recognition, including “watch lists,” portfolio review, updated risk ratings and classification triggers. The framework is supplemented by regular stress testing and monitoring of exposures, with monthly and quarterly reporting to the senior management and the Board of Directors respectively.
Scope and Nature of Risk Reporting and Measurement Systems
Citi uses a global risk reporting system to manage credit exposure to its wholesale obligors and counterparties. The counterparty exposure profile for derivative counterparty credit risk is calculated using Monte Carlo simulation.
2.2 Market Risk Management
Market Risk Management covers the price risk in the firm’s trading and accrual portfolios. There are policies in place governing the relevant methodologies for managing and measuring risk on both types of portfolio. The risk is then aggregated and reported on centralised risk systems.
Responsibility for hedging or otherwise mitigating market risk lies in the first instance with the business originating the risk. Risks taken must be commensurate with the risk appetite of the firm as set by senior management. The Risk Management function independently monitors market risks via a comprehensive system of limits and triggers.
Trading Portfolios
For traded product price risk, all traded risk exposures are aggregated in the CitiRisk Market Risk (CRMR) system daily. Price risk in Citi’s trading portfolios is monitored using a series of measures, including but not limited to Value at Risk (VaR), stress testing and factor sensitivities.
CRMR is used as the primary system to aggregate and calculate these measures, including the firm’s VaR.
CGML’s VaR reports are circulated daily for monitoring of: (i) the VaR usage against the overall VaR limit; (ii) the standalone VaR by market risk factor; (iii) the component Value at Risk (CVaR) contribution to total VaR; and (iv) the stressed VaR. As well as an overall VaR limit, the Company has factor sensitivity limits in place for each market risk factor that are monitored daily. Factor sensitivities are defined as the change in the value of a position for a defined change in a market risk factor (e.g. the change in the value of a Treasury bill for a one basis point change in interest rates). It is the responsibility of each
13
business to seek to ensure that factor sensitivities are calculated and reported for all relevant risks taken within a trading portfolio.
Exposure that approaches or exceeds limit or trigger levels is escalated within market risk management and to CGML’s Market Risk Manager and Legal Entity Risk Manager, with necessary actions taken.
Where the Equities business is concerned, an ex-ante stress loss based escalation framework has been put in place to cover all block trades, including accelerated equity offerings, equity underwritings, rights offerings and special situation (event-driven) transactions. Transactions with estimated stress losses above certain levels require escalation to the EMEA Chief Risk Officer, the CGML Chief Executive Officer and to the Board.
2.3 Operational Risk Management
Operational risk is the risk of loss resulting from inadequate or failed internal processes, systems or human factors, or from external events, and includes reputation and franchise risk associated with business practices or market conduct.
Citi’s operational risk is managed through a framework designed to balance strong corporate oversight with well-defined independent Risk Management. This framework, consistent with Citi’s three lines of defence approach to Risk Management, includes:
Recognised ownership of the risk by the businesses;
Oversight by Citi’s independent control functions; and
Independent assessment by Citi’s Internal Audit function.
Operational Risk Management proactively assists the businesses, operations, technology and other independent control groups in enhancing the effectiveness of controls and managing operational risks across products, business lines and regions. Furthermore, operational risks are considered as new products and business activities are developed and processes are designed, modified or sourced through alternative means.
Citi maintains a system of policies to anticipate, mitigate and control operational risk. A consistent framework has also been established for monitoring, assessing and communicating both operational risk and the overall operating effectiveness of the internal control environment. As part of this framework, Citi has a Manager’s Control Assessment (MCA) process to help managers self-assess key operational risks and identify and address weaknesses in the design and operating effectiveness of related, mitigating internal controls.
Other tools include Operational Risk Scenario Analysis, a forward-looking tool to manage operational risk, involving the identification and assessment by business managers and risk management experts of potential events with low probability but high severity. In addition, there are various governance forums for escalation and reporting of internal control, compliance, regulatory and risk issues, including operational risk loss events.
2.4 Liquidity Risk Management
CGML defines liquidity risk as the risk that it will not be able to meet efficiently both expected and unexpected current and future cash flow and collateral needs without adversely affecting either daily operations or its financial condition.
Citi operates as a centralised treasury model, where the overall balance sheet is managed by Treasury, through its Global Franchise and Regional Treasurers. The EMEA Regional Treasurer is supported by the UK Treasurer who is responsible for CGML’s balance sheets and liquidity profile. The UK Treasurer heads the EMEA Legal Entity Management team which includes a liquidity management team responsible for managing CGML’s liquidity on a day to day basis. The liquidity management team is specifically responsible for the CGML’s daily funding, liquidity risk management, liquidity stress testing, and provision of oversight to the Fixed Income and Equity Finance desks (including setting and monitoring limits).
CGML adheres to Citi's Global Liquidity Risk Management Policy (LRMP) which requires it to define its liquidity risk appetite and operate limit and trigger structures to ensure compliance. CGML is also required to comply with the European Union CRD IV delegated act which sets out certain regulatory qualitative and quantitative standards for managing liquidity. The CGML’s liquidity position is calculated and reported to senior management on a daily basis and reviewed formally by the UK ALCO committee and Board of Directors.
According to the LRMP, CGML is required to prepare a detailed plan of its liquidity position which also considers a forecast of future business activities. This plan is called the Funding and Liquidity Plan (FLP) and it addresses strategic liquidity issues and establishes the parameters for identifying, measuring, monitoring and limiting liquidity risk and sets forth key assumptions for liquidity risk management. The FLP is divided into the following component parts:

14
Contingency Funding Plan (CFP);
Intra-day liquidity risk management plan; and
Balance Sheet Funding and Liquidity Plan.
Further, the Policy requires each entity to establish an appropriate liquidity risk appetite and operate a limit and trigger structures. CGML uses two internal stress tests to monitor its liquidity position. The first stress test covers a 12 month survival horizon in a highly stressed market disruption scenario (S2), whilst the other covers a 30 days horizon in a severely stressed market disruption scenario (LCR Prime). Both LCR Prime and S2 internal liquidity metrics were in surplus as at 30 December 2016.
CGML is also required to comply with the European Commission Delegated Act (2015/16) which sets out certain regulatory qualitative and quantitative standards for managing liquidity. Accordingly, CGML monitors its liquidity position against the European Commission Liquidity Coverage Ratio (LCR). The LCR is designed to promote short term resilience of an entity’s liquidity risk profile by ensuring that it has sufficient high quality liquid assets to survive an acute stress scenario lasting 30 days. Throughout 2016, CGML was in compliance with LCR requirements.
CGML also monitors its position against the Net Stable Funding Ratio (NSFR), adopting Basel III guidelines. Final European Commission rules and standards for the NSFR have not yet been set. The NSFR has a time horizon of one year and has been developed to promote a sustainable maturity structure of assets and liabilities.
The liquidity position for CGML is calculated and reported to senior management on a daily basis and reviewed formally by the UK Asset and Liability Committee (ALCO) and CGML Board of Directors through its risk committee.
2.5 Conduct Risk Management
Citi is exposed to the risk of improper conduct through prohibited and manipulative practices by individual employees, collusive practices across a group of employees within and across market participants, and misconduct that harms customers or the integrity of the markets. Citi’s exposure to conduct risk resulted in the issuance of a Citi-wide Conduct Risk Policy which sets out a framework through which Citi manages, minimises, and mitigates its significant conduct risks, and describes the responsibilities of each of the three lines of defence for complying with the policy.
Citi manages its exposure to conduct risk through the three lines of defence. Each employee in each line of defence is guided by Citi’s Mission and Value Proposition and the principle of Responsible Finance. Citi’s Leadership Standards, which are aligned with Citi’s Mission and Value Proposition, outline Citi’s expectations of employees’ behaviour, and employees’ performance is evaluated against those standards.
In 2015, Citi issued a Conduct Risk Policy to further the objectives of its Compliance-led Conduct Risk Program, which was established in 2014 to enhance Citi’s culture of compliance and control through the management, minimisation and mitigation of Citi’s conduct risks. The Conduct Risk Steering Committee provides governance and strategic direction for the Conduct Risk Program and the Ethics and Culture Committee of the Citigroup Board provides oversight to Management on its conduct and culture program, including the Conduct Risk Program. Under the Conduct Risk Policy, Citi’s businesses and functions are responsible for managing their conduct risks. Compliance advises Citi’s businesses and other functions on conduct risks and associated controls. Internal Audit, among other work, assesses the adequacy and effectiveness of Citi ’s management of and controls ones conduct risk. Citi uses business self-assessment and control function assessments to assess the design and operation of controls that are utilized to manage the institution’s conduct risks. Citi also manages its conduct risk through other initiatives, including various culture-related efforts.

15

16
3. Own Funds
Under the PRA's minimum capital standards, CGML is required to maintain a prescribed excess of own funds over its capital resources requirements. Own funds are measured and reported in accordance with the provisions of the Capital Requirements Regulation (CRR).
Regulatory capital comprises the following distinct elements for CGML:
Common Equity Tier 1 capital, which includes ordinary share capital, retained earnings, and capital reserves;
Tier 2 capital, which includes Long Term Subordinated Debt;
Deductions from capital, which include:
• Intangible assets;
• Certain securitisation and free delivery positions;
• Defined benefit pension assets;
• Prudent valuation adjustments;
• Credit Valuation Adjustments (CVA)
The following table sets out the regulatory capital of CGML as at 31 December 2016 and 31 December 2015.
Table 1: Own Funds
USD millions 2016 2015
Common Equity Tier 1 Capital
Paid up capital instruments 1,500 1,500
Retained earnings 2,381 1,958
Other reserves 9,999 9,989
Deductions
CVA (157) (173)
Prudent valuation adjustments (272) (78)
Other intangible assets (176) (223)
Defined benefit pension fund assets (437) (446)
Securitisation positions (93) (188)
Free deliveries (1) 0
CET1 capital elements or deduction- Other (4)
Total Common Equity Tier 1 Capital 12,744 12,335
Total Additional Tier 1 Capital 0 0
Tier 2 Capital
Paid up capital instruments and subordinated loans 4,585 5,438
Total Tier 2 Capital 4,585 5,438
Total Own Funds, Net of Deductions 17,329 17,773
CET1 Capital Ratio 12.3% 12.0%
Tier 1 Capital Ratio 12.3% 12.0%
Total Capital Ratio 16.7% 17.3%
Further details of the main features of CGML’s capital instruments can be found in Appendix 4.

17
Table 2: Reconciliation of Own funds to the balance sheet
USD millions 2016 2015
Total shareholders funds as reported in the balance sheet 13,880 13,447
Regulatory deductions (1,136) (1,112)
Subordinated liabilities qualifying as Tier 2 4,585 5,438
Total Own Funds 17,329 17,773
18
4. Capital Adequacy
CGML complies with the CRD IV minimum capital requirements to ensure that sufficient capital is maintained to cover all relevant risks and exposures. For this purpose, the firm calculates capital charges for market risk, counterparty risk and operational risk based upon a number of internal models and standardised approaches, as well as recognising a number of credit risk mitigation techniques in calculating the charges for credit and counterparty risk.
To assess the adequacy of capital to support current and expected future activities, the firm produces regular capital forecasts for CGML, taking into account both normal business conditions and a variety of stressed scenarios. On at least an annual basis CGML prepares an Internal Capital Adequacy Assessment Process (ICAAP) document, setting out its risk appetite, capital requirements and associated policies and procedures.
CRD IV also introduces the leverage ratio as an additional capital measurement. The ratio is calculated by dividing Tier 1 capital by the total leverage exposure. The management of leverage risk for CGML is discussed in further detail in Section 4.1.
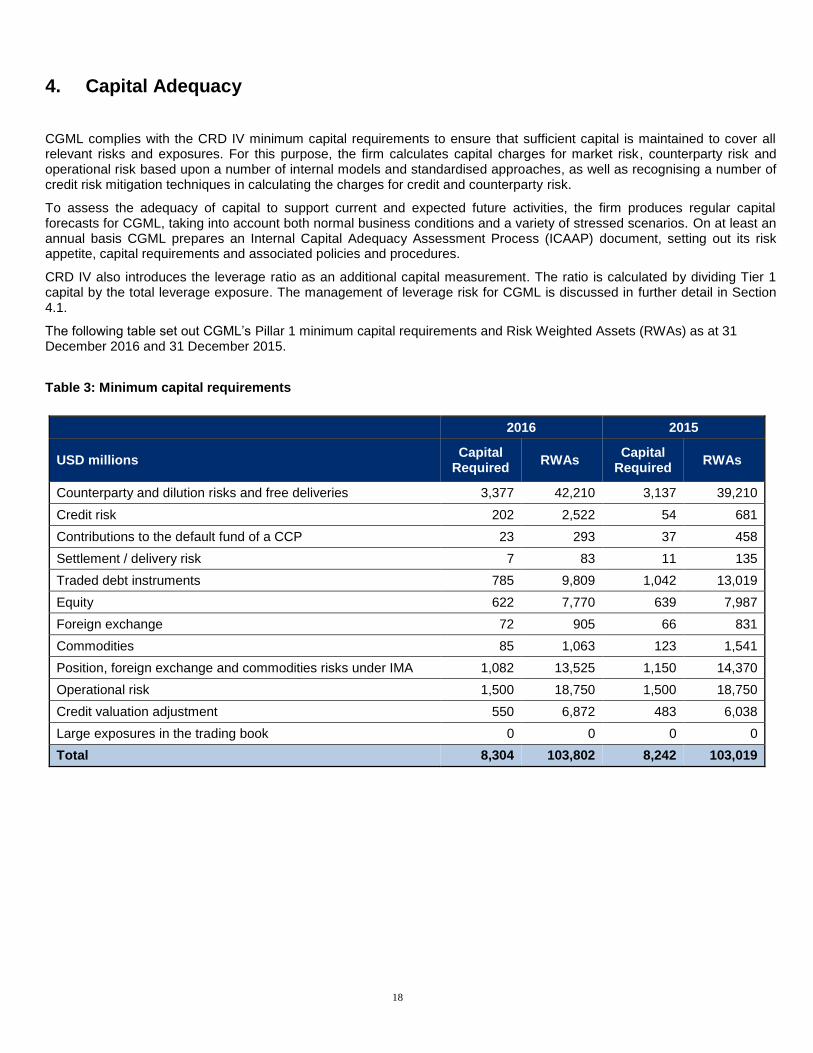
The following table set out CGML’s Pillar 1 minimum capital requirements and Risk Weighted Assets (RWAs) as at 31 December 2016 and 31 December 2015.
Table 3: Minimum capital requirements
2016 2015
USD millions Capital
Required RWAs
Capital Required
RWAs
Counterparty and dilution risks and free deliveries 3,377 42,210 3,137 39,210
Credit risk 202 2,522 54 681
Contributions to the default fund of a CCP 23 293 37 458
Settlement / delivery risk 7 83 11 135
Traded debt instruments 785 9,809 1,042 13,019
Equity 622 7,770 639 7,987
Foreign exchange 72 905 66 831
Commodities 85 1,063 123 1,541
Position, foreign exchange and commodities risks under IMA 1,082 13,525 1,150 14,370
Operational risk 1,500 18,750 1,500 18,750
Credit valuation adjustment 550 6,872 483 6,038
Large exposures in the trading book 0 0 0 0
Total 8,304 103,802 8,242 103,019
19
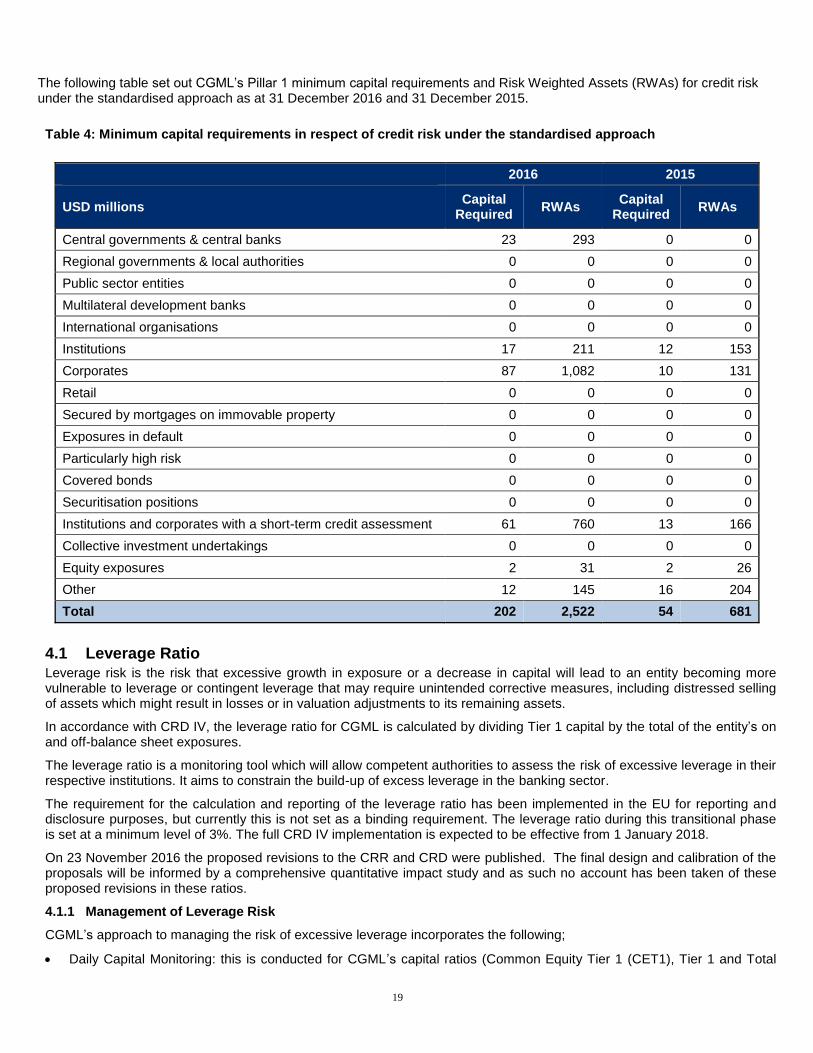
The following table set out CGML’s Pillar 1 minimum capital requirements and Risk Weighted Assets (RWAs) for credit risk under the standardised approach as at 31 December 2016 and 31 December 2015.
Table 4: Minimum capital requirements in respect of credit risk under the standardised approach
2016 2015
USD millions Capital
Required RWAs
Capital Required
RWAs
Central governments & central banks 23 293 0 0
Regional governments & local authorities 0 0 0 0
Public sector entities 0 0 0 0
Multilateral development banks 0 0 0 0
International organisations 0 0 0 0
Institutions 17 211 12 153
Corporates 87 1,082 10 131
Retail 0 0 0 0
Secured by mortgages on immovable property 0 0 0 0
Exposures in default 0 0 0 0
Particularly high risk 0 0 0 0
Covered bonds 0 0 0 0
Securitisation positions 0 0 0 0
Institutions and corporates with a short-term credit assessment 61 760 13 166
Collective investment undertakings 0 0 0 0
Equity exposures 2 31 2 26
Other 12 145 16 204
Total 202 2,522 54 681
4.1 Leverage Ratio Leverage risk is the risk that excessive growth in exposure or a decrease in capital will lead to an entity becoming more vulnerable to leverage or contingent leverage that may require unintended corrective measures, including distressed selling of assets which might result in losses or in valuation adjustments to its remaining assets.
In accordance with CRD IV, the leverage ratio for CGML is calculated by dividing Tier 1 capital by the total of the entity’s on and off-balance sheet exposures.
The leverage ratio is a monitoring tool which will allow competent authorities to assess the risk of excessive leverage in their respective institutions. It aims to constrain the build-up of excess leverage in the banking sector.
The requirement for the calculation and reporting of the leverage ratio has been implemented in the EU for reporting and disclosure purposes, but currently this is not set as a binding requirement. The leverage ratio during this transitional phase is set at a minimum level of 3%. The full CRD IV implementation is expected to be effective from 1 January 2018.
On 23 November 2016 the proposed revisions to the CRR and CRD were published. The final design and calibration of the proposals will be informed by a comprehensive quantitative impact study and as such no account has been taken of these proposed revisions in these ratios.
4.1.1 Management of Leverage Risk
CGML’s approach to managing the risk of excessive leverage incorporates the following;
Daily Capital Monitoring: this is conducted for CGML’s capital ratios (Common Equity Tier 1 (CET1), Tier 1 and Total

20
Capital Ratios). The excess capital over Pillar 1 and Pillar 2 requirements (including the Individual Capital Guidance and Capital Planning Buffer) and over the internal Capital Action Trigger, are also monitored daily. The latter is an internal trigger set to ensure that the entity holds enough of a capital excess to permit timely management decisions in case of short term stresses.
Legal Entity Capital Limits: For CGML there are both legal entity capital usage limits and business specific regulatory capital targets. These limits and targets are subject to detailed monitoring and review by both business and finance subject matter experts and reported to senior management on a weekly basis.
Balance Sheet and Regulatory Capital Quarterly Reforecasts: For CGML there are quarterly reforecasts of the Pillar 1 requirements and balance sheet for all businesses. These forecasts are owned by the businesses and are vetted by the regional Markets head.
All the above tools are monitored and controlled through the monthly UK ALCO process. The UK ALCO is the primary governance committee for the management of CGML’s balance sheet. Amongst the responsibilities of the UK ALCO are the provision of balance sheet oversight of trends and business mix, ensuring prudent legal entity balance sheet management and overseeing the local regulatory requirements related to the balance sheet. The UK ALCO is also responsible for approving CGML’s Funding and Liquidity Plan (FLP) on an annual basis.
Stress Testing: On a weekly basis, the trading books of the entities are stress tested for market risk across a range of scenarios. A trigger has been set for the largest loss of the three 1-in-25 year scenarios that are run weekly, and potential stress losses above this trigger will be escalated to the entity CEO, CRO and Treasurer.
CGML Capital Committee: The monthly CGML Capital Committee is the primary governance committee for the management of CGML’s capital. Responsibilities include approval of the ICAAP and the Pillar 3 document.
The following table sets out CGML’s leverage ratio as at 31 December 2016 and 31 December 2015.
Table 5: Leverage Ratio
USD millions 2016 2015
On-Balance Sheet Exposures (excluding derivatives and SFTs)
On-Balance Sheet Items 70,302 63,440
Asset amounts deducted from tier 1 capital (614) (673)
Total On-Balance Sheet Exposures (excluding derivatives and SFTs) 69,688 62,767
Derivative Exposure
Current replacement cost 21,558 17,579
Add-on for Mark-to-Market Method 97,768 106,510
Exempted leg of client cleared trades (5,590) (2,738)
Adjusted effective notional amount of written credit derivatives 562,446 463,008
Adjusted effective notional amount offsets for written credit derivatives (552,600) (449,340)
Total Derivative Exposure 123,582 135,019
Securities Financing Transaction Exposure
Balance Sheet assets exposure value for SFTs 107,673 93,645
Counterparty credit risk exposure for SFTs 27,216 23,535
Total Securities Financing Transaction Exposure 134,889 117,180
Off-Balance Sheet Exposures 19 0
Total Off-Balance Sheet Exposures 19 0
Total Leverage Exposure 328,178 314,966
Tier 1 Capital 12,744 12,335
Leverage Ratio 3.88% 3.92%

21
The following table sets out a breakdown of CGML’s on-balance sheet exposures in its leverage ratio as at 31 December 2016.
Table 6: Leverage exposure split of on-balance sheet exposures (excluding derivatives, SFT's)
USD millions 2016
Trading book exposures 67,246
Banking book exposures, of which: 3,055
Exposures treated as sovereigns 379
Institutions 130
Corporates 533
Other Exposures 2,013
Total On-balance sheet exposures (excluding derivatives, SFT's) 70,302
The following table set out CGML’s reconciliation of the total assets in its financial statements to leverage exposure for 31 December 2016 and 31 December 2015.
Table 7: Reconciliation of Leverage Exposure to accounting assets¹
USD millions 2016 2015
Total Assets as per the balance sheet 345,608 323,339
Adjustments for Derivatives (44,051) (27,431)
Adjustments for Securities Financing Transactions 27,216 23,535
Adjustment for off-balance sheet items 19 0
Adjustments for items deducted from capital (614) (673)
Other Adjustments 0 (3,804)
Total Leverage Exposure 328,178 314,966
¹In accordance with Article 4 of the commission implementing regulation (EU) 2016/200, the implementing technical standards in regard to the disclosure of the leverage ratio. The total assets as per the balance sheet for CGML are on a solo basis, the group does not publish financial statements at the consolidated level.
4.2 Capital Buffers
Under CRD4 CGML is required to hold additional capital buffers.
The countercyclical capital buffer aims to ensure that capital requirements take into account the macro-financial environment. Its primary objective is to protect the banking sector from periods of excess aggregate credit growth. The designated authorities can set the countercyclical capital buffer rates between 0% and 2.5%.
CGML is required to calculate its institution-specific countercyclical buffer rate as a weighted average of the buffer rates that have been announced for each jurisdiction to which the firm has relevant credit exposures. Relevant credit exposures are as follows;
credit risk
specific risk
incremental default and migration risk (IRC)
securitisations

22
The institution-specific countercyclical buffer rate consists of the weighted average of the countercyclical buffer rates that apply in the jurisdictions where the relevant credit exposures of the institutions are located.
The following table sets out CGML’s countercyclical buffer requirement for 31 December 2016.
Table 8: Geographical distribution of credit exposures relevant for the calculation of the countercyclical buffer
General credit
exposures
Trading book exposure
Own funds requirements
Own funds requirement
weights
Countercyclical capital buffer
rate Breakdown by country
Exposure value for
SA
Sum of long and
short position
of trading book
Value of trading book
exposure for
internal models
Of which: General credit
exposures
Of which: Trading
book exposures
Total
Hong Kong 1,038 103 - 83 8 91 2.74% 0.625%
Norway 127 24 7 6 3 9 0.26% 1.500%
Sweden 393 20 84 29 8 37 1.11% 1.500%
All Other countries 30,694 7,896 3,754 2,240 932 3,172 95.89% 0.000%
Total 32,252 8,043 3,845 2,358 951 3,309 100%
Table 9: Amount of institution-specific countercyclical buffer
Total risk exposure amount (USD millions) 103,802
Institution-specific countercyclical buffer rate 0.038%
Institution-specific countercyclical buffer requirement (USD millions) 39
CGML is also required to hold a capital conservation buffer. The buffer was introduced 1 January 2016 at 0.625% of RWAs. The buffer is scheduled to increase by 0.625% per year until it reaches 2.5% of RWAs on 1 January 2019. The buffer held by CGML as at 31 December 2016 was $649 million.

23
5. Credit Risk
5.1 Credit Risk Management
5.1.1 Overview
Credit risk is the potential for financial loss resulting from the failure of a borrower or counterparty to honour its financial or contractual obligations. Credit risk arises in many of Citigroup’s business activities, as outlined in 2.1.
5.1.2 Corporate Credit Risk
For corporate clients and investment banking activities across the organisation, the credit process is grounded in a series of fundamental policies, as outlined in 2.1.
Wholesale exposures are classifiably-managed (individually rated) and are primarily found in ICG (including Citi Private Bank), as well as Corporate Treasury. Additionally, classifiably-managed exposures are found in certain commercial business lines within GCB and Citi Holdings. Typical financial reporting categories that include wholesale exposures are deposits with banks, debt securities held-to-maturity or available-for-sale, loans and off-balance sheet commitments such as unused commitments to lend and letters of credit.
Wholesale exposures, which include counterparty credit risk exposures arising from OTC derivative contracts, repo-style transactions and eligible margin loans, consist of exposures such as those to corporates, banks, securities firms, financial institutions, central governments, government agencies, local governments, other public sector entities, income producing real estate, high volatility commercial real estate, high net worth individuals not eligible for retail treatment, and other obligor or counterparty types not included in retail.
For regulatory capital purposes, standardised risk weights are applied for wholesale credit risk.
Use of Risk Parameter Estimates
For Citi’s wholesale exposures, internal credit ratings are used in determining approval levels, risk capital and reserves. Each wholesale obligor is assigned an obligor risk rating (ORR) that reflects the one-year probability of default (PD) of the obligor. Each wholesale facility is assigned a facility risk rating (FRR) that reflects the expected loss rate of the facility, the product of the one-year PD and the expected loss given default (LGD) associated with the facility characteristics.
The ORRs are used for longer-term credit assessments for large credit relationships, which form the basis for obligor limits and approval levels. ORRs are established through an integrated framework that combines quantitative and qualitative tools, calibrated and tested across economic cycles, with risk manager expertise of customers, markets and industries. ORRs are generally expected to change in line with material changes in the PD of the obligor. Rating categories are defined consistently across wholesale credit by ranges of PDs and are used to calibrate and objectively test rating models and the final ratings assigned to individual obligors.
Independently-validated models and, in limited cases, external agency ratings establish the starting point in the obligor rating process. The use of external agency ratings in establishing an internal rating occurs when agency ratings have been reviewed against internal rating performance and definitions, and is generally limited to ratings of BBB+/Baa1 or higher.
Internal rating models include statistically-derived models and expert-judgment rating models. The statistical models are developed by an independent analytical team in conjunction with independent Risk Management. The analytical team resides in Credit and Operational Risk Analytics (CORA) which is part of the corporate-level independent risk group. The statistical rating models cover Citi’s corporate segment and certain commercial activity within the consumer business lines and are based on statistically significant financial variables. Expert-judgment rating models, developed by independent Risk Management, cover industry or obligor segments where there are limited defaults or data histories, or highly-specialised or heterogeneous populations.
To the extent that Risk Management believes the applicable model does not capture all the relevant factors affecting the credit risk of an obligor, discretionary adjustments may be applied to derive the final ORR, within limits defined by policy. For larger obligors, the final ORRs are derived through the use of a scorecard that is designed to capture the key risks for the segment.
As discussed above, Citi’s wholesale exposures primarily relate to activities in the ICG. Citi’s ICG businesses that incur credit, market, operational and franchise risk are covered by an ICG Risk Management manual (ICG Risk Manual) which sets forth the ICG’s core risk principles, policy framework, limits, definitions, rules and standards for identifying, measuring, approving and reporting risk.
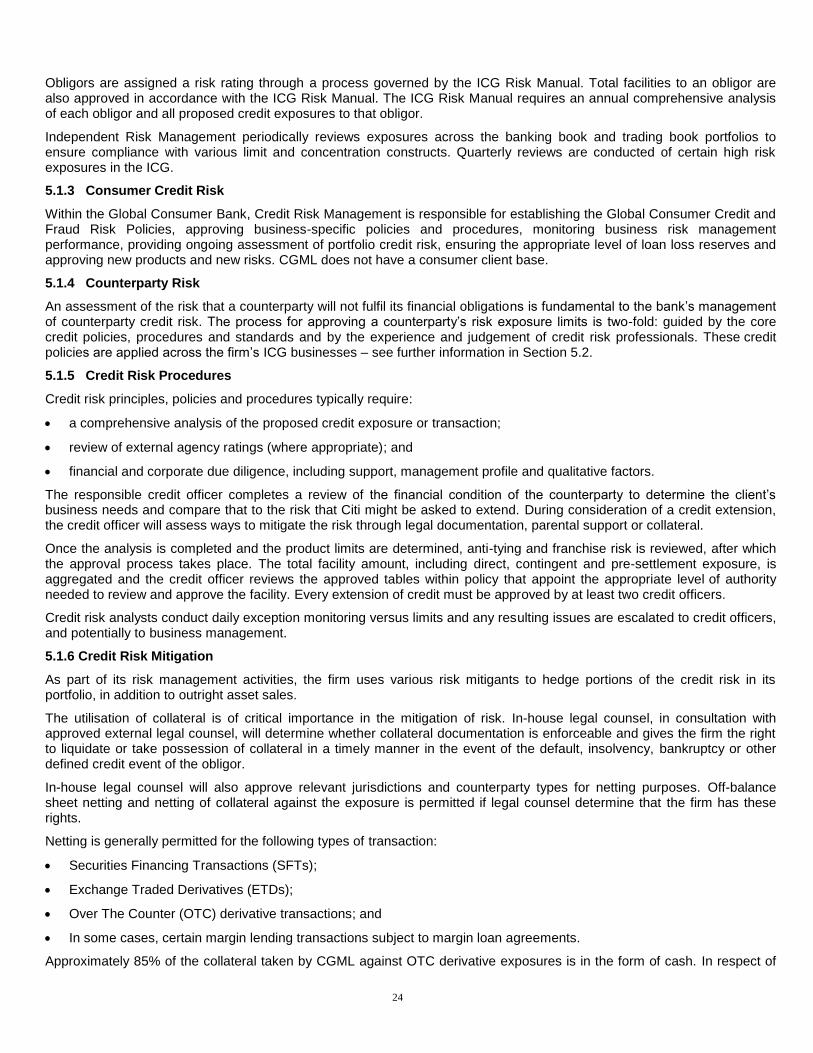
24
Obligors are assigned a risk rating through a process governed by the ICG Risk Manual. Total facilities to an obligor are also approved in accordance with the ICG Risk Manual. The ICG Risk Manual requires an annual comprehensive analysis of each obligor and all proposed credit exposures to that obligor.
Independent Risk Management periodically reviews exposures across the banking book and trading book portfolios to ensure compliance with various limit and concentration constructs. Quarterly reviews are conducted of certain high risk exposures in the ICG.
5.1.3 Consumer Credit Risk
Within the Global Consumer Bank, Credit Risk Management is responsible for establishing the Global Consumer Credit and Fraud Risk Policies, approving business-specific policies and procedures, monitoring business risk management performance, providing ongoing assessment of portfolio credit risk, ensuring the appropriate level of loan loss reserves and approving new products and new risks. CGML does not have a consumer client base.
5.1.4 Counterparty Risk
An assessment of the risk that a counterparty will not fulfil its financial obligations is fundamental to the bank’s management of counterparty credit risk. The process for approving a counterparty’s risk exposure limits is two-fold: guided by the core credit policies, procedures and standards and by the experience and judgement of credit risk professionals. These credit policies are applied across the firm’s ICG businesses – see further information in Section 5.2.
5.1.5 Credit Risk Procedures
Credit risk principles, policies and procedures typically require:
a comprehensive analysis of the proposed credit exposure or transaction;
review of external agency ratings (where appropriate); and
financial and corporate due diligence, including support, management profile and qualitative factors.
The responsible credit officer completes a review of the financial condition of the counterparty to determine the client’s business needs and compare that to the risk that Citi might be asked to extend. During consideration of a credit extension, the credit officer will assess ways to mitigate the risk through legal documentation, parental support or collateral.
Once the analysis is completed and the product limits are determined, anti-tying and franchise risk is reviewed, after which the approval process takes place. The total facility amount, including direct, contingent and pre-settlement exposure, is aggregated and the credit officer reviews the approved tables within policy that appoint the appropriate level of authority needed to review and approve the facility. Every extension of credit must be approved by at least two credit officers.
Credit risk analysts conduct daily exception monitoring versus limits and any resulting issues are escalated to credit officers, and potentially to business management.
5.1.6 Credit Risk Mitigation
As part of its risk management activities, the firm uses various risk mitigants to hedge portions of the credit risk in its portfolio, in addition to outright asset sales.
The utilisation of collateral is of critical importance in the mitigation of risk. In-house legal counsel, in consultation with approved external legal counsel, will determine whether collateral documentation is enforceable and gives the firm the right to liquidate or take possession of collateral in a timely manner in the event of the default, insolvency, bankruptcy or other defined credit event of the obligor.
In-house legal counsel will also approve relevant jurisdictions and counterparty types for netting purposes. Off-balance sheet netting and netting of collateral against the exposure is permitted if legal counsel determine that the firm has these rights.
Netting is generally permitted for the following types of transaction:
Securities Financing Transactions (SFTs);
Exchange Traded Derivatives (ETDs);
Over The Counter (OTC) derivative transactions; and
In some cases, certain margin lending transactions subject to margin loan agreements.
Approximately 85% of the collateral taken by CGML against OTC derivative exposures is in the form of cash. In respect of
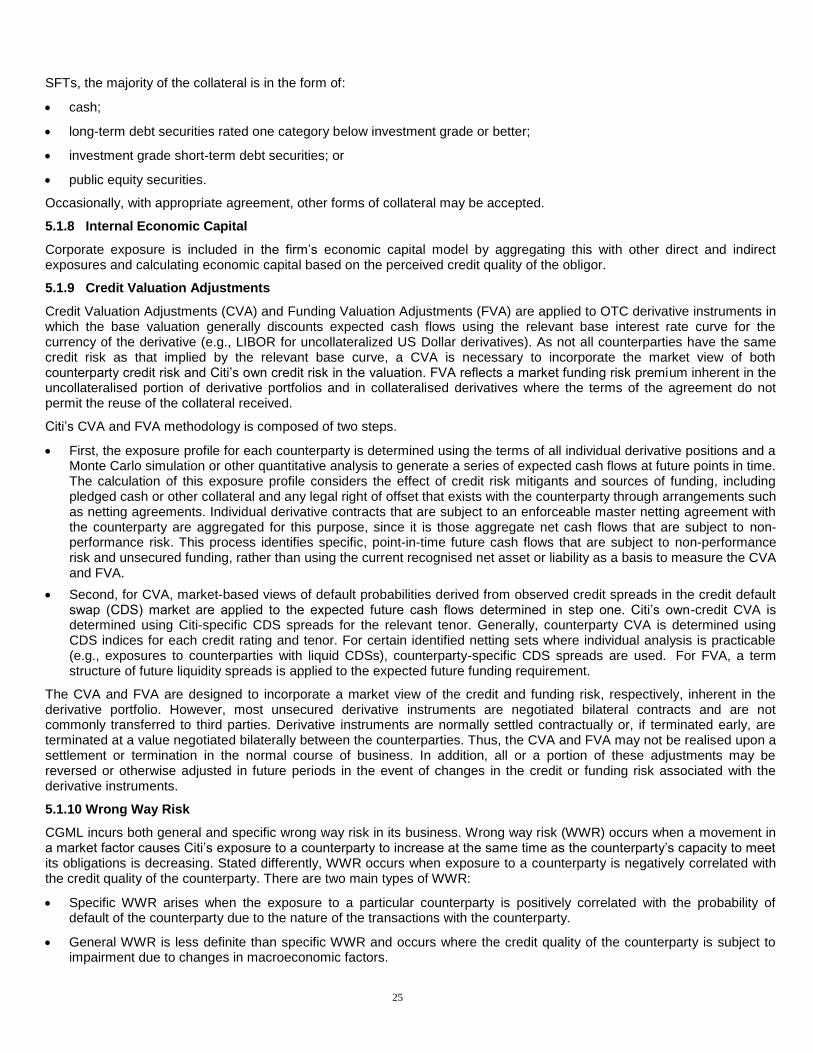
25
SFTs, the majority of the collateral is in the form of:
cash;
long-term debt securities rated one category below investment grade or better;
investment grade short-term debt securities; or
public equity securities.
Occasionally, with appropriate agreement, other forms of collateral may be accepted.
5.1.8 Internal Economic Capital
Corporate exposure is included in the firm’s economic capital model by aggregating this with other direct and indirect exposures and calculating economic capital based on the perceived credit quality of the obligor.
5.1.9 Credit Valuation Adjustments
Credit Valuation Adjustments (CVA) and Funding Valuation Adjustments (FVA) are applied to OTC derivative instruments in which the base valuation generally discounts expected cash flows using the relevant base interest rate curve for the currency of the derivative (e.g., LIBOR for uncollateralized US Dollar derivatives). As not all counterparties have the same credit risk as that implied by the relevant base curve, a CVA is necessary to incorporate the market view of both counterparty credit risk and Citi’s own credit risk in the valuation. FVA reflects a market funding risk premium inherent in the uncollateralised portion of derivative portfolios and in collateralised derivatives where the terms of the agreement do not permit the reuse of the collateral received.
Citi’s CVA and FVA methodology is composed of two steps.
First, the exposure profile for each counterparty is determined using the terms of all individual derivative positions and a Monte Carlo simulation or other quantitative analysis to generate a series of expected cash flows at future points in time. The calculation of this exposure profile considers the effect of credit risk mitigants and sources of funding, including pledged cash or other collateral and any legal right of offset that exists with the counterparty through arrangements such as netting agreements. Individual derivative contracts that are subject to an enforceable master netting agreement with the counterparty are aggregated for this purpose, since it is those aggregate net cash flows that are subject to non-performance risk. This process identifies specific, point-in-time future cash flows that are subject to non-performance risk and unsecured funding, rather than using the current recognised net asset or liability as a basis to measure the CVA and FVA.
Second, for CVA, market-based views of default probabilities derived from observed credit spreads in the credit default swap (CDS) market are applied to the expected future cash flows determined in step one. Citi’s own-credit CVA is determined using Citi-specific CDS spreads for the relevant tenor. Generally, counterparty CVA is determined using CDS indices for each credit rating and tenor. For certain identified netting sets where individual analysis is practicable (e.g., exposures to counterparties with liquid CDSs), counterparty-specific CDS spreads are used. For FVA, a term structure of future liquidity spreads is applied to the expected future funding requirement.
The CVA and FVA are designed to incorporate a market view of the credit and funding risk, respectively, inherent in the derivative portfolio. However, most unsecured derivative instruments are negotiated bilateral contracts and are not commonly transferred to third parties. Derivative instruments are normally settled contractually or, if terminated early, are terminated at a value negotiated bilaterally between the counterparties. Thus, the CVA and FVA may not be realised upon a settlement or termination in the normal course of business. In addition, all or a portion of these adjustments may be reversed or otherwise adjusted in future periods in the event of changes in the credit or funding risk associated with the derivative instruments.
5.1.10 Wrong Way Risk
CGML incurs both general and specific wrong way risk in its business. Wrong way risk (WWR) occurs when a movement in a market factor causes Citi’s exposure to a counterparty to increase at the same time as the counterparty’s capacity to meet its obligations is decreasing. Stated differently, WWR occurs when exposure to a counterparty is negatively correlated with the credit quality of the counterparty. There are two main types of WWR:
Specific WWR arises when the exposure to a particular counterparty is positively correlated with the probability of default of the counterparty due to the nature of the transactions with the counterparty.
General WWR is less definite than specific WWR and occurs where the credit quality of the counterparty is subject to impairment due to changes in macroeconomic factors.

26
WWR in a trading exposure arises when there is significant correlation between the underlying asset and the counterparty which, in the event of default, would lead to a significant mark-to-market loss. The interdependence between the counterparty credit exposure and underlying reference asset or collateral for each transaction can exacerbate and magnify the speed in which a portfolio deteriorates. Thus, the goal of Citi’s WWR policy is to provide best practices and guidelines for the identification, approval, reporting and mitigation of specific and general WWR.
WWR is monitored at a Company level and includes circulation of a monthly report that identifies CDS-based, OTC or SFT transactions that generate specific wrong-way risk. Wrong-way risk is mitigated through the use of enforceable netting agreements, margining and offsetting or terminating transactions.
Citi’s WWR policy further mandates ongoing product stress testing to identify potential general WWR using simulated macro-economic scenarios. General WWR reports are reviewed on an ongoing basis by senior management to determine appropriate management and mitigation.
5.1.11 Credit Ratings Downgrade
party to collateralised OTC derivative contracts in which a downgrade of the firm will give rise to the obligation to post additional collateral to the counterparty.
The actual amount of collateral which CGML would be required to provide to third parties in such an event depends on the net exposure to those counterparties at that time and varies according to the current market value of the contracts outstanding.
These risks are captured as part of Citi’s liquidity risk management framework.
5.2 Counterparty Risk
The following table summarise the counterparty credit risk exposures arising from derivatives held by CGML as at 31 December 2016 and 31 December 2015, indicating the benefits of legally enforceable netting agreements and collateral arrangements.
Table 10: Derivative Exposures
USD millions 2016 2015
Gross positive fair value of contracts 357,964 379,924
Netting benefits (287,167) (323,918)
Netted credit exposure 70,798 56,006
Benefits of collateral (24,547) (20,986)
Net derivatives credit exposure 46,250 35,020
5.2.1 Counterparty Credit Risk Exposures
Counterparty credit risk is the risk that the counterparty to a transaction will default before the final settlement of the transaction's cash flows. For OTC derivatives, counterparty credit risk arises from pre-settlement exposures. CGML calculates its exposures under two methods:
The Internal Models Method (IMM); and
The Current Exposure Method (CEM).
CGML’s ETD’s are calculates under CEM.
Two conditions are required for Citi to recognise a loss on a contract: firstly the counterparty defaults and, secondly, the contract has a positive market value to the firm. Consequently risk measurement is a function of three elements:
Potential Future Exposure;
Probability of Default; and
Loss at Default.
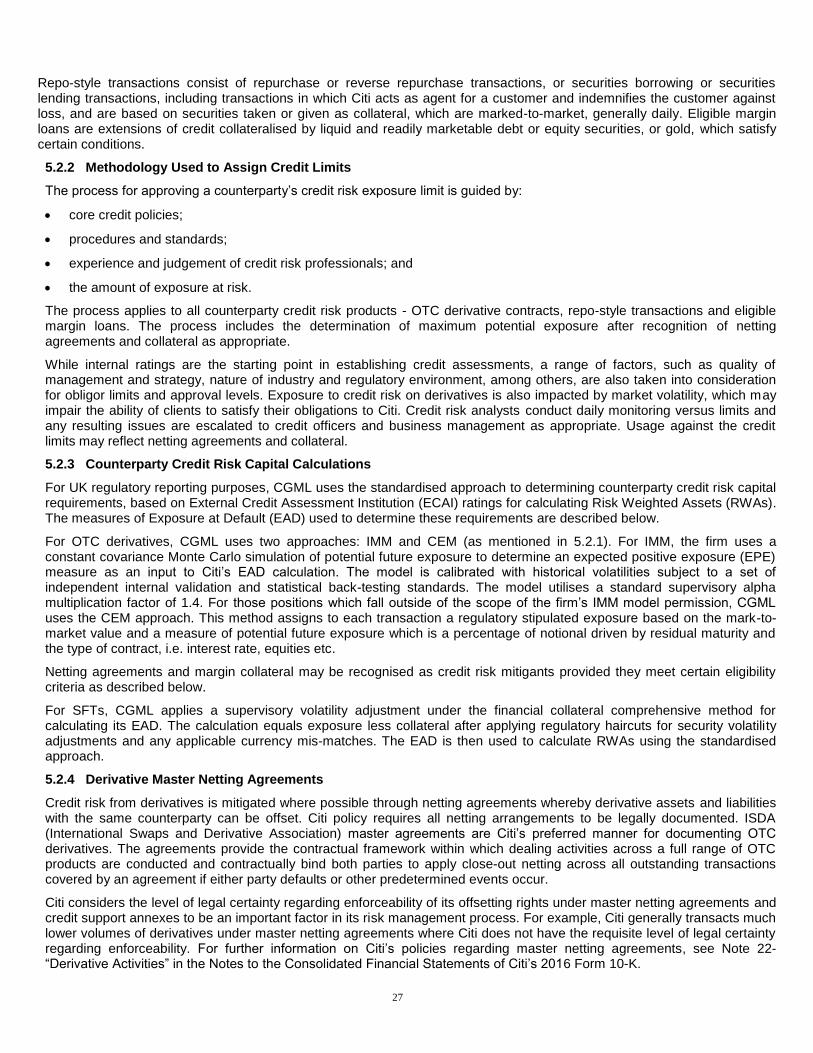
27
Repo-style transactions consist of repurchase or reverse repurchase transactions, or securities borrowing or securities lending transactions, including transactions in which Citi acts as agent for a customer and indemnifies the customer against loss, and are based on securities taken or given as collateral, which are marked-to-market, generally daily. Eligible margin loans are extensions of credit collateralised by liquid and readily marketable debt or equity securities, or gold, which satisfy certain conditions.
5.2.2 Methodology Used to Assign Credit Limits
The process for approving a counterparty’s credit risk exposure limit is guided by:
core credit policies;
procedures and standards;
experience and judgement of credit risk professionals; and
the amount of exposure at risk.
The process applies to all counterparty credit risk products - OTC derivative contracts, repo-style transactions and eligible margin loans. The process includes the determination of maximum potential exposure after recognition of netting agreements and collateral as appropriate.
While internal ratings are the starting point in establishing credit assessments, a range of factors, such as quality of management and strategy, nature of industry and regulatory environment, among others, are also taken into consideration for obligor limits and approval levels. Exposure to credit risk on derivatives is also impacted by market volatility, which may impair the ability of clients to satisfy their obligations to Citi. Credit risk analysts conduct daily monitoring versus limits and any resulting issues are escalated to credit officers and business management as appropriate. Usage against the credit limits may reflect netting agreements and collateral.
5.2.3 Counterparty Credit Risk Capital Calculations
For UK regulatory reporting purposes, CGML uses the standardised approach to determining counterparty credit risk capital requirements, based on External Credit Assessment Institution (ECAI) ratings for calculating Risk Weighted Assets (RWAs). The measures of Exposure at Default (EAD) used to determine these requirements are described below.
For OTC derivatives, CGML uses two approaches: IMM and CEM (as mentioned in 5.2.1). For IMM, the firm uses a constant covariance Monte Carlo simulation of potential future exposure to determine an expected positive exposure (EPE) measure as an input to Citi’s EAD calculation. The model is calibrated with historical volatilities subject to a set of independent internal validation and statistical back-testing standards. The model utilises a standard supervisory alpha multiplication factor of 1.4. For those positions which fall outside of the scope of the firm’s IMM model permission, CGML uses the CEM approach. This method assigns to each transaction a regulatory stipulated exposure based on the mark-to-market value and a measure of potential future exposure which is a percentage of notional driven by residual maturity and the type of contract, i.e. interest rate, equities etc.
Netting agreements and margin collateral may be recognised as credit risk mitigants provided they meet certain eligibility criteria as described below.
For SFTs, CGML applies a supervisory volatility adjustment under the financial collateral comprehensive method for calculating its EAD. The calculation equals exposure less collateral after applying regulatory haircuts for security volatility adjustments and any applicable currency mis-matches. The EAD is then used to calculate RWAs using the standardised approach.
5.2.4 Derivative Master Netting Agreements
Credit risk from derivatives is mitigated where possible through netting agreements whereby derivative assets and liabilities with the same counterparty can be offset. Citi policy requires all netting arrangements to be legally documented. ISDA (International Swaps and Derivative Association) master agreements are Citi’s preferred manner for documenting OTC derivatives. The agreements provide the contractual framework within which dealing activities across a full range of OTC products are conducted and contractually bind both parties to apply close-out netting across all outstanding transactions covered by an agreement if either party defaults or other predetermined events occur.
Citi considers the level of legal certainty regarding enforceability of its offsetting rights under master netting agreements and credit support annexes to be an important factor in its risk management process. For example, Citi generally transacts much lower volumes of derivatives under master netting agreements where Citi does not have the requisite level of legal certainty regarding enforceability. For further information on Citi’s policies regarding master netting agreements, see Note 22- “Derivative Activities” in the Notes to the Consolidated Financial Statements of Citi’s 2016 Form 10-K.

28
5.2.5 Policies for Securing, Valuing and Managing Collateral
Citi’s policies and procedures cover management and governance of financial assets (including securing and valuing collateral) utilised for the purpose of mitigating the credit risk of OTC derivatives, repo-style transactions and eligible margin loans. Specifically, businesses are required to establish standard eligibility criteria for collateral usage and review processes for approving non-standard collateral. Industry standard legal agreements combined with internal reviews for legal enforceability are used to achieve a perfected security interest in the collateral. Additionally, Risk Management establishes guidelines on appropriate collateral haircuts related to repo-style transactions and eligible margin loans. A haircut is the percentage of reduction in current market value applicable to each type of collateral and is largely based on liquidity and price volatility of the underlying security. Potential correlations between the exposure and the underlying collateral are reflected through the setting of appropriately greater haircuts.
The current market value of collateral is monitored on a regular basis. Margin procedures are established for managing margin calls for which daily margining is considered best practice in order to maintain an appropriate level of collateral coverage reflecting market value fluctuations. Trades are reconciled on a regular basis that is consistent with regulatory and industry best practice guidelines and margin dispute processes are in place. Procedures are established surrounding collateral substitution and collateral re-use/re-hypothecation. Limits and concentration monitoring are utilised to control Citi’s collateral concentrations to different types of asset classes.
Additionally, for eligible margin loans, procedures are established to ensure an appropriate level of allowance for credit losses.
5.2.6 Primary Types of Collateral
Cash collateral and security collateral in the form of G10 (Group of Ten) government debt securities are generally posted to secure the net open exposure of OTC derivative transactions, at a counterparty level, whereby the receiving party is free to co-mingle or re-hypothecate such collateral in the ordinary course of business. Non-standard collateral, such as corporate bonds, municipal bonds, U.S. agency securities and mortgage-backed securities, may also be pledged as collateral for OTC derivative transactions. Collateral posted to open and maintain a master netting agreement with a counterparty in the form of cash and securities may from time to time be segregated in an account at a third-party custodian pursuant to a tri-party account control agreement.
With respect to SFTs, the majority of the collateral is in the form outlined in 5.1.6.
5.2.7 Credit Default Swap Activity
The following table sets out the notional value of CGML’s CDS transactions as per the CRR article 439. The table is as at 31 December 2016 and 31 December 2015.
Table 11: Notional value of CGML’s CDS Transactions
2016 2015
USD millions
Protection Bought
Protection Sold
Protection Bought
Protection Sold
Index CDS 284,041 284,538 181,787 181,610
Single name and other CDS 281,439 277,909 284,130 283,635
Total 565,481 562,446 465,917 465,244
5.3 Credit Risk
5.3.1 Credit Exposures
The total amount of CGML’s exposures after accounting offsets and without taking into account the effects of credit risk mitigation are set out below as at 31 December 2016 and 31 December 2015. These exposures have been calculated in accordance with the relevant regulatory requirements.
Further information on the benefits of netting and collateral for these positions is shown in section 5.2.
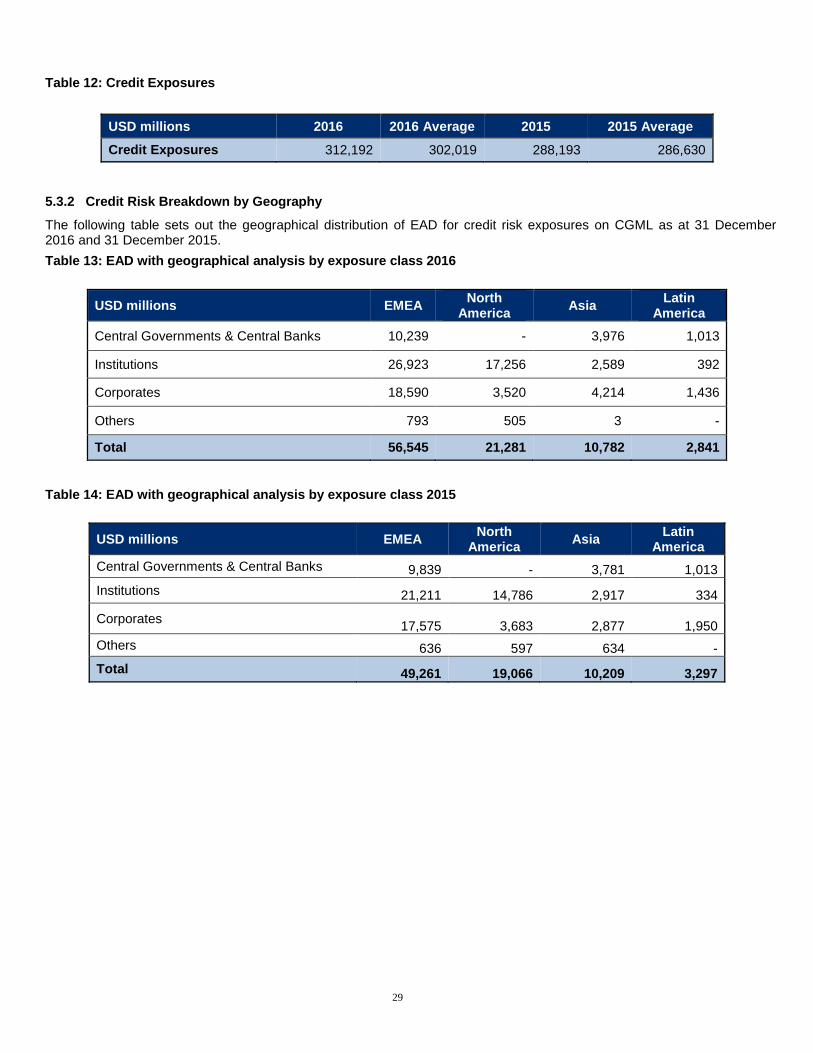
29
Table 12: Credit Exposures
USD millions 2016 2016 Average 2015 2015 Average
Credit Exposures 312,192 302,019 288,193 286,630
5.3.2 Credit Risk Breakdown by Geography
The following table sets out the geographical distribution of EAD for credit risk exposures on CGML as at 31 December 2016 and 31 December 2015.
Table 13: EAD with geographical analysis by exposure class 2016
USD millions EMEA North
America Asia
Latin America
Central Governments & Central Banks 10,239 - 3,976 1,013
Institutions 26,923 17,256 2,589 392
Corporates 18,590 3,520 4,214 1,436
Others 793 505 3 -
Total 56,545 21,281 10,782 2,841
Table 14: EAD with geographical analysis by exposure class 2015
USD millions EMEA North
America Asia
Latin America
Central Governments & Central Banks 9,839 - 3,781 1,013
Institutions 21,211 14,786 2,917 334
Corporates 17,575 3,683 2,877 1,950
Others 636 597 634 -
Total 49,261 19,066 10,209 3,297

30
5.3.3 Credit risk breakdown by sector
The following tables set out the sector distribution of EAD for credit risk exposures on CGML as at 31 December 2016 and 31 December 2015.
Table 15: EAD with sector analysis
USD millions 2016 2015
Financial non-bank 40,985 37,351
Financial banks 22,764 19,287
Sovereign and government 16,163 16,264
Insurance and pension funds 7,036 5,581
Transport, utilities and storage 2,224 1,564
Manufacturing 775 744
Wholesale and retail trade 740 650
Mining and quarrying 493 125
Information and communication 128 75
Services 78 87
Real estate activities 29 44
Professional, scientific and technical activities 28 42
Construction 5 20
Total 91,449 81,833
5.3.4 Credit risk breakdown by maturity
The following tables set out the residual maturity distribution of EAD for credit risk exposures on CGML as at 31 December 2016 and 31 December 2015.
Table 16: EAD with maturity breakdown by exposure class as at 31 December 2016
USD millions Under 1 Year 1-5 Years Over 5 Years
Central Governments & Central Banks 14,841 236 151
Institutions 29,238 11,317 6,605
Corporates 22,079 3,593 2,088
Others 1,005 175 121
Total 67,163 15,321 8,965
Table 17: EAD with maturity breakdown by exposure class as at 31 December 2015
USD millions Under 1 Year 1-5 Years Over 5 Years
Central Governments & Central Banks 14,265 348 20
Institutions 24,812 9,404 5,032
Corporates 21,291 2,809 1,985
Others .
1,547 158 162
Total 61,915 12,719 7,199

31
5.3.5 Impairment
5.3.5.1 Impairment of Financial Assets
Under International Financial Reporting Standards (IFRS), the firm assesses whether there is objective evidence that a financial asset or a portfolio of financial assets is impaired on an ongoing basis (including at each balance sheet date). A financial asset or portfolio of financial assets is impaired and impairment losses are incurred if, and only if, there is objective evidence of impairment as a result of one or more loss events that occurred after the initial recognition of the asset and prior to the balance sheet date (“a loss event”) and that loss event has had an impact on the estimated future cash flows of the financial asset or the portfolio that can be reliably estimated. Objective evidence that a financial asset or a portfolio is impaired includes observable data that comes to the attention of the firm about the following loss events:
Significant financial difficulty of the issuer or obligor;
A breach of contract, such as a default or delinquency in interest or principal payments;
The firm as lender, for economic or legal reasons relating to the borrower’s financial difficulty, grants to the borrower a concession that the firm would not otherwise consider;
It becomes probable that the borrower will enter bankruptcy or other financial reorganisation;
The disappearance of an active market for that financial asset because of financial difficulties; and
Observable data indicating that there is a measurable decrease in the estimated future cash flows from a portfolio of financial assets since the initial recognition of those assets, although the decrease cannot yet be identified with the individual financial assets in the portfolio, including:
adverse changes in the payment status of borrowers in the portfolio;
national or local economic conditions that correlate with defaults on the assets in the portfolio.
The firm first assesses whether objective evidence of impairment exists:
individually, for financial assets that are individually significant; and
individually or collectively, for financial assets that are not individually significant.
If the firm determines that no objective evidence of impairment exists for an individually assessed financial asset, whether significant or not, it includes the asset in a group of financial assets with similar credit risk characteristics and collectively assesses them for impairment. Assets that are individually assessed for impairment and for which an impairment loss is recognised are not included in a collective assessment of impairment.
Following impairment, interest income is recognised using the original effective interest rate which is used to discount the future cash flows for the purpose of measuring the impairment loss.
For the purposes of the collective evaluation of impairment, financial assets are grouped on the basis of similar credit risk characteristics by using a grading process that considers obligor type, industry, geographical location, collateral type, past due status and other relevant factors. These characteristics are relevant to the estimation of future cash flows for groups of such assets by being indicative of the likelihood of receiving all amounts due under a facility according to the contractual terms of the assets being evaluated.
Future cash flows in a group of financial assets that are collectively evaluated for impairment are estimated on the basis of the contractual cash flows of the assets in the group and historical loss experience for assets with credit risk characteristics similar to those of the group.
If, in a subsequent period, the amount of the impairment loss decreases and the decrease can be related objectively to an event occurring after the impairment was recognised, the previously recognised impairment loss is reversed by adjusting the allowance account. The amount of the reversal is recognised in the income statement.
In the case of equity instruments classified as available for sale, a significant or prolonged decline in the fair value of the security below its cost is also considered in determining whether impairment exists. Where such evidence exists, the cumulative net loss that has been previously recognised directly in equity is removed from equity and recognised in the income statement.
In the case of debt instruments classified as available for sale, impairment is assessed based on the same criteria as for assets held at amortised cost. However, impairment charges are recorded as the entire cumulative net loss that has previously been recognised directly in equity. Reversals of impairment of debt securities are recognised in the income

32
statement. Reversals of impairment of equity shares are not recognised in the income statement. Increases in the fair value of equity shares after impairment are recognised directly in equity.
5.3.5.2 Wholesale Impairment
Rather than measuring delinquency for a wholesale customer or for a facility to that customer by the number of days past due, impaired wholesale credit exposures are classified as either substandard or doubtful:
Substandard
A substandard asset is inadequately protected by the current sound worth and paying capacity of the obligor. Assets so classified must have a well-defined weakness, or weaknesses, that jeopardise the timely repayment of its obligations.
Doubtful
An asset classified as doubtful has all the weaknesses inherent in one classified as substandard with the added characteristic that the weaknesses make collection or liquidation in full, on the basis of currently existing facts, conditions and values, highly questionable and improbable.
The value of the wholesale exposures in these categories on CGML as at 31 December 2016 and 31 December 2015 are shown in the table below.
Table 18: Impaired Wholesale Exposures
USD millions 2016 2015
Substandard 183 116
Doubtful (73)1 118
Total 110 235
These numbers include counterparty exposures arising from OTC derivatives and SFTs. Given the relatively small number of obligors which are classified as doubtful or substandard, no further geographical or product analysis of these amounts is provided for reasons of materiality.
5.3.5.3 Retail Impairment
CGML has no retail exposure.
5.3.5.4 Movements in Impaired Exposures
Where assets are held at fair value, typically in the trading book, part of the fair value movement relates to credit exposure. However it is not always practicable to determine what portion of the fair value movement relates to credit exposures, and hence no such disclosure is provided for these assets.
1The $73m showing as doubtful exposure at 31 December 2016 is shown as negative. The reserves taken are greater than the exposure
to the counterparties.

33
5.4 Credit Quality Analysis
Standardised Credit Risk Exposures
The nominated ECAIs used by the firm are Standard and Poor’s, Moody’s and Fitch. These are used for all credit risk exposure classes. Credit assessments applied to items in the trading book and banking book alike are assigned in accordance with the requirements of CRD IV. The credit quality assessment scale assigns a credit quality step, as set out in the table below.
Table 19: Credit quality assessment scale
Credit Quality
Step Standard &
Poor’s Moody’s Fitch
Step 1 AAA to AA- Aaa to Aa3 AAA to AA-
Step 2 A+ to A- A1 to A3 A+ to A-
Step 3 BBB+ to BBB- Baa1 to Baa3 BBB+ to BBB-
Step 4 BB+ to BB- Ba1 to Ba3 BB+ to BB-
Step 5 B+ to B- B1 to B3 B+ to B-
Step 6 CCC+ and below Caa1 and below CCC+ and below
Risk weightings are assigned to each exposure depending on its credit quality step and other factors, including exposure class and maturity. Exposures for which no rating is available are treated in a similar way to those under Credit Quality Step 3. The table below sets out a simplified summary of how credit quality is linked to risk weighting.
Table 20: Simplified summary of risk weightings by Credit Quality Step
Credit Quality Step
Governments and Central Banks
Corporates Institutions >3
Months Maturity
Step 1 0% 20% 20%
Step 2 20% 50% 50%
Step 3 50% 100% 50%
Step 4 100% 100% 100%
Step 5 100% 150% 100%
Step 6 150% 150% 150%
The table on the following page sets out the exposure values for CGML as at 31 December 2016 and 31 December 2015 (before and after credit risk mitigation) associated with each exposure class and credit quality step.

34
Table 21: Credit Quality Step analysis of Exposure before and after Credit Risk Mitigation
2016 2015
USD millions Credit
Quality Step Gross Net Gross Net
Central Governments & Central Banks 1 30,800 10,875 32,382 14,190
2 3,947 3,840 81 38
3 40 7 844 208
4 512 161 526 176
5 345 345 21 21
Unrated 3 1 2 0
Total 35,648 15,229 33,855 14,634
Regional Governments & Local Authorities 1 121 117 178 178
2 41 41 120 119
3 9 9 8 8
4 6 6 1 1
Unrated 935 566 802 671
Total 1,111 739 1,109 976
Public Sector Entities 1 105 105 42 14
Unrated 91 91 640 640
Total 196 196 682 654
Multilateral Development Banks 1 0 0 2 2
Total 0 0 2 2
Institutions 1 6,708 1,846 6,587 1,778
2 56,483 20,386 82,129 23,275
3 7,275 2,616 3,676 1,212
4 445 94 355 144
5 546 174 382 171
6 388 13 7 1
Unrated 70,317 17,905 61,858 11,781
Total 142,162 43,034 154,995 38,362
Corporates 1 1,657 507 1,605 674
2 5,920 837 8,774 781
3 6,399 2,559 6,346 2,315
4 462 130 356 91
5 36 36 11 11
6 0 0 0 0
Unrated 88,827 23,605 78,645 22,119
Total 103,300 27,673 95,737 25,990
Institutions and Corporates with a Short Term Credit Assessment
1 28,835 3,826 599 272
2 104 28 898 665
3 73 73 45 44
4 285 285 0 0
Total 29,297 4,212 1,542 981
Collective Investment Undertakings Unrated 310 200 89 52
Total 310 200 89 52
Equity Exposures 2 0 0 2 2
Unrated 31 31 25 25
Total 31 31 27 27
Other items Unrated 136 136 155 155
Total 136 136 155 155
Total 312,193 91,449 288,193 81,833

35
5.5 Credit Risk Mitigation
As part of its risk management activities, Citi uses various risk mitigants to hedge portions of the credit risk in its portfolios, in addition to outright asset sales. Credit risk mitigation, including netting, collateral and other techniques, is important to Citi in the effective management of its credit risk exposures.
Generally, in consultation with legal counsel, Citi determines whether collateral documentation is legally enforceable and gives Citi the right to liquidate or take possession of collateral in a timely manner in the event of the default, insolvency, bankruptcy or other defined credit event of the obligor. Also in consultation with legal counsel, Citi approves relevant jurisdictions and counterparty types for netting purposes. Off-balance sheet netting and netting of the collateral against the exposure is permitted under approved circumstances.
Valuation
Collateral valuations must be completed daily for SFTs, OTC derivatives and margin lending by the relevant operations units and collateral/margin departments. Collateral haircuts are applied in a number of circumstances, such as where there is a material positive correlation between the credit quality of the counterparty and the value of the collateral, or where there are currency or maturity mismatches. The firm has sound and well managed systems and procedures for requesting and promptly receiving additional collateral for transactions whose terms require maintenance of collateral values at specified thresholds as documented in the respective legal agreements.
Reporting
The firm has procedures in place to ensure that appropriate information is available to support the collateral process and that timely and accurate margin calls feed correctly into the margin applications from upstream systems. Key to the process is a daily credit exposure report as well as reports identifying counterparties that have not met their requirement for additional collateral to satisfy specified initial margin amounts and variation margin thresholds. In addition, there is firm wide risk reporting of counterparty exposures at an individual and an aggregate level.
Collateral Concentrations
Apart from the concentration of cash as the predominant form of collateral accepted in respect of margined OTC derivative transactions and sovereign government bonds within SFTs, there were no other material concentrations of collateral as at 31 December 2016.
Other Forms of Credit Risk Mitigation
CGML does not generally use credit derivatives to mitigate its counterparty risk exposure, but Citi does use credit derivatives for this purpose when exposure is viewed at a global level, and such hedging is carried out by certain US affiliate companies.
Exposures
The following tables set out the exposures covered by credit risk mitigation in the calculation of RWAs under the standardised approach as at 31 December 2016 and 31 December 2015. The tables do not include the benefits of modelling collateral in respect of OTC derivative exposures covered by CGML’s IMM permission, which are described in other sections of this disclosure.
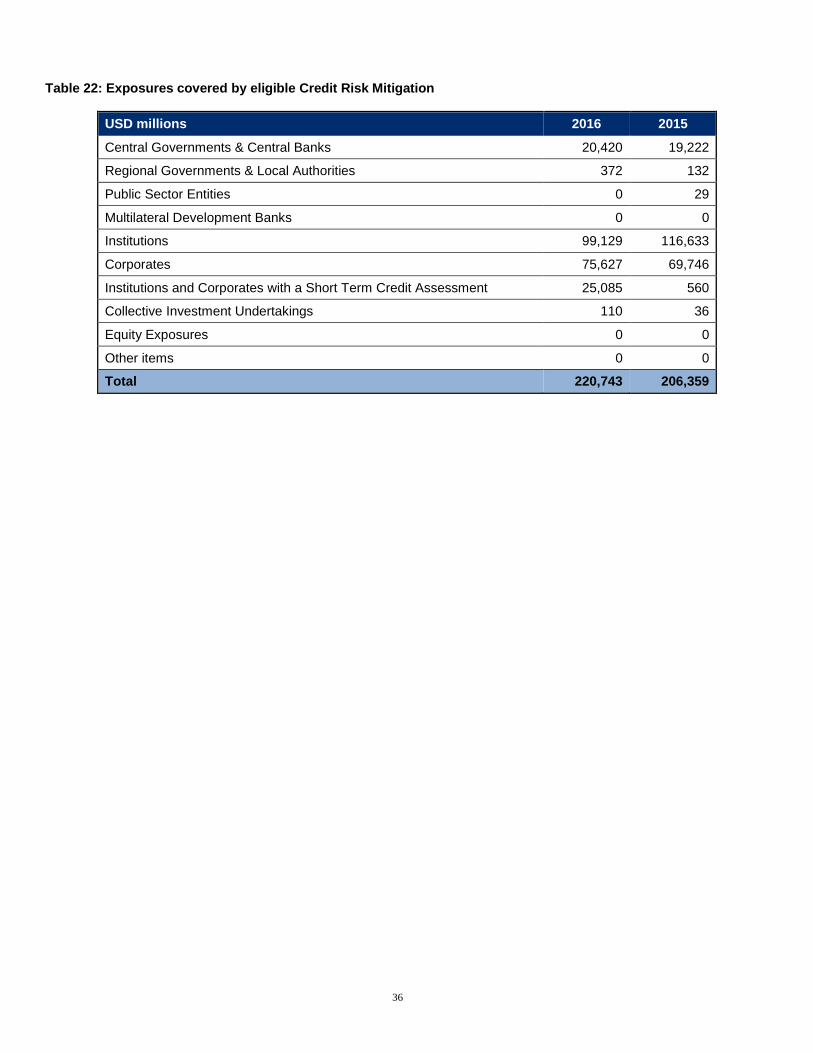
36
Table 22: Exposures covered by eligible Credit Risk Mitigation
USD millions 2016 2015
Central Governments & Central Banks 20,420 19,222
Regional Governments & Local Authorities 372 132
Public Sector Entities 0 29
Multilateral Development Banks 0 0
Institutions 99,129 116,633
Corporates 75,627 69,746
Institutions and Corporates with a Short Term Credit Assessment 25,085 560
Collective Investment Undertakings 110 36
Equity Exposures 0 0
Other items 0 0
Total 220,743 206,359
37
6. Market Risk
In accordance with an Internal Model Approach (IMA) permission granted by the PRA, CGML utilises risk models (VaR, SVaR and IRC) to determine the own funds capital requirement for market risk for a number of its businesses.
The market risk capital requirements of CGML are summarised in Section 4 (Capital Adequacy). Market Risk is responsible for a significant proportion of CGML’s overall capital requirements.
6.1 Market Risk Management
Price risk in trading portfolios is monitored by the firm using a series of measures, including:
Factor sensitivities;
VaR;
Stress testing.
In addition, CGML has a defined risk appetite framework which is supplemented by regular stress testing and daily monitoring against the VaR limit with monthly and quarterly reporting to senior management and the Board of Directors respectively.
Each business that uses the CGML in client facing transactions is required to establish, with approval from the independent market risk management function, a market risk limit framework for identified risk factors. This framework must clearly define approved risk profiles, include permitted product lists, and must remain within the parameters of CGML’s overall risk appetite. The established limits are monitored by market risk management.
In all cases, the businesses are ultimately responsible for the market risks taken and for remaining within their defined limits. Management of this process begins with the employees who work most closely with the Group’s customers, products and markets and extends up to the senior executives who manage these businesses with a complementary aggregation up to the country level.
Factor sensitivities represent the change in the value of a position for a defined change in a market risk factor, such as a change in the value of a Treasury bill for a one basis point change in interest rates. Citi’s independent Market Risk Management function ensures that factor sensitivities are calculated, monitored and, in most cases, limited, for all relevant risks taken in a trading portfolio.
VaR estimates the potential decline in the value of a position or a portfolio under normal market conditions. The firm’s VaR methodology incorporates the factor sensitivities of the trading portfolio with the volatilities and correlations of those factors and is expressed as the risk to the firm over a one-day holding period, at a 99% confidence level. Citigroup’s VaR is based on the volatilities of and correlations between a multitude of market risk factors, as well as factors that track the specific issuer risk in debt and equity securities.
Stress testing is performed on trading portfolios on a regular basis to estimate the impact of extreme market movements. It is performed on both individual trading portfolios, as well as on aggregations of portfolios and businesses. Independent Market Risk Management, in conjunction with the businesses, develops stress scenarios, reviews the output of periodic stress testing exercises and uses the information to make judgements as to the ongoing appropriateness of exposure levels and limits.
Each trading portfolio has its own market risk limit framework encompassing these measures as well as other controls, including permitted product lists and a new product approval process for new or complex products.
6.2 Market Risk Regulatory Capital
CGML uses a VaR model to calculate market risk capital requirements for the majority of its trading portfolio under an IMA permission granted by the PRA. The permission covers general market risk and issuer specific risk for a number of Fixed Income, Equities and Commodities businesses. In addition to VaR based capital requirements, CGML is required to set aside capital in respect of Stressed VaR and the Incremental Risk Charge.
The VaR model, as described above, is designed to capture potential market losses at a 99% confidence level over a one day holding period. The capital requirement is based on the VaR with a ten day holding period. The key components of the VaR model are the variance/covariance matrix of market variables and the sensitivity of Citi’s trading portfolio to those variables. The variance/covariance matrix is calibrated using three years of market data, with some volatility adjusted up to
38
capture fat tail effects at a 99% confidence level over a one day period, and others adjusted up to capture short term spikes in volatility. Market variations simulated from the matrix by a Monte Carlo methodology are applied to the set of factor sensitivities to generate a forecast distribution of one day profit and loss, from which the VaR can be computed. The factor sensitivities are designed to capture all material market risks on each trading asset, both linear and non-linear in nature.
Stressed VaR (SVaR) estimates the potential decline in the value of a position or a portfolio under stressed market conditions. The firm’s SVaR methodology incorporates the factor sensitivities of the trading portfolio with the volatilities and correlations of those factors under stressed conditions and is expressed as the risk to the firm over a one-day holding period, at a 99% confidence level.
Citi’s Monte Carlo VaR/SVaR model incorporates a full covariance matrix. The volatilities and correlations are built from thousands of market factors with actual time series from the last three years for VaR and a one-year stress period for SVaR. Proxy rules exist for market factors that do not have a sufficiently long time series or where the relevant data are inappropriate for matrix construction (e.g. due to gaps, unreliable sources, too short history). Aggregation of VaR/SVaR components by market factors or portfolios is fully integrated into the model. The model accepts as inputs the full risk profile from all trading activity in the form of risk factor sensitivities. Revaluation grids are used for nonlinear positions. 10-day VaR/SVaR numbers are calculated directly from 10-day volatility estimates. Production and reporting takes place on a daily basis and for any requested sub-portfolio or market factor.
The Incremental Risk Charge (IRC) is a measure of potential losses due to default and credit migration risk over a one-year time horizon at a one-tailed, 99.9% confidence level under the assumption of constant positions.
A Monte Carlo in-house 6-factor copula model is used for the correlations between issuers. The correlation depends mainly on the risk rating, region and industry sector of the issuer, and thus provides a richer correlation structure than what has been observed with 1-factor copula models. The model is calibrated annually to the public data of over 20,000 companies maintained within Citi’s databases and has been the subject of independent model validation. The migration and default of each issuer are modelled consistently by a single normal random variable which is mapped to the inverse normal cumulative distribution of the transition matrix to determine whether a migration or a default happens. The transition matrix is based on publicly available data from rating agencies. The scope of the issuers that are used for the calibration of the model encompasses the full spectrum of relevant trading products. The model accepts as inputs the jump-to-default amounts and the spread sensitivities from every debt issuer with interest rate exposure in Citi’s systems. Recovery rates are also simulated with their parameters properly calibrated to market data.
In addition, for the businesses within the scope of its IMA permission, CGML holds capital buffers in respect of certain risks not fully captured by its VaR/SVaR/IRC models.
The highest, lowest, mean and year end levels of the daily VaR, SVaR and IRC measures during 2016 and 2015 were as follows:
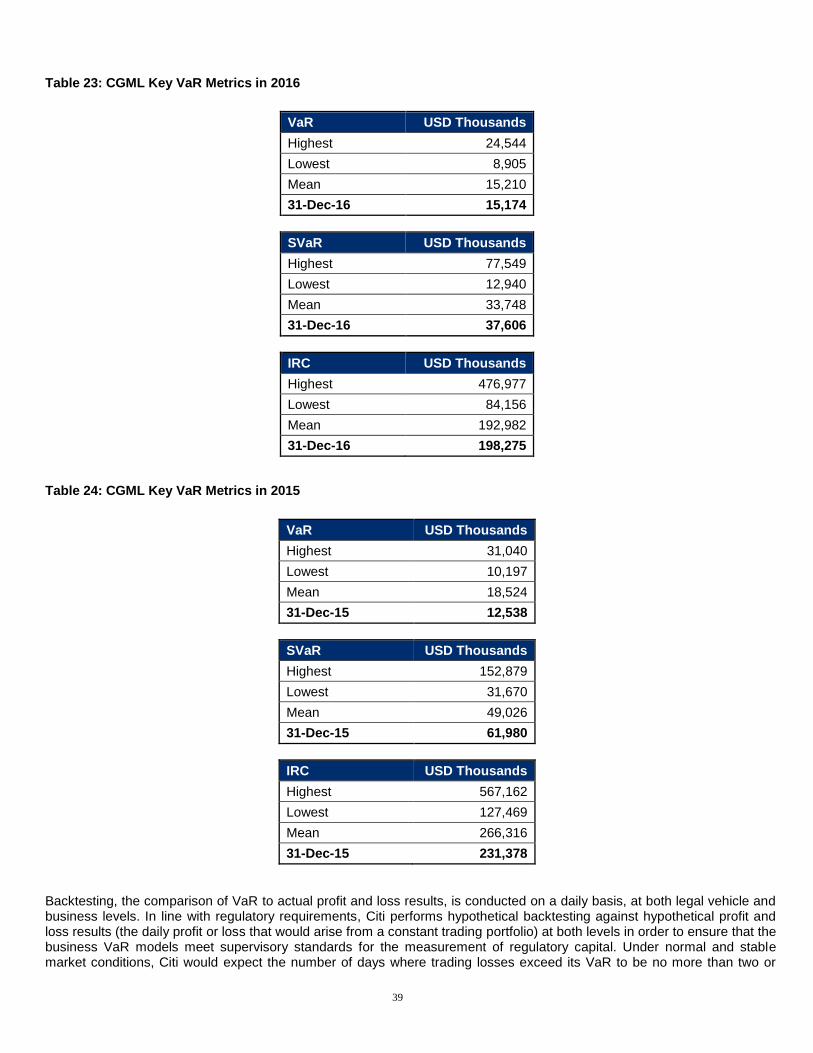
39
Table 23: CGML Key VaR Metrics in 2016
VaR USD Thousands
Highest 24,544
Lowest 8,905
Mean 15,210
31-Dec-16 15,174
SVaR USD Thousands
Highest 77,549
Lowest 12,940
Mean 33,748
31-Dec-16 37,606
IRC USD Thousands
Highest 476,977
Lowest 84,156
Mean 192,982
31-Dec-16 198,275
Table 24: CGML Key VaR Metrics in 2015
VaR USD Thousands
Highest 31,040
Lowest 10,197
Mean 18,524
31-Dec-15 12,538
SVaR USD Thousands
Highest 152,879
Lowest 31,670
Mean 49,026
31-Dec-15 61,980
IRC USD Thousands
Highest 567,162
Lowest 127,469
Mean 266,316
31-Dec-15 231,378
Backtesting, the comparison of VaR to actual profit and loss results, is conducted on a daily basis, at both legal vehicle and business levels. In line with regulatory requirements, Citi performs hypothetical backtesting against hypothetical profit and loss results (the daily profit or loss that would arise from a constant trading portfolio) at both levels in order to ensure that the business VaR models meet supervisory standards for the measurement of regulatory capital. Under normal and stable market conditions, Citi would expect the number of days where trading losses exceed its VaR to be no more than two or

40
three occasions per year. Periods of unstable market conditions could increase the number of these exceptions.
The graphs below illustrate a comparison of the daily end-of-day VaR measure with the one-day change in the portfolio’s value by the end of the subsequent business day (hypothetical P&L) for each day in 2016 and 2015.
Figure 5: CGML combined VaR for Businesses within the IMA Scope 2016
Figure 6: CGML combined VaR for Businesses within the IMA Scope 2015
Note: The downside VaR in the figures is taken as the 100th worst loss out of 10,000 simulated daily P&Ls (1st percentile)
from Citi’s Monte Carlo VaR model. The upside VaR is taken to be the 100th best profit out of the 10,000 simulations (99th
percentile). Hypothetical P&L represents market moves, excluding all trading P&L, fees, financing and accruals.
Citi employs two complementary approaches to stress testing: top-down systemic stresses and bottom-up business specific stresses. Systemic stresses are designed to quantify the potential impact of extreme market movements on a firm-wide basis, and are constructed using both historical periods of market stress and projections of adverse economic scenarios. Business specific stresses are designed to probe the risks of particular portfolios and market segments, especially those risks that are not fully captured in either the VaR model or the systemic stresses.
-30,000
-20,000
-10,000
0
10,000
20,000
30,000
40,000
De
c-1
5
Jan-1
6
Feb
-16
Ma
r-1
6
Apr-
16
Ma
y-1
6
Jun-1
6
Jul-1
6
Aug-1
6
Sep-1
6
Oct-
16
No
v-1
6
De
c-1
6
US
D T
housands
Hypothetical Daily P&L ($) Downside VaR Upside VaR
-40,000
-30,000
-20,000
-10,000
0
10,000
20,000
30,000
40,000
De
c-1
4
Jan-1
5
Feb
-15
Ma
r-1
5
Apr-
15
Ma
y-1
5
Jun-1
5
Jul-1
5
Aug-1
5
Sep-1
5
Oct-
15
No
v-1
5
De
c-1
5
US
D T
housands
Hypothetical Daily P&L ($) Downside VaR Upside VaR

41
Total revenues of the trading business consist of:
Customer revenue, which includes spreads from customer flow activity and gains on positions; and
Net interest income.
CGML maintains the necessary systems, controls and documentation to demonstrate appropriate standards in respect of valuation, reporting and valuation adjustments.
42
7. Operational Risk
Overview
Operational risk is the risk of loss resulting from inadequate or failed internal processes, systems or human factors, or from external events, and includes reputation and franchise risk associated with business practices or market conduct in which Citi is involved.
Operational risk is inherent in Citigroup’s global business activities, as well as the internal processes that support those business activities, and can result in losses arising from events related to the following, among others:
Fraud, theft and unauthorised activities;
Employment practices and workplace environment;
Clients, products and business practices;
Physical assets and infrastructure; and
Execution, delivery and process management.
Operational Risk Measurement and Stress Testing
CGML has been applying the Advanced Measurement Approach (AMA) in deriving its operational risk regulatory capital requirements since 2007. Pursuant to the AMA, Citi employs units of measure for calculating operational risk capital. Separately, loss severity and frequency are modelled independently and, as required under the AMA, both internal and external event data are used. The capital results are subsequently modified each quarter by applying a “qualitative adjustment factor” to reflect the current business environment and internal control factors. Citi uses insurance for the purposes of partially mitigating operational risk; however, such insurance does not have a material impact on Citi’s operational risk capital.
Further, scenario analysis is used as a management tool to provide a forward-looking view of specified, identified operational risks. Scenario analysis is conducted as a systematic process of obtaining opinions from business managers and risk management experts to derive reasoned assessments of the likelihood and loss impact of plausible, high-severity operational risk losses. Scenario analysis results are used to benchmark the capital model.

43
8. Non-Trading Book Exposures
8.1 Non-Trading Book Equity Exposures
CGML has a small number of equity investments which are held outside the trading book. This category includes investments in clearing houses, exchanges and other strategic investments which are required to be held for membership, access or relationship purposes, and which are otherwise not traded. They are carried on the balance sheet at fair value where this is readily determinable. Where this is not the case, the investment is carried at cost. The market price is deemed to be the fair value for exchange traded equities.
Table 25: Non-Trading Book Equity Exposures
USD millions 2016 2015
Investments Held at Fair Value 28 23
Investments Held at Cost 6 8
Total 34 31
8.2 Interest Rate Risk in the Non-Trading Book
One of Citi’s primary business functions is providing financial products that meet the needs of its customers. Loans and deposits are tailored to the customer’s requirements with regard to tenor, index and rate type. Net Interest Revenue (NIR) is the difference between the yield earned on the non-trading book portfolio assets (including customer loans) and the rate paid on the liabilities (including customer deposits or borrowings). The NIR is affected by changes in the level of interest rates.
Interest Rate Risk Governance
The risks in Citi’s non-traded portfolios are estimated using a common set of standards that define, measure, limit and report the market risk. Each business is required to establish, with approval from independent Market Risk Management, a market risk limit framework that clearly defines approved risk profiles and is within the parameters of Citi’s overall risk appetite. In all cases, the businesses are ultimately responsible for the market risks they take and for remaining within their defined limits. These limits are monitored by independent Market Risk Management and country and business ALCOs.
Please note that CGML’s business is almost entirely trading book in nature and therefore does not give rise to any material accrual book interest rate risk.

44
9. Securitisation Activity
CGML’s securitisation activities fall within the ICG business segment. Within ICG, securitisation activity is conducted within Global Securitised Products (GSP) and Global Securitised Markets (GSM).
Global Securitised Products
This group within the ICG structures and underwrites securitisations of financial assets primarily for financial institutions across EMEA. The desk originates and distributes (both via bank loan syndication and capital markets) secured risk based mainly on tranching and rating of that risk.
Global Securitised Markets
The EMEA Global Securitised Markets (“GSM”) business model is primarily comprised of teo types of activity; market making in ABS, and real estate and mortgage loan/portfolio financing with a consequent exit through a loan sale or securitisation. GSM’s ABS trading desk uses CGML to book market risk. The Commercial Real Estate and Residential Real Estate desks have no exposure on CGML. GSM is further divided into the following business lines:
ABS Trading
The ABS desk actively trades new issuances, existing ABS, RMBS and CMBS securities and commercial loans. The ABS desk is also a risk taker for the Residential Real Estate team’s financing activity, hedging any existing risk on residential loans. Trading activities on ABS, CMBS and RMBS are carried out on CGML, whereas loans are traded on Citi’s banking entities.
Commercial Real Estate
The Commercial Real Estate (CRE) team is focused on financing of commercial real estate backed projects, non-performing loan portfolio financing, acquisition of performing/re-performing commercial real estate portfolios, and primary commercial mortgage-backed securities (CMBS) issuance.
The Commercial Real Estate business uses CGML exclusively for CMBS issuance as an underwriter and as an arranger of financings, while CEP is used for both financing and CMBS issuance as an underwriter. CBNA is used solely for financing activities.
Residential Real Estate
The Residential Real Estate team primarily finances acquisitions of performing and re-performing residential mortgage portfolios, as well as financing of warehouse loans for residential mortgage businesses. The primary exit strategy includes issuance of residential mortgage-backed securities (“RMBS”) which are distributed through CGML or CEP.
The Residential Real Estate team originates, structures and distributes RMBS from CGML.
The ECAIs used by the ICG securitisation business are as follows:
Standard and Poor’s – ABS exchange service and Ratings Direct (general); rating of Conduit Programmes; preliminary ratings assessments (at loan stage) and final determinations or assessments at the time of a capital markets issuance.
Moody’s – Real estate related break-ups; rating of Conduit Programmes; preliminary ratings assessments (at loan stage) and final determinations or assessments at the time of a capital markets issuance.
Fitch – Real estate related break-ups and general surveillance; rating of Conduit Programmes; preliminary ratings assessments (at loan stage) and final determinations or assessments at the time of a capital markets issuance.
Approaches to Calculating Risk Weighted Exposure Amounts
Where applicable, the firm’s capital requirements for securitisation activity are calculated in accordance with CRD IV.
Accounting Policies for Securitisation Activity in the Trading Book (IFRS)
Any securitisation positions (such as Asset Backed Securities or Mortgage Backed Securities) purchased as part of a trading strategy are accounted for at fair value through earnings.
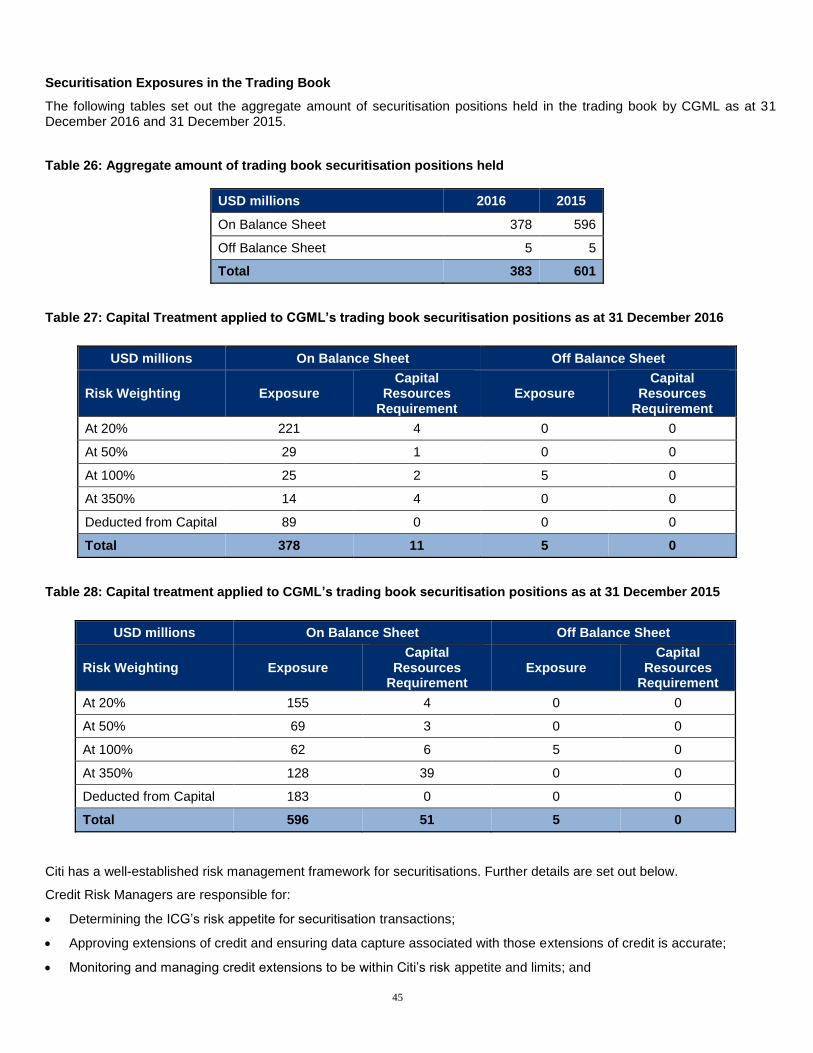
45
Securitisation Exposures in the Trading Book
The following tables set out the aggregate amount of securitisation positions held in the trading book by CGML as at 31 December 2016 and 31 December 2015.
Table 26: Aggregate amount of trading book securitisation positions held
USD millions 2016 2015
On Balance Sheet 378 596
Off Balance Sheet 5 5
Total 383 601
Table 27: Capital Treatment applied to CGML’s trading book securitisation positions as at 31 December 2016
USD millions On Balance Sheet Off Balance Sheet
Risk Weighting Exposure Capital
Resources Requirement
Exposure Capital
Resources Requirement
At 20% 221 4 0 0
At 50% 29 1 0 0
At 100% 25 2 5 0
At 350% 14 4 0 0
Deducted from Capital 89 0 0 0
Total 378 11 5 0
Table 28: Capital treatment applied to CGML’s trading book securitisation positions as at 31 December 2015
USD millions On Balance Sheet Off Balance Sheet
Risk Weighting Exposure Capital
Resources Requirement
Exposure Capital
Resources Requirement
At 20% 155 4 0 0
At 50% 69 3 0 0
At 100% 62 6 5 0
At 350% 128 39 0 0
Deducted from Capital 183 0 0 0
Total 596 51 5 0
Citi has a well-established risk management framework for securitisations. Further details are set out below.
Credit Risk Managers are responsible for:
Determining the ICG’s risk appetite for securitisation transactions;
Approving extensions of credit and ensuring data capture associated with those extensions of credit is accurate;
Monitoring and managing credit extensions to be within Citi’s risk appetite and limits; and
46
Working with the respective businesses in the allocation of credit to optimize returns.
Market Risk Managers are responsible for:
Ensuring that securitisation transactions, booked in the trading book, are consistent with the businesses’ mandate and represent an adequate risk/reward balance;
Approving securitisation transactions that are booked in the trading book and ensuring data capture associated with those securitisation transactions is accurate; and
Ongoing monitoring of market risk associated with securitisation transactions that are booked in the trading book.
The ICG trading book securitisation business is subject to the ICG policy “Rules Governing Market Risk”. All major generic sources of risk and stress losses are covered by the desk’s limit structures. Granularity within these limit structures is further enhanced through product-types, country risk and ratings. The business operates under an approved permitted products list which applies at the desk level. Concentration limits may also exist by obligor name depending on the business. Stress testing is completed in various formats including weekly stress tests, monthly Top Ten Risk reports and annual exercises. In addition, Risk Management performs ad hoc stress tests when determined as necessary. For those risks not fully captured in VaR or the linear stresses, a Business Specific Stress Test (BSST) is developed and produced in conjunction with the linear stresses. The BSSTs are reviewed at least quarterly to ensure relevance and completeness.
Securitisation Exposures in the Banking Book
CGML does not have a banking book and therefore does not have this type of activity.
47
10. 2016 Remuneration Statement
Citi’s Compensation Philosophy
Employee compensation is a critical tool in the successful execution of our corporate goals.
As long-term value creation requires balancing strategic goals, so does developing compensation programs that incentivise balanced behaviours.
Citi’s Compensation Philosophy describes our approach to balancing the five primary objectives that our compensation programs and structures are designed to achieve and is available online at: http://www.citigroup.com/citi/investor/corporate_governance.html.
Remuneration Governance
Global Remuneration Committee
The Personnel and Compensation Committee (P&C Committee) of the Board of Directors of Citigroup Inc., oversees Citi’s global remuneration policies and practices. It annually reviews the compensation structures for members of senior management and other highly compensated or regulated individuals. The P&C Committee, with the assistance of the Chief Risk Officer, also reviews the design and structure of compensation programs relevant to all employees in the context of risk management.
The P&C Committee’s terms of reference are documented in the P&C Committee Charter, which establishes the scope and
mandate of the P&C Committee’s responsibilities and the general principles governing the remuneration policy of the firm
globally. The Charter (updated for 2017) is available online at:
http://www.citigroup.com/citi/investor/data/percompcharter.pdf?ieNocache=248.
The P&C Committee members are all independent non-executive directors, selected and appointed on account of their
background and experience in business and their capability to fulfil their responsibilities as P&C Committee members. For
the performance year 2016, the P&C Committee members were: William S. Thompson, Jr. (Chairman), Dr Judith Rodin,
Diana L. Taylor, Duncan P. Hennes, Gary M. Reiner and Michael E. O’Neill. Biographies and details around the
compensation paid to P&C Committee members are in the 2016 Proxy Statement. The P&C Committee met 13 times in
2016 and each Director attended at least 75% of all meetings.
The P&C Committee is supported by Human Resources and Citi’s control functions, including Independent Risk and Legal.
The P&C Committee also draws on considerable experience of the other non-executive directors of the Board of Citigroup Inc. It is also empowered to draw upon internal and external expertise and advice as it determines appropriate and in its sole discretion and Citi pays the fees of any such external advisors. The Committee appointed Frederic W Cook & Co (“Cook & Co”) in 2012 to provide the Committee with independent advice on Citi’s compensation programs for senior management. Cook & Co reports solely to the Committee and the Committee has sole authority to retain, terminate, and approve the fees of Cook & Co. Cook & Co does no other work for Citi.
CGML Remuneration Committee
In 2016 Citi established the CGML Remuneration Committee (“CGML RemCo”) in order to provide oversight on remuneration matters for CGML, including decisions which have implications for the risk and risk management of CGML. The CGML RemCo will cover employees of CGML and its branches and is a formal sub-committee of the CGML Board.
The CGML RemCo comprises of Non-Executive Directors. Diana Taylor (Non-Executive Director for CGML and also a Non-Executive Director of the P&C Committee of the Board of Directors of Citigroup Inc pl) is the Chair of the Remuneration Committee.
48
Material Risk Takers In accordance with the PRA and FCA Codes, CGML maintains a record of its Material Risk Takers, which comprises the categories of staff whose professional activities are determined as having a material impact on the firm’s risk profile. For the 2016 performance year, Material Risk Takers were identified principally using Citi’s understanding of the European Banking Association’s criteria for identifying staff as set out in Commission Delegated Regulation (EU) No 604/2014. Design and Structure of Remuneration Fixed Remuneration – Salary, Role-Based Allowances (“RBAs”) and Benefits Citi’s fixed remuneration is set to appropriately attract, retain and motivate employees, in line with market practices, and is benchmarked against market data by role. RBAs have been assigned to roles, not employees, on the basis of the following non-exhaustive list of factors: a) the size and complexity of the role, b) the breadth of responsibility and territory covered by the role and, c) the strategic importance of the role, territory or market to the business. The decision of whether a particular role is eligible for an RBA will be made by the EMEA Remuneration Committee or CGML Remuneration Committee as appropriate. The rationale for granting an RBA must be clearly articulated by reference to the eligibility criteria, including specific details on the duties and responsibilities of the role. Pension and other non-cash benefits are offered to Citi EMEA employees as part of an overall reward package which is designed to be sufficiently competitive to attract, retain and motivate employees. Citi EMEA aims to provide pension and other benefits across all units/business groups, which are competitive against the external market. Variable Compensation Discretionary Incentive and Retention Award Plan Citi’s Discretionary Incentive and Retention Award Plan (DIRAP) is Citi’s main discretionary variable compensation plan, and applies globally. It is designed to incentivise, reward and retain employees based on their current and prospective performance and contribution. Awards made under the DIRAP are typically awarded in the form of cash and/or Citi stock.
Cash awarded for the 2016 performance year to Material Risk Takers under DIRAP is included under “2016 Cash” in Table
29.
Use of Stock and Deferred Cash as Deferred Compensation
Citi operates a mandatory deferral policy, where total annual variable compensation of an individual awarded under DIRAP
exceeds globally set thresholds. For Material Risk Takers, 2016 variable compensation subject to deferral was typically
awarded in the form of Citi stock and deferred cash. Citi believes that awarding deferred stock and deferred cash are effective
means of aligning employee interests with those of stockholders and other stakeholders.
Deferred Equity Awards
The Capital Accumulation Program (CAP) is the main programme under which Citi may make awards of deferred Citi stock to
selected employees. Deferred stock awards are subject to the terms of the CAP plan.
Deferred equity awarded under CAP to Material Risk Takers for the 2016 performance year is included in “2016 Equity”. Prior
years unvested CAP awards are included in the “Outstanding Deferred – Unvested” amounts in Table 28.
Short Term Equity Awards
Material Risk Takers receive a portion of their “immediate” variable compensation in the form of an immediately vesting stock
award (EU Short Term Award or “EUSTA”), which is subject to a 6-month retention period on vesting. EUSTA awarded for
the 2016 performance year to Material Risk Takers under DIRAP is included under “2016 Vested Outstanding” in Table 28.
Deferred Cash Awards
A portion of 2016 deferred remuneration was awarded to Material Risk Takers in the form of a deferred cash award. Deferred
Cash awarded for the 2016 performance year to Material Risk Takers is outlined in Table 28 as ‘2016 Deferred Cash’.

49
Deferrals and Retention Periods
Citi EMEA operates a standard or “default” deferral policy period of four years for non-Material Risk Takers, which it considers
captures the duration of most risks in a proportionate manner.
Deferred variable compensation awarded to Material Risk Takers is awarded in the form of deferred stock and deferred cash
Material Risk Takers were subject to deferral rates of 40% to 100% depending on their level of total compensation. Deferred
awards for Material Risk Takers vest over at least three years, subject to a further minimum six-month retention period once
vested. Deferred Awards for Risk Manager Material Risk Takers vest over five years, subject to a further minimum six-month
retention period once vested. Deferred awards for Senior Managers vest over 7 years, subject to a further minimum six-
month retention period once vested. In regards to the remaining portion of variable compensation, at least 10-30% is paid as
immediately vesting stock (EUSTA) subject to a minimum six-month sales restriction and the remainder is paid in immediate
cash.
Material Risk Takers who fall within de-minimis thresholds are subject to Citi’s mandatory deferrals.
Clawback
Following the introduction of the new rules around clawback, Citi’s award documentation for its awards granted in January
and February 2015 and onwards provided that clawback of vested cash and stock will be possible for up to 7 years from the
date of the award for affected employees. In addition, for awards granted in January and February 2017 and onwards, the
clawback period may be extended for Senior Managers for a period of up to 10 years from the date of award, under
exceptional circumstances.
Awards may be subject to performance adjustment based on the following:
There is reasonable evidence of employee misbehaviour or material error; or
There is reasonable evidence that an employee was involved with or responsible for conduct which resulted in significant
losses in connection with their employment or failed to meet appropriate standards of fitness and propriety; or
The firm or the relevant business unit suffers a material downturn in its financial performance; or
The firm or the relevant business unit suffers a material failure of risk management; or
The participant received the award based on materially inaccurate audited publicly reported financial statements; or
The participant knowingly engaged in providing materially inaccurate information relating to audited publicly reported
financial statements; or
The participant materially violated any risk limits established or revised by senior management and/or risk management;
or
The participant engaged in gross misconduct.
Performance Based Vesting Condition
Deferred equity awards made to Material Risk Takers are subject to a formulaic performance based vesting condition that
may result in the cancellation of all or part of unvested amounts in the event of losses in their relevant business.
Deferred cash awards made to Material Risk Takers are subject to discretionary performance based vesting, which may result in cancellation of unvested awards where an employee has significant responsibility for a material adverse outcome, such as events which lead to serious financial or reputational harm to Citi. Key Remuneration Policies Guarantees, Buyouts and Retention Payments Citi has guidelines in place with respect to guarantees that apply to all employees across the EMEA region, including employees of all PRA and FCA regulated entities. Citi’s guidelines on guarantees provides that guaranteed incentive and retention awards for employees can only be made in exceptional circumstances, in the context of recruitment and by

50
reference to the first year of service. HR regularly monitors the number of guarantees that are awarded by the business to new hires. Guaranteed awards which buy out equity or similar instruments which are forfeited as a result of resigning, employment with another employer and joining Citi EMEA are generally permitted but must not be more generous in either amount or terms than that provided by the former employer. Table [43] includes 2016 guaranteed and buy out awards made to Material Risk Taker hires. Guaranteed awards made for the purposes of retaining employees can only generally be made in exceptional circumstances, for example, during major restructuring, during a merger process; or where a business is winding down, such that particular staff needs to be retained on business grounds. No guaranteed retention awards were paid to Material Risk Takers in 2016. Severance Severance pay is generally discretionary unless otherwise required by local law or workplace agreements. Payments related to the termination of employment are designed in a way that does not reward failure. Ratio of Fixed to Variable Remuneration Citi seeks to balance the components of reward between fixed and variable, and between short term and long-term components. Annual fixed remuneration for senior employees is regularly reviewed by the P&C Committee. Citi operates a fully flexible remuneration policy, including the possibility to pay zero variable remuneration. For relevant employees, an annual review of the balance between fixed and variable compensation takes place and, where required, adjustments are made to the fixed element of pay to ensure that an appropriate balance of fixed versus variable continues to be maintained on an ongoing basis. The aggregate of fixed remuneration paid to Material Risk Takers for 2016 is set out in Table 28. Following the introduction of CRD IV Citi has obtained shareholder approval to apply a fixed to variable ratio of up to 1:2 for Material Risk Takers in 2016. Personal Hedging
Employees subject to the PRA and FCA Code are prohibited from engaging in personal hedging strategies or taking out
remuneration or liability related contracts of insurance that undermine or may undermine any risk alignment effects of their
remuneration arrangements.
In addition, Citi's Corporate Personal Trading Policy and Standards prohibits “Covered Employees” (separately defined for
this purpose) and related persons from hedging in any manner (other than currency hedges) unvested restricted stock or
deferred stock awarded under CAP or restricted shares, or otherwise having a financial interest in having Citi securities
decline in value.
Certain “Covered Employees” are subject to restrictions on specific types of trading in Citi shares. The following transactions
in Citi securities are prohibited:
Short sales
Sales of naked calls
Purchases of puts for speculative purposes
Speculative option strategies (i.e. straddles, combinations and spreads) when the Covered Employee does not have an
underlying position in Citigroup securities that would permit the Covered Employee to make delivery if the options were
to be exercised; and
Any transactions related to the hedging of unvested CAP or Restricted shares
Link between Pay and Performance Citi is committed to responsible compensation practices and structures. Citi seeks to balance the need to compensate its employees fairly and competitively based on their performance, while assuring that their compensation reflects principles of risk management and performance metrics that reward long-term contributions to sustained profitability.
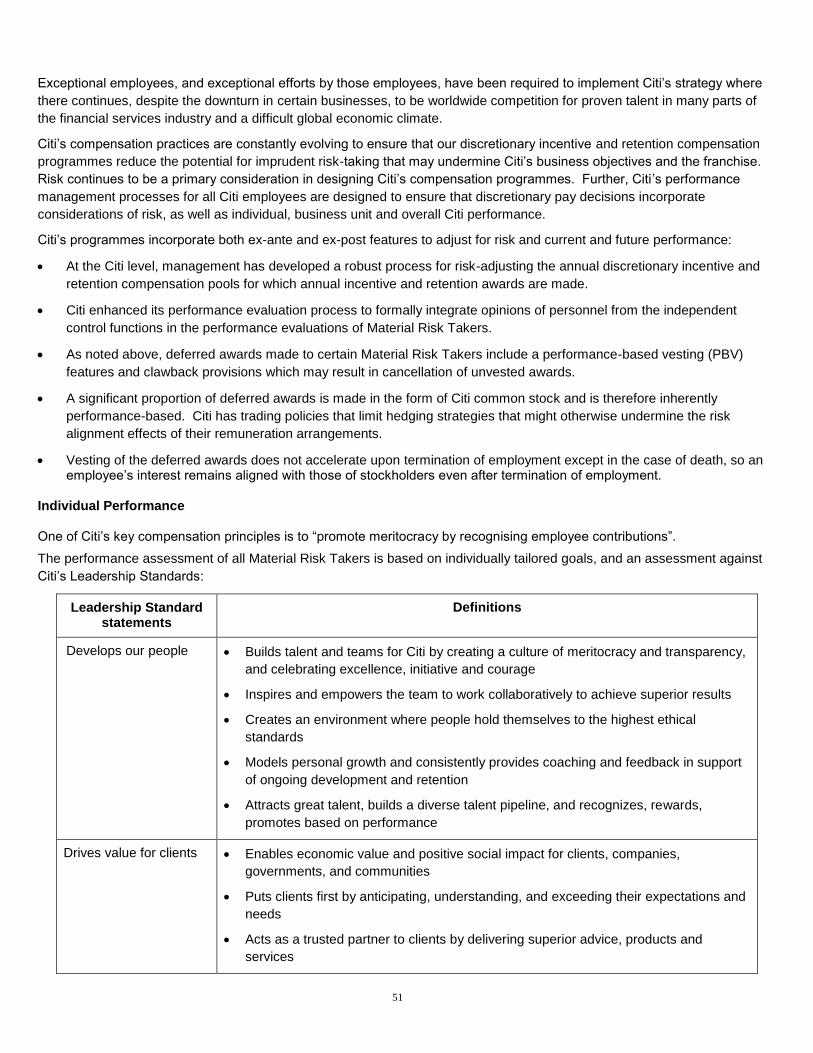
51
Exceptional employees, and exceptional efforts by those employees, have been required to implement Citi’s strategy where
there continues, despite the downturn in certain businesses, to be worldwide competition for proven talent in many parts of
the financial services industry and a difficult global economic climate.
Citi’s compensation practices are constantly evolving to ensure that our discretionary incentive and retention compensation
programmes reduce the potential for imprudent risk-taking that may undermine Citi’s business objectives and the franchise.
Risk continues to be a primary consideration in designing Citi’s compensation programmes. Further, Citi’s performance
management processes for all Citi employees are designed to ensure that discretionary pay decisions incorporate
considerations of risk, as well as individual, business unit and overall Citi performance.
Citi’s programmes incorporate both ex-ante and ex-post features to adjust for risk and current and future performance:
At the Citi level, management has developed a robust process for risk-adjusting the annual discretionary incentive and
retention compensation pools for which annual incentive and retention awards are made.
Citi enhanced its performance evaluation process to formally integrate opinions of personnel from the independent
control functions in the performance evaluations of Material Risk Takers.
As noted above, deferred awards made to certain Material Risk Takers include a performance-based vesting (PBV)
features and clawback provisions which may result in cancellation of unvested awards.
A significant proportion of deferred awards is made in the form of Citi common stock and is therefore inherently
performance-based. Citi has trading policies that limit hedging strategies that might otherwise undermine the risk
alignment effects of their remuneration arrangements.
Vesting of the deferred awards does not accelerate upon termination of employment except in the case of death, so an employee’s interest remains aligned with those of stockholders even after termination of employment.
Individual Performance One of Citi’s key compensation principles is to “promote meritocracy by recognising employee contributions”.
The performance assessment of all Material Risk Takers is based on individually tailored goals, and an assessment against
Citi’s Leadership Standards:
Leadership Standard statements
Definitions
Develops our people Builds talent and teams for Citi by creating a culture of meritocracy and transparency,
and celebrating excellence, initiative and courage
Inspires and empowers the team to work collaboratively to achieve superior results
Creates an environment where people hold themselves to the highest ethical
standards
Models personal growth and consistently provides coaching and feedback in support
of ongoing development and retention
Attracts great talent, builds a diverse talent pipeline, and recognizes, rewards,
promotes based on performance
Drives value for clients Enables economic value and positive social impact for clients, companies,
governments, and communities
Puts clients first by anticipating, understanding, and exceeding their expectations and
needs
Acts as a trusted partner to clients by delivering superior advice, products and
services
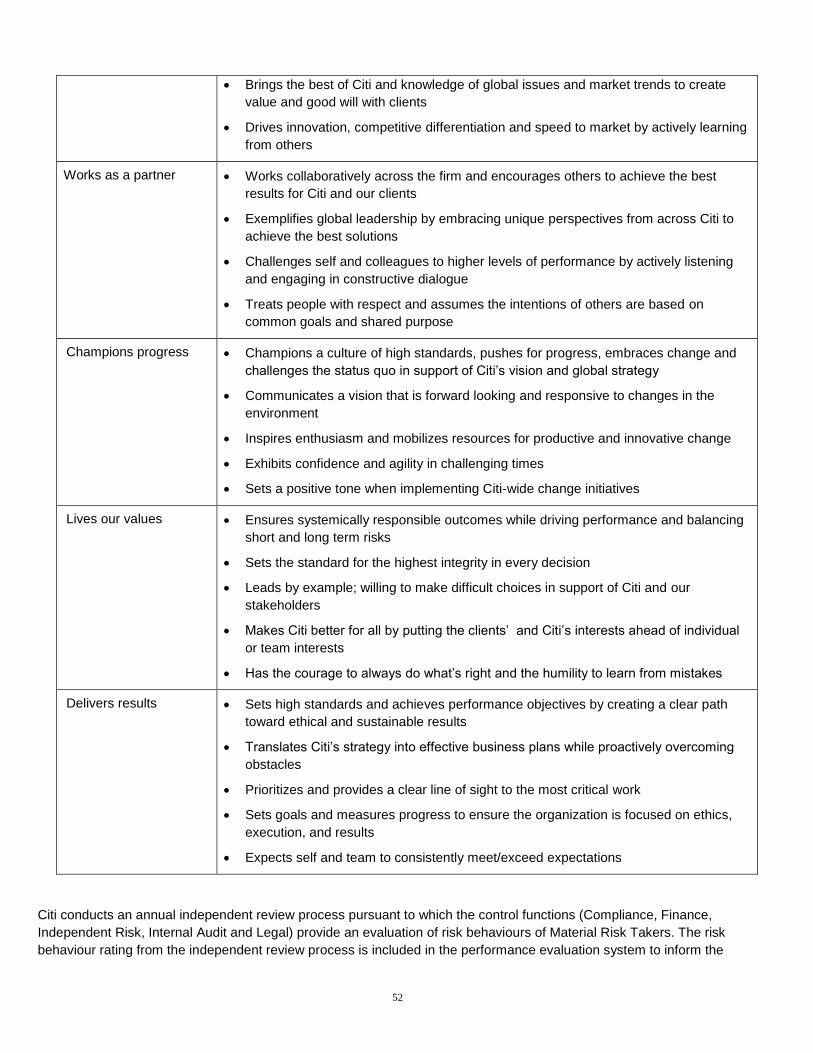
52
Brings the best of Citi and knowledge of global issues and market trends to create
value and good will with clients
Drives innovation, competitive differentiation and speed to market by actively learning
from others
Works as a partner Works collaboratively across the firm and encourages others to achieve the best
results for Citi and our clients
Exemplifies global leadership by embracing unique perspectives from across Citi to
achieve the best solutions
Challenges self and colleagues to higher levels of performance by actively listening
and engaging in constructive dialogue
Treats people with respect and assumes the intentions of others are based on
common goals and shared purpose
Champions progress Champions a culture of high standards, pushes for progress, embraces change and
challenges the status quo in support of Citi’s vision and global strategy
Communicates a vision that is forward looking and responsive to changes in the
environment
Inspires enthusiasm and mobilizes resources for productive and innovative change
Exhibits confidence and agility in challenging times
Sets a positive tone when implementing Citi-wide change initiatives
Lives our values Ensures systemically responsible outcomes while driving performance and balancing
short and long term risks
Sets the standard for the highest integrity in every decision
Leads by example; willing to make difficult choices in support of Citi and our
stakeholders
Makes Citi better for all by putting the clients’ and Citi’s interests ahead of individual
or team interests
Has the courage to always do what’s right and the humility to learn from mistakes
Delivers results Sets high standards and achieves performance objectives by creating a clear path
toward ethical and sustainable results
Translates Citi’s strategy into effective business plans while proactively overcoming
obstacles
Prioritizes and provides a clear line of sight to the most critical work
Sets goals and measures progress to ensure the organization is focused on ethics,
execution, and results
Expects self and team to consistently meet/exceed expectations
Citi conducts an annual independent review process pursuant to which the control functions (Compliance, Finance,
Independent Risk, Internal Audit and Legal) provide an evaluation of risk behaviours of Material Risk Takers. The risk
behaviour rating from the independent review process is included in the performance evaluation system to inform the

53
performance review conducted by the individual’s manager. The performance evaluation system includes formal risk goals for
all Material Risk Takers as well as a formal manager-provided risk rating.
Whilst the appraisal system reflects performance in the current year, any compliance or risk related breach in the previous performance period that is discovered in the current performance period will be taken into account when determining the individual’s rating. For Material Risk Takers material errors which occur in a previous performance period but are discovered in the current performance period may result in an adjustment of unvested deferred compensation (i.e. clawback) and/or current year end variable compensation. Remuneration of Control Function Employees In terms of remuneration for employees in control functions, whilst remuneration levels are influenced by Citi’s overall performance, individual compensation is determined within the function and pay decisions are based on assessments against measurable goals and targets which are set by each function. Compensation of Control Function employees is regularly benchmarked against external market data.
Citi maintains the independence of key control functions (e.g. Compliance and Risk) to minimise any scope for potential
conflicts of interests. Accordingly, there should be no conflict of interest on account of any business’ potential to influence
individual awards in the control function. Citi ensures performance management and compensation decisions for function
personnel are directed by function management, and not the business unit.
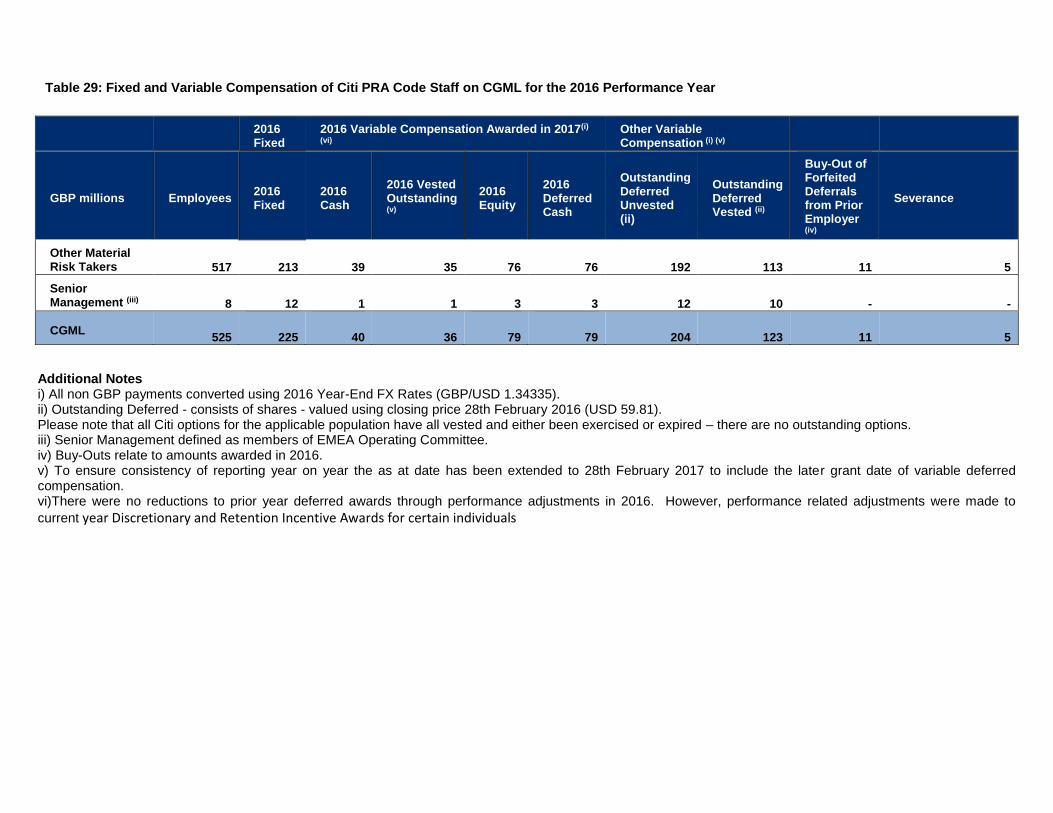
Table 29: Fixed and Variable Compensation of Citi PRA Code Staff on CGML for the 2016 Performance Year
2016 Fixed
2016 Variable Compensation Awarded in 2017(i)
(vi) Other Variable Compensation (i) (v)
GBP millions Employees 2016 Fixed
2016 Cash
2016 Vested Outstanding (v)
2016 Equity
2016 Deferred Cash
Outstanding Deferred Unvested (ii)
Outstanding Deferred Vested (ii)
Buy-Out of Forfeited Deferrals from Prior Employer (iv)
Severance
Other Material Risk Takers 517
213
39 35
76
76 192 113 11 5
Senior Management (iii) 8
12
1 1
3
3 12 10 - -
CGML 525
225
40 36
79
79 204 123 11 5
Additional Notes i) All non GBP payments converted using 2016 Year-End FX Rates (GBP/USD 1.34335). ii) Outstanding Deferred - consists of shares - valued using closing price 28th February 2016 (USD 59.81). Please note that all Citi options for the applicable population have all vested and either been exercised or expired – there are no outstanding options. iii) Senior Management defined as members of EMEA Operating Committee. iv) Buy-Outs relate to amounts awarded in 2016. v) To ensure consistency of reporting year on year the as at date has been extended to 28th February 2017 to include the later grant date of variable deferred compensation. vi)There were no reductions to prior year deferred awards through performance adjustments in 2016. However, performance related adjustments were made to
current year Discretionary and Retention Incentive Awards for certain individuals
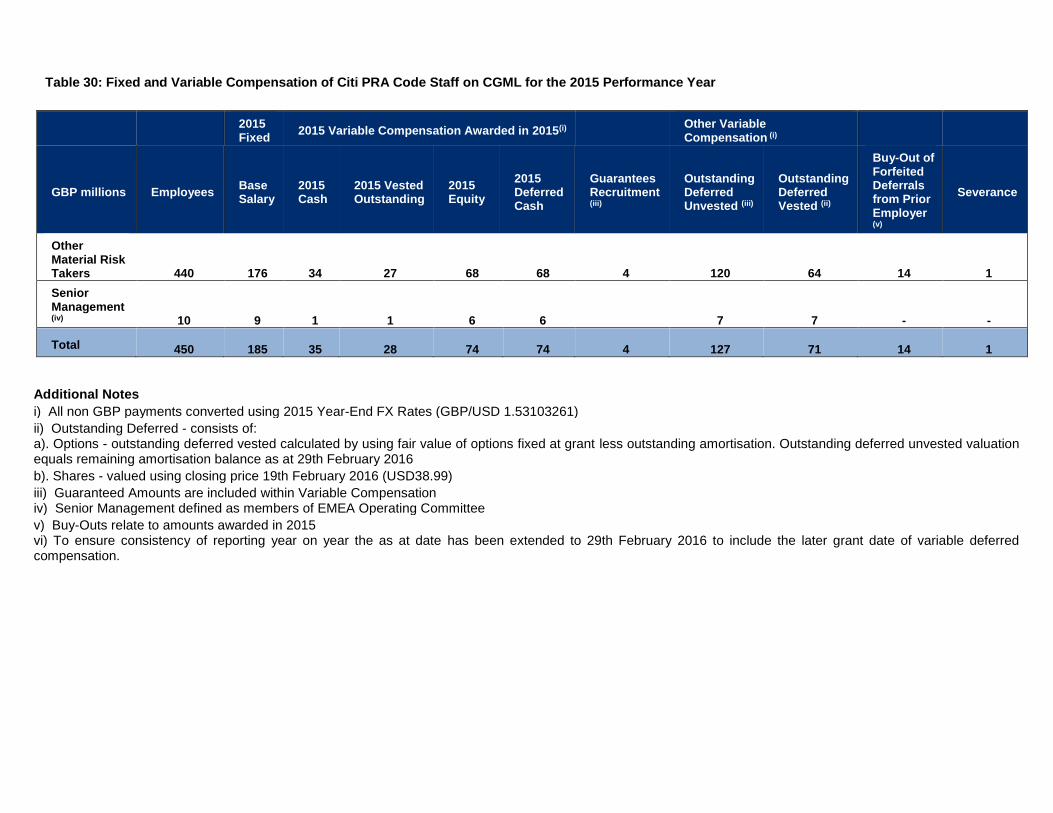
Table 30: Fixed and Variable Compensation of Citi PRA Code Staff on CGML for the 2015 Performance Year
2015 Fixed
2015 Variable Compensation Awarded in 2015(i)
Other Variable Compensation (i)
GBP millions Employees Base Salary
2015 Cash
2015 Vested Outstanding
2015 Equity
2015 Deferred Cash
Guarantees Recruitment (iii)
Outstanding Deferred Unvested (iii)
Outstanding Deferred Vested (ii)
Buy-Out of Forfeited Deferrals from Prior Employer (v)
Severance
Other Material Risk Takers 440 176 34 27 68 68 4 120 64 14 1
Senior Management (iv) 10 9 1 1 6 6
7 7 - -
Total 450 185 35 28 74 74 4 127 71 14 1
Additional Notes
i) All non GBP payments converted using 2015 Year-End FX Rates (GBP/USD 1.53103261)
ii) Outstanding Deferred - consists of: a). Options - outstanding deferred vested calculated by using fair value of options fixed at grant less outstanding amortisation. Outstanding deferred unvested valuation equals remaining amortisation balance as at 29th February 2016
b). Shares - valued using closing price 19th February 2016 (USD38.99)
iii) Guaranteed Amounts are included within Variable Compensation iv) Senior Management defined as members of EMEA Operating Committee
v) Buy-Outs relate to amounts awarded in 2015 vi) To ensure consistency of reporting year on year the as at date has been extended to 29th February 2016 to include the later grant date of variable deferred compensation.

56
Table 31: 2016 Remuneration Banding for Annual Compensation of Individuals Earning at Least EUR 1 Million
Total Compensation Number of Individuals
EUR 1 million to below EUR 1.5 million 110
EUR 1.5 million to below EUR 2 million 45
EUR 2 million to below EUR 2.5 million 23
EUR 2.5 million to below EUR 3 million 15
EUR 3 million to below EUR 3.5 million 9
EUR 3.5 million to below EUR 4 million 5
EUR 4 million to below EUR 4.5 million 5
EUR 4.5 million to below EUR 5 million 1
EUR 5 million to below EUR 6 million 6
EUR 6 million to below EUR 7 million 3
EUR 7 million to below EUR 8 million 3
EUR 8 million to below EUR 9 million 0
EUR 9 million to below EUR 10 million 0
EUR 10 million to below EUR 11 million 1
EUR 11 million to below EUR 12 million 0
EUR 12 million to below EUR 13 million 0
EUR 13 million to below EUR 14 million 1
Total 227
57
11. Appendix 1: UK Senior Management and Board Disclosures
The following senior management disclosures are made in accordance with CRR.
Recruitment and Diversity Policy for the CGML Board of Directors
Board Composition, Role and Effectiveness
The selection criteria for the Non-Executive Directors of CGML are designed to ensure their independence and the provision of robust challenge to their executive counterparts.
CGML has a combination of Non-Executive Directors who are either:
UK based and independent from any of Citi's businesses;
On the parent company’s Board (in order to provide direct linkage between the main and subsidiary boards), but who are independent within the standards applicable to the parent board; or
Former Citi executives who have a deep understanding of its business.
All new Non-Executive Directors receive training on the senior management regime and Companies Act responsibilities, as well as Citi familiarisation for independent Non-Executive Directors.
The selection process for Non-Executive Directors is rigorous and consists of several interviews. The interviewers include the CEO of the relevant legal entity, the EMEA Chief Administrative Officer and the EMEA Chief Legal Officer. All Board appointments are required to be formally approved by the UK Nominations Committee and the PRA.
The recruitment process aims to select Non-Executive Directors with significant financial regulatory and industry expertise. This expertise is outlined in further detail in the biographical summaries later in this appendix.
In order to meet the PRA's expectations for legal entity focus, Citi also appoints a Chief Executive Officer (CEO) for CGML.
Distinction Between the Roles of Executive and Non-Executive Directors
A fundamental distinction is drawn between the roles of executive and non-executive directors. Non-Executive Directors do not have any business line responsibility, but have oversight responsibilities consistent with the approach recommended in the Combined Code on Corporate Governance. The Non-Executive Directors chair the board, set the agendas for those Committee meetings and determine any follow up actions. The Non-Executive Directors are also not limited in their oversight to specific business operations.
The resources used by the Non-Executive Directors in their role of challenging the business include:
Full and unhindered access to the business, which involves the receipt of detailed presentations given by business or control functions;
Administrative support in the form of an assistant for the Chairman and office facilities on the executive floor of Citigroup's London offices in Canary Wharf for UK-based Non-Executive Directors; and
Technical training in the form of Board tutorials. These regular tutorials cover a wide range of subjects including capital and liquidity requirements, client assets and client money regulations, anti-money laundering rules, regulation relating to anti-bribery and corruption, and recovery and resolution planning.
Non-Executive Directors of CGML
Jonathan Asquith (Chairman). Number of Directorships Held: 3
In addition to his role at Citi, Jonathan is a Non-exec of 3i Group plc since 2011, Non-exec of CiCap Plc (Coller International Capital) since 2015, the holding company for the Coller group of secondary private equity funds Trustee, Eton Fives Charitable Trust.
His previous experience includes terms as a non-executive director of Ashmore Group PLC from 2008 to 2012, Chairman of Dexion Capital PLC until 2015, and as Chief Financial Officer and Vice Chairman of Schroders PLC between 2002 and 2008. He spent 18 years in the investment banking industry with Morgan Grenfell and Deutsche Bank.
Susan Dean. Number of Directorships Held: 3
Susan Dean is the Chair of the CGML audit committee and is a member of CGML’s Risk Committee; Remuneration Committee and Nominations Committee. In March 2016 Susan was appointed to the board of Citibank Europe plc (CEP)

58
and also become a member of the CEP Risk Committee and in September 2016 Susan was appointed as Chair of the Board of CEP. From 2009 - 2011 Susan was Global CFO for Citi's Institutional Client businesses, prior to this, positions held include EMEA CFO for the Citigroup franchise including Consumer, EMEA CFO for Institutional businesses, European CFO and Head of Operations and Technology for European Institutional Businesses.
Diana Taylor. Number of Directorships Held: 6
Diana Taylor has been an independent director of Citigroup Inc. since July 2009. As well as being Vice Chair of Solera Capital LLC, Diana holds directorships at both Brookfield Asset Management and Sotheby's.
From 2007 to 2014 Diana was managing director of Wolfensohn Fund Management L.P. Prior to this 2003 to 2007, she served as Superintendent of Banks of New York State Banking Department, where she also oversaw the regulation of the mortgage industry, and money service businesses. Diana served as Governor Pataki’s Deputy Secretary for Finance and Housing between 1996 and 1999. Other previous roles included several years in the energy business, first as Vice President of KeySpan Energy and then as Chief Financial Officer at the Long Island Power Authority. She was a founding partner and president of M.R. Beal & Company.
Diana started her career as an investment banker with Smith Barney, followed by roles with Lehman Brothers and Donaldson Lufkin & Jenrette.
Richard Goulding. Number of Directorships Held: 3
Richard Goulding joined Citi as a non-executive director in 2016.
In addition to his role at Citi Richard holds directorships at RFG Consulting Limited and Park Avenue Freehold Limited.
Richard Goulding was Group Chief Risk Officer and Director at Standard Chartered Bank London and Singapore from 2002-2015.
Executive Directors of CGML
James (Jim) Cowles. Number of Directorships Held: 1
Jim Cowles was named Citi's Chief Executive Officer for Europe, Middle East & Africa (EMEA) in January 2013. Prior to assuming his current position, he was Chief Operating Officer for EMEA and Head of Western Europe at Citi. He has also served as Head of Markets for Citi in EMEA, Global Head of Equities and Global Head of Equity Capital Markets.
Jim joined Smith Barney in 1979. Other previous roles have included: Head of Equities (EMEA), Deputy Head of Investment Banking, Head of Real Estate Investment Banking and Commercial Mortgage Trading, Head of Debt Capital Markets and Head of Direct Investments.
Peter McCarthy. Number of Directorships Held: 4
Peter McCarthy was appointed Citi’s Chief Administrative Officer for EMEA in February 2012. He has spent 30 years in various management roles at Citi including CAO of Citi’s Markets business in EMEA. Prior to joining Citi, Peter spent 6 years working in the European Financial Control division of Merrill Lynch.
James Bardrick (Director and Chief Executive Officer of CGML). Number of Directorships Held: 5
James Bardrick is Citi's Country Officer for the United Kingdom. Prior to this appointment, he was Co-head of Corporate and Investment Banking for EMEA, with specific responsibility for Corporate Banking from 2009 to 2014. He sits on Citi's Institutional Clients Group's Global Executive Committee, Citi's EMEA Operating, Governance and Risk Committees.
James is a Business Senior Credit Officer and has been with the firm for 30 years. During this time he has developed a broad experience of global client relationship management and coverage as well as providing strategic and transaction advice through many advisory, equity and debt financing transactions. Prior to joining Citi, James worked as an engineer and in marketing for GKN PLC and for Tomkins PLC.
Leo Arduini. Number of Directorships Held: 3
Leo Arduini is EMEA Head of Markets & Securities Services. Leo has 24 years experience in various positions across Citi. Other appointments at Citi include Head of EMEA Global Investor Sales from 2012 to 2014 and Citi Country Officer Italy from 2010 to 2013.

59
12. Appendix 2: 2016 asset encumbrance disclosures for CGML
Assets
Carrying amount of encumbered
assets
Fair value of encumbered
assets
Carrying amount of unencumbered
assets
Fair value of unencumbered
assets
Assets of the reporting institution 59,230,914,604 269,353,034,112
Equity instruments 13,266,349,379 13,266,349,379 1,564,959,536 1,564,959,536
Debt securities 19,763,849,376 19,763,849,376 1,855,038,667 1,855,038,667
Other assets 26,200,715,848 265,933,035,910
Collateral received
Fair value of encumbered
collateral received or own debt
securities issued
Fair value of collateral received
or own debt securities issued
available for encumbrance
Collateral received by the reporting institution 170,391,872,141 18,888,461,540
Equity instruments 29,765,732,154 889,432,017
Debt securities 136,961,457,643 17,343,497,908
Other collateral received 3,664,682,344 655,531,615
Own debt securities issued other than own covered bonds or ABSs
0 0
Encumbered assets/collateral received and associated liabilities
Matching liabilities,
contingent liabilities or
securities lent
Assets, collateral received and own
debt securities issued other than
covered bonds and ABSs
encumbered
Carrying amount of selected financial liabilities 235,112,642,141 104,544,512,321
Information on importance of encumbrance
As at 30 December 2016, the carrying value of assets on CGML’s UK GAAP Balance sheet was $328.5bn. This included approximately 7% debt securities, 5% equity instruments, and 89% Other assets. Of the total amount, approximately 18% or $59.2bn is considered to be encumbered. Assets are considered encumbered when they have been pledged or used to secure, collateralise or credit enhance a transaction which impacts their transferability and free use. Unencumbered other assets primarily relates to derivative instruments which cannot be encumbered under UK GAAP, and receivables related to secured financing assets. CGML also receives cash and securities collateral from on/off balance sheet secured financing transactions including reverse repos, stock borrows, prime brokerage margin loans, and also derivatives. The fair value of collateral received from these transactions was $189bn. This included 82% debt securities, 16% equity instruments, and 2% Other collateral. Of the total amount, approximately 90% or $170bn of total cash and securities collateral received is considered to be encumbered. Sources of encumbrance for both assets and securities collateral received include secured financing transactions such as repo and stock lending as well as customer and firm short position coverage and derivative margining. Encumbrance plays an essential role in the funding and liquidity management of CGML through its secured financing, derivative and customer activities, and as such encumbrance levels are monitored and managed appropriately. The level of encumbrance related to transactions with other members within the group is immaterial considering the level of total encumbrance. CGML primarily uses standard collateral agreements such as Credit Support Annexes (“CSA”) and Global Master Repurchase Agreements (“GMRAs”) and collateralises at appropriate levels in line with industry standards. The data provided represents balances at 30 December 2016.

60
13. Appendix 3: 2015 asset encumbrance disclosures for CGML
Assets
Carrying amount of encumbered
assets
Fair value of encumbered
assets
Carrying amount of unencumbered
assets
Fair value of unencumbered
assets
Assets of the reporting institution 66,302,358,009 247,564,443,978
Equity instruments 9,288,302,950 9,288,302,950 906,478,291 906,478,291
Debt securities 38,772,677,360 38,772,677,360 5,920,287,474 5,920,287,474
Other assets 18,241,377,698 240,737,678,213
Collateral received
Fair value of encumbered
collateral received or own debt
securities issued
Fair value of collateral received
or own debt securities issued
available for encumbrance
Collateral received by the reporting institution 155,281,233,752 26,140,479,892
Equity instruments 34,144,084,377 1,369,857,310
Debt securities 118,175,037,328 23,484,996,900
Other collateral received 2,962,112,047 1,285,625,682
Own debt securities issued other than own covered bonds or ABSs
0 0
Encumbered assets/collateral received and associated liabilities
Matching liabilities,
contingent liabilities or
securities lent
Assets, collateral received and own
debt securities issued other than
covered bonds and ABSs
encumbered
Carrying amount of selected financial liabilities 242,138,757,303 118,283,608,162
Information on importance of encumbrance
As at 31 December 2015, the carrying value of assets on CGML’s UK GAAP balance sheet was $313.9bn. This included approximately 14% debt securities, 3% equity instruments, and 83% Other assets. Of the total amount, approximately 21% or $66.3bn is considered to be encumbered. Assets are considered encumbered when they have been pledged or used to secure, collateralise or credit enhance a transaction which impacts their transferability and free use. Unencumbered other assets primarily relates to derivative instruments which cannot be encumbered under UK GAAP, and receivables related to secured financing assets. CGML also receives cash and securities collateral from on/off balance sheet secured financing transactions including reverse repos, stock borrows, prime brokerage margin loans, and also derivatives. The fair value of collateral received from these transactions was $181bn. This included 78% debt securities, 20% equity instruments, and 2% other collateral. Of the total amount, approximately 86% or $155bn of total cash and securities collateral received is considered to be encumbered. Sources of encumbrance for both assets and securities collateral received include secured financing transactions such as repo and stock lending as well as customer and firm short position coverage and derivative margining. Encumbrance plays an essential role in the funding and liquidity management of CGML through its secured financing, derivative and customer activities, and as such encumbrance levels are monitored and managed appropriately. The level of encumbrance related to transactions with other members within the group is immaterial considering the level of total encumbrance. CGML primarily uses standard collateral agreements such as Credit Support Annexes (“CSAs”) and Global Master Repurchase Agreements (“GMRAs”) and collateralises at appropriate levels in line with industry standards. The rationale for the significant difference between 2015 and 2014 is the refinement of the reporting methodology in 2015. The main impacts are that 2015 is based on UK GAAP balance sheet rather than US GAAP balance sheet. In addition 2015 includes for Reverse repo related activity both the Assets and Collateral received templates and not just in the collateral received template. The data provided represents balances at 31 December 2015.
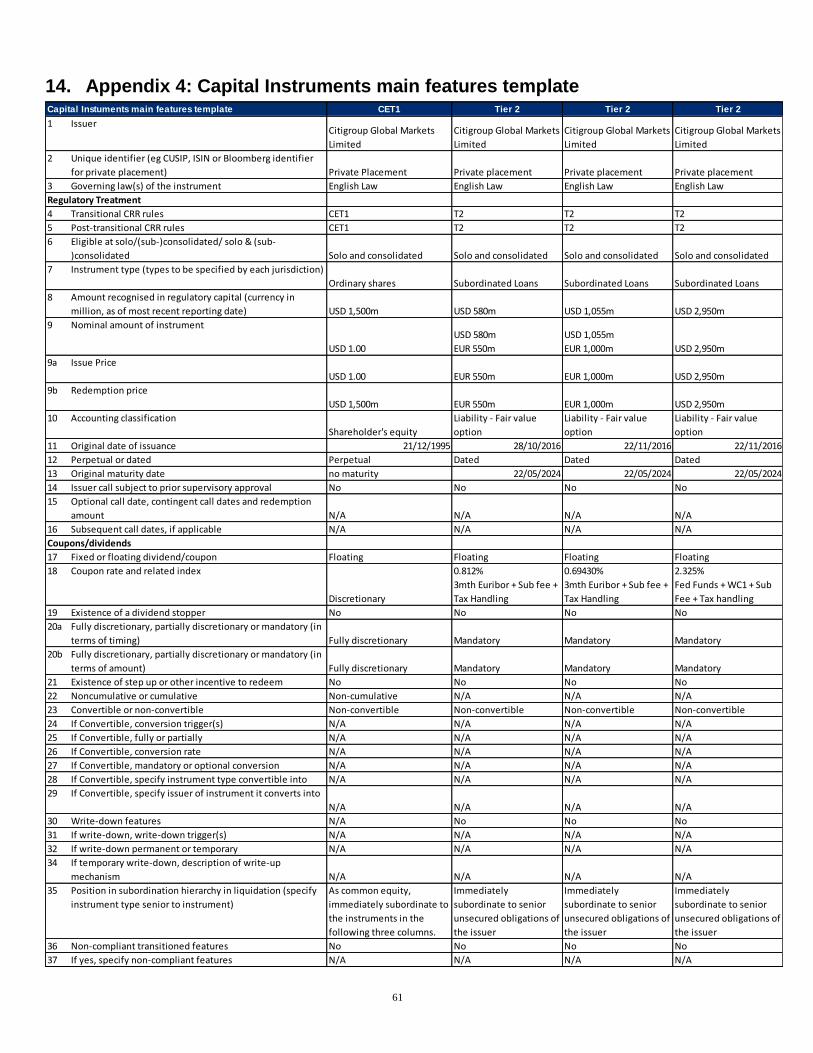
61
14. Appendix 4: Capital Instruments main features template
CET1 Tier 2 Tier 2 Tier 2
1 IssuerCitigroup Global Markets
Limited
Citigroup Global Markets
Limited
Citigroup Global Markets
Limited
Citigroup Global Markets
Limited
2 Unique identifier (eg CUSIP, ISIN or Bloomberg identifier
for private placement) Private Placement Private placement Private placement Private placement
3 Governing law(s) of the instrument English Law English Law English Law English Law
Regulatory Treatment
4 Transitional CRR rules CET1 T2 T2 T2
5 Post-transitional CRR rules CET1 T2 T2 T2
6 Eligible at solo/(sub-)consolidated/ solo & (sub-
)consolidated Solo and consolidated Solo and consolidated Solo and consolidated Solo and consolidated
7 Instrument type (types to be specified by each jurisdiction)
Ordinary shares Subordinated Loans Subordinated Loans Subordinated Loans
8 Amount recognised in regulatory capital (currency in
million, as of most recent reporting date) USD 1,500m USD 580m USD 1,055m USD 2,950m
9 Nominal amount of instrument
USD 1.00
USD 580m
EUR 550m
USD 1,055m
EUR 1,000m USD 2,950m
9a Issue Price
USD 1.00 EUR 550m EUR 1,000m USD 2,950m
9b Redemption price
USD 1,500m EUR 550m EUR 1,000m USD 2,950m
10 Accounting classification
Shareholder's equity
Liability - Fair value
option
Liability - Fair value
option
Liability - Fair value
option
11 Original date of issuance 21/12/1995 28/10/2016 22/11/2016 22/11/2016
12 Perpetual or dated Perpetual Dated Dated Dated
13 Original maturity date no maturity 22/05/2024 22/05/2024 22/05/2024
14 Issuer call subject to prior supervisory approval No No No No
15 Optional call date, contingent call dates and redemption
amount N/A N/A N/A N/A
16 Subsequent call dates, if applicable N/A N/A N/A N/A
Coupons/dividends
17 Fixed or floating dividend/coupon Floating Floating Floating Floating
18 Coupon rate and related index
Discretionary
0.812%
3mth Euribor + Sub fee +
Tax Handling
0.69430%
3mth Euribor + Sub fee +
Tax Handling
2.325%
Fed Funds + WC1 + Sub
Fee + Tax handling
19 Existence of a dividend stopper No No No No
20a Fully discretionary, partially discretionary or mandatory (in
terms of timing) Fully discretionary Mandatory Mandatory Mandatory
20b Fully discretionary, partially discretionary or mandatory (in
terms of amount) Fully discretionary Mandatory Mandatory Mandatory
21 Existence of step up or other incentive to redeem No No No No
22 Noncumulative or cumulative Non-cumulative N/A N/A N/A
23 Convertible or non-convertible Non-convertible Non-convertible Non-convertible Non-convertible
24 If Convertible, conversion trigger(s) N/A N/A N/A N/A
25 If Convertible, fully or partially N/A N/A N/A N/A
26 If Convertible, conversion rate N/A N/A N/A N/A
27 If Convertible, mandatory or optional conversion N/A N/A N/A N/A
28 If Convertible, specify instrument type convertible into N/A N/A N/A N/A
29 If Convertible, specify issuer of instrument it converts into
N/A N/A N/A N/A
30 Write-down features N/A No No No
31 If write-down, write-down trigger(s) N/A N/A N/A N/A
32 If write-down permanent or temporary N/A N/A N/A N/A
34 If temporary write-down, description of write-up
mechanism N/A N/A N/A N/A
35 Position in subordination hierarchy in liquidation (specify
instrument type senior to instrument)
As common equity,
immediately subordinate to
the instruments in the
following three columns.
Immediately
subordinate to senior
unsecured obligations of
the issuer
Immediately
subordinate to senior
unsecured obligations of
the issuer
Immediately
subordinate to senior
unsecured obligations of
the issuer
36 Non-compliant transitioned features No No No No
37 If yes, specify non-compliant features N/A N/A N/A N/A
Capital Instuments main features template
62
15. Glossary
ABS Asset Backed Securities
ALCO Asset and Liability Committee
AMA Advanced Measurement Approach
BPC Business Practices Committee
BRCC Business Risk and Control Committee
BSST Business Specific Stress Test
CAP Capital Accumulation Programme
CCO Citi Country Officer
CCP Central Counterparty Clearing House
CCyB Countercyclical buffer
CDS Credit Default Swap
CEM Current Exposure Method
CEO Chief Executive Officer
CEP Citigroup Europe PLC
CET 1 Common Equity Tier 1
CFO Chief Finance Officer
CFP Contingency Funding Plan
CGML Citigroup Global Markets Limited
CMO Capital Markets Origination
CORA Credit and Operational Risk Analytics
CPAC Consumer Product Approval Committee
CPB Citi Private Bank
CRD Capital Requirements Directive
CRE Commercial Real Estate
CRMR CitiRisk Market Risk
CRO Chief Risk Officer
CSA Credit Support Annex
CSC Citi Service Centre
CVA Credit Valuation Adjustment
DIRAP Discretionary Incentive and Retention Award Plan
DPAC Distribution Product Approval Committee
EAD Exposure at Default
EBA European Banking Authority
ECAI External Credit Assessment Institution
EEA European Economic Area
EMEA Europe, Middle East and Africa
EPE Expected Positive Exposure
63
EU European Union
EUSTA EU Short-Term Award
ETDs Exchange Traded Derivatives
FCA Financial Conduct Authority
FLP Funding and Liquidity Plan
FRR Facility Risk Rating
FX Foreign Exchange
G10 Group of Ten (refers to the countries that have agreed to participate in the General Arrangements to Borrow (GAB))
GAAP Generally Accepted Accounting Principles
GCB Global Consumer Banking
GSM Global Securitised Markets
GSP Global Securitised Products
IAS International Accounting Standard
ICAAP Internal Capital Adequacy Assessment Process
ICG Institutional Clients Group
IFRS International Financial Reporting Standards
ILG Individual Liquidity Guidance
IMA Internal Model Approach
IMM Internal Models Method
IPB International Personal Bank
IPR Investments Products Risk
IRC Incremental Risk Charge
IRE Interest Rate Exposure
ISDA International Swaps and Derivatives Association
KEPSP Key Employee Profit Sharing Plan
LCR Liquidity Coverage Ratio
LGD Loss Given Default
LIBOR London Interbank Offered Rate
MCA Manager’s Control Assessment
MPAC Manufacturing Product Approval Committee
NIR Net Interest Revenue
NPAC New Product Approval Committee
NRI Non-Resident Indian
NSFR Net Stable Funding Ratio
OCI Other Comprehensive Income
OIS Overnight Indexed Swap
ORR Obligor Risk Rating
OTC Over The Counter

64
P&C Personnel and Compensation
PBV Performance Based Vesting
PD Probability of Default
PRA Prudential Regulation Authority
PRR Position Risk Requirement
PSU Performance Share Units
RemCo Remuneration Committee
Resi Residential Real Estate
RMBS Residential Mortgage Backed Securities
RWA Risk Weighted Assets
SFT Securities Financing Transaction
SVaR Stressed Value at Risk
TTS Treasury and Trade Solutions
VaR Value at Risk
WWR Wrong Way Risk


