Download - CLACLS - CUNY Graduate Center
CLACLS Center for Latin American, Caribbean & Latino Studies
Center for Latin American, Caribbean & Latino Studies Graduate Center City University of New York 365 Fifth Avenue Room 5419 New York, New York 10016 212- 817- 8438 [email protected] http://web.gc.cuny.edu/lastudies
The Concentration of Wealth in New York City
Changes in the Structure of
Household Income by Race/Ethnic Groups and
Latino Nationalities 1990 - 2010
Laird W. Bergad Distinguished Professor
Department of Latin American, Latino and Puerto Rican Studies, Lehman College
Ph.D. Program in History, Graduate Center
Latino Data Project - Report 56 - January 2014
The Center for Latin American, Caribbean and Latino Studies is a research institute that works for the advancement of the study of Latin America, the Caribbean, and Latinos in the United States in the doctoral programs at the CUNY Graduate Center. One of its major priorities is to provide funding and research opportunities to Latino students at the Ph.D. level. The Center established and helps administer an interdisciplinary specialization in Latin American, Caribbean and Latino Studies in the Masters of Arts in Liberal Studies program. The Latino Data Project was developed with the goal of making information available on the dynamically growing Latino population of the United States and especially New York City through the analysis of extant data available from a variety of sources such as the U.S. Census Bureau, the National Institute for Health, the Bureau of Labor Statistics, and state and local-level data sources. All Latino Data Project reports are available at http://web.gc.cuny.edu/lastudies/
For additional information you may contact the Center at 212-817-8438 or by e-mail at [email protected].
Staff:
Laird W. Bergad, Distinguished Professor, Latin American and Puerto Rican Studies, Lehman College, Ph.D. Program in History, Executive Director, CLACLS Teresita Levy, Assistant Professor, Department of Latin American, Latino and Puerto Rican Studies, Lehman College, Associate Director Laura Limonic, Administrative Director and Director of Quantitative Research Victoria Stone-Cadena, Director of Outreach and Special Projects Lawrence Cappello, Research Associate Justine Calcagno, Quantitative Research Associate Mila Burns, Website Developer
Copyright @ 2014 Center for Latin American, Caribbean and Latino Studies
Room 5419 Graduate Center
City University of New York 365 Fifth Avenue
New York, New York 10016 212-817-8438 [email protected]
http://web.gc.cuny.edu/lastudies
Household Income Concentration in New York City 3
Latino Data Project Report 56 January 2014
Table of Contents
Guide to Tables ............................................................................................................... 4
Guide to Figures .............................................................................................................. 6
Executive Summary ........................................................................................................ 9
Household Income Distribution and Wealth Concentration among New York City’s Total Population .................................................................................................. 11
Household Income and Race/Ethnicity .......................................................................... 16
Income Distribution and Wealth Concentration among New York City’s Non-Hispanic White Population ................................................................................................ 18
Income Distribution and Wealth Concentration among New York City’s Non-Hispanic Black Population ................................................................................................. 23
Income Distribution and Wealth Concentration among New York City’s Asian Population .......................................................................................................... 28
Income Distribution and Wealth Concentration among New York City’s Latino Population .......................................................................................................... 33
Income Distribution and Wealth Concentration among New York City’s Largest Latino National Sub-Groups: Puerto Ricans, Dominicans, Mexicans, Ecuadorians and Colombians ........................................................................................................ 41
The Gini Index of Inequality in New York City ............................................................... 48
Conclusion .................................................................................................................... 50
Statistical Appendix ....................................................................................................... 52

Household Income Concentration in New York City 4
Latino Data Project Report 56 January 2014
Guide to Tables1
Table 1: Share of Total Household Income in New York City by Percentile, 1990 – 2010, Total Households ............................................................................................... 14
Table 2: Percentage of Households and Total Household Income by Income-Earning Category in New York City, 1990 – 2010 Total Population .................................. 15
Table 3: Share of Total Household Income in New York City by Percentile, 1990 – 2010 Non-Hispanic White ................................................................................... 20
Table 4: Percentage of Households and Total Household Income by Income-Earning Category in New York City, 1990 – 2010 Non-Hispanic White ............................ 22
Table 5: Share of Total Household Income in New York City by Percentile, 1990 – 2010 Non-Hispanic Black ................................................................................... 25
Table 6: Percentage of Households and Total Household Income by Income-Earning Category in New York City, 1990 – 2010 Non-Hispanic Black ............................. 28
Table 7: Share of Total Household Income in New York City by Percentile, 1990 – 2010 Asian.......................................................................................................... 32
Table 8: Percentage of Households and Total Household Income by Income-Earning Category in New York City, 1990 – 2010 Asian ................................................... 33
Table 9: Share of Total Household Income in New York City by Percentile, 1990 – 2010 Latino ......................................................................................................... 37
Table 10: Percentage of Households and Total Household Income by Income-Earning Category in New York City, 1990 – 2010 Latino .................................................. 41
Table 11: Share of Total Household Income in New York City by Percentile, 1990 – 2010 Puerto Rican .............................................................................................. 52
Table 12: Share of Total Household Income in New York City by Percentile, 1990 – 2010 Dominican .................................................................................................. 53
Table 13: Share of Total Household Income in New York City by Percentile, 1990 – 2010 Mexican ..................................................................................................... 54
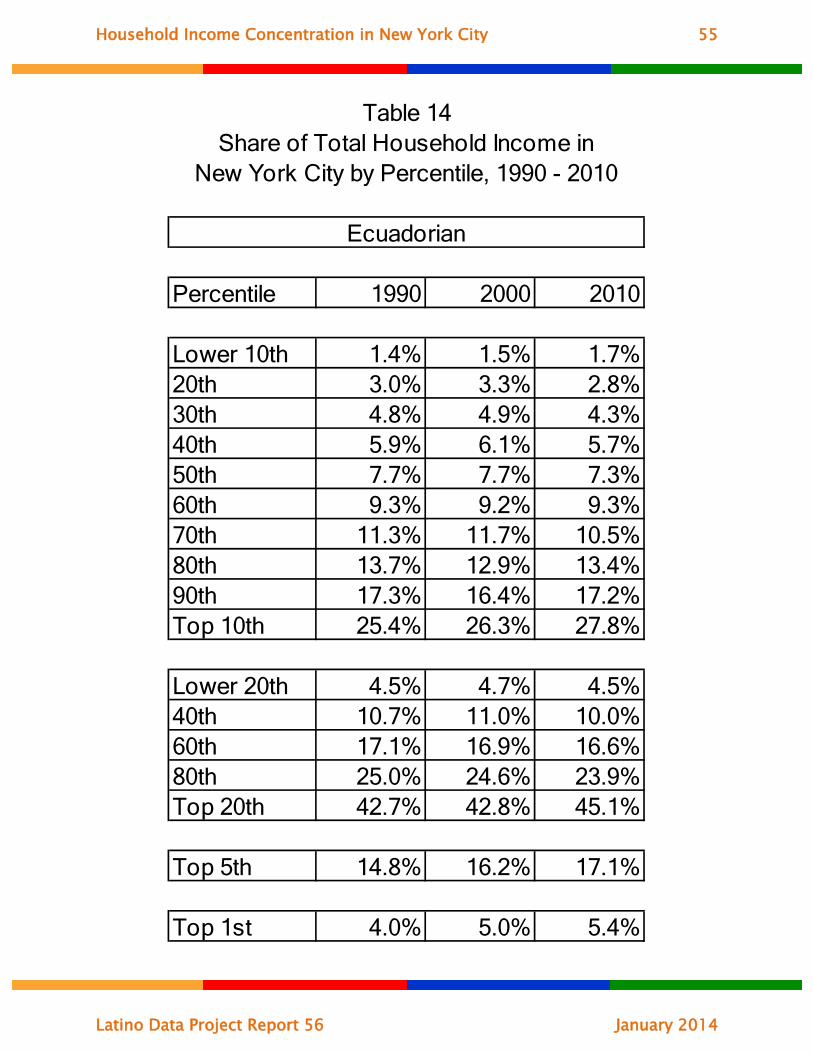
Table 14: Share of Total Household Income in New York City by Percentile, 1990 – 2010 Ecuadorian ................................................................................................ 55
1 Note: Tables which indicate particular race/ethnic groups or Latino nationalities contain data ONLY on those specific groups, not the City at large.
Household Income Concentration in New York City 5
Latino Data Project Report 56 January 2014
Table 15: Share of Total Household Income in New York City by Percentile, 1990 – 2010 Colombian ................................................................................................. 56
Table 16: Percentage of Households and Total Household Income by Income-Earning Category in New York City, 1990 – 2010 Puerto Rican ....................................... 57
Table 17: Percentage of Households and Total Household Income by Income-Earning Category in New York City, 1990 – 2010 Dominican ........................................... 57
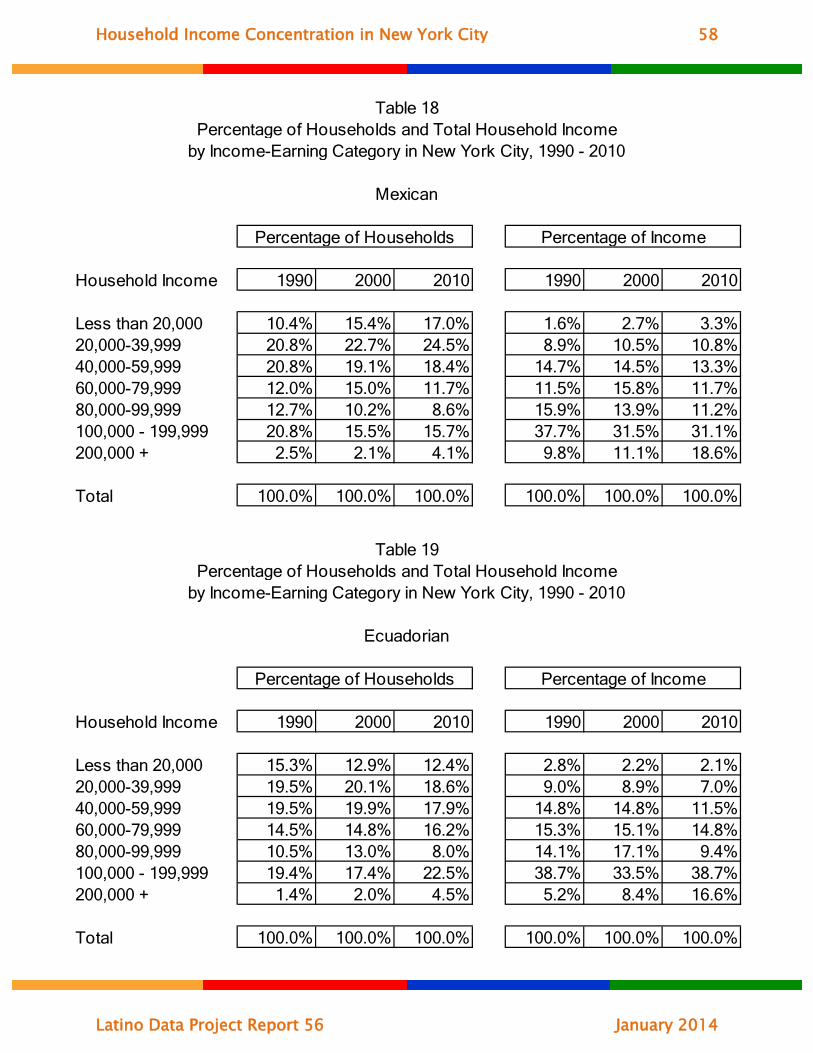
Table 18: Percentage of Households and Total Household Income by Income-Earning Category in New York City, 1990 – 2010 Mexican ............................................... 58
Table 19: Percentage of Households and Total Household Income by Income-Earning Category in New York City, 1990 – 2010 Ecuadorian .......................................... 58
Table 20: Percentage of Households and Total Household Income by Income-Earning Category in New York City, 1990 – 2010 Colombian ........................................... 59
Household Income Concentration in New York City 6
Latino Data Project Report 56 January 2014
Guide to Figures2
Figure 1: Percentage of Total Household Income Earned by Top 1%, 5%, 10%, 20% of Households New York City 1990 – 2010 Total Population .............................. 11
Figure 2: Percentage of Total Household Income Earned by Lower 10%, 20%, 40% of Households New York City 1990 – 2010 Total Population .............................. 12
Figure 3: Median Household Income Earned by Upper 1%, 10%, 20% of Households New York City 1990 – 2010 Total Population ...................................................... 13
Figure 4: Median Household Income Earned by Lower 10%, 20% of Households New York City 1990 – 2010 Total Population .............................................................. 13
Figure 5: Percentage of Total Households and Income by Race/Ethnicity New York City 2010 ............................................................................................................ 16
Figure 6: Percentage of Households Earning $100,000 or More by Race/Ethnicity New York City, 1990 – 2010 ............................................................................... 17
Figure 7: Percentage of Total Income Controlled by Households Earning $100,000 or More by Race/Ethnicity New York City, 1990 – 2010 .......................................... 18
Figure 8: Percentage of Total Household Income Earned by Top 1%, 5%, 10%, 20% of Households New York City 1990 – 2010 Non-Hispanic White Population ....... 19
Figure 9: Percentage of Total Household Income Earned by Lower 10%, 20%, 40% of Households New York City 1990 – 2010 Non-Hispanic White Population ....... 19
Figure 10: Median Household Income Earned by Upper 1%, 10%, 20% of Households New York City 1990 – 2010 Non-Hispanic White Population ........... 21
Figure 11: Median Household Income Earned by Lower 10%, 20% of Households New York City 1990 – 2010 Non-Hispanic White Population .............................. 22
Figure 12: Percentage of Total Household Income Earned by Top 1%, 5%, 10%, 20% of Households New York City 1990 – 2010 Non-Hispanic Black Population ....... 24
Figure 13: Percentage of Total Household Income Earned by Lower 10%, 20%, 40% of Households New York City 1990 – 2010 Non-Hispanic Black Population ...... 24
Figure 14: Median Household Income Earned by Upper 1%, 10%, 20% of Households New York City 1990 – 2010 Non-Hispanic Black Population ............................... 26
2 Note: Figures which indicate particular race/ethnic groups or Latino nationalities contain data ONLY on those specific groups, not the City at large.

Household Income Concentration in New York City 7
Latino Data Project Report 56 January 2014
Figure 15: Median Household Income Earned by Lower 10%, 20% of Households New York City 1990 – 2010 Non-Hispanic Black Population ............................... 26
Figure 16: Percentage of Total Household Income Earned by Top 1%, 5%, 10%, 20% of Households New York City 1990 – 2010 Asian Population ............................. 29
Figure 17: Percentage of Total Household Income Earned by Lower 10%, 20%, 40% of Households New York City 1990 – 2010 Asian Population ............................. 30
Figure 18: Median Household Income Earned by Upper 1%, 10%, 20% of Households New York City 1990 – 2010 Asian Population ..................................................... 30
Figure 19: Median Household Income Earned by Lower 10%, 20% of Households New York City 1990 – 2010 Asian Population ..................................................... 31
Figure 20: Percentage of Total Household Income Earned by Top 1%, 5%, 10%, 20% of Households New York City 1990 – 2010 Latino Population ............................ 34
Figure 21: Percentage of Total Household Income Earned by Top 1%, 5%, 10%, 20% of Households by Race/Ethnic Group New York City 1990 – 2010 ..................... 35
Figure 22: Percentage of Total Household Income Earned by Lower 10%, 20%, 40% of Households New York City 1990 – 2010 Latino Population ............................. 35
Figure 23: Percentage of Total Household Income Earned by Lower 10%, 20%, 40% of Households by Race/Ethnic Group New York City 1990 – 2010 ..................... 36
Figure 24: Median Household Income Earned by Upper 1%, 10%, 20% of Households New York City 1990 – 2010 Latino Population .................................................... 38
Figure 25: Median Household Income Earned by Lower 10%, 20% of Households New York City 1990 – 2010 Latino Population .................................................... 38
Figure 26: Median Household Income Earned by Upper 1% of Households New York City Major Race/Ethnic Groups .................................................................. 39
Figure 27: Median Household Income Earned by Upper 5% of Households New York City Major Race/Ethnic Groups .................................................................. 39
Figure 28: Median Household Income Earned by Upper 10% of Households New York City Major Race/Ethnic Groups .................................................................. 40
Figure 29: Median Household Income New York City 2010 Largest Latino Nationalities ........................................................................................................ 42
Figure 30: Percentage of Household Income Earned by Upper 20% of Households New York City Largest Latino Nationalities ......................................................... 42
Household Income Concentration in New York City 8
Latino Data Project Report 56 January 2014
Figure 31: Median Household Income Earned by Upper 20% of Households New York City Largest Latino Nationalities ................................................................. 43
Figure 32: Percentage of Household Income Earned by Upper 10% of Households New York City Largest Latino Nationalities ......................................................... 44
Figure 33: Percentage of Household Income Earned by Upper 5% of Households New York City Largest Latino Nationalities ......................................................... 44
Figure 34: Percentage of Household Income Earned by Upper 1% of Households New York City Largest Latino Nationalities ........................................................ 45
Figure 35: Median Household Income Earned by Upper 10% of Households New York City 2010 Largest Latino Nationalities ........................................................ 45
Figure 36: Median Household Income Earned by Upper 5% of Households New York City 2010 Largest Latino Nationalities ........................................................ 46
Figure 37: Median Household Income Earned by Upper 1% of Households New York City 2010 Largest Latino Nationalities ........................................................ 46
Figure 38: Percentage of Total Household Income Earned by Lower 40% of Households New York City 2010 Largest Latino Nationalities ............................ 47
Figure 39: Gini Indexes for Household Income by Race/Ethnicity New York City, 1990 - 2010 ........................................................................................................ 49
Figure 40: Gini Indexes for Household Income by Latino Nationality New York City, 1990 - 2010 ........................................................................................................ 49
Household Income Concentration in New York City 9
Latino Data Project Report 56 January 2014
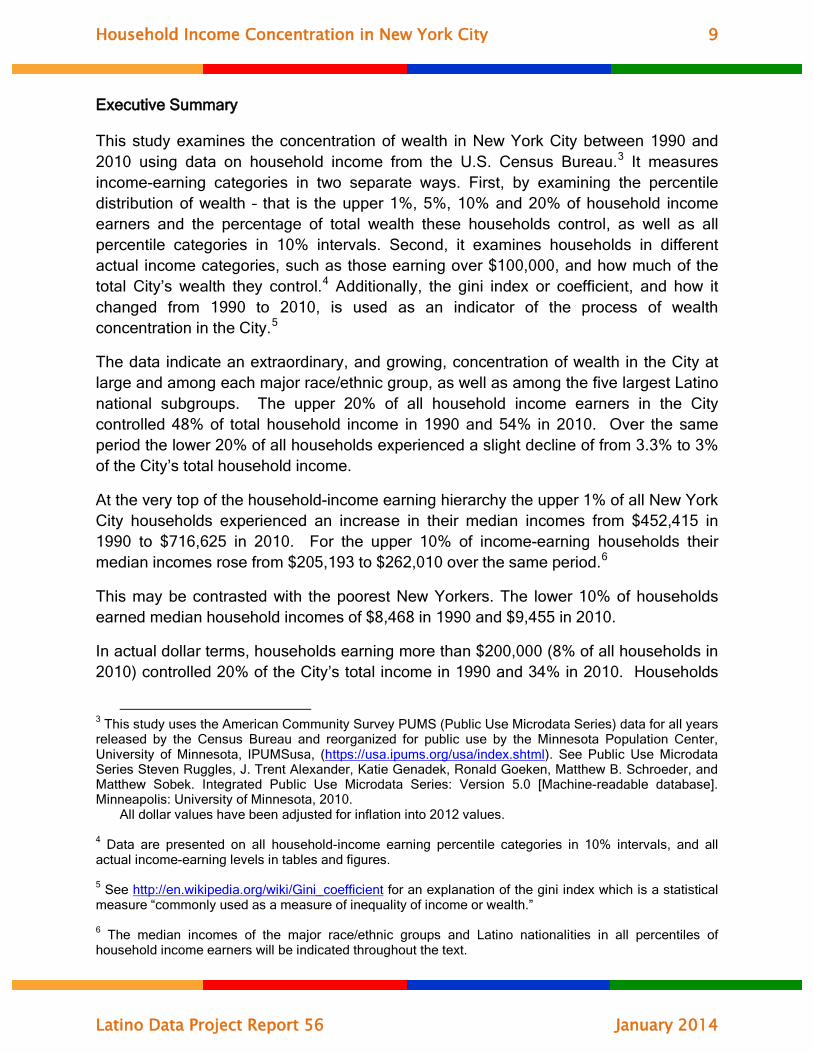
Executive Summary This study examines the concentration of wealth in New York City between 1990 and 2010 using data on household income from the U.S. Census Bureau.3 It measures income-earning categories in two separate ways. First, by examining the percentile distribution of wealth – that is the upper 1%, 5%, 10% and 20% of household income earners and the percentage of total wealth these households control, as well as all percentile categories in 10% intervals. Second, it examines households in different actual income categories, such as those earning over $100,000, and how much of the total City’s wealth they control.4 Additionally, the gini index or coefficient, and how it changed from 1990 to 2010, is used as an indicator of the process of wealth concentration in the City.5
The data indicate an extraordinary, and growing, concentration of wealth in the City at large and among each major race/ethnic group, as well as among the five largest Latino national subgroups. The upper 20% of all household income earners in the City controlled 48% of total household income in 1990 and 54% in 2010. Over the same period the lower 20% of all households experienced a slight decline of from 3.3% to 3% of the City’s total household income.
At the very top of the household-income earning hierarchy the upper 1% of all New York City households experienced an increase in their median incomes from $452,415 in 1990 to $716,625 in 2010. For the upper 10% of income-earning households their median incomes rose from $205,193 to $262,010 over the same period.6
This may be contrasted with the poorest New Yorkers. The lower 10% of households earned median household incomes of $8,468 in 1990 and $9,455 in 2010.
In actual dollar terms, households earning more than $200,000 (8% of all households in 2010) controlled 20% of the City’s total income in 1990 and 34% in 2010. Households
3 This study uses the American Community Survey PUMS (Public Use Microdata Series) data for all years released by the Census Bureau and reorganized for public use by the Minnesota Population Center, University of Minnesota, IPUMSusa, (https://usa.ipums.org/usa/index.shtml). See Public Use Microdata Series Steven Ruggles, J. Trent Alexander, Katie Genadek, Ronald Goeken, Matthew B. Schroeder, and Matthew Sobek. Integrated Public Use Microdata Series: Version 5.0 [Machine-readable database]. Minneapolis: University of Minnesota, 2010.
All dollar values have been adjusted for inflation into 2012 values.
4 Data are presented on all household-income earning percentile categories in 10% intervals, and all actual income-earning levels in tables and figures. 5 See http://en.wikipedia.org/wiki/Gini_coefficient for an explanation of the gini index which is a statistical measure “commonly used as a measure of inequality of income or wealth.” 6 The median incomes of the major race/ethnic groups and Latino nationalities in all percentiles of household income earners will be indicated throughout the text.
Household Income Concentration in New York City 10
Latino Data Project Report 56 January 2014
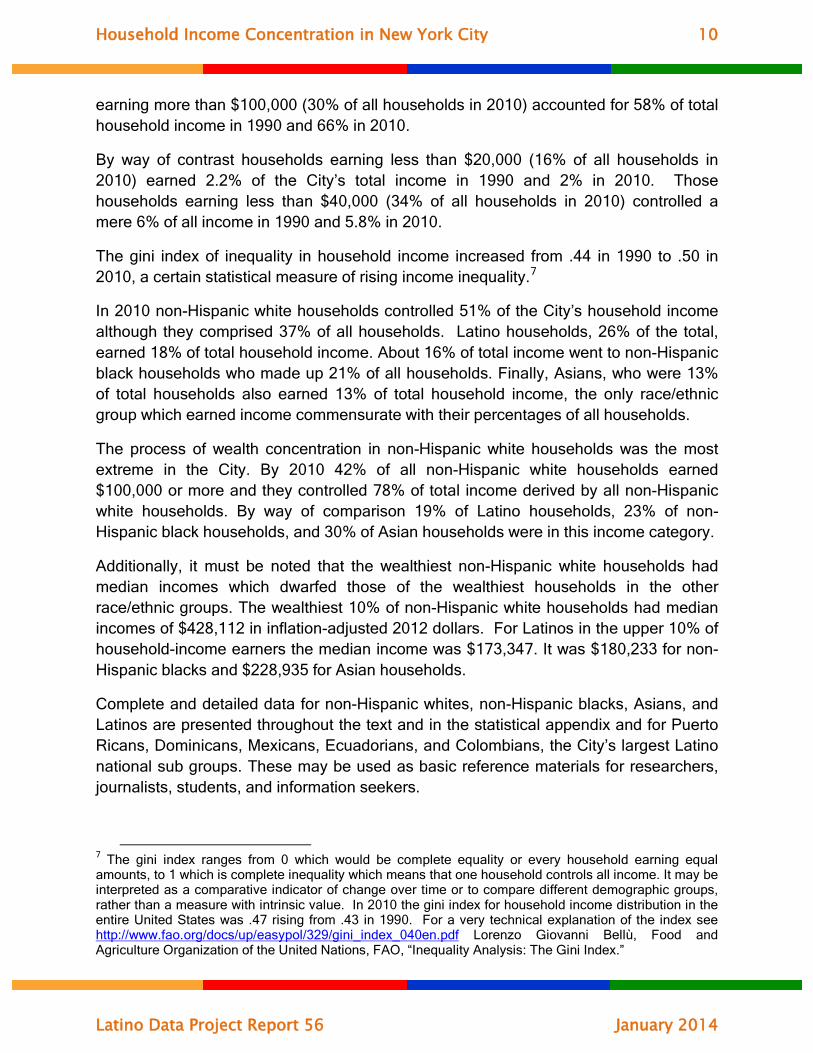
earning more than $100,000 (30% of all households in 2010) accounted for 58% of total household income in 1990 and 66% in 2010.
By way of contrast households earning less than $20,000 (16% of all households in 2010) earned 2.2% of the City’s total income in 1990 and 2% in 2010. Those households earning less than $40,000 (34% of all households in 2010) controlled a mere 6% of all income in 1990 and 5.8% in 2010.
The gini index of inequality in household income increased from .44 in 1990 to .50 in 2010, a certain statistical measure of rising income inequality.7
In 2010 non-Hispanic white households controlled 51% of the City’s household income although they comprised 37% of all households. Latino households, 26% of the total, earned 18% of total household income. About 16% of total income went to non-Hispanic black households who made up 21% of all households. Finally, Asians, who were 13% of total households also earned 13% of total household income, the only race/ethnic group which earned income commensurate with their percentages of all households.
The process of wealth concentration in non-Hispanic white households was the most extreme in the City. By 2010 42% of all non-Hispanic white households earned $100,000 or more and they controlled 78% of total income derived by all non-Hispanic white households. By way of comparison 19% of Latino households, 23% of non-Hispanic black households, and 30% of Asian households were in this income category.
Additionally, it must be noted that the wealthiest non-Hispanic white households had median incomes which dwarfed those of the wealthiest households in the other race/ethnic groups. The wealthiest 10% of non-Hispanic white households had median incomes of $428,112 in inflation-adjusted 2012 dollars. For Latinos in the upper 10% of household-income earners the median income was $173,347. It was $180,233 for non-Hispanic blacks and $228,935 for Asian households.
Complete and detailed data for non-Hispanic whites, non-Hispanic blacks, Asians, and Latinos are presented throughout the text and in the statistical appendix and for Puerto Ricans, Dominicans, Mexicans, Ecuadorians, and Colombians, the City’s largest Latino national sub groups. These may be used as basic reference materials for researchers, journalists, students, and information seekers.
7 The gini index ranges from 0 which would be complete equality or every household earning equal amounts, to 1 which is complete inequality which means that one household controls all income. It may be interpreted as a comparative indicator of change over time or to compare different demographic groups, rather than a measure with intrinsic value. In 2010 the gini index for household income distribution in the entire United States was .47 rising from .43 in 1990. For a very technical explanation of the index see http://www.fao.org/docs/up/easypol/329/gini_index_040en.pdf Lorenzo Giovanni Bellù, Food and Agriculture Organization of the United Nations, FAO, “Inequality Analysis: The Gini Index.”
Household Income Concentration in New York City 11
Latino Data Project Report 56 January 2014
6.1%
19.3%
30.5%
47.5%
8.0%
24.4%
35.8%
52.2%
8.5%
25.4%
37.0%
53.7%
Upper 1% Upper 5% Upper 10% Upper 20%
Figure 1Percentage of Total Household Income Earned by Top 1%, 5%, 10%, 20% of Households
New York City 1990 - 2010Total Population
1990 2000 2010
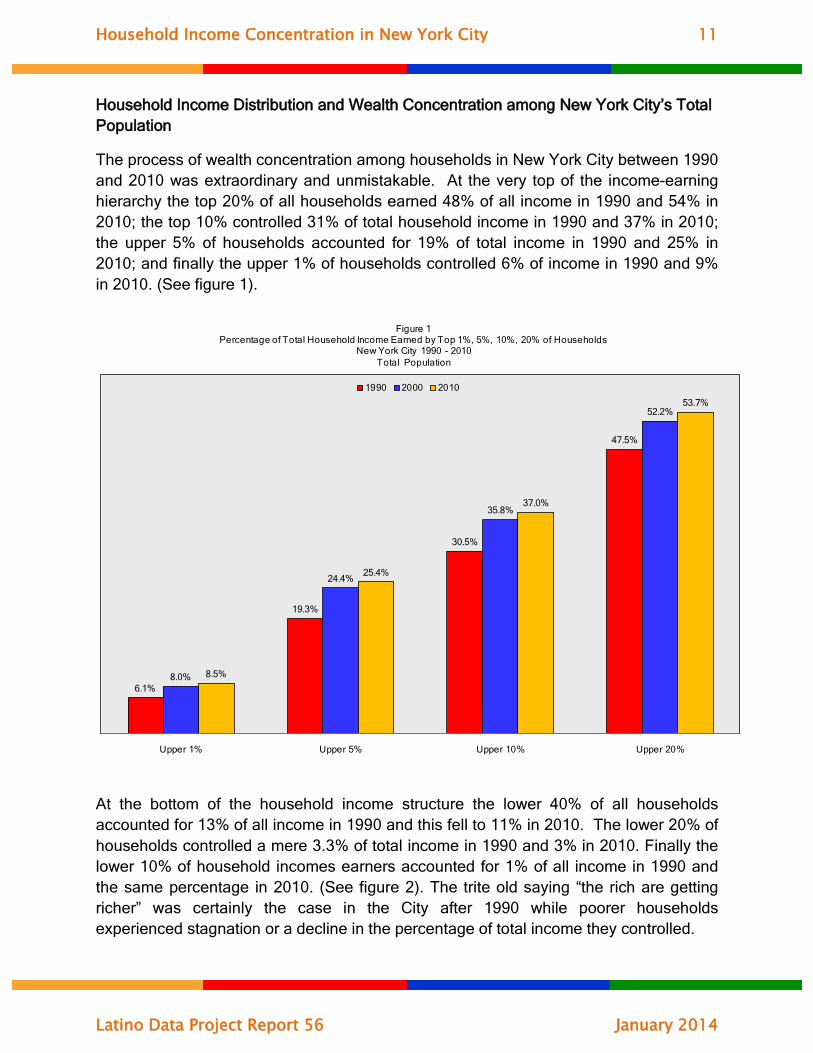
Household Income Distribution and Wealth Concentration among New York City’s Total Population
The process of wealth concentration among households in New York City between 1990 and 2010 was extraordinary and unmistakable. At the very top of the income-earning hierarchy the top 20% of all households earned 48% of all income in 1990 and 54% in 2010; the top 10% controlled 31% of total household income in 1990 and 37% in 2010; the upper 5% of households accounted for 19% of total income in 1990 and 25% in 2010; and finally the upper 1% of households controlled 6% of income in 1990 and 9% in 2010. (See figure 1).
At the bottom of the household income structure the lower 40% of all households accounted for 13% of all income in 1990 and this fell to 11% in 2010. The lower 20% of households controlled a mere 3.3% of total income in 1990 and 3% in 2010. Finally the lower 10% of household incomes earners accounted for 1% of all income in 1990 and the same percentage in 2010. (See figure 2). The trite old saying “the rich are getting richer” was certainly the case in the City after 1990 while poorer households experienced stagnation or a decline in the percentage of total income they controlled.

Household Income Concentration in New York City 12
Latino Data Project Report 56 January 2014
0.9%
3.3%
12.7%
0.8%
2.9%
11.2%
0.9%
3.0%
10.7%
Lower 10% Lower 20% Lower 40%
Figure 2Percentage of Total Household Income Earned by Lower 10%, 20%, 40% of Households
New York City 1990 - 2010Total Population
1990 2000 2010
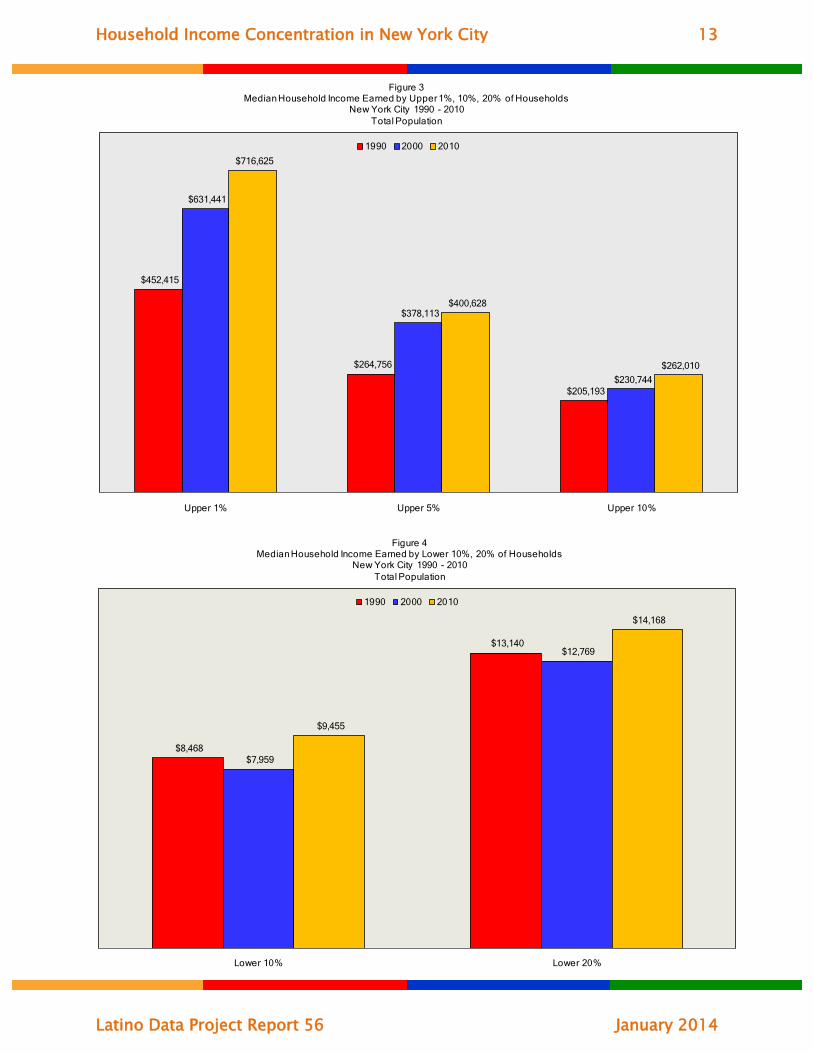
Perhaps the most graphic indicator of how wealth was concentrated among the total population of the City is by examining in meteoric increase in median household incomes among the wealthiest New York City households. The upper 1% of all households had median incomes of $452,415 in 1990 and $716,625 in 2010. The upper 5% of households had median incomes of $264,756 in 1990 and $400,628 in 2010. Finally, the upper 20% of households had median incomes of $205,193 in 1990 and $262,010 in 2010. (See figure 3),
Over the same period the lower 20% of income-earning households experienced modest increases in median household income of $13,140 in 1990 to $14,168 in 2010 while the lower 10% went from $8,468 to $9,455. (See figure 4),
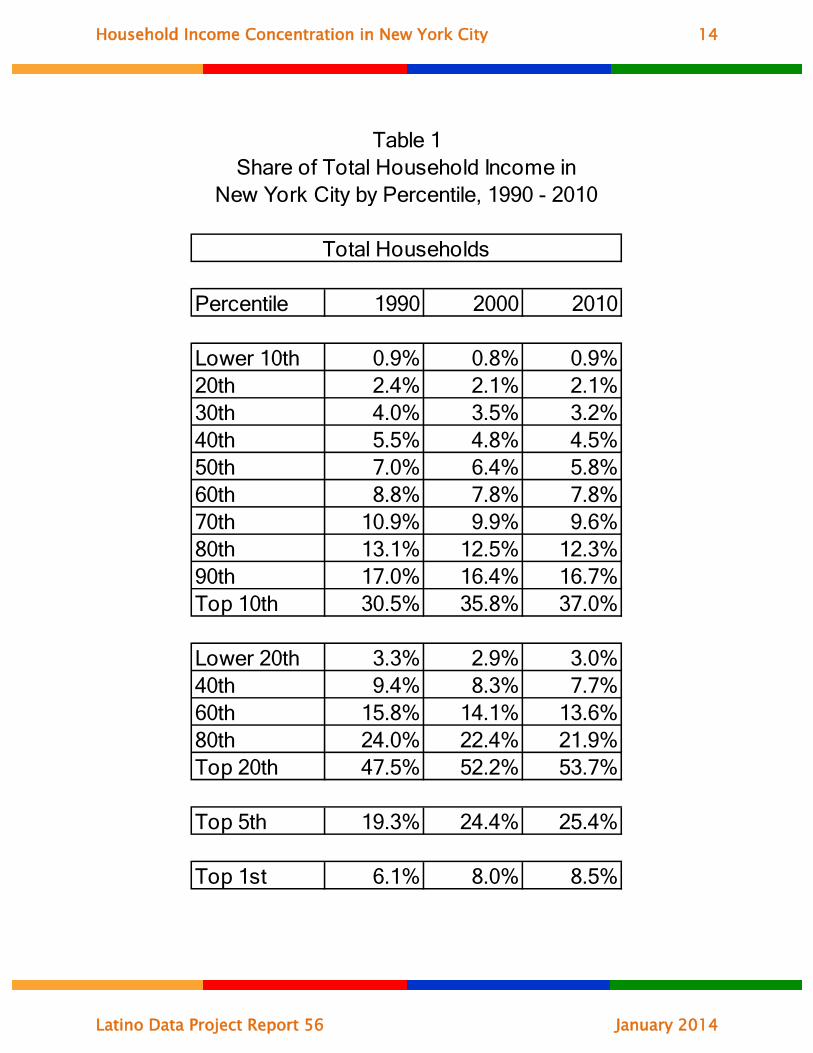
Complete data on the percentage of income controlled by the different percentiles of households in the income earning hierarchy are provided in table 1.
Household Income Concentration in New York City 13
Latino Data Project Report 56 January 2014
$452,415
$264,756
$205,193
$631,441
$378,113
$230,744
$716,625
$400,628
$262,010
Upper 1% Upper 5% Upper 10%
Figure 3Median Household Income Earned by Upper 1%, 10%, 20% of Households
New York City 1990 - 2010Total Population
1990 2000 2010
$8,468
$13,140
$7,959
$12,769
$9,455
$14,168
Lower 10% Lower 20%
Figure 4Median Household Income Earned by Lower 10%, 20% of Households
New York City 1990 - 2010Total Population
1990 2000 2010
Household Income Concentration in New York City 14
Latino Data Project Report 56 January 2014
Percentile 1990 2000 2010
Lower 10th 0.9% 0.8% 0.9%20th 2.4% 2.1% 2.1%30th 4.0% 3.5% 3.2%40th 5.5% 4.8% 4.5%50th 7.0% 6.4% 5.8%60th 8.8% 7.8% 7.8%70th 10.9% 9.9% 9.6%80th 13.1% 12.5% 12.3%90th 17.0% 16.4% 16.7%Top 10th 30.5% 35.8% 37.0%
Lower 20th 3.3% 2.9% 3.0%40th 9.4% 8.3% 7.7%60th 15.8% 14.1% 13.6%80th 24.0% 22.4% 21.9%Top 20th 47.5% 52.2% 53.7%
Top 5th 19.3% 24.4% 25.4%
Top 1st 6.1% 8.0% 8.5%
Table 1Share of Total Household Income in
New York City by Percentile, 1990 - 2010
Total Households
Household Income Concentration in New York City 15
Latino Data Project Report 56 January 2014
Household Income 1990 2000 2010 1990 2000 2010
Less than 20,000 15.9% 17.1% 15.9% 2.2% 2.2% 2.0%20,000-39,999 15.9% 17.5% 18.0% 6.0% 6.2% 5.8%40,000-59,999 16.1% 15.7% 15.3% 10.0% 9.2% 8.2%60,000-79,999 13.6% 12.9% 11.6% 11.9% 10.6% 8.8%80,000-99,999 10.9% 9.8% 9.1% 12.2% 10.3% 8.8%100,000 - 199,999 22.2% 20.2% 21.7% 37.5% 32.5% 32.5%200,000 + 5.4% 6.8% 8.4% 20.3% 29.0% 33.9%
Total 100.0% 100.0% 100.0% 100.0% 100.0% 100.0%
Percentage of Households Percentage of Income
Table 2Percentage of Households and Total Household Income
by Income-Earning Category in New York City, 1990 - 2010
Total Population
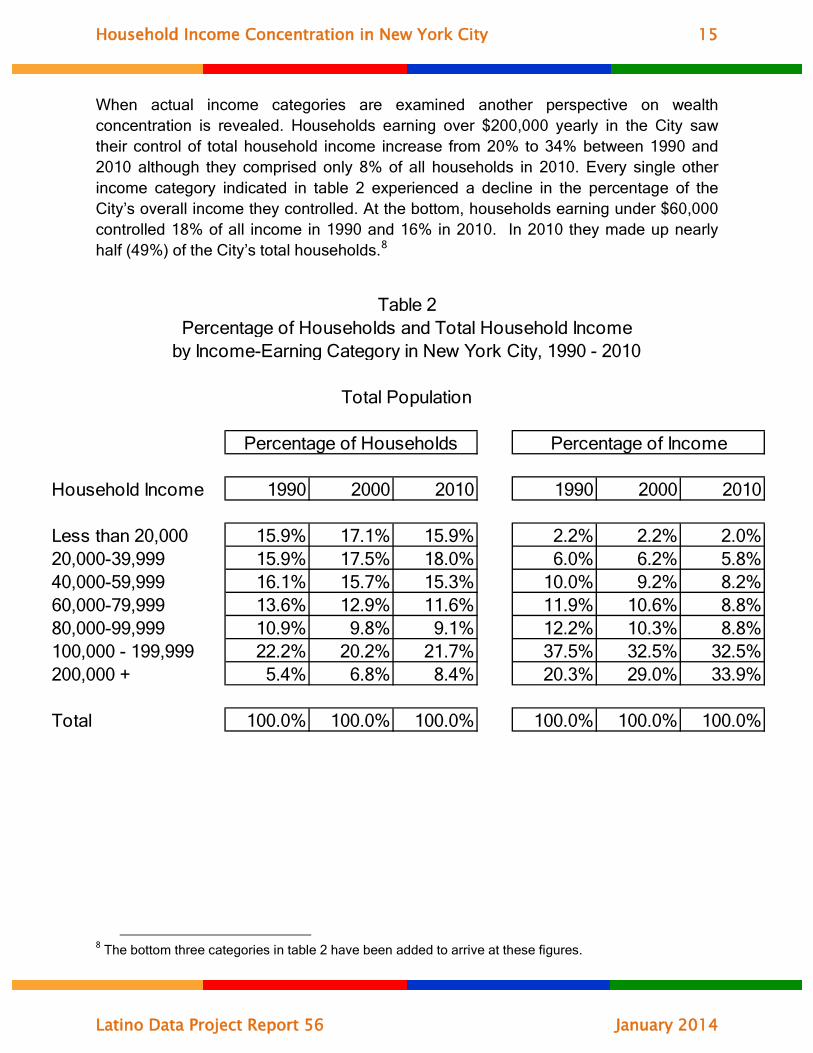
When actual income categories are examined another perspective on wealth concentration is revealed. Households earning over $200,000 yearly in the City saw their control of total household income increase from 20% to 34% between 1990 and 2010 although they comprised only 8% of all households in 2010. Every single other income category indicated in table 2 experienced a decline in the percentage of the City’s overall income they controlled. At the bottom, households earning under $60,000 controlled 18% of all income in 1990 and 16% in 2010. In 2010 they made up nearly half (49%) of the City’s total households.8
8 The bottom three categories in table 2 have been added to arrive at these figures.
Household Income Concentration in New York City 16
Latino Data Project Report 56 January 2014
37.1%
26.1%
21.4%
13.4%
50.5%
18.4%16.0%
13.0%
Non-Hispanic White Latino Non-Hispanic Black Asian
Figure 5Percentage of Total Households and Income by Race/Ethnicity
New York City, 2010
% of Total Households % of Total Income
Household Income and Race/Ethnicity
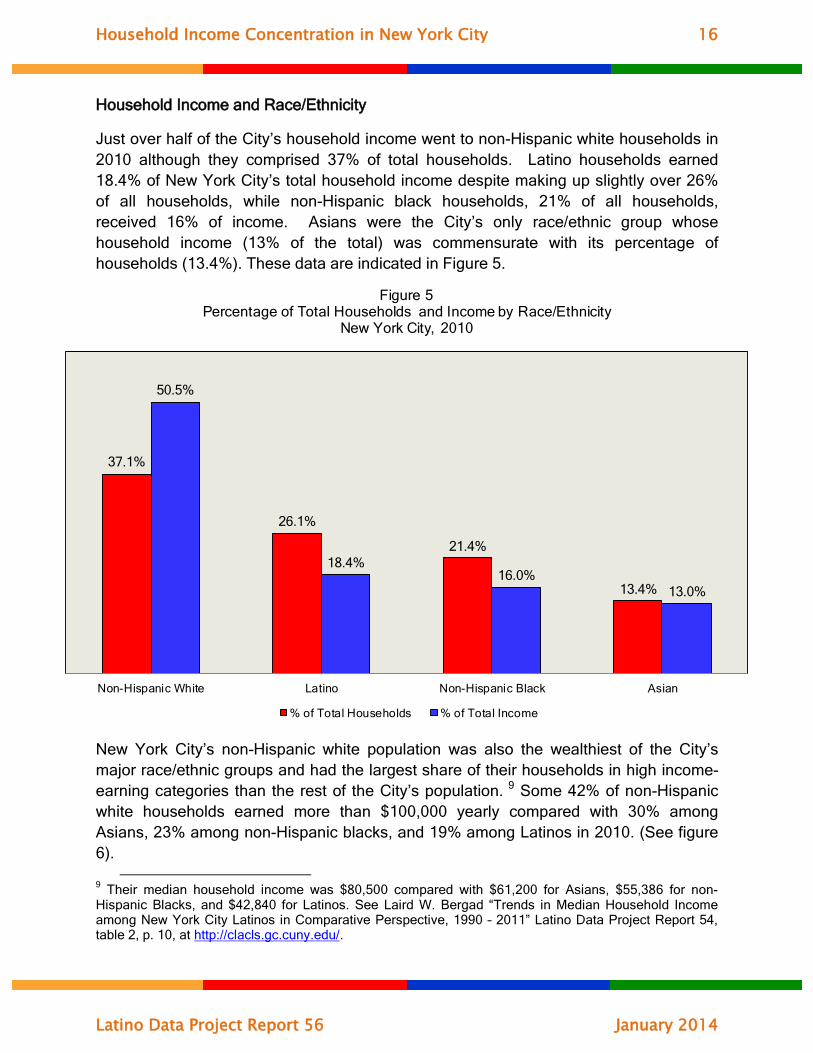
Just over half of the City’s household income went to non-Hispanic white households in 2010 although they comprised 37% of total households. Latino households earned 18.4% of New York City’s total household income despite making up slightly over 26% of all households, while non-Hispanic black households, 21% of all households, received 16% of income. Asians were the City’s only race/ethnic group whose household income (13% of the total) was commensurate with its percentage of households (13.4%). These data are indicated in Figure 5.
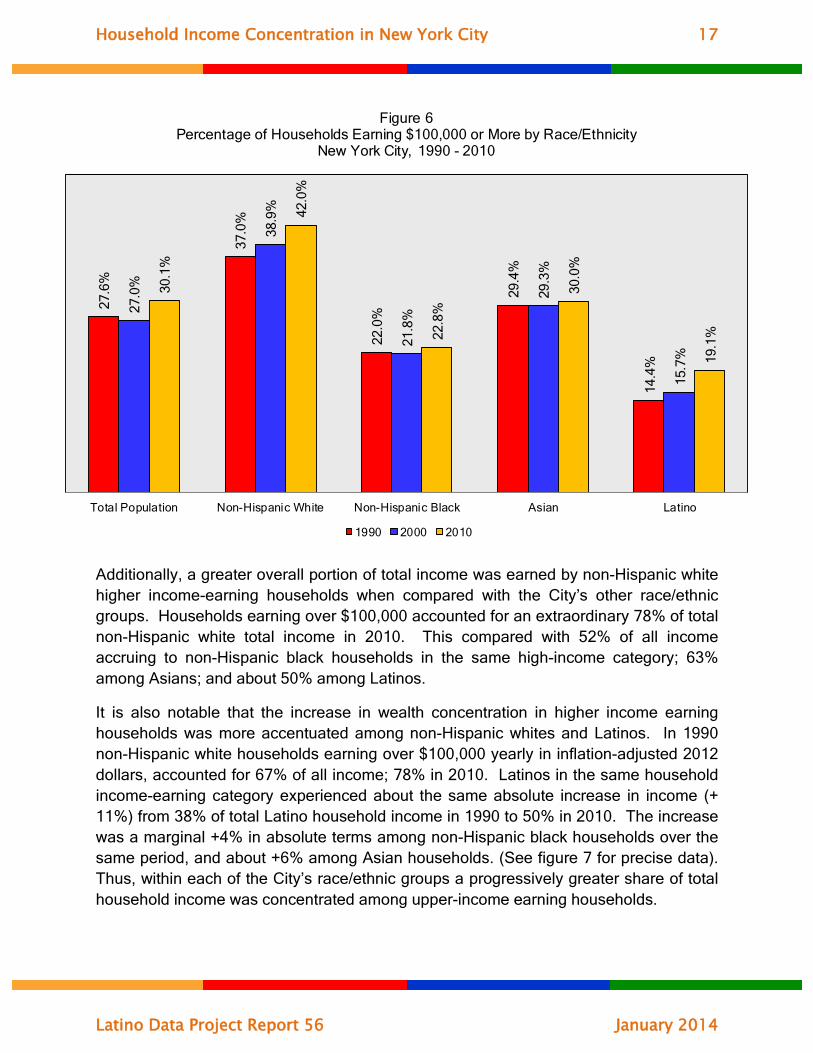
New York City’s non-Hispanic white population was also the wealthiest of the City’s major race/ethnic groups and had the largest share of their households in high income-earning categories than the rest of the City’s population. 9 Some 42% of non-Hispanic white households earned more than $100,000 yearly compared with 30% among Asians, 23% among non-Hispanic blacks, and 19% among Latinos in 2010. (See figure 6).
9 Their median household income was $80,500 compared with $61,200 for Asians, $55,386 for non-Hispanic Blacks, and $42,840 for Latinos. See Laird W. Bergad “Trends in Median Household Income among New York City Latinos in Comparative Perspective, 1990 – 2011” Latino Data Project Report 54, table 2, p. 10, at http://clacls.gc.cuny.edu/.
Household Income Concentration in New York City 17
Latino Data Project Report 56 January 2014
27.6
%
37.0
%
22.0
%
29.4
%
14.4
%
27.0
%
38.9
%
21.8
%
29.3
%
15.7
%
30.1
%
42.0
%
22.8
%
30.0
%
19.1
%
Total Population Non-Hispanic White Non-Hispanic Black Asian Latino
Figure 6Percentage of Households Earning $100,000 or More by Race/Ethnicity
New York City, 1990 - 2010
1990 2000 2010
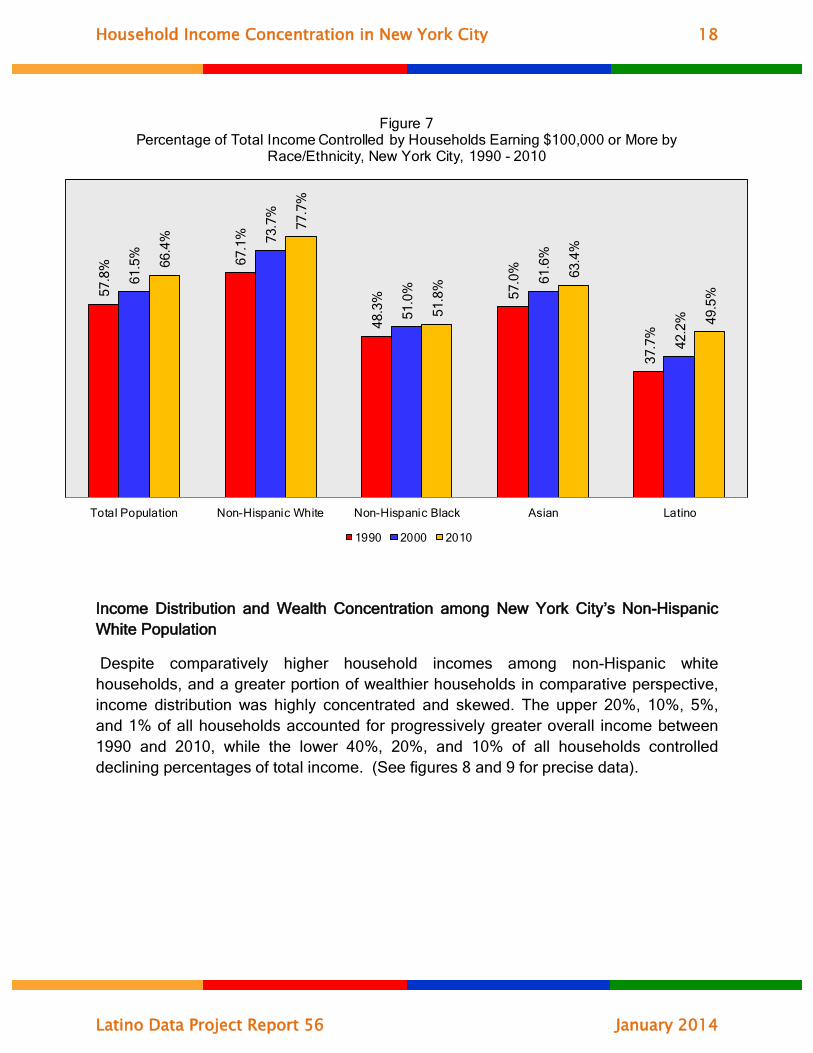
Additionally, a greater overall portion of total income was earned by non-Hispanic white higher income-earning households when compared with the City’s other race/ethnic groups. Households earning over $100,000 accounted for an extraordinary 78% of total non-Hispanic white total income in 2010. This compared with 52% of all income accruing to non-Hispanic black households in the same high-income category; 63% among Asians; and about 50% among Latinos.
It is also notable that the increase in wealth concentration in higher income earning households was more accentuated among non-Hispanic whites and Latinos. In 1990 non-Hispanic white households earning over $100,000 yearly in inflation-adjusted 2012 dollars, accounted for 67% of all income; 78% in 2010. Latinos in the same household income-earning category experienced about the same absolute increase in income (+ 11%) from 38% of total Latino household income in 1990 to 50% in 2010. The increase was a marginal +4% in absolute terms among non-Hispanic black households over the same period, and about +6% among Asian households. (See figure 7 for precise data). Thus, within each of the City’s race/ethnic groups a progressively greater share of total household income was concentrated among upper-income earning households.
Household Income Concentration in New York City 18
Latino Data Project Report 56 January 2014
57.8
% 67.1
%
48.3
% 57.0
%
37.7
%
61.5
%
73.7
%
51.0
%
61.6
%
42.2
%
66.4
%
77.7
%
51.8
%
63.4
%
49.5
%
Total Population Non-Hispanic White Non-Hispanic Black Asian Latino
Figure 7Percentage of Total Income Controlled by Households Earning $100,000 or More by
Race/Ethnicity, New York City, 1990 - 2010
1990 2000 2010
Income Distribution and Wealth Concentration among New York City’s Non-Hispanic White Population
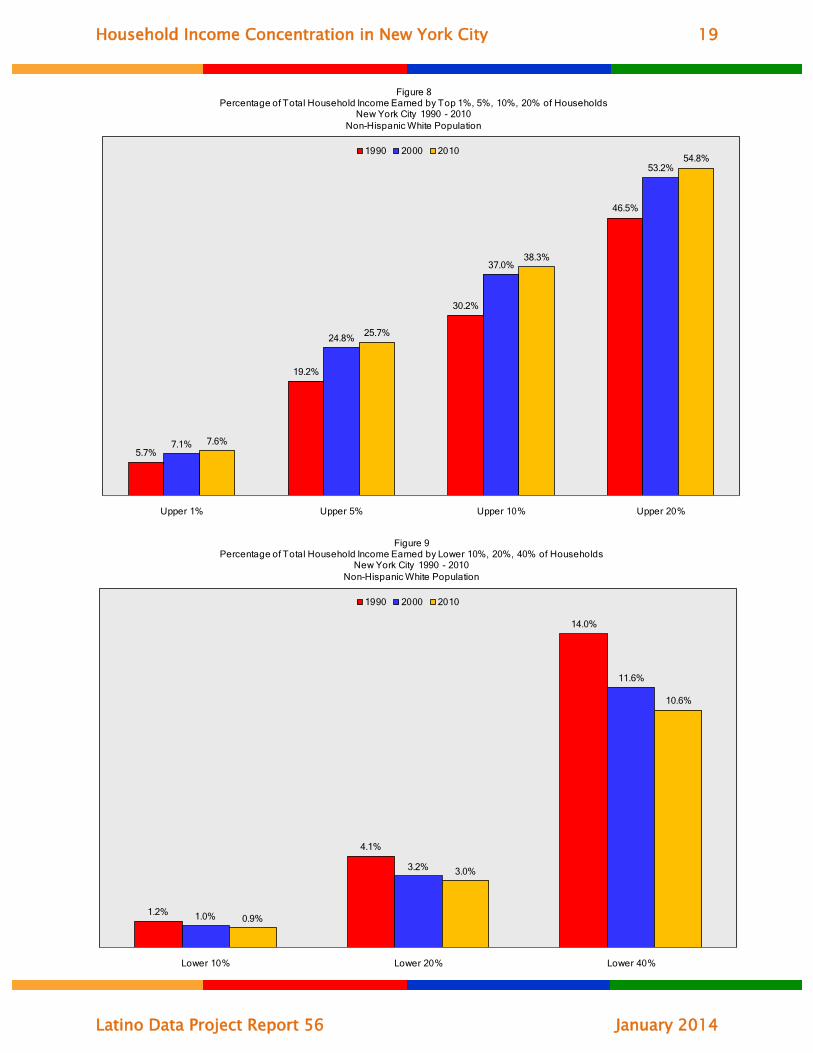
Despite comparatively higher household incomes among non-Hispanic white households, and a greater portion of wealthier households in comparative perspective, income distribution was highly concentrated and skewed. The upper 20%, 10%, 5%, and 1% of all households accounted for progressively greater overall income between 1990 and 2010, while the lower 40%, 20%, and 10% of all households controlled declining percentages of total income. (See figures 8 and 9 for precise data).
Household Income Concentration in New York City 19
Latino Data Project Report 56 January 2014
5.7%
19.2%
30.2%
46.5%
7.1%
24.8%
37.0%
53.2%
7.6%
25.7%
38.3%
54.8%
Upper 1% Upper 5% Upper 10% Upper 20%
Figure 8Percentage of Total Household Income Earned by Top 1%, 5%, 10%, 20% of Households
New York City 1990 - 2010Non-Hispanic White Population
1990 2000 2010
1.2%
4.1%
14.0%
1.0%
3.2%
11.6%
0.9%
3.0%
10.6%
Lower 10% Lower 20% Lower 40%
Figure 9Percentage of Total Household Income Earned by Lower 10%, 20%, 40% of Households
New York City 1990 - 2010Non-Hispanic White Population
1990 2000 2010
Household Income Concentration in New York City 20
Latino Data Project Report 56 January 2014
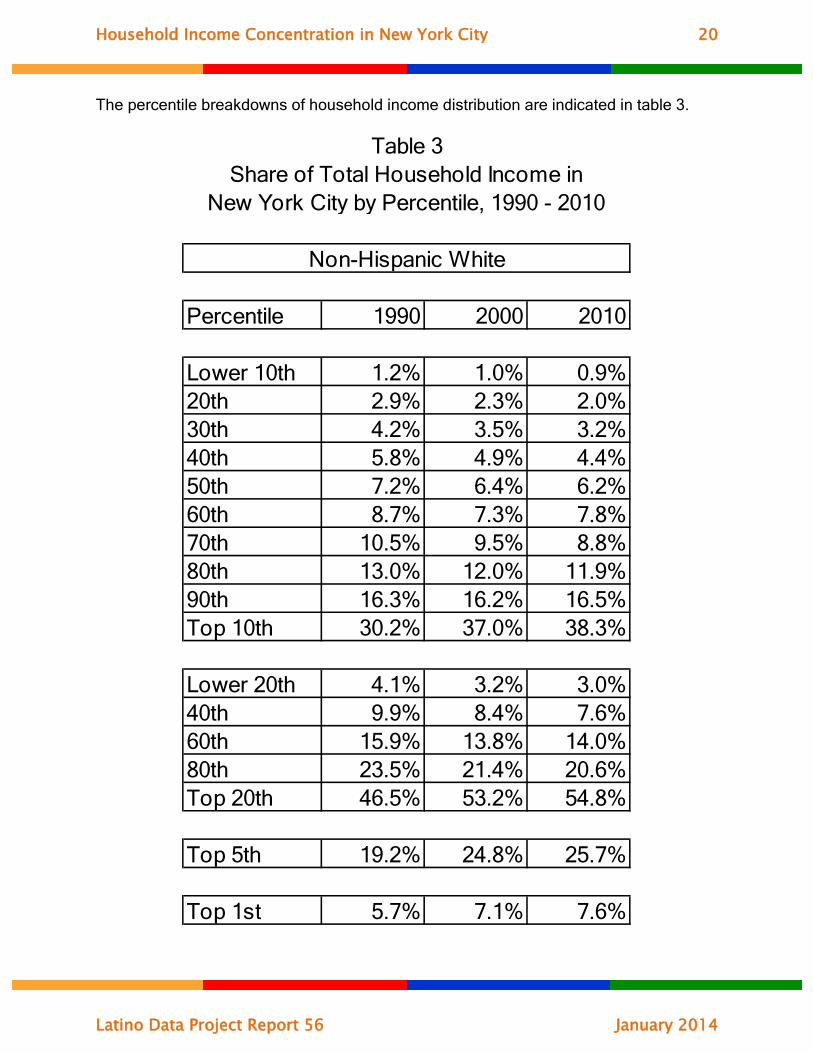
Percentile 1990 2000 2010
Lower 10th 1.2% 1.0% 0.9%20th 2.9% 2.3% 2.0%30th 4.2% 3.5% 3.2%40th 5.8% 4.9% 4.4%50th 7.2% 6.4% 6.2%60th 8.7% 7.3% 7.8%70th 10.5% 9.5% 8.8%80th 13.0% 12.0% 11.9%90th 16.3% 16.2% 16.5%Top 10th 30.2% 37.0% 38.3%
Lower 20th 4.1% 3.2% 3.0%40th 9.9% 8.4% 7.6%60th 15.9% 13.8% 14.0%80th 23.5% 21.4% 20.6%Top 20th 46.5% 53.2% 54.8%
Top 5th 19.2% 24.8% 25.7%
Top 1st 5.7% 7.1% 7.6%
Non-Hispanic White
Table 3Share of Total Household Income in
New York City by Percentile, 1990 - 2010
The percentile breakdowns of household income distribution are indicated in table 3.
Household Income Concentration in New York City 21
Latino Data Project Report 56 January 2014
$529,776
$351,978
$253,560
$809,356
$519,099
$399,549
$869,820
$575,692
$428,112
Upper 1% Upper 5% Upper 10%
Figure 10Median Household Income Earned by Upper 1%, 10%, 20% of Households
New York City 1990 - 2010Non-Hispanic White Population
1990 2000 2010
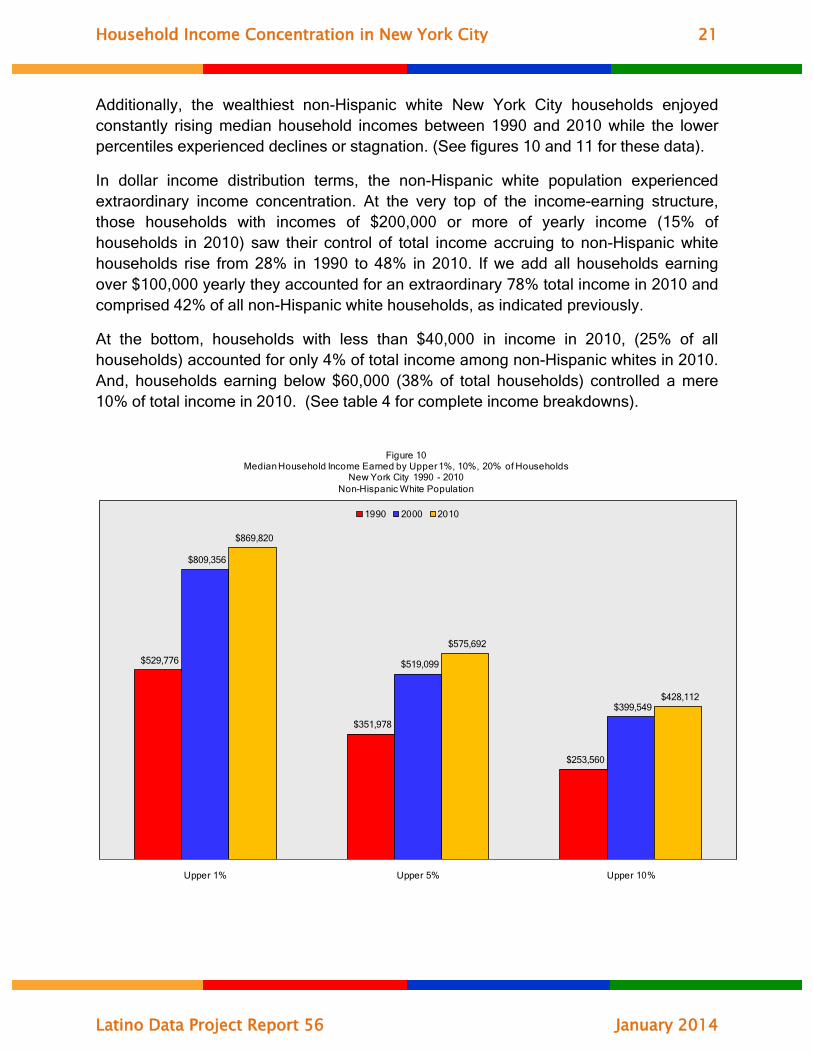
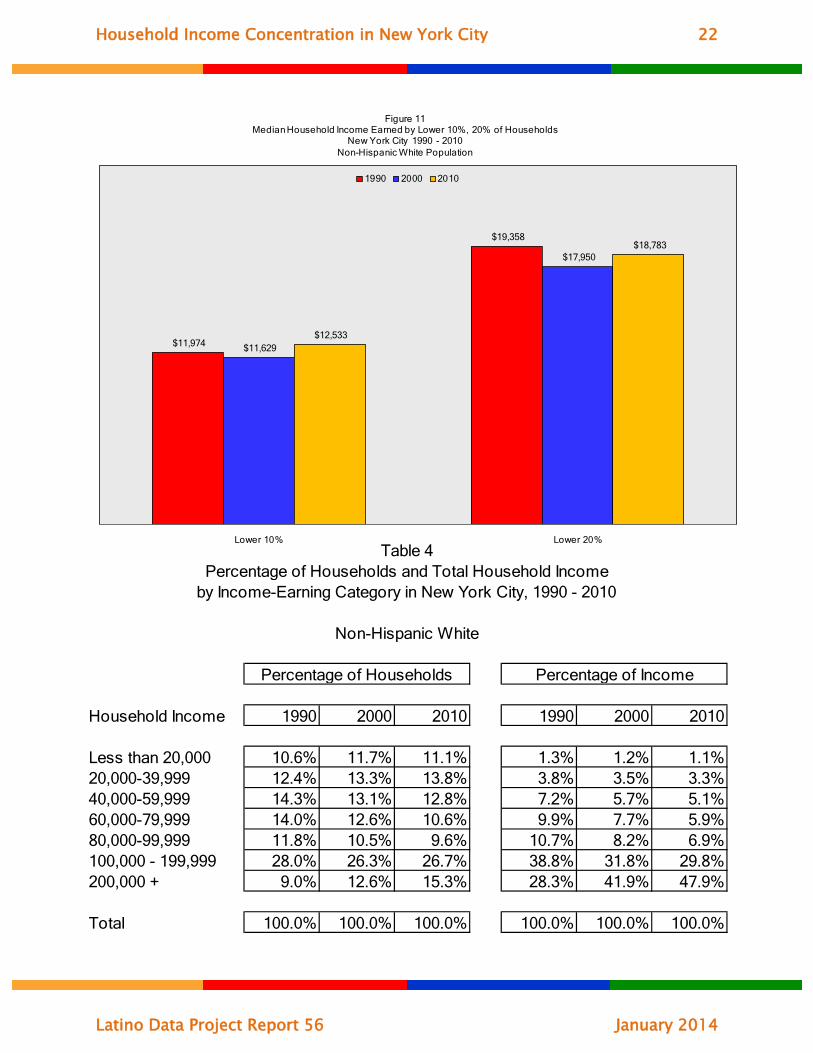
Additionally, the wealthiest non-Hispanic white New York City households enjoyed constantly rising median household incomes between 1990 and 2010 while the lower percentiles experienced declines or stagnation. (See figures 10 and 11 for these data).
In dollar income distribution terms, the non-Hispanic white population experienced extraordinary income concentration. At the very top of the income-earning structure, those households with incomes of $200,000 or more of yearly income (15% of households in 2010) saw their control of total income accruing to non-Hispanic white households rise from 28% in 1990 to 48% in 2010. If we add all households earning over $100,000 yearly they accounted for an extraordinary 78% total income in 2010 and comprised 42% of all non-Hispanic white households, as indicated previously.
At the bottom, households with less than $40,000 in income in 2010, (25% of all households) accounted for only 4% of total income among non-Hispanic whites in 2010. And, households earning below $60,000 (38% of total households) controlled a mere 10% of total income in 2010. (See table 4 for complete income breakdowns).
Household Income Concentration in New York City 22
Latino Data Project Report 56 January 2014
$11,974
$19,358
$11,629
$17,950
$12,533
$18,783
Lower 10% Lower 20%
Figure 11Median Household Income Earned by Lower 10%, 20% of Households
New York City 1990 - 2010Non-Hispanic White Population
1990 2000 2010
Household Income 1990 2000 2010 1990 2000 2010
Less than 20,000 10.6% 11.7% 11.1% 1.3% 1.2% 1.1%20,000-39,999 12.4% 13.3% 13.8% 3.8% 3.5% 3.3%40,000-59,999 14.3% 13.1% 12.8% 7.2% 5.7% 5.1%60,000-79,999 14.0% 12.6% 10.6% 9.9% 7.7% 5.9%80,000-99,999 11.8% 10.5% 9.6% 10.7% 8.2% 6.9%100,000 - 199,999 28.0% 26.3% 26.7% 38.8% 31.8% 29.8%200,000 + 9.0% 12.6% 15.3% 28.3% 41.9% 47.9%
Total 100.0% 100.0% 100.0% 100.0% 100.0% 100.0%
Table 4Percentage of Households and Total Household Income
by Income-Earning Category in New York City, 1990 - 2010
Non-Hispanic White
Percentage of Households Percentage of Income
Household Income Concentration in New York City 23
Latino Data Project Report 56 January 2014
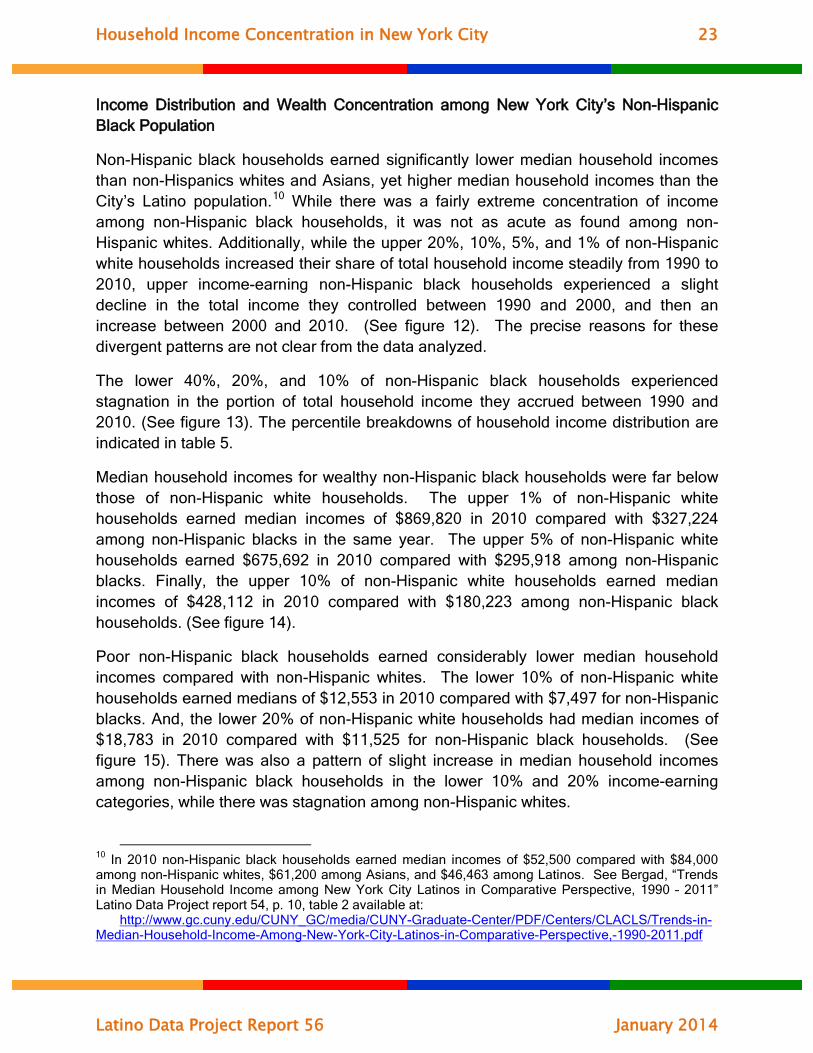
Income Distribution and Wealth Concentration among New York City’s Non-Hispanic Black Population
Non-Hispanic black households earned significantly lower median household incomes than non-Hispanics whites and Asians, yet higher median household incomes than the City’s Latino population.10 While there was a fairly extreme concentration of income among non-Hispanic black households, it was not as acute as found among non-Hispanic whites. Additionally, while the upper 20%, 10%, 5%, and 1% of non-Hispanic white households increased their share of total household income steadily from 1990 to 2010, upper income-earning non-Hispanic black households experienced a slight decline in the total income they controlled between 1990 and 2000, and then an increase between 2000 and 2010. (See figure 12). The precise reasons for these divergent patterns are not clear from the data analyzed.
The lower 40%, 20%, and 10% of non-Hispanic black households experienced stagnation in the portion of total household income they accrued between 1990 and 2010. (See figure 13). The percentile breakdowns of household income distribution are indicated in table 5.
Median household incomes for wealthy non-Hispanic black households were far below those of non-Hispanic white households. The upper 1% of non-Hispanic white households earned median incomes of $869,820 in 2010 compared with $327,224 among non-Hispanic blacks in the same year. The upper 5% of non-Hispanic white households earned $675,692 in 2010 compared with $295,918 among non-Hispanic blacks. Finally, the upper 10% of non-Hispanic white households earned median incomes of $428,112 in 2010 compared with $180,223 among non-Hispanic black households. (See figure 14).
Poor non-Hispanic black households earned considerably lower median household incomes compared with non-Hispanic whites. The lower 10% of non-Hispanic white households earned medians of $12,553 in 2010 compared with $7,497 for non-Hispanic blacks. And, the lower 20% of non-Hispanic white households had median incomes of $18,783 in 2010 compared with $11,525 for non-Hispanic black households. (See figure 15). There was also a pattern of slight increase in median household incomes among non-Hispanic black households in the lower 10% and 20% income-earning categories, while there was stagnation among non-Hispanic whites.
10 In 2010 non-Hispanic black households earned median incomes of $52,500 compared with $84,000 among non-Hispanic whites, $61,200 among Asians, and $46,463 among Latinos. See Bergad, “Trends in Median Household Income among New York City Latinos in Comparative Perspective, 1990 – 2011” Latino Data Project report 54, p. 10, table 2 available at:
http://www.gc.cuny.edu/CUNY_GC/media/CUNY-Graduate-Center/PDF/Centers/CLACLS/Trends-in-Median-Household-Income-Among-New-York-City-Latinos-in-Comparative-Perspective,-1990-2011.pdf

Household Income Concentration in New York City 24
Latino Data Project Report 56 January 2014
4.7%
16.3%
27.5%
45.2%
6.8%
11.4%
21.9%
40.2%
5.3%
18.1%
29.5%
47.5%
Upper 1% Upper 5% Upper 10% Upper 20%
Figure 12Percentage of Total Household Income Earned by Top 1%, 5%, 10%, 20% of Households
New York City 1990 - 2010Non-Hispanic Black Population
1990 2000 2010
0.8%
3.1%
12.8%
1.2%
3.7%
14.7%
1.0%
3.4%
13.0%
Lower 10% Lower 20% Lower 40%
Figure 13Percentage of Total Household Income Earned by Lower 10%, 20%, 40% of Households
New York City 1990 - 2010Non-Hispanic Black Population
1990 2000 2010

Household Income Concentration in New York City 25
Latino Data Project Report 56 January 2014
Percentile 1990 2000 2010
Lower 10th 0.8% 1.2% 1.0%20th 2.3% 2.5% 2.4%30th 4.3% 4.6% 4.2%40th 5.4% 6.4% 5.4%50th 7.3% 8.0% 6.4%60th 9.2% 9.8% 8.5%70th 11.4% 12.5% 10.8%80th 14.0% 14.7% 13.9%90th 17.7% 18.3% 18.0%Top 10th 27.5% 21.9% 29.5%
Lower 20th 3.1% 3.7% 3.4%40th 9.7% 11.0% 9.6%60th 16.6% 17.8% 14.9%80th 25.4% 27.2% 24.6%Top 20th 45.2% 40.2% 47.5%
Top 5th 16.3% 11.4% 18.1%
Top 1st 4.7% 6.8% 5.3%
Non-Hispanic Black
Table 5Share of Total Household Income in
New York City by Percentile, 1990 - 2010

Household Income Concentration in New York City 26
Latino Data Project Report 56 January 2014
$290,414
$198,951
$167,921
$469,718
$295,918
$210,723
$327,224
$219,807
$180,233
Upper 1% Upper 5% Upper 10%
Figure 14Median Household Income Earned by Upper 1%, 10%, 20% of Households
New York City 1990 - 2010Non-Hispanic Black Population
1990 2000 2010
$6,056
$10,290
$6,895
$10,626
$7,497
$11,525
Lower 10% Lower 20%
Figure 15Median Household Income Earned by Lower 10%, 20% of Households
New York City 1990 - 2010Non-Hispanic Black Population
1990 2000 2010
Household Income Concentration in New York City 27
Latino Data Project Report 56 January 2014
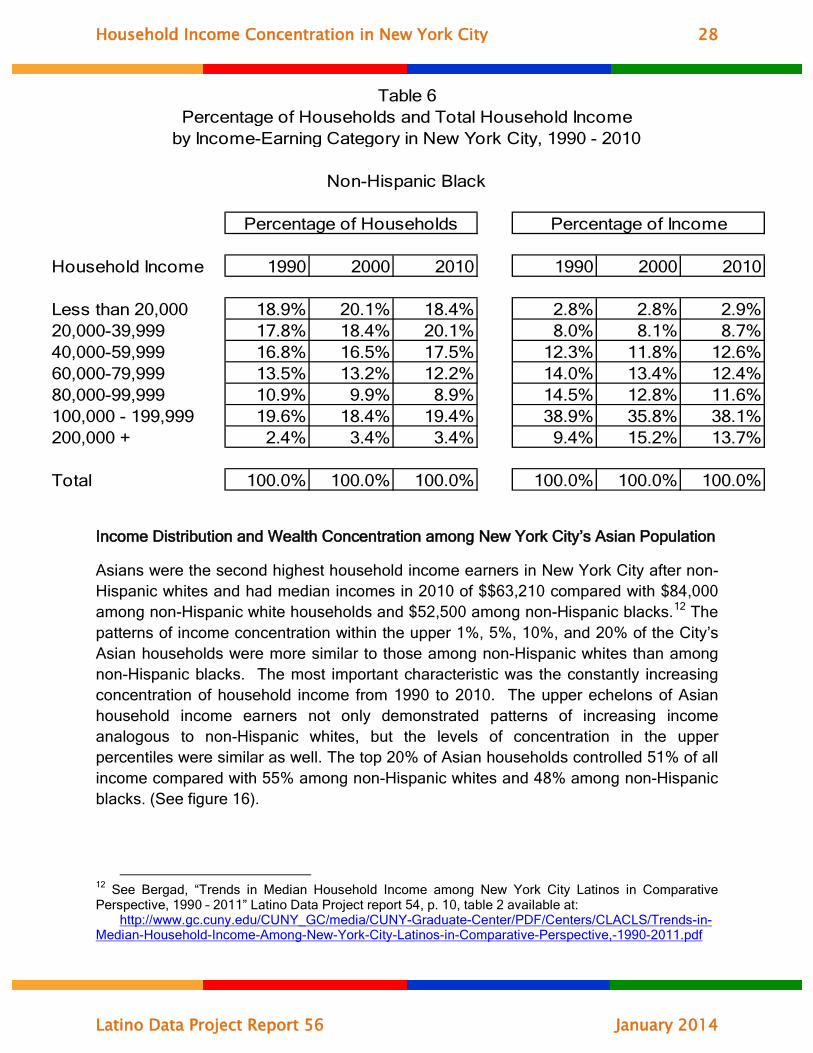
When income distribution is measured in dollar terms, a much smaller percentage of non-Hispanic black households earned over $200,000 (3.4%) compared with non-Hispanic whites (15.3%) and they controlled a much smaller percentage of overall household income (13.7% in 2010) compared to 48% among non-Hispanic white households in the same year.
Additionally, there was little change in both the percentage of households earning over $100,000 yearly among the City’s non-Hispanic blacks (22% in 1990 and 23% in 2010) and in the percentage of all income they controlled (48% in 1990 and 52% in 2010). This was very different from the pattern observed among non-Hispanic whites earning over $100,000 yearly whose share of household income increased from 67% in 1990 to 78% in 2010. (See table 4 above for data on non-Hispanic white households). Thus, while there was clearly a great deal of wealth concentration within the non-Hispanic black community of New York City it was at both lower income levels, and not nearly as extreme as among the non-Hispanic white population.11
At the lower end of the income-earning hierarchy about 39% of all non-Hispanic black households earned under $40,000 yearly in 2010 compared with 25% of non-Hispanic whites. These households controlled 12% of all income compared with only 4% among non-Hispanic white households in the same income category. Thus, there were comparatively higher poorer non-Hispanic black households, but a greater share of income accrued to these households than to non-Hispanic whites in the same income category.
One other characteristic may be noted among lower income-earning households. Between 1990 and 2010 they did not change very much in terms of their relative percentages nor in the portion of total income earned. Among non-Hispanic whites 23% of all households earned less than $40,000 in 1990 and 25% in 2010. They controlled 5% of all income in 1990 and 4.4% in 2010. Within non-Hispanic black households 37% earned under $40,000 in 1990 and 38.5% in 2010. They controlled 10.8% of all income in 1990 and 11.6% in 2010. Thus, in absolute terms there were great differences between non-Hispanic white and black households, but the structures did not change very much between 1990 and 2010. (See table 6 for complete data).
11 These data suggest that, at least among non-Hispanic whites, there may be an out migration of people living in lower income-earning households since such a large portion of households were in higher income brackets in comparative perspective with the City’s other race/ethnic groups.
Household Income Concentration in New York City 28
Latino Data Project Report 56 January 2014
Household Income 1990 2000 2010 1990 2000 2010
Less than 20,000 18.9% 20.1% 18.4% 2.8% 2.8% 2.9%20,000-39,999 17.8% 18.4% 20.1% 8.0% 8.1% 8.7%40,000-59,999 16.8% 16.5% 17.5% 12.3% 11.8% 12.6%60,000-79,999 13.5% 13.2% 12.2% 14.0% 13.4% 12.4%80,000-99,999 10.9% 9.9% 8.9% 14.5% 12.8% 11.6%100,000 - 199,999 19.6% 18.4% 19.4% 38.9% 35.8% 38.1%200,000 + 2.4% 3.4% 3.4% 9.4% 15.2% 13.7%
Total 100.0% 100.0% 100.0% 100.0% 100.0% 100.0%
Table 6Percentage of Households and Total Household Income
by Income-Earning Category in New York City, 1990 - 2010
Non-Hispanic Black
Percentage of Households Percentage of Income
Income Distribution and Wealth Concentration among New York City’s Asian Population
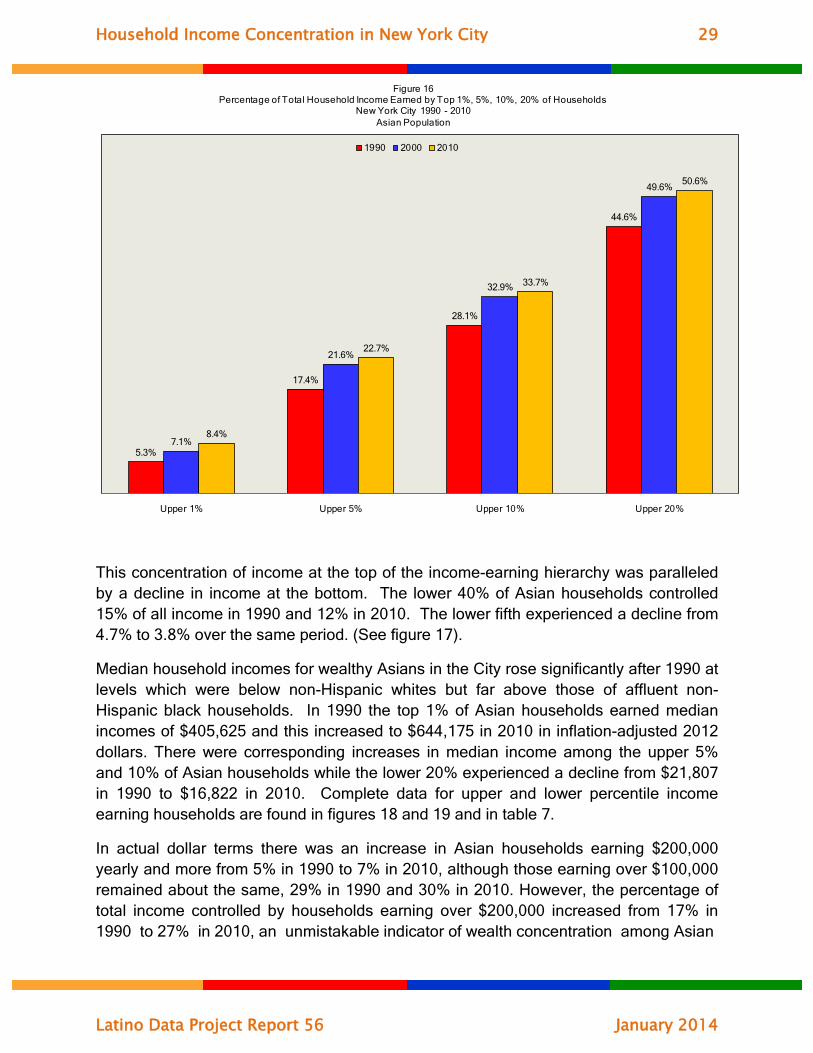
Asians were the second highest household income earners in New York City after non-Hispanic whites and had median incomes in 2010 of $$63,210 compared with $84,000 among non-Hispanic white households and $52,500 among non-Hispanic blacks.12 The patterns of income concentration within the upper 1%, 5%, 10%, and 20% of the City’s Asian households were more similar to those among non-Hispanic whites than among non-Hispanic blacks. The most important characteristic was the constantly increasing concentration of household income from 1990 to 2010. The upper echelons of Asian household income earners not only demonstrated patterns of increasing income analogous to non-Hispanic whites, but the levels of concentration in the upper percentiles were similar as well. The top 20% of Asian households controlled 51% of all income compared with 55% among non-Hispanic whites and 48% among non-Hispanic blacks. (See figure 16).
12 See Bergad, “Trends in Median Household Income among New York City Latinos in Comparative Perspective, 1990 – 2011” Latino Data Project report 54, p. 10, table 2 available at:
http://www.gc.cuny.edu/CUNY_GC/media/CUNY-Graduate-Center/PDF/Centers/CLACLS/Trends-in-Median-Household-Income-Among-New-York-City-Latinos-in-Comparative-Perspective,-1990-2011.pdf
Household Income Concentration in New York City 29
Latino Data Project Report 56 January 2014
5.3%
17.4%
28.1%
44.6%
7.1%
21.6%
32.9%
49.6%
8.4%
22.7%
33.7%
50.6%
Upper 1% Upper 5% Upper 10% Upper 20%
Figure 16Percentage of Total Household Income Earned by Top 1%, 5%, 10%, 20% of Households
New York City 1990 - 2010Asian Population
1990 2000 2010
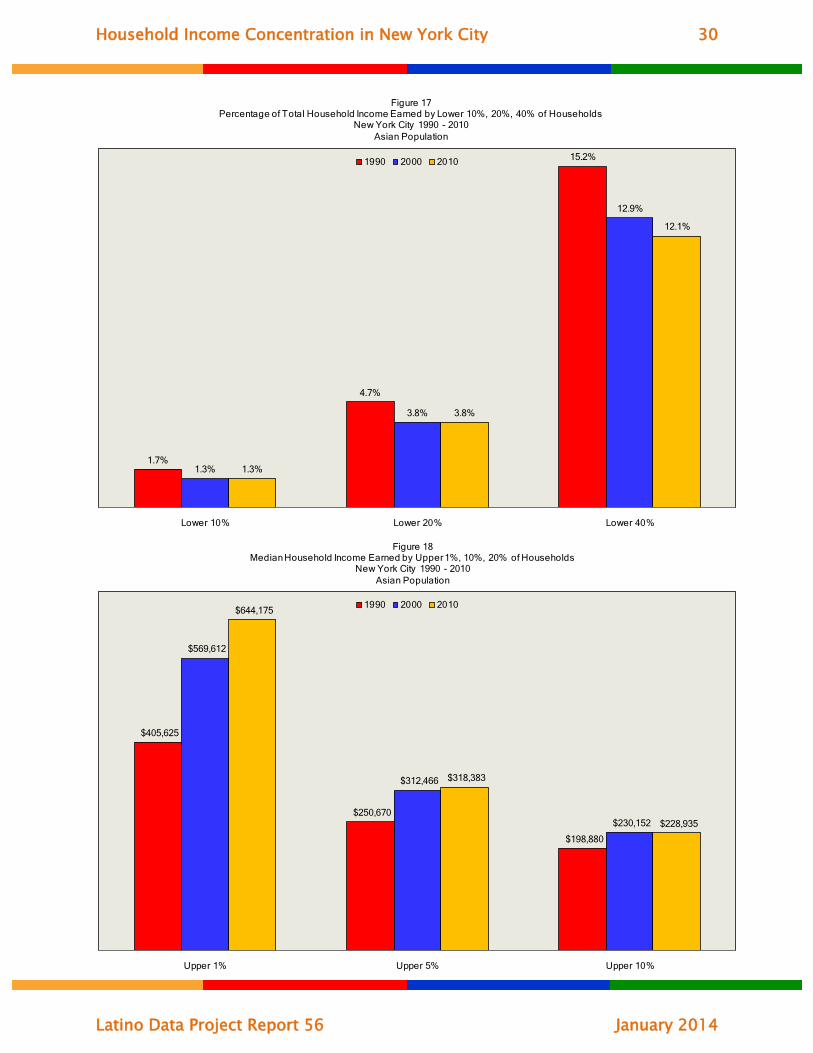
This concentration of income at the top of the income-earning hierarchy was paralleled by a decline in income at the bottom. The lower 40% of Asian households controlled 15% of all income in 1990 and 12% in 2010. The lower fifth experienced a decline from 4.7% to 3.8% over the same period. (See figure 17).
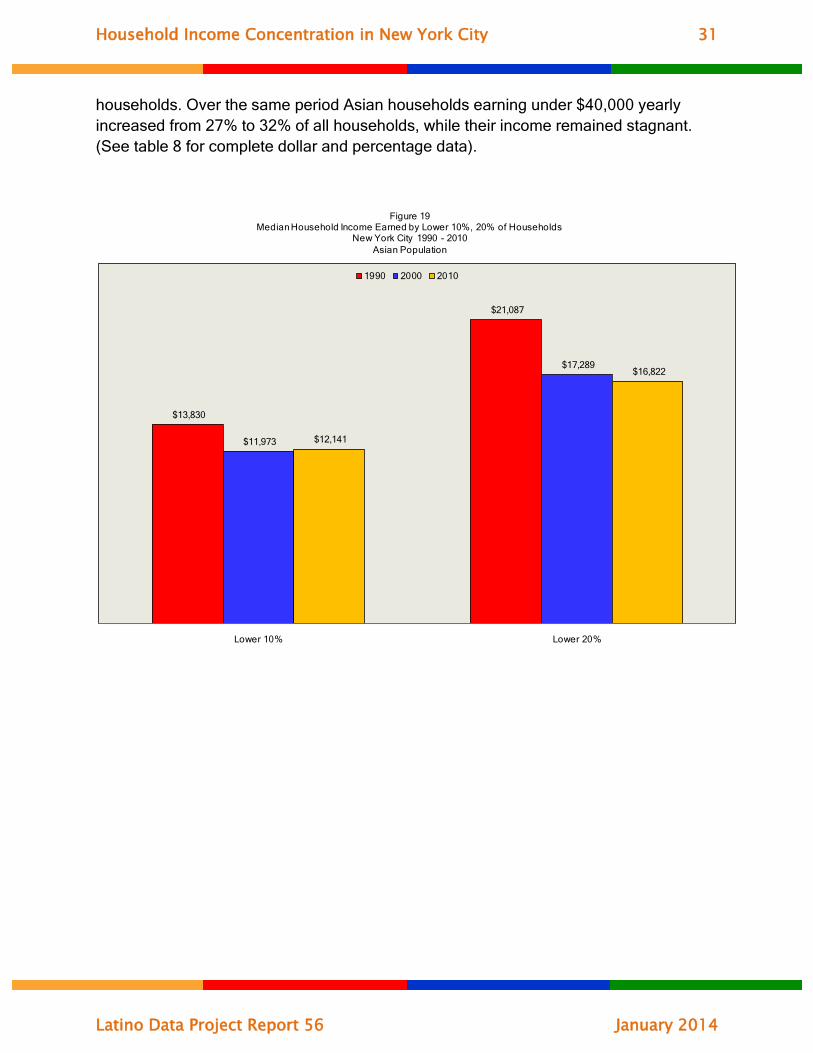
Median household incomes for wealthy Asians in the City rose significantly after 1990 at levels which were below non-Hispanic whites but far above those of affluent non-Hispanic black households. In 1990 the top 1% of Asian households earned median incomes of $405,625 and this increased to $644,175 in 2010 in inflation-adjusted 2012 dollars. There were corresponding increases in median income among the upper 5% and 10% of Asian households while the lower 20% experienced a decline from $21,807 in 1990 to $16,822 in 2010. Complete data for upper and lower percentile income earning households are found in figures 18 and 19 and in table 7.
In actual dollar terms there was an increase in Asian households earning $200,000 yearly and more from 5% in 1990 to 7% in 2010, although those earning over $100,000 remained about the same, 29% in 1990 and 30% in 2010. However, the percentage of total income controlled by households earning over $200,000 increased from 17% in 1990 to 27% in 2010, an unmistakable indicator of wealth concentration among Asian
Household Income Concentration in New York City 30
Latino Data Project Report 56 January 2014
1.7%
4.7%
15.2%
1.3%
3.8%
12.9%
1.3%
3.8%
12.1%
Lower 10% Lower 20% Lower 40%
Figure 17Percentage of Total Household Income Earned by Lower 10%, 20%, 40% of Households
New York City 1990 - 2010Asian Population
1990 2000 2010
$405,625
$250,670
$198,880
$569,612
$312,466
$230,152
$644,175
$318,383
$228,935
Upper 1% Upper 5% Upper 10%
Figure 18Median Household Income Earned by Upper 1%, 10%, 20% of Households
New York City 1990 - 2010Asian Population
1990 2000 2010
Household Income Concentration in New York City 31
Latino Data Project Report 56 January 2014
$13,830
$21,087
$11,973
$17,289
$12,141
$16,822
Lower 10% Lower 20%
Figure 19Median Household Income Earned by Lower 10%, 20% of Households
New York City 1990 - 2010Asian Population
1990 2000 2010
households. Over the same period Asian households earning under $40,000 yearly increased from 27% to 32% of all households, while their income remained stagnant. (See table 8 for complete dollar and percentage data).

Household Income Concentration in New York City 32
Latino Data Project Report 56 January 2014
Percentile 1990 2000 2010
Lower 10th 1.7% 1.3% 1.3%20th 3.0% 2.6% 2.5%30th 4.6% 3.8% 3.5%40th 5.9% 5.2% 4.9%50th 7.3% 6.4% 6.4%60th 9.0% 8.2% 8.1%70th 11.0% 10.1% 10.0%80th 12.9% 12.8% 12.8%90th 16.5% 16.8% 17.0%Top 10th 28.1% 32.9% 33.7%
Lower 20th 4.7% 3.8% 3.8%40th 10.5% 9.1% 8.3%60th 16.4% 14.6% 14.5%80th 23.9% 22.9% 22.8%Top 20th 44.6% 49.6% 50.6%
Top 5th 17.4% 21.6% 22.7%
Top 1st 5.3% 7.1% 8.4%
Asian
Table 7Share of Total Household Income in
New York City by Percentile, 1990 - 2010

Household Income Concentration in New York City 33
Latino Data Project Report 56 January 2014
Household Income 1990 2000 2010 1990 2000 2010
Less than 20,000 9.5% 12.8% 13.4% 1.4% 1.8% 1.9%20,000-39,999 17.3% 18.8% 18.8% 6.3% 6.5% 6.2%40,000-59,999 17.3% 16.5% 15.6% 10.3% 9.5% 8.7%60,000-79,999 14.0% 12.7% 11.8% 11.7% 10.3% 9.2%80,000-99,999 12.4% 9.9% 10.4% 13.3% 10.2% 10.5%100,000 - 199,999 24.5% 22.4% 22.9% 39.7% 35.2% 35.7%200,000 + 4.9% 6.9% 7.1% 17.3% 26.4% 27.7%
Total 100.0% 100.0% 100.0% 100.0% 100.0% 100.0%
Table 8Percentage of Households and Total Household Income
by Income-Earning Category in New York City, 1990 - 2010
Asian
Percentage of Households Percentage of Income
Income Distribution and Wealth Concentration among New York City’s Latino Population
Latinos were the poorest of the City’s major race/ethnic groups. Their median household incomes at $46,463 in 2010 were well below those of non-Hispanic whites ($84,000), Asians ($63,210), and non-Hispanic blacks ($52,500).13 Nevertheless, within the City’s Latino households similar patterns of progressive income concentration were found between 1990 and 2010. The top 20% of Latino households earned 47% of all income in 1990 and 51% in 2010, and the same patterns of increasing income concentration were found in the upper 10%, 5%, and 1% of Latino households. (See figure 20).
13 See Bergad, “Trends in Median Household Income among New York City Latinos in Comparative Perspective, 1990 – 2011” Latino Data Project report 54, p. 10, table 2 available at:
http://www.gc.cuny.edu/CUNY_GC/media/CUNY-Graduate-Center/PDF/Centers/CLACLS/Trends-in-Median-Household-Income-Among-New-York-City-Latinos-in-Comparative-Perspective,-1990-2011.pdf

Household Income Concentration in New York City 34
Latino Data Project Report 56 January 2014
5.5%
17.8%
29.3%
47.0%
7.8%
20.6%
31.9%
48.9%
7.8%
21.6%
33.3%
50.8%
Upper 1% Upper 5% Upper 10% Upper 20%
Figure 20Percentage of Total Household Income Earned by Top 1%, 5%, 10%, 20% of Households
New York City 1990 - 2010Latino Population
1990 2000 2010
Despite being the poorest of the City’s race/ethnic groups the structure of income distribution and wealth concentration was very similar to the patterns found among all races and ethnicities, although income concentration was most extreme among non-Hispanic whites. (See figure 21).
At the bottom of the household income-earning hierarchy Latinos also demonstrated structural patterns which were somewhat similar to those found among the City’s other race/ethnic groups. The lower 40% of Latino households saw their overall share of total income decline from 12.1% to 11.6% between 1990 and 2010 while the lower 10% and 20% experienced marginal increases. (See figure 22).
Additionally, at the bottom of household income earners in percentile terms, there was not much differentiation in the percentage of overall income they controlled by race/ethnicity. (See figure 23).

Household Income Concentration in New York City 35
Latino Data Project Report 56 January 2014
7.6%
25.7%
38.3%
54.8%
7.8%
21.6%
33.3%
50.8%
8.4%
22.7%
33.7%
50.6%
5.3%
18.1%
29.5%
47.5%
Upper 1% Upper 5% Upper 10% Upper 20%
Figure 21Percentage of Total Household Income Earned by Top 1%, 5%, 10%, 20% of Households
by Race/Ethnic GroupNew York City 2010
Non-Hispanic Whites Latinos Asians Non-Hispanic Blacks
0.9%
3.2%
12.1%
1.0%
3.1%
12.1%
1.1%
3.5%
11.6%
Lower 10% Lower 20% Lower 40%
Figure 22Percentage of Total Household Income Earned by Lower 10%, 20%, 40% of Households
New York City 1990 - 2010Latino Population
1990 2000 2010

Household Income Concentration in New York City 36
Latino Data Project Report 56 January 2014
0.9%
3.0%
10.6%
1.1%
3.5%
11.6%
1.3%
3.8%
12.1%
1.0%
3.4%
13.0%
Lower 10% Lower 20% Lower 40%
Figure 23Percentage of Total Household Income Earned by Lower 10%, 20%, 40% of Households
by Race/Ethnic Group New York City 2010
Non-Hispanic Whites Latinos Asians Non-Hispanic Blacks
It is also clear that the median incomes of upper-earning Latino households increased between 1990 and 2010, and while there were increases in the median incomes of lower-earning percentile households, these were still in dismally low income categories. The upper 1% of Latino households experienced a rise in median incomes in inflation adjusted 2012 dollars from $271,168 in 1990 to $492,315 in 2010. The lower 20% of Latino household income earners saw their median incomes rise from $9,503 in 1990 to $10,730 in 2010. (See figures 24 and 25).
Complete percentile breakdowns among Latinos from 1990 to 2010 are found in table 9.
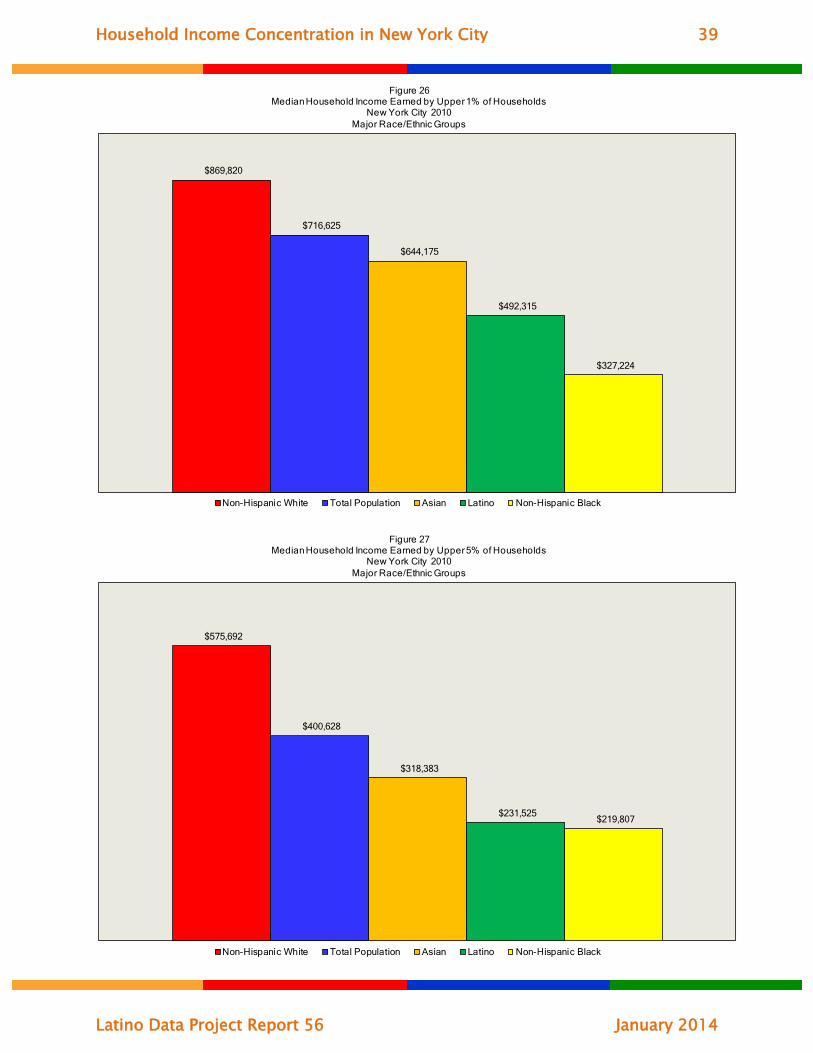
While the process of increasing Latino household income in the top percentile income-earning households is unmistakable, the median incomes of high income earning Latino households were still far below those of non-Hispanic whites, and Asians, although they were above non-Hispanic blacks despite generally lower median household incomes. The top 1% of Latino household income earners had median incomes of $492,115 in 2010 compared with $869,820 among non-Hispanic whites, $644,175 among Asians, and $327,224 among non-Hispanic blacks. (See figure 26). The hierarchy was the same in the upper 5% percentile category (see figure 27), but Latinos had the lowest median household incomes in the upper 10% category. (See figure 28).

Household Income Concentration in New York City 37
Latino Data Project Report 56 January 2014
Percentile 1990 2000 2010
Lower 10th 0.9% 1.0% 1.1%20th 2.3% 2.1% 2.4%30th 3.5% 3.9% 3.3%40th 5.4% 5.1% 4.8%50th 7.1% 6.6% 6.3%60th 9.0% 8.5% 8.0%70th 11.0% 10.7% 10.2%80th 13.8% 13.2% 13.1%90th 17.7% 17.0% 17.4%Top 10th 29.3% 31.9% 33.3%
Lower 20th 3.2% 3.1% 3.5%40th 8.9% 9.0% 8.1%60th 16.1% 15.1% 14.3%80th 24.9% 24.0% 23.3%Top 20th 47.0% 48.9% 50.8%
Top 5th 17.8% 20.6% 21.6%
Top 1st 5.5% 7.8% 7.8%
Latino
Table 9Share of Total Household Income in
New York City by Percentile, 1990 - 2010

Household Income Concentration in New York City 38
Latino Data Project Report 56 January 2014
$271,168
$172,978
$145,768
$467,052
$196,627
$155,500
$492,315
$231,525
$173,347
Upper 1% Upper 5% Upper 10%
Figure 24Median Household Income Earned by Upper 1%, 10%, 20% of Households
New York City 1990 - 2010Latino Population
1990 2000 2010
$5,638
$9,503
$5,840
$9,565
$7,929
$10,730
Lower 10% Lower 20%
Figure 25Median Household Income Earned by Lower 10%, 20% of Households
New York City 1990 - 2010Latino Population
1990 2000 2010
Household Income Concentration in New York City 39
Latino Data Project Report 56 January 2014
$869,820
$716,625
$644,175
$492,315
$327,224
Figure 26Median Household Income Earned by Upper 1% of Households
New York City 2010Major Race/Ethnic Groups
Non-Hispanic White Total Population Asian Latino Non-Hispanic Black
$575,692
$400,628
$318,383
$231,525 $219,807
Figure 27Median Household Income Earned by Upper 5% of Households
New York City 2010Major Race/Ethnic Groups
Non-Hispanic White Total Population Asian Latino Non-Hispanic Black

Household Income Concentration in New York City 40
Latino Data Project Report 56 January 2014
$428,112
$262,010
$228,935
$180,233 $173,347
Figure 28Median Household Income Earned by Upper 10% of Households
New York City 2010Major Race/Ethnic Groups
Non-Hispanic White Total Population Asian Non-Hispanic Black Latino
About the same percentage of Latino households earned over $200,000 yearly in the City in 2010 (3.4%), as non-Hispanic blacks although they controlled slightly more income, at 17% of the total compared to14% among non-Hispanic black households. This was significantly less than the 15% of non-Hispanic white households and 7% of Asians who were in this upper-income category.
Additionally, Latinos had the lowest percentage of households earning over $100,000 in income in 2010, 19%, compared to 42% among non-Hispanic whites, 30% among Asians, and 23% among non-Hispanic blacks. Nevertheless, there was the progressive concentration of income within these Latino households. In 1990 they accounted for 38% of all income accruing to Latinos; in 2010 this had risen to 50%, considerable less than the 77% of total income controlled by non-Hispanic white households in the $100,000 plus income category, 63% among Asians, and 52% among non-Hispanic blacks.
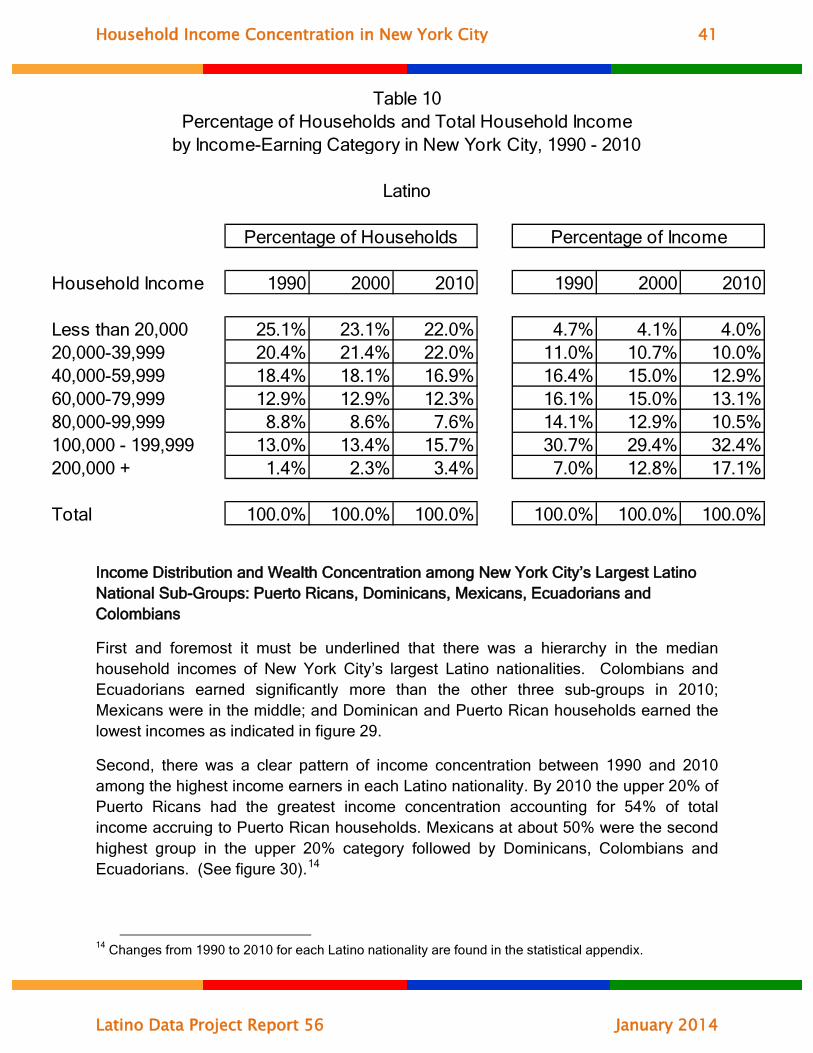
Thus, while the process of wealth concentration in high-income Latino households was unmistakable between 1990 and 2010, it was not quite as extreme as among non-Hispanic whites or Asians. (See table 10 for complete data).
Household Income Concentration in New York City 41
Latino Data Project Report 56 January 2014
Household Income 1990 2000 2010 1990 2000 2010
Less than 20,000 25.1% 23.1% 22.0% 4.7% 4.1% 4.0%20,000-39,999 20.4% 21.4% 22.0% 11.0% 10.7% 10.0%40,000-59,999 18.4% 18.1% 16.9% 16.4% 15.0% 12.9%60,000-79,999 12.9% 12.9% 12.3% 16.1% 15.0% 13.1%80,000-99,999 8.8% 8.6% 7.6% 14.1% 12.9% 10.5%100,000 - 199,999 13.0% 13.4% 15.7% 30.7% 29.4% 32.4%200,000 + 1.4% 2.3% 3.4% 7.0% 12.8% 17.1%
Total 100.0% 100.0% 100.0% 100.0% 100.0% 100.0%
Table 10Percentage of Households and Total Household Income
by Income-Earning Category in New York City, 1990 - 2010
Latino
Percentage of Households Percentage of Income
Income Distribution and Wealth Concentration among New York City’s Largest Latino National Sub-Groups: Puerto Ricans, Dominicans, Mexicans, Ecuadorians and Colombians
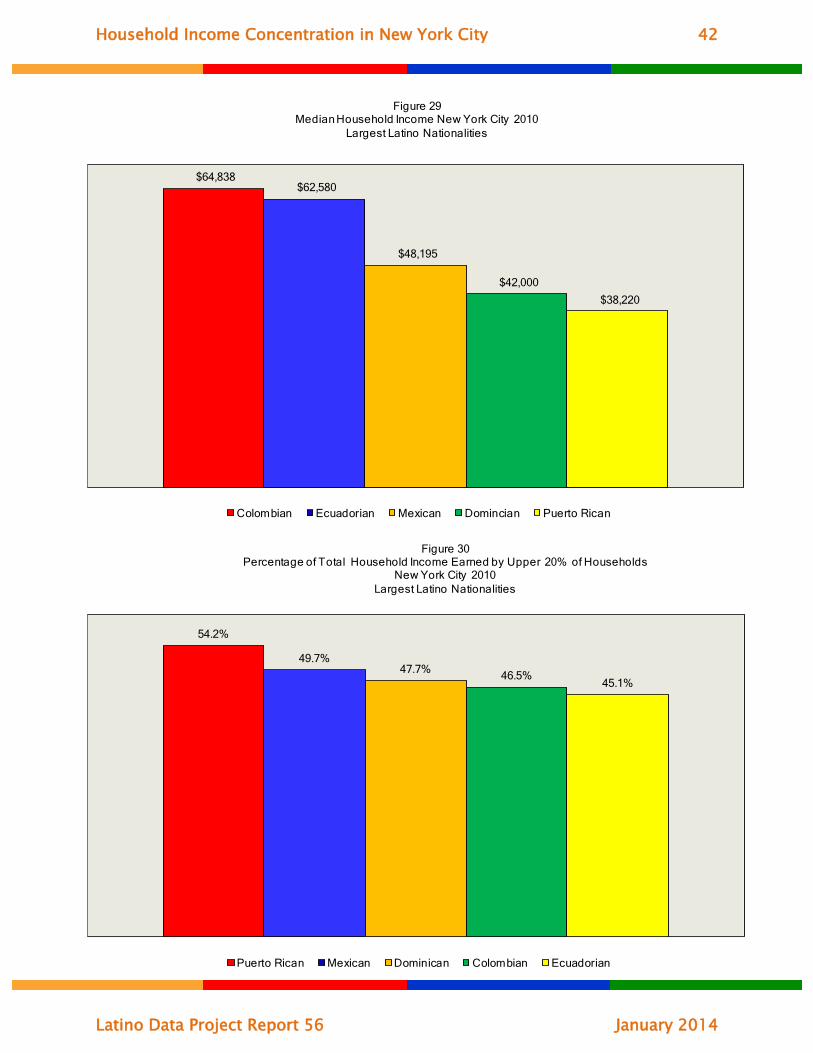
First and foremost it must be underlined that there was a hierarchy in the median household incomes of New York City’s largest Latino nationalities. Colombians and Ecuadorians earned significantly more than the other three sub-groups in 2010; Mexicans were in the middle; and Dominican and Puerto Rican households earned the lowest incomes as indicated in figure 29.
Second, there was a clear pattern of income concentration between 1990 and 2010 among the highest income earners in each Latino nationality. By 2010 the upper 20% of Puerto Ricans had the greatest income concentration accounting for 54% of total income accruing to Puerto Rican households. Mexicans at about 50% were the second highest group in the upper 20% category followed by Dominicans, Colombians and Ecuadorians. (See figure 30).14
14 Changes from 1990 to 2010 for each Latino nationality are found in the statistical appendix.
Household Income Concentration in New York City 42
Latino Data Project Report 56 January 2014
$64,838 $62,580
$48,195
$42,000
$38,220
Figure 29Median Household Income New York City 2010
Largest Latino Nationalities
Colombian Ecuadorian Mexican Domincian Puerto Rican
54.2%
49.7%47.7% 46.5%
45.1%
Figure 30Percentage of Total Household Income Earned by Upper 20% of Households
New York City 2010Largest Latino Nationalities
Puerto Rican Mexican Dominican Colombian Ecuadorian
Household Income Concentration in New York City 43
Latino Data Project Report 56 January 2014
$159,075
$148,050 $139,650
$128,415
$114,555
Figure 31Median Household Income Earned by Upper 20% of Households
New York City 2010Largest Latino Nationalities
Colombian Ecuadorian Mexican Puerto Rican Dominican
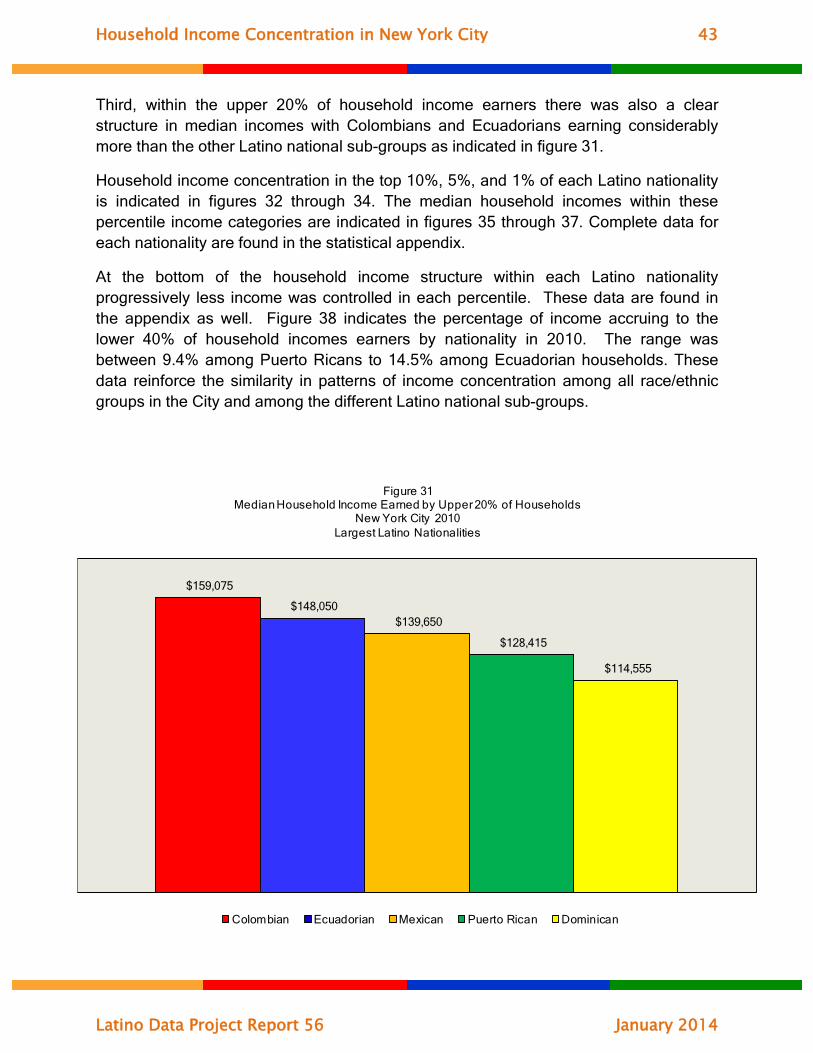
Third, within the upper 20% of household income earners there was also a clear structure in median incomes with Colombians and Ecuadorians earning considerably more than the other Latino national sub-groups as indicated in figure 31.
Household income concentration in the top 10%, 5%, and 1% of each Latino nationality is indicated in figures 32 through 34. The median household incomes within these percentile income categories are indicated in figures 35 through 37. Complete data for each nationality are found in the statistical appendix.
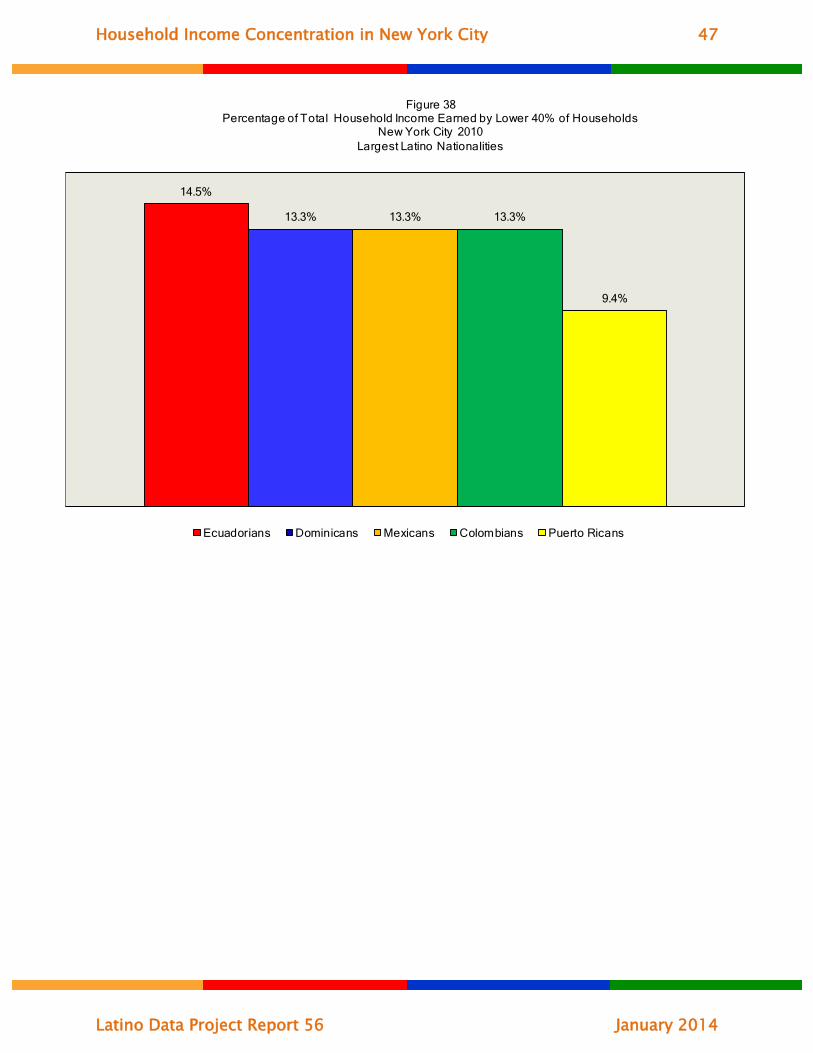
At the bottom of the household income structure within each Latino nationality progressively less income was controlled in each percentile. These data are found in the appendix as well. Figure 38 indicates the percentage of income accruing to the lower 40% of household incomes earners by nationality in 2010. The range was between 9.4% among Puerto Ricans to 14.5% among Ecuadorian households. These data reinforce the similarity in patterns of income concentration among all race/ethnic groups in the City and among the different Latino national sub-groups.

Household Income Concentration in New York City 44
Latino Data Project Report 56 January 2014
35.6%
32.5%30.6% 30.3%
27.8%
Figure 32Percentage of Total Household Income Earned by Upper 10% of Households
New York City 2010Largest Latino Nationalities
Puerto Rican Mexican Dominican Colombian Ecuadorian
23.0%
20.6%19.3% 19.0%
17.1%
Figure 33Percentage of Total Household Income Earned by Upper 5% of Households
New York City 2010Largest Latino Nationalities
Puerto Rican Mexican Colombian Dominican Ecuadorian

Household Income Concentration in New York City 45
Latino Data Project Report 56 January 2014
8.7%
6.4% 6.2% 6.1%
5.4%
Figure 34Percentage of Total Household Income Earned by Upper 1% of Households
New York City 2010Largest Latino Nationalities
Puerto Rican Colombian Dominican Mexican Ecuadorian
$213,780
$186,585 $185,325
$168,270
$143,340
Figure 35Median Household Income Earned by Upper 10% of Households
New York City 2010Largest Latino Nationalities
Colombian Ecuadorian Mexican Puerto Rican Dominican

Household Income Concentration in New York City 46
Latino Data Project Report 56 January 2014
$268,800 $256,200
$237,111
$216,090
$172,486
Figure 36Median Household Income Earned by Upper 5% of Households
New York City 2010Largest Latino Nationalities
Colombian Mexican Ecuadorian Puerto Rican Dominican
$564,900
$469,395 $461,760
$402,749
$296,205
Figure 37Median Household Income Earned by Upper 1% of Households
New York City 2010Largest Latino Nationalities
Colombian Ecuadorian Mexican Puerto Rican Dominican
Household Income Concentration in New York City 47
Latino Data Project Report 56 January 2014
14.5%
13.3% 13.3% 13.3%
9.4%
Figure 38Percentage of Total Household Income Earned by Lower 40% of Households
New York City 2010Largest Latino Nationalities
Ecuadorians Dominicans Mexicans Colombians Puerto Ricans
Household Income Concentration in New York City 48
Latino Data Project Report 56 January 2014
The Gini Index of Inequality in New York City
A statistical measure that is widely used to examine comparative levels of wealth concentration between different regions, as well as changes over time within a particular area, is the gini index of inequality. (See footnote 7, p. 11 above for complete explanation). The United States has one of the highest gini indexes in the world among countries with advanced industrial economies. It is also recognized that income inequality in the U.S. has increased after 1980.15
Compared with other states in the U.S., New York had the highest level of household income inequality in 2010 as measured by the gini index at .50. The range varied from .42 in Utah to .50 in New York.16
In New York City the rise of household income inequality and the concentration of wealth indicated in the data on percentile distribution, as well as actual income data, is confirmed by the gini index. In 1990 the gini index for all households was .44. It increased to .49 by 2000 and .50 in 2010, an increase of 14% between 1990 and 2010.
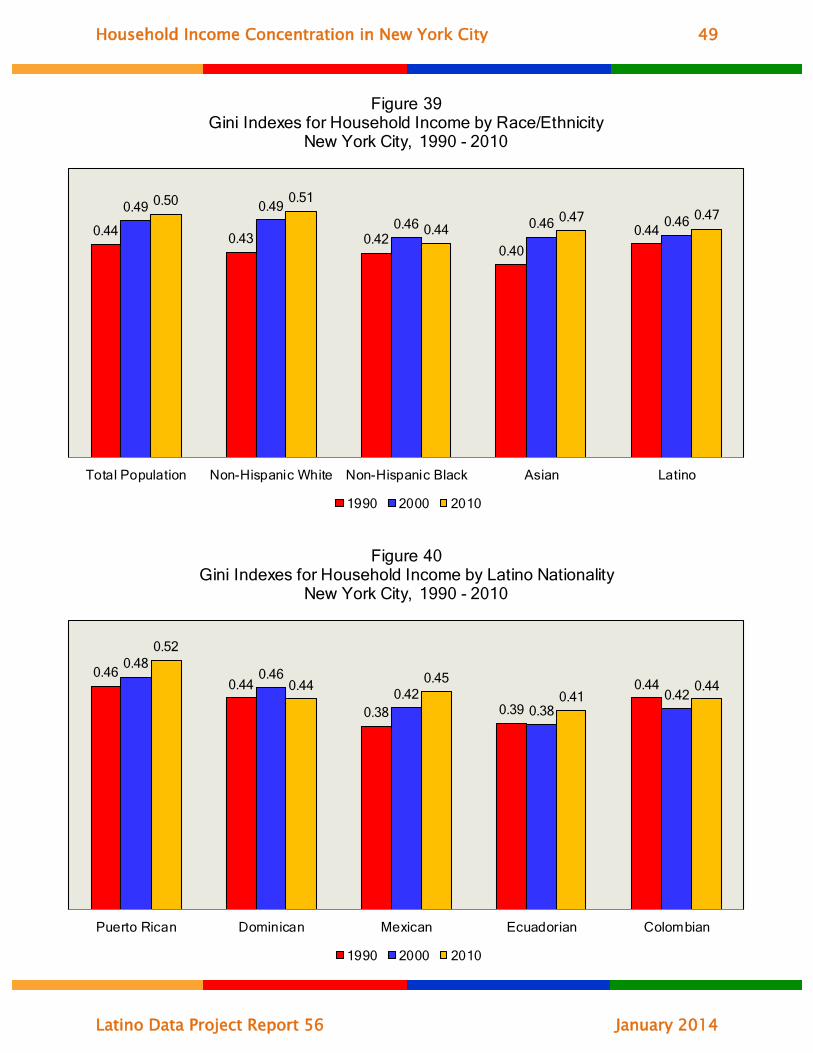
The most extreme process of wealth concentration was among the non-Hispanic white population which controlled about one-half of the City’s household income. The gini index was .43 in 1990 and .51 in 2010, and increase of 20%. For Latinos the gini was .44 in 1990 and .47 in 2010 (+7%). Non-Hispanic blacks in the City experienced a marginal increase from .42 to .44 between 1990 and 2010 (+5%), while for Asians there was a sharp rise from .40 to .47 (+18%). (See figure 39).
Among the City’s Latino national sub-groups, Puerto Ricans had the highest household income inequality as measured by the gini index which was .46 in 1990 and .52 in 2010 (+12%). Mexican households experienced the greatest percentage change in the concentration of income (+19%) between 1990 and 2010 as their gini index increased from .38 to .45. There was little change in the gini indexes among Dominicans and Colombians from 1990 to 2010, and among Ecuadorians there was a rise from .39 to .41. (See figure 40 for complete data).
15 In 2007 the gini index for family income in the U.S. was .45. This compared with .40 in the United Kingdom; .33 in France; .27 in Germany; .23 in Sweden; .27 in Finland; ,31 in the Netherlands; and .42 in Russa as some comparative examples. See Central Intelligence Agency, “The World Factbook” available at https://www.cia.gov/library/publications/the-world-factbook/fields/2172.html
16 The District of Columbia had a higher gini index in 2010 at .53. See http://en.wikipedia.org/wiki/List_of_U.S._states_by_Gini_coefficient
Household Income Concentration in New York City 49
Latino Data Project Report 56 January 2014
0.44 0.43 0.420.40
0.44
0.49 0.490.46 0.46 0.46
0.50 0.51
0.440.47 0.47
Total Population Non-Hispanic White Non-Hispanic Black Asian Latino
Figure 39Gini Indexes for Household Income by Race/Ethnicity
New York City, 1990 - 2010
1990 2000 2010
0.460.44
0.38 0.39
0.44
0.480.46
0.420.38
0.42
0.52
0.44 0.450.41
0.44
Puerto Rican Dominican Mexican Ecuadorian Colombian
Figure 40Gini Indexes for Household Income by Latino Nationality
New York City, 1990 - 2010
1990 2000 2010
Household Income Concentration in New York City 50
Latino Data Project Report 56 January 2014
Conclusion
The data presented in this report provide unmistakable empirical evidence of the progressive concentration of household income in New York City between 1990 and 2010 among the wealthiest New Yorkers. The three indicators used for this study – percentile breakdowns of income; actual inflation adjusted dollar-income categories; and the gini index of inequality – offer consistent and indisputable evidence of this process.
While progressive income concentration was evident within every race/ethnic group in the city there was an extraordinary process of household income concentration within the non-Hispanic white population between 1990 and 2010. Not only did these households account for about half the city’s total income in 2010 despite making up about 37% of all households, but the concentration of income in higher income categories was the most extreme among all race/ethnic groups.
In 1990 about 9% of non-Hispanic white households earned over $200,000 annually in 2012 inflation-adjusted dollars. They controlled 28% of all income accruing to non-Hispanic white households. By 2010 15% of households were in this category but their share of all non-Hispanic white household income was 48%. There was no other race/ethnic category in the City in which income concentration was so extreme in this upper income category. It is often heard that the ‘middle class’ is disappearing in a City that is increasingly divided into rich and poor. This may not be the case within every race/ethnic group in New York City, but the data suggest that this process seems to have developed intensely within the non-Hispanic white population after 1990.
Not only did non-Hispanic white households have greater levels of income concentration in comparative perspective, but within their wealthiest sectors, incomes were well above those of the City’s other race/ethnic groups. The median income of the wealthiest 10% of non-Hispanic white households was $428,112 in inflation-adjusted 2012 dollars. For Latinos in the upper 10% of household-income earners the median income was $173,347. It was $180,233 for non-Hispanic blacks and $228,935 for Asian households.
There were hierarchical structures in the household incomes of each race/ethnic group in the City which had some similarities in the divisions between upper, middle, and lower income earners, and in the progressive concentration of wealth among the rich. However, the absolute incomes of wealthy non-Hispanic white households were extraordinarily higher than among Latinos, non-Hispanic blacks, and Asians.
This does not mean that the process of wealth concentration should be minimized among Latino, non-Hispanic black, and Asian households between 1990 and 2010. Within each race/ethnicity the same ‘process’ of wealth concentration was clearly evident. Wealthier households accumulated greater percentages of overall income without question.
Household Income Concentration in New York City 51
Latino Data Project Report 56 January 2014
However, there were two overarching differences when compared with wealthy non-Hispanic white households. First, smaller percentages were in upper-income categories. Second, they controlled a smaller portion of overall wealth. About 42% of non-Hispanic white households earned $100,000 or more in 2010. For Latinos it was 19% of all households; 23% among non-Hispanic blacks; 30% among Asians. These non-Hispanic white households controlled 78% of total household income in 2010. Latinos in this category controlled 50%; 52% among non-Hispanic blacks; and 63% among Asians.
The data presented in this report have important implications with respect to the economic and fiscal future of New York City. A new mayor, Bill de Blasio, took office on January 1, 2014. He has promised to increase taxes on the City’s wealthy families to finance education, among other services for the City’s overall population, This is something which has and will continue to generate a great deal of controversy to be sure. If this report demonstrates one thing it is that New York City’s wealthiest families have become much richer in the past twenty years and that they can certainly afford to pay higher taxes for the overall well-being of all New Yorkers.

Household Income Concentration in New York City 52
Latino Data Project Report 56 January 2014
Percentile 1990 2000 2010
Lower 10th 0.7% 0.7% 0.9%20th 2.0% 1.9% 1.7%30th 3.0% 3.0% 2.8%40th 4.9% 4.5% 3.9%50th 6.5% 6.8% 5.6%60th 8.9% 8.0% 7.5%70th 11.4% 11.4% 9.9%80th 14.3% 13.5% 13.4%90th 18.5% 18.3% 18.6%Top 10th 29.7% 31.8% 35.6%
Lower 20th 2.7% 2.5% 2.7%40th 7.9% 7.5% 6.7%60th 15.3% 14.9% 13.1%80th 25.7% 24.9% 23.4%Top 20th 48.2% 50.1% 54.2%
Top 5th 17.8% 19.8% 23.0%
Top 1st 5.1% 6.8% 8.7%
Puerto Rican
Table 11Share of Total Household Income in
New York City by Percentile, 1990 - 2010
Statistical Appendix

Household Income Concentration in New York City 53
Latino Data Project Report 56 January 2014
Percentile 1990 2000 2010
Lower 10th 1.0% 1.0% 1.4%20th 2.4% 2.3% 2.7%30th 3.6% 3.8% 3.9%40th 5.4% 5.2% 5.4%50th 7.1% 6.9% 6.9%60th 9.2% 8.3% 8.6%70th 10.6% 10.6% 10.6%80th 13.7% 12.5% 12.9%90th 17.6% 16.7% 17.1%Top 10th 29.2% 32.6% 30.6%
Lower 20th 3.5% 3.3% 4.0%40th 9.0% 9.0% 9.3%60th 16.3% 15.2% 15.5%80th 24.4% 23.2% 23.4%Top 20th 46.9% 49.3% 47.7%
Top 5th 17.8% 21.4% 19.0%
Top 1st 5.3% 8.4% 6.2%
Dominican
Table 12Share of Total Household Income in
New York City by Percentile, 1990 - 2010

Household Income Concentration in New York City 54
Latino Data Project Report 56 January 2014
Percentile 1990 2000 2010
Lower 10th 1.6% 1.4% 1.5%20th 3.4% 3.0% 3.1%30th 4.9% 4.5% 3.7%40th 6.4% 6.2% 5.1%50th 7.3% 6.6% 6.4%60th 9.0% 8.8% 7.9%70th 11.4% 10.5% 10.1%80th 13.9% 13.1% 12.7%90th 15.9% 16.4% 17.2%Top 10th 26.2% 29.6% 32.5%
Lower 20th 5.0% 4.3% 4.6%40th 11.3% 10.6% 8.7%60th 16.3% 15.5% 14.2%80th 25.3% 23.6% 22.8%Top 20th 42.1% 45.9% 49.7%
Top 5th 15.8% 19.0% 20.6%
Top 1st 4.8% 6.8% 6.1%
Mexican
Table 13Share of Total Household Income in
New York City by Percentile, 1990 - 2010
Household Income Concentration in New York City 55
Latino Data Project Report 56 January 2014
Percentile 1990 2000 2010
Lower 10th 1.4% 1.5% 1.7%20th 3.0% 3.3% 2.8%30th 4.8% 4.9% 4.3%40th 5.9% 6.1% 5.7%50th 7.7% 7.7% 7.3%60th 9.3% 9.2% 9.3%70th 11.3% 11.7% 10.5%80th 13.7% 12.9% 13.4%90th 17.3% 16.4% 17.2%Top 10th 25.4% 26.3% 27.8%
Lower 20th 4.5% 4.7% 4.5%40th 10.7% 11.0% 10.0%60th 17.1% 16.9% 16.6%80th 25.0% 24.6% 23.9%Top 20th 42.7% 42.8% 45.1%
Top 5th 14.8% 16.2% 17.1%
Top 1st 4.0% 5.0% 5.4%
Ecuadorian
Table 14Share of Total Household Income in
New York City by Percentile, 1990 - 2010

Household Income Concentration in New York City 56
Latino Data Project Report 56 January 2014
Percentile 1990 2000 2010
Lower 10th 1.9% 1.4% 1.3%20th 3.8% 3.2% 2.7%30th 5.2% 4.7% 4.0%40th 6.4% 5.8% 5.3%50th 8.0% 7.1% 6.9%60th 9.3% 8.4% 8.9%70th 11.2% 10.3% 10.5%80th 13.3% 12.5% 14.0%90th 16.4% 16.5% 16.2%Top 10th 24.6% 30.1% 30.3%
Lower 20th 5.7% 4.6% 4.0%40th 11.6% 10.5% 9.3%60th 17.2% 15.5% 15.7%80th 24.5% 22.8% 24.5%Top 20th 41.0% 46.6% 46.5%
Top 5th 14.5% 19.5% 19.3%
Top 1st 4.1% 6.1% 6.4%
Colombian
Table 15Share of Total Household Income in
New York City by Percentile, 1990 - 2010

Household Income Concentration in New York City 57
Latino Data Project Report 56 January 2014
Household Income 1990 2000 2010 1990 2000 2010
Less than 20,000 31.8% 30.5% 30.5% 6.5% 5.7% 5.6%20,000-39,999 19.5% 20.2% 21.1% 11.7% 11.2% 10.4%40,000-59,999 16.6% 15.8% 14.0% 16.6% 14.7% 11.6%60,000-79,999 11.9% 11.5% 10.3% 16.7% 15.1% 12.1%80,000-99,999 8.1% 8.0% 6.8% 14.6% 13.3% 10.4%100,000 - 199,999 11.2% 12.4% 14.5% 29.6% 30.3% 33.6%200,000 + 0.8% 1.7% 2.8% 4.4% 9.7% 16.3%
Total 100.0% 100.0% 100.0% 100.0% 100.0% 100.0%
Table 16Percentage of Households and Total Household Income
by Income-Earning Category in New York City, 1990 - 2010
Puerto Rican
Percentage of Households Percentage of Income
Household Income 1990 2000 2010 1990 2000 2010
Less than 20,000 27.7% 23.8% 23.1% 6.1% 4.5% 5.1%20,000-39,999 22.7% 23.8% 24.6% 13.7% 12.8% 13.4%40,000-59,999 19.2% 19.9% 19.5% 19.0% 17.7% 17.7%60,000-79,999 12.5% 12.2% 13.0% 17.4% 15.1% 16.4%80,000-99,999 7.3% 7.7% 7.1% 13.1% 12.4% 11.6%100,000 - 199,999 9.9% 10.7% 11.0% 26.0% 25.0% 26.8%200,000 + 0.8% 1.9% 1.6% 4.6% 12.4% 9.0%
Total 100.0% 100.0% 100.0% 100.0% 100.0% 100.0%
Table 17Percentage of Households and Total Household Income
by Income-Earning Category in New York City, 1990 - 2010
Dominican
Percentage of Households Percentage of Income
Household Income Concentration in New York City 58
Latino Data Project Report 56 January 2014
Household Income 1990 2000 2010 1990 2000 2010
Less than 20,000 10.4% 15.4% 17.0% 1.6% 2.7% 3.3%20,000-39,999 20.8% 22.7% 24.5% 8.9% 10.5% 10.8%40,000-59,999 20.8% 19.1% 18.4% 14.7% 14.5% 13.3%60,000-79,999 12.0% 15.0% 11.7% 11.5% 15.8% 11.7%80,000-99,999 12.7% 10.2% 8.6% 15.9% 13.9% 11.2%100,000 - 199,999 20.8% 15.5% 15.7% 37.7% 31.5% 31.1%200,000 + 2.5% 2.1% 4.1% 9.8% 11.1% 18.6%
Total 100.0% 100.0% 100.0% 100.0% 100.0% 100.0%
Table 18Percentage of Households and Total Household Income
by Income-Earning Category in New York City, 1990 - 2010
Mexican
Percentage of Households Percentage of Income
Household Income 1990 2000 2010 1990 2000 2010
Less than 20,000 15.3% 12.9% 12.4% 2.8% 2.2% 2.1%20,000-39,999 19.5% 20.1% 18.6% 9.0% 8.9% 7.0%40,000-59,999 19.5% 19.9% 17.9% 14.8% 14.8% 11.5%60,000-79,999 14.5% 14.8% 16.2% 15.3% 15.1% 14.8%80,000-99,999 10.5% 13.0% 8.0% 14.1% 17.1% 9.4%100,000 - 199,999 19.4% 17.4% 22.5% 38.7% 33.5% 38.7%200,000 + 1.4% 2.0% 4.5% 5.2% 8.4% 16.6%
Total 100.0% 100.0% 100.0% 100.0% 100.0% 100.0%
Table 19Percentage of Households and Total Household Income
by Income-Earning Category in New York City, 1990 - 2010
Ecuadorian
Percentage of Households Percentage of Income
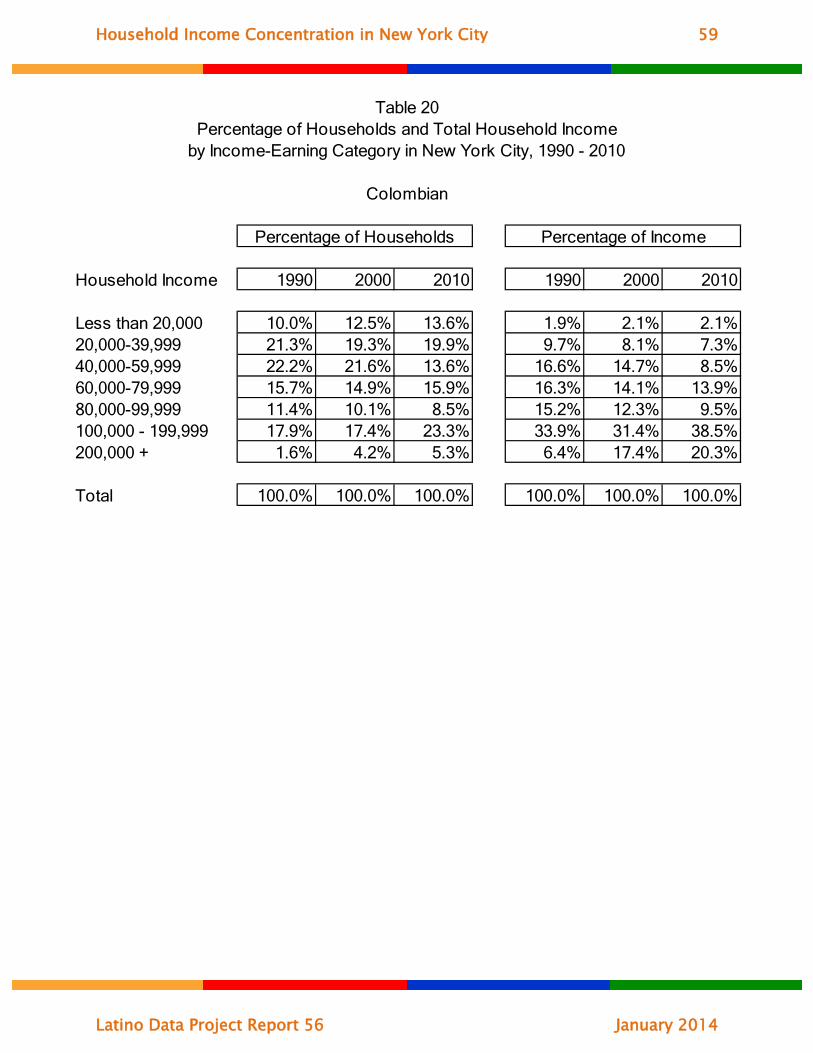
Household Income Concentration in New York City 59
Latino Data Project Report 56 January 2014
Household Income 1990 2000 2010 1990 2000 2010
Less than 20,000 10.0% 12.5% 13.6% 1.9% 2.1% 2.1%20,000-39,999 21.3% 19.3% 19.9% 9.7% 8.1% 7.3%40,000-59,999 22.2% 21.6% 13.6% 16.6% 14.7% 8.5%60,000-79,999 15.7% 14.9% 15.9% 16.3% 14.1% 13.9%80,000-99,999 11.4% 10.1% 8.5% 15.2% 12.3% 9.5%100,000 - 199,999 17.9% 17.4% 23.3% 33.9% 31.4% 38.5%200,000 + 1.6% 4.2% 5.3% 6.4% 17.4% 20.3%
Total 100.0% 100.0% 100.0% 100.0% 100.0% 100.0%
Table 20Percentage of Households and Total Household Income
by Income-Earning Category in New York City, 1990 - 2010
Colombian
Percentage of Households Percentage of Income


