Lower Mainland Flood Management Strategy
Metro Vancouver’s Climate Action CommitteeMarch 13, 2020 – Fraser Basin Council
4.1
Climate Action Committee
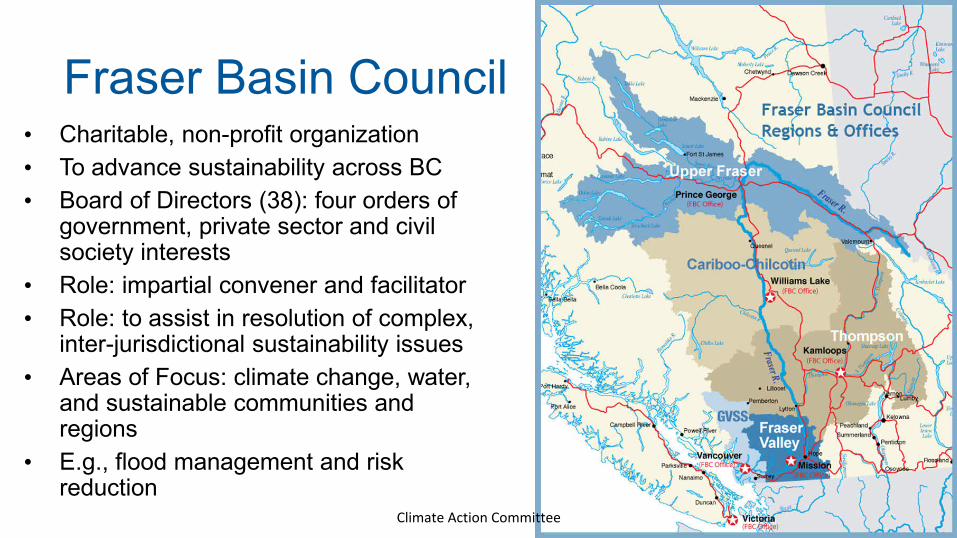
• Charitable, non-profit organization• To advance sustainability across BC• Board of Directors (38): four orders of
government, private sector and civilsociety interests
• Role: impartial convener and facilitator• Role: to assist in resolution of complex,
inter-jurisdictional sustainability issues• Areas of Focus: climate change, water,
and sustainable communities andregions
• E.g., flood management and riskreduction
Fraser Basin Council
Climate Action Committee
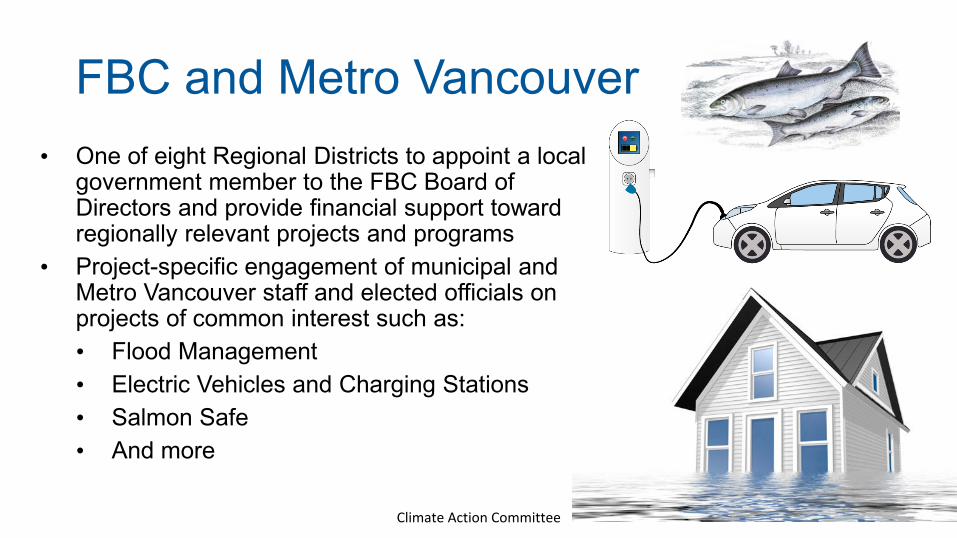
FBC and Metro Vancouver• One of eight Regional Districts to appoint a local
government member to the FBC Board ofDirectors and provide financial support towardregionally relevant projects and programs
• Project-specific engagement of municipal andMetro Vancouver staff and elected officials onprojects of common interest such as:• Flood Management• Electric Vehicles and Charging Stations• Salmon Safe• And more
Climate Action Committee
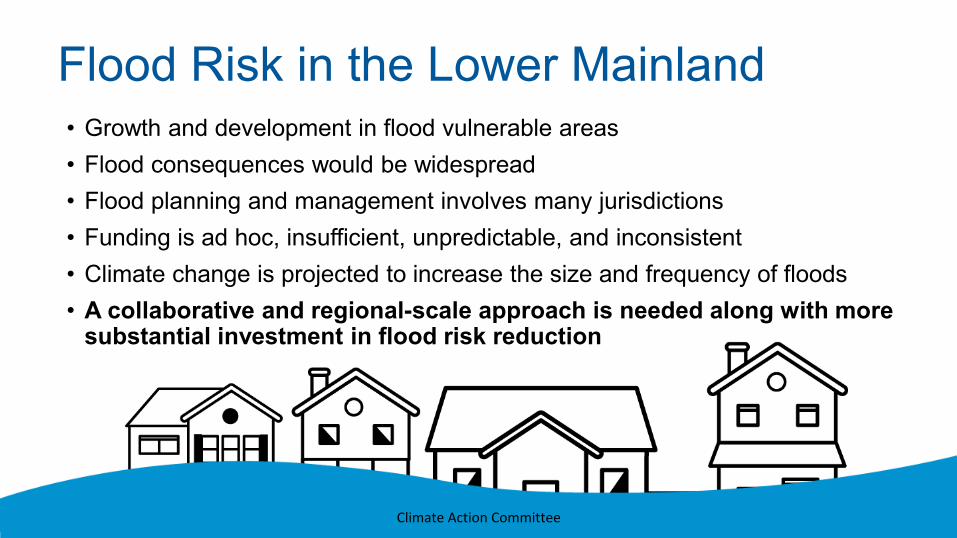
Flood Risk in the Lower Mainland• Growth and development in flood vulnerable areas• Flood consequences would be widespread• Flood planning and management involves many jurisdictions• Funding is ad hoc, insufficient, unpredictable, and inconsistent• Climate change is projected to increase the size and frequency of floods• A collaborative and regional-scale approach is needed along with more
substantial investment in flood risk reduction
Climate Action Committee
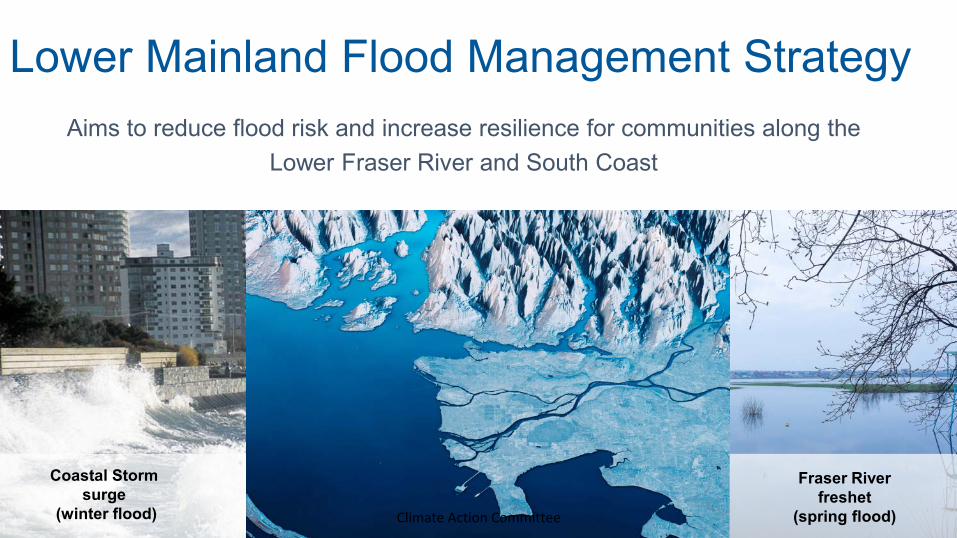
Aims to reduce flood risk and increase resilience for communities along the Lower Fraser River and South Coast
Coastal Storm surge
(winter flood)
Fraser River freshet
(spring flood)
Lower Mainland Flood Management Strategy
Climate Action Committee
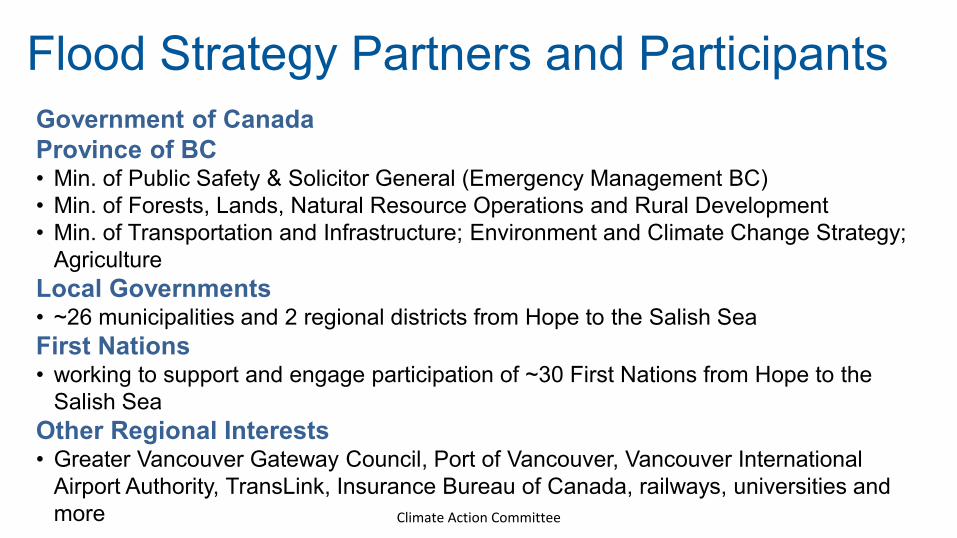
Flood Strategy Partners and ParticipantsGovernment of CanadaProvince of BC • Min. of Public Safety & Solicitor General (Emergency Management BC)• Min. of Forests, Lands, Natural Resource Operations and Rural Development• Min. of Transportation and Infrastructure; Environment and Climate Change Strategy;
AgricultureLocal Governments• ~26 municipalities and 2 regional districts from Hope to the Salish SeaFirst Nations• working to support and engage participation of ~30 First Nations from Hope to the
Salish SeaOther Regional Interests • Greater Vancouver Gateway Council, Port of Vancouver, Vancouver International
Airport Authority, TransLink, Insurance Bureau of Canada, railways, universities andmore Climate Action Committee
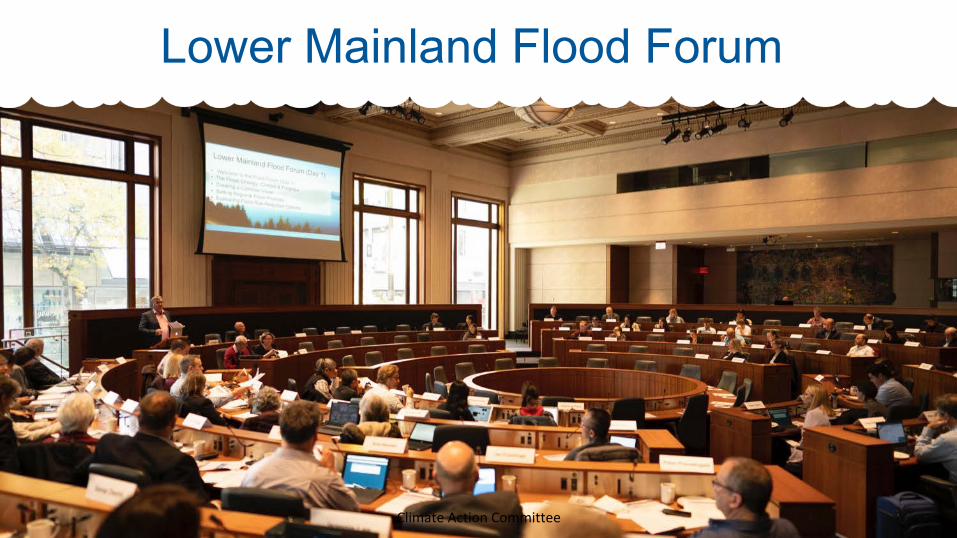
Lower Mainland Flood Forum
Climate Action Committee
Climate Action Committee
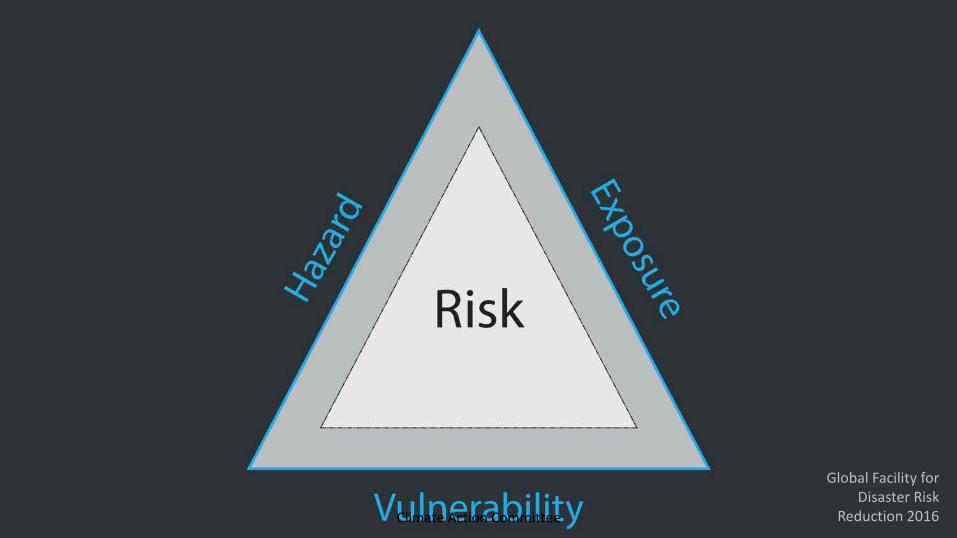
RISKER TRIANGLE
Global Facility for Disaster Risk
Reduction 2016Climate Action Committee
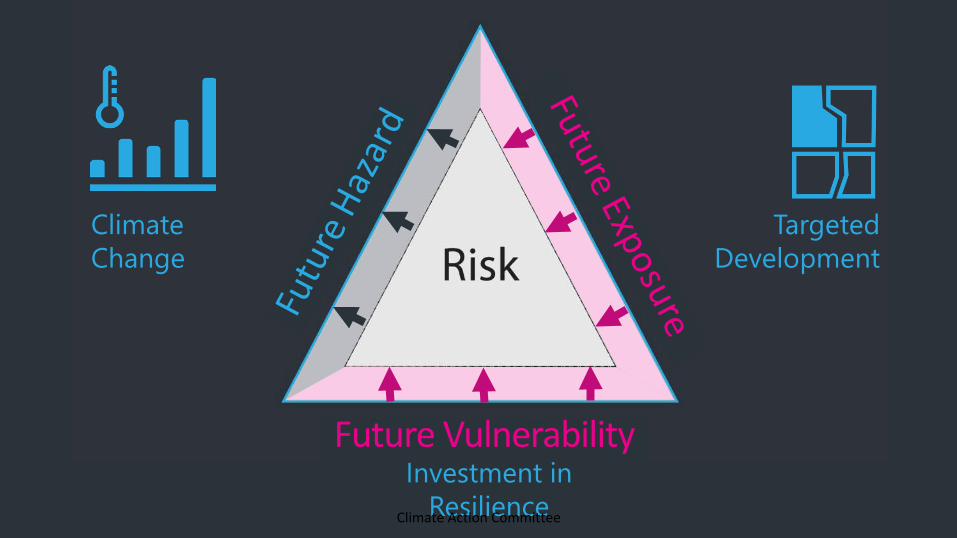
RISKER TRIANGLE
Climate Change
TargetedDevelopment
Future VulnerabilityInvestment in
ResilienceClimate Action Committee
Values and Principles to Guide the Flood Strategy
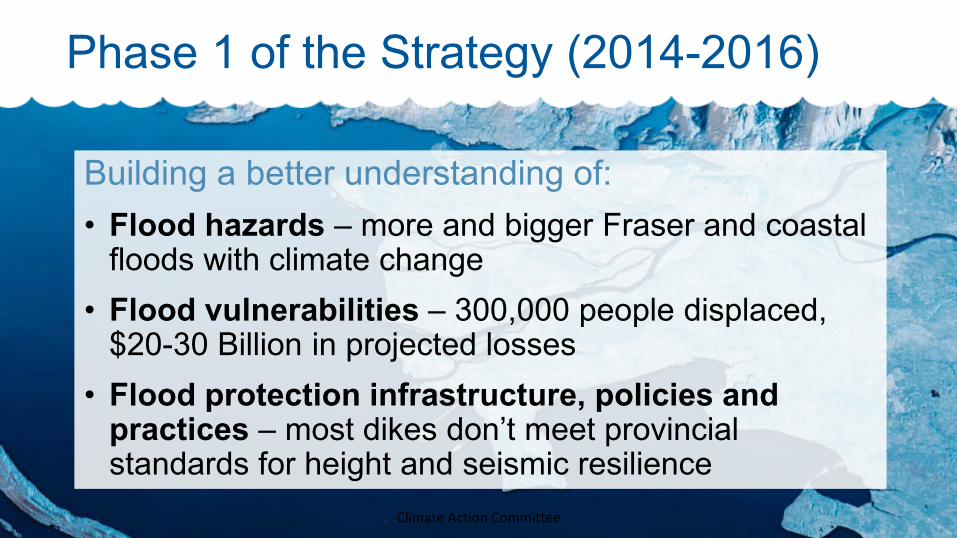
Building a better understanding of:• Flood hazards – more and bigger Fraser and coastal
floods with climate change• Flood vulnerabilities – 300,000 people displaced,
$20-30 Billion in projected losses• Flood protection infrastructure, policies and
practices – most dikes don’t meet provincialstandards for height and seismic resilience
Phase 1 of the Strategy (2014-2016)
Climate Action Committee
Values and Principles to Guide the Flood Strategy
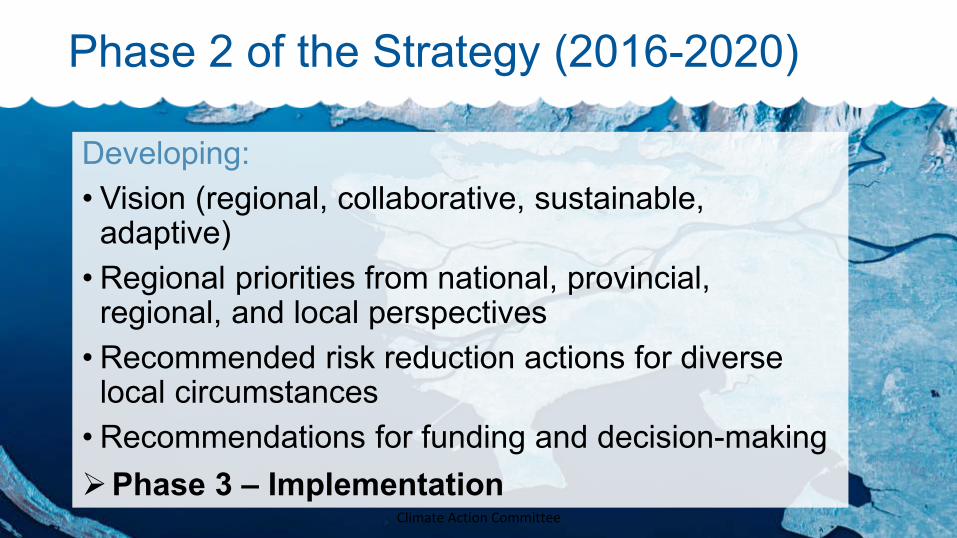
Developing:• Vision (regional, collaborative, sustainable,
adaptive)• Regional priorities from national, provincial,
regional, and local perspectives• Recommended risk reduction actions for diverse
local circumstances• Recommendations for funding and decision-makingPhase 3 – Implementation
Phase 2 of the Strategy (2016-2020)
Climate Action Committee
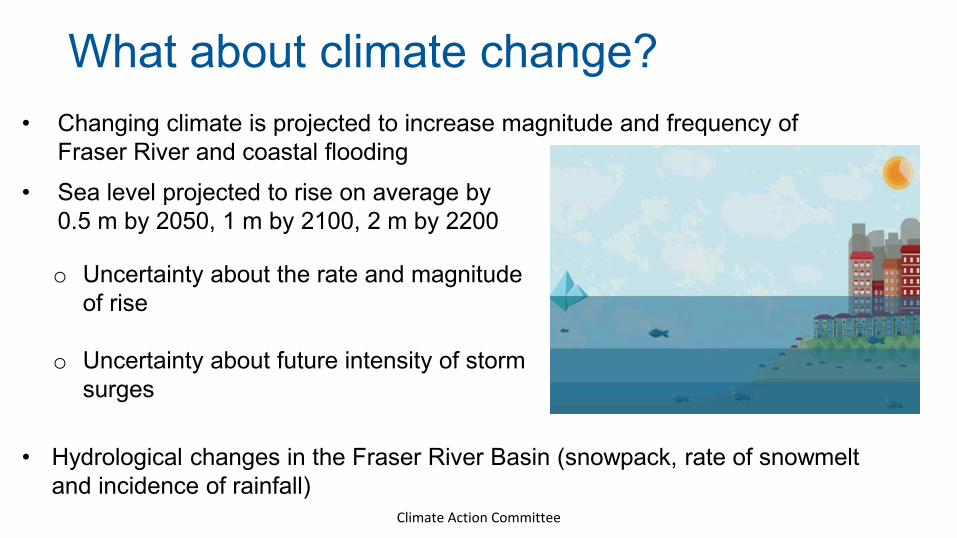
• Changing climate is projected to increase magnitude and frequency of Fraser River and coastal flooding
What about climate change?
• Sea level projected to rise on average by 0.5 m by 2050, 1 m by 2100, 2 m by 2200
o Uncertainty about the rate and magnitude of rise
o Uncertainty about future intensity of storm surges
• Hydrological changes in the Fraser River Basin (snowpack, rate of snowmelt and incidence of rainfall)
Climate Action Committee
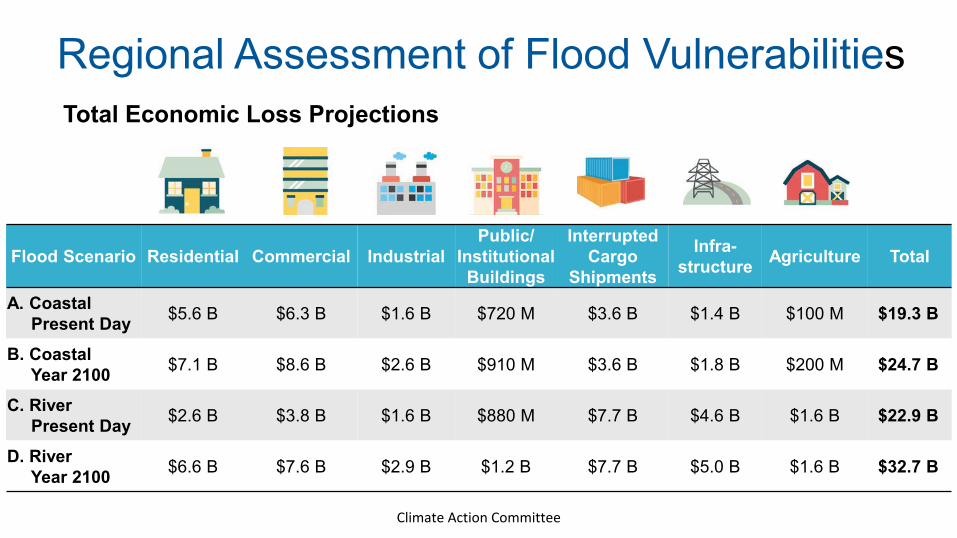
Flood Scenario Residential Commercial IndustrialPublic/
Institutional Buildings
Interrupted Cargo
Shipments
Infra-structure Agriculture Total
A. CoastalPresent Day $5.6 B $6.3 B $1.6 B $720 M $3.6 B $1.4 B $100 M $19.3 B
B. CoastalYear 2100 $7.1 B $8.6 B $2.6 B $910 M $3.6 B $1.8 B $200 M $24.7 B
C. RiverPresent Day $2.6 B $3.8 B $1.6 B $880 M $7.7 B $4.6 B $1.6 B $22.9 B
D. RiverYear 2100 $6.6 B $7.6 B $2.9 B $1.2 B $7.7 B $5.0 B $1.6 B $32.7 B
Regional Assessment of Flood VulnerabilitiesTotal Economic Loss Projections
Climate Action Committee
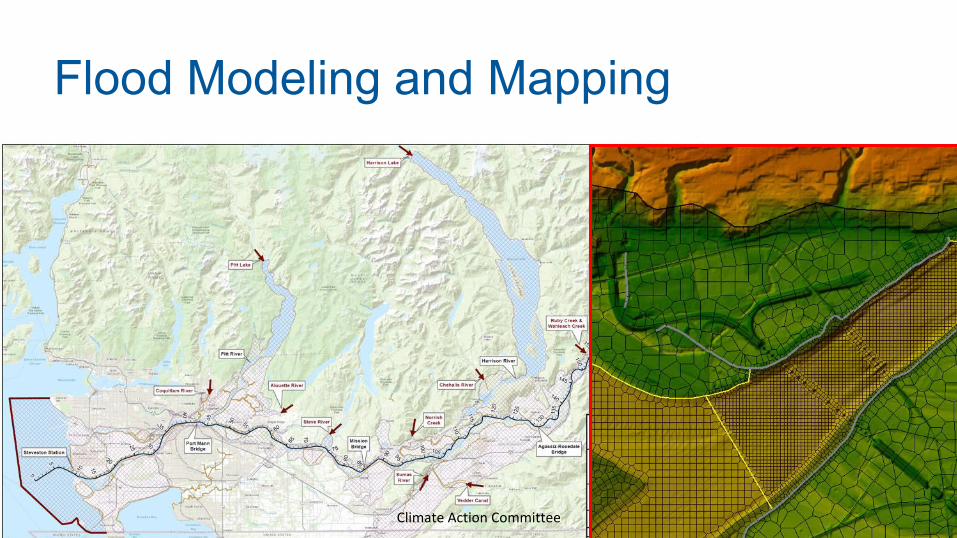
Flood Modeling and Mapping
Climate Action Committee
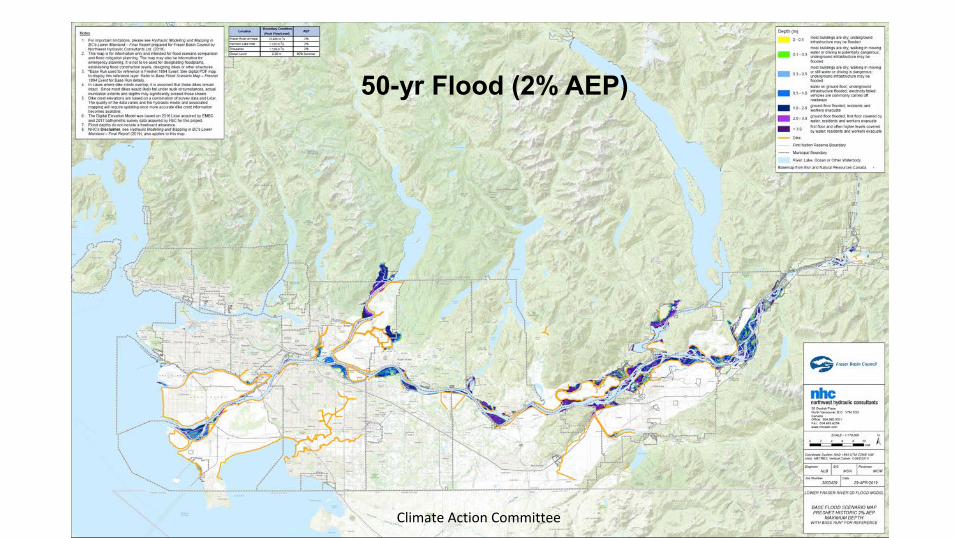
50-yr Flood50-yr Flood (2% AEP)
Climate Action Committee
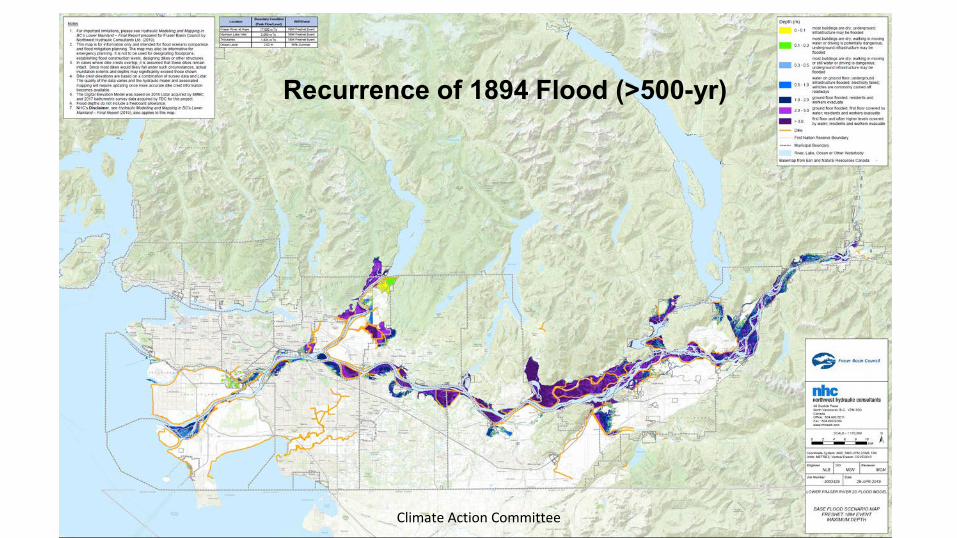
Recurrence of 1894 Flood (>500-yr)Recurrence of 1894 Flood (>500-yr)
Climate Action Committee
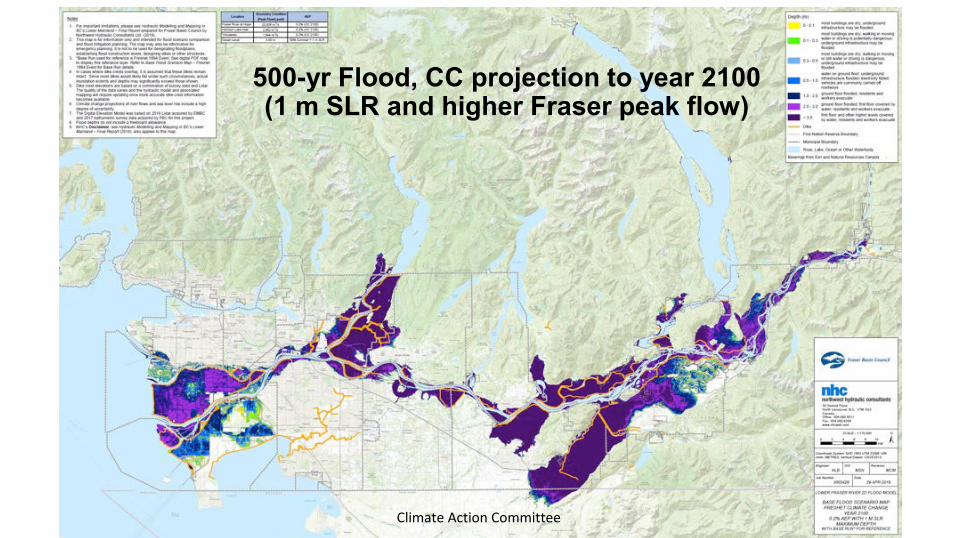
500-yr Flood, CC projection to year 2100 (1 m SLR and higher Fraser peak flow)500-yr Flood, CC projection to year 2100
(1 m SLR and higher Fraser peak flow)
Climate Action Committee
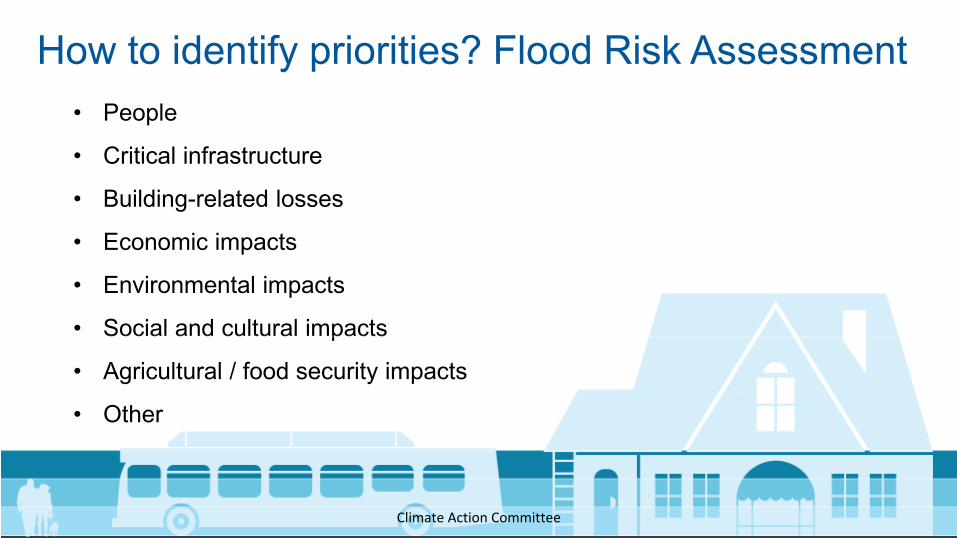
How to identify priorities? Flood Risk Assessment• People
• Critical infrastructure
• Building-related losses
• Economic impacts
• Environmental impacts
• Social and cultural impacts
• Agricultural / food security impacts
• Other
Climate Action Committee
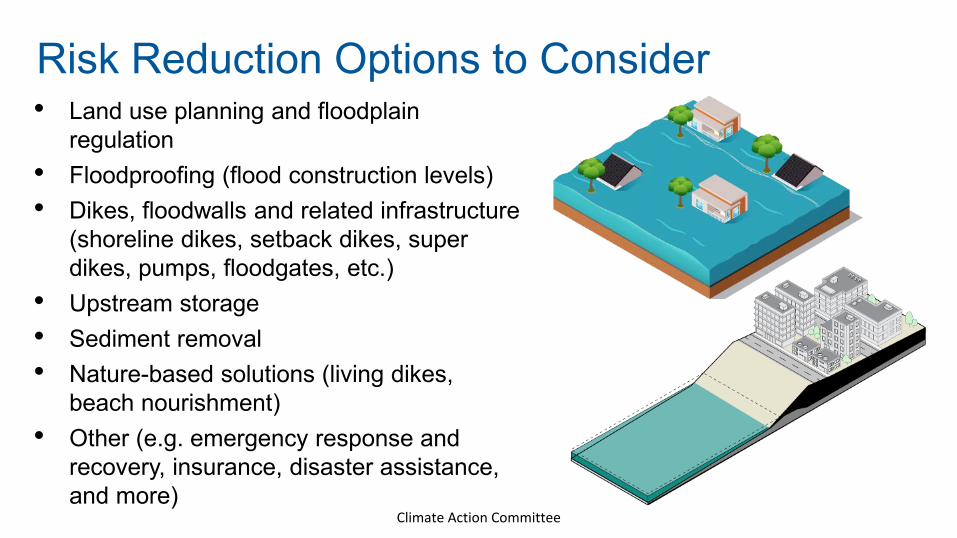
Risk Reduction Options to Consider• Land use planning and floodplain
regulation• Floodproofing (flood construction levels)• Dikes, floodwalls and related infrastructure
(shoreline dikes, setback dikes, superdikes, pumps, floodgates, etc.)
• Upstream storage• Sediment removal• Nature-based solutions (living dikes,
beach nourishment)• Other (e.g. emergency response and
recovery, insurance, disaster assistance,and more)
Climate Action Committee
Thank you. Questions and Comments?
Fraser Basin Council
Steve Litke, Director Frances Woo, Program [email protected] [email protected]
Havan Surat, Program Manager Natalie Elster, Asst. Program [email protected] [email protected]
www.floodstrategy.ca
37790204 Climate Action Committee
Health Impacts of Residential Wood Smoke
Michael Brauer
School of Population and Public Health
Metro Vancouver Climate Action Committee, October 4, 2017
4.2
Climate Action Committee
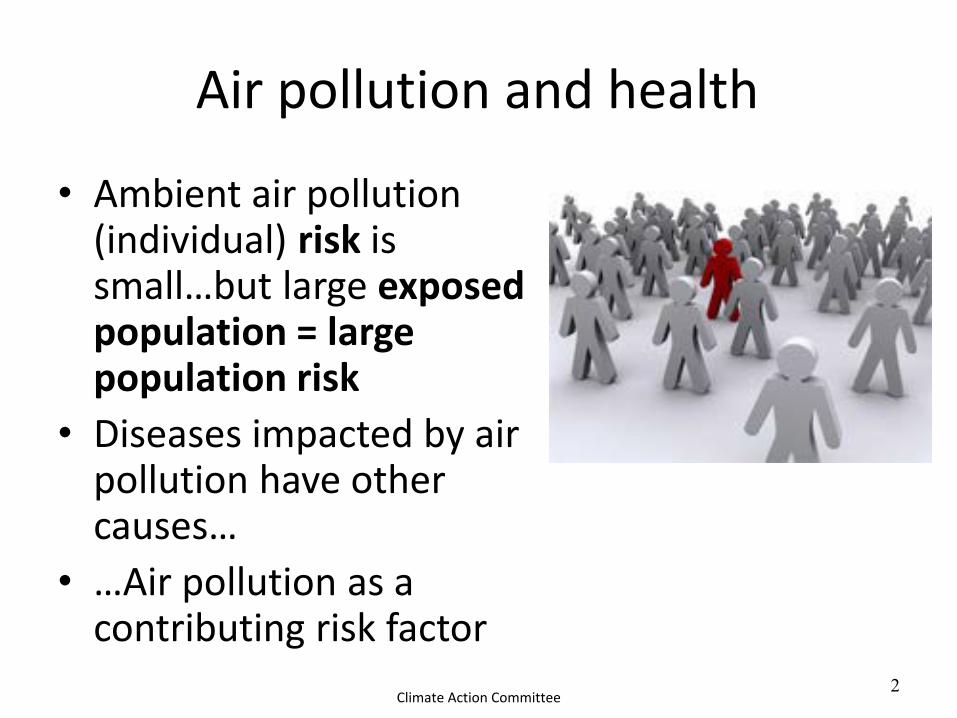
Air pollution and health
• Ambient air pollution (individual) risk is small…but large exposed population = large population risk
• Diseases impacted by air pollution have other causes…
• …Air pollution as a contributing risk factor
2Climate Action Committee
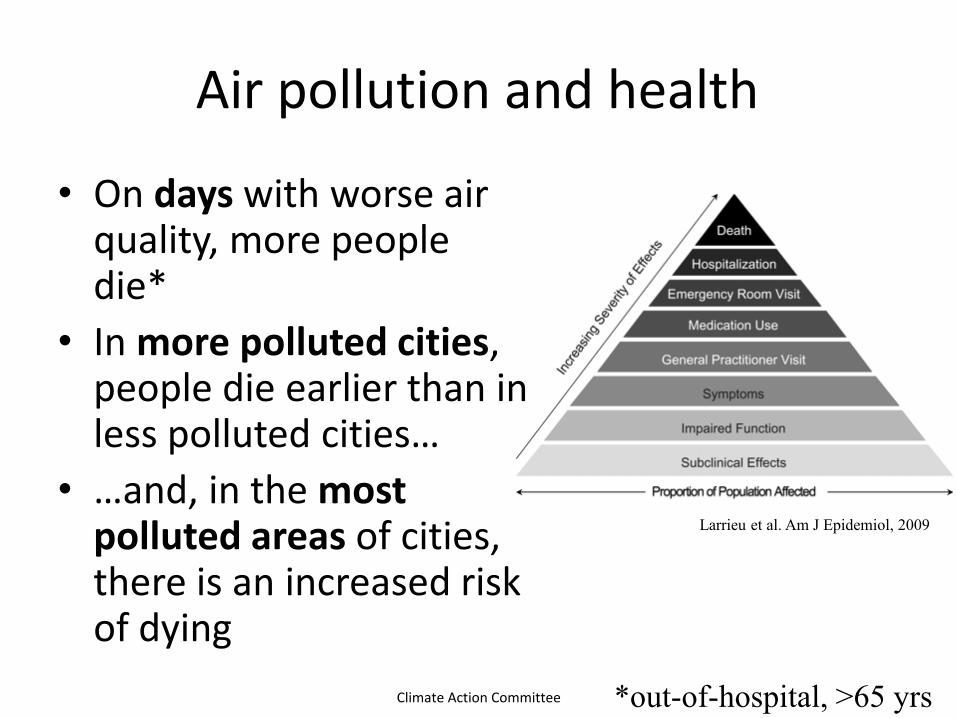
Air pollution and health
• On days with worse air quality, more people die*
• In more polluted cities, people die earlier than in less polluted cities…
• …and, in the most polluted areas of cities, there is an increased risk of dying
Larrieu et al. Am J Epidemiol, 2009
*out-of-hospital, >65 yrsClimate Action Committee
BC Lung air quality and health workshop 2016
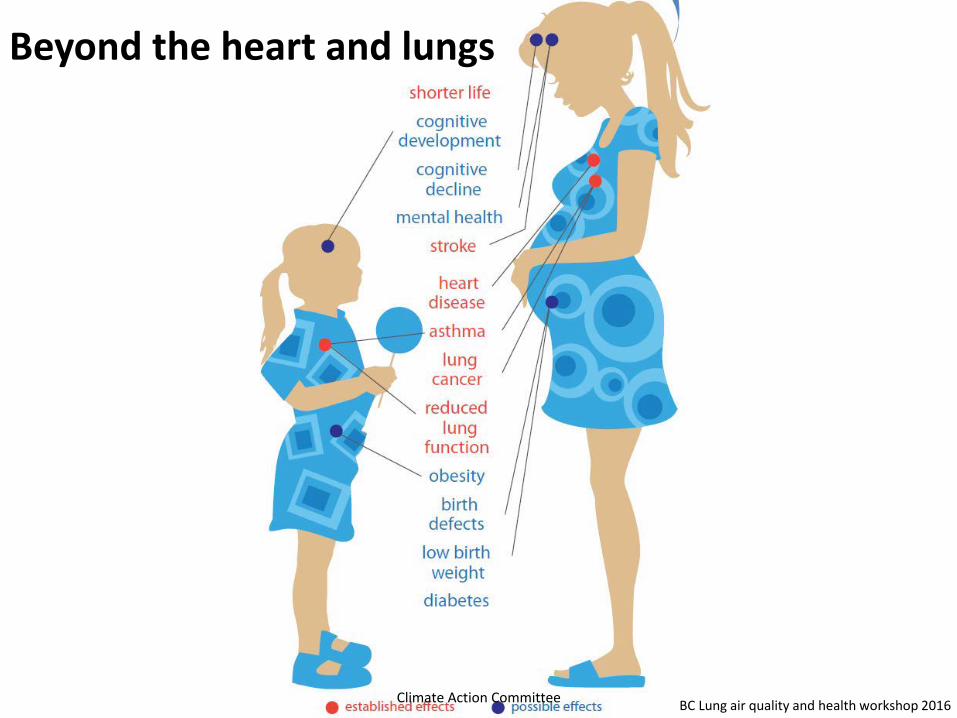
Beyond the heart and lungs
Climate Action Committee
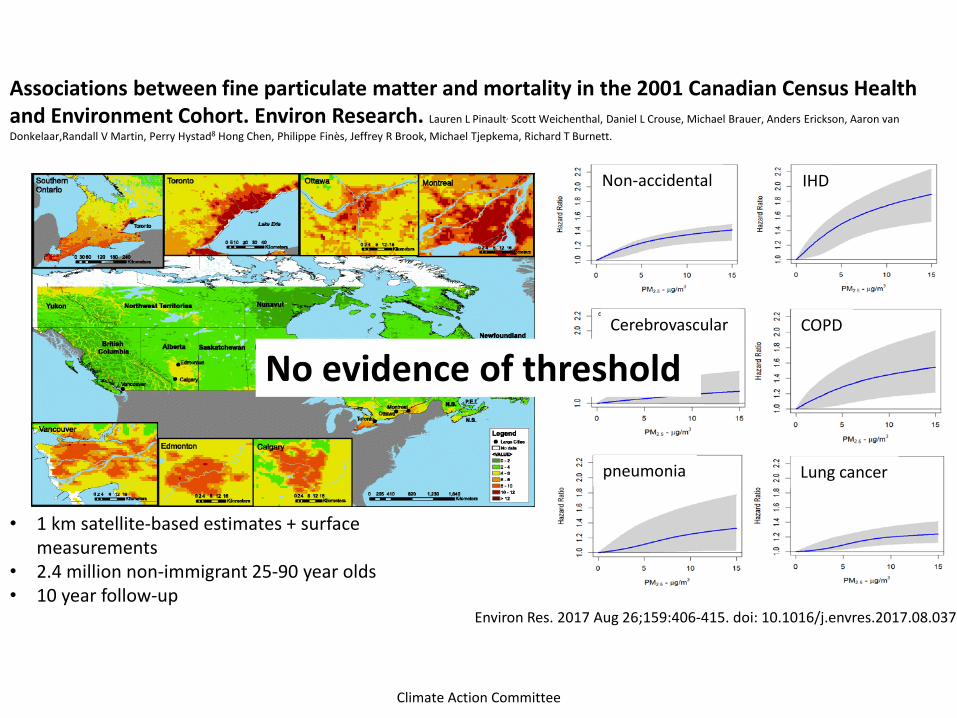
• 1 km satellite-based estimates + surface measurements
• 2.4 million non-immigrant 25-90 year olds• 10 year follow-up
Associations between fine particulate matter and mortality in the 2001 Canadian Census Health and Environment Cohort. Environ Research. Lauren L Pinault, Scott Weichenthal, Daniel L Crouse, Michael Brauer, Anders Erickson, Aaron van Donkelaar,Randall V Martin, Perry Hystad8 Hong Chen, Philippe Finès, Jeffrey R Brook, Michael Tjepkema, Richard T Burnett.
Non-accidental IHD
Cerebrovascular COPD
pneumonia Lung cancer
Environ Res. 2017 Aug 26;159:406-415. doi: 10.1016/j.envres.2017.08.037
No evidence of threshold
Climate Action Committee
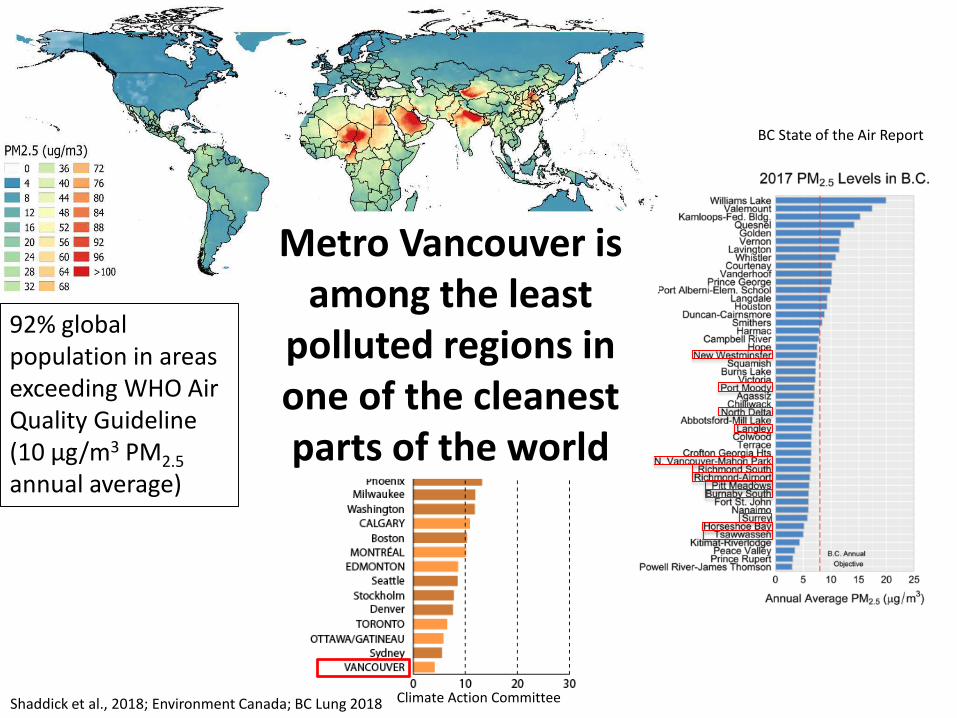
BC State of the Air Report
Shaddick et al., 2018; Environment Canada; BC Lung 2018
92% global population in areas exceeding WHO Air Quality Guideline (10 μg/m3 PM2.5annual average)
Metro Vancouver is among the least
polluted regions in one of the cleanest parts of the world
Climate Action Committee
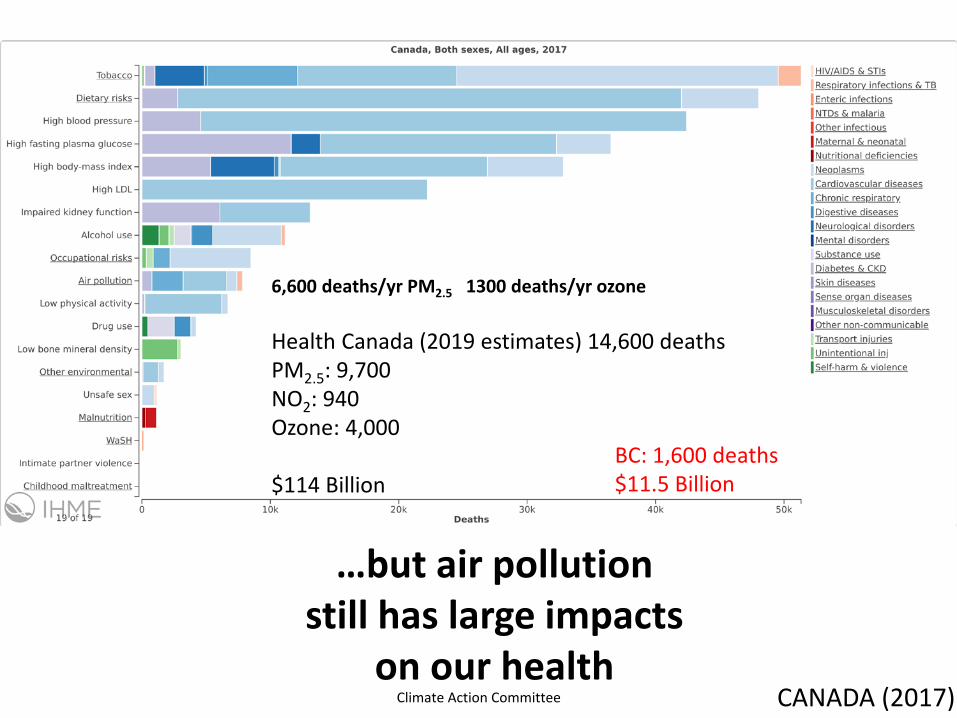
CANADA (2017)
6,600 deaths/yr PM2.5 1300 deaths/yr ozone
Health Canada (2019 estimates) 14,600 deathsPM2.5: 9,700NO2: 940Ozone: 4,000
$114 BillionBC: 1,600 deaths$11.5 Billion
…but air pollution still has large impacts
on our healthClimate Action Committee
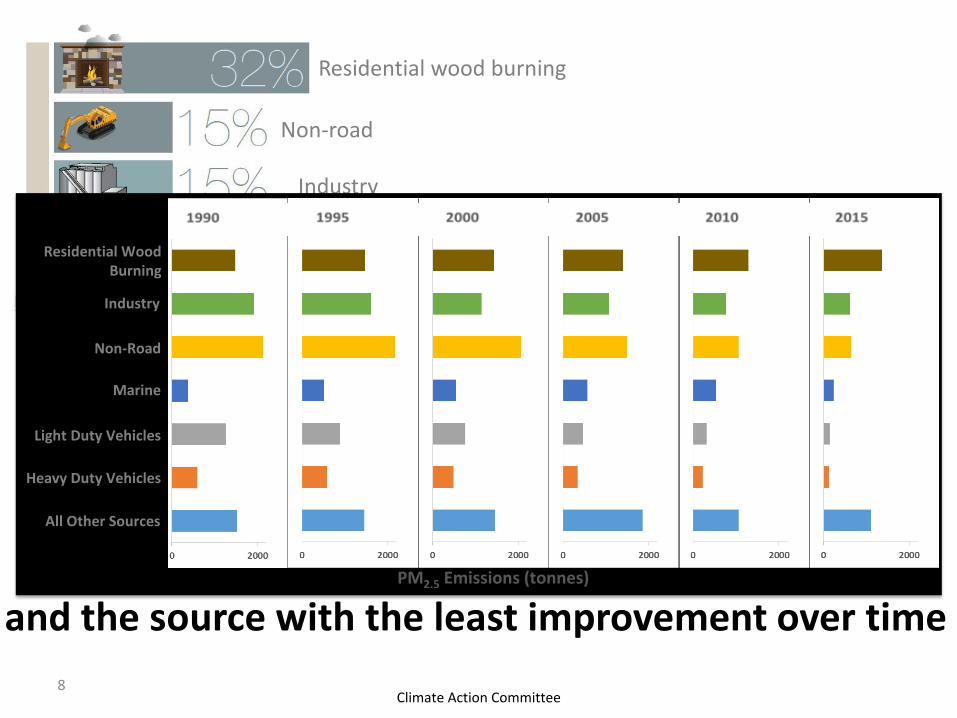
8
Residential wood burning
Industry
Non-road
Marine
Motor vehicles
Other
…and residential woodsmoke is our largest sourceand the source with the least improvement over time
Residential WoodBurning
Industry
Marine
Non-Road
Light Duty Vehicles
Heavy Duty Vehicles
All Other Sources
PM2.5 Emissions (tonnes)
Climate Action Committee
Climate Action Committee
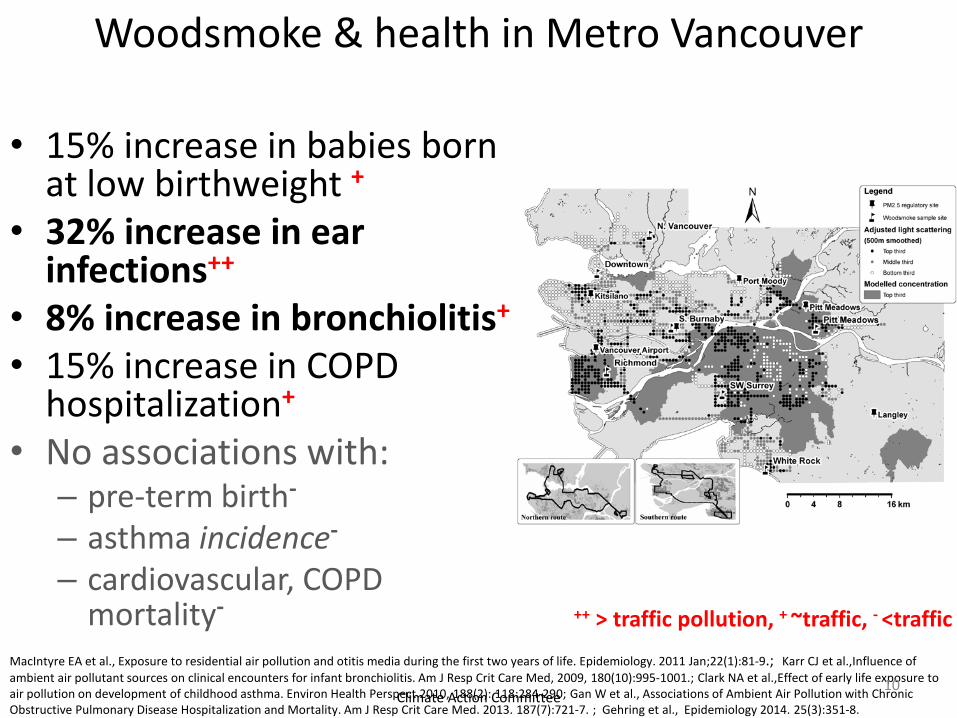
Woodsmoke & health in Metro Vancouver
• 15% increase in babies born at low birthweight +
• 32% increase in ear infections++
• 8% increase in bronchiolitis+
• 15% increase in COPD hospitalization+
• No associations with:– pre-term birth-
– asthma incidence-
– cardiovascular, COPD mortality-
MacIntyre EA et al., Exposure to residential air pollution and otitis media during the first two years of life. Epidemiology. 2011 Jan;22(1):81-9.; Karr CJ et al.,Influence of ambient air pollutant sources on clinical encounters for infant bronchiolitis. Am J Resp Crit Care Med, 2009, 180(10):995-1001.; Clark NA et al.,Effect of early life exposure to air pollution on development of childhood asthma. Environ Health Perspect 2010, 188(2): 118:284-290; Gan W et al., Associations of Ambient Air Pollution with Chronic Obstructive Pulmonary Disease Hospitalization and Mortality. Am J Resp Crit Care Med. 2013. 187(7):721-7. ; Gehring et al., Epidemiology 2014. 25(3):351-8.
++ > traffic pollution, + ~traffic, - <traffic
10Climate Action Committee
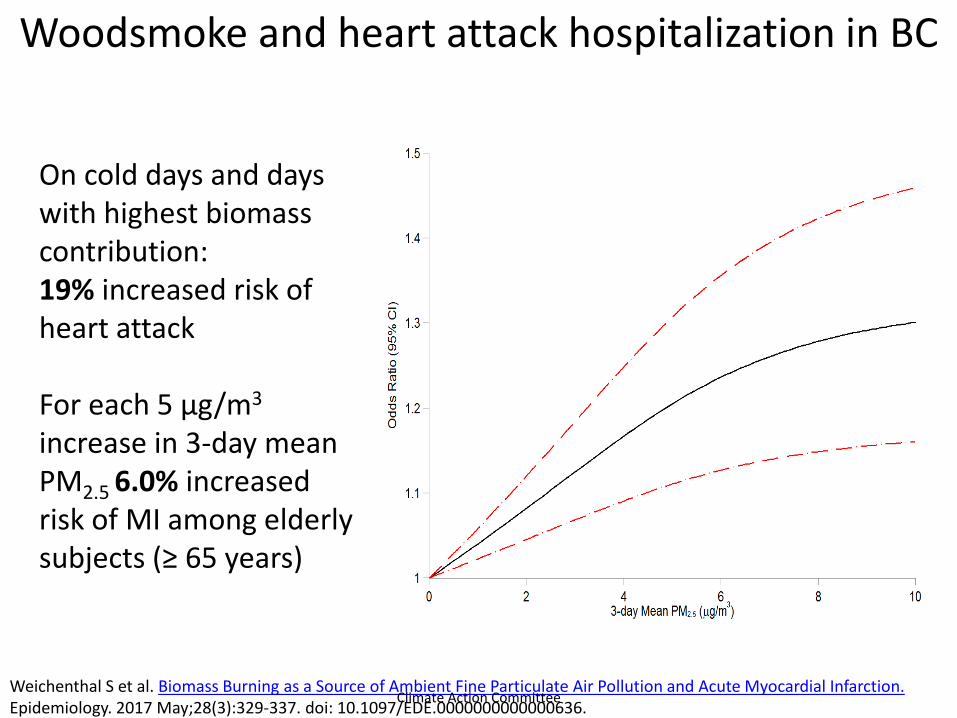
Woodsmoke and heart attack hospitalization in BC
On cold days and days with highest biomass contribution:19% increased risk of heart attack
For each 5 µg/m3
increase in 3-day mean PM2.5 6.0% increased risk of MI among elderly subjects (≥ 65 years)
Weichenthal S et al. Biomass Burning as a Source of Ambient Fine Particulate Air Pollution and Acute Myocardial Infarction.Epidemiology. 2017 May;28(3):329-337. doi: 10.1097/EDE.0000000000000636.Climate Action Committee
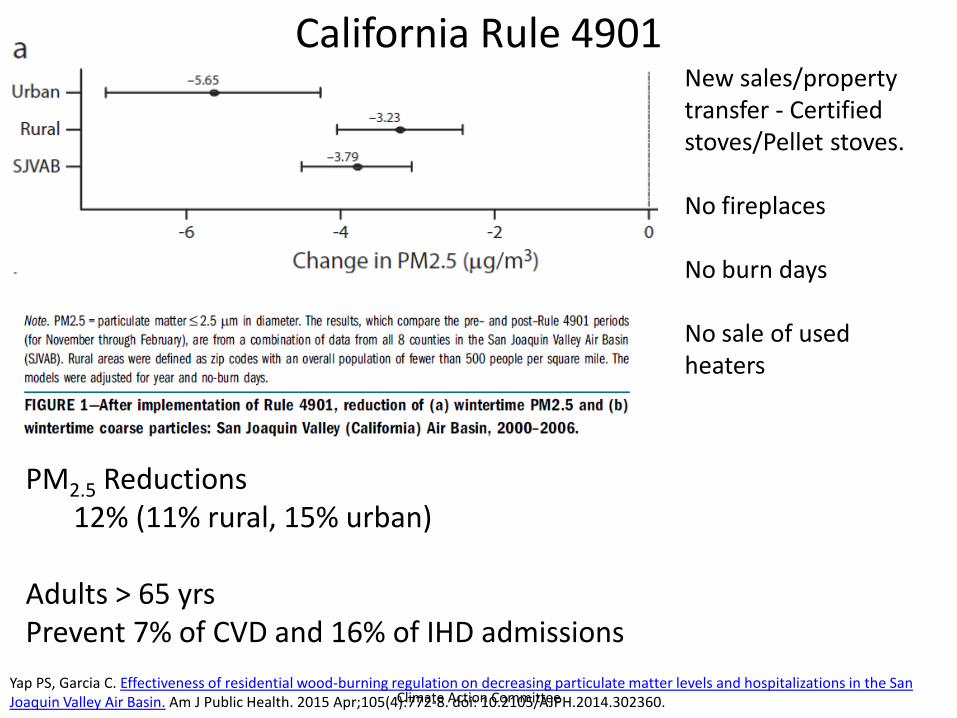
Yap PS, Garcia C. Effectiveness of residential wood-burning regulation on decreasing particulate matter levels and hospitalizations in the San Joaquin Valley Air Basin. Am J Public Health. 2015 Apr;105(4):772-8. doi: 10.2105/AJPH.2014.302360.
PM2.5 Reductions 12% (11% rural, 15% urban)
Adults > 65 yrsPrevent 7% of CVD and 16% of IHD admissions
California Rule 4901New sales/property transfer - Certified stoves/Pellet stoves.
No fireplaces
No burn days
No sale of used heaters
Climate Action Committee
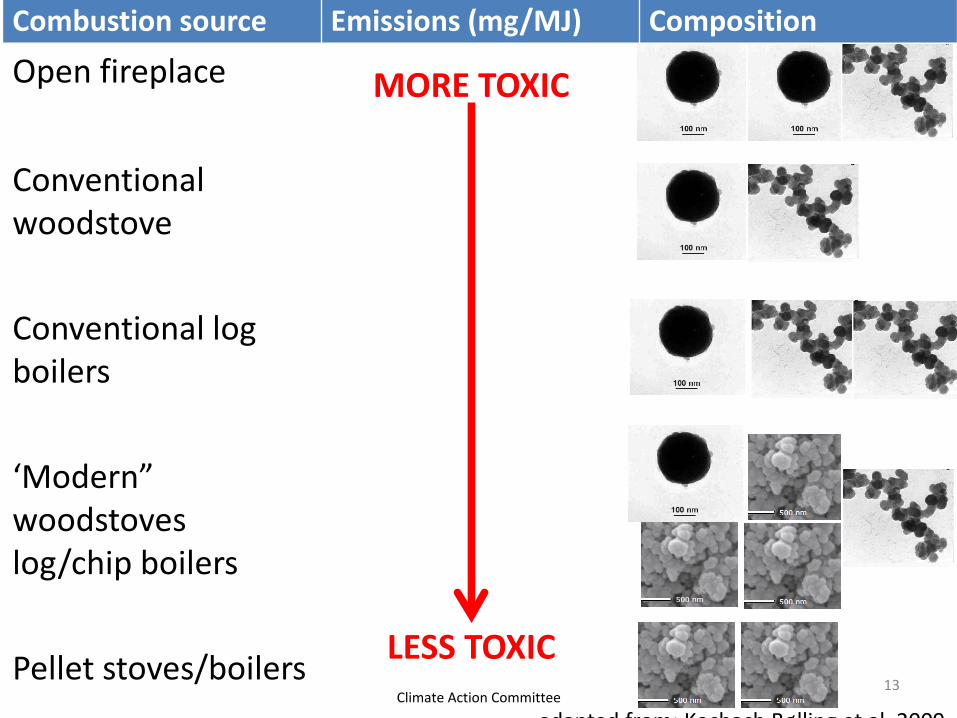
Combustion source Emissions (mg/MJ) Composition
Open fireplace 160 – 910
Conventional woodstove
50 – 2100
Conventional log boilers
50 – 2000(50 – 250)
‘Modern” woodstoveslog/chip boilers
34 – 3305 – 450
Pellet stoves/boilers 10 - 5013
MORE TOXIC
LESS TOXIC
adapted from: Kocbach Bølling et al 2009Climate Action Committee
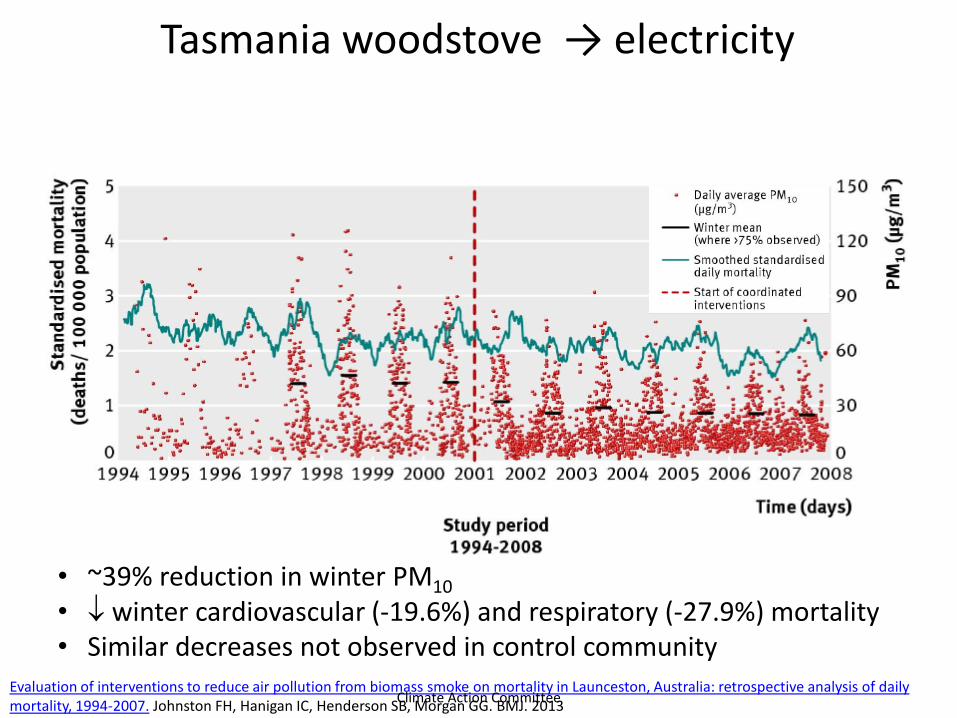
• ~39% reduction in winter PM10• ↓ winter cardiovascular (-19.6%) and respiratory (-27.9%) mortality• Similar decreases not observed in control community
Evaluation of interventions to reduce air pollution from biomass smoke on mortality in Launceston, Australia: retrospective analysis of daily mortality, 1994-2007. Johnston FH, Hanigan IC, Henderson SB, Morgan GG. BMJ. 2013
Tasmania woodstove → electricity
Climate Action Committee
Addressing GHG Intensity of BuildingsCLIMATE ACTION COMMITTEEErik BlairAIR QUALITY PLANNER, AIR QUALITY & CLIMATE CHANGE POLICY
Climate Action Committee, March 13, 2020
Photo courtesy of naturallywood.com
5.2
Climate Action Committee
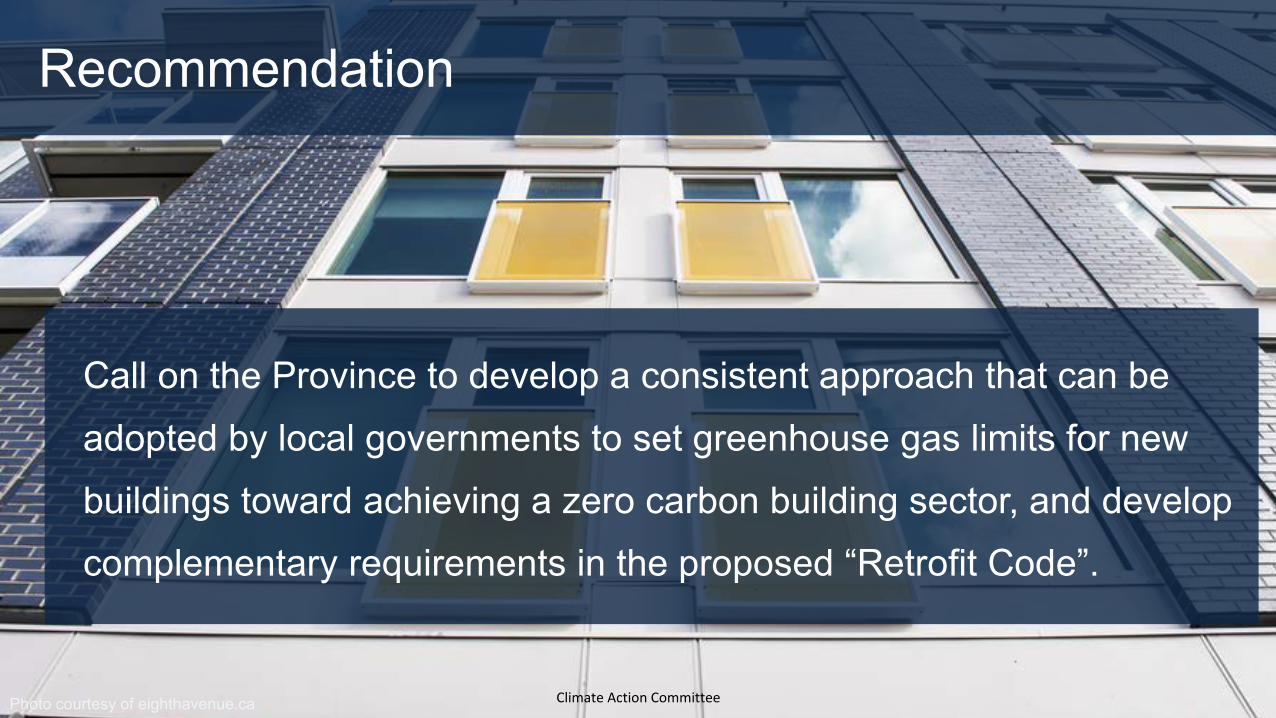
Call on the Province to develop a consistent approach that can be adopted by local governments to set greenhouse gas limits for new buildings toward achieving a zero carbon building sector, and develop complementary requirements in the proposed “Retrofit Code”.
Recommendation
Photo courtesy of eighthavenue.ca Climate Action Committee
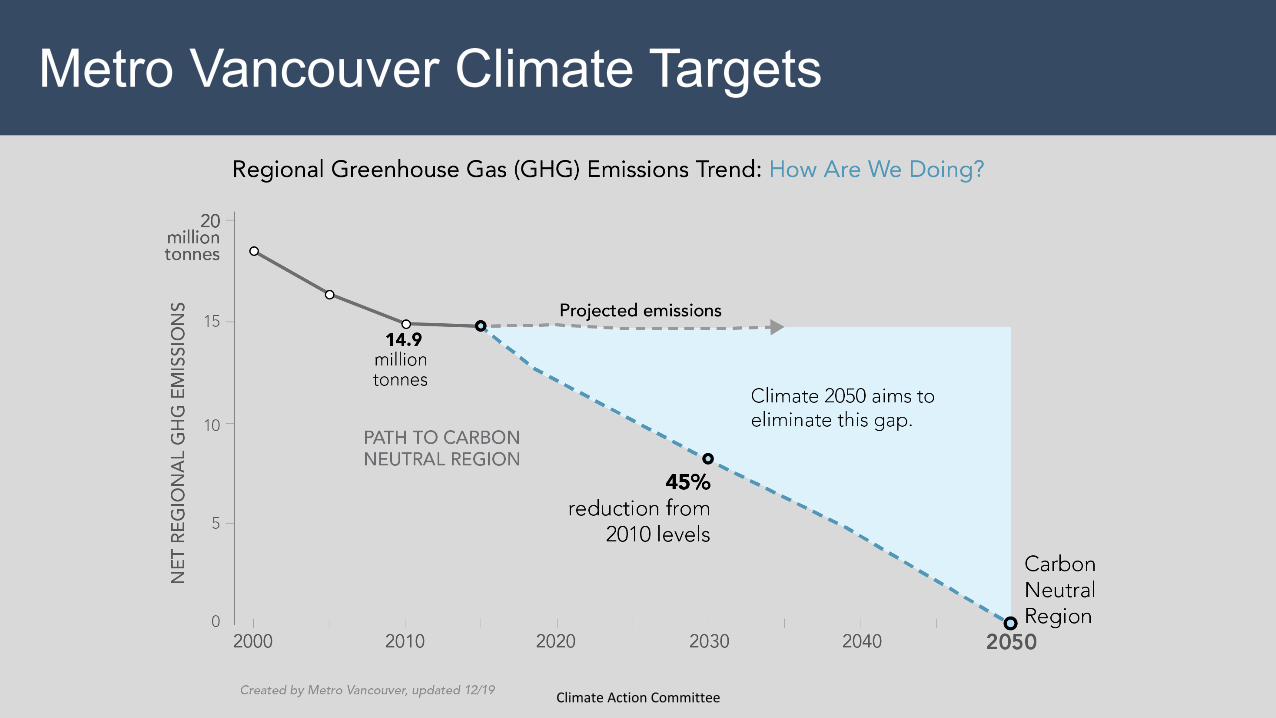
Metro Vancouver Climate Targets
Climate Action Committee
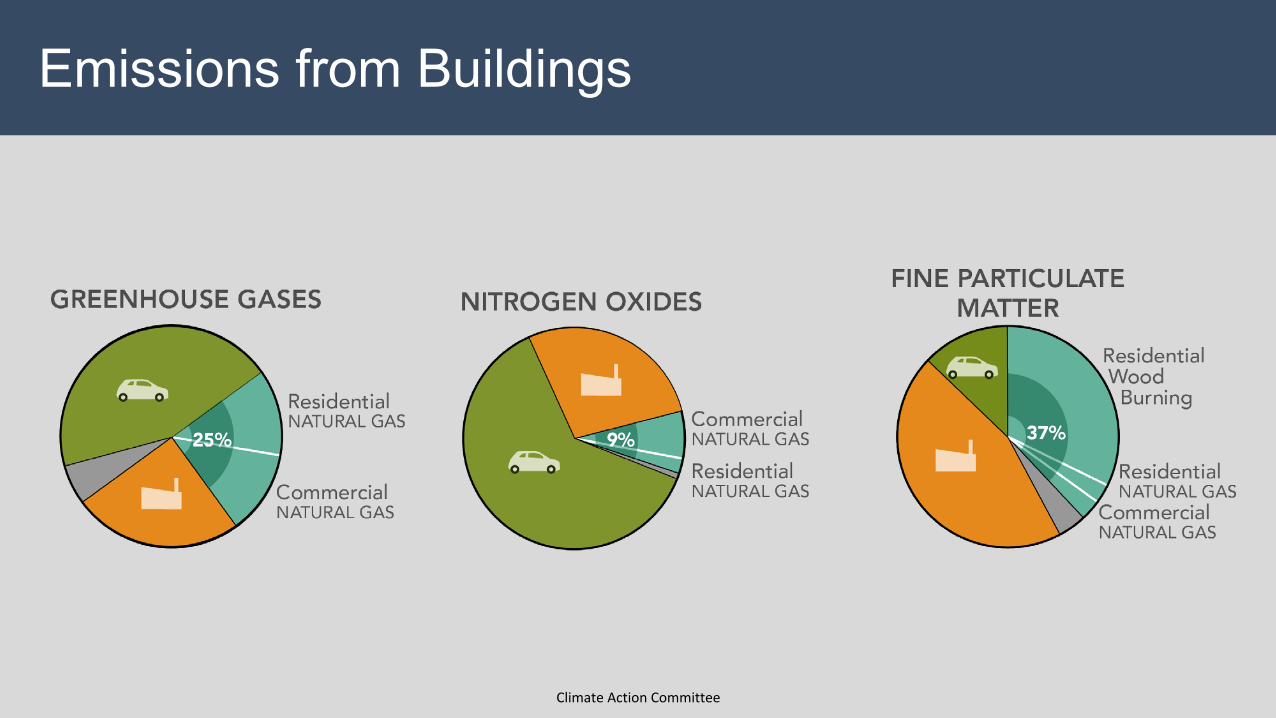
Emissions from Buildings
Climate Action Committee
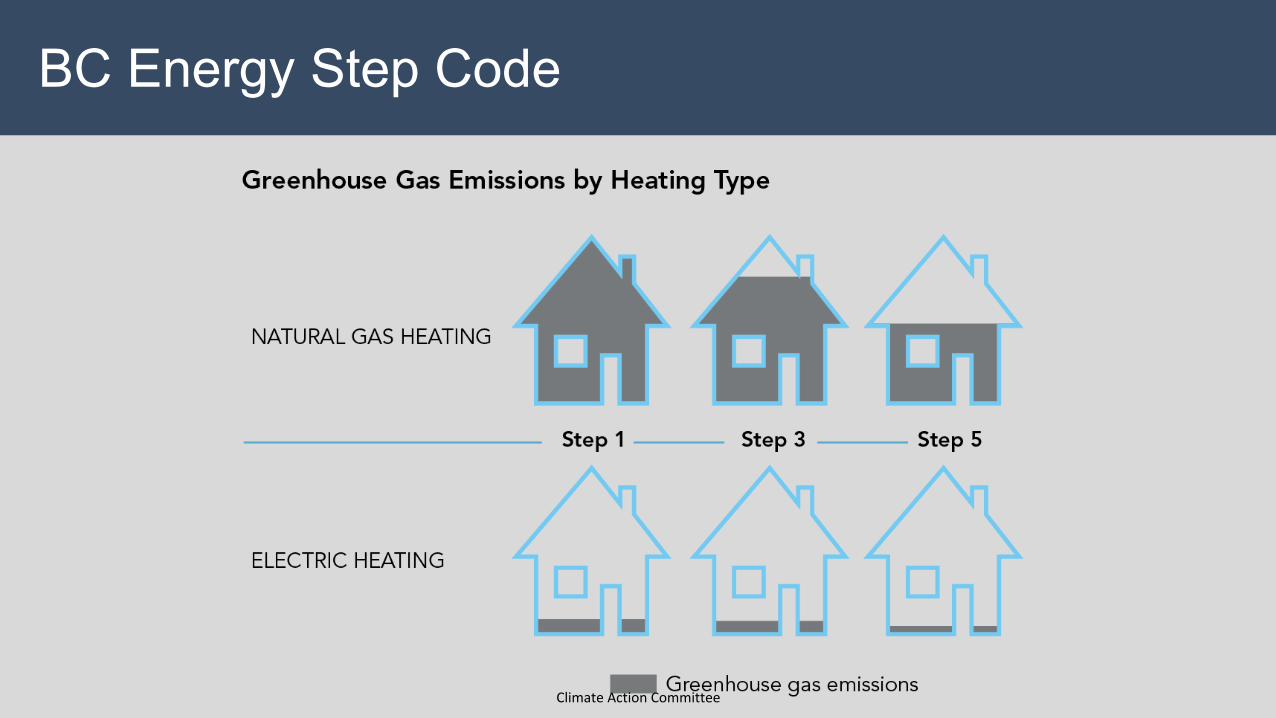
BC Energy Step Code
Climate Action Committee
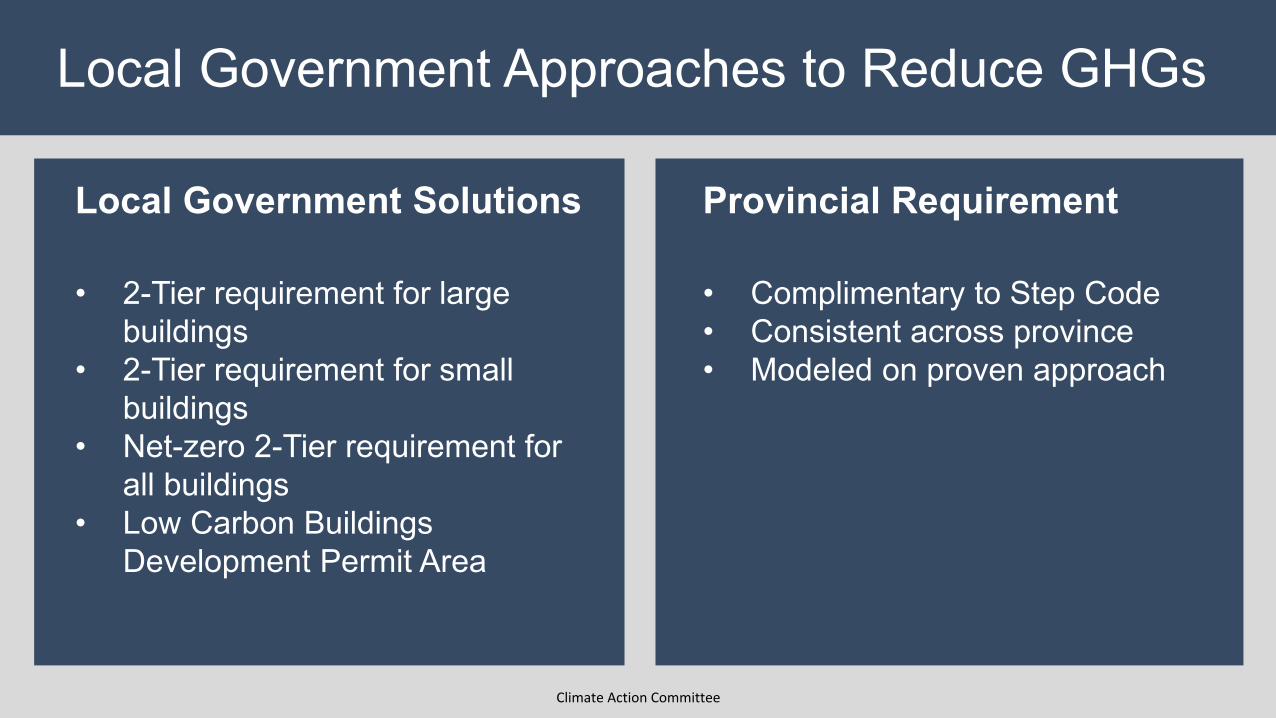
Local Government Approaches to Reduce GHGs
Local Government Solutions
• 2-Tier requirement for large buildings
• 2-Tier requirement for small buildings
• Net-zero 2-Tier requirement for all buildings
• Low Carbon Buildings Development Permit Area
Provincial Requirement
• Complimentary to Step Code• Consistent across province• Modeled on proven approach
Climate Action Committee
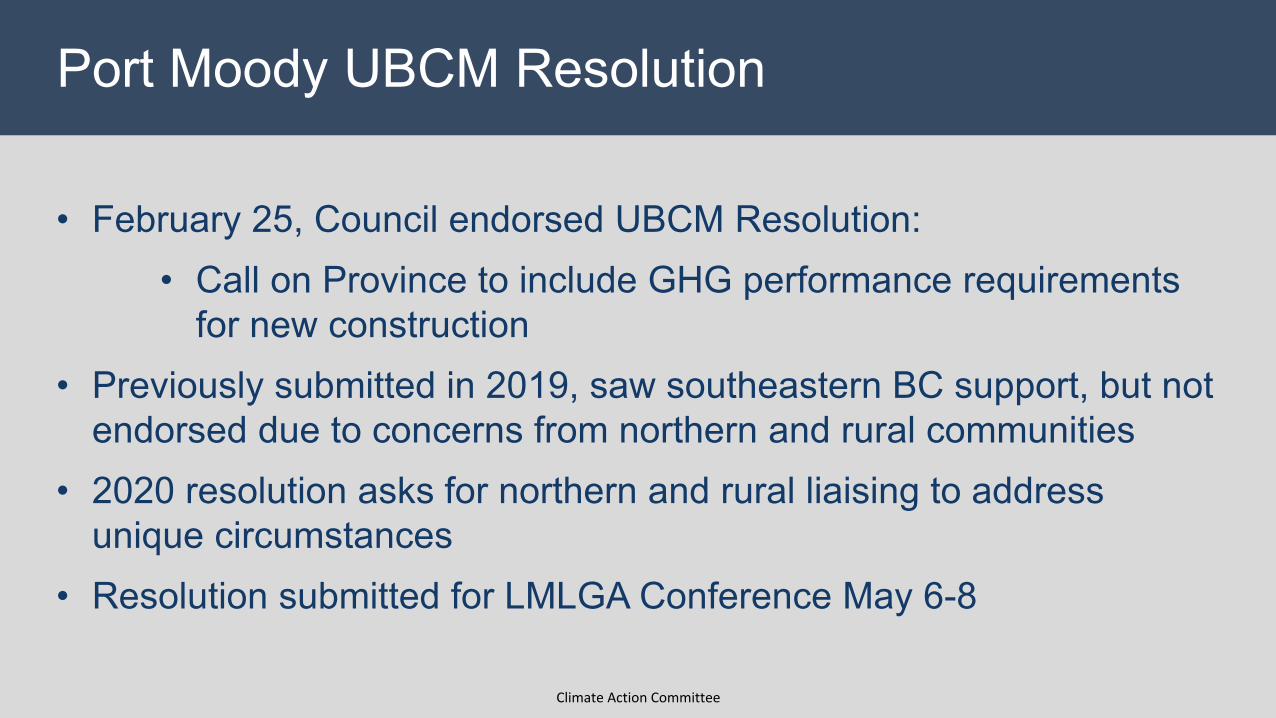
• February 25, Council endorsed UBCM Resolution:• Call on Province to include GHG performance requirements
for new construction• Previously submitted in 2019, saw southeastern BC support, but not
endorsed due to concerns from northern and rural communities• 2020 resolution asks for northern and rural liaising to address
unique circumstances• Resolution submitted for LMLGA Conference May 6-8
Port Moody UBCM Resolution
Climate Action Committee
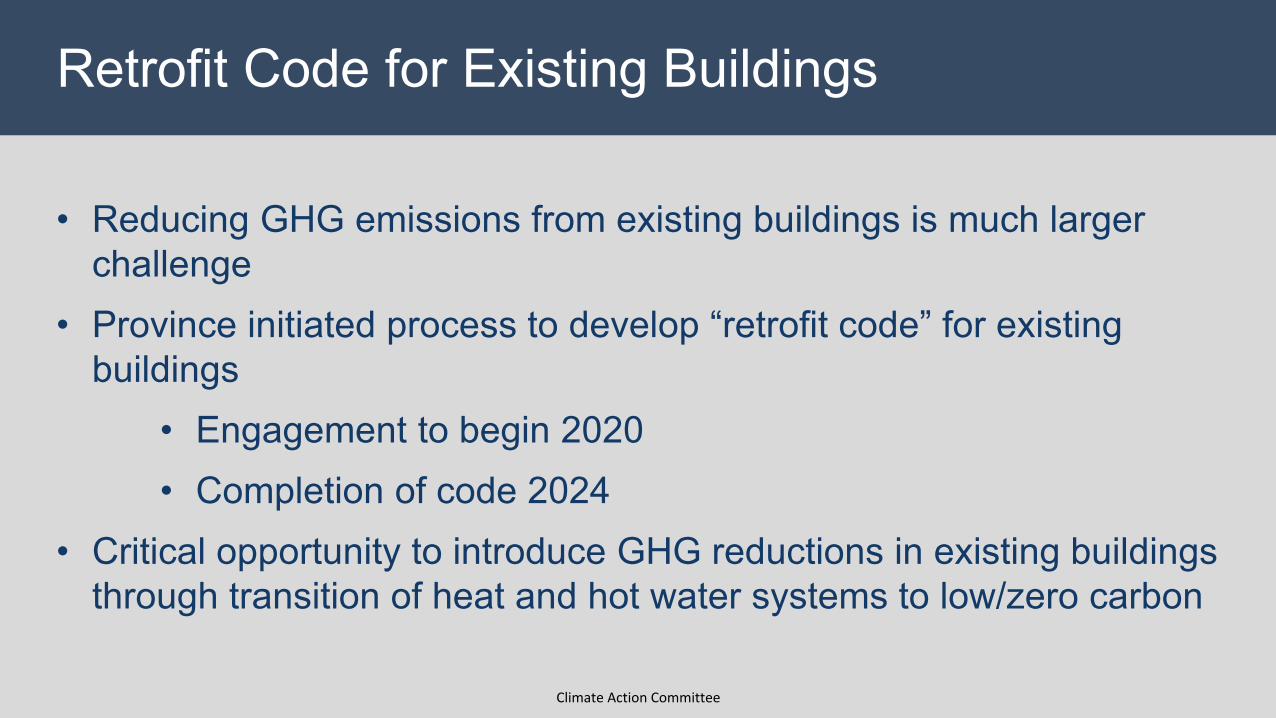
• Reducing GHG emissions from existing buildings is much larger challenge
• Province initiated process to develop “retrofit code” for existing buildings
• Engagement to begin 2020• Completion of code 2024
• Critical opportunity to introduce GHG reductions in existing buildings through transition of heat and hot water systems to low/zero carbon
Retrofit Code for Existing Buildings
Climate Action Committee
Questions?
37794433 Climate Action Committee


