Climate Change – state of the science
Prof. Richard Allan, Department of Meteorology University of Reading
Henley in Transition December 14th 2015
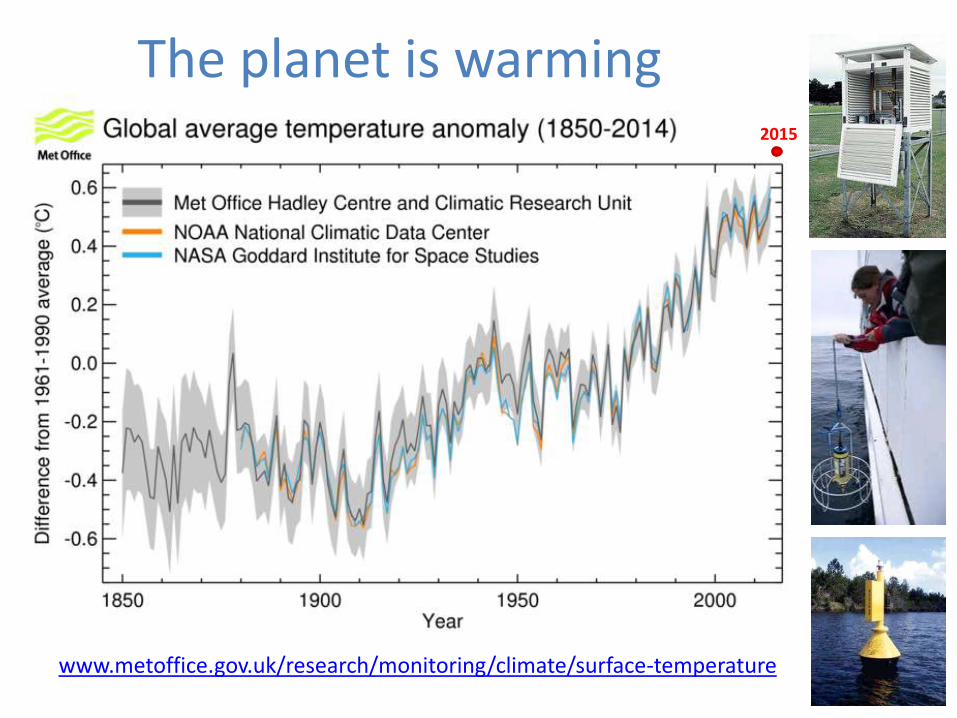
www.metoffice.gov.uk/research/monitoring/climate/surface-temperature
The planet is warming 2015
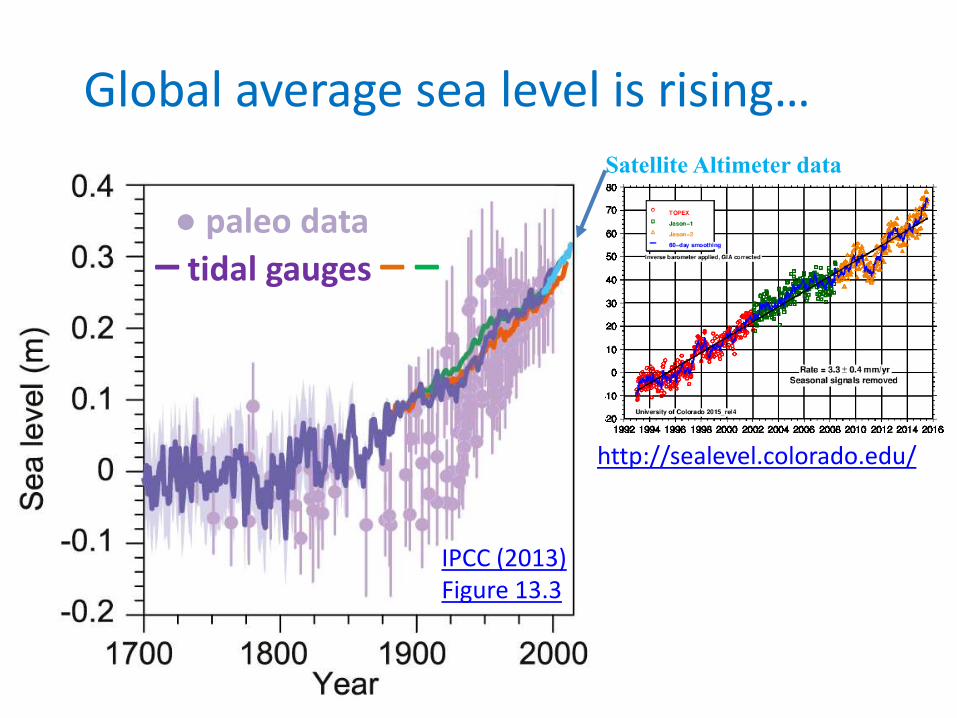
Global average sea level is rising…
– tidal gauges – –
● paleo data
Satellite Altimeter data
IPCC (2013) Figure 13.3
http://sealevel.colorado.edu/
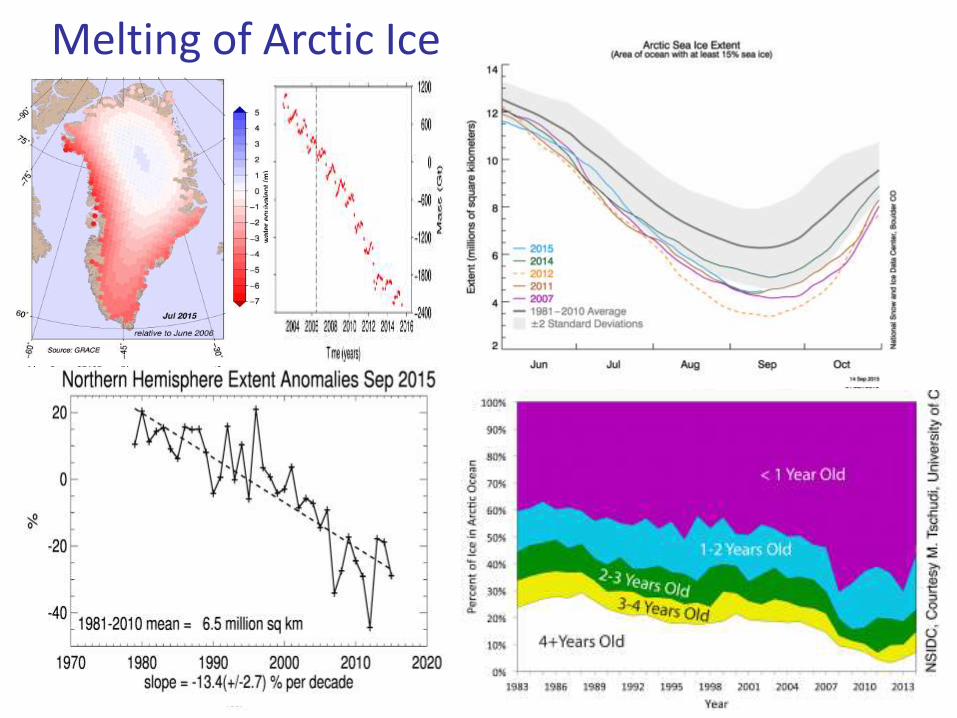
NSIDC :
Melting of Arctic Ice
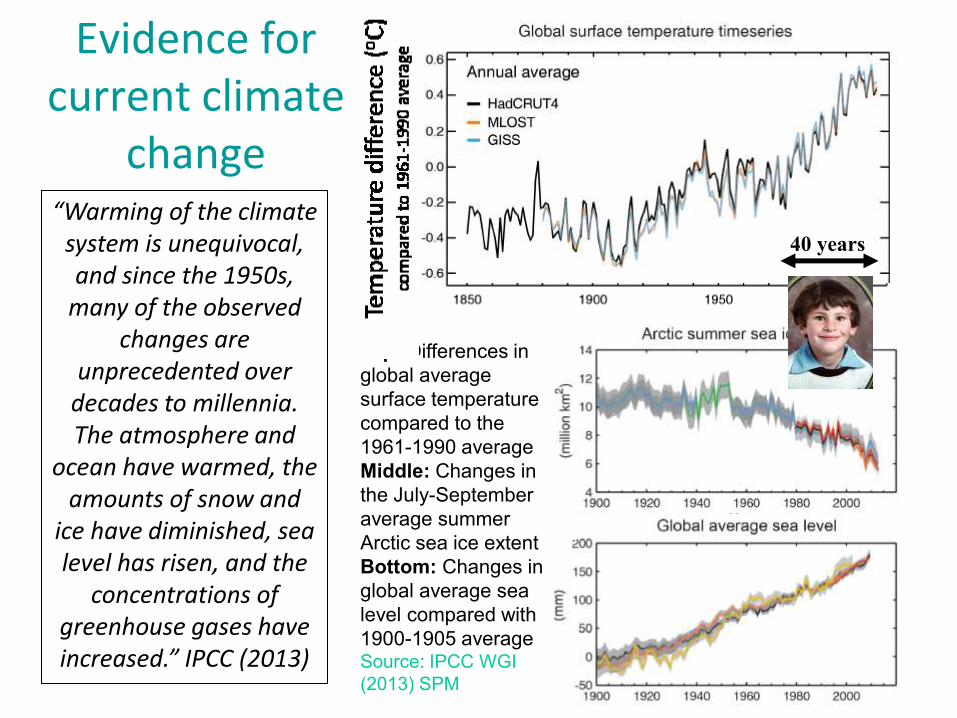
Top: Differences in
global average
surface temperature
compared to the
1961-1990 average
Middle: Changes in
the July-September
average summer
Arctic sea ice extent
Bottom: Changes in
global average sea
level compared with
1900-1905 average Source: IPCC WGI
(2013) SPM
40 years
Evidence for current climate
change “Warming of the climate
system is unequivocal, and since the 1950s,
many of the observed changes are
unprecedented over decades to millennia. The atmosphere and
ocean have warmed, the amounts of snow and
ice have diminished, sea level has risen, and the
concentrations of greenhouse gases have increased.” IPCC (2013)
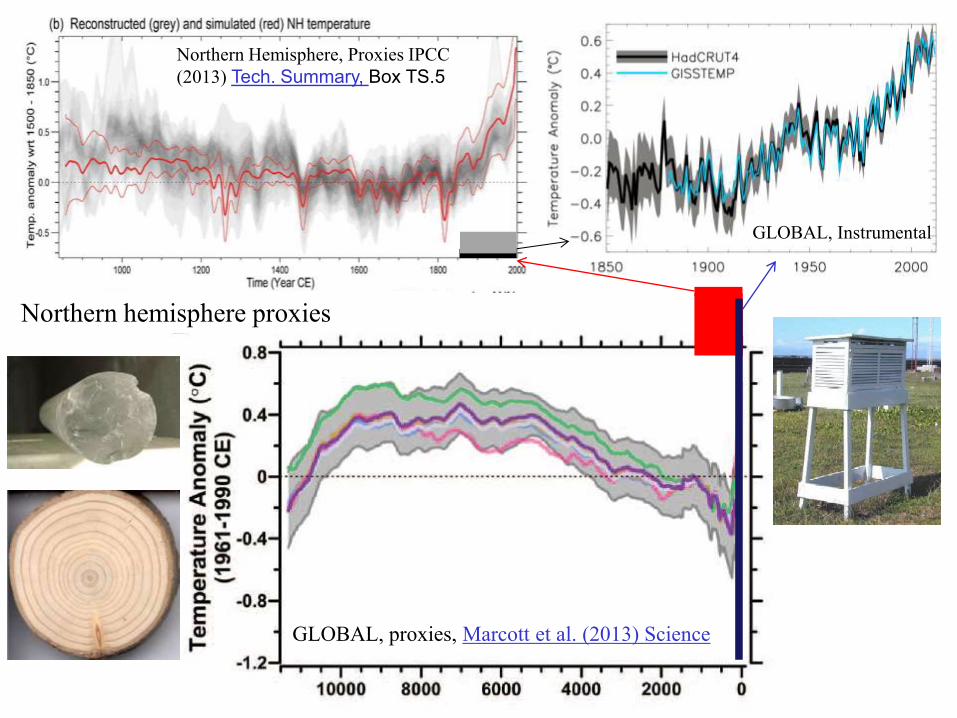
Indirect (or “proxy”) observations
must be used to piece together past
climate. These help us to understand
how climate has changed in the past
and put current direct observations
(top right) in context
GLOBAL, proxies, Marcott et al. (2013) Science
Northern hemisphere proxies
GLOBAL, Instrumental
Northern Hemisphere, Proxies IPCC
(2013) Tech. Summary, Box TS.5
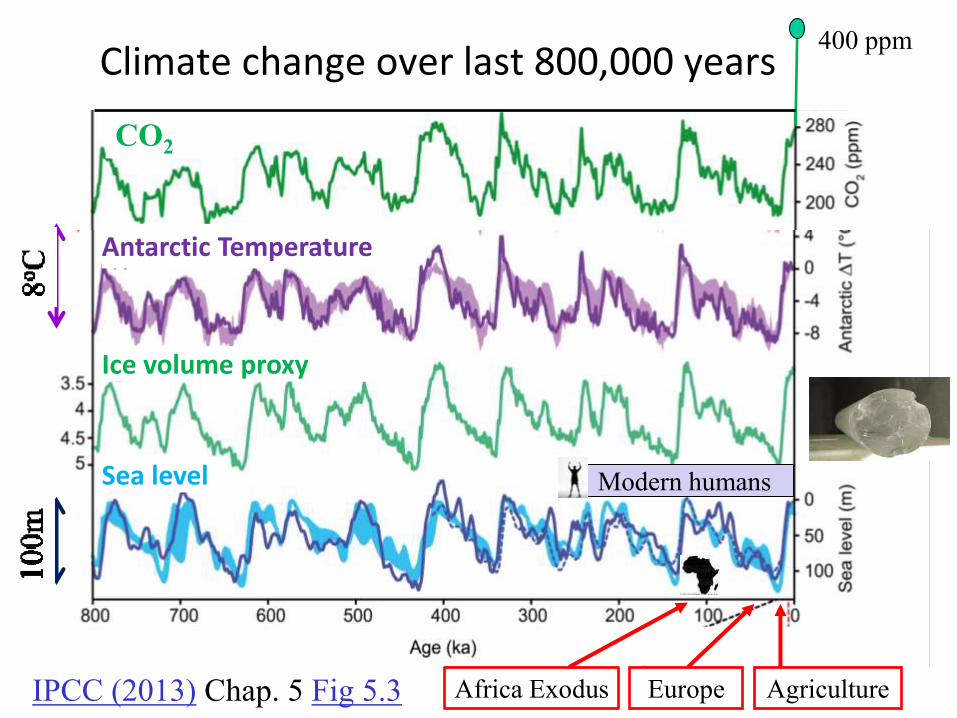
Climate change over last 800,000 years
CO2
Antarctic Temperature
Ice volume proxy
Sea level
Europe
Modern humans
Africa Exodus Agriculture IPCC (2013) Chap. 5 Fig 5.3
400 ppm
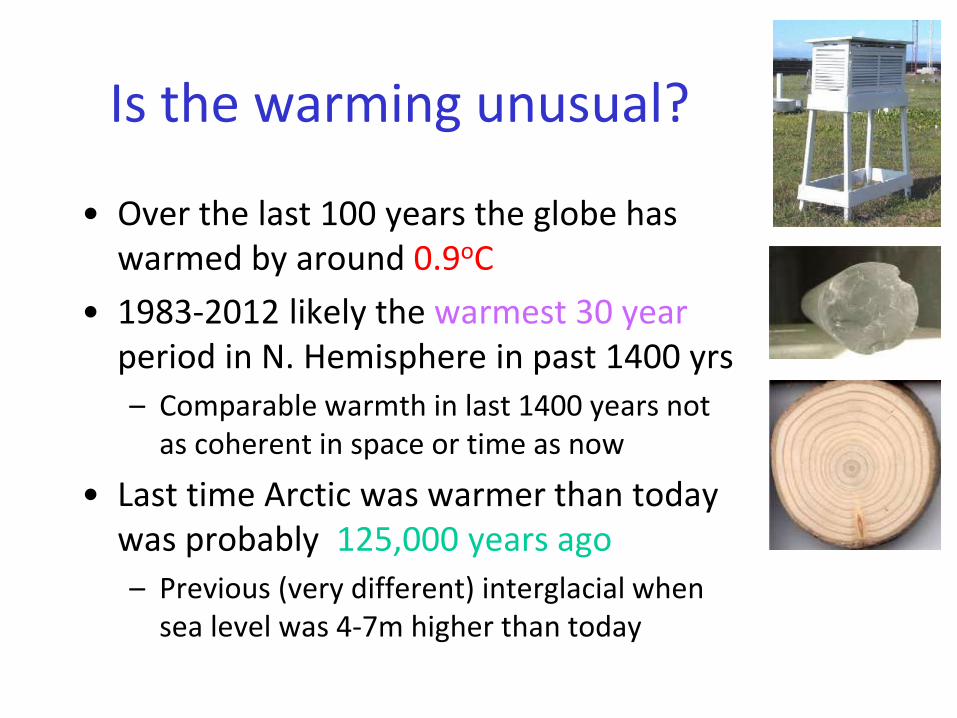
Is the warming unusual?
• Over the last 100 years the globe has warmed by around 0.9oC
• 1983-2012 likely the warmest 30 year period in N. Hemisphere in past 1400 yrs
– Comparable warmth in last 1400 years not as coherent in space or time as now
• Last time Arctic was warmer than today was probably 125,000 years ago
– Previous (very different) interglacial when sea level was 4-7m higher than today
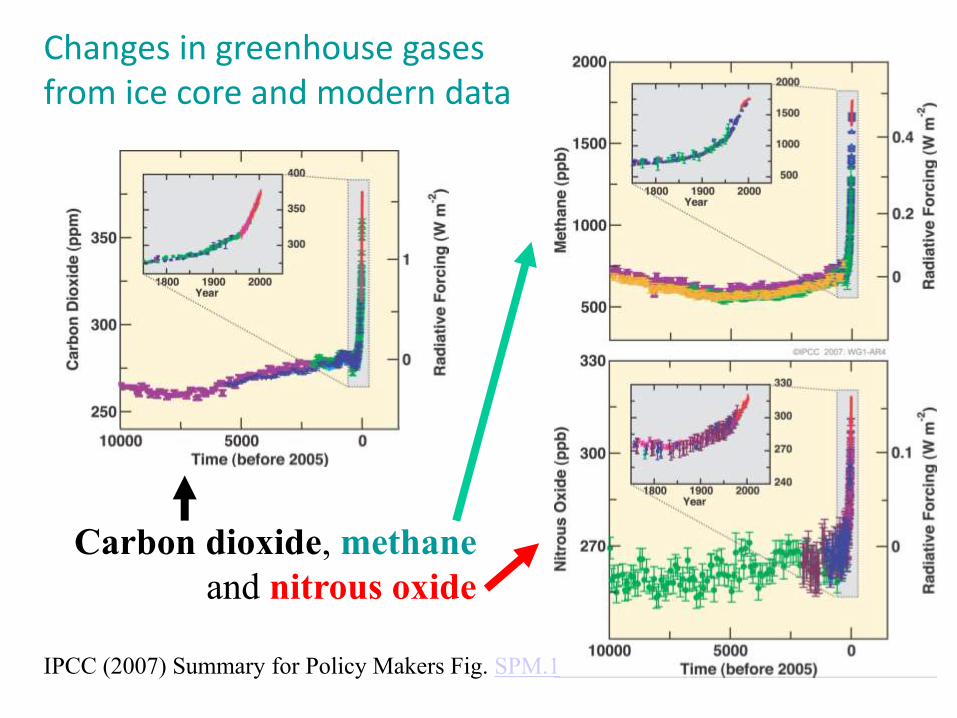
Carbon dioxide, methane
and nitrous oxide
Changes in greenhouse gases from ice core and modern data
IPCC (2007) Summary for Policy Makers Fig. SPM.1
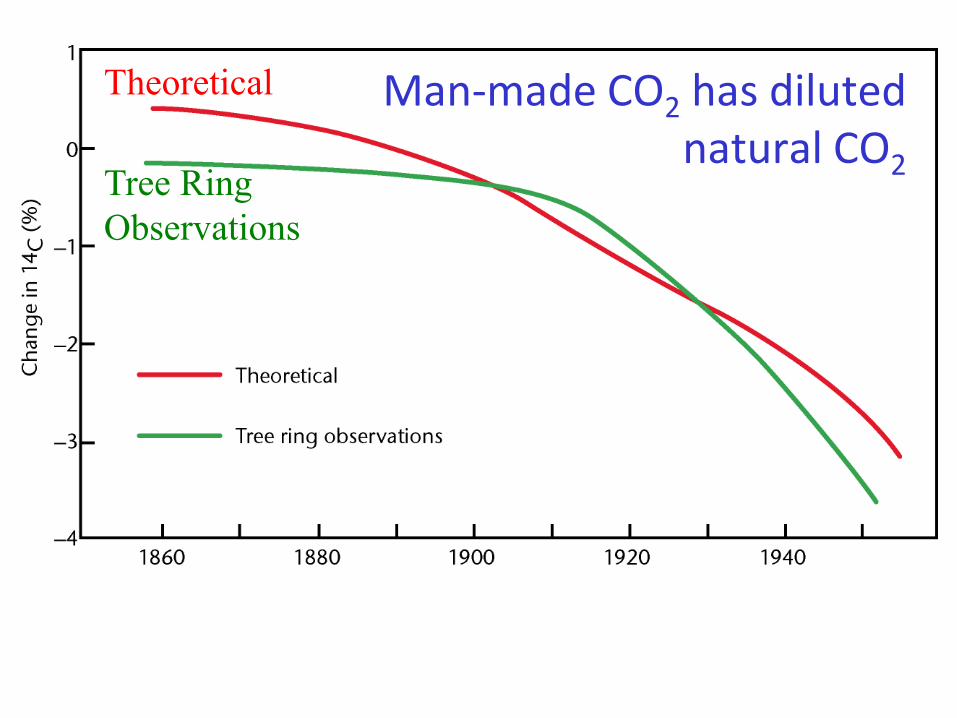
Man-made CO2 has diluted natural CO2
Theoretical
Tree Ring
Observations
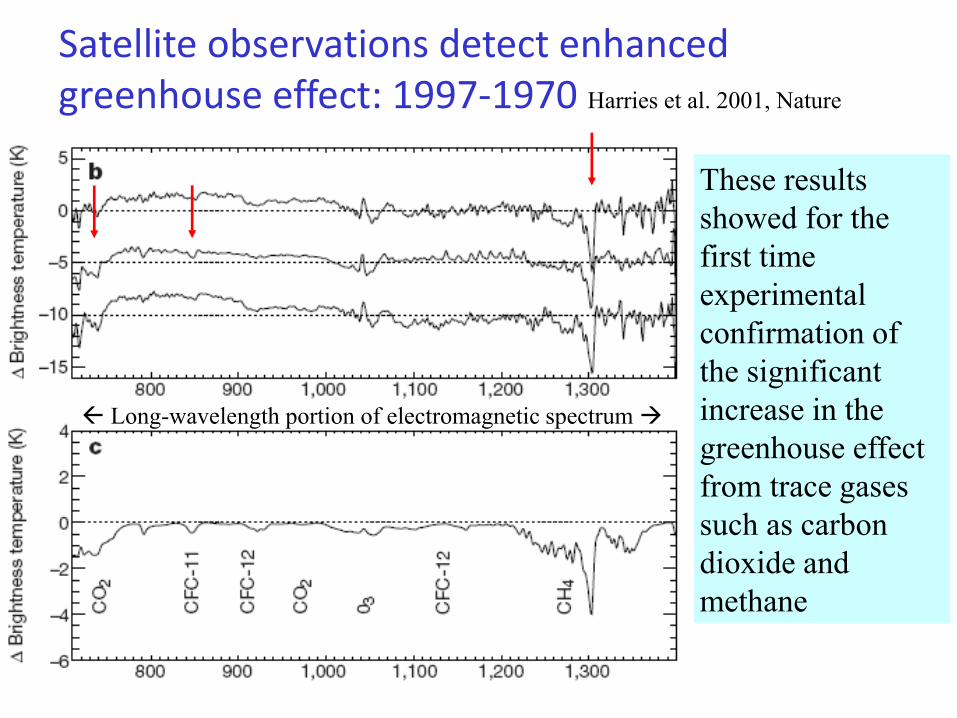
Satellite observations detect enhanced greenhouse effect: 1997-1970 Harries et al. 2001, Nature
These results
showed for the
first time
experimental
confirmation of
the significant
increase in the
greenhouse effect
from trace gases
such as carbon
dioxide and
methane
Long-wavelength portion of electromagnetic spectrum
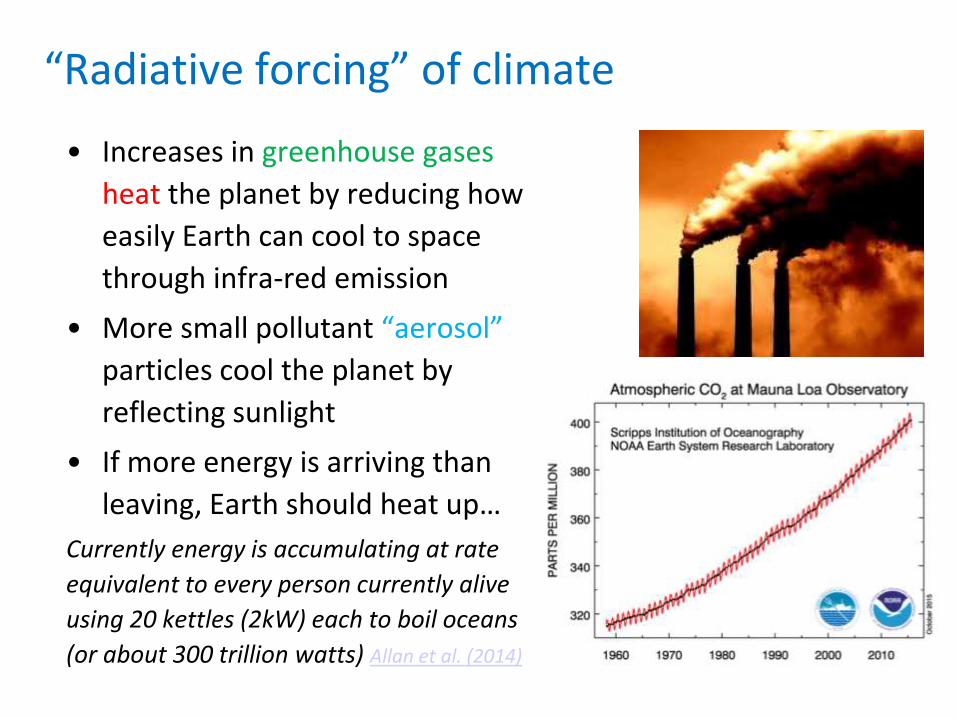
“Radiative forcing” of climate
• Increases in greenhouse gases
heat the planet by reducing how
easily Earth can cool to space
through infra-red emission
• More small pollutant “aerosol”
particles cool the planet by
reflecting sunlight
• If more energy is arriving than
leaving, Earth should heat up…
Currently energy is accumulating at rate
equivalent to every person currently alive
using 20 kettles (2kW) each to boil oceans
(or about 300 trillion watts) Allan et al. (2014)
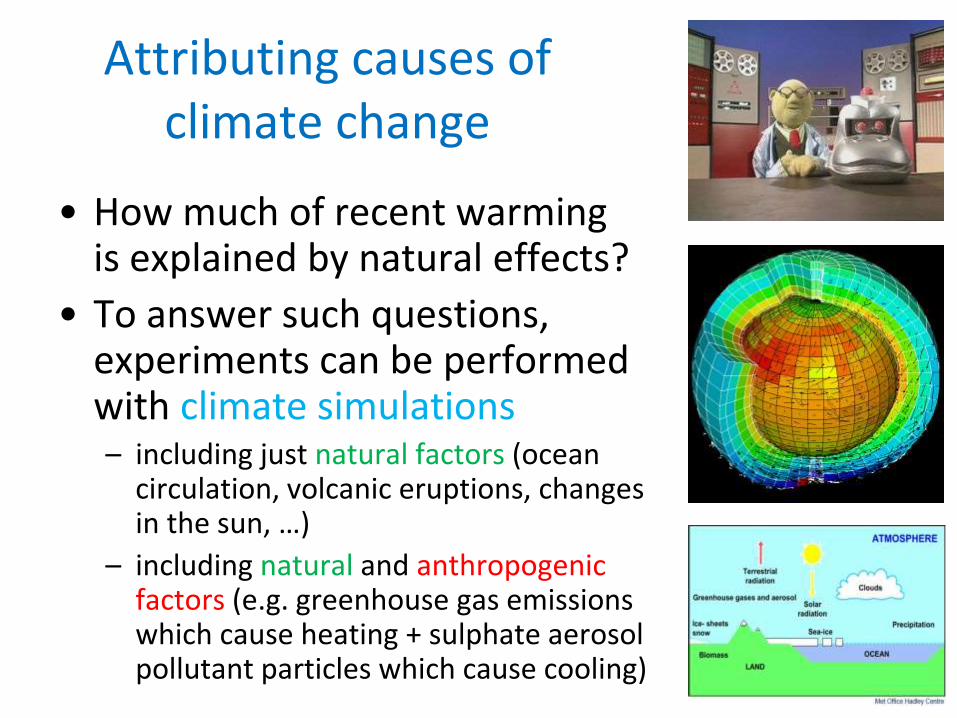
Attributing causes of climate change
• How much of recent warming is explained by natural effects?
• To answer such questions, experiments can be performed with climate simulations – including just natural factors (ocean
circulation, volcanic eruptions, changes in the sun, …)
– including natural and anthropogenic factors (e.g. greenhouse gas emissions which cause heating + sulphate aerosol pollutant particles which cause cooling)
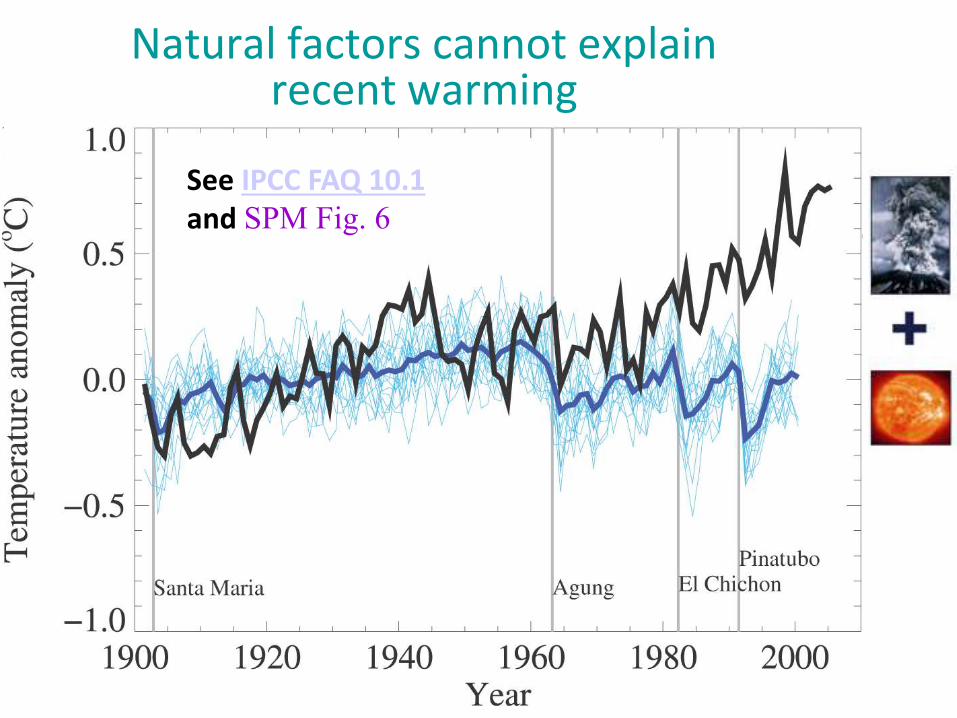
Natural factors cannot explain recent warming
See IPCC FAQ 10.1 and SPM Fig. 6
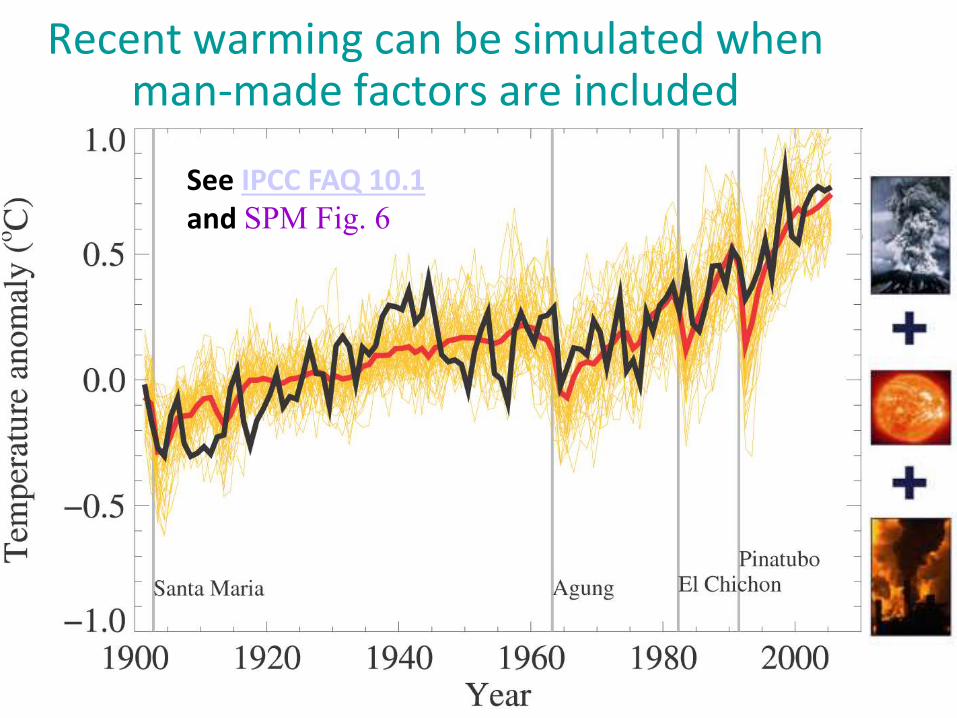
Recent warming can be simulated when man-made factors are included
See IPCC FAQ 10.1 and SPM Fig. 6
1.0
0.8
0.6
0.4
0.2
0.0
(m)
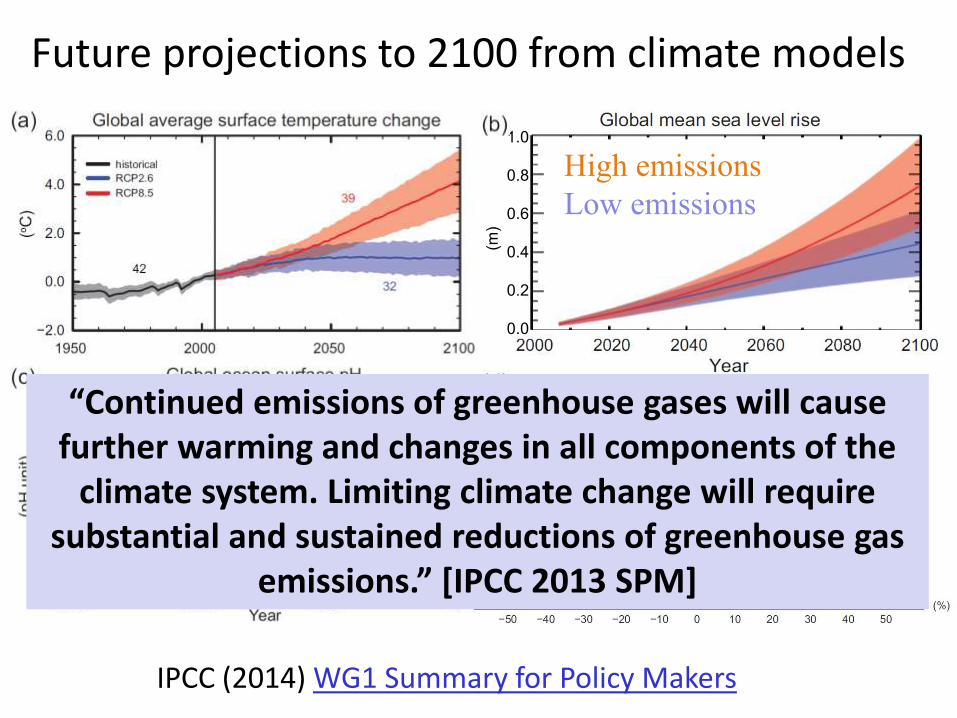
Future projections to 2100 from climate models
IPCC (2014) WG1 Summary for Policy Makers
High emissions
Low emissions
“Continued emissions of greenhouse gases will cause further warming and changes in all components of the
climate system. Limiting climate change will require substantial and sustained reductions of greenhouse gas
emissions.” [IPCC 2013 SPM]
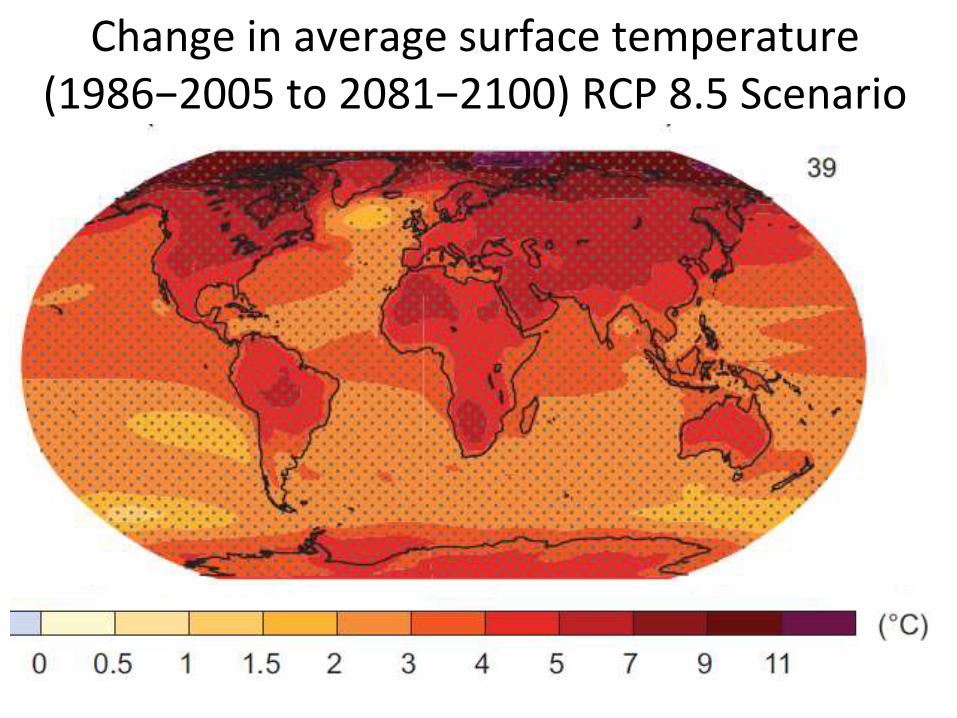
Change in average surface temperature (1986−2005 to 2081−2100) RCP 8.5 Scenario
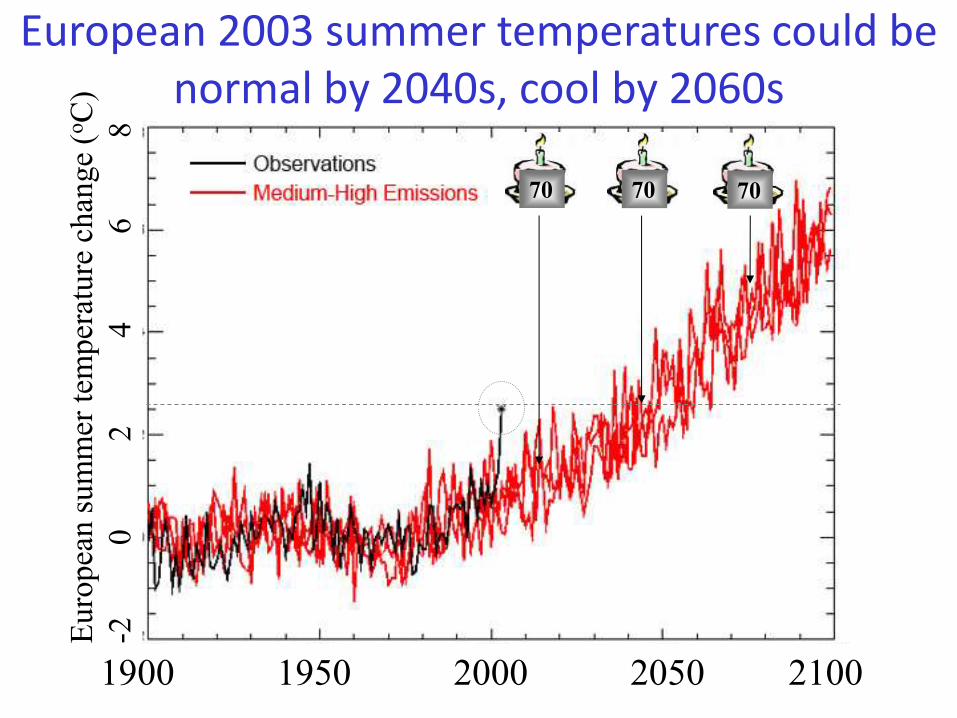
European 2003 summer temperatures could be normal by 2040s, cool by 2060s
1900 1950 2000 2050 2100
Euro
pea
n s
um
mer
tem
per
ature
chan
ge
(oC
)
-2 0
2
4
6
8
70 70 70
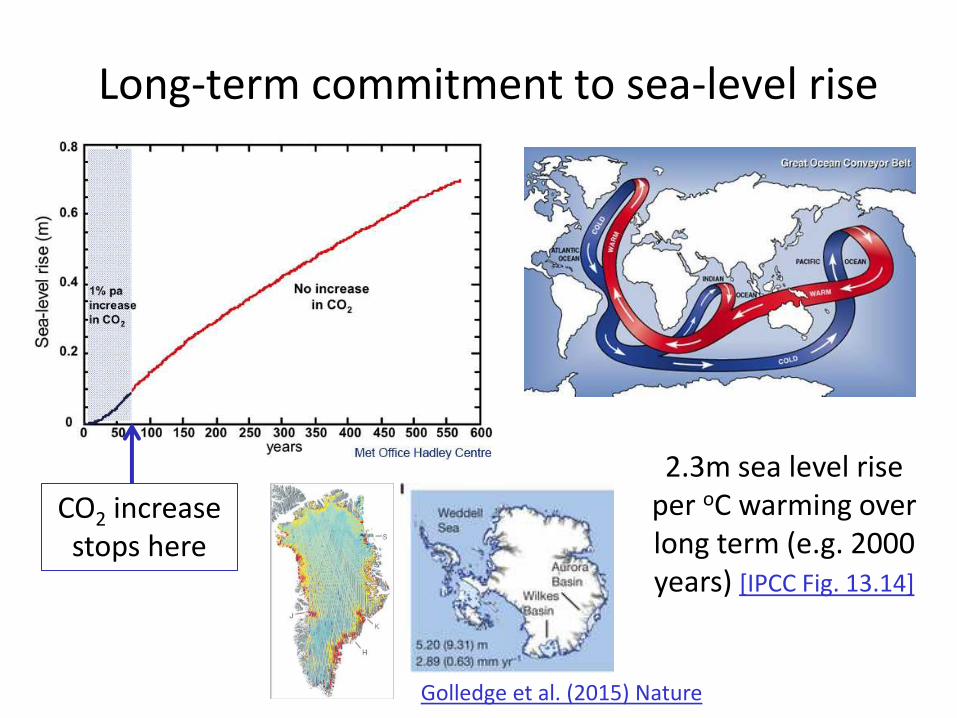
Long-term commitment to sea-level rise
CO2 increase stops here
Golledge et al. (2015) Nature
2.3m sea level rise per oC warming over long term (e.g. 2000 years) [IPCC Fig. 13.14]
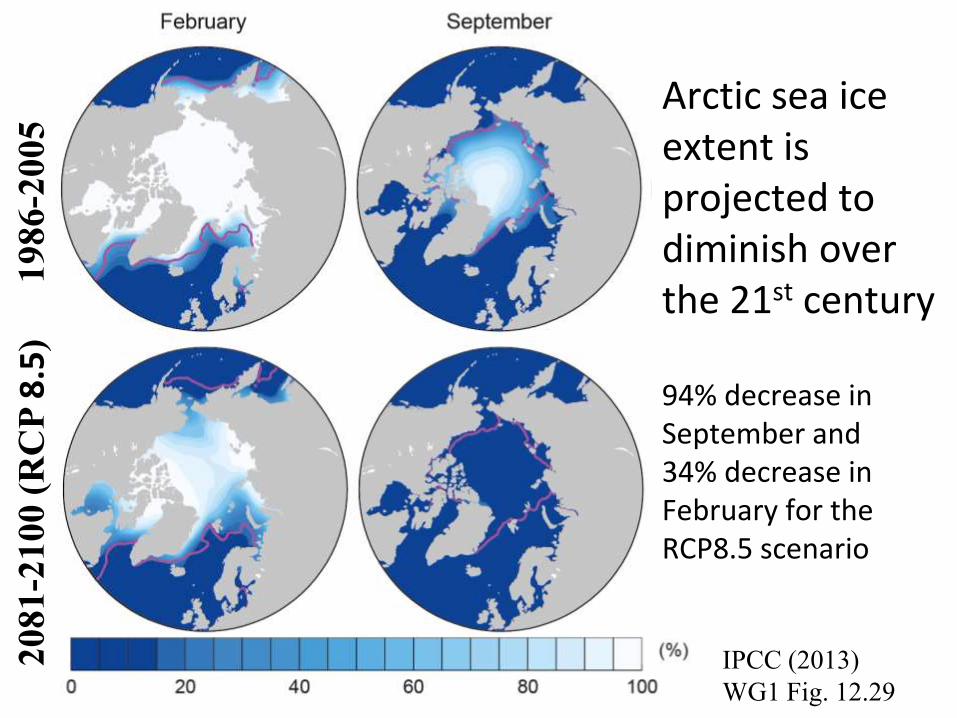
Arctic sea ice extent is projected to diminish over the 21st century 94% decrease in September and 34% decrease in February for the RCP8.5 scenario
20
81
-21
00
(R
CP
8.5
) 1
98
6-2
00
5
IPCC (2013)
WG1 Fig. 12.29
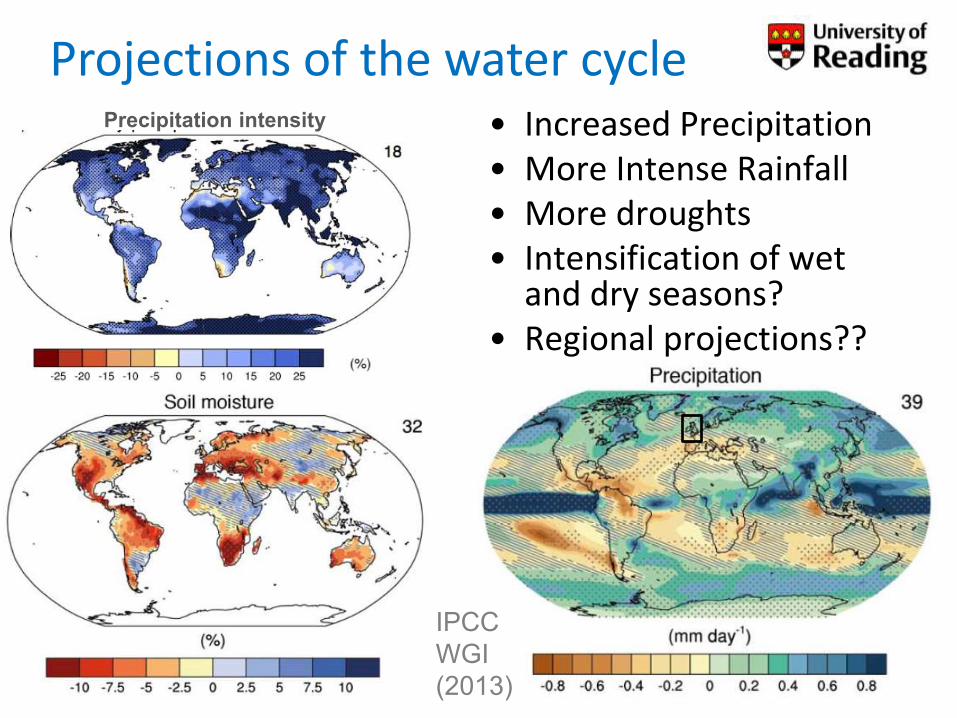
• Increased Precipitation • More Intense Rainfall • More droughts • Intensification of wet
and dry seasons? • Regional projections??
Projections of the water cycle
IPCC
WGI
(2013)
Precipitation intensity
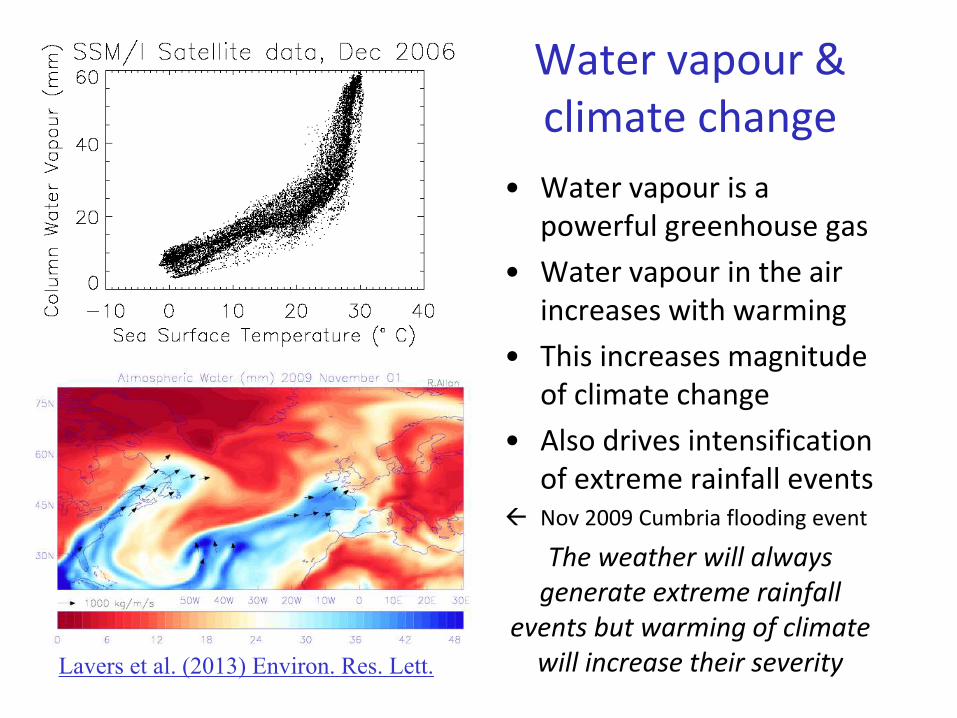
Water vapour & climate change
• Water vapour is a powerful greenhouse gas
• Water vapour in the air increases with warming
• This increases magnitude of climate change
• Also drives intensification of extreme rainfall events
Nov 2009 Cumbria flooding event
The weather will always generate extreme rainfall
events but warming of climate will increase their severity Lavers et al. (2013) Environ. Res. Lett.
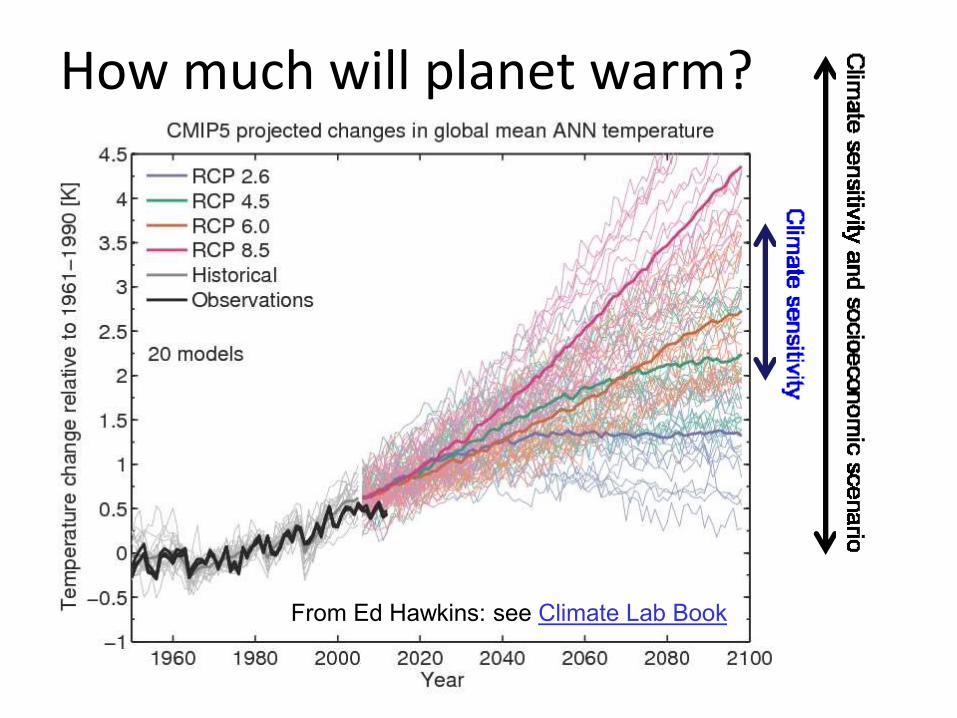
From Ed Hawkins: see Climate Lab Book
How much will planet warm?
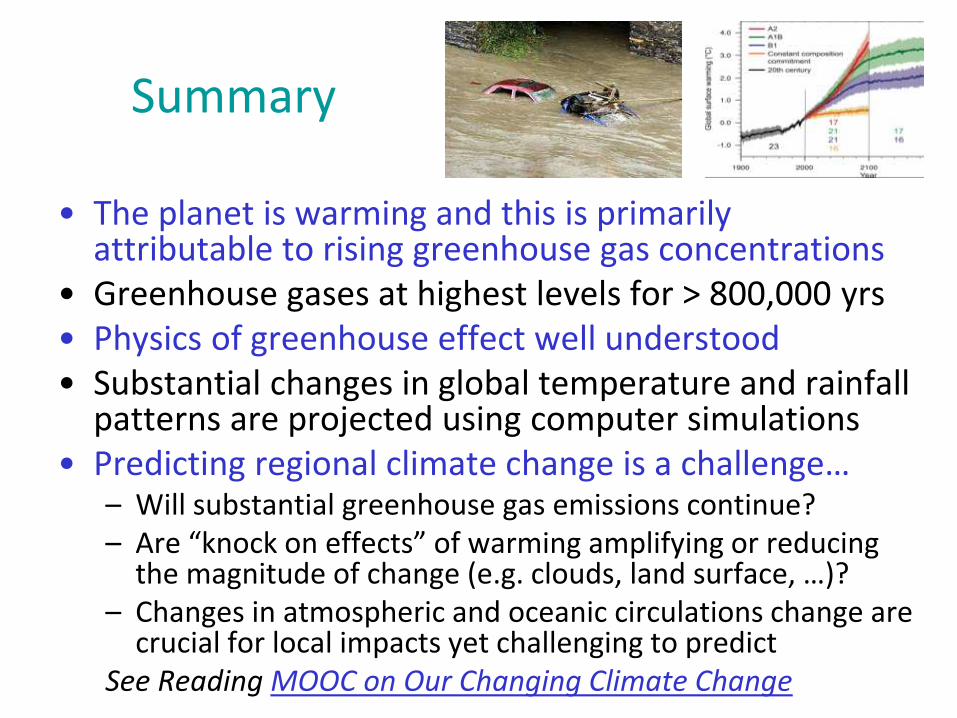
Summary
• The planet is warming and this is primarily attributable to rising greenhouse gas concentrations
• Greenhouse gases at highest levels for > 800,000 yrs • Physics of greenhouse effect well understood • Substantial changes in global temperature and rainfall
patterns are projected using computer simulations • Predicting regional climate change is a challenge…
– Will substantial greenhouse gas emissions continue? – Are “knock on effects” of warming amplifying or reducing
the magnitude of change (e.g. clouds, land surface, …)? – Changes in atmospheric and oceanic circulations change are
crucial for local impacts yet challenging to predict See Reading MOOC on Our Changing Climate Change
COP21 Paris Climate Deal source: http://www.carbonbrief.org/analysis-the-final-paris-climate-deal
• Target: global temperature well below 2oC; efforts to limit to 1.5oC
• Mitigation: pursue policies aiming to achieve INDC climate pledges;
subsequent pledges progressively more ambitious; global stocktake
2018 & then every 5 years; peak global greenhouse gas emissions “as
soon as possible”; “balance” between emissions & sinks 2050-2100
• Adaptation: $100bn/yr fund for developing countries: new collective
quantified goal by 2025; periodic review of adaptive planning of Loss
& damage has its own Article in the agreement — now on par with
mitigation & adaptation; liability/compensation excluded.
• Transparency: "facilitative, non-intrusive, non-punitive” system of
review will track countries’ progress; emissions trading allowed;
aviation/shipping not included
• Treaty: deal enters force once 55+ parties, covering at least 55% of
global emissions have signed up


