Climate change trade and competitiveness ndash A European
perspectiveGeneva Annual China Dialogue
November 27-28 2008Fredrik Erixon
European Centre for Intrsquol Political Economy (ECIPE)
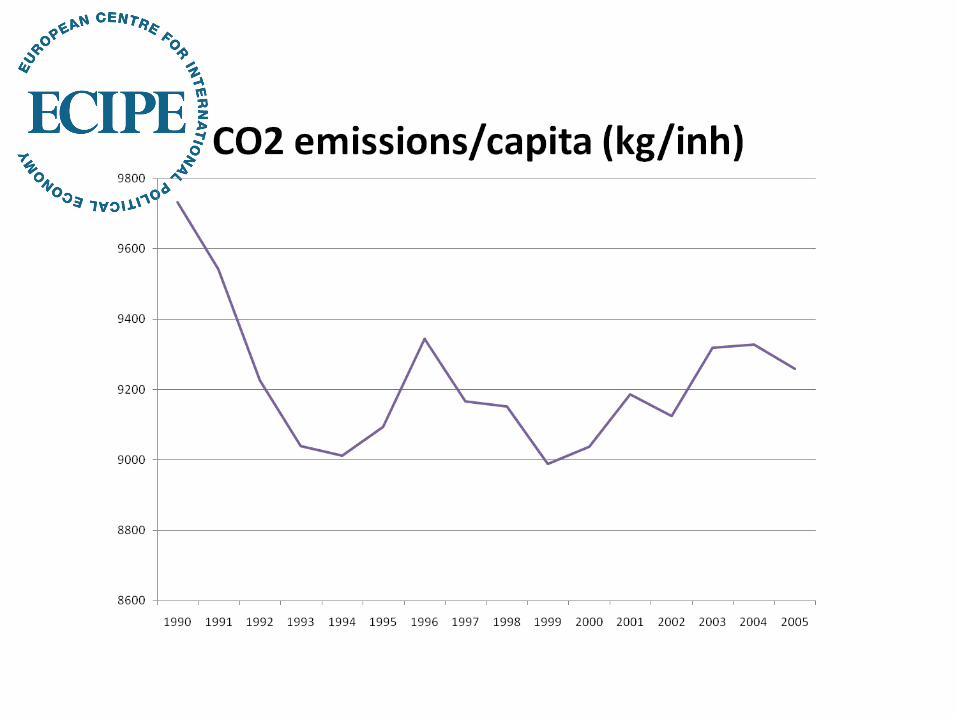
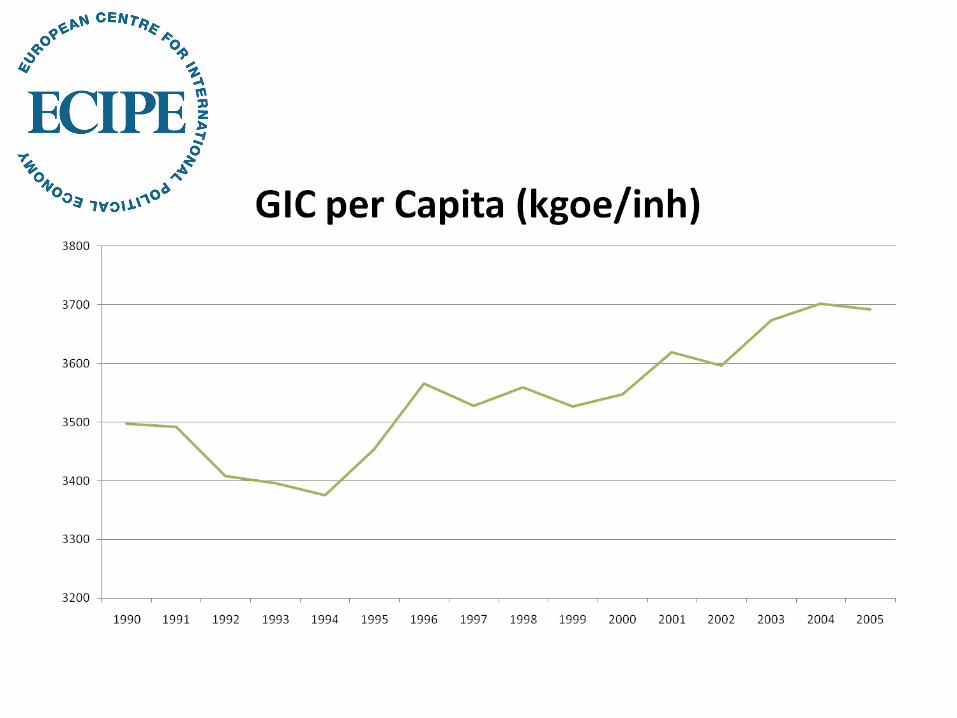
Proposition 1
Europe wants to lead on carbon-emission reduction but is making slow progress at home
Import intensity and energy intensity (2006)
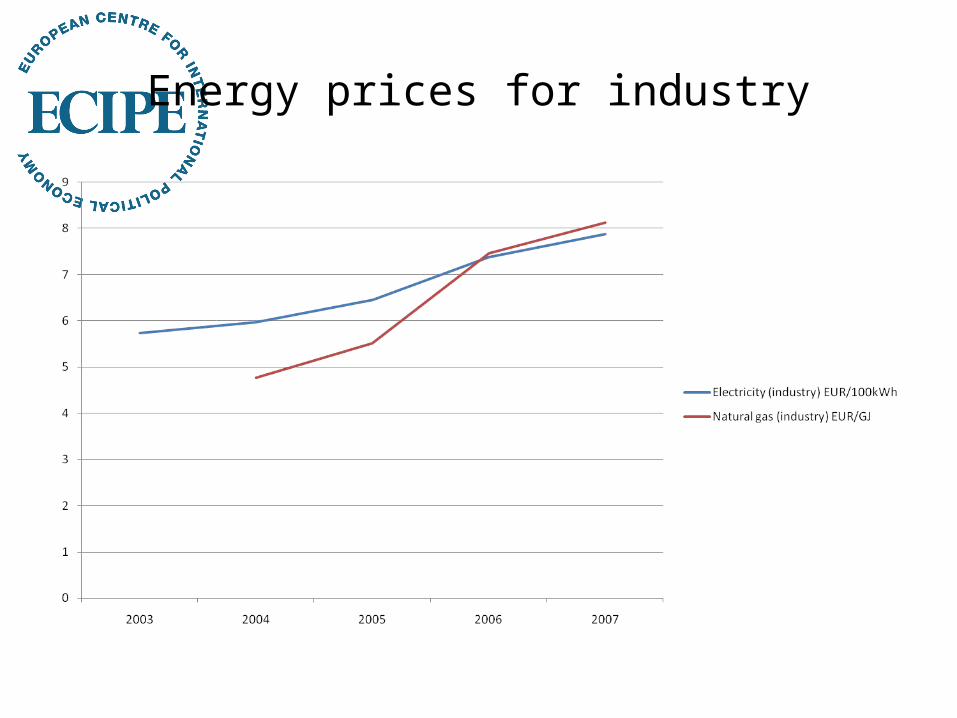
Energy prices for industry
Proposition 2
Falling prices for raw materials helps ambitions to lower carbon emissions as sectors buying emission allowances are raw-matieral intensive But the effect is temporary
Aluminium price 15-months buyer London Metal Exchange
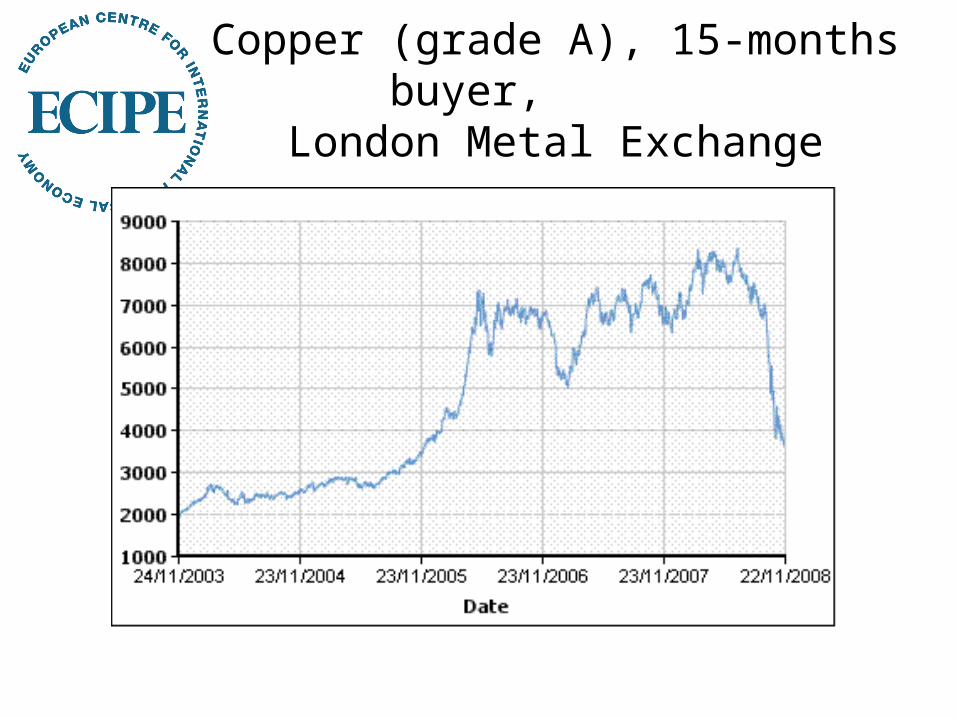
Copper (grade A) 15-months buyer London Metal Exchange
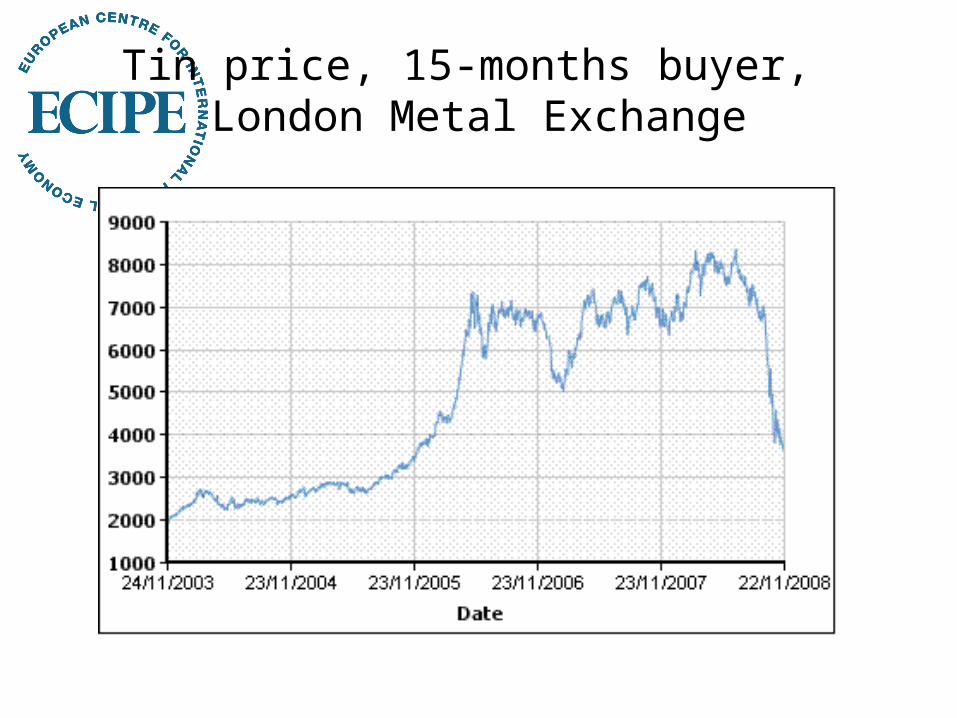
Tin price 15-months buyer London Metal Exchange
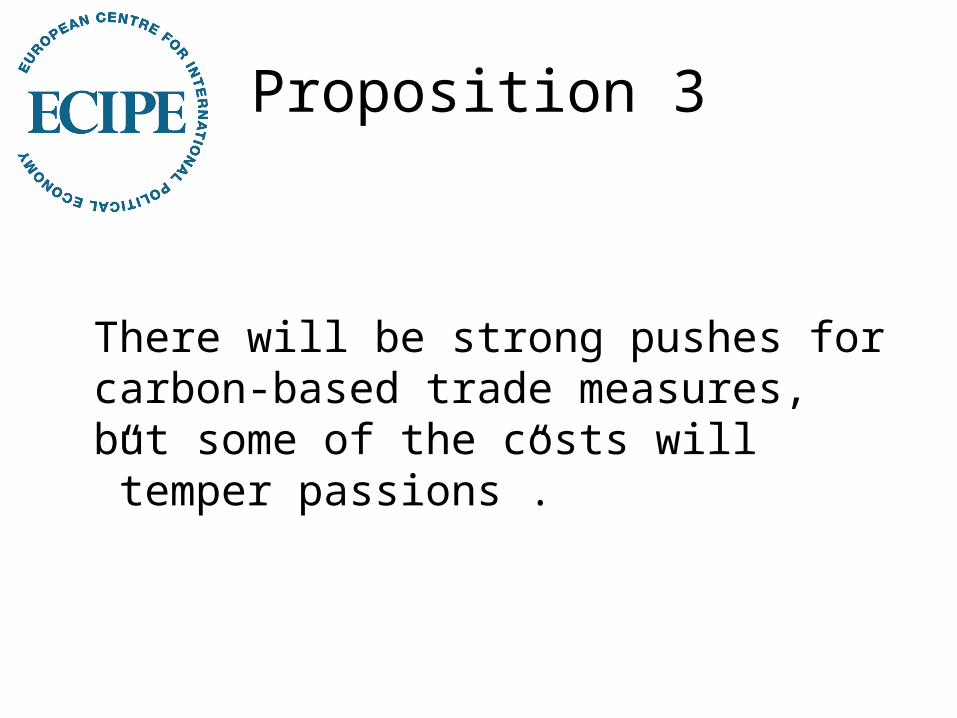
Proposition 3
There will be strong pushes for carbon-based trade measures but some of the costs will rdquotemper passionsrdquo
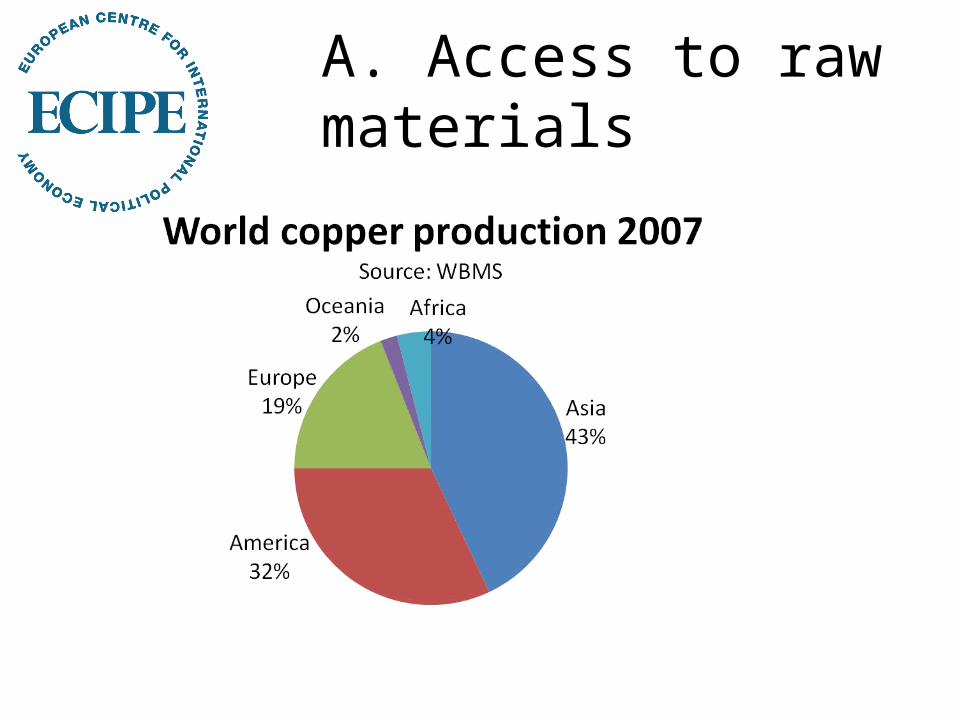
A Access to raw materials
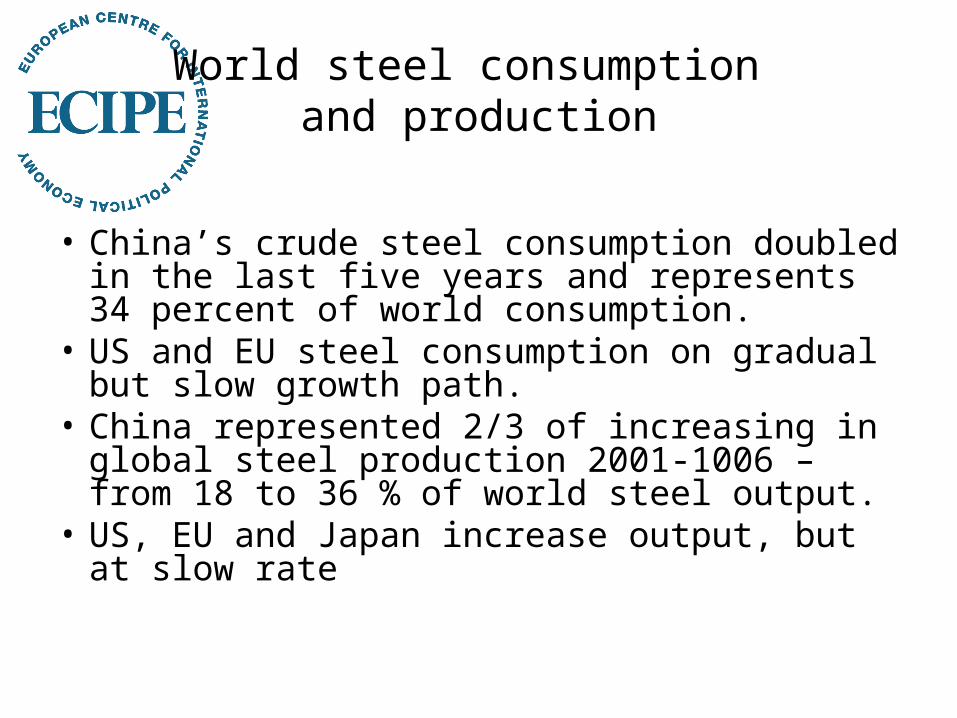
World steel consumption and production
bull Chinarsquos crude steel consumption doubled in the last five years and represents 34 percent of world consumption
bull US and EU steel consumption on gradual but slow growth path
bull China represented 23 of increasing in global steel production 2001-1006 ndash from 18 to 36 of world steel output
bull US EU and Japan increase output but at slow rate
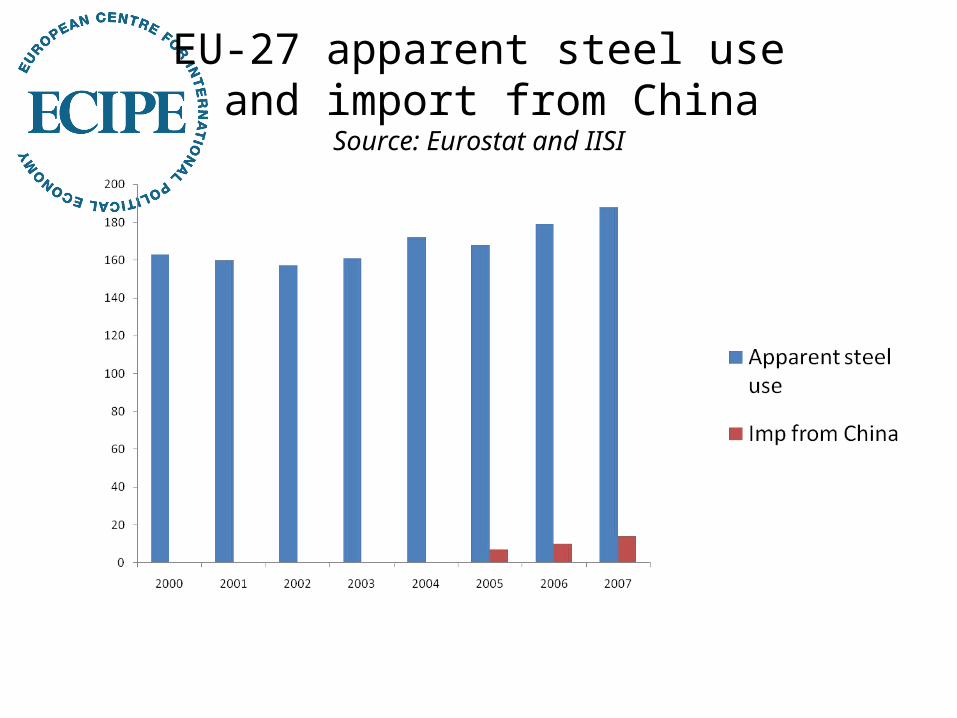
EU-27 apparent steel use and import from China
Source Eurostat and IISI
EU policy on raw materials
bull Zero tariffs on raw materialsbull Increase in production and consumption in Asia ndash
esp China and Indiabull EU wants better market access to raw materials
from Asia and emerging marketsbull Complains about export taxes on raw materials
eg in Chinabull Raw material vs manufacture of input goods
made of raw material
B Unlikely to affect others choices
bull Tariffs have the potential to affect the outputin the rest of the world only in a market for a good in which the imports of a country are a substantial fraction of outout in the rest of the world
bull WTO legality rdquolike productsrdquo if adjusted to firm-level behaviour
Share of EU-15 in sectoral exports
Korea Turkey United States
China
Pulp and paper 214 1671 1697 414
Lime and cement 031 2837 396 1500
Iron and steel 340 3109 770 999
Manufactures of metal 942 3698 1450 2206
Chemicals 415 2947 3025 1691
Glass 337 4549 1720 954
Aluminum 028 5196 740 202
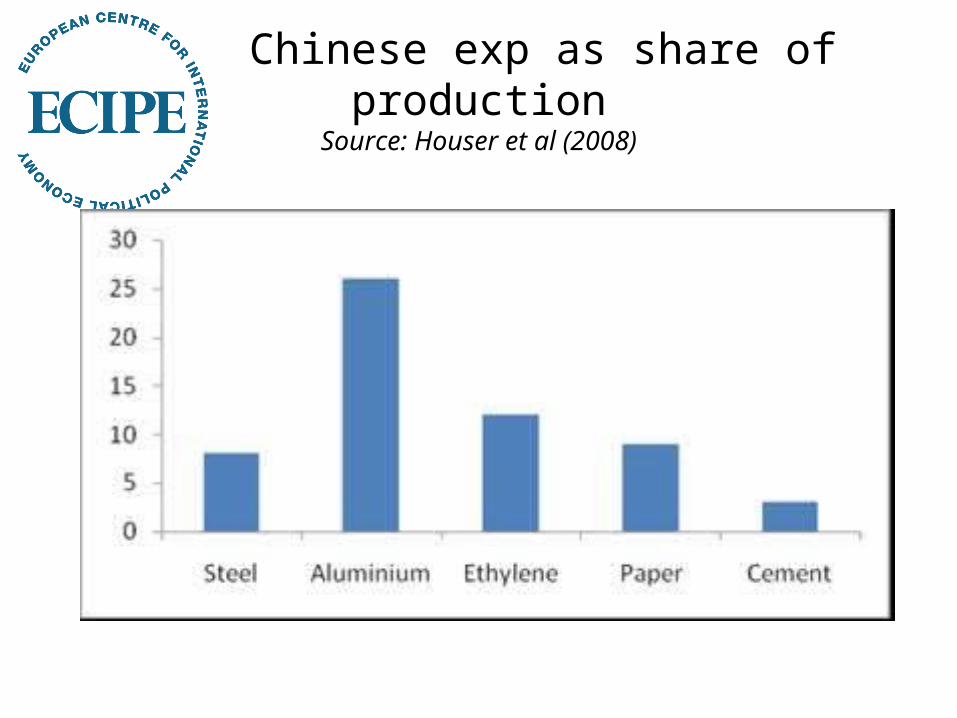
Chinese exp as share of productionSource Houser et al (2008)
Demand growth by country grouping 1991-2005 ()
Source House et al (2008)
C Costly (aluminium)
Costs and benefits
bull Production methodologypowerndash Raw material a targted sector but EU wants to have
better and cheaper access to raw materialsndash Demands from uncompetitive sectors ndash finished
goods
bull Transportndash Input import industryfragmented supply chains
bull Who would benefit
- Slide 1
- Slide 2
- Slide 3
- Slide 4
- Slide 5
- Slide 6
- Slide 7
- Slide 8
- Slide 9
- Slide 10
- Slide 11
- Slide 12
- Slide 13
- Slide 14
- Slide 15
- Slide 16
- Slide 17
- Slide 18
- Slide 19
- Slide 20
- Slide 21
- Slide 22
-
Proposition 1
Europe wants to lead on carbon-emission reduction but is making slow progress at home
Import intensity and energy intensity (2006)
Energy prices for industry
Proposition 2
Falling prices for raw materials helps ambitions to lower carbon emissions as sectors buying emission allowances are raw-matieral intensive But the effect is temporary
Aluminium price 15-months buyer London Metal Exchange
Copper (grade A) 15-months buyer London Metal Exchange
Tin price 15-months buyer London Metal Exchange
Proposition 3
There will be strong pushes for carbon-based trade measures but some of the costs will rdquotemper passionsrdquo
A Access to raw materials
World steel consumption and production
bull Chinarsquos crude steel consumption doubled in the last five years and represents 34 percent of world consumption
bull US and EU steel consumption on gradual but slow growth path
bull China represented 23 of increasing in global steel production 2001-1006 ndash from 18 to 36 of world steel output
bull US EU and Japan increase output but at slow rate
EU-27 apparent steel use and import from China
Source Eurostat and IISI
EU policy on raw materials
bull Zero tariffs on raw materialsbull Increase in production and consumption in Asia ndash
esp China and Indiabull EU wants better market access to raw materials
from Asia and emerging marketsbull Complains about export taxes on raw materials
eg in Chinabull Raw material vs manufacture of input goods
made of raw material
B Unlikely to affect others choices
bull Tariffs have the potential to affect the outputin the rest of the world only in a market for a good in which the imports of a country are a substantial fraction of outout in the rest of the world
bull WTO legality rdquolike productsrdquo if adjusted to firm-level behaviour
Share of EU-15 in sectoral exports
Korea Turkey United States
China
Pulp and paper 214 1671 1697 414
Lime and cement 031 2837 396 1500
Iron and steel 340 3109 770 999
Manufactures of metal 942 3698 1450 2206
Chemicals 415 2947 3025 1691
Glass 337 4549 1720 954
Aluminum 028 5196 740 202
Chinese exp as share of productionSource Houser et al (2008)
Demand growth by country grouping 1991-2005 ()
Source House et al (2008)
C Costly (aluminium)
Costs and benefits
bull Production methodologypowerndash Raw material a targted sector but EU wants to have
better and cheaper access to raw materialsndash Demands from uncompetitive sectors ndash finished
goods
bull Transportndash Input import industryfragmented supply chains
bull Who would benefit
- Slide 1
- Slide 2
- Slide 3
- Slide 4
- Slide 5
- Slide 6
- Slide 7
- Slide 8
- Slide 9
- Slide 10
- Slide 11
- Slide 12
- Slide 13
- Slide 14
- Slide 15
- Slide 16
- Slide 17
- Slide 18
- Slide 19
- Slide 20
- Slide 21
- Slide 22
-


