Climate-driven ecosystem shifts in Korean waters during the past 40 years
PICES 2011.10.17 S1
Sukgeun Jung1 and Il Su Choi
1. School of Marine Biomedical SciencesJeju National University, Korea

Objective of Study• The reported past regime shifts in the North Pacific– 1977, 1989, 1998
• How did the ecosystems of the Korean waters responded to these basin-wide regime shifts?
• Regional differences– Japan/East Sea: deep basin– Korea Strait: intermediate– Yellow Sea: shallow

Topography
Yellow Sea
Tsushima
East Sea
North
Jeju Island
Korea StraitTsushima Warm Current
KSBC

Study Area for Env, Zooplankton and Fish Latitude: 32-39oN
Longitude: 124-133oE
SJES
KS
EYS

Time-series Data
• Korea Meteorological Administration– Air surface temperature 1968-2009
• MIFAFF-NFRDI– Depth-specific T, S, DO (0~100 m) 1968-2010– Meso- and Macro-zooplankton 1965-2006– Fisheries Data 1968-2010
• Seoul National University– Volume Transport of TWC and KSBCW 1968-
2007
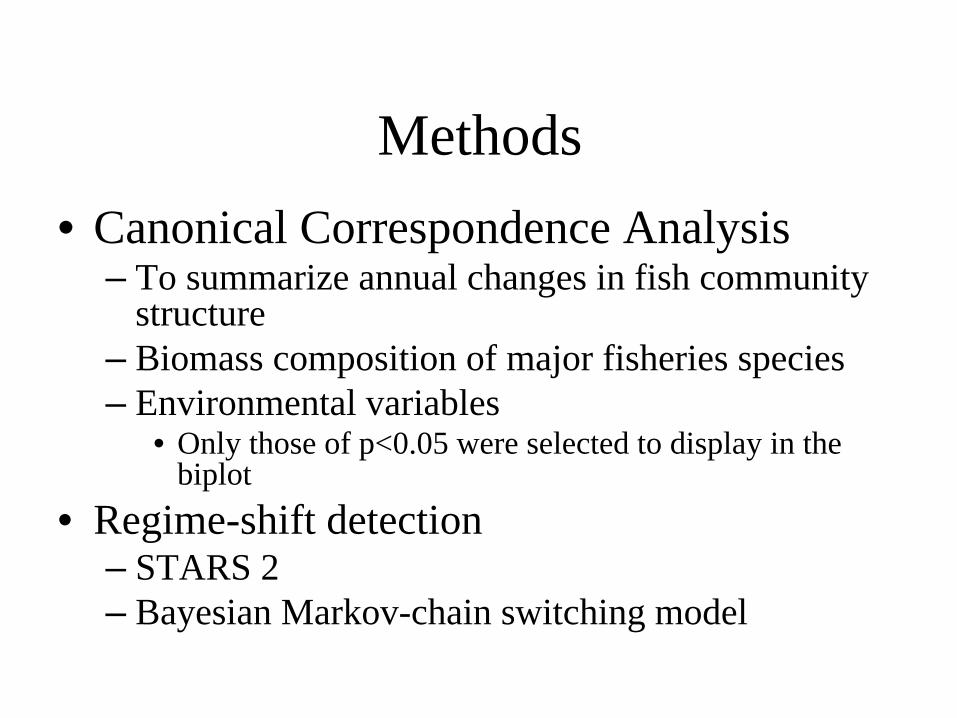
Methods• Canonical Correspondence Analysis
– To summarize annual changes in fish community structure
– Biomass composition of major fisheries species– Environmental variables
• Only those of p<0.05 were selected to display in the biplot
• Regime-shift detection– STARS 2– Bayesian Markov-chain switching model

Annual Catch from Korean Sea Waters by Species (marine capture fisheries, metric tons, 1968-2008)

Correspondence Analysis on Biomass composition of Fishes

Pollock
Sardine
Squid
Correspondence Analysis on species composition of Korean fishery catch
Reported Regime Shifts: 1976-1977, 1988-1989, 1997-1998
Saury

Canonical Correspondence Analysis 1 Environmental Variables of p<0.05
Volume Transport of KSBCW
Jan.-Dec.
Volume Transport of TW
C
Feb. and Aug.
Temperature 0-30 m
Korea Strait Salinity 0-30 mKorea Strait
Temperature and salinity in the mixed layer were correlated significantly.

Canonical Correspondence Analysis 2 Means for the entire Korean water
Monthly ENSO index
VariableCorr. With
Dim1 p-valueAir Temp -0.53 0.000289Salin 0 m 0.52 0.000356
Wtemp 10 m -0.51 0.00055SST -0.47 0.001331Salin 10 m 0.47 0.001658Salin 20 m 0.43 0.003756Salin 30 m 0.39 0.010301Salin 50 m 0.32 0.034465Disoxy 75 m 0.34 0.036871Wtemp 20 m -0.31 0.045795
Variable Corr with
Dim2 p-valuedisoxy 100 m 0.54 0.000413dosat 100 m 0.51 0.001066ENSO May -0.44 0.003485Air Temp. -0.43 0.004796ENSO Apr -0.38 0.011862SST -0.38 0.011947ENSO Jun -0.36 0.016729disoxy 75 m 0.38 0.021614ENSO Mar -0.32 0.036395wtemp 10 m -0.31 0.043796dosat 30 m 0.32 0.047241

Dim 1 Stars2
1976 1988 1995

Dim 2 Stars2
1977 1983 1991

Dim 1 Bayesian Markov switching models
1976 1991

Dim 2Dim 2Bayesian Markov switching models
1976 19831991

Detected Shifts
STARS 2 Bayesian Markov 1976-19771983198819911995
197619831991
• The 1983 shift seems to be related with the strong 1983 ENSO.• The 1991 shift seems to be related with the 1989 shift,
considering a time lag of 2 yr for recruitment and fishermen’s preparation for catching new target species.

A shift in the time-series of air surface temperature in the Korean peninsula
1989

No detectable shift in depth-specific water temperatures in the JES
0 m
100 m
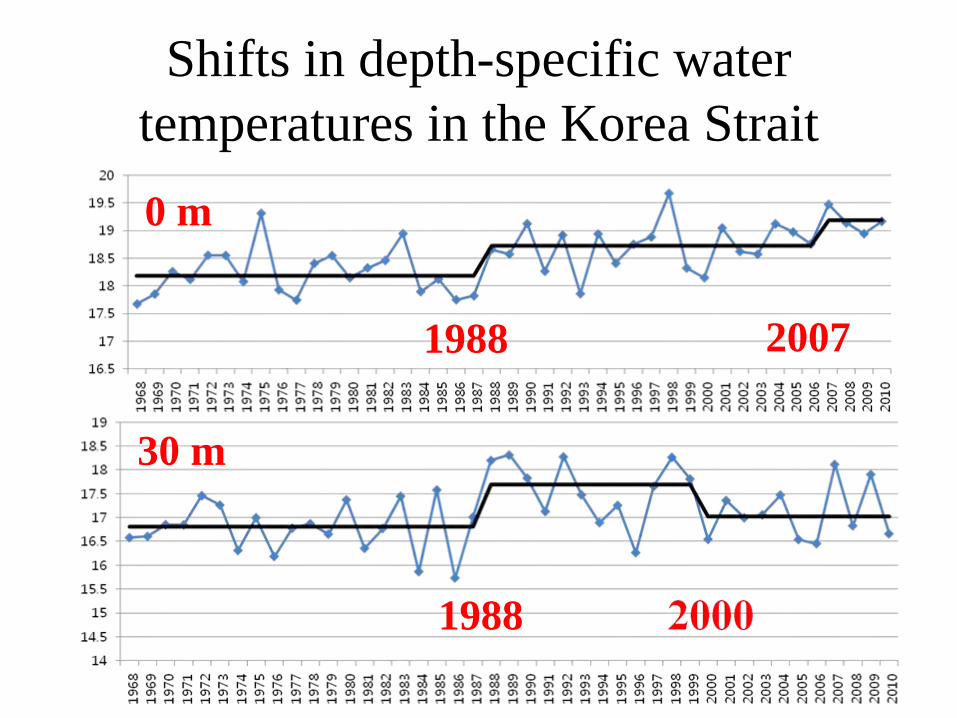
Shifts in depth-specific water temperatures in the Korea Strait0 m
30 m
1988
1988 2007

Shifts in depth-specific salinity in the Korea Strait
0 m
30 m 2002
1998

Shifts in Dissolved Oxygen in the Korea Strait
100 m
20011990

Meso- and macro-zooplankton biomass 1965-2006, from KODC

Meso-zooplankton Averaged biomass (1965-2006)
122 124 126 128 130 132 134 136 13826
28
30
32
34
36
38
40 1965-1977
00.1369306090120150180210240270300330360390420450480510540570600630660690720750780810840870900930
mg m-3
122 124 126 128 130 132 134 136 13826
28
30
32
34
36
38
40 1978-1988
122 124 126 128 130 132 134 136 13826
28
30
32
34
36
38
40 1989-1997
122 124 126 128 130 132 134 136 13826
28
30
32
34
36
38
40 1998-2000
122 124 126 128 130 132 134 136 13826
28
30
32
34
36
38
40 2001-2006
Mesh size = 330 micron

Zooplankton mean biomass in the Japan/East Sea
1992, 2001

Copepods Chaetognaths
AmphipodsEupahusiids
Mean numerical density of major zooplankton groups in the JES: 1999 shift
Region 1977regime shift
1982El Niño
1989regime shift
1998El Niño
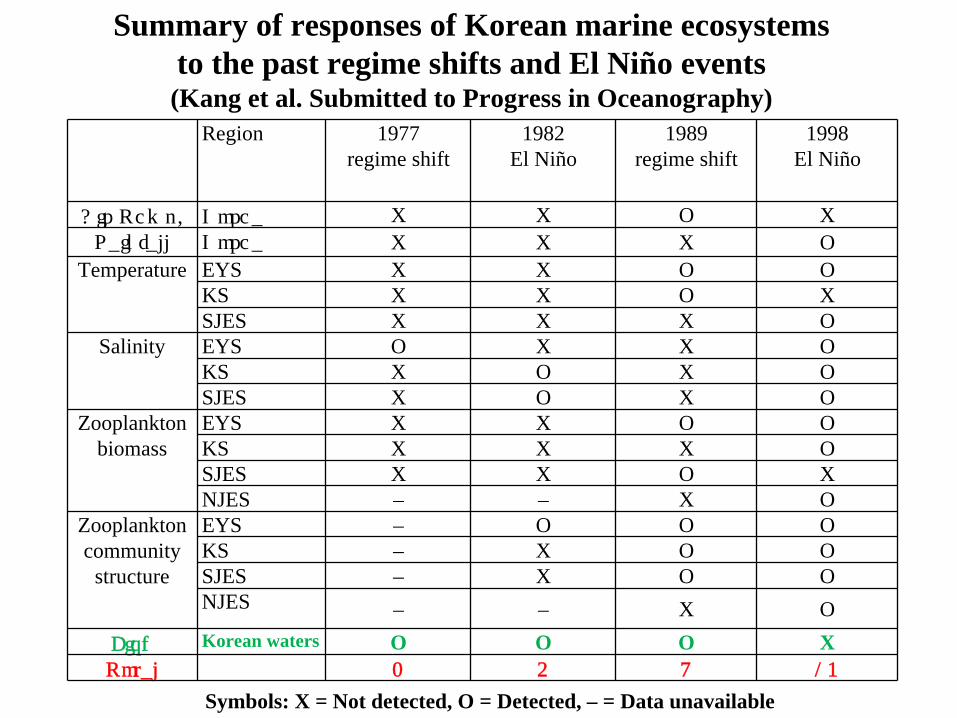
Air Temp. Korea X X O XRainfall Korea X X X O
Temperature EYS X X O OKS X X O XSJES X X X O
Salinity EYS O X X OKS X O X OSJES X O X O
Zooplanktonbiomass
EYS X X O OKS X X X OSJES X X O XNJES – – X O
Zooplanktoncommunity
structure
EYS – O O OKS – X O OSJES – X O ONJES – – X O
Fish Korean waters O O O XTotal 2 4 9 13
Symbols: X = Not detected, O = Detected, – = Data unavailable
Summary of responses of Korean marine ecosystems to the past regime shifts and El Niño events(Kang et al. Submitted to Progress in Oceanography)

Landings of Pacific cod and Herring in Korea 1971-2000
1998Cod
Herring

Cod, Mean catch level (1994-2008) based on location reports from fishing boats
122 124 126 128 130 132 134 136 13826
28
30
32
34
36
38
40
01E-0050.00010.0010.010.020.030.040.050.060.070.080.090.10.20.30.40.50.60.70.80.911.11.21.31.41.51.61.71.81.922.1
kg km-2
; Χατχη βψ γιλλνετ ισ υνδερρεπρεσεντεδ.
East Sea
Yellow Sea
Korea Strait
Main Spawning ground(Jinhae Bay)
Win
ter m
igrat
ion
Sprin
g mig
ratio
n

Southward Expansion of Pacific cod to Jeju Island
Caught on September 9, 2011Length = 32~35 cm (2 yrs old)
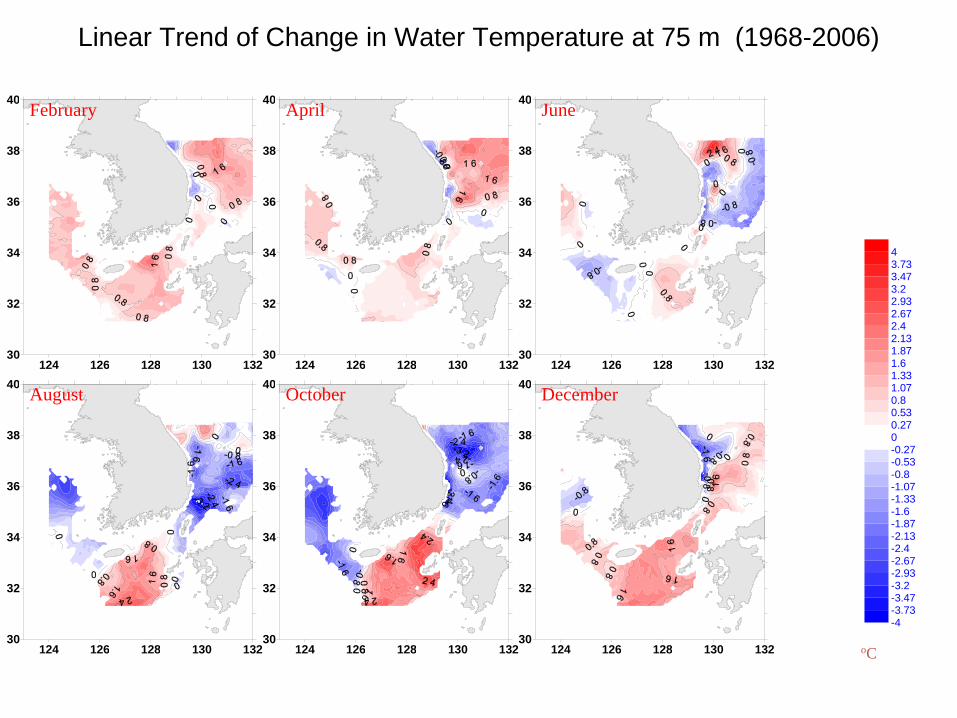
Linear Trend of Change in Water Temperature at 75 m (1968-2006)
124 126 128 130 13230
32
34
36
38
40 February
-4-3.73-3.47-3.2-2.93-2.67-2.4-2.13-1.87-1.6-1.33-1.07-0.8-0.53-0.2700.270.530.81.071.331.61.872.132.42.672.933.23.473.734
oC
124 126 128 130 13230
32
34
36
38
40 April
124 126 128 130 13230
32
34
36
38
40 June
124 126 128 130 13230
32
34
36
38
40 August
124 126 128 130 13230
32
34
36
38
40 October
124 126 128 130 13230
32
34
36
38
40 December

Water temperatures at100-m depth in the Korea Strait

Volume Transport by the Tsushima Warm Current (1962-2008)
From Lyu & Kim. 2003. Absolute transport from the sea
level difference across theKorea Strait. Geophysical
Research Letters 30(6): 18-1 - 18-4.

TWC volume transport Courtesy of Hanna Na, Seoul National University
1984, 2002

KSBC (Estimated relative volume transport of bottom cold water from the Japan/East Sea
Courtesy of Hanna Na, Seoul National University
1993

Topography
Yellow Sea
Tsushima
East Sea
North
Jeju Island
Korea StraitTsushima Warm Current
KSBC

Tsushima Warm Current (TWC) vs. Korea Strait Bottom Cold Water (KSBW)
TWC
KSBW
TWC
KSBW

Conclusions
• Responses to the reported regime shifts can vary depending on region and depth, and which variables you choose.
• In Korean waters, the shift in 1998 was the most evident, followed by 1989.
• Although the CCA did not detect the 1998 shift in fish community structure, the recent increase of cod and herring catch supports the idea of the 1998 shift, related with strengthened TWC.

Future Works
• Develop a robust shift detection method that can incorporate and reflect spatial variability in hydrographic conditions
• Improve reliability in estimation of volume transports of the TWC and KSBCW by applying general circulation models

![[2004] Ph.D Essays on Financial Contagion and Regime Shifts](https://cdn.vdocument.in/doc/165x107/577d34e81a28ab3a6b8f2472/2004-phd-essays-on-financial-contagion-and-regime-shifts.jpg)


