
1
University of Missouri System Offices
September 12, 2017
Climate Study for Learning, Living,
and Working
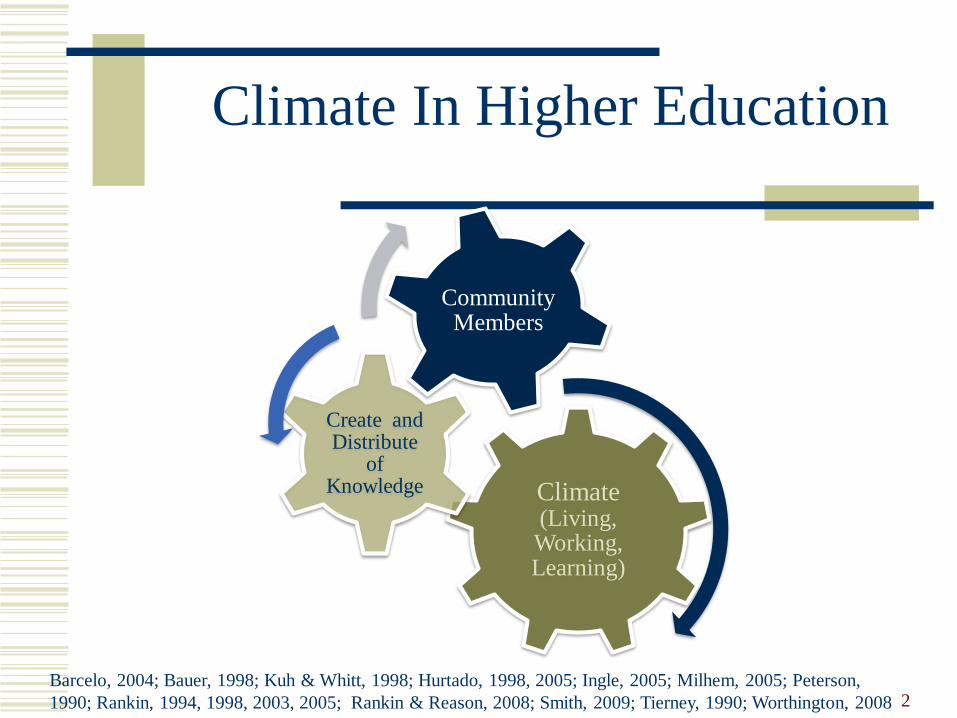
Climate In Higher Education
Climate (Living, Working, Learning)
Create and Distribute
of Knowledge
Community Members
2Barcelo, 2004; Bauer, 1998; Kuh & Whitt, 1998; Hurtado, 1998, 2005; Ingle, 2005; Milhem, 2005; Peterson,
1990; Rankin, 1994, 1998, 2003, 2005; Rankin & Reason, 2008; Smith, 2009; Tierney, 1990; Worthington, 2008

Assessing Campus Climate
3Rankin & Reason, 2008
What is it?• Campus Climate is a construct
Definition?
• Current attitudes, behaviors, and standards and practices of employees and students of an institution
How is it measured?
• Personal Experiences
• Perceptions
• Institutional Efforts

Campus Climate & Students
How students experience their
campus environment influences both learning and
developmental outcomes.1
Discriminatory environments have a negative effect on student learning.2
Research supports the pedagogical value of
a diverse student body and faculty on enhancing learning
outcomes.3
4
1 Pascarella & Terenzini, 1991, 2005; Harper & Hurtado, 2009, Maramba. & Museus, 2011, Patton, 2011, Strayhorn, 20122 Cabrera, Nora, Terenzini, Pascarella, & Hagedron, 1999; Feagin, Vera & Imani, 1996; Pascarella & Terenzini, 2005 3 Hale, 2004; Harper & Quaye , 2004; Harper, & Hurtado, 2009; Hurtado, 2003, Nelson & Niskodé-Dossett, 2010; Strayhorn, 2013

Campus Climate & Faculty/Staff
The personal and professional
development of employees including
faculty members, administrators, and staff members are impacted by campus climate.1
Faculty members who judge their campus
climate more positively are more
likely to feel personally supported and perceive their work unit as more
supportive.2
Research underscores the relationships between (1) workplace discrimination
and negative job/career attitudes and (2)
workplace encounters with prejudice and lower health/well-being..3
5
1Settles, Cortina, Malley, and Stewart , 2006, Gardner, S. 2013; Jayakumar, Howard, Allen, & Han, J. 2009 2Costello, 2012; Sears, 2002; Kaminski, & Geisler, 2012; Griffin, Pérez , Holmes, & Mayo 20103Silverschanz, Cortina, Konik, & Magley, 2007; Waldo, 1999

Climate MattersStudent Activism in 2016
6

Climate Matters
Student Activism in 2016
7

While the demands vary by institutional context, a qualitative analysis reveals
similar themes across the 76 institutions and organizations (representing 73 U.S.
colleges and universities, three Canadian universities, one coalition of universities and one consortium of Atlanta HBCUs.)
Chessman & Wayt explore these overarching themes in an effort to provide collective insight into what is important to today’s students in the heated context of racial or other bias-related incidents on
college and university campuses.
What Are Students Demanding?
Source: Chessman & Wayt, 2016 ; http://www.thedemands.org/ 8

Policy (91%)
Leadership (89%)
Resources (88%)
Increased Diversity (86%)
Training (71%)Curriculum (68%)
Support (61%)
Seven Major Themes
Source: Chessman & Wayt, 2016 ; http://www.thedemands.org/ 9
What are students’ behavioral
responses?
Responses to Unwelcoming Campus Climates
10

30% of respondents have seriously considered leaving their institution due to
the challenging climate
What do students offer as the main reason for their departure?
Lack of Persistence
Source: R&A, 2015; Rankin, et al., 2010; Strayhorn, 201211
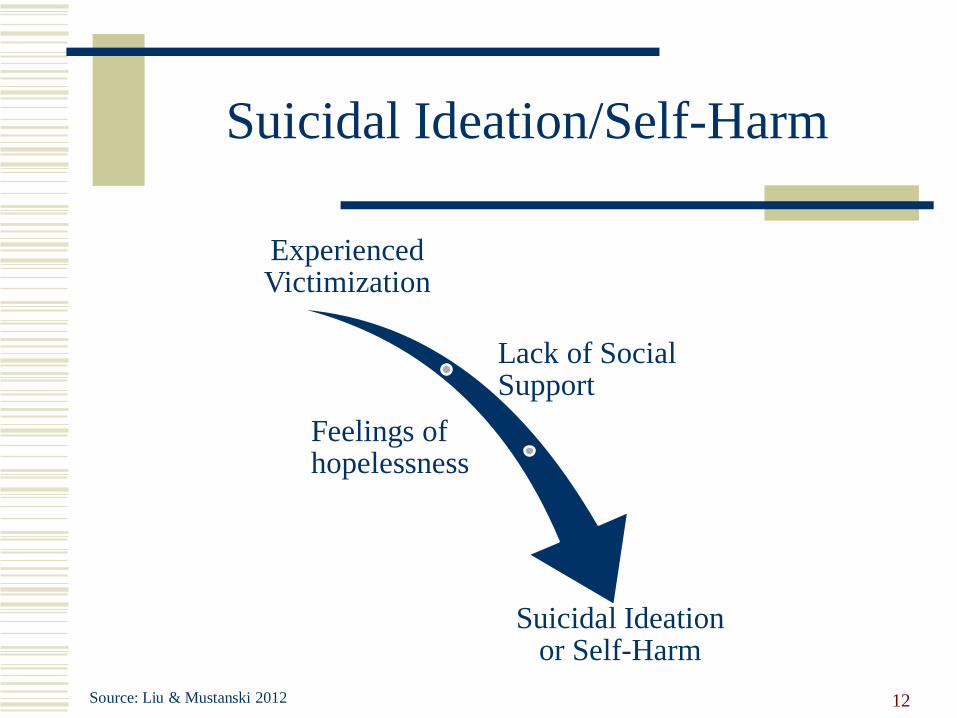
Suicidal Ideation/Self-Harm
Experienced Victimization
Lack of Social Support
Feelings of hopelessness
Suicidal Ideation or Self-Harm
Source: Liu & Mustanski 2012 12

Projected Outcomes
13
UM System Offices will add to their knowledge base with regard to how constituent groups currently feel about their particular campus climate and how the community responds to them (e.g., work-life issues, curricular integration, inter-group/intra-group relations, respect issues).
UM System Offices will use the results of the assessment to inform current/on-going work.

Setting the Context for Beginning the Work
Examine the Research
• Review work already completed
Preparation
• Readiness of each campus
Assessment
• Examine the climate
Follow-up
• Building on the successes and addressing the challenges
14

Current
Campus
Climate
Access
Retention
Research
Scholarship
Curriculum
Pedagogy
University
Policies/Service
Intergroup &
Intragroup
Relations
Transformational Tapestry Model©
Baseline
Organizational
Challenges
Systems
Analysis
Local / Sate /
Regional
Environments
Contextualized Campus Wide Assessment
Advanced
Organizational
Challenges
Consultant
Recommendations
Assessment
Transformation
via
Intervention
Fiscal
Actions
Symbolic
Actions
Administrative
Actions
Educational
Actions
Transformed
Campus
Climate
Access
Retention
Research
Scholarship
Curriculum
Pedagogy
University
Policies/Service
Intergroup &
Intragroup
Relations
© 2001
External
Relations
External
Relations
15

16
Project Overview
• Review of Institutional Data
• Assessment Tool Development and Implementation
Phase I
• Data Analysis
Phase II
• Final Report and Presentation
Phase III

17
Process to DatePhase I
May 2016
In collaboration with R&A, the Systemwide Climate Study Team (SCST; composed of faculty, staff, and administrators across the UM System) was created.
In meetings, the SCST developed the survey instrument; reviewed multiple drafts; and approved the final survey instrument.

18
Process to DatePhase I
Fall 2016
The final survey was distributed to the entire UM System Offices community via an invitation from Interim President Michael A. Middleton.
The survey was available from November 15th to December 16th.

Instrument/Sample
19
Final instrument
• 120 questions including space for respondents to provide commentary
• On-line or paper & pencil options
Sample = Population
• All community members were invited to take the survey
• The survey was available from November 15th to December 16th, 2016
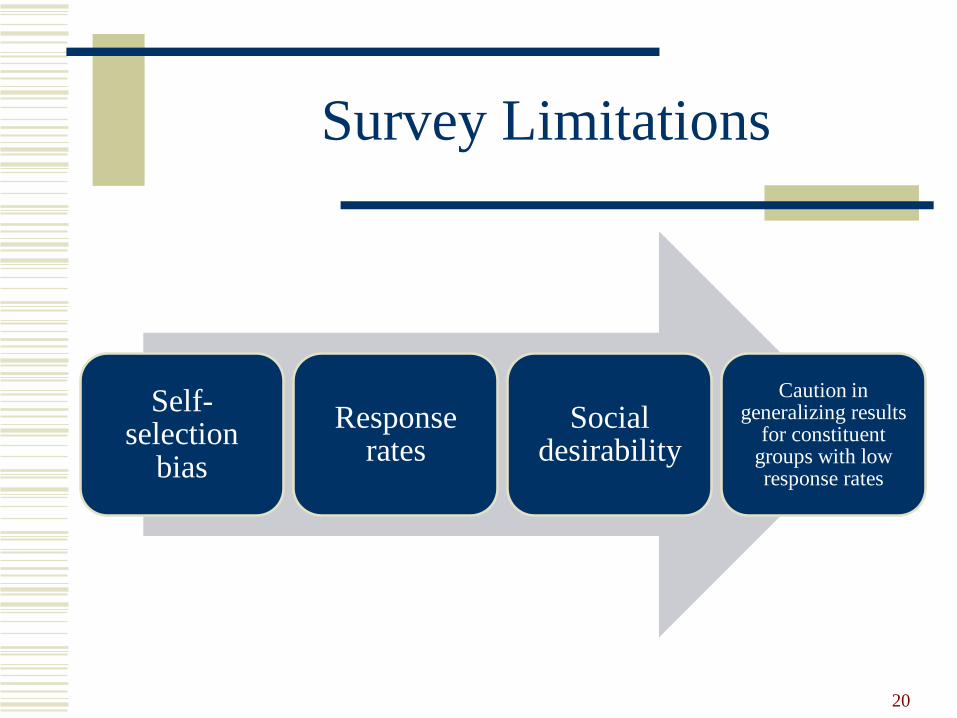
Survey Limitations
Self-selection
bias
Response rates
Social desirability
Caution in generalizing results
for constituent groups with low response rates
20

21
Process to DatePhase II
Spring 2017
Quantitative and qualitative analyses conducted
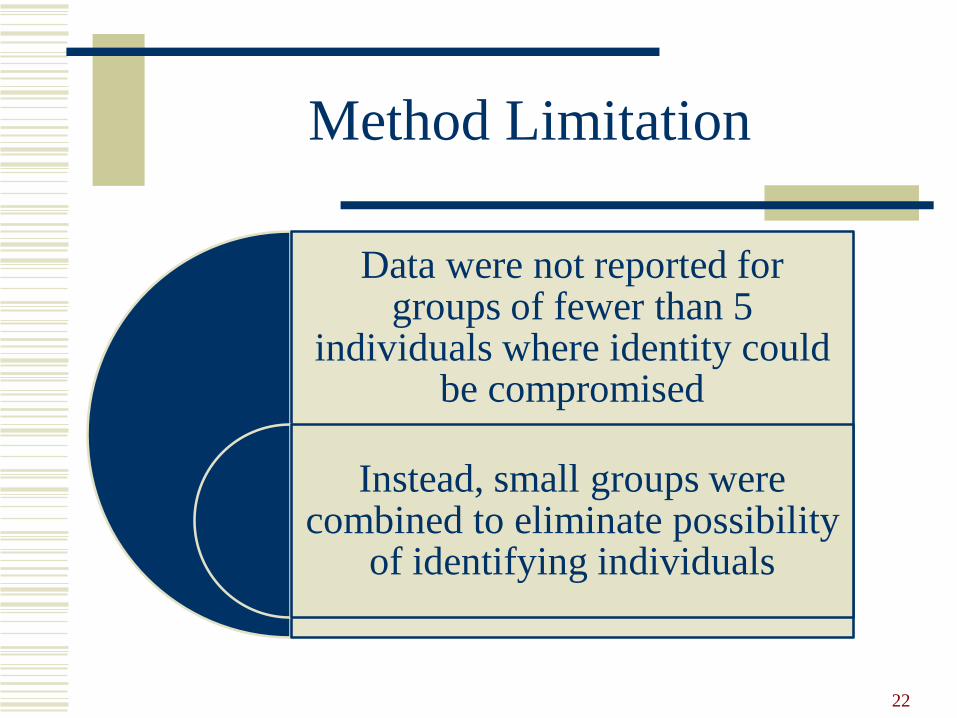
Method Limitation
Data were not reported for groups of fewer than 5
individuals where identity could be compromised
Instead, small groups were combined to eliminate possibility
of identifying individuals
22

23
Phase III
Summer/Fall 2017
Report draft reviewed by the Local Campus Study Team (LCST) at UM System Offices
Final report submitted to UM System Offices
Presentation to UM System Offices campus community
Results: Response Rates
24

Who are the respondents?
142 surveys were returned for a
27% overall response rate
25

Response Rates by Employee Position
26
25%• Staff – Salary (n = 94)
24%• Staff – Hourly (n = 37)
N/A• Administrator without Faculty Rank (n = 9)
N/A• Administrator with Faculty Rank (n < 5)

Response Rates by Gender Identity
27
27%• Woman (n = 80)
24%• Man (n = 57)
N/A• Transspectrum (n = 0)

Response Rates by Racial Identity
28
100%• Multiracial (n = 5)
25%• White/European American (n = 116)
23%• Black/African American (n = 6)
N/A• Asian/Asian American (n < 5)

Response Rates by Racial Identity
29
N/A• Hispanic/Latin@/Chican@ (n < 5)
N/A• American Indian/Alaska Native (n < 5)
N/A• Native Hawaiian/Pacific Islander (n = 0)
N/A• Middle Eastern/Southwest Asian (n = 0)
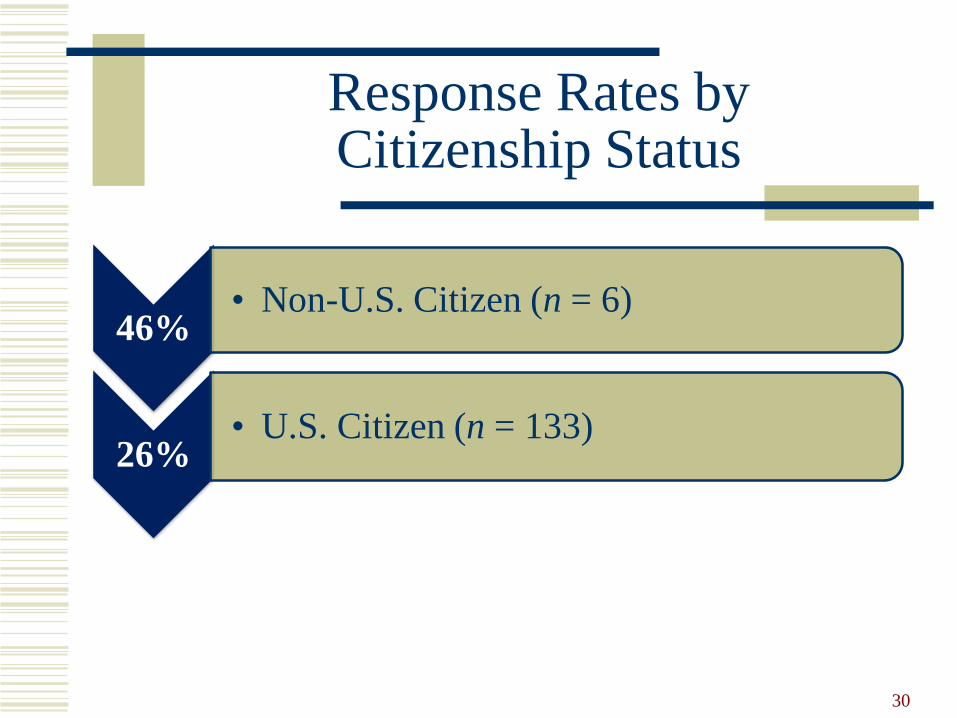
Response Rates by Citizenship Status
30
46%• Non-U.S. Citizen (n = 6)
26%• U.S. Citizen (n = 133)
Additional Demographic Characteristics
31
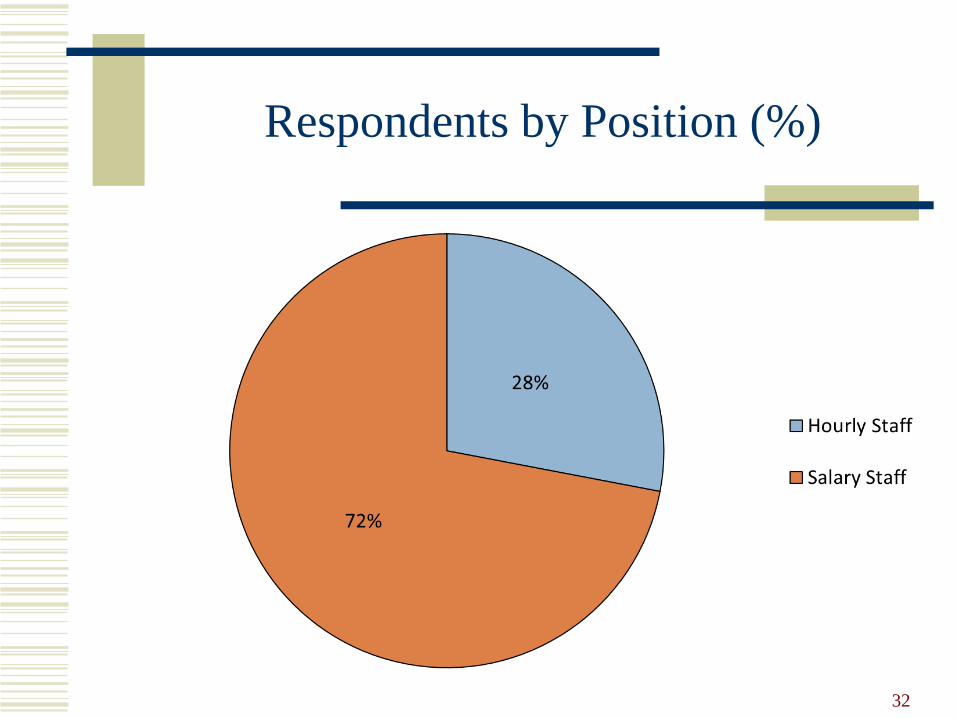
Respondents by Position (%)
32

Full-Time Status/Benefits Eligible
33
99% (n = 140) were full-time in
their primary positions
99% (n = 141) were benefits
eligible

Primary UM System Offices Location
34
Location n %
Woodrail Center 37 26.1
University Hall 25 17.6
Old Alumni Building 15 10.6
Lemone Building 11 7.7
Locust St. Building 9 6.3
Telecom Building < 5 ---
Other 43 30.3

Respondents by Gender Identity and Position Status (%)
35
75
25
57
43
0% 10% 20% 30% 40% 50% 60% 70% 80% 90% 100%
Women
Men
Women
Men
Ho
url
y S
taff
Sa
lary
Sta
ff

Respondents by Racial/Ethnic Identity (%)(Duplicated Total)
36
4
4
85
0% 10% 20% 30% 40% 50% 60% 70% 80% 90% 100%
Asian/Asian American
Hispanic/Latin@/Chican@
Middle Eastern/Southwest Asian
Pacific Islander
Alaska Native
Native Hawaiian
Racial identity not listed
African/Black/African American
American Indian/Native
White/European American

Respondents by Racial/Ethnic Identity (%) (Unduplicated Total)
37
9
4
87
0% 10% 20% 30% 40% 50% 60% 70% 80% 90% 100%
People of Color
Multiracial
White

12% (n = 17) of Respondents Had a Condition/Disability that Influenced Their Learning, Working, or Living Activities
38
Condition n %
Chronic Diagnosis or Medical Condition 9 52.9
Mental health/Psychological Condition 5 29.4
Developmental/Learning difference/Disability < 5 ---
Physical/Mobility condition that affects walking < 5 ---
Low vision or blind < 5 ---
Hard of hearing or deaf 0 0.0
Physical/Mobility condition that does not affect walking 0 0.0
Acquired/Neurological/Traumatic Brain Injury 0 0.0
Speech/communication condition 0 0.0
A disability/condition not listed here 0 0.0
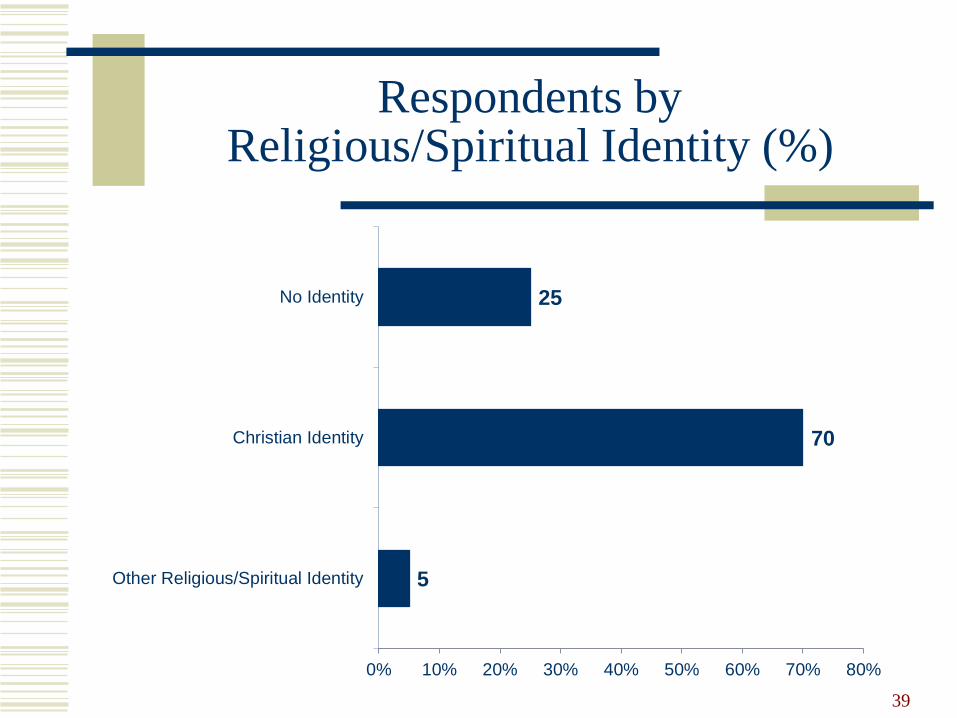
Respondents byReligious/Spiritual Identity (%)
39
5
70
25
0% 10% 20% 30% 40% 50% 60% 70% 80%
Other Religious/Spiritual Identity
Christian Identity
No Identity

Respondents with a Disability -Accommodations
40
77% (n = 13) of respondents indicated that they were not receiving accommodations

Citizenship/Immigration Status
41
U.S. Citizen
(94%, n = 133)

Military Status
42
Military n %
Never served in the military 127 89.7
On active duty in the past, but not now 11 7.7
Now on active duty (including Reserves or
National Guard) 0 0.0
ROTC 0 0.0

Respondents by Age (n)
43
0 0
16
30
48
22
17
21 or younger 22-24 25-34 35-44 45-54 55-74 75 and older

Respondents by Caregiving Responsibilities (%)
44Note: Responses with n < 5 are not presented in the figure.
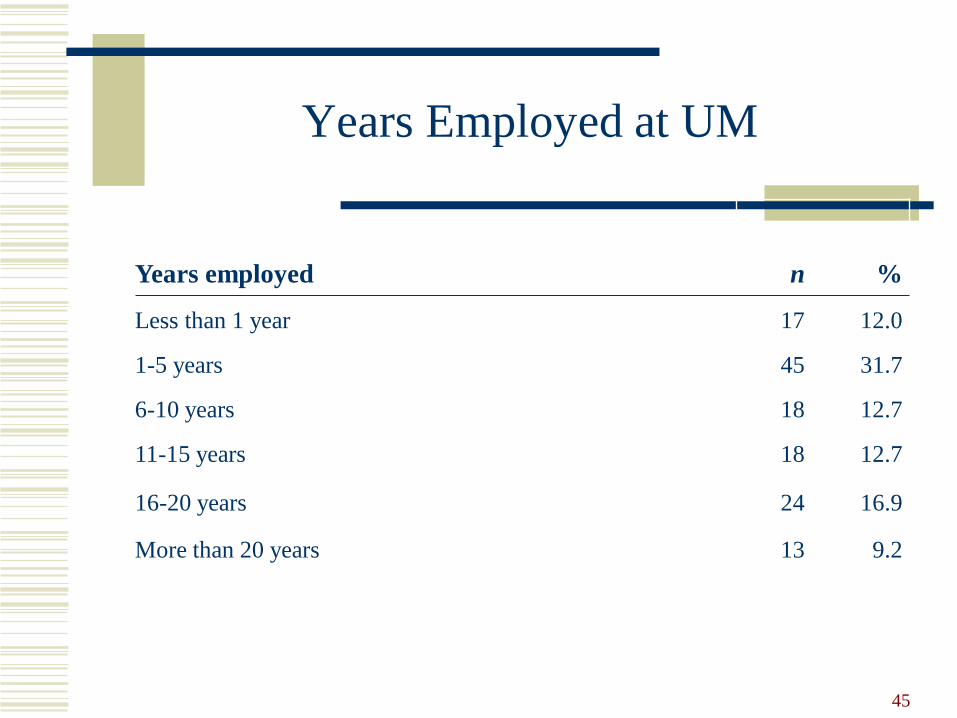
Years Employed at UM
45
Years employed n %
Less than 1 year 17 12.0
1-5 years 45 31.7
6-10 years 18 12.7
11-15 years 18 12.7
16-20 years 24 16.9
More than 20 years 13 9.2

35% (n = 50) of Respondents Reported Experiencing Financial Hardship…
46
Financial hardship n %
Affording housing 23 46.0
Affording health care 20 40.0
Affording food 20 40.0
Affording professional development 18 36.0
Affording childcare 13 26.0
Affording travel to and from UM System Office/MU 10 20.0
Affording benefits 8 16.0
Affording other campus fees (e.g., parking) < 5 ---
A financial hardship not listed here 16 32.0
Note: Table includes respondents who reported having experienced financial hardship (n = 50) only.

Findings
47

Comfort Levels
Overall Campus Climate (63%)
Work Areas (80%)
48
Challenges and Opportunities
49
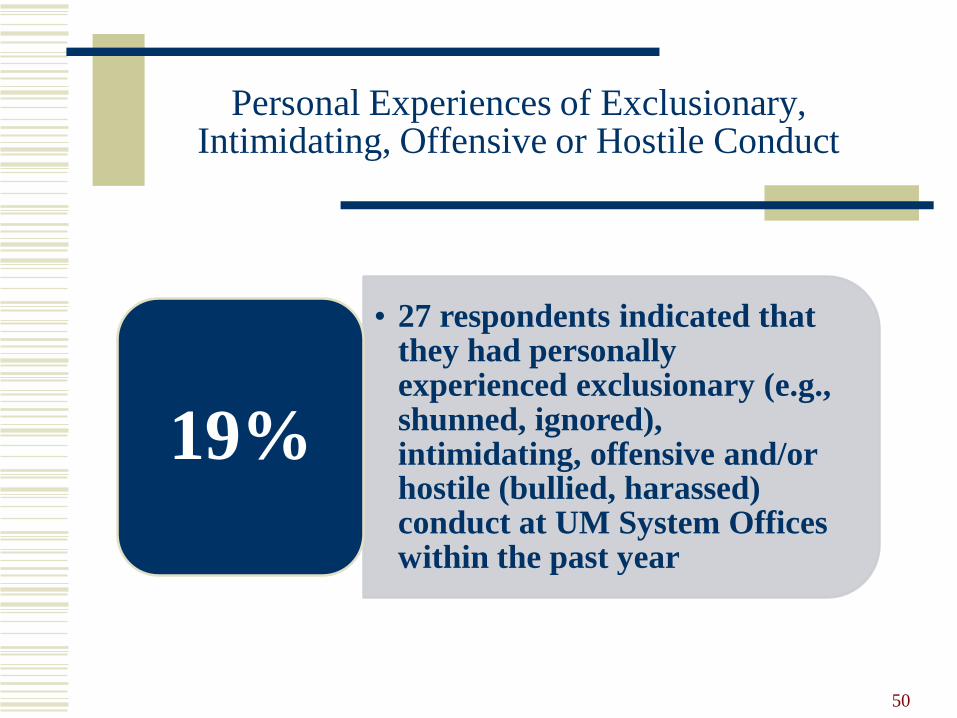
Personal Experiences of Exclusionary, Intimidating, Offensive or Hostile Conduct
50
• 27 respondents indicated that they had personally experienced exclusionary (e.g., shunned, ignored), intimidating, offensive and/or hostile (bullied, harassed) conduct at UM System Offices within the past year
19%
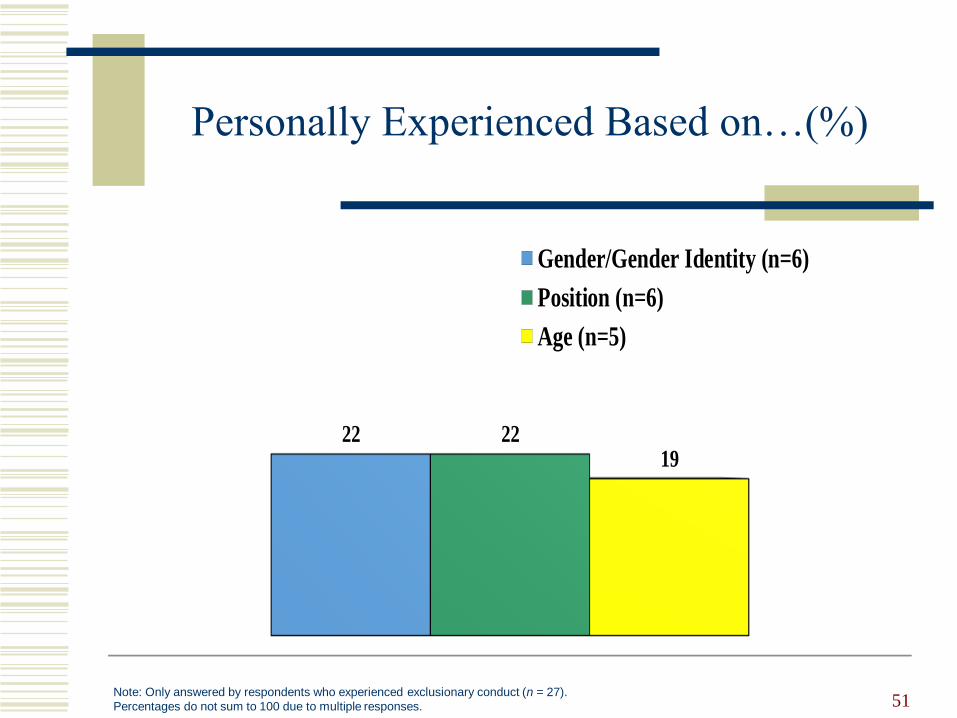
Personally Experienced Based on…(%)
51Note: Only answered by respondents who experienced exclusionary conduct (n = 27).
Percentages do not sum to 100 due to multiple responses.
22 2219
Gender/Gender Identity (n=6)
Position (n=6)
Age (n=5)
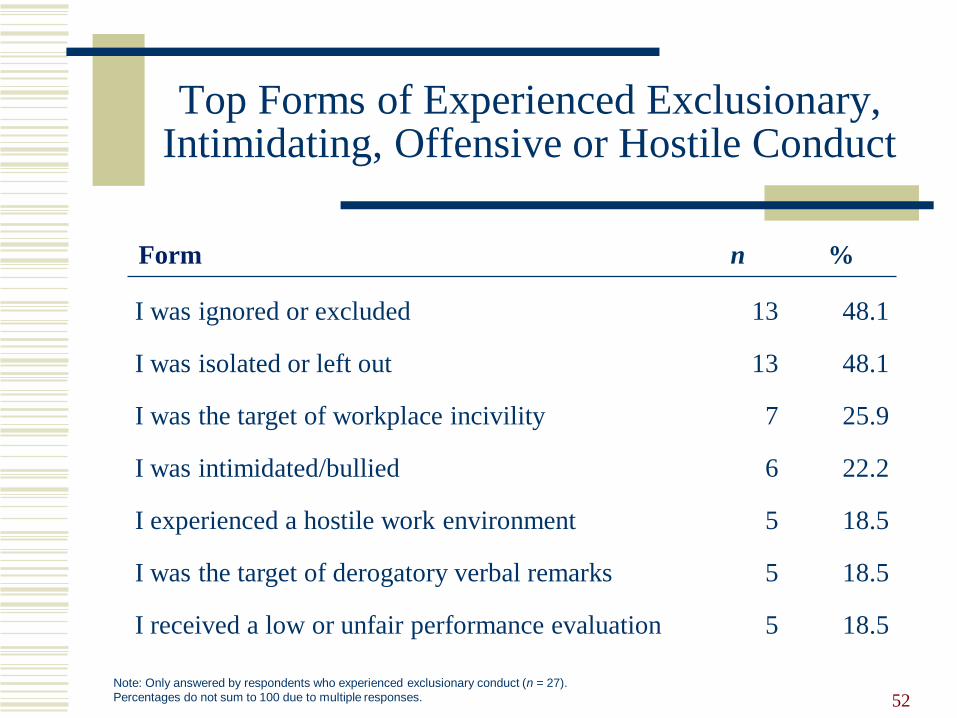
Top Forms of Experienced Exclusionary, Intimidating, Offensive or Hostile Conduct
52
Form n %
I was ignored or excluded 13 48.1
I was isolated or left out 13 48.1
I was the target of workplace incivility 7 25.9
I was intimidated/bullied 6 22.2
I experienced a hostile work environment 5 18.5
I was the target of derogatory verbal remarks 5 18.5
I received a low or unfair performance evaluation 5 18.5
Note: Only answered by respondents who experienced exclusionary conduct (n = 27).
Percentages do not sum to 100 due to multiple responses.

Personal Experiences of Exclusionary, Intimidating, Offensive or Hostile Conduct as
a Result of Position Status (%)
53
22%
17%
Hourly Staff Salary Staff
(n = 8) (n = 16)

Personal Experiences of Exclusionary, Intimidating, Offensive or Hostile Conduct as
a Result of Gender Identity (%)
54
21%
17%
Men Staff
Women Staff
(n = 12) (n = 13)
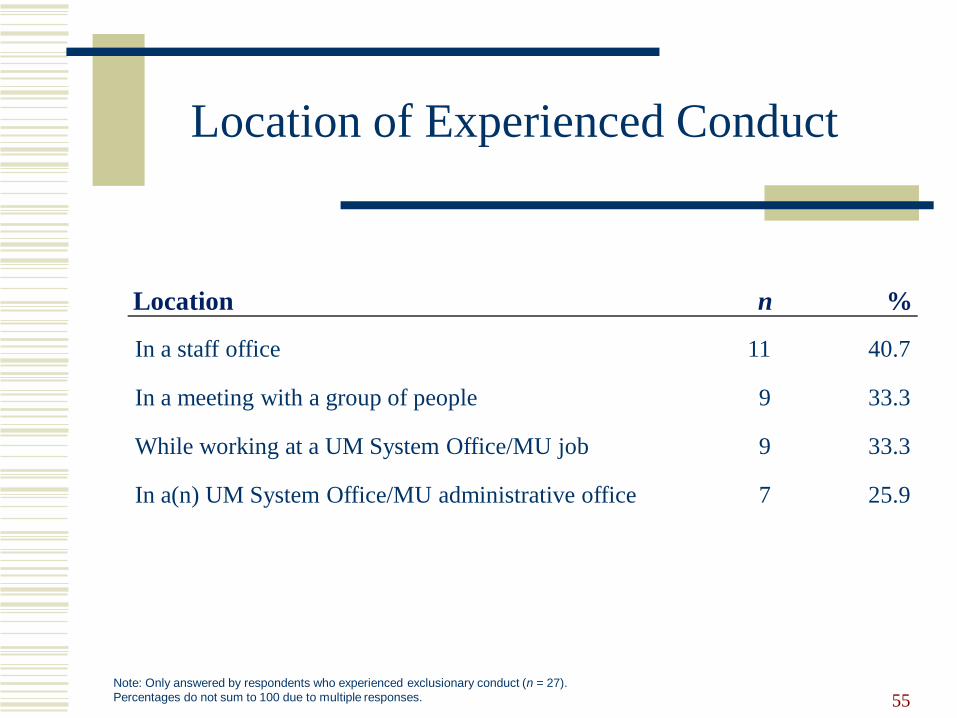
Location of Experienced Conduct
55
Location n %
In a staff office 11 40.7
In a meeting with a group of people 9 33.3
While working at a UM System Office/MU job 9 33.3
In a(n) UM System Office/MU administrative office 7 25.9
Note: Only answered by respondents who experienced exclusionary conduct (n = 27).
Percentages do not sum to 100 due to multiple responses.

Source of Experienced Conduct by Position (%)
56Note: Only answered by respondents who experienced exclusionary conduct (n = 27).
Percentages do not sum to 100 due to multiple responses.
63
44
50
Hourly Staff Salary Staff
Coworkers/colleagues
Supervisor/manager
(n = 5) (n = 7)(n < 5) (n = 8)
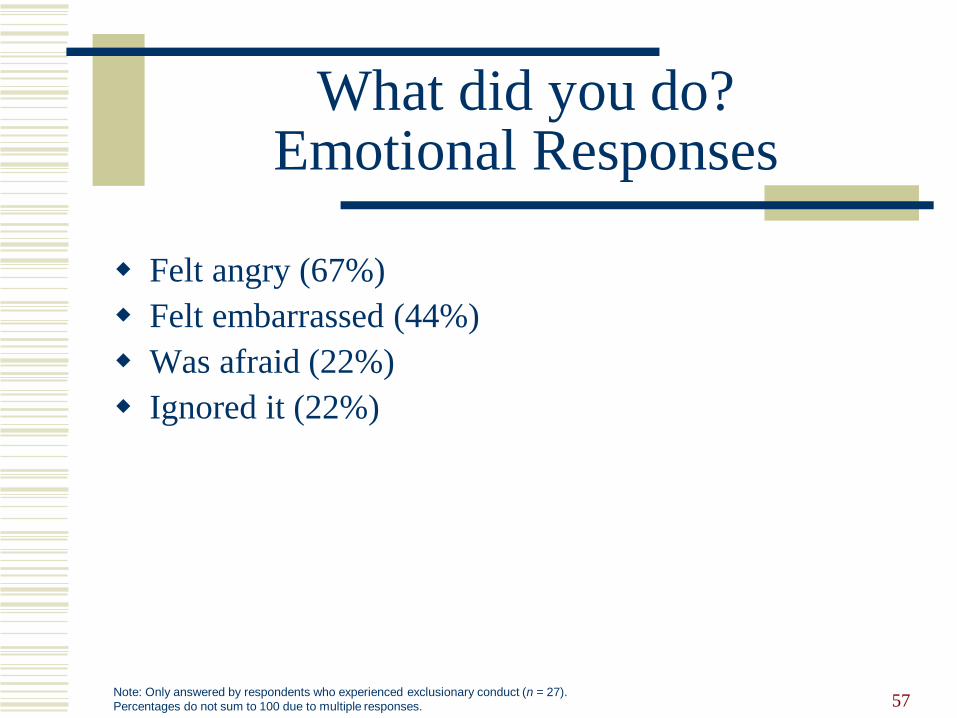
What did you do?Emotional Responses
Felt angry (67%)
Felt embarrassed (44%)
Was afraid (22%)
Ignored it (22%)
57Note: Only answered by respondents who experienced exclusionary conduct (n = 27).
Percentages do not sum to 100 due to multiple responses.

What did you do?Actions
Told a family member (33%)
Didn’t do anything (30%)
Told a friend (26%)
Avoided the person/venue (22%)
Confronted the person(s) later (22%)
Contacted a UM System Office/MU resource (19%)
58Note: Only answered by respondents who experienced exclusionary conduct (n = 27).
Percentages do not sum to 100 due to multiple responses.

Qualitative Themes
Experienced Exclusionary Conduct
59
Lack of support
Harassment based on age, sexuality, or nationality

Intent to Persist
60

50% (n = 71) of Respondents Seriously Considered Leaving
UM System Offices
61
50%57%
48%
All Respondents (n = 71) Hourly Staff (n = 21) Salary Staff (n = 45)

Top Reasons Respondents Seriously Considered Leaving
UM System Offices
62
Reason n %
Low salary/pay rate 37 52.1
Limited opportunities for advancement 34 47.9
Lack of a sense of belonging 27 38.0
Increased workload 22 31.0
Tension with supervisor/manager 22 31.0
Interested in a position at another institution 18 25.4
Lack of professional development opportunities 18 25.4
Note: Table includes answers from only those respondents who indicated that they considered leaving (n = 71).

Qualitative Themes for Respondents
Why Considered leaving…
63
Low and/or static salary
Lack of quality leadership

Perceptions
64
Respondents who observed conduct or communications directed towards a person/group of people that created an
exclusionary, intimidating, offensive and/or hostile working or learning environment…
65
24% (n = 34)

Top Forms of Observed Exclusionary, Intimidating, Offensive, or Hostile Conduct
66
Forms n %
Derogatory verbal remarks 18 52.9
Person intimidated/bullied 11 32.4
Person ignored or excluded 7 20.6
Person isolated or left out 6 17.6
Person experienced a hostile work environment 6 17.6
Person was the target of workplace incivility 6 17.6
Note: Only answered by respondents who observed exclusionary conduct (n = 34).
Percentages do not sum to 100 due to multiple responses.

Observed Exclusionary, Intimidating, Offensive, or Hostile Conduct Based
on…(%)
67Note: Only answered by respondents who observed exclusionary conduct (n = 34).
Percentages do not sum to 100 due to multiple responses.
29
21 2118
Gender/Gender Identity (n=10)
Political views (n=7)
Sexual Identity (n=7)
Racial Identity (n=6)

Source of Observed Exclusionary, Intimidating, Offensive, or Hostile Conduct
68
• Supervisor or manager (35%)
• Coworker/colleague (21%)
• Faculty member/other instructional staff (18%)
• Staff member (18%)
• Student (15%)
Source
Note: Only answered by respondents who observed exclusionary conduct (n = 34).
Percentages do not sum to 100 due to multiple responses.

Target of Observed Exclusionary, Intimidating, Offensive, or Hostile Conduct
69
• Coworker/colleague (44%)
• Staff member (29%)
• Student (27%)Target
Note: Only answered by respondents who observed exclusionary conduct (n = 34).
Percentages do not sum to 100 due to multiple responses.

Location of Observed Exclusionary, Intimidating, Offensive, or Hostile Conduct
70
In other public spaces at UM System Office/MU
18% n = 6
In a meeting with a group of people
24% n = 8
In a staff office
35% n = 12
Note: Only answered by respondents who observed exclusionary conduct (n = 34).
Percentages do not sum to 100 due to multiple responses.

Actions in Response to Observed Conduct
71
Told a family
member
18% Confronted the person(s) at the time
15%
Note: Only answered by respondents who observed exclusionary conduct (n = 34).
Percentages do not sum to 100 due to multiple responses.

Qualitative Themes
Observed Conduct
72
Excluding or attacking the perspectives of individuals in the majority

Perceptions of Climate
73

74
Perceptions of Unjust Hiring Practices
19% (n = 7) of Hourly Staff respondents
17% (n = 16) of Salary Staff respondents
75
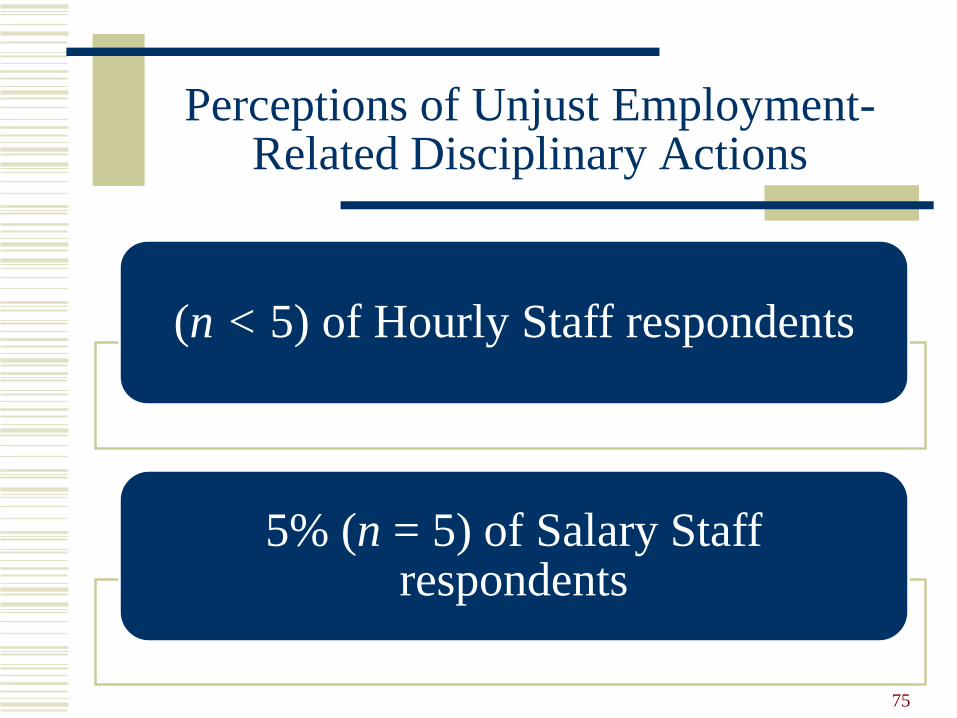
Perceptions of Unjust Employment-Related Disciplinary Actions
(n < 5) of Hourly Staff respondents
5% (n = 5) of Salary Staff respondents

76
Perceptions of Unjust Practices
Related to Promotion
22% (n = 8) of Hourly Staff respondents
24% (n = 22) of Salary Staff respondents

Most Common Bases for
Discriminatory Employment Practices
Age
Racial identity
EthnicityGender identity
Nepotism/ cronyism
77

Work-Life IssuesSUCCESSES & CHALLENGES
The majority of Staff respondents expressed
positive views of campus climate.
78

Staff RespondentsExamples of Successes
94% indicated that their supervisors provided adequate support for
them to manage work-life balance
89% had adequate resources to perform
their job duties
Majority had supervisors (81%) or
colleagues/ coworkers (79%) who gave them
job/career advice or guidance when they
needed it
79

Staff Respondents Examples of Successes
83% believed that they were given a reasonable time frame to complete
assigned responsibilities
76% believed that their supervisors
were supportive of flexible work
schedules
86% believed that their supervisors
were supportive of their taking leave
80

Staff Respondents Examples of Successes
81
A majority felt valued by coworkers in their department (83%) and
outside their department (79%), and by supervisors/ managers (82%).
A majority felt that their skills (76%) and work (79%) were
valued.

Staff Respondents Examples of Challenges
82
62%
• A hierarchy existed within staff positions that allowed some voices to be valued more than others
33%
• People who have children or elder care were burdened with balancing work and family responsibilities
39%
• Performed more work than colleagues with similar performance expectations
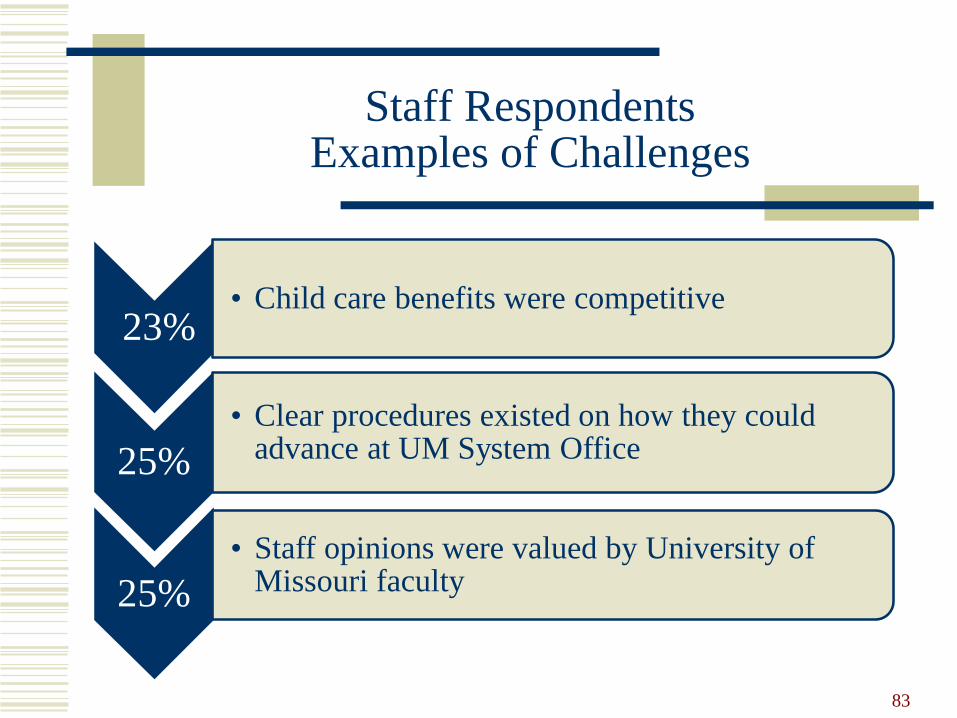
Staff Respondents Examples of Challenges
83
23%• Child care benefits were competitive
25%
• Clear procedures existed on how they could advance at UM System Office
25%
• Staff opinions were valued by University of Missouri faculty

Staff RespondentsExamples of Challenges
84
24%• Felt valued by University of Missouri students
30%• Felt valued by University of Missouri faculty
39%
• Felt valued by University of Missouri senior administrators

Qualitative Themes
Staff Respondents
Work-Life Attitudes
85
Workload/salary imbalances
Short-comings of staff evaluations

Qualitative Themes
Staff Respondents
Professional Development, Leave, Flexible Work
Schedule, Salary, Benefits
86
Lack of job security

Institutional Actions
87

Top Five Available Campus Initiatives that Positively
Influenced Climate for Staff Respondents
88
Career development opportunities for staff
Fair process to resolve conflicts
Clear process to resolve conflicts
Access to counseling for people who have
experienced harassment
Supervisory training for supervisors/
managers

Top Five Unavailable Campus Initiatives that Would
Positively Influence Climate for Staff Respondents
89
Affordable child care
Mentorship for new staff
Clear process to resolve conflicts
A location for staff for informal networking
(e.g., University Club).
Career development opportunities for
staff
Qualitative Themes
Campus Initiatives – Staff Respondents
90
Administrative support for diversity programs and initiatives
Summary
Strengths and Successes
Opportunities for Improvement
91

Context Interpreting the Summary
Although colleges and universities attempt to foster
welcoming and inclusive environments, they are not
immune to negative societal attitudes and discriminatory
behaviors.
As a microcosm of the larger social environment,
college and university campuses reflect the
pervasive prejudices of society.
Classism, Racism, Sexism, Genderism, Heterosexism, etc.
92
(Eliason, 1996; Hall & Sandler, 1984; Harper & Hurtado, 2007; Hart & Fellabaum, 2008; Malaney, Williams, &
Gellar, 1997; Rankin, 2003; Rankin & Reason, 2008; Rankin, Weber, Blumenfeld, & Frazer, 2010; Smith, 2009;
Worthington, Navarro, Loewy & Hart, 2008)

93
Overall Strengths and
Successes 83% felt valued by coworkers and 82%felt valued by supervisors/ managers
76% believed that their supervisors were supportive of flexible work schedules
81% believed that they had supervisors
who gave them job/career advice or guidance when they
needed it
80% of respondents were comfortable with
the climate in their primary work area

94
Overall Challenges and Opportunities for
Improvement24% observedexclusionary
conduct within the last year at
UM System Offices
63% were comfortable
with the overall climate - less
than the national average
19% personally
experiencedexclusionary
conduct within the last year at
UM System Offices
50% of Staff respondents seriously
considered leaving UM
System Offices

Sharing the Report with the Community
Executive Summary, Full Report, and Power Point will be available at
https://www.umsystem.edu/ums/dei/campus-climate-survey
95

Questions and Discussion
96


