
ANURAG SEHGALRAHUL TONGIA
RESEARCH CONTRIBUTOR | ABHISHEK MISHRA
Coal Requirement in 2020:A Bottom-up Analysis
RESEARCH PAPER 072016-2
BROOKINGS INDIAQUALITY. INDEPENDENCE. IMPACT
© 2016 Brookings Institution India Center
No. 6, Second Floor, Dr. Jose P Rizal Marg
Chanakyapuri, New Delhi - 110021
www.brookings.in
Recommended citation:
Sehgal, Anurag; Tongia, Rahul (2016). “Coal Requirement in 2020: A Bottom-up Analysis,” Brookings India
Research Paper No. 072016-2.
The Brookings Institution India Center serves as a platform for cutting-edge, independent, policy-relevant
research and analysis on the opportunities and challenges facing India. The Center is based in New Delhi,
and registered as a company limited by shares and not for profit, under Section 25 of the Companies Act,
1956. Established in 2013, the Center is the third and newest overseas center of the Washington, D.C.-
based Brookings Institution. Our work is centered on the Brookings motto of “Quality, Independence,
Impact.”
All content reflects the individual views of the author(s). Brookings India does not hold an institutional view
on any subject.
BROOKINGS INDIAQUALITY. INDEPENDENCE. IMPACT
BROOKINGS INDIA | RESEARCH PAPER 072016-2
Coal Requirement in 2020: A Bottom-up Analysis
ANURAG SEHGAL
RAHUL TONGIA
RESEARCH CONTRIBUTOR: ABHISHEK MISHRA
Building a Design Economy in India
IMPACT SERIES 072016-2
QUALITY. INDEPENDENCE. IMPACT

BROOKINGS INDIA | RESEARCH PAPER 072016-2
1| Coal Requirement in 2020: A Bottom-up Analysis
Acknowledgements and disclaimers
The authors gratefully acknowledge a range of people who have helped with data, feedback, ideas,
etc., including leaders at the Ministry of Coal, participants at a Roundtable discussion held at
Brookings India in March 2016, as well as Partha Bhattacharyya, Vivek Sahai, Rohit Chandra, Daljit
Singh, and multiple others. We also benefited from detailed feedback from leaders at the Ministry
of Power, Ministry of New and Renewable Energy, Central Electricity Authority, Power System
Operation Corporation, and other operational and statutory bodies in the sector. We also
acknowledge feedback from a number of reviewers.
Support for this publication was generously provided by Tata Steel Ltd. Brookings India recognises
that the value it provides is in its absolute commitment to quality, independence, and impact.
Activities supported by its donors reflect this commitment and the analysis and recommendations
found in this report are solely determined by the scholar(s).
The authors remain responsible for the content.

BROOKINGS INDIA | RESEARCH PAPER 072016-2
2| Coal Requirement in 2020: A Bottom-up Analysis
Table of contents ACKNOWLEDGEMENTS AND DISCLAIMERS .................................................................................................................. 1
LIST OF ABBREVIATIONS ................................................................................................................................................. 4
LIST OF TABLES ................................................................................................................................................................ 5
LIST OF FIGURES .............................................................................................................................................................. 6
1 SUMMARY .............................................................................................................................................................. 8
1.1 COAL TARGETS WERE PURPOSELY AMBITIOUS, BUT MAY BE UNNECESSARILY SO ................................. 8
1.2 2020 DOMESTIC COAL REQUIREMENTS TO RANGE BETWEEN 900 AND 1,200 MT ........................... 9
1.3 THE HAND FOR 2020 HAS ALREADY BEEN DEALT .................................................................................. 10
2 INTRODUCTION AND OBJECTIVES ..................................................................................................................... 14
3 COAL IN INDIA ................................................................................................................................................... 15
3.1 COAL DEMAND AND AVAILABILITY .......................................................................................................... 15
3.2 QUALITY AND QUANTITY CONSTRAINTS OF INDIAN COAL TYPES ........................................................ 15
3.3 NEAR MONOPOLY POSITION OF PUBLIC SECTOR COAL MINING COMPANIES ..................................... 16
3.4 AMBITIOUS COAL PRODUCTION TARGETS FOR THE FUTURE? ............................................................... 17
3.5 RESEARCH OBJECTIVE AND METHODOLOGY ........................................................................................... 17
4 POWER SECTOR OVERVIEW ............................................................................................................................... 19
4.1 COAL DOMINATES ELECTRICITY GENERATED (79 PER CENT IN FY’14-15) ......................................... 20
4.2 LAGGING IN TECHNOLOGY USE ................................................................................................................ 20
4.3 LOW EFFICIENCY VALUES FOR EXISTING PLANTS .................................................................................... 21
4.4 FUTURE COAL-BASED POWER CAPACITY: A LOT MORE OF THE SAME? ............................................... 21
5 SECTORAL COAL CONSUMPTION (POWER AND NON-POWER, FY’14-15) ................................................. 23
6 SECTORAL ASSUMPTIONS FOR FUTURE COAL DEMAND CALCULATIONS ..................................................... 24
6.1 POWER SECTOR ASSUMPTIONS ................................................................................................................ 24
6.1.1 PLF ........................................................................................................................................................ 24
6.1.2 EFFICIENCY ............................................................................................................................................ 25
6.1.3 COAL LEAKAGE ..................................................................................................................................... 28
6.2 NON-POWER SECTOR ASSUMPTIONS ..................................................................................................... 28
6.2.1 STEEL (+ BOILER) ................................................................................................................................. 29
6.2.2 CAPTIVE POWER .................................................................................................................................. 29
6.2.3 CEMENT ................................................................................................................................................ 29
6.2.4 FERTILISER ............................................................................................................................................. 29
6.2.5 OTHER USERS OF COAL ....................................................................................................................... 29
6.3 CALCULATING POWER CAPACITY EXPECTED ONLINE TILL 2020 ........................................................... 29
6.4 FUTURE COAL IMPORTS (CALCULATED) ................................................................................................... 32
6.4.1 POWER PLANTS SEGMENTATION METHODOLOGY ........................................................................... 32
6.4.2 PROCEDURE FOR SEGMENTATION ...................................................................................................... 32
6.4.3 ASSESSING PROBABILITIES OF FUTURE IMPORTS .............................................................................. 34
7 CALCULATIONS – COAL REQUIREMENTS, THERMAL POWER PLANT CAPACITY BASIS ................................. 38
7.1 COAL REQUIREMENT IN 2020.................................................................................................................. 38
8 SENSITIVITY ANALYSIS – FUTURE THERMAL POWER PLANT CAPACITY BASIS ............................................... 39
8.1 SLIPPAGE SENSITIVITY ANALYSIS .............................................................................................................. 39
8.2 PLANT EFFICIENCY SENSITIVITY ANALYSIS ............................................................................................... 40

BROOKINGS INDIA | RESEARCH PAPER 072016-2
3| Coal Requirement in 2020: A Bottom-up Analysis
8.3 PLF SENSITIVITY ANALYSIS ....................................................................................................................... 41
9 ASSUMPTIONS FOR ENERGY DEMAND PROJECTIONS IN 2020: A LIMITING FACTOR ................................. 44
9.1 ASSUMPTIONS FOR CALCULATING ELECTRICITY DEMAND IN 2020 ..................................................... 44
9.1.1 GDP ELASTICITY OF ELECTRICITY ........................................................................................................ 44
9.1.2 MEANINGFUL ELECTRIFICATION FOR HOUSEHOLDS ......................................................................... 45
9.1.3 REMOVING ALL LOAD SHEDDING ....................................................................................................... 45
9.1.4 REDUCTION IN TECHNICAL LOSSES .................................................................................................... 46
9.1.5 DISPLACEMENT BY RE ......................................................................................................................... 46
10 CALCULATIONS: COAL REQUIREMENTS, ELECTRICITY DEMAND PROJECTIONS BASIS .................................. 47
10.1 ENERGY DEMAND PROJECTIONS IN 2020 .............................................................................................. 47
10.2 COAL REQUIRED FOR ENERGY DEMAND IN 2020 .................................................................................. 47
10.2.1 OTHER ASSUMPTIONS .................................................................................................................... 47
11 SENSITIVITY ANALYSIS: FUTURE ELECTRICITY DEMAND BASIS ....................................................................... 49
11.1 SENSITIVITY ANALYSIS - IMPORTS ............................................................................................................ 49
11.2 FUTURE IMPORT SCENARIOS .................................................................................................................... 49
11.3 GDP SENSITIVITY ....................................................................................................................................... 51
12 TRIANGULATION: POWER DEMAND AND FUTURE CAPACITY THROW UP DIVERGENT COAL REQUIREMENT
NUMBERS ...................................................................................................................................................................... 52
12.1 COAL DEMAND (THERMAL POWER CAPACITY V/S POWER DEMAND) ................................................. 52
12.2 IMPLICATIONS OF POWER SUPPLY-DEMAND MISMATCH ON PLFS ..................................................... 52
12.3 IMPACT ON COAL ...................................................................................................................................... 54
13 DISCUSSION: ROBUST CALCULATIONS FOR LOWER COAL REQUIREMENTS ................................................. 55
13.1 CAN AN INCREASE IN WASHERY CAPACITY REDUCE QUANTUM OF IMPORTS? ................................... 55
13.2 LOW TRANSPORTATION CAPACITY COULD BE AN ISSUE? ..................................................................... 55
13.3 RE INTEGRATION ....................................................................................................................................... 56
13.4 IMPLICATIONS – 2020 AND BEYOND ...................................................................................................... 57
13.4.1 DO TWO WRONGS MAKE A RIGHT? NO EASY “BYE” FOR CIL .................................................... 57
13.4.2 OTHER IMPLICATIONS OF A TARGET MISMATCH ......................................................................... 58
14 APPENDIX A........................................................................................................................................................ 60
15 REFERENCES ........................................................................................................................................................ 61
THE AUTHORS ......................................................................................................................................................... 64

BROOKINGS INDIA | RESEARCH PAPER 072016-2
4| Coal Requirement in 2020: A Bottom-up Analysis
List of abbreviations
AT&C Aggregate Technical and Commercial (losses)
BU Billion Units (kWh)
CAGR Compounded Annual Growth Rate
CEA Central Electricity Authority
CIL Coal India Limited
COP21 Convention of Parties 21 (Paris Conference on Climate Change)
CSE Centre for Science and Environment
CUF Capacity Utilisation Factor
FSA Fuel Supply Agreement
FY Fiscal Year
GCV Gross Calorific value
GDP Gross Domestic Product
GoAP Government of Andhra Pradesh
GoI Government of India
GW Gigawatt
IGEN Indo-German Energy Program
INDC Intended Nationally Determined Contributions
kWh kilowatt-hour
MNRE Ministry of New and Renewable Energy
MoC Ministry of Coal
MoP Ministry of Power
MT Million Tonnes
PLF Plant Load Factor
PTI Press Trust of India
RE Renewable Energy
ROI Return on Investment
SCCL Singareni Collieries Company Limited
UMPP Ultra Mega Power Projects
YOY Year-On-Year
BROOKINGS INDIA | RESEARCH PAPER 072016-2
5| Coal Requirement in 2020: A Bottom-up Analysis
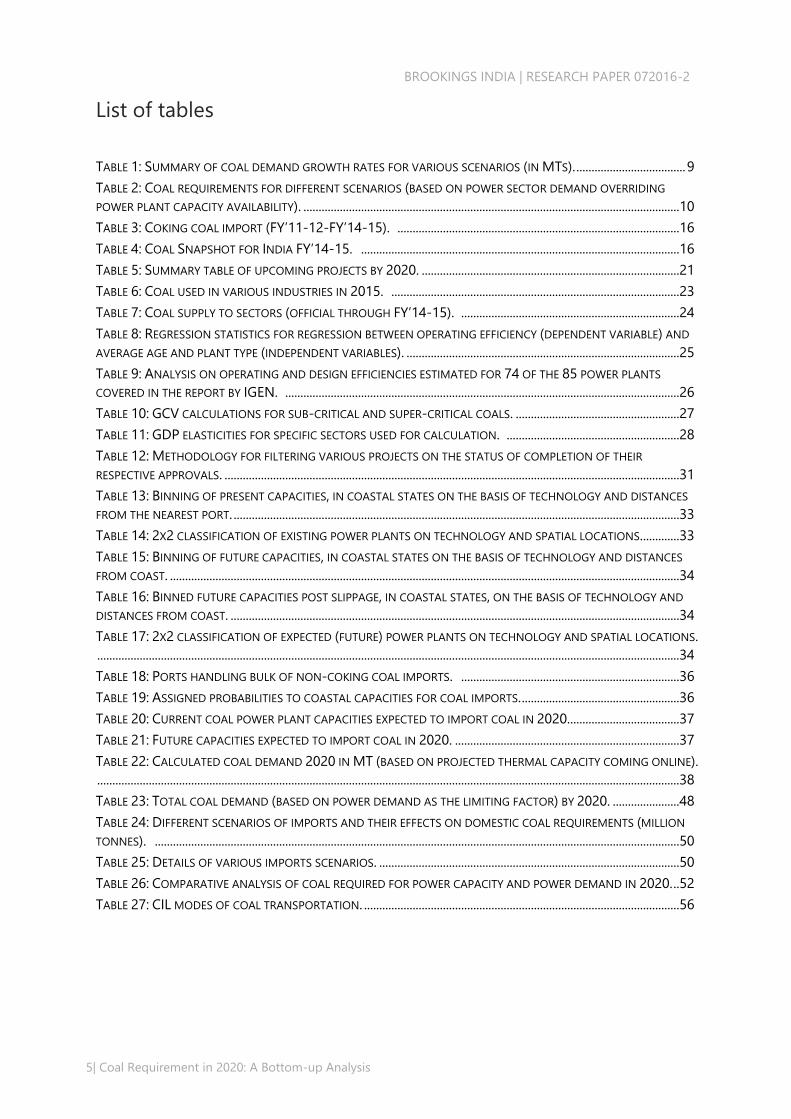
List of tables
TABLE 1: SUMMARY OF COAL DEMAND GROWTH RATES FOR VARIOUS SCENARIOS (IN MTS). .................................... 9
TABLE 2: COAL REQUIREMENTS FOR DIFFERENT SCENARIOS (BASED ON POWER SECTOR DEMAND OVERRIDING
POWER PLANT CAPACITY AVAILABILITY). ............................................................................................................................10
TABLE 3: COKING COAL IMPORT (FY’11-12-FY’14-15). .............................................................................................16
TABLE 4: COAL SNAPSHOT FOR INDIA FY’14-15. .........................................................................................................16
TABLE 5: SUMMARY TABLE OF UPCOMING PROJECTS BY 2020. .....................................................................................21
TABLE 6: COAL USED IN VARIOUS INDUSTRIES IN 2015. ...............................................................................................23
TABLE 7: COAL SUPPLY TO SECTORS (OFFICIAL THROUGH FY’14-15). ........................................................................24
TABLE 8: REGRESSION STATISTICS FOR REGRESSION BETWEEN OPERATING EFFICIENCY (DEPENDENT VARIABLE) AND
AVERAGE AGE AND PLANT TYPE (INDEPENDENT VARIABLES). ..........................................................................................25
TABLE 9: ANALYSIS ON OPERATING AND DESIGN EFFICIENCIES ESTIMATED FOR 74 OF THE 85 POWER PLANTS
COVERED IN THE REPORT BY IGEN. ..................................................................................................................................26
TABLE 10: GCV CALCULATIONS FOR SUB-CRITICAL AND SUPER-CRITICAL COALS. ......................................................27
TABLE 11: GDP ELASTICITIES FOR SPECIFIC SECTORS USED FOR CALCULATION. .........................................................28
TABLE 12: METHODOLOGY FOR FILTERING VARIOUS PROJECTS ON THE STATUS OF COMPLETION OF THEIR
RESPECTIVE APPROVALS. ......................................................................................................................................................31
TABLE 13: BINNING OF PRESENT CAPACITIES, IN COASTAL STATES ON THE BASIS OF TECHNOLOGY AND DISTANCES
FROM THE NEAREST PORT. ...................................................................................................................................................33
TABLE 14: 2X2 CLASSIFICATION OF EXISTING POWER PLANTS ON TECHNOLOGY AND SPATIAL LOCATIONS. ............33
TABLE 15: BINNING OF FUTURE CAPACITIES, IN COASTAL STATES ON THE BASIS OF TECHNOLOGY AND DISTANCES
FROM COAST. ........................................................................................................................................................................34
TABLE 16: BINNED FUTURE CAPACITIES POST SLIPPAGE, IN COASTAL STATES, ON THE BASIS OF TECHNOLOGY AND
DISTANCES FROM COAST. ....................................................................................................................................................34
TABLE 17: 2X2 CLASSIFICATION OF EXPECTED (FUTURE) POWER PLANTS ON TECHNOLOGY AND SPATIAL LOCATIONS.
................................................................................................................................................................................................34
TABLE 18: PORTS HANDLING BULK OF NON-COKING COAL IMPORTS. ........................................................................36
TABLE 19: ASSIGNED PROBABILITIES TO COASTAL CAPACITIES FOR COAL IMPORTS. ....................................................36
TABLE 20: CURRENT COAL POWER PLANT CAPACITIES EXPECTED TO IMPORT COAL IN 2020.....................................37
TABLE 21: FUTURE CAPACITIES EXPECTED TO IMPORT COAL IN 2020. ..........................................................................37
TABLE 22: CALCULATED COAL DEMAND 2020 IN MT (BASED ON PROJECTED THERMAL CAPACITY COMING ONLINE).
................................................................................................................................................................................................38
TABLE 23: TOTAL COAL DEMAND (BASED ON POWER DEMAND AS THE LIMITING FACTOR) BY 2020. ......................48
TABLE 24: DIFFERENT SCENARIOS OF IMPORTS AND THEIR EFFECTS ON DOMESTIC COAL REQUIREMENTS (MILLION
TONNES). .............................................................................................................................................................................50
TABLE 25: DETAILS OF VARIOUS IMPORTS SCENARIOS. ...................................................................................................50
TABLE 26: COMPARATIVE ANALYSIS OF COAL REQUIRED FOR POWER CAPACITY AND POWER DEMAND IN 2020. ..52
TABLE 27: CIL MODES OF COAL TRANSPORTATION. ........................................................................................................56

BROOKINGS INDIA | RESEARCH PAPER 072016-2
6| Coal Requirement in 2020: A Bottom-up Analysis
List of figures
FIGURE 1: IMPACT OF RE DISPLACING COAL DEMAND IN 2020 BASED UPON VARIOUS RE CAPACITY ACHIEVEMENTS
BY 2020.. ...............................................................................................................................................................................11
FIGURE 2: IMPACT OF GDP ON COAL REQUIREMENTS. ................................................................................................... 12
FIGURE 3: GDP ELASTICITY OF POWER GENERATION VS GDP GROWTH RATE (1998 – 2015). ................................. 12
FIGURE 4: TOTAL INSTALLED POWER CAPACITY IN INDIA (2014 – 2016) ................................................................... 19
FIGURE 5: FY’14-15 ELECTRICITY GENERATION (BU) BY SECTOR. ................................................................................. 20
FIGURE 6: COAL DEMAND [MT] FOR 2020 WITH DIFFERENT SLIPPAGES OF POWER PLANT CONSTRUCTION. .......... 39
FIGURE 7: COAL DEMAND IN 2020, WITH CHANGES IN FUTURE PLANT SUB-CRITICAL (PER CENT) AND SUPER-
CRITICAL (PER CENT) EFFICIENCIES. ..................................................................................................................................... 41
FIGURE 8: INDIA AGGREGATE MONTHLY PLFS (COAL AND LIGNITE BASED PLANTS ONLY) .......................................... 42
FIGURE 9: COAL REQUIREMENTS [MT] WITH PLF SENSITIVITY OF POWER CAPACITY EXPECTED BY 2020 ................ 43
FIGURE 10: GDP ELASTICITY OF POWER GENERATION VS GDP GROWTH RATE (1998 – 2015) ............................ 45
FIGURE 11: IMPORTED COAL SCENARIOS AND THEIR IMPACTS ON TOTAL DOMESTIC COAL REQUIREMENTS ............ 51
FIGURE 12: IMPACT OF GDP SENSITIVITY ON COAL REQUIREMENTS. ............................................................................ 51
FIGURE 13: DISPLACEMENT OF PLF OF OLDER PLANTS DUE TO HIGHER PLFS OF NEWER PLANTS. ........................... 53
FIGURE 14: IMPACT OF RE DISPLACING COAL DEMAND IN 2020 BASED UPON VARIOUS RE CAPACITY
ACHIEVEMENTS BY 2020. .................................................................................................................................................... 57

BROOKINGS INDIA | RESEARCH PAPER 072016-2
7| Coal Requirement in 2020: A Bottom-up Analysis
Key findings
India is heavily dependent on coal based power for its electricity needs, 79 per cent of total
electricity generation is coal/thermal based. This is not expected to change drastically in the
near future.
Thermal power generation consumes around 76 per cent of total coal available in the country
(imports included). Given its high coal consumption, power sector has a disproportionate
impact on future coal demand.
Imported coal constituted 26 per cent of total coal supply in FY’14-15 (212 MT of the total
supply of 820.3 MT), however, the imports were 6 per cent lower (than 212 MT) in FY’15-16.
Given that boiler technology locks in to a specific type of coal (imports/blending inclusive), it
is unlikely that imports will ever be zero.
The ambitious target of producing 1.5 billion tonnes of domestic coal is too high, vis-a-vis the
expected increase in coal requirement(s) by 2020. The actual coal requirements are expected
to be (at a maximum) around 1.2 billion tonnes in 2020 (subject to certain optimistic
assumptions of growth in demand).
In addition to GDP growth rates, the Renewable Energy capacity targets of 175 GW by 2022
could also impact coal demand in 2020, pushing it further down, displacing thermal generated
kWh.
Huge thermal power capacities are expected online by 2020. This will impact PLFs, with
economic and technical implications for the new capacities. And, if financial reforms in the
distribution companies do not work as expected, there could be stressed assets as well,
impacting liquidity in the banking sector.
Railways capacity augmentation is a related investment within the same timeframe (till 2020)
to enable actual coal offtake for increased mining capacity. To enable capacity augmentation,
it is essential to look holistically at the total capital requirements for both these sectors
simultaneously.
BROOKINGS INDIA | RESEARCH PAPER 072016-2
8| Coal Requirement in 2020: A Bottom-up Analysis
1 Summary
1.1 Coal targets were purposely ambitious, but may be unnecessarily so
In FY’14-15, the government announced an ambitious plan to produce 1.5 billion tonnes of coal
domestically by 2020, an annual growth of almost 20 per cent. The announcement came at the
back of the then chronic shortfall of coal. However, by the end of FY’15-16 India’s coal shortfall
ended. In fact, power plants—which are the largest users of coal—reported an oversupply of coal,
a situation mirrored in terms of power, with plant capacity growth outstripping power demand
growth.
The 1.5-billion tonne target was split between Coal India Limited (CIL) (and other smaller PSU
producers) producing 1,000 MT and private (captive) producers contributing the remaining 500 MT
by 2020. For the given target, we have envisioned three sets of growth rates (compounded annual
growth rates, or CAGRs)
Estimated requirements of coal in 2020:
Scenario 1 – upper bound for coal requirement, based upon power plant capacity: Non-power
sector demand was extrapolated based on GDP and elasticity assumptions,1 and power
demand was bounded based on upcoming thermal power capacity (examining all plants
under construction, their locations, technology, and status, assuming a plant load factor
(PLF) same as in FY’14-15.
Scenario 2 – Offtake based on power demand: Keeping non-power demand the same as
scenario 1, a detailed power demand calculation2 for 2020 led to coal demand estimates
based on assumptions on share of thermal generation.
The target and estimates however, do not align, as shown in Table 1
1 Assumptions for non-power sector include the following: A base assumptions of 8 per cent GDP growth,
respective sectoral GDP elasticities and continued imports proportionate to imports in the base year FY’14-
15.
2 Base power demand calculations assume: additional demand linked to GDP, zero load-shedding by 2020,
“meaningful” electrification to hitherto unconnected rural consumers and reduction in technical losses.

BROOKINGS INDIA | RESEARCH PAPER 072016-2
9| Coal Requirement in 2020: A Bottom-up Analysis
Targets for coal production in 2020
FY’14-15
[MT]
2020
[MT]
CAGR
Coal requirements (targeted)
Total domestic coal 609 1500 19.8%
Public sector growth required
All public
(CIL + Others,
proportional)
567 1000 12%
Private sector growth
required
Private 45 500 61%
Scenarios for coal requirements in 2020
FY’14-15
[MT]
2020
[MT]
CAGR
Scenario 1: thermal power
plant based coal
requirements
(keeping PLFs as FY’14-15, ~
64%)
Domestic coal 609 996 10.3%
Total coal 820 1311 9.8%
Scenario 2: Power demand
based coal requirements
(more realistic)
Domestic coal 609 929 8.8%
Total coal 820 1228 8.4%
Table 1: Summary of coal demand growth rates for various scenarios (in million tonnes). These have base
assumptions of 8 per cent GDP growth, modest RE growth, and continued imports due to economics and power plant
technology choices (plus imports of coking coal). Note that one tonne of imported coal isn’t the same as one tonne of
domestic coal due to different quality of coal (heating value).
1.2 2020 domestic coal requirements to range between 900 and 1,200
MT (based heavily on electricity demand scenarios and import
choices)
Table 1 shows the base calculations based on assumptions. The capacity based analysis is an
intellectual exercise to show an upper bound on the coal required. Given demand-based
projections are lower, these become the bottleneck and provide a more realistic range of coal
requirements. If one ignores demand for power, the implication would be further “overcapacity” of
power plants, and a fall in PLFs.
All calculations are based on assumptions, and sensitivity analysis indicates what factors matter,
and by how much. High and Low demand scenarios indicate a range as shown in
Table 2, still lower than the nominal target of 1,500 MT. The ‘High coal’ scenario is optimistic and
assumes zero imports of thermal coal (coking coal imports, however, are assumed to continue), a
high GDP growth of 8 per cent, 100 per cent electrification with zero load-shedding, and a modest

BROOKINGS INDIA | RESEARCH PAPER 072016-2
10| Coal Requirement in 2020: A Bottom-up Analysis
growth of Renewable Energy (with no additional displacement of coal share versus today, which
would undershoot the target of 175 GW RE). The ‘Low coal’ scenario assumes a partial improvement
in supply quality with imports in the same proportion as were in FY’14-15.
Scenario
Total coal
required (MT)
Domestic
supply (MT)
Total
imports
(MT)
Comments
Base 1228 929 299
Imports proportionate to
existing ratio
High coal 1291 1225 67
End all imports except coking
coal
Low coal 1139 868 272
Conditional upon demand side
limitations and continued
imports
Table 2: Coal requirements for different scenarios (based on power sector demand overriding power plant
capacity availability). Low coal scenario assumes slightly lower GDP growth (7.5 per cent), imports remain in the
same proportion to the domestic supply as FY’14-15, 50 per cent electrification of hitherto un-electrified households
(slight but incomplete improvement), and a 3 per cent power supply shortfall (versus 3.6 per cent in FY’14-15) and
renewable share of power generated is 10.8 per cent.
1.3 The hand for 2020 has already been dealt: Not much flexibility in
displacing imports for existing/planned power plants as targeted, and
high RE targets
Almost 76 per cent of coal is consumed by the power sector, and 79 per cent of electricity
generated from thermal power plants. Given that coal power plants take years to materialise, we
can assume that plants in 2020 are either under operation or already planned or under
construction. Given that boiler technology requires specific coal quality—sometimes fully
imported, other times with blending—it is unlikely that imports will be zero by 2020 or even later.
The report details how coal requirements were calculated across plants, factoring in their location,
technology, status, etc.
We find that the number of coal power plants under advanced planning or construction is far
higher than likely required. This indicates that overall system PLFs will fall even further, or place
financial stress on plants. As per Central Electricity Authority calculations and planning estimates,
the earlier high PLFs of upwards of 73 per cent are very difficult, if not impossible, to realise in
future.
Economics would warrant existing plants be utilised to the highest level possible (high PLFs), but
the power position in India of surplus at some times in a day reinforces the challenge of peaking
power (mostly in the evening). This indicates that coal-based plants, which are baseload plants,

BROOKINGS INDIA | RESEARCH PAPER 072016-2
11| Coal Requirement in 2020: A Bottom-up Analysis
aren’t the only need for India’s power sector, and neither is solar power. In addition to not meeting
the peak demand, RE also places other system burdens, such as high ramping requirements in the
evening (the so-termed “duck curve”). An “optimal” portfolio of power plants is assumption-driven
based on the objective function: lowest cost vs. energy security vs. environmental improvement
etc.
As an example of sensitivity analysis, Figure 1 shows the impact of different RE capacities on coal
demand. This assumes a fixed (exogenous) demand for power, and a 19 per cent PLF for RE. The
impact of very ambitious RE targets is modest, in the tens of millions of tonnes of coal per annum.
Figure 1: Impact of RE displacing coal demand in 2020 based upon various RE capacity achievements by
2020. The 2022 target of 175 GW implies the need to reach 106 GW by 2020, which would increase the RE share
of total projected electricity (BUs) to 10.8 per cent. Any level of RE share growth (or fall) could displace coal BUs at
varying levels, from 1:1 to perhaps less (assuming other generation also backs down in favor of RE).
GDP growth rates and future electricity demand are among the key variables or wild cards that can
likely pull down the coal requirement compared to the base case assumption of 8 per cent GDP
growth and 100 per cent electrification, zero load-shedding, etc. Figure 2 shows the impact of GDP
on demand from not just power sector growth but non-power sector growth like for cement and
steel industries etc. A 1 per cent (absolute) reduction in anticipated GDP growth rate reduces the
coal requirement in 2020 by about ~4 per cent.

BROOKINGS INDIA | RESEARCH PAPER 072016-2
12| Coal Requirement in 2020: A Bottom-up Analysis
Figure 2: Impact of GDP on coal requirements.
Power demand is a major factor for India’s coal requirement. There are multiple future electricity
demand exercises conducted by various organisations, including by the Central Electricity Authority
(CEA). In one such exercise, CEA found that the combination of rapid capacity growth in the last
few years and modest demand growth means a fall in power plant PLFs and/or stranded (if not
abandoned) capacity. One possibility is system equilibrium that encourages retirement of older
coal plants, on environmental and/or efficiency grounds.
Figure 3 shows the complexity of calculating demand elasticity with GDP. Higher GDP growth rates
indicate a possible lower elasticity, which also cannot be separated from issues of autocorrelation
(prior year lows/highs indicate compensation the next year), the impact of the monsoon, not to
mention targeted growth of manufacturing.
Figure 3: GDP elasticity of power generation vs GDP growth rate (1998 – 2015). This is based on MoP/CEA
data for generation (BU) and Ministry of Finance data for GDP.
Other wild cards (unknowns) that could impact coal demand in the future include:
Imports for both coal and end-products such as steel. These depend on macroeconomic
conditions, global prices, etc.
1136 1181 1205 1228 1252
864 896 913 929 9467%
8%8%
8%9%
0%
1%
2%
3%
4%
5%
6%
7%
8%
9%
10%
0
200
400
600
800
1000
1200
1400
6.0% 7.0% 7.5% 8.0% 8.5%
Tota
l co
al C
AG
R (
%)
Co
al (
MT)
GDP growth rate
Total coal demand Domestic coal CAGR
0.0
0.2
0.4
0.6
0.8
1.0
1.2
1.4
1.6
0.0 2.0 4.0 6.0 8.0 10.0 12.0
GD
P e
last
icit
y o
f p
ow
er
gen
erat
ion
GDP growth rate percentage (%)
Base case

BROOKINGS INDIA | RESEARCH PAPER 072016-2
13| Coal Requirement in 2020: A Bottom-up Analysis
Growth (or not) of alternative sources of power
Demand from power distribution companies and consumers. Factors other than GDP based,
reforms such as UDAY should help improve the demand for power, but some of this is already
captured in the base assumptions on power demand.
Logistics, especially railways, can be a bottleneck. Also, the costs involved can determine if end-
users want to use domestic versus imported coal.
Ultimately, the calculations are for the demand of coal, which still leaves enormous challenges for
its supply (i.e., mining). Even the lowered estimates for demand, far lower than 1,500 MT, still leave
pressure to perform. Given that the private/captive sector has dramatically higher growth targets
for mining and has not grown anywhere near envisaged through FY’15-16, this still leaves
enormous pressure on Coal India Limited to grow output by 2020.

BROOKINGS INDIA | RESEARCH PAPER 072016-2
14| Coal Requirement in 2020: A Bottom-up Analysis
2 Introduction and objectives
In this report, we aim to examine the demand for coal in India in 2020 (using FY’14-15 as a base
year), focusing on domestic coal production. Coal is predominantly used in power production, and
hence answering this question requires a deep dive into (1) Demand for power; (2) Alternatives for
power generation, especially Renewable Energy (RE), which has ambitious growth targets in the
short term; and (3) ability to produce coal-based power (looking at virtually all the power plants
under construction/planned, examining their location, technology, status of clearances, etc.)
Clearly, this is not an easy exercise. First of all, there are inter-relationships between variables, and
hence the holistic look at this topic (one cannot do simple extrapolations only). Second, there is
enormous uncertainty, even in just a few years (forget a more complex exercise such as modelling
for 2030, the year for the carbon commitments for Paris COP21, through India’s Intended Nationally
Determined Contribution (INDC)). Therefore, we apply not just wide sensitivity analysis, but also
have released the model3 used, so that analysts/scholars/decision-makers can modify key
assumptions to visualise its impacts.
3 The model is available online at the Brookings India website:
http://www.brookings.in/coal-requirement-in-2020-a-bottom-up-analysis/

BROOKINGS INDIA | RESEARCH PAPER 072016-2
15| Coal Requirement in 2020: A Bottom-up Analysis
3 Coal in India
3.1 Coal demand and availability
Coal contributed to around 79 per cent of the total generated electricity in India in FY’14-15. The
total gross power generation stood at 1,110.2 BU4 (CEA, CEA Monthly Executive Summary Power
Sector, April, 2015) till 31 March 2015, of which 1,048.67 BU was from non-RE (mostly coal), while
61.78 BU was from RE5. Preliminary data till 31 March 2016 indicates that total generation has
increased by 5.7 per cent YoY, the comparable value in FY’15-16 was 1,173.2 BU total, with 1,107.38
BU from non-RE sources and 65.78 BU from RE (CEA, CEA Monthly Executive Summary Power
Sector, March, 2016) (CEA, CEA Monthly Executive Summary Power Sector, April, 2016). Considering
the high share of coal-powered electricity, it is safe to say that India is heavily dependent on coal
for its electricity requirements and, as we shall see later in this report, most of the coal used is
indigenous.
In addition to its use for electricity generation, coal is also the base fuel for many other industries
such as iron and steel, aluminium, and cement. The role of coal in powering multiple segments of
India’s industry puts it firmly in the vanguard for achieving India’s economic growth potential.
In the above context, the total demand for coal in India for FY’14-15 was ~787 MT (Ministry of
Coal, 2014-15), whereas the total indigenous supply of coal was in the range of ~608 MT, an
additional ~212 MT was imported in FY’14-15. Imported coal accounted for ~26 per cent of all
available6 in India in FY’14-15, despite India holding the fifth-largest coal reserve (Technology,
2014) in the world, seemingly sufficient for many decades of consumption.
3.2 Quality and quantity constraints of Indian coal types
Indian coal has a lower average GCV (gross calorific value) ~4,000 kcal/kg and a higher average
ash content ~34 per cent compared with international coal7. High ash content reduces the amount
of heat available for use per tonne coal input8. This also has negative economic implications if high
ash coal is transported long distances and also causes pollution, as combusted coal inevitably
releases some ash into the environment.
Imports from foreign destinations, mainly Indonesia (only steam/thermal coal) and Australia
(largely coking coal) are one way of compensating for lower heat value of Indian coal, on a joule
4 Billion Units (BU), or Billion kilowatt-hours (kWh). This generation is gross as from utilities and grid
connected, and excludes captive or back-up power. 5 RE as defined by India is “New Renewables” such as solar, wind, micro-hydro, and excludes traditional
hydropower. 6 Coal availability and consumption are separate, all coal that is mined/imported may not be consumed in
the same year as some is stockpiled at either the pithead or the plant stockyard. However, while recording
the total available coal, all coal that enters the system is recorded. The authors recognize this nuance for
accounting of coal in future, but given the lower level of stockpiles in FY’14-15, have not applied it for the
base year calculations. However, in 2015-16, some of the “consumption” by a sector can include measurable
stockpiles. And, this would also impact the specific coal consumption calculations. 7 Indonesian coal has ash content between 5 and 12 per cent (Indonesia, Rich coal, 2015) and Australian
coal between 8 per cent to 20 per cent (Australia, Rail Page, 2015) 8 As opposed to imported coals which has higher average GCVs and lower average ash content resulting in
higher available heat per tonne.

BROOKINGS INDIA | RESEARCH PAPER 072016-2
16| Coal Requirement in 2020: A Bottom-up Analysis
per kg basis, and this is one reason, in addition to using solely imported coal, that a number of
power plants import coal to blend with domestic coal. Also, until recently, there was a restriction
on the coal import with ash content higher than 12 per cent, which was recently amended (PTI,
2015) for the UMPPs (Ultra Mega Power Projects) to introduce competition by opening up imports
from countries other than Indonesia9.
India has insufficient coking coal reserves, which was why only 31 per cent of the total coking coal
demand in FY 2015 (~56 MT) was indigenously available. Coking coal is required for steel making,
through the blast furnace route. With increasing urbanisation, it is anticipated that there would be
an increased requirement of steel in the future (for construction and also white goods and other
products). However, insufficient domestic reserves of coking coal necessitate imports. This is
however, before considering macro demand issues for finished products, for example; Chinese
overcapacity of steel coupled with a slowdown in domestic consumption leading to surplus
capacity of finished steel in China, which may then be imported by India regardless of alleged
dumping. Table 3 captures the increase in coking coal imports between FY’11-12 and FY’14-15.
Financial year(s) FY’11-12 FY’12-13 FY’13-14 FY’14-15
Coking coal imports (MT) 31.80 35.56 36.87 43.71
Table 3: Coking coal import (FY’11-12-FY’14-15). Source: (Ministry of Coal, 2015)
3.3 Near monopoly position of public sector coal mining companies
CIL (Coal India Limited), the largest coal mining company in the world by volume and the
predominant coal miner in India (through its operating subsidiaries), along with SCCL (Singareni
Collieries Company Limited), contributed ~90 per cent to the total coal production of India (Table
4).
Organisation name
Total production in FY’14-15 (MT)
Coal India Ltd. (CIL) 494.2
Singareni Collieries Company Ltd. 52.5
Other public 20.7
Private (captive) miners 45.0
Total Production 612.4
Total consumption 608.2
Table 4: Coal Snapshot for India FY’14-15. Consumption is officially marginally lower than production, but
additional losses are often booked to the consumer. Sources: (Ministry of Coal, 2014-15); Authors estimates
The private sector mined only ~45 MT of coal in FY’14-15 (captive consumption), and the private
miners are not allowed to sell coal commercially, their production is intended for a notified end
9 Majority of Indian thermal coal/steam coal imports are from Indonesia. In FY‘14-15 India imported 70%
(118.215 MT) of steam coal/thermal coal from Indonesia (Ministry of Coal, 2014-15).

BROOKINGS INDIA | RESEARCH PAPER 072016-2
17| Coal Requirement in 2020: A Bottom-up Analysis
use only (which can be regulated: power generation for utilities—or non-regulated: power
generation for operating cement/steel/aluminium/any other notified end use based manufacturing
unit). The monopoly position of public sector firms makes coal a controlled good—without an
independent regulator—limiting private capital and even new technologies. This is despite CIL
being a publicly listed company, a step which was initially met with resistance by the miners, but
was later enforced resulting in transparency and improvement in much of its operations.
3.4 Ambitious coal production targets for the future?
The Ministry of Coal (Government of India) recently announced a target of 1.5 billion tonnes of
coal production by 2020 (IANS, 2015), of which CIL is expected to contribute 1 billion tonnes, while
the remainder is expected from the private (captive) miners. Given the very low output from private
miners today, ~45 MT of the total indigenous production (7.4 per cent of the total coal production
of India in FY’14-15), it appears a herculean, if not unfeasible, task requiring 11 times growth, or a
CAGR of ~61 per cent to reach 500 MT by 2020.
On the other hand, CIL (and the other mining PSUs) needs to increase production as well through
new capacity or increased production from existing mines. To reach its 1 billion tonne target for
2020, the public sector as an aggregate needs to grow at 12 per cent CAGR, however if the growth
target is only for CIL and not the entire public sector then the CIL (only) CAGR stands at 15 per
cent. Although CIL did achieve 8.5 per cent growth YoY in FY’15-16, its best ever, it still missed its
guidance by 12 MT, settling for 538 MT in the last fiscal (CIL, 2016). Based upon past performance,
even the 12 per cent required growth for CIL seems ambitious and possibly unlikely, especially in
the future on a larger base. A 12 per cent growth on a 500 base is a lot easier than on an 800 base.
Having said that, CIL is the only organisation that has the scale and ability to reach the targeted
coal production by 2020.
However, even before one gets to the point of discussing how to reach the target, there are
important questions that need to be answered: Are coal production targets for 2020 realistic? Does
India actually need to mine as much coal by 2020? Will it be able to absorb all of the additional
production? Is there a baseline import requirement that would still be required, even if indigenous
coal production increases?
3.5 Research objective and methodology
The objective of this paper is to examine the 1.5 billion tonnes of coal production target, using a
mathematical model to arrive at a realistic value of coal requirement in 2020. The step-wise
methodology is below:
Examine all present demand of coal from various sectors and look into possible growth
over coming years
Make data and assumption-driven extrapolations of demand across various sectors
o Use FY’14-15 as the base financial year unless stated otherwise
o Power sector dominates consumption, hence is the main focus of the study

BROOKINGS INDIA | RESEARCH PAPER 072016-2
18| Coal Requirement in 2020: A Bottom-up Analysis
o GDP growth rate is nominally pegged at 8 per cent between 2015 and 2020 (study
period), sensitivity has been used on top to analyse alternative performance scenarios
as well.
o Analyse plant-level data on power plants planned/upcoming
o Apply assumptions based on location (coastal/non-coastal), technology (sub-
critical/super-critical) and age of plants
o Utilise data from CEA, other GoI sources, news reports, and paid (subscription) industry
analysis
Among the many sectors where coal is used, the majority of coal demand (~77 per cent in FY’14-
15) is from thermal power plants for electricity generation, and the remaining sectors contribute
only ~23 per cent of coal demand in India. This research uses the actual data for FY’14-15 to arrive
at assumption-driven estimates of coal required for expected increase in thermal generation
capacity in 2020. For the remaining (~23 per cent in FY’14-15) coal demand, projections based on
sectoral growth rates, calculated from historical values of GDP elasticities of the respective sectors,
are used to complete the analysis.
For triangulating, similar calculations for coal requirement are made on the demand side, based
mainly on detailed projections of expected increase in electricity demand by 2020 keeping the
values of non-power coal consumption as is from the supply-side estimates. A comparison
between demand and supply side requirements of coal provides an objective assessment of the
coal production targets set by the government for 2020.

BROOKINGS INDIA | RESEARCH PAPER 072016-2
19| Coal Requirement in 2020: A Bottom-up Analysis
4 Power sector overview
Since the power sector (electricity) constitutes the bulk of coal demand, we begin with a detailed
overview of the current status of the power sector (especially coal-based power sector).
Figure 4 shows the change in total capacity between years 2014 and 2016 by type. Out of the
overall 11 per cent capacity increase (between 2015 and 2016), the maximum capacity addition
(absolute value terms between 2015 and 2016) was in thermal (coal) power plants (~20 GW) and
thereafter in RE (~7 GW). As on 31 March 2015, the share of renewable and nuclear was only 14
per cent by capacity. Coal-based thermal power units made up 61 per cent of the total installed
capacity (GW) at the end of FY 2015, but have a much higher share based on generation (kWh), 79
per cent10.
Figure 4: Total installed power capacity in India (2014 – 2016). Sources: (CEA, CEA Monthly Executive
Summary Power Sector, April 2014) (CEA, CEA Monthly Executive Summary Power Sector, April, 2015) (CEA, CEA
Monthly Executive Summary Power Sector, April, 2016).
10 While official data (CEA) lists total thermal share as 79 per cent of generation in FY’14-15, Almost 3.7 per
cent of this (absolute share) is from gas. For 2020, as a starting point, we assume 79 per cent of BUs from
coal for the following reasons: (1) hydropower capacity growth has been limited, and its share of generation
is likely to fall (it also varies significantly with the monsoons); (2) Gas share depends heavily on both gas
availability/pricing as well as its chosen duty city (baseload vs. peaking). If it runs as a peaker, more capacity
can be utilized, but with low PLFs; (3) this is a conservative number from a coal requirement number - any
growth of other thermal (or hydro) would decrease the coal requirement.
14
5.3
21
.8
1.2 4.8
40
.5
29
.5
16
4.6
23
.1
1.2 5.8
41
.3
31
.7
18
5.2
24
.5
1 5.8
42
.7
38
.8
0
20
40
60
80
100
120
140
160
180
200
Thermal (GW)Coal
Thermal (GW) Gas Thermal (GW)Disel
Nuclear (GW) Hydro (GW) RE (GW)
Cap
acit
y (G
W)
India total installed power capacity 2014 India total installed power capacity 2015
India total installed power capacity 2016
BROOKINGS INDIA | RESEARCH PAPER 072016-2
20| Coal Requirement in 2020: A Bottom-up Analysis
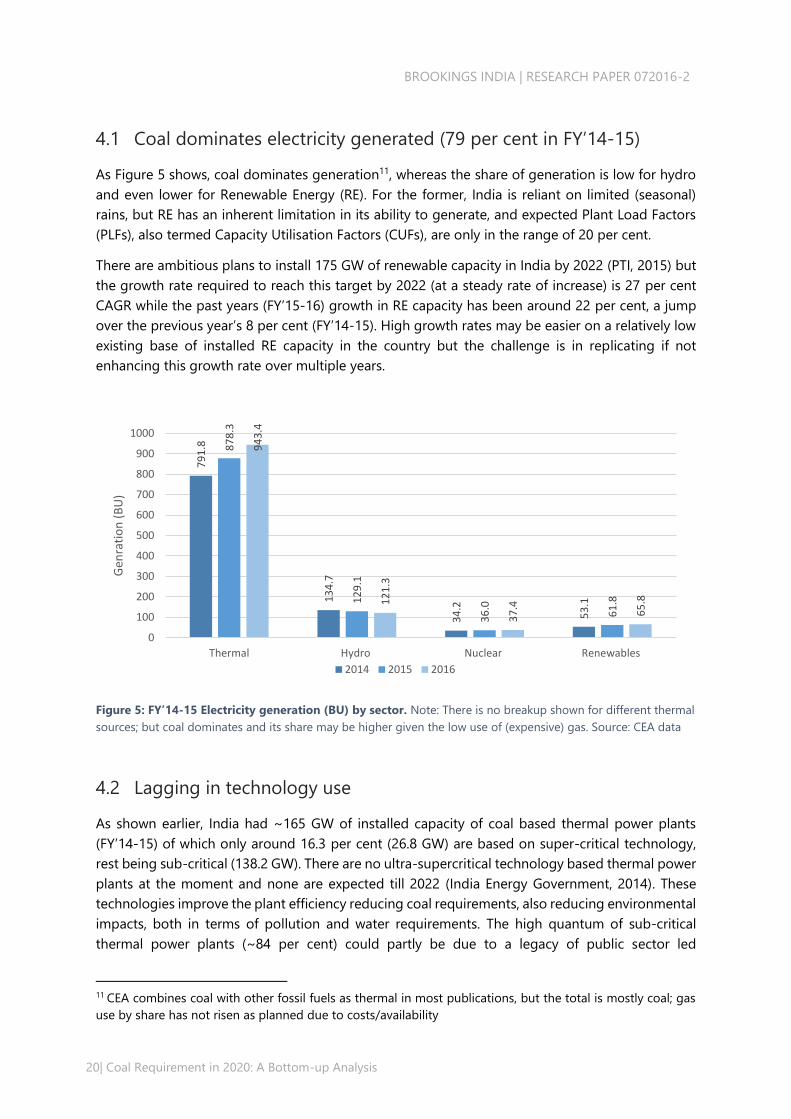
4.1 Coal dominates electricity generated (79 per cent in FY’14-15)
As Figure 5 shows, coal dominates generation11, whereas the share of generation is low for hydro
and even lower for Renewable Energy (RE). For the former, India is reliant on limited (seasonal)
rains, but RE has an inherent limitation in its ability to generate, and expected Plant Load Factors
(PLFs), also termed Capacity Utilisation Factors (CUFs), are only in the range of 20 per cent.
There are ambitious plans to install 175 GW of renewable capacity in India by 2022 (PTI, 2015) but
the growth rate required to reach this target by 2022 (at a steady rate of increase) is 27 per cent
CAGR while the past years (FY’15-16) growth in RE capacity has been around 22 per cent, a jump
over the previous year’s 8 per cent (FY’14-15). High growth rates may be easier on a relatively low
existing base of installed RE capacity in the country but the challenge is in replicating if not
enhancing this growth rate over multiple years.
Figure 5: FY’14-15 Electricity generation (BU) by sector. Note: There is no breakup shown for different thermal
sources; but coal dominates and its share may be higher given the low use of (expensive) gas. Source: CEA data
4.2 Lagging in technology use
As shown earlier, India had ~165 GW of installed capacity of coal based thermal power plants
(FY’14-15) of which only around 16.3 per cent (26.8 GW) are based on super-critical technology,
rest being sub-critical (138.2 GW). There are no ultra-supercritical technology based thermal power
plants at the moment and none are expected till 2022 (India Energy Government, 2014). These
technologies improve the plant efficiency reducing coal requirements, also reducing environmental
impacts, both in terms of pollution and water requirements. The high quantum of sub-critical
thermal power plants (~84 per cent) could partly be due to a legacy of public sector led
11 CEA combines coal with other fossil fuels as thermal in most publications, but the total is mostly coal; gas
use by share has not risen as planned due to costs/availability
79
1.8
13
4.7
34
.2
53
.1
87
8.3
12
9.1
36
.0
61
.8
94
3.4
12
1.3
37
.4
65
.80
100
200
300
400
500
600
700
800
900
1000
Thermal Hydro Nuclear Renewables
Gen
rati
on
(B
U)
2014 2015 2016

BROOKINGS INDIA | RESEARCH PAPER 072016-2
21| Coal Requirement in 2020: A Bottom-up Analysis
development and its lack of capital and innovation. The government has recently come up with a
mandate (Press Bureau, 2015) to add only super-critical thermal generation capacity subsequent
to 2017. With increased participation of the private sector and an increased focus on environmental
damage, the future for efficient boiler technologies looks promising, but India is not at the forefront
of plant technologies.
4.3 Low efficiency values for existing plants
Indian power plants lag in average operational efficiency values. The global efficiency values for
coal based thermal plants vary widely between 30 and 45 per cent (IEA, 2012), domestic plants
have managed to achieve a maximum of 33 per cent for sub-critical and 38 per cent for super-
critical (Chandra Bhushan, 2015), respectively, with the lowest efficiency values for sub-critical
power plants at ~29 per cent. A detailed 2008 study of a sample of sub-critical power plants (85)
indicated an average operational efficiency values of ~31 per cent (IGEN, 2008). To be fair, there
are technical limits to achieving higher operational efficiency values in India due to differences in
climactic conditions from global comparisons.
While efficiency is foremost limited by plant technologies (largely via operating temperatures and
pressure), there are other factors that are relevant for India, including operating duty cycle and
whether the plants operate at ~full load or not. Any plant operating at part load loses efficiency,
and this gets far worse with cycling, loading up and down (also increases the wear and tear). While
it is beyond the scope of this paper to examine such issues in detail (especially grid operator load
despatch), these are known to exist and demand greater analysis.
4.4 Future coal-based power capacity: A lot more of the same?
With a lot of new proposed thermal power plants (200+) (India Inframonitor, 2015-16) in various
stages of development and completion, there seems to be massive growth on the anvil for thermal
power capacity by 2020. Table 5 shows the projects and the capacity in the pipeline by 2020. Even
though the number of proposed future power projects is large (a total of 268 projects translating
into 325 GW), about 147 GW of the total has projected commissioning dates before 2020, as shown
below.
Project count
Capacity total (GW) Projected capacity
(GW) by 2020
Announced
(no construction reported as of
September 2015)
200 255.8 77.8
Under construction
(as of September 2015)
68 69.2 69.2
Grand total
268 325.0 147
Table 5: Summary table of upcoming projects by 2020. Source: (India Inframonitor, 2015-16)

BROOKINGS INDIA | RESEARCH PAPER 072016-2
22| Coal Requirement in 2020: A Bottom-up Analysis
However, on a closer look, many of the proposed projects are yet to achieve financial closure or
the necessary environmental and land clearances to apply for funding. Removing all such plants
from the lot throws up ~147 GW of thermal capacity expected to come up by 2020 (at various
stages of construction and/or advanced stages in the approval process), doubling the FY’14-15
thermal capacity by 2020. In Section 6.3, we examine growth of new power plants in much more
detail.
Future plants are not the same as existing plants. The overwhelming majority will be super-critical,
which means they will be more efficient. They are also not randomly distributed, and their location
determines their preferred if not optimal source of coal i.e.; not only imported versus domestic, but
also the grade of coal, transportation requirements, etc. New capacity also impacts existing capacity
in the sense that a finite demand (total coal sector PLF) need not be distributed equally across
plants by vintage or location, ownership, etc.
Taking into account historical project slippage rates, all of the capacities in Table 5 are unlikely to
make it online by 2020. Even then, the residual capacity coming online could potentially have a
material impact on the existing plant PLFs, unless older and inefficient plants are retired.

BROOKINGS INDIA | RESEARCH PAPER 072016-2
23| Coal Requirement in 2020: A Bottom-up Analysis
5 Sectoral coal consumption (power and non-power,
FY’14-15)
Coal supply to the power sector is only one facet of coal use. It is also used in other industrial
sectors, like aluminium (captive consumption for power generation), cement, steel making (coking
coal) and fertilisers. In Section 6 we explain broad assumptions on current (FY’14-15) data
underlying future coal demand calculations for power sector and non-power sector.
Sectors
Demand
Supply
Coking coal
Domestic Imports Total
Steel and allied
sector 17.0 22.3 22.3
Imports 38.4 43.7 43.7
Sub Total 55.46 22.3 43.7 66.0
Non coking
coal
Sectors Demand Supply
Domestic Imports Total
Power
(Utilities) 551.6 418.5 12512 543.5
Power
(Captive) 50.0 53.5 2613 79.6
Sponge Iron 23.9 14.7 9.214 23.9
Cement 26.1 11.4 8.115 19.5
Others 80.0 87.9 016 87.9
Sub Total 731.6 585.9 168.4 754.3
Total 787.0 608.2 212.1 820.3
Table 6: Coal used in various industries in 2015. Source: (Ministry of Coal, 2014-15), (CEA, CEA Monthly Executive
Summary Power Sector, April, 2015) and Authors’ analysis
Table 6 is a modification of the demand-supply as reported in the provisional coal statistics from
the MoC (Coal Controller Organization, 2016). Demand is a prospective estimate at the beginning
of a year, however, actual supply through the year can vary based upon multiple factors. Hence,
the demand side numbers are used as is as per official reporting by agencies (Ministry of Coal,
2014-15) while the supply side numbers are a mix of reported numbers and independent estimates
based upon inputs from various sources. Data usage protocol, and supply side estimation
methodology from various sources in is explained in Section 14 (Appendix A).
12 Expected value of imports for power utilities based upon expert consultations. 13 Expected value of imports for Captive power plants based upon expert consultations. 14 Imports attributed to sponge iron based upon demand from the sector. 15 Imports attributed to the cement sector considering availability of alternate material and also requirement
of imports. 16 Assumed to be zero in the face of excess supply from domestic sources, though there are reports of some
coal imports by brick industry today.
BROOKINGS INDIA | RESEARCH PAPER 072016-2
24| Coal Requirement in 2020: A Bottom-up Analysis
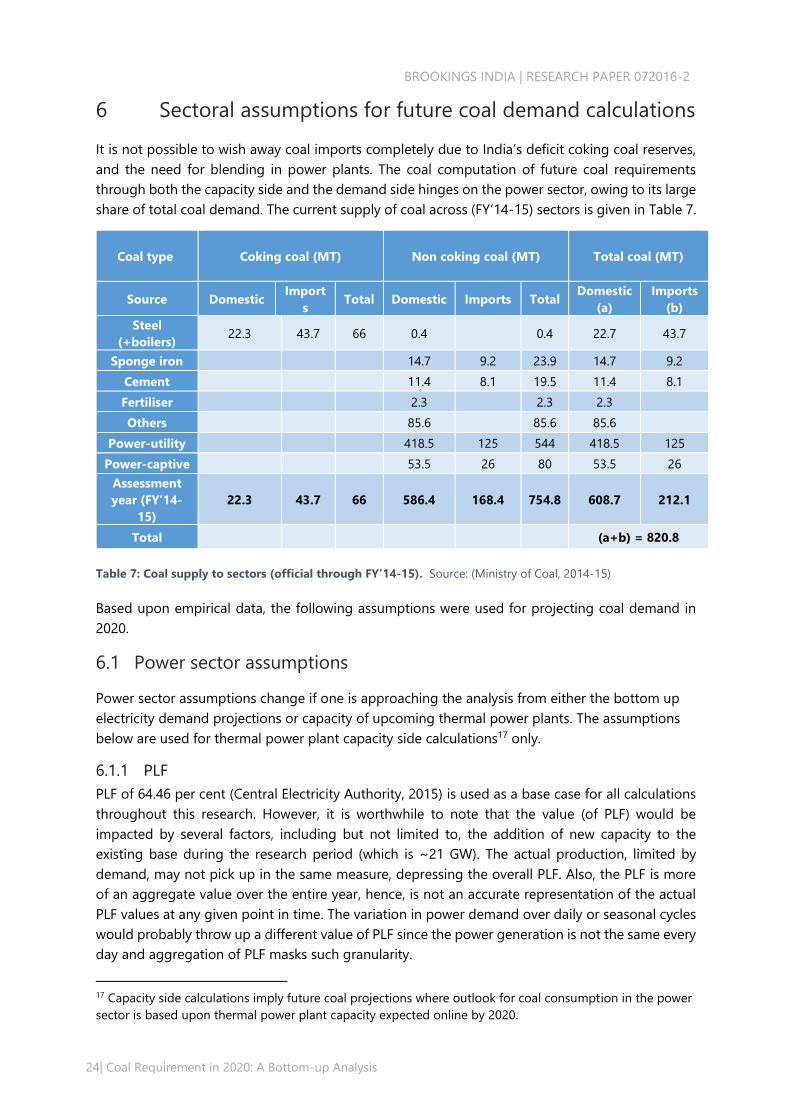
6 Sectoral assumptions for future coal demand calculations
It is not possible to wish away coal imports completely due to India’s deficit coking coal reserves,
and the need for blending in power plants. The coal computation of future coal requirements
through both the capacity side and the demand side hinges on the power sector, owing to its large
share of total coal demand. The current supply of coal across (FY’14-15) sectors is given in Table 7.
Coal type
Coking coal (MT)
Non coking coal (MT)
Total coal (MT)
Source Domestic Import
s Total Domestic Imports Total
Domestic
(a)
Imports
(b)
Steel
(+boilers) 22.3 43.7 66 0.4 0.4 22.7 43.7
Sponge iron 14.7 9.2 23.9 14.7 9.2
Cement 11.4 8.1 19.5 11.4 8.1
Fertiliser 2.3 2.3 2.3
Others 85.6 85.6 85.6
Power-utility 418.5 125 544 418.5 125
Power-captive 53.5 26 80 53.5 26
Assessment
year (FY’14-
15)
22.3 43.7 66 586.4 168.4 754.8 608.7 212.1
Total (a+b) = 820.8
Table 7: Coal supply to sectors (official through FY’14-15). Source: (Ministry of Coal, 2014-15)
Based upon empirical data, the following assumptions were used for projecting coal demand in
2020.
6.1 Power sector assumptions
Power sector assumptions change if one is approaching the analysis from either the bottom up
electricity demand projections or capacity of upcoming thermal power plants. The assumptions
below are used for thermal power plant capacity side calculations17 only.
6.1.1 PLF
PLF of 64.46 per cent (Central Electricity Authority, 2015) is used as a base case for all calculations
throughout this research. However, it is worthwhile to note that the value (of PLF) would be
impacted by several factors, including but not limited to, the addition of new capacity to the
existing base during the research period (which is ~21 GW). The actual production, limited by
demand, may not pick up in the same measure, depressing the overall PLF. Also, the PLF is more
of an aggregate value over the entire year, hence, is not an accurate representation of the actual
PLF values at any given point in time. The variation in power demand over daily or seasonal cycles
would probably throw up a different value of PLF since the power generation is not the same every
day and aggregation of PLF masks such granularity.
17 Capacity side calculations imply future coal projections where outlook for coal consumption in the power
sector is based upon thermal power plant capacity expected online by 2020.

BROOKINGS INDIA | RESEARCH PAPER 072016-2
25| Coal Requirement in 2020: A Bottom-up Analysis
6.1.2 Efficiency
6.1.2.1 Sub-critical power plants (FY’14-15)
For realistic assumptions of efficiency in thermal power plants, a public report from the CEA website
on the “Mapping of 85 pulverized coal fired thermal power generating units in different states
(Under Indo-German Energy Program-IGEN)” was analysed. The report (IGEN, 2008) studied the
operating parameters for 85 power plants of various age and capacities with data on various design
and operating parameters for each of these units. While the report is slightly dated, it covers
historical plants in detail, thus providing a good baseline for existing plants.
For the purpose of this study, raw data on three key parameters; age of the plant, design efficiency,
operating efficiency, and percentage deviation from design parameters for 74 of these plants was
used. The remaining plants (11) were removed from the analysis as they were found to be outliers
in their segment. Table 9, lists the sample plants on operating and design efficiency with weighted
averages of all parameters in the last row.
Regression Statistics
R-squared 0.814
Adjusted R-squared 0.752
Standard Error of Regression 0.009
# Cases 9
Coefficient estimates P-values
Constant 0.318 (0.000)
Average age -0.001 (0.026)
Capacity 0 (0.080)
Table 8: Regression statistics for regression between operating efficiency (dependent variable) and
average age and plant type (independent variables).
A simple regression, results shown in
Table 8, on operating efficiency (dependent variable) based upon independent variables; average
age and plant type (capacity in MW) gives an R-squared value of 0.814 and is negatively correlated
with average age and positively correlated with plant capacity. However, the P values for both are
statistically insignificant, 0.026 for average age (coefficient, -0.001) and 0.08 for capacity
(coefficient, 0), only the constant with a coefficient 0.318 with p value of 0.000 is statistically
significant. Based upon results of the regression, the null hypothesis that age and plant type have
no impact on the efficiency of a plant is accepted. Average age, however, is a better influencer
compared to the plant capacity.

BROOKINGS INDIA | RESEARCH PAPER 072016-2
26| Coal Requirement in 2020: A Bottom-up Analysis
Plant type
(MW)
Total
Number
Plants
Averag
e age
Design
Efficiency (a)
Operating
Efficiency (b)
Percentage
difference
((b)/(a))%
500 MW 5 14 38.07% 33.51% 88.02%
250 MW 4 8 37.32% 31.98% 85.70%
210
MW(2000+ ) 3 2 37.22% 33.66% 85.86%
210 MW
(1990-1999) 18 14 36.73% 32.48% 88.41%
210 MW (till
1989) 27 24 36.15% 31.04% 90.43%
140 MW 3 38 35.92% 30.74% 83.90%
120-125 MW 7 29 35.52% 29.33% 85.60%
100-110 MW
(age 20s) 3 24 36.67% 30.12% 82.59%
100-110 MW
(age 30+) 4 33 35.04% 28.72% 81.98%
Weighted
Averages (74/85) 20.66 36.42% 31.16%
Table 9: Analysis on operating and design efficiencies estimated for 74 of the 85 power plants covered in
the report by IGEN. This removes 11 outliers for the above calculations. SOURCE: (IGEN, 2008)
Based on the analysis in Table 9, an average value of 31.16 per cent for operating efficiency of sub-
critical plants was used for further calculations.
6.1.2.2 Future sub-critical power plants (expected by 2020)
A more efficient scenario with a higher efficiency for the upcoming sub-critical power plants was
considered, separating the current efficiencies and future values to account for increase in system
efficiency by a combination of retiring older plants and better efficiencies in general for the newer
plants. An efficiency value of 34 per cent was considered, this is a conservative value and a
sensitivity on top of this has been built into the model (explained later in this report).
6.1.2.3 Super-critical power plants (FY’14-15)
In the absence of any report on the actual operating efficiencies of super-critical power plants, the
CSE report titled “Heat on Power - Green rating of coal-based thermal power plants” was used
(Chandra Bhushan, 2015) with a value of 38 per cent efficiency for super-critical plants.
6.1.2.4 Future super-critical power plants (expected by 2020)
Similar to the assignment of sub-critical power plants, a different value for efficiency of upcoming
super-critical power plants was considered, separating the current and future values to account for
overall efficiency gains in the system with newer capacities and better operational discipline. A
marginal increase in efficiency value by 0.5 per cent to reach a total of 38.5 per cent over current
super-critical plants was considered. This is a conservative value and a sensitivity on top of this has
been built into the model—elaborated subsequently.

BROOKINGS INDIA | RESEARCH PAPER 072016-2
27| Coal Requirement in 2020: A Bottom-up Analysis
6.1.2.5 Average grade of coal and specific coal consumption
The specific coal consumption in India (kilograms of coal required per kWh generation) varies
widely by factors including technology, size, vintage, and operations (loading compared to nominal
capacity). The recent CSE report titled “Heat on Power - Green rating of coal-based thermal power
plants” (Chandra Bhushan, 2015) used a sample of 47 power plants—a representative mix of private
and the public sector (central/state) units, covering half of the total capacity in 16 states—to study
coal power’s efficiency and environmental impact. The report cited variations in the specific coal
consumption for plants based upon coal type (imported coal based power plants reporting lower
specific coal consumption), use of complementary fuel (like corex gas, a by-product of steel
making) etc. however, the average specific coal consumption across the country was reported to
be in the range of 0.71 Kg/Kwh (for FY’12-13, page 32 of the report).
For this research, specific coal consumption was calculated by segregating imports and domestic
coal in FY’14-15. Only utility grade electricity was considered for calculations, leaving aside the
captive capacities. Boundary conditions were set based upon known values of coal consumption in
power sector;
418.5 MT of domestic coal and 125 MT of imported coal,
technology split of generating capacities—137.8 GW sub-critical and 26.8 GW super-critical,
average efficiency values of sub-critical and super-critical power plants—31 per cent for sub-
critical and 38 per cent for super-critical and,
plant PLFs on annual average basis – 64.46 per cent
The boundary conditions helped iterate assumptions of average GCV values of respective coal
types to find the optimal value of specific coal consumption.
Based on the above assumptions the specific coal consumption value was calculated, shown in
Table 10.
Sub-critical
Super-critical
Specific coal
consumption GCV
Coal grade
(India
equivalent)
Specific coal
consumption GCV
Coal grade
(India
equivalent)
Kg/Kwh Kcal/KG Rating Kg/Kwh Kcal/KG Rating
Imported
coal 0.505 5,500 0.412 5,500
Domestic
coal 0.642 4,325.3
G11 (Upper
Bound,
4,300)
0.523 4,325.3
G11 (Upper
Bound,
4,300)
Table 10: GCV calculations for sub-critical and super-critical coals.
The calculated values of specific coal consumption and grade of coal (G1-G17) were applied to the
model for use in future demand/capacity based coal calculations. A comparison of the GCV values
for imported and domestic coal throws up a comparative ratio. The ratio (1:1.27) supplies the
BROOKINGS INDIA | RESEARCH PAPER 072016-2
28| Coal Requirement in 2020: A Bottom-up Analysis
quantum increase in domestic coal required (in tonnes) for each tonne of imported coal being
removed from the system, to keep the heat value of coal in the system constant.
It is also important to note the following in the context of the above calculations:
The values of imported coal consumed in the power sector in FY’14-15 is an assumption, in the
absence of exact data available
The value of efficiency also impacts coal grade on an aggregate basis and this is also an
assumption, although based on a 2008 report (IGEN, 2008) for sub-critical power plants the
value for super-critical power plants is also based upon a CSE report (Chandra Bhushan, 2015)
The GCV values though calculated, the actual value used (G11) for future calculations are a bit
different. Reasons include sub and cross-category splits in usage of coal, accounting for losses
in the system (coal transport), disputes in coal grades delivered, etc.
6.1.3 Coal leakage
Leakage is defined as the coal lost in transit and pilferage, based on the material difference between
the demand and supply of coal reported in FY’14-15 (Ministry of Coal, 2014-15) and expert views
on the amount of coal lost to theft/spillage/fire, during storage, transportation, and loading-
unloading. A 4 per cent value to the leakage of coal was applied in the model (comparing mining
to consumption by users).
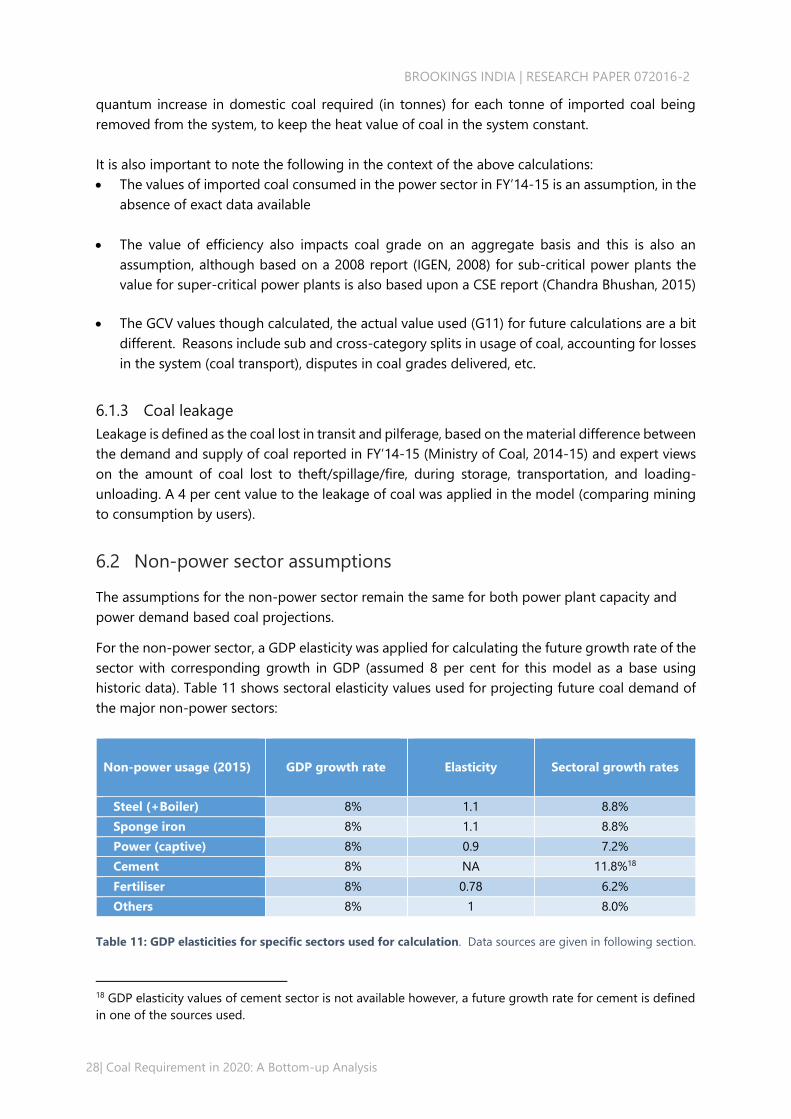
6.2 Non-power sector assumptions
The assumptions for the non-power sector remain the same for both power plant capacity and
power demand based coal projections.
For the non-power sector, a GDP elasticity was applied for calculating the future growth rate of the
sector with corresponding growth in GDP (assumed 8 per cent for this model as a base using
historic data). Table 11 shows sectoral elasticity values used for projecting future coal demand of
the major non-power sectors:
Non-power usage (2015)
GDP growth rate
Elasticity
Sectoral growth rates
Steel (+Boiler) 8% 1.1 8.8%
Sponge iron 8% 1.1 8.8%
Power (captive) 8% 0.9 7.2%
Cement 8% NA 11.8%18
Fertiliser 8% 0.78 6.2%
Others 8% 1 8.0%
Table 11: GDP elasticities for specific sectors used for calculation. Data sources are given in following section.
18 GDP elasticity values of cement sector is not available however, a future growth rate for cement is defined
in one of the sources used.

BROOKINGS INDIA | RESEARCH PAPER 072016-2
29| Coal Requirement in 2020: A Bottom-up Analysis
6.2.1 Steel (+ boiler)
Steel is one of the major infrastructure sectors that is expected to grow with increased demand for
goods and construction. The historical GDP elasticity of 1.1 according to sources (Steel, 2016) lays
the groundwork for a higher GDP growth rate through 2020.
6.2.2 Captive Power
CEA monthly reports do not cover captive power plants in great detail except for capacity details.
Captive power is generated by a power plant for a fixed End Use (EU), and does not feed into the
grid. Notable large-scale users include industries like aluminium, steel etc. The historical growth
rate for the overall power sector had a GDP elasticity greater than 1 (Planning Commision, 2014)
however, the GDP elasticity of electricity reduced from 1.3 to 1.06 between 1981 and 2001, and
recent data (albeit with a shorter time horizon) show even lower elasticities. It is further expected
to decline as GDP grows, therefore, to ensure a conservative estimate it is assumed at 0.9 for the
future. Section 9.1.1 on power demand goes into more detail.
6.2.3 Cement
The cement industry in India is set to grow with the increase in the need for urban housing.
However, the cement industry can and does use alternative fuels as opposed to many industries
that do not have such flexibility. These choices are based on a combination of pricing, availability
of alternatives, and plant designs. In case of any availability or price concerns related to coal, it can
shift to alternative sources of fuel. A forecasted growth rate of 11.58 per cent (India Cement Review,
2016), has been used for this sector in the absence of GDP elasticity data.
6.2.4 Fertiliser
The fertiliser sector, though comparatively not a major consumer of coal, sits at an impactful
position in the economy. However, the use of coal for this sector is slated to fall below expected
GDP growth rates (IGIDR, 2016) hence, a less than 1 base value for GDP elasticity has been used.
6.2.5 Other users of coal
The official segment titled “Others” includes a number of applications that have been clubbed
together including brick kiln works, basic metal works etc. While, after the new coal distribution
policy in 2007 (MoC, 2016), the distribution of coal to non-bulk consumers has been liberalised (for
those that have a demand 4,200 Metric Tonnes or less per annum the state government arranges
coal through CIL), some imports in this sector cannot be ruled out. For the purpose of this study,
however, no imports were attributed to this segment (which may not necessarily hold as there are
reports of brick kiln industry importing high sulphur American coal). To account for multiple sectors
and industries a uniform peg with GDP growth rate at 1:1 has been considered for the base case.
6.3 Calculating power capacity expected online till 2020
As discussed in Section 4.4, the anticipated future capacities are large. However, adding a layer to
the analysis, in addition to the cut off for projects expected to come up by 2020, there is a firming

BROOKINGS INDIA | RESEARCH PAPER 072016-2
30| Coal Requirement in 2020: A Bottom-up Analysis
up of capacities by binning in buckets based upon their progress on the construction/approval
process. Upcoming capacities were binned (147 GW) on the basis of their status on three key
variables and one additional exogenous variable (explained later) impacting the project approval
and commissioning. Weights have been assigned to the three key factors19 (Table 12):
Current status of land acquisition
Current status of environmental clearance
Current status of financial closure
With a 0/1 for each of the above based upon status: in-progress/achieved, respectively.
Environmental clearance is de facto first among equals. It is necessary for closing land acquisition
and securing funding and has, therefore, been assigned the highest possible weightage (35 per
cent) among the three key impact variables. A step down of 5 per cent for the second highest
weighted variable: land acquisition (weightage of 30 per cent), and another 5 per cent step down
for the variable financial closure (weightage of 25 per cent), together summing up to 90 per cent.
The rank ordering of the impact variables represents the potential impact that they have on the
successful execution of a thermal power project. The residual (10 per cent) has been attributed to
an exogenous positive variable (0/1 defined as the sum of all residual events, without overt
individual probabilities, that can impact the project commissioning), absence of which (0) implies
that the project will not go through even after securing clearance on all three key variables. An
example of plausible events that could stall the project could be local protests by villagers against
land compensation, etc.
To ensure a conservative estimate of future power plant projections, the exogenous variable20 has
been assumed “0” for all categories, except the category 0-0-0, it is expected that some of these,
in spite of being far away from project closure, may still might manage to go through at a later
stage. This does not imply that projects without clearances can get through, though a positive
prospect for these projects has been considered to assign probabilities in the aforementioned
fashion.
19 Those plants that are under construction (after having secured all clearances) have a higher probability of
coming up in future as opposed to those that are yet to commence construction (also have secured all the
clearances). Since both of these categories have been clubbed together for assigning probabilities, it is
important to note that a higher probability should be assigned to those under construction and lower value
to those without. However, this aspect is reflected in the sensitivity (as opposed to the base case) later on in
the report. 20 Authors have assigned a low but finite probability under the new exogenous variable not because of
randomness per se but also because there might be plants which have some clearances (and/or political
support) but aren’t capture in the database(s). CEA itself found additional capacity coming online the current
Plan (2012-17) due to things slipping below its radar.

BROOKINGS INDIA | RESEARCH PAPER 072016-2
31| Coal Requirement in 2020: A Bottom-up Analysis
Methodology
Weightage Respective clearance status (2015) 2020
Environmental
clearance 35% 1 1 1 1 1 0 0 0 0
Overall
Land
acquisition 30% 1 1 1 0 0 1 1 0 0
Financial
closure 25% 1 1 0 1 0 1 0 1 0
Exogenous
support
variable
10% 1 0 0 0 0 0 0 0 1
1-Slippage % 100% 100% 90% 65% 60% 35% 55% 30% 25% 10% 75%
Slippage %21 0% 10% 35% 40% 65% 45% 70% 75% 90% 25%
Projected
maximum
capacity
addition by
type [GW]
- 89.9 14.0 20.3 4.6 7.2 4.9 1.4 4.7 146.9
Private - 57.5 5.3 11.8 4.6 5.9 4.922 1.4 3.1 94.4
Public - 32.4 8.7 8.5 1.3 1.6 52.5
Possible
online (After
slippage)
- 80.9 9.1 12.2 1.6 4.0 1.5 0.4 0.5 110.0
Table 12: Methodology for filtering various projects on the status of completion of their respective
approvals.
Those plants that have all three approvals in place (1,1,1) are weighted at the highest probability
(and thus lowest “slippage”) of getting commissioned, while those that have none have the lowest
probability of coming online (0,0,0), others being in between (0,1,0 or 1,0,0 or 0,0,1).
After ranking the prospective capacities upon the binary probabilities of the three causative
variables, duly weighted, a slippage rate was found (Table 12) by summing up the weights of the
respective variable status (0/1) and an order for binning thus defined. A differential slippage rate
(between minimum 10 per cent to maximum 90 per cent, for plants that have maximum clearances
and plants with minimum clearances respectively) was applied to weigh the projected power
capacity expected online by 2020. With the applied assumptions on slippage rates, the computed
average slippage rate for the entire 147 GW was 25 per cent23 giving a most likely value of 11024
(+5) GW of power capacity expected online till 2020.
21 Slippage rate, is defined as the percentage of total projects that are expected to fall behind schedule and
not come up in the time span planned for their execution. These projects may come up later but for the
analysis timeframe such capacities are discounted from calculation.
23 The calculated slippage rate is an approximation and is close to actual slippage rate for last five years –
reported on the basis of CEA data and expert interviews with subject matter experts. 24 An additional 5 GW of capacity has been added to the total (sub-critical) to account for new projects online
between the beginning of the research period and the research closing date. The total capacity thus becomes
115 GW by 2020.

BROOKINGS INDIA | RESEARCH PAPER 072016-2
32| Coal Requirement in 2020: A Bottom-up Analysis
While one may question how a plant can come on stream in five years if it lacks one or more of
three key clearances, it would be good to note that these data points are based on clearances prior
to 2015 in many cases. Some of the (partial) clearances came even earlier, and there is a likelihood
that those already obtained, or are close to being obtained, haven’t reflected into public and private
databases, till the point where data is assessed for this report.
6.4 Future coal imports (calculated)
Assumptions for future imports of coal for the power sector are based upon multiple factors
elaborated in the section below. Future imports for non-power sectors are considered to grow
proportionately to maintain the current ratio between indigenous coal and imports.
Computation methodology for power sector imports is explained below.
6.4.1 Power plants segmentation methodology
At the first level of analysis power capacities were listed and then classified into two parts:
Current capacity FY’14-15 (164.6 GW)
Additional future capacity by 2020 (11525 GW)
The capacities (present and upcoming) were then arranged in a matrix based upon the following
key criterion:
Location (coastal states/non-coastal states),
Technology (sub-critical/super-critical) and,
Coal usage (running on imported coal or domestic coal).
The above classifications are not mutually exclusive, implying a non-coastal power plant may be
either sub-critical or super-critical and may/may not be using blended coal for fuel. The
segmentation applies a layered approach to calibrating the probability of future coal imports as
newer power plants are commissioned and also pegs a number to the plausible imports for the
existing power plants in future (2020). On the basis of these criteria and assumptions explained
below, the source of coal for different plants was estimated.
6.4.2 Procedure for segmentation
6.4.2.1 Present capacities
All the present capacities, plant level, were individually marked on the basis of their spatial location
(latitude/longitude), capacities (GW), technology used (sub-critical/super-critical) and distance
(KM) from the nearest port.26 Among the present capacities those in states that have a coastline
(Andhra Pradesh, Gujarat, Karnataka, Maharashtra, Odisha, Tamil Nadu, and West Bengal) were
25 The calculation methodology for expected capacity is explained in Section 6.3, however to reiterate the
5GW additional capacity is attributable to the capacity already commissioned between 31 March 2015 and
30 September 2015, the research period for this study. 26As the crow flies/actual distance through marked roads, based on available information on google maps
and various other online sources
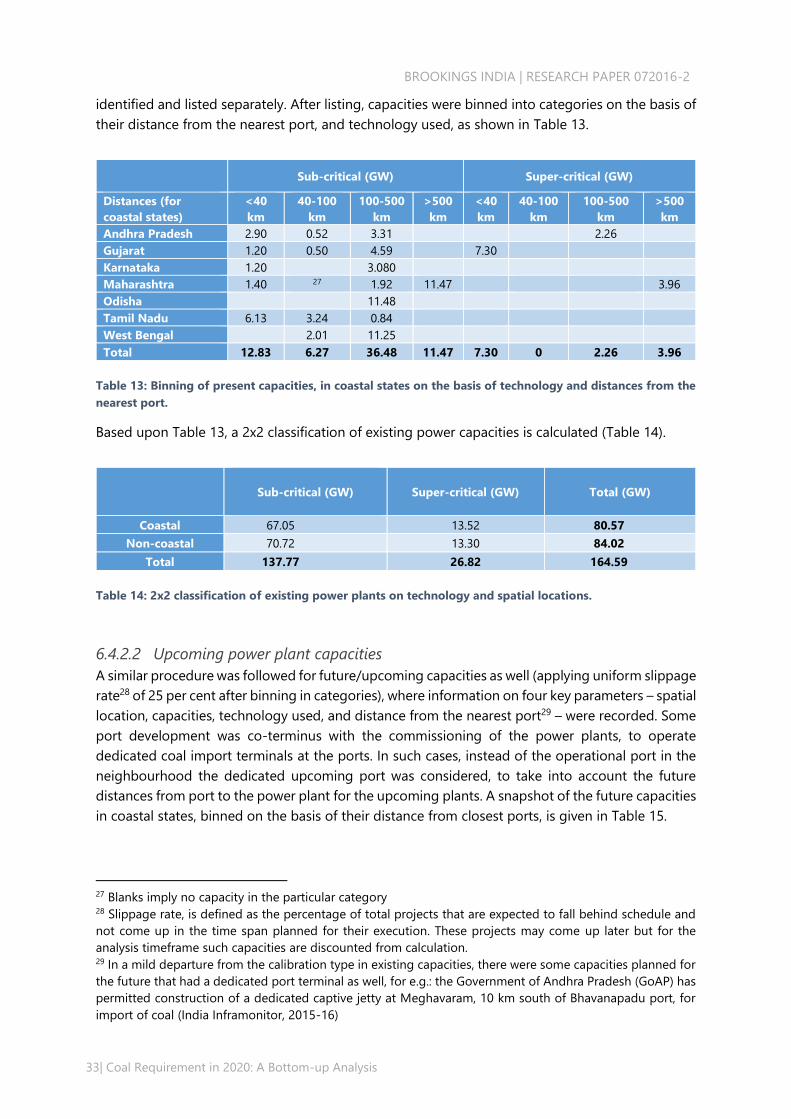
BROOKINGS INDIA | RESEARCH PAPER 072016-2
33| Coal Requirement in 2020: A Bottom-up Analysis
identified and listed separately. After listing, capacities were binned into categories on the basis of
their distance from the nearest port, and technology used, as shown in Table 13.
Sub-critical (GW) Super-critical (GW)
Distances (for
coastal states)
<40
km
40-100
km
100-500
km
>500
km
<40
km
40-100
km
100-500
km
>500
km
Andhra Pradesh 2.90 0.52 3.31 2.26
Gujarat 1.20 0.50 4.59 7.30
Karnataka 1.20 3.080
Maharashtra 1.40 27 1.92 11.47 3.96
Odisha 11.48
Tamil Nadu 6.13 3.24 0.84
West Bengal 2.01 11.25
Total 12.83 6.27 36.48 11.47 7.30 0 2.26 3.96
Table 13: Binning of present capacities, in coastal states on the basis of technology and distances from the
nearest port.
Based upon Table 13, a 2x2 classification of existing power capacities is calculated (Table 14).
Sub-critical (GW)
Super-critical (GW) Total (GW)
Coastal 67.05 13.52 80.57
Non-coastal 70.72 13.30 84.02
Total 137.77 26.82 164.59
Table 14: 2x2 classification of existing power plants on technology and spatial locations.
6.4.2.2 Upcoming power plant capacities
A similar procedure was followed for future/upcoming capacities as well (applying uniform slippage
rate28 of 25 per cent after binning in categories), where information on four key parameters – spatial
location, capacities, technology used, and distance from the nearest port29 – were recorded. Some
port development was co-terminus with the commissioning of the power plants, to operate
dedicated coal import terminals at the ports. In such cases, instead of the operational port in the
neighbourhood the dedicated upcoming port was considered, to take into account the future
distances from port to the power plant for the upcoming plants. A snapshot of the future capacities
in coastal states, binned on the basis of their distance from closest ports, is given in Table 15.
27 Blanks imply no capacity in the particular category 28 Slippage rate, is defined as the percentage of total projects that are expected to fall behind schedule and
not come up in the time span planned for their execution. These projects may come up later but for the
analysis timeframe such capacities are discounted from calculation. 29 In a mild departure from the calibration type in existing capacities, there were some capacities planned for
the future that had a dedicated port terminal as well, for e.g.: the Government of Andhra Pradesh (GoAP) has
permitted construction of a dedicated captive jetty at Meghavaram, 10 km south of Bhavanapadu port, for
import of coal (India Inframonitor, 2015-16)
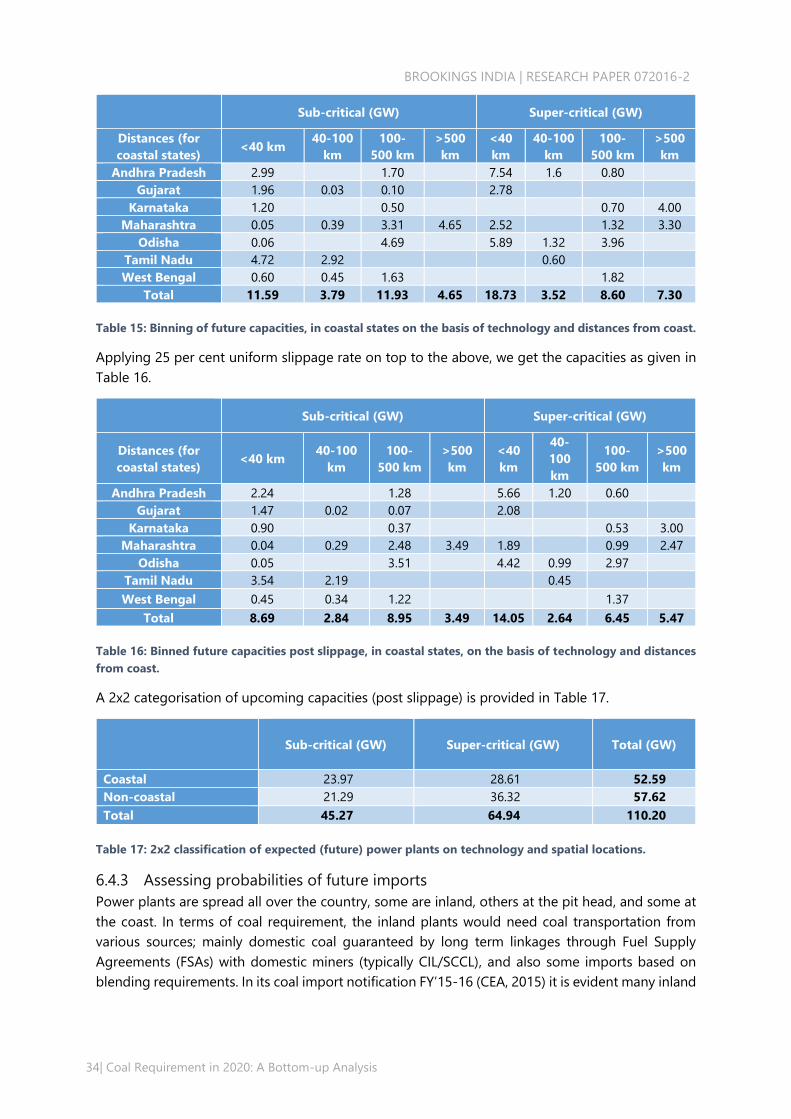
BROOKINGS INDIA | RESEARCH PAPER 072016-2
34| Coal Requirement in 2020: A Bottom-up Analysis
Sub-critical (GW) Super-critical (GW)
Distances (for
coastal states) <40 km
40-100
km
100-
500 km
>500
km
<40
km
40-100
km
100-
500 km
>500
km
Andhra Pradesh 2.99 1.70 7.54 1.6 0.80
Gujarat 1.96 0.03 0.10 2.78
Karnataka 1.20 0.50 0.70 4.00
Maharashtra 0.05 0.39 3.31 4.65 2.52 1.32 3.30
Odisha 0.06 4.69 5.89 1.32 3.96
Tamil Nadu 4.72 2.92 0.60
West Bengal 0.60 0.45 1.63 1.82
Total 11.59 3.79 11.93 4.65 18.73 3.52 8.60 7.30
Table 15: Binning of future capacities, in coastal states on the basis of technology and distances from coast.
Applying 25 per cent uniform slippage rate on top to the above, we get the capacities as given in
Table 16.
Sub-critical (GW) Super-critical (GW)
Distances (for
coastal states) <40 km
40-100
km
100-
500 km
>500
km
<40
km
40-
100
km
100-
500 km
>500
km
Andhra Pradesh 2.24 1.28 5.66 1.20 0.60
Gujarat 1.47 0.02 0.07 2.08
Karnataka 0.90 0.37 0.53 3.00
Maharashtra 0.04 0.29 2.48 3.49 1.89 0.99 2.47
Odisha 0.05 3.51 4.42 0.99 2.97
Tamil Nadu 3.54 2.19 0.45
West Bengal 0.45 0.34 1.22 1.37
Total 8.69 2.84 8.95 3.49 14.05 2.64 6.45 5.47
Table 16: Binned future capacities post slippage, in coastal states, on the basis of technology and distances
from coast.
A 2x2 categorisation of upcoming capacities (post slippage) is provided in Table 17.
Sub-critical (GW)
Super-critical (GW)
Total (GW)
Coastal 23.97 28.61 52.59
Non-coastal 21.29 36.32 57.62
Total 45.27 64.94 110.20
Table 17: 2x2 classification of expected (future) power plants on technology and spatial locations.
6.4.3 Assessing probabilities of future imports
Power plants are spread all over the country, some are inland, others at the pit head, and some at
the coast. In terms of coal requirement, the inland plants would need coal transportation from
various sources; mainly domestic coal guaranteed by long term linkages through Fuel Supply
Agreements (FSAs) with domestic miners (typically CIL/SCCL), and also some imports based on
blending requirements. In its coal import notification FY’15-16 (CEA, 2015) it is evident many inland

BROOKINGS INDIA | RESEARCH PAPER 072016-2
35| Coal Requirement in 2020: A Bottom-up Analysis
plants blend imported coal to their feed. Blending with imported coal could be required by a power
plant due to multiple reasons:
Technology restrictions: boiler technology used by a power plant could be built for a specific
feed type mandating imports for matching the required fuel characteristics,
Economic reasons: imported coal could be cheaper on a per unit energy basis,
Environmental reasons: blending of low ash imported coal (till recently only coal with ash
content of 12 per cent and less was allowed for imports (PTI, 2015)), reducing environmental
pollution load from usage of high ash domestic coal.
Pit head power plants are typically built to use coal available at the mine itself as it saves
transportation costs. However, depending on the variance in the quality of mined coal over the life
of mine there may still be some import requirements in the future.
Coastal power plants,30 are at the other end of the spectrum. By virtue of being on the coast/near
the coast, the plants are most likely to be designed to run on imported coal. The caveat being, even
in a coastal state those power plants far from the coast (>500 km) may benefit from their proximity
to a mine (if at all) and may like to blend, if not entirely run on domestic coal. The examples of
entirely imported coal dependent plants are: Mundra Thermal Power Plant (Adani) and Mundra
UMPP (Tata).
6.4.3.1 Procedure for allotting probabilities (imports for coastal power plants)
The import probabilities in Table 19 are based on the scenario where maximum (import) probability
is assigned to power plants closest to the ports. Thereafter, within a technology type (sub-
critical/super-critical) probability of import is expected to decrease with an increase in distance
from the port. A step value of 25 per cent has been assigned in reducing probabilities from left to
right within a technology type. Among the states (vertically) the probability of imports decreases
with proximity to coal bearing regions (availability of indigenous coal) hence the lower assigned
probabilities for Odisha and West Bengal. Based upon above, AP should also get a lower rating for
plants within 40 km however, with the reorganisation of the state, Telangana now has the mineral
bearing areas of the state, whereas the distance of Khammam (the border of AP and Telangana
and also a coal bearing district of Telangana) from port is ~200 km hence, the higher probability
of imports for AP.
6.4.3.2 Incorporating port capacity and distances
The top 20 ports that handle almost 94 per cent of the total coal imports in the country are given
in Table 18.
30 The analysis starts by taking into account all the states with a coastline. The upcoming capacities in these
states are then binned in categories based upon the distance from the port. Based upon distance from the
(nearest) port the power plant may actually be far inland as opposed to being close to the port. Such nuances
have been incorporated in the analysis.
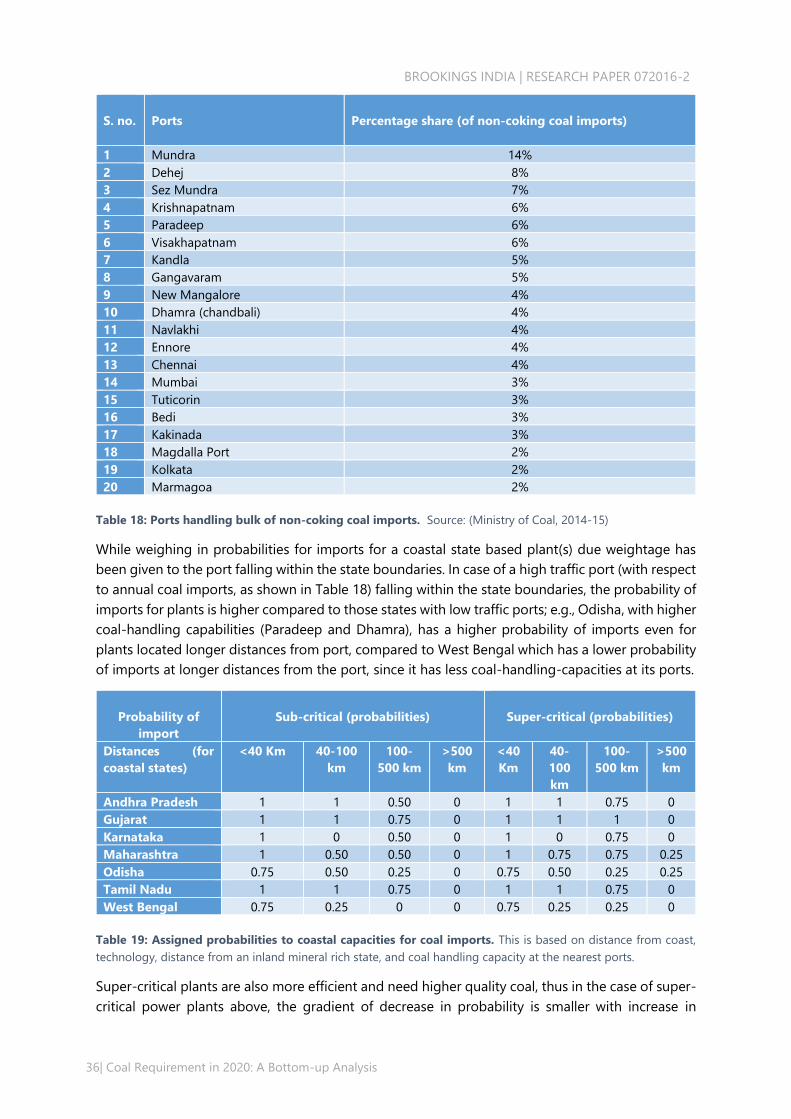
BROOKINGS INDIA | RESEARCH PAPER 072016-2
36| Coal Requirement in 2020: A Bottom-up Analysis
S. no.
Ports
Percentage share (of non-coking coal imports)
1 Mundra 14%
2 Dehej 8%
3 Sez Mundra 7%
4 Krishnapatnam 6%
5 Paradeep 6%
6 Visakhapatnam 6%
7 Kandla 5%
8 Gangavaram 5%
9 New Mangalore 4%
10 Dhamra (chandbali) 4%
11 Navlakhi 4%
12 Ennore 4%
13 Chennai 4%
14 Mumbai 3%
15 Tuticorin 3%
16 Bedi 3%
17 Kakinada 3%
18 Magdalla Port 2%
19 Kolkata 2%
20 Marmagoa 2%
Table 18: Ports handling bulk of non-coking coal imports. Source: (Ministry of Coal, 2014-15)
While weighing in probabilities for imports for a coastal state based plant(s) due weightage has
been given to the port falling within the state boundaries. In case of a high traffic port (with respect
to annual coal imports, as shown in Table 18) falling within the state boundaries, the probability of
imports for plants is higher compared to those states with low traffic ports; e.g., Odisha, with higher
coal-handling capabilities (Paradeep and Dhamra), has a higher probability of imports even for
plants located longer distances from port, compared to West Bengal which has a lower probability
of imports at longer distances from the port, since it has less coal-handling-capacities at its ports.
Probability of
import
Sub-critical (probabilities)
Super-critical (probabilities)
Distances (for
coastal states)
<40 Km 40-100
km
100-
500 km
>500
km
<40
Km
40-
100
km
100-
500 km
>500
km
Andhra Pradesh 1 1 0.50 0 1 1 0.75 0
Gujarat 1 1 0.75 0 1 1 1 0
Karnataka 1 0 0.50 0 1 0 0.75 0
Maharashtra 1 0.50 0.50 0 1 0.75 0.75 0.25
Odisha 0.75 0.50 0.25 0 0.75 0.50 0.25 0.25
Tamil Nadu 1 1 0.75 0 1 1 0.75 0
West Bengal 0.75 0.25 0 0 0.75 0.25 0.25 0
Table 19: Assigned probabilities to coastal capacities for coal imports. This is based on distance from coast,
technology, distance from an inland mineral rich state, and coal handling capacity at the nearest ports.
Super-critical plants are also more efficient and need higher quality coal, thus in the case of super-
critical power plants above, the gradient of decrease in probability is smaller with increase in

BROOKINGS INDIA | RESEARCH PAPER 072016-2
37| Coal Requirement in 2020: A Bottom-up Analysis
distances from the ports (left to right). While we do not claim these exact block numbers will mirror
reality, these are indicative and some errors would even out, especially, given that these are plant-
level characterisations. Operations (PLF) are also important for calculating the coal requirements,
which will vary by plant.
6.4.3.3 Calculating future capacities on imported coal
Upon multiplication of binned present capacities (Table 13) with binned probability distribution
of imports (Table 19); and binned future capacities (Table 16) with binned probability of imports
(Table 19) we get the capacity of existing plants expected to run on domestic versus imported
coal in the future (2020) (Table 20) and the capacity of upcoming plants expected to run on
domestic versus imported coal for a base calculation (Table 21).
Capacity on domestic coal (GW)
Capacity on imported coal (GW) Total (GW)
Sub-critical Super-critical Sub-critical Super-critical
Coastal 38.4 3.5 28.7 10.0 80.6
Non-coastal 70.7 13.3 0.0 0.0 84.0
Grand total 109.1 16.8 28.7 10.0 164.6
Table 20: Current coal power plant capacities expected to import coal in 2020.
Capacity on domestic coal (GW)
Capacity on imported coal (GW) Total GW)
Sub-critical Super-
critical
Sub-critical Super-critical
Coastal 10.0 10.2 14.0 18.4 52.6
Non-coastal 21.3 36.3 0.0 0.0 57.6
Grand total 31.3 46.6 14.0 18.4 110.2
Table 21: Future capacities expected to import coal in 2020. Assumes slippage rates as discussed before.
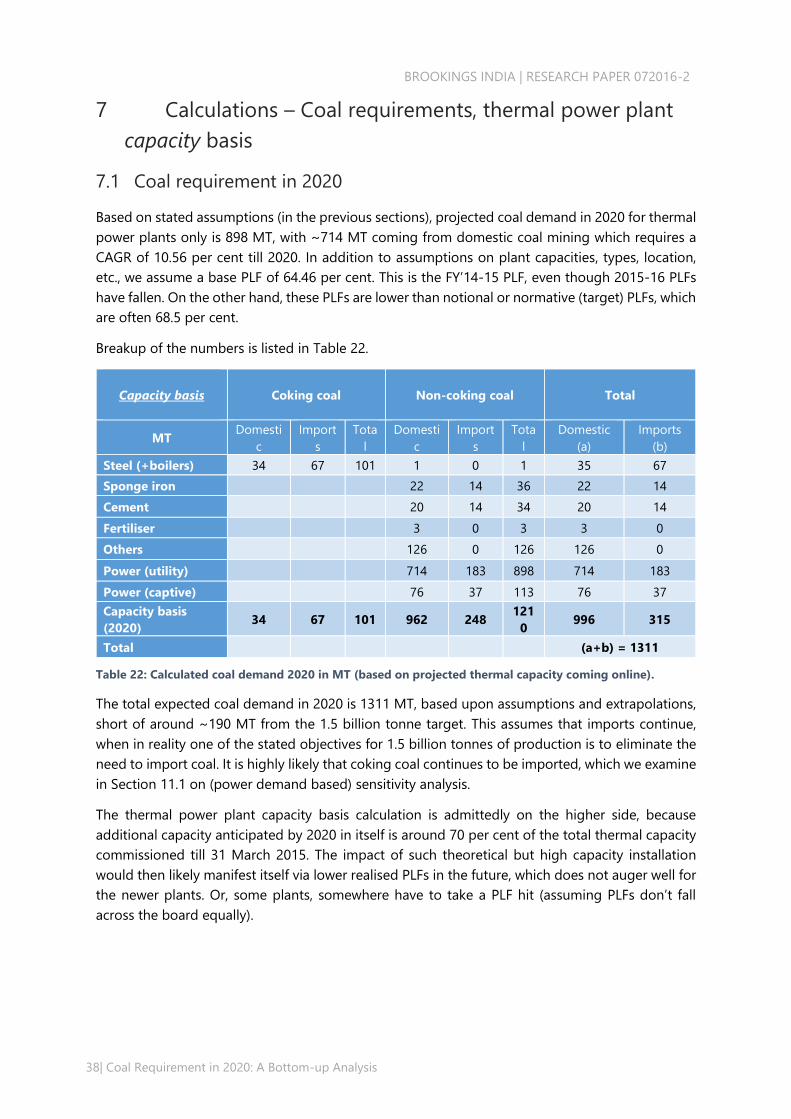
BROOKINGS INDIA | RESEARCH PAPER 072016-2
38| Coal Requirement in 2020: A Bottom-up Analysis
7 Calculations – Coal requirements, thermal power plant
capacity basis
7.1 Coal requirement in 2020
Based on stated assumptions (in the previous sections), projected coal demand in 2020 for thermal
power plants only is 898 MT, with ~714 MT coming from domestic coal mining which requires a
CAGR of 10.56 per cent till 2020. In addition to assumptions on plant capacities, types, location,
etc., we assume a base PLF of 64.46 per cent. This is the FY’14-15 PLF, even though 2015-16 PLFs
have fallen. On the other hand, these PLFs are lower than notional or normative (target) PLFs, which
are often 68.5 per cent.
Breakup of the numbers is listed in Table 22.
Capacity basis
Coking coal Non-coking coal Total
MT Domesti
c
Import
s
Tota
l
Domesti
c
Import
s
Tota
l
Domestic
(a)
Imports
(b)
Steel (+boilers) 34 67 101 1 0 1 35 67
Sponge iron 22 14 36 22 14
Cement 20 14 34 20 14
Fertiliser 3 0 3 3 0
Others 126 0 126 126 0
Power (utility) 714 183 898 714 183
Power (captive) 76 37 113 76 37
Capacity basis
(2020) 34 67 101 962 248
121
0 996 315
Total (a+b) = 1311
Table 22: Calculated coal demand 2020 in MT (based on projected thermal capacity coming online).
The total expected coal demand in 2020 is 1311 MT, based upon assumptions and extrapolations,
short of around ~190 MT from the 1.5 billion tonne target. This assumes that imports continue,
when in reality one of the stated objectives for 1.5 billion tonnes of production is to eliminate the
need to import coal. It is highly likely that coking coal continues to be imported, which we examine
in Section 11.1 on (power demand based) sensitivity analysis.
The thermal power plant capacity basis calculation is admittedly on the higher side, because
additional capacity anticipated by 2020 in itself is around 70 per cent of the total thermal capacity
commissioned till 31 March 2015. The impact of such theoretical but high capacity installation
would then likely manifest itself via lower realised PLFs in the future, which does not auger well for
the newer plants. Or, some plants, somewhere have to take a PLF hit (assuming PLFs don’t fall
across the board equally).

BROOKINGS INDIA | RESEARCH PAPER 072016-2
39| Coal Requirement in 2020: A Bottom-up Analysis
8 Sensitivity analysis – Future thermal power plant capacity
basis
The assumptions used for calculating coal demand projections for 2020 are base case projections
for future; one can get upside/downside values resulting from changes in the assumptions. The
following are sensitivity estimates for coal requirements. It is also assumed, unless otherwise stated,
non-power demand for coal stays as is.
8.1 Slippage sensitivity analysis
Slippage numbers used in estimates are weighted extrapolations based upon the capacity expected
to not be commissioned at the end of 12th Five-Year Plan period (2012-17). However, positive
changes in slippage will imply higher capacity coming online by 2020 (unlikely). Varying slippage
rate within a range of 50 per cent to 10 per cent would give estimates for coal demand
commensurate to the expected capacity online. The current situation of adding copious quantities
of RE capacity by 2022 coupled with adverse DisCom situations and virtually no new PPAs being
signed does not auger well for new capacity, therefore, it is likely that the slippage rate would be
higher than 25 per cent. Hence, at about 50 per cent slippage, worst case scenario, about 83.5 GW
capacity would come online requiring about 1,200 MT of total coal at a CAGR of 8 per cent from
current supply levels, shown in Figure 6. Also note, the bar in the centre at 25 per cent on the x-
axis, is the base case scenario. The graph also shows the CAGRs required to get to the coal
projections at various slippages in five years (2015 to 2020).
The actual slippage rates may vary based on the following factors:
There have been instances in the past of new plants proposed, approved, and commissioned
within a time frame of five years. These are positive surprises which reduce the slippage rates,
however, a typical time span from conceptualisation to commissioning is around eight years.
Such plants impact the slippage rate (read the right end of the graph below, representative of
the lower slippage rates).
Figure 6: Coal demand [MT] for 2020 with different slippages of power plant construction.
912 946 979 996 1012 1046
288 299 310 315 321 331
8%9%
9% 10% 10%11%
0%
2%
4%
6%
8%
10%
12%
0
200
400
600
800
1000
1200
50% 40% 30% 25% 20% 10%
CA
GR
fo
r to
tal c
oal
(p
er c
ent)
Co
al v
olu
me
(MT)
Slippage rates (%)
Domestic Imports CAGRBase case
BROOKINGS INDIA | RESEARCH PAPER 072016-2
40| Coal Requirement in 2020: A Bottom-up Analysis
There are also positive surprises in the form of a few project(s) that lay un-commissioned even
after completion due to lack of raw material, unexpected delay in coal linkage/supply or
entanglement in legal issues over environmental concerns, getting commissioned in the
forecast period (right end of Figure 6).
A few plants with all the statutory clearances, however, may remain stalled at the end of the
forecast period due to adverse circumstances or construction delays such as sponsors’
involvement with other projects, or project side-lined for any other reason, contributing to
additional slippage to the projections (left end of Figure 6).
There is high likelihood of less new investment in thermal power capacity unless older plants
are retired and new PPAs are signed. The slippage rates are anticipated to be high, based on
the current status of the power sector, however, projects already “invested in” would most likely
still continue to come up due to sunk costs. The slippage rates, hence, are more likely to be on
the higher side, lowering the coal requirement.
8.2 Plant efficiency sensitivity analysis
Technology differences in sub-critical and super-critical power plants make it imperative for coal
demand computations to include differences in efficiency values—31 per cent for sub-critical and
38 per cent for super-critical existing power plants and 34 per cent and 38.5 per cent for future
power plants, respectively—as parameters to forecast capacity by 2020 on the baseline for the
model. Future plants are expected to be more efficient, however, the extent may vary over the base
line, seen in the sensitivity analysis (Figure 7).
The difference between existing plants and upcoming future plant efficiencies has been maintained
with changes effected only in future efficiencies and not in current efficiencies for calculating
sensitivity. Stated another way, present plants aren’t likely to change their efficiency much (have
less uncertainty). A change of (+/-) 2 per cent for both sub-critical and super-critical over the base
line numbers of 34 per cent and 38.5 per cent for future power plants without any changes in
current plant efficiencies has been considered. Figure 7 also plots the CAGRs required from the
2015 supply of 820.8 MT in five years to reach the respective total demand(s):

BROOKINGS INDIA | RESEARCH PAPER 072016-2
41| Coal Requirement in 2020: A Bottom-up Analysis
Figure 7: Coal demand in 2020, with changes in future plant sub-critical (per cent) and super-critical (per
cent) efficiencies.
As we see above, coal demand decreases from a maximum of 1,391 MT, at higher efficiency values
(left side of the graph) and increases towards lower efficiency numbers (right side of the graph),
with our base case (in the centre) demand of 1,311 MT. The quantum of super-critical plants being
low, the impact on coal demand is not very pronounced.
8.3 PLF sensitivity analysis
Figure 8 shows a trend line for pan-India aggregate thermal monthly PLFs in the last few financial
years, clearly indicating a drop in PLF YoY, which could possibly imply that the current capacity is
underutilised (there are seasonal variations, of course).
974 983 1004 996 1025 1049 1060
1283 1296 1320 1311 1348 1376 1391
9.3%9.6%
10.0%9.8%
10.4%
10.9%11.1%
8.0%
8.5%
9.0%
9.5%
10.0%
10.5%
11.0%
11.5%
0
200
400
600
800
1000
1200
1400
1600
35% & 40% 35% & 38% 33% & 40% 34% & 38.5% 33%&36% 31%&38% 31%&36%
CA
GR
fo
r to
tal c
oal
(%
)
Co
al (
MT)
Efficiency combinations, sub- and super-critical respectively
Domestic Total CAGR (2020) Base case

BROOKINGS INDIA | RESEARCH PAPER 072016-2
42| Coal Requirement in 2020: A Bottom-up Analysis
Figure 8: India aggregate monthly PLFs (coal and lignite based plants only). Also shown is the 12-month
moving average, to overcome seasonal effects. Source: (CEA Monthly reports March 2012 – May 2016).
Power plants have seen historic PLFs hovering at 75 per cent in the not so distant past. Just a few
years ago, shortfalls of coal were a major reason for lower PLFs, but as of April 2016, coal stocks
are at a record high.
The recent trend of lower PLFs, without attributing causality, is ostensibly an overcapacity, but there
are underlying factors such as reduced demand, rise of alternative power supply, etc. that must be
considered.
Low PLFs aren’t a steady-state, and a lower PLF could include reduced output from plants instead
of just some units switching off, which can lead to lower efficiencies.
Some other possible causes of lowered PLF include:
Inappropriate and frequent ramping up/down
Fuel related causes, e.g., variation in quality of fuel, causing the plant to cycle in order to
maintain heat rates, resulting in low PLFs
State-owned plants asked to ramp up if not back down in cases of “excess” supply (non-peak)
of RE/central power plants.
Figure 9 is a sensitivity analysis on the coal required as the national (average) thermal PLF changes.
The base case PLF for our study is at 64.46 per cent31 (marked in deeper shades in the graph) and
the graph shows how coal demand responds to changes in PLF, with associated CAGR values for
coal growth till 2020 on top of the 820.8 MT of coal demand till March 2015. The range for PLF is
taken such that the past PLFs are also represented and the worst case includes the lowest likely
31 The PLFs in FY’15-16 was even lower (CEA).
55
60
65
70
75
80
Ap
r-1
2
Jun
-12
Au
g-1
2
Oct
-12
Dec
-12
Feb
-13
Ap
r-1
3
Jun
-13
Au
g-1
3
Oct
-13
Dec
-13
Feb
-14
Ap
r-1
4
Jun
-14
Au
g-1
4
Oct
-14
Dec
-14
Feb
-15
Ap
r-1
5
Jun
-15
Au
g-1
5
Oct
-15
Dec
-15
Feb
-16
Ap
r-1
6
Jun
-16
PLF
(%
)
Months from Apr'12 to June'16
Monthly PLF PLF 12-month moving average

BROOKINGS INDIA | RESEARCH PAPER 072016-2
43| Coal Requirement in 2020: A Bottom-up Analysis
PLFs. As the PLF increases the coal requirement also increase with a 75 per cent PLF requiring high
coal volumes ~1,458 MT. A low PLF has implications for plant life through technical efficiency loss
and also an economic implication through high cost of maintaining the low levels of PLF, secondary
fuel consumption, and a heat rate penalty (Chandra Bhushan, 2015).
Figure 9: Coal requirements [MT] with PLF sensitivity of power capacity expected by 2020. This assumes
the capacity is built as previously calculated but is able to operate at different PLFs.
836 891 957 996 1057 1113
11091179
12631311
13881458
6.2%
7.5%
9.0%
9.8%
11.1%
12.2%
0.0%
2.0%
4.0%
6.0%
8.0%
10.0%
12.0%
14.0%
0
200
400
600
800
1000
1200
1400
1600
50% 55% 61% 64.46% 70% 75%
Tota
l co
al C
AG
R (
%)
Cao
l dem
and
(M
T)
PLF
Domestic Total CAGR
Base case

BROOKINGS INDIA | RESEARCH PAPER 072016-2
44| Coal Requirement in 2020: A Bottom-up Analysis
9 Assumptions for energy demand projections in 2020: A
limiting factor
Till now, we have focused on the supply of power through coal powered plants. What about
demand for coal-based power? Demand for coal-based power is a subset of total demand for
power, factoring in alternative supplies. While most alternatives have had modest or even low
growth, Renewable Energy (RE) has seen dramatic increases in the last few years, even before
considering the enormous 175 GW RE capacity targets of the government by 2022 (almost a five
times growth in seven years!) The targeted increase in total installed capacity from all of these
sources by 2020 raises an important question: would India be able to absorb all the energy coming
online, including 110 GW32 coal based after slippage, at the current PLF of 64.46 per cent and if
not, what are the implications?
9.1 Assumptions for calculating electricity demand in 2020
To answer the above questions, we extrapolate the total increase in demand (BUs) by the year 2020.
In 2015, Indian power demand was 1049 BU. We segregate demand growth into various buckets
as organic growth and inorganic growth. The former is GDP-related, and factors in all growth as
we’ve seen thus far. However, given ~300 million people still do not have connections to the grid
(O'Neill, 2016), and we still have shortfalls of power in places (load-shedding), we can estimate such
one-off growth in demand assuming these problems are solved by 2020. From a modelling
perspective this is inorganic growth, as it is one-off and above-and-beyond existing demand
growth.
9.1.1 GDP elasticity of electricity
Economic (GDP) growth is linked and correlated to energy (power) use, but the linkage is not static
or simple. First, we have changes in the economy, with services demanding less energy than
manufacturing. Second, we have the push towards energy efficiency, notably in lighting (LEDs) and
efficient appliances. Third, we have issues of time lags, where GDP growth percolates to new
investment.
For India energy intensity has been falling since 1981 (Planning Commission, 2012), following a
general pattern for the development ladder. For the purposes of this analysis, we have chosen a
single base value of power demand to GDP growth elasticity of 0.9.
From an energy perspective the aggregate values for GDP elasticity of primary energy (not
electricity only) have been decreasing, from a value of 0.73 in 1980-81 to 0.66 at 2000-01 (Planning
Commission, 2012). Considering electricity only (see Figure 10), for the analysis we have chosen a
single baseline value of 0.9 as the GDP elasticity of electricity. A simple multiplication with GDP
(assumed 8 per cent) gives us a value of 7.2 per cent organic growth of electricity demand.33
32 The total is 115 GW however, 5 GW has already come online since the start of the study. 33 Simple regressions do no provide accurate estimates given standard regressions assume independent,
identically distributed variables. Examination of the data indicate periods of negative auto-correlation (high
elasticities are often followed by low elasticities), in addition to a trend that isn’t normally distributed (as GDPs
rise, the elasticity doesn’t necessarily rise as much, in part (possibly) due to the contribution of the service

BROOKINGS INDIA | RESEARCH PAPER 072016-2
45| Coal Requirement in 2020: A Bottom-up Analysis
Figure 10: GDP Elasticity of Power Generation Vs GDP Growth Rate (1998 – 2015). This is based on MoP/CEA
data for generation (BU) and Ministry of Finance data for GDP.
9.1.2 Meaningful electrification for households (especially new connections)
Meaningful electrification goes beyond the first step of putting up supply lines till the village/
supply region. Tongia (2014) suggests this to mean actually connecting households with the supply
lines and assuring a minimum quality of service levels. Ideally, zero load-shedding, starting with
the peak demand periods (evenings are critical for households).
For our study, we assume that new connections would have a low value of demand as these
households are newly electrified, and also typically link to lower socio-economic strata of society.
For the sake of simplicity, we have taken the consumption from these households at a baseline of
approximately ~ 500 units per annum.
9.1.3 Removing all load shedding
The third important factor contributing to future electricity demand is fulfilment of latent demand.
Improvement in quality of supply – consistent voltage and zero load shedding – is of equal
importance, if not more, to reduce the implicit costs associated with low quality power supply
(frequent repair of equipment and cost of alternatives for coping with power cuts). The latent
demand is estimated at around 3.6 per cent of the total estimated demand (~1,110.2 BU in 2015).34
We have assumed that this would be reduced gradually and by 2020 this would amount to zero,
however, the plugging of shortfall would also generate an additional demand in the form of
increased use of appliances due to improvement in quality of supply.
sector.) Other factors that matter include the strength of the monsoon, any growth in manufacturing, global
impacts for GDP, and time lags between investment, operations, etc. 34 These estimates are from CEA’s Load Generation Balance (LGB) reports, which might slightly understate the
shortfall. In the absence of proper instrumentation, shortfalls are “as-reported” by states.
0.0
0.2
0.4
0.6
0.8
1.0
1.2
1.4
1.6
0.0 2.0 4.0 6.0 8.0 10.0 12.0
GD
P e
last
icit
y o
f p
ow
er
gen
erat
ion
GDP growth rate %

BROOKINGS INDIA | RESEARCH PAPER 072016-2
46| Coal Requirement in 2020: A Bottom-up Analysis
9.1.4 Reduction in technical losses
The last factor that has been taken into account to calculate the total electricity requirement in
2020 is the reduction in technical losses. While much of the total losses of roughly 20 per cent (just
at the distribution level, termed AT&C, or aggregate technical and commercial) are non-technical,
even technical losses are high in India, due to phase and load imbalances, long feeder lines, lack
of reactive power support, etc. So-termed commercial losses are still consumed, so a reduction of
the same may improve finances, but still require generation (unless such demand vanishes). We
assume that there is an annual improvement from 2015 in technical losses by 0.25 per cent initially,
falling to 0.05 per cent, annual technical losses improvement, in 2020.
9.1.5 Displacement by RE
In the base case for the model, it has been assumed that there is no net displacement of thermal
BUs by RE based generation. This is conservative from a coal requirement perspective, and we
subsequently factor in a small and gradual displacement of 1.5 per cent of thermal BUs by RE based
generation (by 2020). If, and this is an unknown, India reaches 175 GW of RE, and this operates on
a “must-run” basis (never backing down RE), then even with a growth of coal and other sectors, the
relative share of RE grows by much more than 1.5 per cent (see Figure 14). RE integration and
subsequent coal displacement has been dealt in much greater detail in Section 13.3.

BROOKINGS INDIA | RESEARCH PAPER 072016-2
47| Coal Requirement in 2020: A Bottom-up Analysis
10 Calculations: Coal requirements, electricity demand
projections basis
10.1 Energy demand projections in 2020
The above assumptions when used to calculate the future BU in 2020 give a value of 1,634 BU. This
value amounts to a CAGR of 8.04 per cent in the electricity demand between 2015 and 2020.
However, this number is source agnostic, meaning for calculating the BUs from thermal power
plants we assume a constant ratio (between 2015 and 2020) for generated power (electricity) from
all sources. Keeping today’s 79 per cent thermal power generation in 2020, we get a number of
1,291 thermal BUs, with a similar share for coal within the thermal group.
10.2 Coal required for energy demand in 2020
Using the above value of power demand in 2020 the coal required to achieve this demand level
would need some additional assumptions:
10.2.1 Other assumptions
Thermal power from coal is still generating 79 per cent of total power in 2020, hence,
discounting any displacement of thermal power due to uptake in the renewables energy
projects till 2020 (which may not be the case, and a sensitivity has been added for this, refer
Section 13.3).
PLF and efficiency values are the same, as used for power capacity calculations in the earlier
segment, and so is the coal leakage, non-power sector coal requirement, and imports. All these
calculations remain as used in the coal based generation capacity calculations in Section 6.
Based on the assumptions above, coal required by 2020 to suffice energy demand is calculated to
be 1,228 MT. Breakdown of the demand is given in Table 23.

BROOKINGS INDIA | RESEARCH PAPER 072016-2
48| Coal Requirement in 2020: A Bottom-up Analysis
Demand basis
Coking coal Non-coking coal Total coal
[MT] Domesti
c
Import
s Total
Domesti
c
Import
s Total
Domestic
(a)
Imports
(b)
Steel
(+boilers) 34 67 101 1 0 1 35 67
Sponge iron 22 14 36 22 14
Cement 20 14 34 20 14
Fertiliser 3 0 3 3 0
Others 126 0 126 126 0
Power (utility) 648 167 815 648 167
Power
(captive) 76 37 113 76 37
Elec. demand
basis (2020) 34 67 101 895 232 1128 929 299
Total (a+b) = 1228
Table 23: Total coal demand (based on power demand as the limiting factor) by 2020.
Given the demand basis calculations for power lead to a lower requirement than from a coal plant
capacity basis, this is a more realistic figure given demand is the bottleneck. Even if more capacity
comes on line, if the demand isn’t present, this means lower PLFs. Thus, this mechanism (power
demand basis) is the chosen method for the bulk of the sensitivity analysis (unless stated
otherwise).

BROOKINGS INDIA | RESEARCH PAPER 072016-2
49| Coal Requirement in 2020: A Bottom-up Analysis
11 Sensitivity analysis: Future electricity demand basis
The assumptions used for calculating power capacity and demand by 2020 start with the base case.
However, one can vary these assumptions and get upside/downside values. Following are the
sensitivity estimates for coal requirements:
11.1 Sensitivity analysis - imports
India imported ~212 MT of coal in FY’14-15 which included ~43 MT of coking coal for steel
manufacturing and ~125 MT used in non-captive thermal power plants, and ~26 MT in captive
thermal power plants, whereas ~17.4 MT coal was imported for non-power application. Thermal
coal sector imports are required for following reasons:
Blending with domestic coal to achieve higher average GCVs, at lower ash content, to match
the thermal units fuel quality specifications
For thermal power plants that are close to ports, inland transportation of domestic coal is
usually an expensive proposition. The coastal power plants may prefer to import since,
o (Like all plants) the quality of coal is better: higher average GCV and lower ash and
moisture content
o The savings on transportation costs vis-à-vis inland transport of lower grade coal. The
average transportation cost being 846 INR/tonne for an average distance of 620 KMs
(Chandra Bhushan, 2015). Global coal prices are also low, for various reasons.
In discussions with experts, they also gave anecdotes that some plants are optimised for specific
coal, which goes beyond notional guidelines of quality.
11.2 Future import scenarios
Scenarios for imported coal and impact on total domestic coal production have been considered,
based on changes in the following assumptions:
Imports to maintain the same percentage share of the total supply as in FY’14-15 (this is the
base case), due to quality concerns with domestic coal (high ash and low GCVs) and ease of
transportation and consumption at the coastal power plants
Some newer plants may have been built to specifications that require imported coal or at least
some blending with imported coal
Coking coal imports are most likely to continue as is, considering the low domestic reserves of
high quality coking coal.
In this sensitivity analysis, the baseline is less a middle value than a bound since, realistically imports
are likely to fall due to improved domestic availability.
Working on the above base case, a number of import scenarios ranging from partial import
substitution to zero imports have been summarised below in Table 24 and Table 25. Please note:
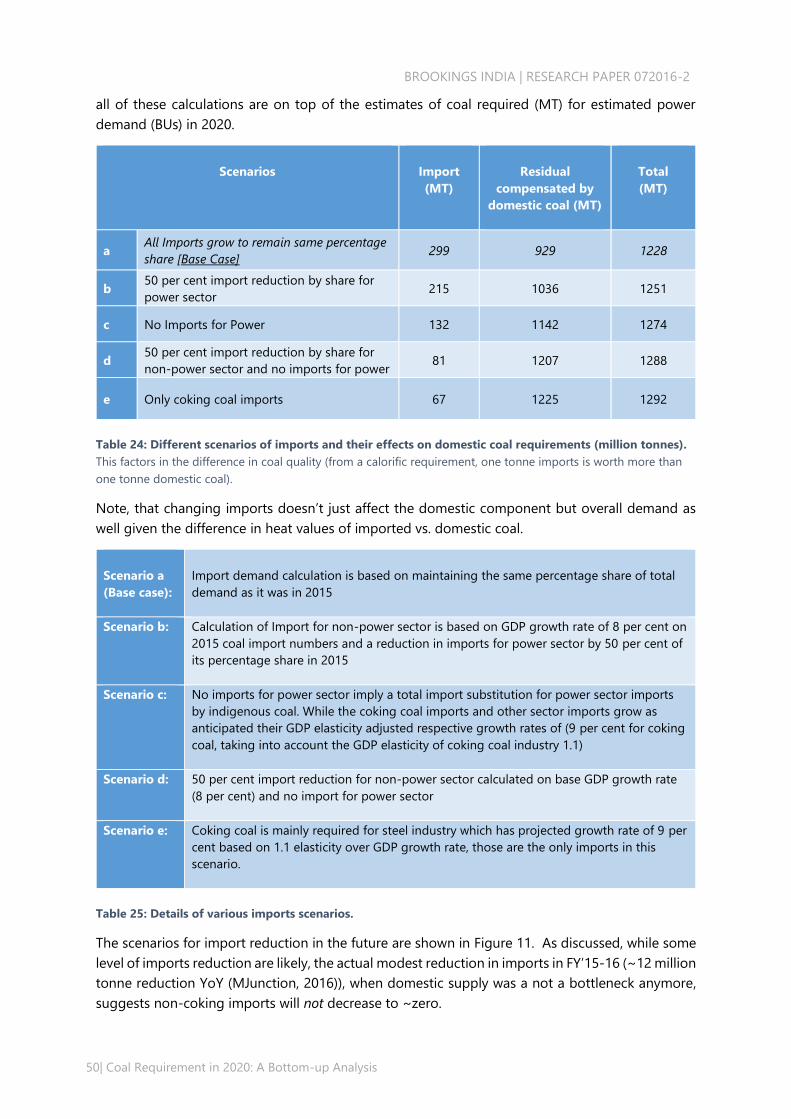
BROOKINGS INDIA | RESEARCH PAPER 072016-2
50| Coal Requirement in 2020: A Bottom-up Analysis
all of these calculations are on top of the estimates of coal required (MT) for estimated power
demand (BUs) in 2020.
Scenarios
Import
(MT)
Residual
compensated by
domestic coal (MT)
Total
(MT)
a All Imports grow to remain same percentage
share [Base Case] 299 929 1228
b 50 per cent import reduction by share for
power sector 215 1036 1251
c No Imports for Power 132 1142 1274
d 50 per cent import reduction by share for
non-power sector and no imports for power 81 1207 1288
e Only coking coal imports 67 1225 1292
Table 24: Different scenarios of imports and their effects on domestic coal requirements (million tonnes).
This factors in the difference in coal quality (from a calorific requirement, one tonne imports is worth more than
one tonne domestic coal).
Note, that changing imports doesn’t just affect the domestic component but overall demand as
well given the difference in heat values of imported vs. domestic coal.
Scenario a
(Base case):
Import demand calculation is based on maintaining the same percentage share of total
demand as it was in 2015
Scenario b: Calculation of Import for non-power sector is based on GDP growth rate of 8 per cent on
2015 coal import numbers and a reduction in imports for power sector by 50 per cent of
its percentage share in 2015
Scenario c: No imports for power sector imply a total import substitution for power sector imports
by indigenous coal. While the coking coal imports and other sector imports grow as
anticipated their GDP elasticity adjusted respective growth rates of (9 per cent for coking
coal, taking into account the GDP elasticity of coking coal industry 1.1)
Scenario d: 50 per cent import reduction for non-power sector calculated on base GDP growth rate
(8 per cent) and no import for power sector
Scenario e: Coking coal is mainly required for steel industry which has projected growth rate of 9 per
cent based on 1.1 elasticity over GDP growth rate, those are the only imports in this
scenario.
Table 25: Details of various imports scenarios.
The scenarios for import reduction in the future are shown in Figure 11. As discussed, while some
level of imports reduction are likely, the actual modest reduction in imports in FY’15-16 (~12 million
tonne reduction YoY (MJunction, 2016)), when domestic supply was a not a bottleneck anymore,
suggests non-coking imports will not decrease to ~zero.

BROOKINGS INDIA | RESEARCH PAPER 072016-2
51| Coal Requirement in 2020: A Bottom-up Analysis
Figure 11: Imported coal scenarios and their impacts on total domestic coal requirements. This is based on
power sector demand as the limiting factor. The area under the curve is boundary of the total requirement.
11.3 GDP sensitivity
GDP is one of the key impact variables that changes the total coal demand. With a base assumption
pegged at a high of 8 per cent GDP growth rate for the next five years, any changes in GDP
(decrease) reduces the coal requirement as well. A 1 per cent (absolute) reduction in anticipated
GDP growth rate reduces the coal requirement in 2020 by about ~4 per cent, as shown in Figure
12.
Figure 12: Impact of GDP sensitivity on coal requirements.
12281251 1274 1287 1291
a, 299
b, 215
c, 132
d, 81e, 67
a, 167
b, 84
929
1036
11421207 1225
0
200
400
600
800
1000
1200
1400
0
50
100
150
200
250
300
350
a b c d e
Co
al, d
om
esti
c an
d t
ota
l (M
T)
Co
al Im
po
rt, p
ow
er a
nd
no
n p
ow
er (
MT)
Import Scenarios
Total coal (MT) Total import (MT)
Non-power imports (MT) Power imports (MT)
Domestic consumption (MT)
11361181 1205 1228 1252
864 896 913 929 946
6.7%
7.6%8.0%
8.4%8.8%
0.0%
1.0%
2.0%
3.0%
4.0%
5.0%
6.0%
7.0%
8.0%
9.0%
10.0%
0
200
400
600
800
1000
1200
1400
6% 7% 7.50% 8% 8.50%
Tota
l Co
al C
AG
R (
%)
Co
al (
MT)
Total Coal Demand Domestic Coal CAGR Base Case

BROOKINGS INDIA | RESEARCH PAPER 072016-2
52| Coal Requirement in 2020: A Bottom-up Analysis
12 Triangulation: Power demand and future capacity throw
up divergent coal requirement numbers
12.1 Coal demand (Thermal power capacity v/s power demand)
Coal calculation through power capacity expected online by 2020 and through power demand
calculations by 2020 throw up two contrasting numbers with separate CAGRs, Table 26.
Domestic coal for future power capacity 898
MT
Domestic coal for future power demand 815 MT
• Base capacity scenario for power sector gives
a total coal requirement of 1311MT on the
following assumptions (base case)
• GDP growth of 8%
• Imports maintain same share of total
supply
• GDP elasticities for non-power sectors
• PLF 64.46% (CEA, September) (CEA,
CEA Monthly Executive Summary
Power Sector, April, 2015)
• 31.1% efficiency for existing sub-
critical plants and 38% for super-
critical plants
• The average coal type is G11 and
respective GCV was used
• 4% leakage of coal was applied.
• Total required coal CAGR of 9.8%
• Base demand growth scenario for power
sector gives a total coal requirement for 1228
MT calculated on the following assumptions
(base case)
• New consumers at ~500 units per
annum
• GDP growth of 8%
• GDP elasticity of electricity = 0.9
(organic growth of 7.2% in power
demand)
• 100% electrification, 3.6% latent
demand and additional demand of
1% by 2020
• Reducing AT&C losses in line with
global value of 0.05% by 2020
• No RE displacement (in base case)
• Total required coal CAGR of 8.4%
Table 26: Comparative analysis of coal required for power capacity and power demand in 2020.
Total coal required by 2020 based upon capacity projections is 1311 MT, of which 996 MT is
expected to be satisfied through domestic production, whereas, 315 is expected through imports.
The same numbers change based on power demand calculations in 2020 and 1228 MT of total
coal, of which 929 MT is domestic production and 299 MT of imports, is required conditional to
demand assumptions holding true.
12.2 Implications of power supply-demand mismatch on PLFs
The power supply-demand mismatch, can lead to a reduction in the PLF’s of the operational plants
to manage low electricity offtake, which in turn would affect the efficiency, increase carbon
emissions and reduce life of plants (due to frequent cycling up/down of the plant). However, there
is a difference between the older and the newer plants in operation. While the older plants have
lower cost of power generation (as they are completely depreciated or higher depreciated,
relatively speaking, against the newer ones), the newer plants have sunk costs and thus a higher
cost of power generation. Lower PLF’s for such plants, especially when the accounting is based on
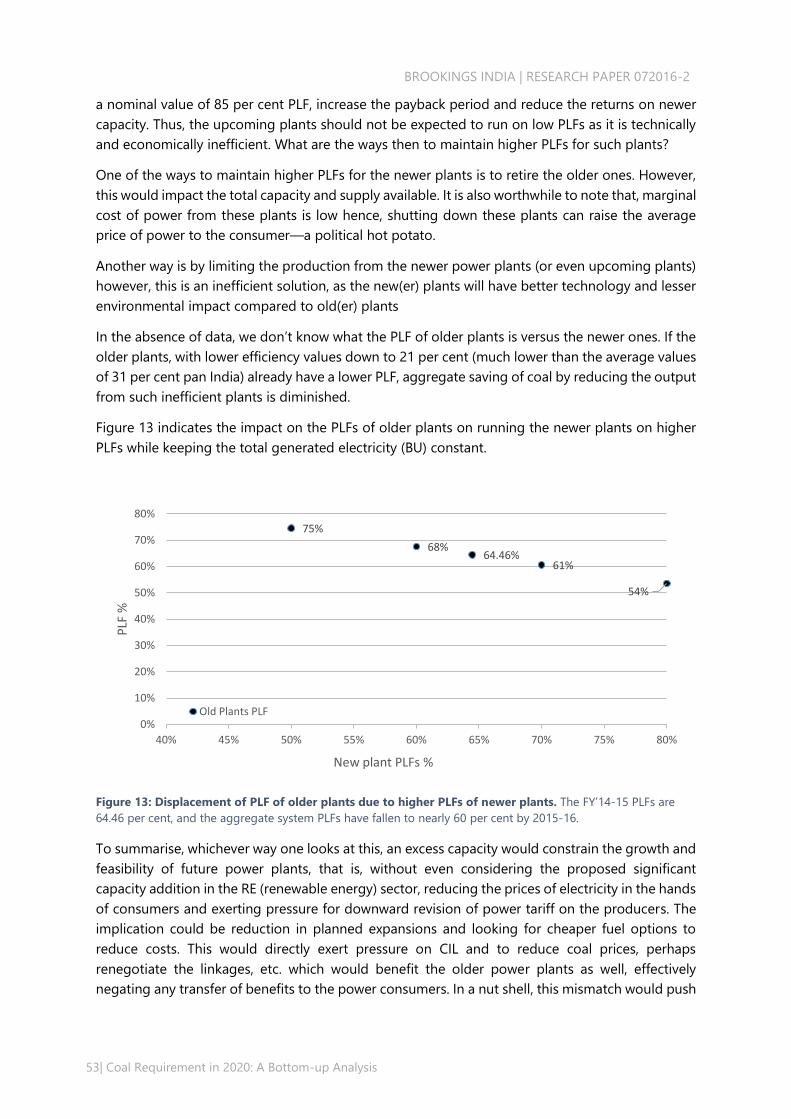
BROOKINGS INDIA | RESEARCH PAPER 072016-2
53| Coal Requirement in 2020: A Bottom-up Analysis
a nominal value of 85 per cent PLF, increase the payback period and reduce the returns on newer
capacity. Thus, the upcoming plants should not be expected to run on low PLFs as it is technically
and economically inefficient. What are the ways then to maintain higher PLFs for such plants?
One of the ways to maintain higher PLFs for the newer plants is to retire the older ones. However,
this would impact the total capacity and supply available. It is also worthwhile to note that, marginal
cost of power from these plants is low hence, shutting down these plants can raise the average
price of power to the consumer—a political hot potato.
Another way is by limiting the production from the newer power plants (or even upcoming plants)
however, this is an inefficient solution, as the new(er) plants will have better technology and lesser
environmental impact compared to old(er) plants
In the absence of data, we don’t know what the PLF of older plants is versus the newer ones. If the
older plants, with lower efficiency values down to 21 per cent (much lower than the average values
of 31 per cent pan India) already have a lower PLF, aggregate saving of coal by reducing the output
from such inefficient plants is diminished.
Figure 13 indicates the impact on the PLFs of older plants on running the newer plants on higher
PLFs while keeping the total generated electricity (BU) constant.
Figure 13: Displacement of PLF of older plants due to higher PLFs of newer plants. The FY’14-15 PLFs are
64.46 per cent, and the aggregate system PLFs have fallen to nearly 60 per cent by 2015-16.
To summarise, whichever way one looks at this, an excess capacity would constrain the growth and
feasibility of future power plants, that is, without even considering the proposed significant
capacity addition in the RE (renewable energy) sector, reducing the prices of electricity in the hands
of consumers and exerting pressure for downward revision of power tariff on the producers. The
implication could be reduction in planned expansions and looking for cheaper fuel options to
reduce costs. This would directly exert pressure on CIL and to reduce coal prices, perhaps
renegotiate the linkages, etc. which would benefit the older power plants as well, effectively
negating any transfer of benefits to the power consumers. In a nut shell, this mismatch would push
75%
68%64.46%
61%
54%
0%
10%
20%
30%
40%
50%
60%
70%
80%
40% 45% 50% 55% 60% 65% 70% 75% 80%
PLF
%
New plant PLFs %
Old Plants PLF

BROOKINGS INDIA | RESEARCH PAPER 072016-2
54| Coal Requirement in 2020: A Bottom-up Analysis
the thermal power sector to adjust to a lower price realisation and make power sector investments
risky, possibly impacting the banking industry by an increase in the NPAs.
12.3 Impact on coal
Even an optimistic estimate of power demand (non-power sector being the same) fails to throw up
a coal requirement close to 1.5 billion tonnes. It is also likely that demand growth is limited at the
current growth rates, the GDP grew by 7.6 per cent in the financial year 2015-16, and the coal
requirements do not exceed 1,200 MT in total in 2020, in which case around 913 MT of coal would
be required from domestic sources, considering similar export ratio, and more in case the exports
are reduced. There is the need to increase coal production in the short run and there will be
pressure on CIL for bridging any shortfall. Although there are limits to CIL’s capacity augmentation
as well, it needs to be realistic in terms of how much it can produce. However, opening up the
mining sector for private participation can ease the pressure on CIL only in the longer term (not in
the short term – 2020), as incremental measures35 have not yielded desired results. The targets
need to be re-thought considering the actionable and achievable in order to prop up demand by
2020.
35 The recent policy announcement of centralised allocation of coal linkages to the respective state
governments for onward distribution to power plants in the states is expected to improve the system
efficiency. If this reduces costs and thus increases demand, it could increase the coal requirements. However,
it is unlikely that marginally lower costs, even if achieved, are the key factor for increased demand of coal. On
the other hand, efficient use of coal involves using more efficient plants better (at a higher PLF), and such
flexibility could reduce coal requirements, in addition to savings on transportation costs.
BROOKINGS INDIA | RESEARCH PAPER 072016-2
55| Coal Requirement in 2020: A Bottom-up Analysis
13 Discussion: Robust calculations for lower coal
requirements
The target of 1.5 billion tonnes of domestic coal by 2020 isn’t only ambitious from a supply
perspective, it risks being far higher than the likely offtake which could be several hundred million
tonnes lower, depending on the quantum of import substitution. It would, however, be prudent to
examine what supporting infrastructure would be required to facilitate greater availability of coal.
13.1 Can an increase in washery capacity reduce quantum of imports?
The question of more washeries installation to upgrade domestic coal quality is controversial. The
current domestic washery capacity is ~131 MT, (Chandra Bhushan, 2015) with only about 77.19 per
cent being utilised (Press Information Bureau, 2015). The utilisation of washery capacity is complex
as not all washing is of the same type, and the technology of washing maps to the actual coal type
that can be washed. Additional upcoming washing capacity, 115 MT in total and 15 in number of
which six are for coking coal and nine are for non-coking coal, would increase the washing capacity.
However, the offtake depends on factors such as logistics, contracts, etc. In addition, use of dry
washing should be encouraged (technology like Ramdars) to ensure lesser water consumption and
environmental load. Washing also impacts the quality of coal increasing the moisture content, and
reducing the density in addition to the following issues;
Washing is an additional cost to the value chain, which needs to be borne by the end consumer.
A market for this value added product is far from developed.
Distance of washery from the mine and the plant determines the increase in transportation
cost payable, which in many cases may be higher than the cost of washing.
Washing generates rejects, which have high ash content and are generally unusable in large
industries. Disposing off these rejects in an environment friendly manner needs to be
addressed.
From an environmental stand point, it is pertinent to ensure the water used for washing is
reused or treated before disposal in order to avoid negative externality or use dry washing.
Newer plants operate on closed-loop cycles to a large extent.
To ensure availability of washed coal the associated technical issues with washing and waste
disposal along with rationalised tariff structures for transportation are necessary. Without such
structural changes in coal washing future plans for increased utilisation of washed coal could
remain stillborn without any improvement in utilisation of the existing capacity.
13.2 Low transportation capacity could be an issue?
One of the key enablers for coal movement in the country is railways. There are bottlenecks in the
form of steep tariffs, last mile connectivity problems (necessitating trucking), losses and pilferage
enroute, and choke points causing delay on some of the busiest routes. However, railways remain,
and are expected to remain, a major enabler for coal movement in the forecast period. The steep
increase, if not 1,500 MT but a lower value of domestic transport of at least 929 MT through 996

BROOKINGS INDIA | RESEARCH PAPER 072016-2
56| Coal Requirement in 2020: A Bottom-up Analysis
MT, would need a commensurate capacity upgradation for the railways as well. This would either
be, adding additional wagons for movement or mandating rapid loading/unloading methods for
the consumers to minimise loading/unloading time at the siding.
Mode of transportation
Share per cent (of quantity of coal transported in MT)
Railways (Including rail +sea) 56%
Road 24%
MGR 18%
Belt conveyors+ ropeways 2%
Table 27: CIL modes of coal transportation. Source: (Ministry of Coal, 2014-15)
The current mining of CIL at ~520 MT of coal could double up in the next five years, and even if 50
per cent of this coal is transported through railways (assumption) this implies 250 MT of coal
movement on the railways currently. If somehow CIL reaches 1 billion tonnes, then an additional
250 MT capacity could possibly come online, which is likely to be at remote locations with distant
railheads assuming schedule I mines would be producing. To move coal from these locations to
the end use plants is a challenge which cannot be accomplished without optimising the railway
fleet by adding new capacity, both in terms of new routes and wagons. Without an upgrade of
routes, tracks, and wagons, coal mining (driven by utilisation) may not be able to achieve its targets
even if new mines are able to produce the requisite quantities on time.
The current transportation tariff is heavily loaded in the favour of railways, with higher charges for
volumetric load and washed coal. There is also pilferage in certain sections which is a cost for
miners—in our calculations an overall 4 per cent aggregate pilferage loss, quality losses, and self-
combustion has been assumed. There needs to also be a rationalisation of the tariff contingent to
service levels quality to ensure that railway transportation remains relevant and competitive. It is
of utmost importance to address structural concerns in the railways, including creation of dedicated
freight corridors, to enable cost-effective coal mining targets till 2020 (Mohan, 2001).
13.3 RE integration
Integration of RE is one of the key impact variables reducing the quantum of thermal power
generation and thus reducing the need for coal, not as much because of its magnitude but because
of the great uncertainty in RE contributions plus level of displacement of existing generation. Given
that the current and projected peak demand is in the evening, solar power isn’t likely to contribute
to the peak, and thus there is a greater chance of displacement of PLFs of other sources (including
coal).
With an ambitious target for RE by 2022, it is possible that some displacement of thermal BUs
would happen with the increase in RE generation. At a 19 per cent PLF (annual aggregate), and
expected RE capacity increase at 22 per cent CAGR by 2020, the total installed capacity by 2020
could reach 106 GW resulting in a generation of about 176 BUs. This 10.8 per cent share of RE
would imply a displacement of other power, especially coal (Figure 14).

BROOKINGS INDIA | RESEARCH PAPER 072016-2
57| Coal Requirement in 2020: A Bottom-up Analysis
Figure 14: Impact of RE displacing coal demand in 2020 based upon various RE capacity achievements by
2020. The 2022 target of 175GW implies the need to reach 106 by 2020, which would increase the RE share of
total projected electricity (BUs) to 10.8 per cent.
We find that for different total RE capacities by 2020, starting with effectively zero growth (an
academic exercise) to 106 GW by 2020 (the required amount to reach 175 by 2020 at a steady
CAGR) the share of RE generation in BUs can vary measurably. The FY’14-15 share could stay
constant (the marked point) but realistically there will be a growth (converting capacity to BUs @
19 per cent PLF for RE). Such increased RE could displace coal BUs at varying levels, from 1:1 to
perhaps less, assuming other generation also backs down in favour of RE. It is unclear how this will
play out, as it depends not just on costs but marginal costs, as well as time of day issues. Thus, we
find a potential for the reduction of tens of millions tonnes of coal with higher RE—not enormous
but still measurable.
Integration of RE would continue to remain one of the biggest challenges and a wild card that
could impact coal demand in 2020. Growth of RE depends not just on financing such capacity or
even grid integration, but also on the growth of ancillary services in the power sector (systems to
help keep the grid stable), storage technologies, smart grids (which can help control demand), etc.
13.4 Implications – 2020 and beyond
13.4.1 Do two wrongs make a right? No easy “bye” for CIL
This analysis shows that 1,500 MT of domestic coal is a very, very high target, and more than
necessary. However, this doesn’t mean reduced pressure on CIL for rapidly growing output. Of the
1,500 MT, 1,000 MT is to come from CIL, and the remaining 500 MT from private (captive) miners.
This means that CIL has growth targets of 15 per cent between 2015 and 2020, while the private

BROOKINGS INDIA | RESEARCH PAPER 072016-2
58| Coal Requirement in 2020: A Bottom-up Analysis
sector has 61 per cent CAGR requirements. Given the private sector produced only half of their
targets in FY’15-16, we believe the private sector will fall disproportionately short of their 500 MT
targets, leaving the bulk of the pressure for output on CIL.
13.4.2 Other implications of a target mismatch
If one simply finds a shortfall in coal production, this would not, in and of itself, be a major
challenge. Many targets are aspirational or ambitious, and market conditions determine what is
really feasible if not desirable. However, targets guide investments and there is the risk of crowding
out investments in areas of prime importance for India’s power sector.
Today’s shortfalls of power are at a record low (on a percentage basis), but that doesn’t mean there
is zero load-shedding, especially in pockets and/or certain times of the day and year. The main
challenge for India in the coming years is cost-effectively meeting the peak demand. This is
something that will not be solved by coal power nor solar power. India’s peak demand is presently
in the evenings at a national level, and sometimes in the morning.36 This problem will only get
worse as we grow RE, which helps with generation (kWh) but much less so with capacity (kW). This
must be seen in the context of the true policy targets, which aren’t coal per se but affordable power
for all, 24x7.
The international commodity market down cycle has provided an interesting opportunity for India
to put its coal mining sector in order. Historic low prices mean imports, if chosen, would reduce
foreign exchange outflow. More importantly, these put pressure on domestic production to be
efficient and competitive. However, to make itself self-sustaining in the long run the sector needs
to disentangle the mining sector from end use plant based constraints, and likely open up
commercial coal mining to private investment (which brings both capital and technology). One can
make railways a stakeholder in the coal targets, investing part of the environmental/clean cess into
transportation capacity augmentation.
Railways have 87.6 per cent of revenues from freight, which cross-subsidises passenger traffic. Of
this, 46.5 per cent comes from coal. With aggressive targets for domestic coal production, this has
specific planning implications for railways which may find itself facing underutilised or non-optimal
routing of tracks and/or traffic. This wouldn’t be the first time this has happened—in the power
sector aggressive capacity targets for generation often fell short while transmission lines would
sometimes come online as per schedule.
The last set of implications are financial. First, we believe that reductions in coal output will come
disproportionately from captive users, who (a) have alternatives such as CIL/e-auction/imports; (b)
may find the prices as bid37 to be untenable (relying on alternatives).38 If they do choose to reduce
outputs (with an extreme step of forfeiting their deposits), this would impact public revenues
expected from the auctions process. Second, given the strong risks of under- or non-performing
36 This is assuming storage technologies are still expensive, which is likely the case in the coming few years
at least on a large-scale energy arbitrage basis. It already has disproportional value in limited and niche uses
including balancing, ramping, etc. 37 The bid refers to the recent coal block auction winning bids, based upon which the winner of the block has
to pay a per tonne levy on the coal mined. In case not able to pay then they lose the bank guarantee and
also the block. 38 In addition to alternatives for coal, there are macro issues on end-product demand which may influence
end-user decisions on how much coal to mine.

BROOKINGS INDIA | RESEARCH PAPER 072016-2
59| Coal Requirement in 2020: A Bottom-up Analysis
coal power plants, there are banking and finance risks for some plants. If we “only” find a reduction
in PLFs, this may not quite mean a run on the banks (assuming debt is only 70 per cent of a project)
but the equity holders would certainly be staring at a haircut at the very least.

BROOKINGS INDIA | RESEARCH PAPER 072016-2
60| Coal Requirement in 2020: A Bottom-up Analysis
14 Appendix A
The provisional coal statistics from the MoC (Coal Controller Organization, 2016) and the Annual
Coal Report of the MoC (Ministry of Coal, 2015) do not reconcile in some of the coal data with
independent sources like IndiaStat (IndiaStat, IndiaStat, 2016). The coal supply numbers were
finalised upon collating from various sources, and triangulating with experts in this sector, to get
the best estimates of coal imports (in specific sectors). The data usage protocol is explained below:
Segment wise indigenous supply is as reported in the MoC provisional coal statistics.
o For coking coal; both indigenous supply and imports, are as reported in the provisional
coal statistics.
Coal imports for power (utility) are estimates based upon inputs from multiple data sources
like MoC (Coal Controller Organization, 2016) and IndiaStat (IndiaStat, Indiastat, 2016) and
subsequent triangulation with experts.
Coal imports for power (captive) are hard to find, since CEA monthly report on power sector
does not capture or report any data on captive plants except for an installed capacity of ~40
GW (CEA, CEA Monthly Executive Summary Power Sector, April, 2015). The volume of imports
for captive power plants estimated in the table above (26 MT) assumes blending requirements
necessitating imports, the quantum of blending is typically ~30 per cent imported coal in the
coal feed. However, there are thermal capacities, difficult to segregate, running purely on
imported coal as well, underscoring the difficulty in exact calculation of imports for captive
power plants. Hence, an assumption of imports for this sector is used primarily based on the
quantum of indigenous coal made available to captive power plants in FY’14-15, and
triangulation with experts in this sector.
Sponge iron and cement are two important sectors that import coal. However, they indicate
divergent numbers for coal use based on different databases. To distribute imports among the
two, the base of no substitute for coal in the sponge iron industry whereas cement industry’s
growing use of alternative fuel sources like the pet coke was considered. Hence, sponge iron’s
coal demand was given primacy before attributing any imported coal to the cement industry.
Once the sponge iron coal requirement (based upon projected demand) was fulfilled the
residual imports (after allocations to various sectors) were adjusted in the cement39 sector.
39 The actual usage of coal in cement is on a downtrend and could be even lower, any future coal usage
projections in the cement industry should be read with this disclaimer.

BROOKINGS INDIA | RESEARCH PAPER 072016-2
61| Coal Requirement in 2020: A Bottom-up Analysis
15 References
Australia, Rail Page. (2015). Australian Coal. Retrieved April 27, 2016, from
http://www.railpage.org.au: http://www.railpage.org.au/articles/coal.html
CEA. (2015, March). CEA Monthly Executive Summary Power Sector, April. Retrieved April 27, 2016,
from CEA Archives:
http://www.cea.nic.in/reports/monthly/executivesummary/2015/exe_summary-03.pdf
CEA. (2015, March 30). CEA, Planning. Retrieved 27 May, 2016, from CEA:
http://cea.nic.in/reports/others/planning/fm/coal_import_1516.pdf
CEA. (2016, June 1). CEA Monthly Executive Summary Power Sector, April. Retrieved June 1, 2016,
from CEA: http://cea.nic.in/reports/monthly/executivesummary/2016/exe_summary-
04.pdf
CEA. (2016, March). CEA Monthly Executive Summary Power Sector, March. Retrieved April 27,
2016, from CEA:
http://cea.nic.in/reports/monthly/executivesummary/2016/exe_summary-03.pdf
Central Electricity Authority, O. P. (2015, March 1). Central Electricity Authority, Operation
Performance and Monitoring Division. Retrieved May 28, 2016, from Central Electricity
Authority:
http://www.cea.nic.in/reports/monthly/generation/2015/March/actual/opm_01.pdf
Chandra Bhushan, P. B. (2015). Heat on Power: Green Rating of Coal-based Power Plants. N ew
Delhi: Centre for Science and Environment.
CIL. (2016, April 2). Physical Perfromance, CIL. Retrieved June 3, 2016, from
https://www.coalindia.in/en-us/performance/physical.aspx
Coal Controller Organization. (2016, February 9). www.coal.nic.in. Retrieved February 9, 2016,
from www.coal.nic.in:
http://coal.nic.in/sites/upload_files/coal/files/coalupload/Provisional1415.pdf
Commission, P. (2016, January 27). www.planningcommission.nic.in. Retrieved January 27, 2016,
from Planning Commision of India:
http://planningcommission.nic.in/sectors/index.php?sectors=energy
IANS. (2015, January 16). Reuters India. Retrieved April 27, 2016, from http://www.business-
standard.com/article/news-ians/1-5-billion-tonnes-coal-production-aimed-by-2020-
official-115011601021_1.html
IEA. (2012, January 1). www.IEA.org. Retrieved June 30, 2016, from www.IEA.org:
http://www.iea.org/publications/freepublications/publication/TechnologyRoadmapHighEf
ficiencyLowEmissionsCoalFiredPowerGeneration_WEB_Updated_March2013.pdf
IGEN, I.-G. E. (2008, March 31). CEA. Retrieved March 7, 2016, from Central Electricity Authority:
http://www.cea.nic.in/reports/others/thermal/tpece/report_85_pul_coal.pdf

BROOKINGS INDIA | RESEARCH PAPER 072016-2
62| Coal Requirement in 2020: A Bottom-up Analysis
IGIDR. (2016, January 27). www.igidr.ac.in. Retrieved January 27, 2016, from IGIDR:
http://www.igidr.ac.in/pdf/publication/WP-2015-01.pdf
India Cement Review. (2016, January 27). www.indiancementreview.com. Retrieved January 27,
2016, from India Cement Review:
http://www.indiancementreview.com/News.aspx?nId=P/gU9WdDlZb/3t6KtUVN6A==
India Energy Government. (2014). Thermal Power generation. Retrieved May 23, 2016, from
Indiaenergy.gov.in: http://indiaenergy.gov.in/docs/Thermal-power-generation-
documentation.pdf
India Environmental Portal. (2015). Coal Target -2020. Retrieved from
http://www.indiaenvironmentportal.org.in/files/file/Energy_stats_2015_0.pdf
India Inframonitor. (2015-16). India Infra monitor: Power. Retrieved from
www.indiainframonitor.com
IndiaStat. (2016, February 9). Indiastat. Retrieved February 9, 2016, from
http://www.indiastat.com/minesandminerals/23/coalmines/63/productionofcoalandlignit
e19512016/722493/stats.aspx
IndiaStat. (2016, February 9). IndiaStat. Retrieved February 9, 2016, from
http://www.indiastat.com/table/power/26/thermalpowergenerationcapacity/449918/7167
21/data.aspx
Indonesia, Rich coal. (2015). Rich coal Indonesia. Retrieved March 27, 2016, from
http://www.richcoalindonesia.com:
http://www.richcoalindonesia.com/?page=specifications
Infomine. (2016, July 1). http://www.infomine.com/investment/metal-prices/coal/. Retrieved from
http://www.infomine.com: http://www.infomine.com/investment/metal-prices/coal/all/
Ministry of Coal. (2014-15). Provisional Coal Statistics 2014-15. New Delhi: MoC.
Ministry of Coal. (2015, February 9). http://coal.nic.in. Retrieved February 9, 2016, from
http://coal.nic.in:
http://coal.nic.in/sites/upload_files/coal/files/coalupload/chap6AnnualReport1415en.pdf
MJunction. (2016, February 29). VOL VIII, ISSUE IV. Indian Coal Market Watch, pp. 167-189, 191-
195.
MoC, A. r.-1. (2016, February 9). http://coal.nic.in/. Retrieved February 9, 2016, from
http://coal.nic.in/sites/upload_files/coal/files/coalupload/chap7AnnualReport1415en.pdf
Mohan, R. (2001, January 1). www.rakeshmohan.com. Retrieved July 3, 2016, from
www.rakeshmohan.com: http://www.rakeshmohan.com/docs/Railway_Report.pdf
O'Neill, K. M. (2016, January 16). MIT News | MIT Energy Initiative . Retrieved January 27, 2016,
from http://news.mit.edu/2016/tata-researchers-tackle-rural-electrification-0121
Planning Commision. (2014, September 18). The Planning Commision. Retrieved February 9, 2016,
from http://planningcommission.nic.in/sectors/index.php?sectors=energy

BROOKINGS INDIA | RESEARCH PAPER 072016-2
63| Coal Requirement in 2020: A Bottom-up Analysis
Planning Commission. (2012, January 27). The Planning Commission. Retrieved January 27, 2016,
from Planning Commission: http://planningcommission.gov.in/hackathon/Energy.pdf
Press Bureau. (2015, March 12). Initiatives to Improve the Efficiency of Coal Based Power Plants .
Retrieved from http://pib.nic.in/newsite/PrintRelease.aspx?relid=116893
Press Information Bureau. (2015, March 19). www.PIB.nic.in. Retrieved June 2, 2016, from
http://pib.nic.in/newsite/PrintRelease.aspx?relid=117379
PTI. (2015, May 1). Economic Times. Retrieved May 25, 2016, from
http://articles.economictimes.indiatimes.com/2015-05-01/news/61723885_1_coal-
offtake-record-production-april-2015
PTI. (2015, November 07). Live Mint. Retrieved January 27, 2016, from
http://www.livemint.com/Industry/99oOe4kY9iP5V8r4eXknaI/175-GW-green-energy-
target-a-big-challenge-Suresh-Prabhu.html
PTI. (2015, May 04). Moneycontrol. Retrieved February 3, 2016, from
http://www.moneycontrol.com/news/business/coal-india-registers-107-
growthproduction_1373534.html
PTI. (2015, November 2). The Economic times. Retrieved May 27, 2016, from
http://articles.economictimes.indiatimes.com/2015-11-02/news/67953501_1_imported-
coal-indonesian-coal-ash-content
PTI. (2015, November 2). The Economic Times. Retrieved May 26, 2016, from
http://articles.economictimes.indiatimes.com:
http://articles.economictimes.indiatimes.com/2015-11-02/news/67953501_1_imported-
coal-indonesian-coal-ash-content
Srinivasan, R. (2015, July 12). Hindu Business Line. Retrieved May 25, 2016, from
http://www.thehindubusinessline.com/companies/coal-indias-road-to-a-billion-
tonnes/article7414004.ece
Steel, M. o. (2016, January 27). Ministry of Steel. Retrieved January 27, 2016, from
www.steel.gov.in: http://steel.gov.in/Long%20Term%20Perspectives.pdf
Technology, M. (2014). World Biggest coal Reserve. Retrieved March 27, 2016, from
http://www.mining-technology.com/features/feature-the-worlds-biggest-coal-reserves-
by-country/
Tongia, R. (2014, Spetmber 9). www.brookings.in. Retrieved July 3, 2016, from www.brookings.in:
http://brookings.in/wp-content/uploads/2014/09/electrification-from-wire-to-service.pdf

BROOKINGS INDIA | RESEARCH PAPER 072016-2
64| Coal Requirement in 2020: A Bottom-up Analysis
Anurag Sehgal Anurag is an experienced mining engineer with a Masters in Public
Policy and Management from the Indian Institute of Management,
Bangalore. His research areas comprise, energy policy and
environment, sustainable development and coal. At Brookings India
he leads the research on coal and allied energy sectors.
A mining graduate from ISM, Dhanbad, Anurag started his career as
a graduate trainee with Tata-Steel, moving to energy and chemicals
strategy consulting and research with Evalueserve between 2008 and 2012, where he spent a year
in Saudi Arabia consulting for SABIC on India and China business strategy. Most recently Anurag
was associated with Rio Tinto India, leading the business and financial analysis of Bunder diamonds
project, based out of Bhopal.
Rahul Tongia Dr. Rahul Tongia is a Fellow at Brookings India / the Brookings
Institution, and an Adjunct Professor at Carnegie Mellon University,
where he was on the faculty for many years with appointments in the
Dept. of Engineering & Public Policy and School of Computer Science.
His areas of research are broad and interdisciplinary, spanning
technology and policy, with domain expertise in energy/power and
IT/telecom.
He was previously co-founder and Principal Research Scientist/Program Director at the Center for
Study of Science, Technology, and Policy (CSTEP), a Bangalore-based not-for-profit, and
instrumental in setting up and was Advisor to the leading bodies for Smart Grids in India, the
government’s Smart Grid Task Task Force and the India Smart Grid Forum.
His energy work has spanned seminal studies on India’s nuclear power programme, importing
natural gas, power pricing, and political economy. Current areas of focus include Smart Grids,
access to energy, political economy and reforms, and sustainable energy.
Dr. Tongia has a Ph.D. in Engineering and Public Policy from Carnegie Mellon University and a Sc.B.
in Electrical Engineering from Brown University.
Authors

BROOKINGS INDIA | RESEARCH PAPER 072016-2
65| Coal Requirement in 2020: A Bottom-up Analysis
Research Contributor
Abhishek Mishra Abhishek works on issues of energy sustainability. His interests are in
Innovation, Project Planning, Data Analysis, Reverse Engineering,
Software Debugging, etc. Abhishek has a Masters in Engineering in
Electrical & Electronics from the University of Brighton, United
Kingdom, and received a fully funded “The Brighton-Pestalozzi
Scholarship” for his undergraduate course.

BROOKINGS INDIAQUALITY. INDEPENDENCE. IMPACT

QUALITY. INDEPENDENCE. IMPACT.
Brookings Institution India Center
No. 6, Second Floor
Dr. Jose P Rizal Marg
Chanakyapuri
New Delhi – 110021
www.brookings.in


