
Coastal Erosion Commission: public meetings
February – March 2015
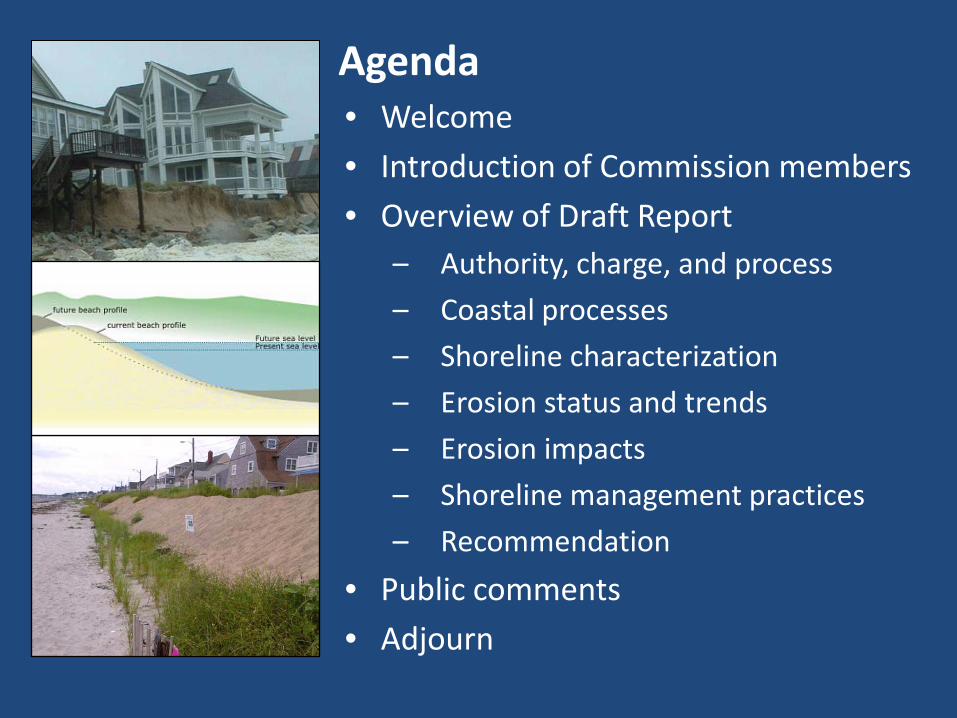
• Welcome • Introduction of Commission members • Overview of Draft Report
– Authority, charge, and process – Coastal processes – Shoreline characterization – Erosion status and trends – Erosion impacts – Shoreline management practices – Recommendation
• Public comments • Adjourn
Agenda

Commission members
Dan Sieger Asst. Secretary for Environment, MA Executive Office of Energy and Environmental Affairs
Bruce Carlisle Director, MA Office of Coastal Zone Management
Martin Suuberg Commissioner, MA Department of Environmental Protection
Jack Murray Commissioner, MA Department of Conservation and Recreation
Patricia Hughes Town of Brewster Selectman Lisa O’Donnell Town of Essex Selectman Doug Packer Town of Newbury Conservation Commission Anne Herbst Town of Hull Conservation Commission Jack Clarke Mass Audubon E. Robert Thieler U.S. Geological Survey Ron Barrett Plum Island Taxpayers Association Paul Schrader Citizen, Town of Sandwich
Commission authority and charge • Commission created by Massachusetts Legislature - Acts
of 2013, Chapter 38, §200, to: – Investigate and document levels and effects of coastal erosion
Develop strategies and recommendations to reduce, minimize or eliminate impacts on property, infrastructure, public safety, beaches and dunes
• Specific tasks include: – Develop a reasonable assessment of coastal erosion rates – Appraise damage since 1978 – Estimate damages in next 10 years – Evaluate current regulations and laws – Review current practices and programs – Develop recommendations

Commission process • Commission meetings:
– March 27, 2014: review charge, establish and task 3 Working Groups, review related efforts, and plan for public workshops
– July 31, 2014: review input and information from 5 public workshops, updates from Working Groups, and deliberations
– October 16, 2014: review and discuss Working Group reports, deliberations on preliminary recommendations and development of draft report
– November 6, 2014: review, discuss, and revise complete set of recommended strategies and actions, approve report outline
– December 5, 2014: review complete, preliminary draft report, discuss steps for finalizing draft report and seeking public review and comment
Working Groups • Commission established 3 Working Groups to provide
assistance in completing its charge • Information and content provided substantive foundation
for deliberations and development of report • Science and Technical Working Group
– Overview of coastal geology and processes, shoreline characterization, assessment of erosion rates
• Erosion Impacts Working Group – Appraise financial damage from 1978 to present, develop
estimate of damages in next 10 years • Legal and Regulatory Working Group
– Summarize and evaluate regulations and laws governing materials and means of erosion control
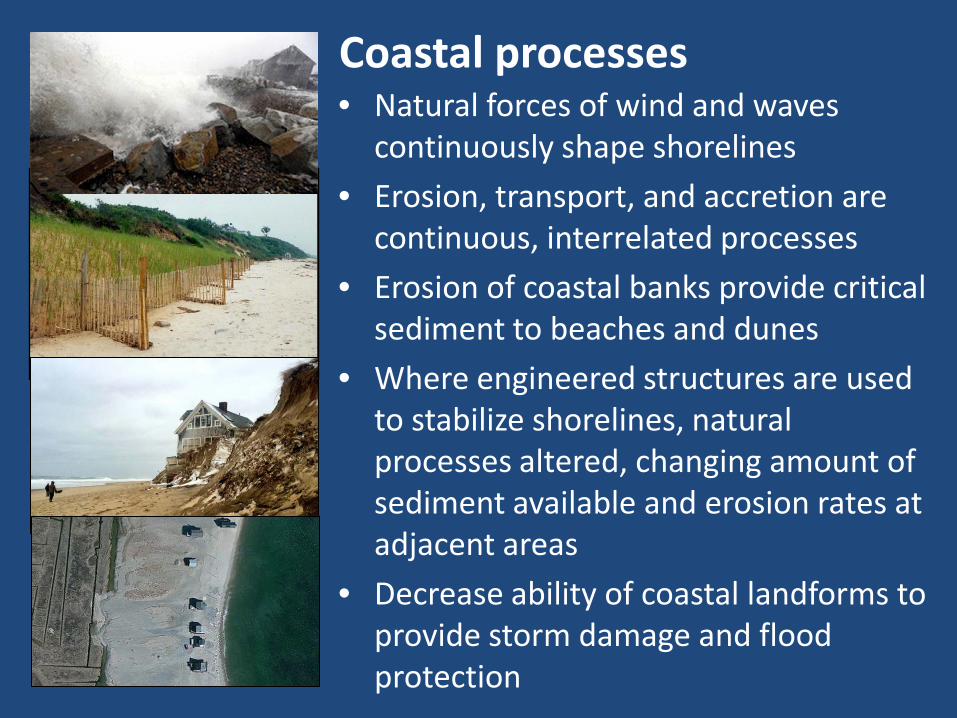
Coastal processes • Natural forces of wind and waves
continuously shape shorelines • Erosion, transport, and accretion are
continuous, interrelated processes • Erosion of coastal banks provide critical
sediment to beaches and dunes • Where engineered structures are used
to stabilize shorelines, natural processes altered, changing amount of sediment available and erosion rates at adjacent areas
• Decrease ability of coastal landforms to provide storm damage and flood protection
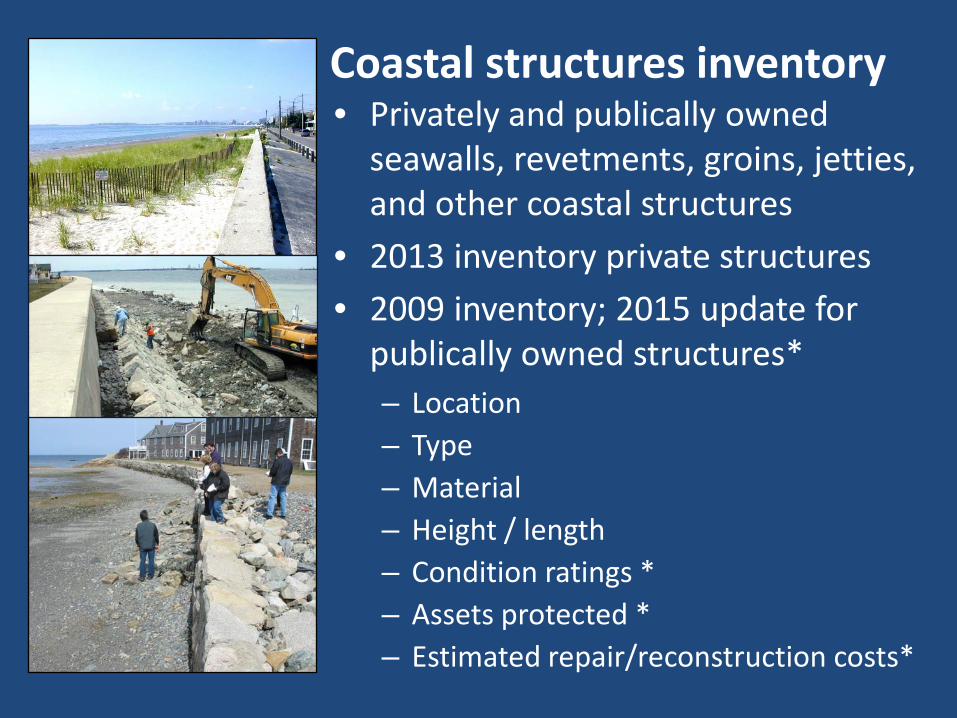
• Privately and publically owned seawalls, revetments, groins, jetties, and other coastal structures
• 2013 inventory private structures • 2009 inventory; 2015 update for
publically owned structures* – Location – Type – Material – Height / length – Condition ratings * – Assets protected * – Estimated repair/reconstruction costs*
Coastal structures inventory

Coastal engineered structures inventory
Region Shoreline
Length (miles)
Private Structure
Length (miles)
Public Structure
Length (miles)
Percent Shoreline
with Structure
North Shore 160 50 24 46%
Boston Harbor 57 12 21 58%
South Shore 129 28 29 44%
Cape Cod & Islands 615 66 11 13%
South Coastal 154 49 7 36%
TOTAL 1,115 205 92 27%
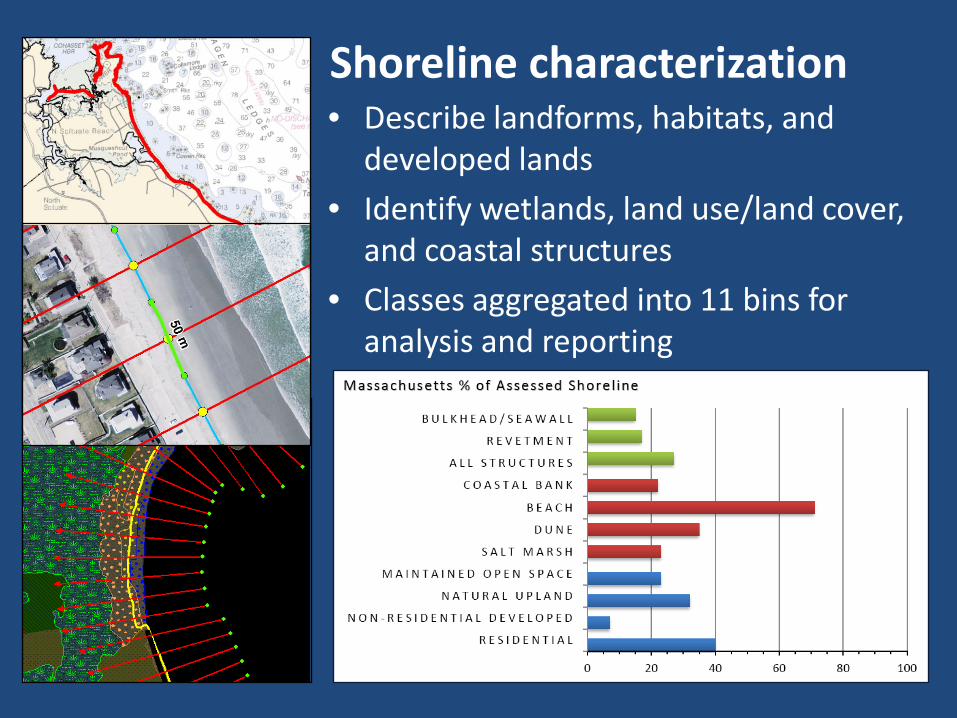
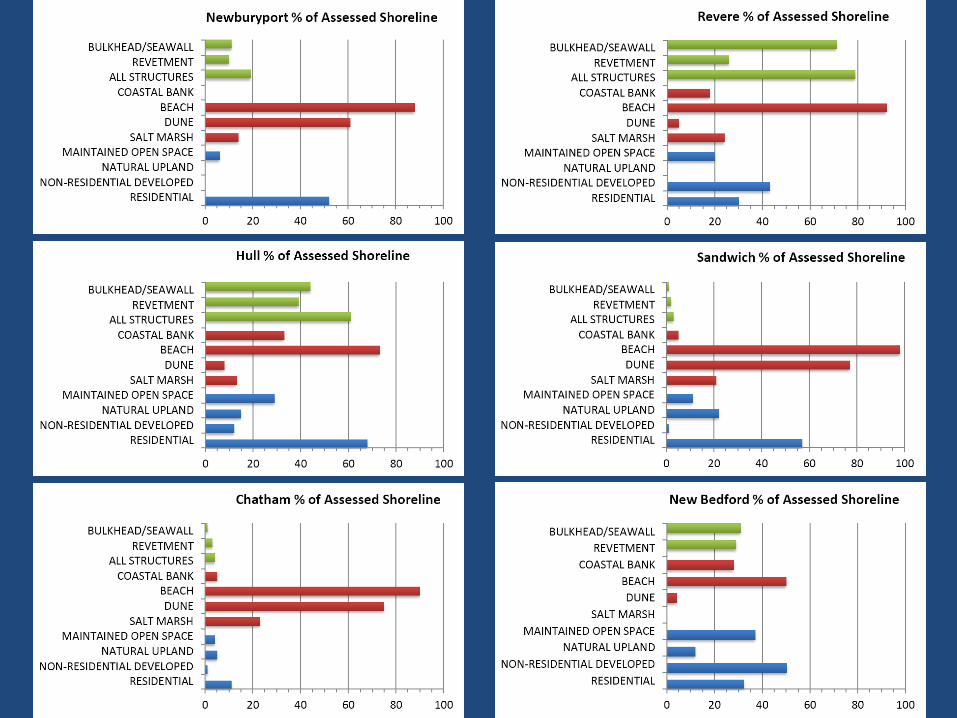
• Describe landforms, habitats, and developed lands
• Identify wetlands, land use/land cover, and coastal structures
• Classes aggregated into 11 bins for analysis and reporting
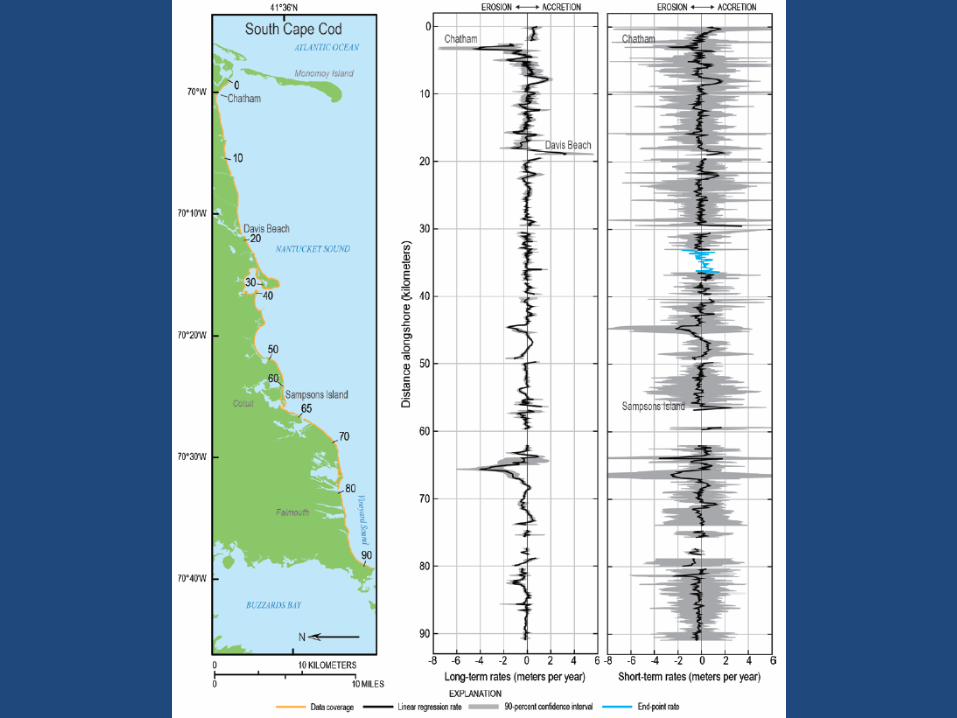
Shoreline characterization

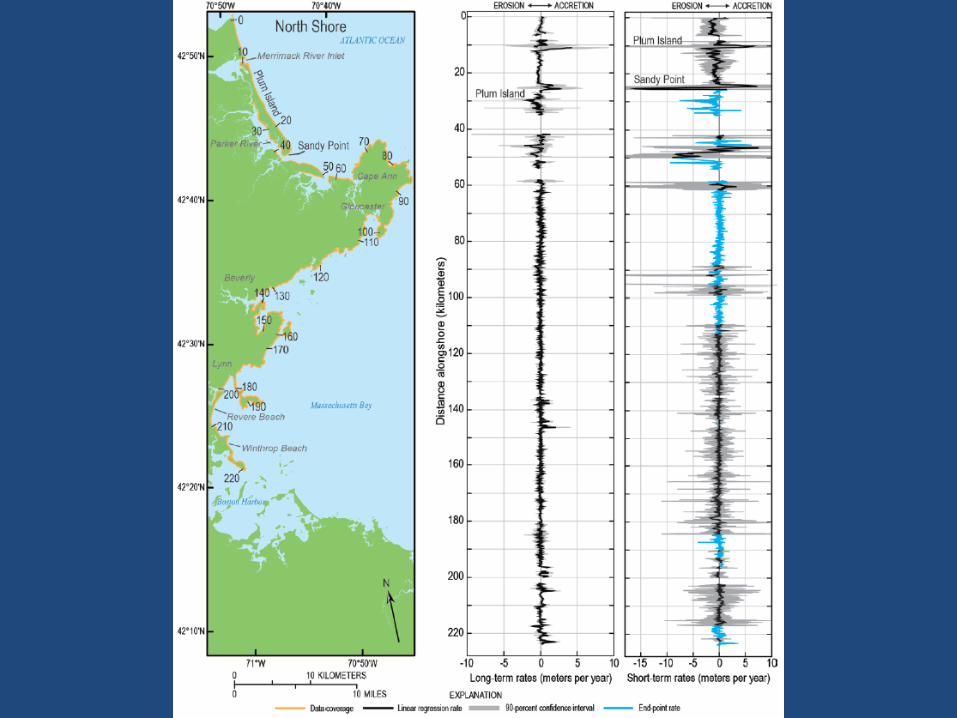
• Mapping and statistical analysis of shoreline locations
• Cooperative with USGS – Woods Hole Science Center and others
• Shorelines: ~ 1846, 1887, 1955, 1978, 1994, 2000, 2009
• 26,000 transects along exposed shore (50m intervals)
• Long-term (~150-year) and short-term (~30-year) change rates
• Data available on CZM’s interactive online mapping tool - MORIS
• USGS Open-File Report 2012–1189
Shoreline change


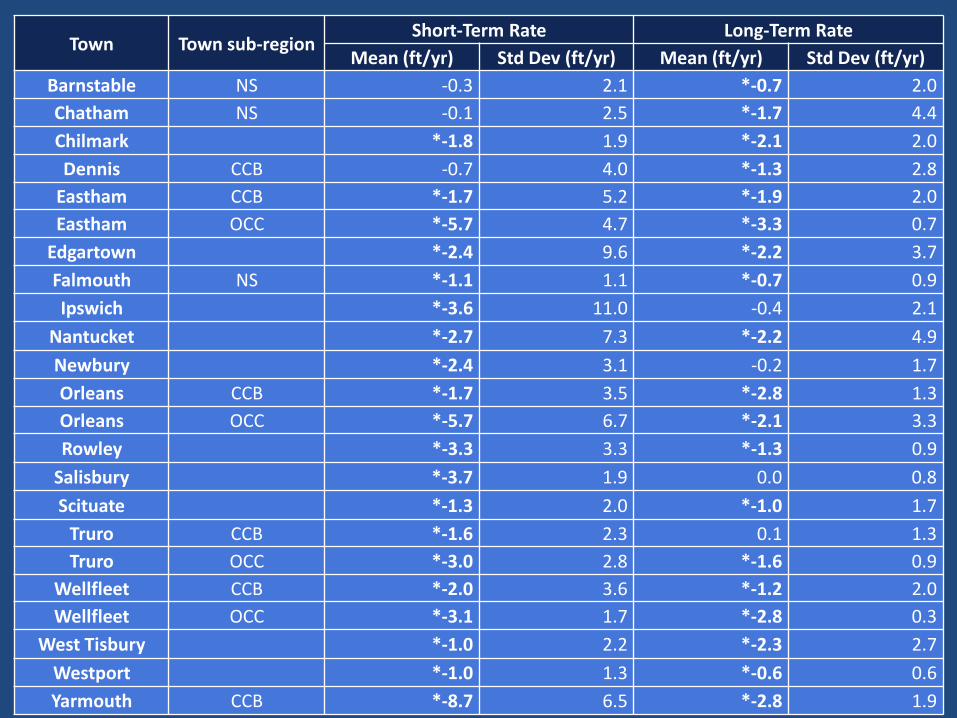
Town Town sub-region Short-Term Rate Long-Term Rate
Mean (ft/yr) Std Dev (ft/yr) Mean (ft/yr) Std Dev (ft/yr) Barnstable NS -0.3 2.1 *-0.7 2.0 Chatham NS -0.1 2.5 *-1.7 4.4 Chilmark *-1.8 1.9 *-2.1 2.0 Dennis CCB -0.7 4.0 *-1.3 2.8
Eastham CCB *-1.7 5.2 *-1.9 2.0 Eastham OCC *-5.7 4.7 *-3.3 0.7
Edgartown *-2.4 9.6 *-2.2 3.7 Falmouth NS *-1.1 1.1 *-0.7 0.9 Ipswich *-3.6 11.0 -0.4 2.1
Nantucket *-2.7 7.3 *-2.2 4.9 Newbury *-2.4 3.1 -0.2 1.7 Orleans CCB *-1.7 3.5 *-2.8 1.3 Orleans OCC *-5.7 6.7 *-2.1 3.3 Rowley *-3.3 3.3 *-1.3 0.9
Salisbury *-3.7 1.9 0.0 0.8 Scituate *-1.3 2.0 *-1.0 1.7
Truro CCB *-1.6 2.3 0.1 1.3 Truro OCC *-3.0 2.8 *-1.6 0.9
Wellfleet CCB *-2.0 3.6 *-1.2 2.0 Wellfleet OCC *-3.1 1.7 *-2.8 0.3
West Tisbury *-1.0 2.2 *-2.3 2.7 Westport *-1.0 1.3 *-0.6 0.6 Yarmouth CCB *-8.7 6.5 *-2.8 1.9

Erosion “hot spot” areas (north to south) Community Location
Salisbury Salisbury Beach Newburyport Plum Island
Newbury Plum Island Hull Nantasket Beach, Crescent Beach
Scituate Glades; Oceanside Drive; Lighthouse Point; Peggotty
Beach; Humarock Beach (northern half) Marshfield Fieldston to Brant Rock; Bay Ave
Plymouth Saquish; Long Beach (southern end) ; White Horse
Beach; Nameloc Heights Sandwich Town Neck Beach
Dennis Chapin Beach Nantucket Siasconset Edgartown Wasque Point Oak Bluffs Inkwell Beach Gosnold Barges Beach
Westport East Beach

• Commission conducted a review of shoreline change forecasting approaches
• Two types of methods – Statistics-based: use linear
regression analysis and extrapolate rates forward
– Process-based: combine historical observations with data from wave processes
• With support from USGS and CZM, Commission piloted a process-based approach using “Kalman filter”
Forecasting shoreline change
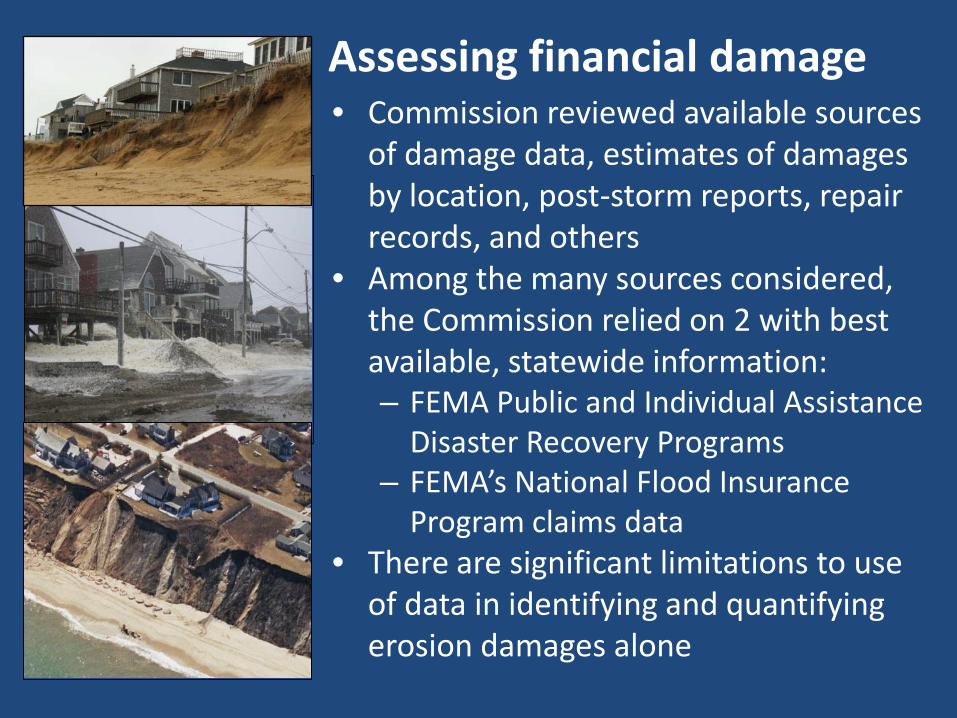
Assessing financial damage • Commission reviewed available sources
of damage data, estimates of damages by location, post-storm reports, repair records, and others
• Among the many sources considered, the Commission relied on 2 with best available, statewide information: – FEMA Public and Individual Assistance
Disaster Recovery Programs – FEMA’s National Flood Insurance
Program claims data • There are significant limitations to use
of data in identifying and quantifying erosion damages alone

Estimating damage costs • FEMA payments for federal disaster
declarations for events with coastal impacts (e.g., flooding and erosion) since 1978 total more than $600 M
• Data show that major events far outweigh costs of more frequent and less damaging events
• Total costs from FEMA’s National Flood Insurance Program claims for all coastal events since 1978 were nearly $370 M
• Northeast-facing shorelines more susceptible to significant damage on a frequent basis from “Northeaster” storms
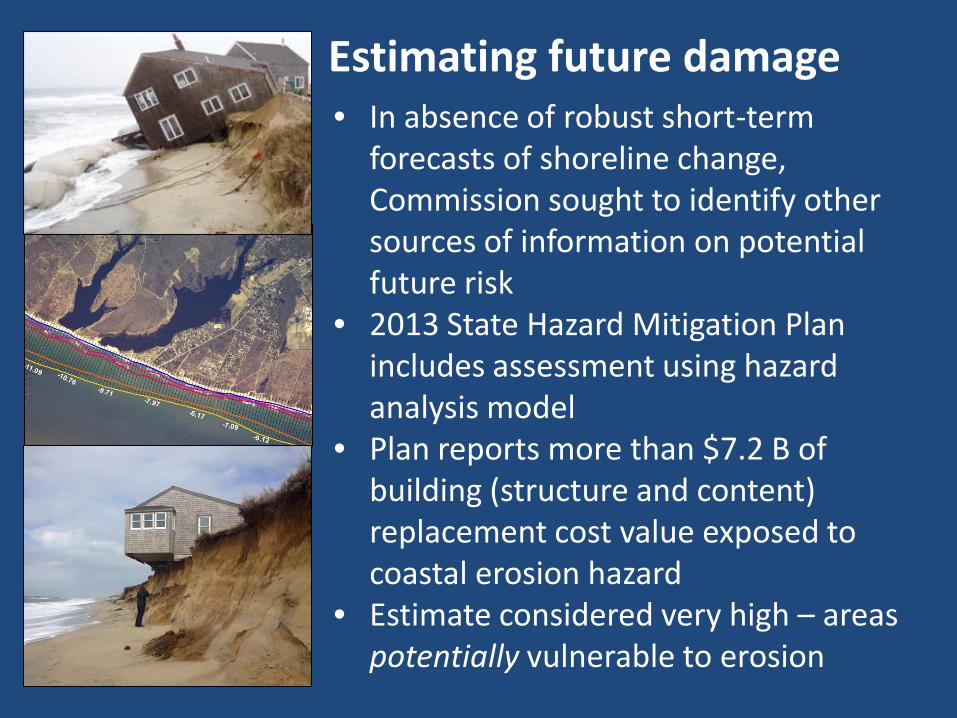
Estimating future damage • In absence of robust short-term
forecasts of shoreline change, Commission sought to identify other sources of information on potential future risk
• 2013 State Hazard Mitigation Plan includes assessment using hazard analysis model
• Plan reports more than $7.2 B of building (structure and content) replacement cost value exposed to coastal erosion hazard
• Estimate considered very high – areas potentially vulnerable to erosion
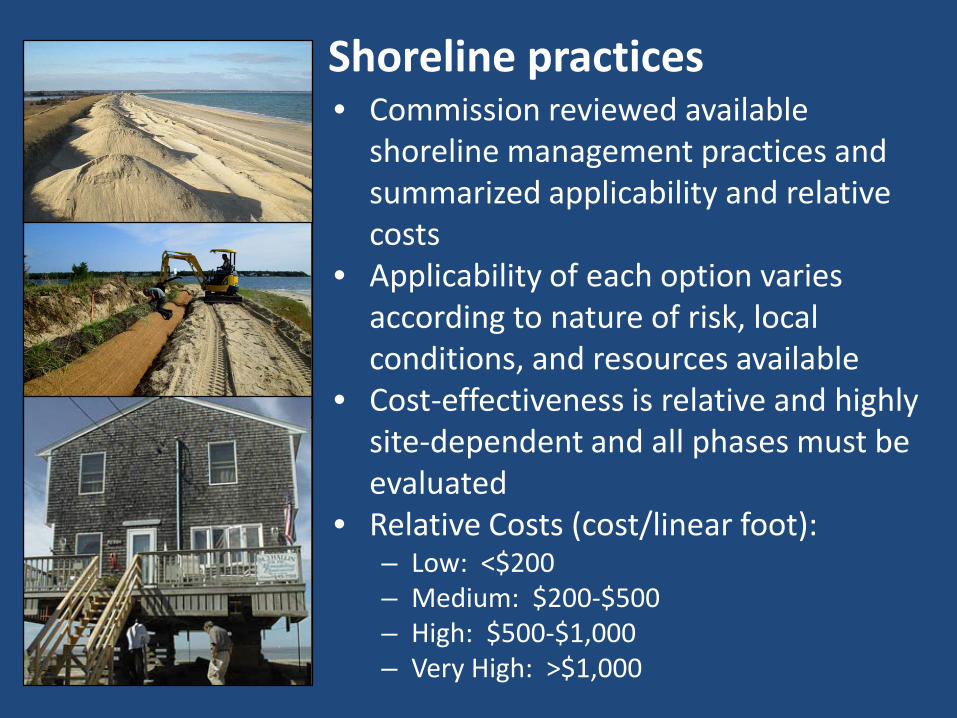
Shoreline practices • Commission reviewed available
shoreline management practices and summarized applicability and relative costs
• Applicability of each option varies according to nature of risk, local conditions, and resources available
• Cost-effectiveness is relative and highly site-dependent and all phases must be evaluated
• Relative Costs (cost/linear foot): – Low: <$200 – Medium: $200-$500 – High: $500-$1,000 – Very High: >$1,000
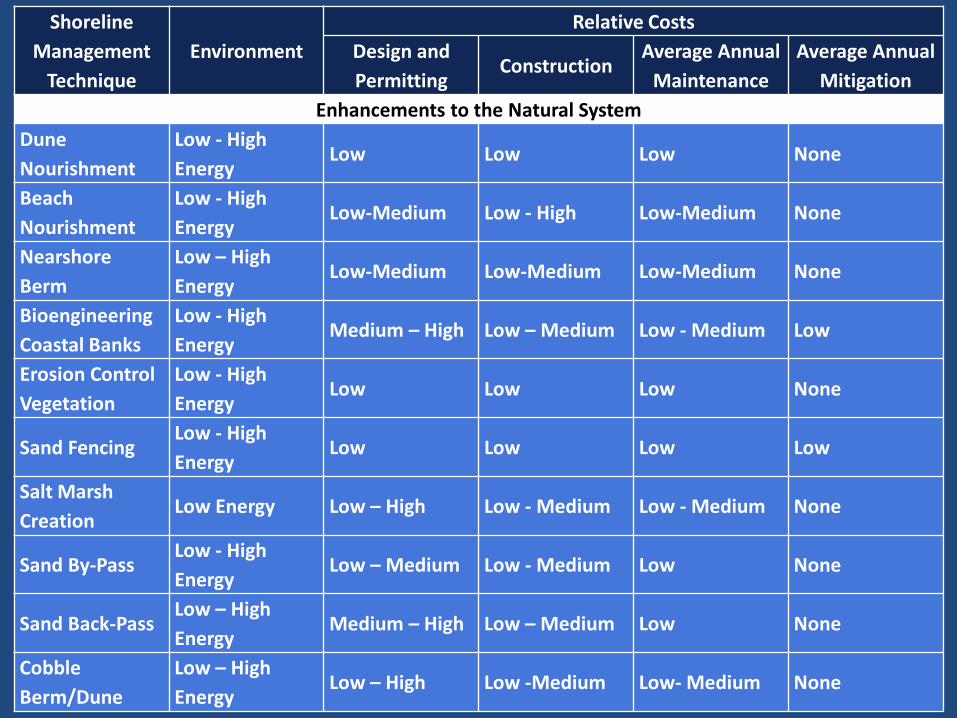
Shoreline Management
Technique Environment
Relative Costs Design and Permitting
Construction Average Annual
Maintenance Average Annual
Mitigation Enhancements to the Natural System
Dune Nourishment
Low - High Energy
Low Low Low None
Beach Nourishment
Low - High Energy
Low-Medium Low - High Low-Medium None
Nearshore Berm
Low – High Energy
Low-Medium Low-Medium Low-Medium None
Bioengineering Coastal Banks
Low - High Energy
Medium – High Low – Medium Low - Medium Low
Erosion Control Vegetation
Low - High Energy
Low Low Low None
Sand Fencing Low - High Energy
Low Low Low Low
Salt Marsh Creation
Low Energy Low – High Low - Medium Low - Medium None
Sand By-Pass Low - High Energy
Low – Medium Low - Medium Low None
Sand Back-Pass Low – High Energy
Medium – High Low – Medium Low None
Cobble Berm/Dune
Low – High Energy
Low – High Low -Medium Low- Medium None
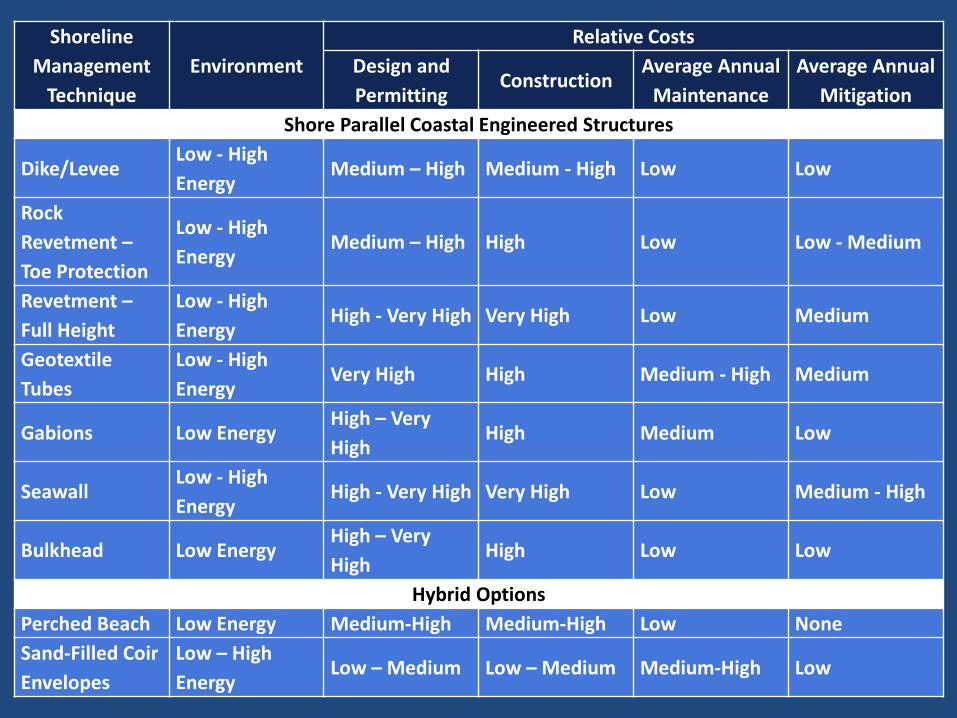
Shoreline Management
Technique Environment
Relative Costs Design and Permitting
Construction Average Annual
Maintenance Average Annual
Mitigation Shore Parallel Coastal Engineered Structures
Dike/Levee Low - High Energy
Medium – High Medium - High Low Low
Rock Revetment – Toe Protection
Low - High Energy
Medium – High High Low Low - Medium
Revetment – Full Height
Low - High Energy
High - Very High Very High Low Medium
Geotextile Tubes
Low - High Energy
Very High High Medium - High Medium
Gabions Low Energy High – Very High
High Medium Low
Seawall Low - High Energy
High - Very High Very High Low Medium - High
Bulkhead Low Energy High – Very High
High Low Low
Hybrid Options Perched Beach Low Energy Medium-High Medium-High Low None Sand-Filled Coir Envelopes
Low – High Energy
Low – Medium Low – Medium Medium-High Low

Shoreline Management
Technique Environment
Relative Costs
Design and Permitting
Construction Average Annual
Maintenance Average Annual
Mitigation
Nearshore and Offshore Coastal Engineered Structures
Nearshore Breakwater
Low- High Energy
Medium – High
High – Very High
Low Low
Offshore Breakwater
Low - High Energy
Very High Very High Low None
Adapting Existing Buildings and Infrastructure
Relocate Buildings
Low - High Energy
Low Very High None None
Relocate Roads &Infrastructure
Low - High Energy
Low Very High None None
Elevate Existing Buildings
Low - High Energy
Low Very High Low None
Shore Perpendicular Coastal Engineered Structures
Groin Low - High Energy
Very High Very High Low Low - High
Jetty Low - High Energy
Very High Very High Low Low - High
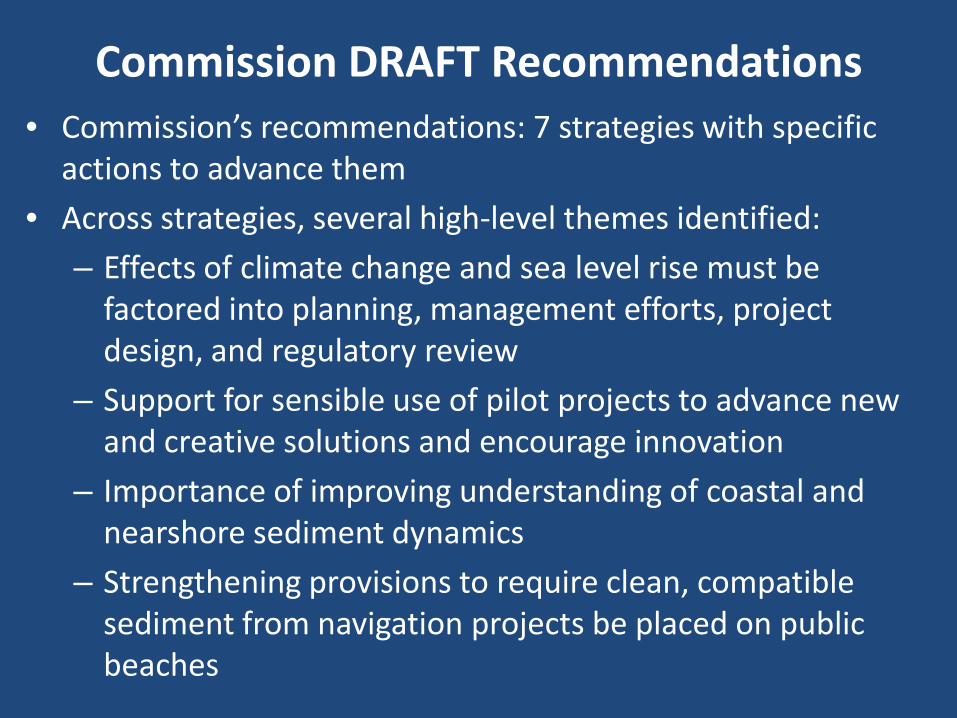
Commission DRAFT Recommendations • Commission’s recommendations: 7 strategies with specific
actions to advance them • Across strategies, several high-level themes identified:
– Effects of climate change and sea level rise must be factored into planning, management efforts, project design, and regulatory review
– Support for sensible use of pilot projects to advance new and creative solutions and encourage innovation
– Importance of improving understanding of coastal and nearshore sediment dynamics
– Strengthening provisions to require clean, compatible sediment from navigation projects be placed on public beaches
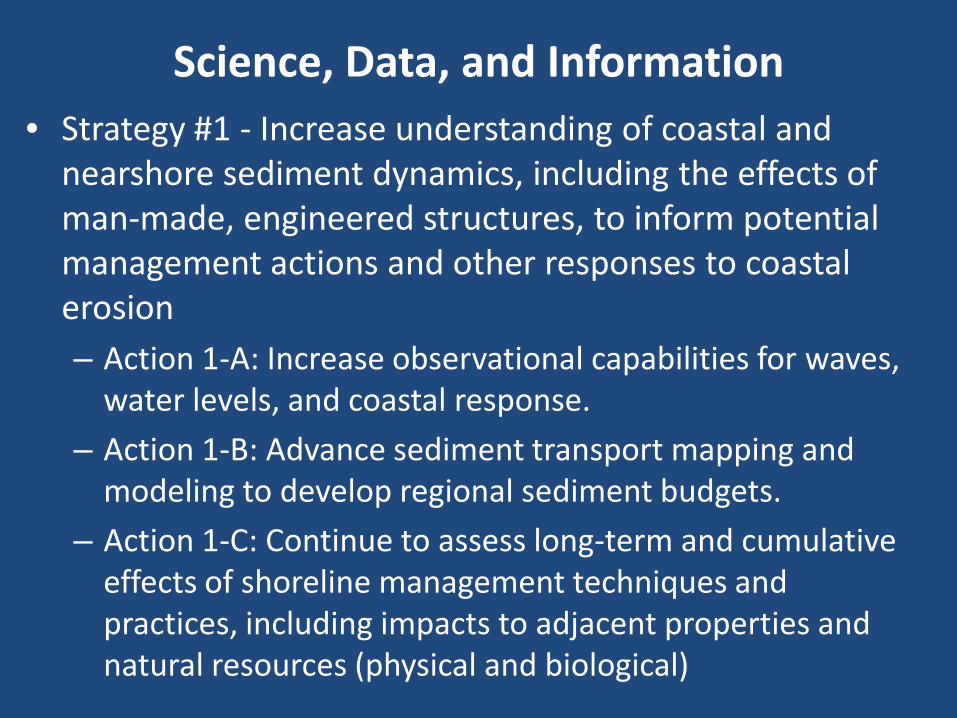
Science, Data, and Information • Strategy #1 - Increase understanding of coastal and
nearshore sediment dynamics, including the effects of man-made, engineered structures, to inform potential management actions and other responses to coastal erosion – Action 1-A: Increase observational capabilities for waves,
water levels, and coastal response. – Action 1-B: Advance sediment transport mapping and
modeling to develop regional sediment budgets. – Action 1-C: Continue to assess long-term and cumulative
effects of shoreline management techniques and practices, including impacts to adjacent properties and natural resources (physical and biological)
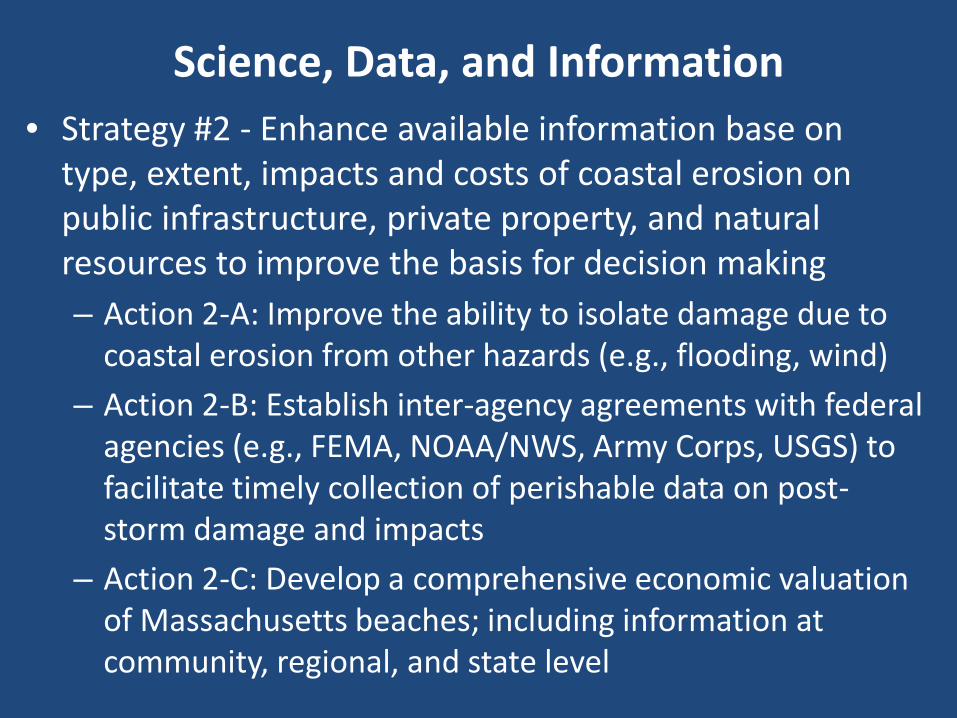
Science, Data, and Information • Strategy #2 - Enhance available information base on
type, extent, impacts and costs of coastal erosion on public infrastructure, private property, and natural resources to improve the basis for decision making – Action 2-A: Improve the ability to isolate damage due to
coastal erosion from other hazards (e.g., flooding, wind) – Action 2-B: Establish inter-agency agreements with federal
agencies (e.g., FEMA, NOAA/NWS, Army Corps, USGS) to facilitate timely collection of perishable data on post-storm damage and impacts
– Action 2-C: Develop a comprehensive economic valuation of Massachusetts beaches; including information at community, regional, and state level

Science, Data, and Information • Strategy #3 - Improve mapping and identification of
coastal high hazard areas to inform managers, property-owners, local officials and the public – Action 3-A: Develop estimates of future shoreline change
by assessing use of approaches that combine model-derived and observed positions of shoreline change
– Action 3-B: Improve ability to assess vulnerability of sites by characterizing geologic and geographic variables that are not currently accounted for in inundation maps
– Action 3-C: Produce comprehensive online atlas of potential flood inundation areas from a range of scenarios, including different timescales and intensities

Legal and Policy • Strategy #4 - Reduce and minimize the impacts of
erosion (and flooding) on property, infrastructure, and natural resources by siting new development and substantial re-development away from high hazard areas and incorporating best practices in projects – Action 4-A: Evaluate the applicability, benefits, concerns
and legal authority for coastal hazard area setbacks – Action 4-B: Develop and promulgate performance
standards for Land Subject to Coastal Storm Flowage under the state Wetlands Protection Act
– Action 4-C: Adopt the 2015 International Building Codes for structures in floodplains, including freeboard requirements for buildings in “A zones”

Legal and Policy • Strategy #4 - Reduce and minimize the impacts of
erosion (and flooding) on property, infrastructure, and natural resources by siting new development and substantial re-development away from high hazard areas and incorporating best practices in projects (cont.) – Action 4-D: Incorporate assessment of sea level rise
impacts during regulatory review of coastal projects and evaluate alternatives that eliminate/reduce impacts
– Action 4-E: Finalize and release guidance document Applying the Massachusetts Coastal Wetlands Regulations – A Practical Guide for Conservation Commissions to Protect the Storm Damage Prevention and Flood Control Functions of Coastal Resource Areas
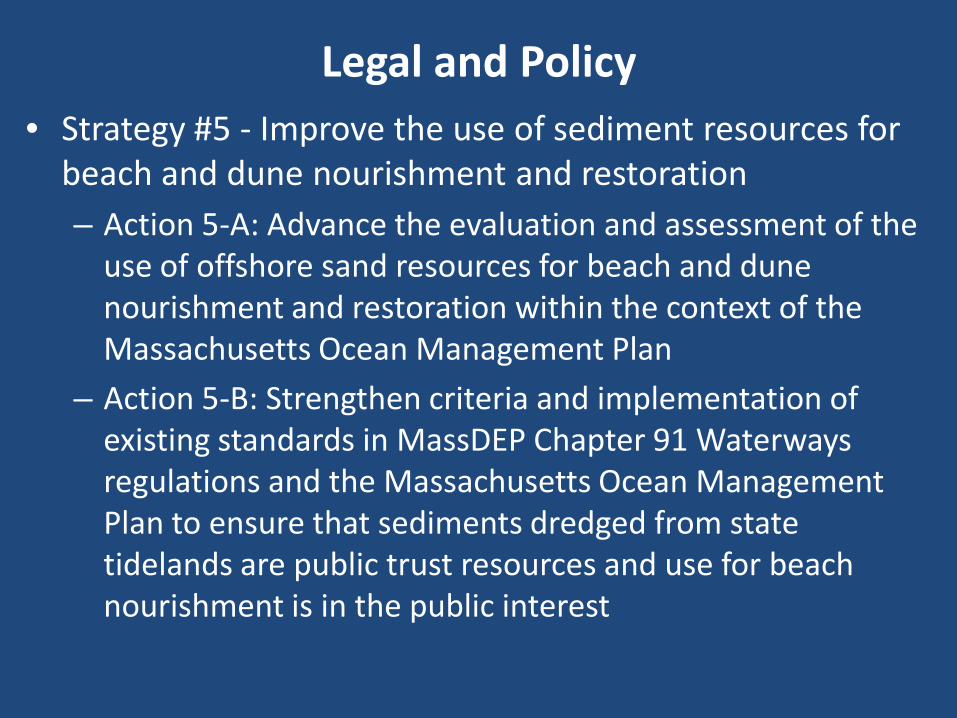
Legal and Policy • Strategy #5 - Improve the use of sediment resources for
beach and dune nourishment and restoration – Action 5-A: Advance the evaluation and assessment of the
use of offshore sand resources for beach and dune nourishment and restoration within the context of the Massachusetts Ocean Management Plan
– Action 5-B: Strengthen criteria and implementation of existing standards in MassDEP Chapter 91 Waterways regulations and the Massachusetts Ocean Management Plan to ensure that sediments dredged from state tidelands are public trust resources and use for beach nourishment is in the public interest

Legal and Policy • Strategy #5 - Improve the use of sediment resources for
beach and dune nourishment and restoration (cont.) – Action 5-C: Support advancement of top policy position in
joint CSO and ASBPA Call for the Improved Management of America’s Beaches for national policy to ensure that beach-compatible dredged materials are beneficially used
– Action 5-D: Explore and implement regional dredging programs to allow for greater efficiencies and cost-effectiveness
– Action 5-E: Improve effectiveness of beach nourishment projects by reviewing and potentially adjusting standards and policies that restrict placement of sand below mean high water on the nourished beach
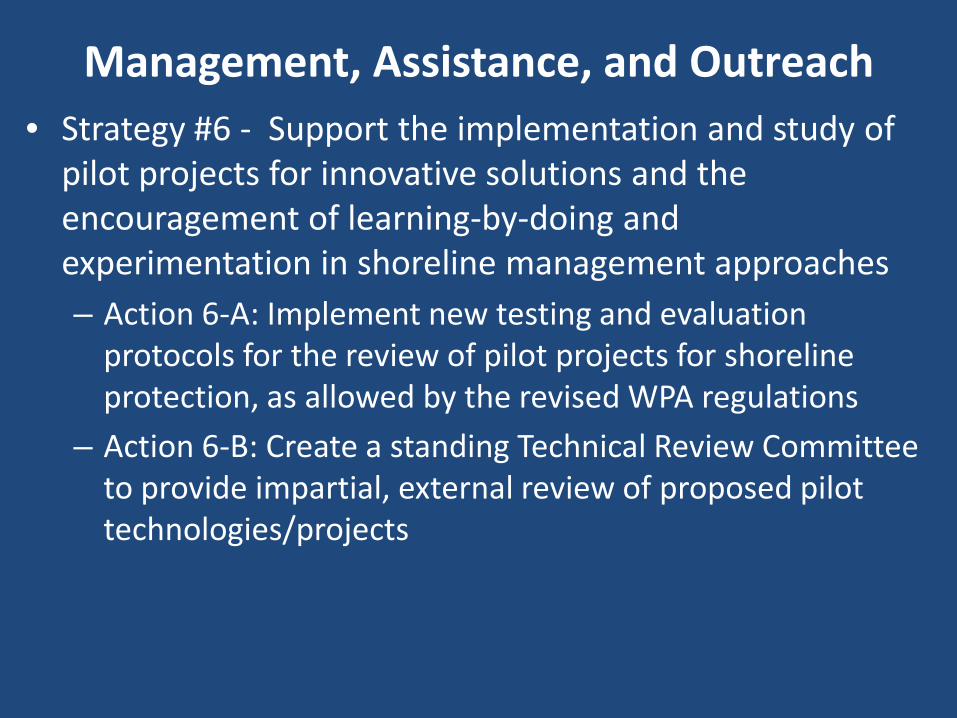
Management, Assistance, and Outreach • Strategy #6 - Support the implementation and study of
pilot projects for innovative solutions and the encouragement of learning-by-doing and experimentation in shoreline management approaches – Action 6-A: Implement new testing and evaluation
protocols for the review of pilot projects for shoreline protection, as allowed by the revised WPA regulations
– Action 6-B: Create a standing Technical Review Committee to provide impartial, external review of proposed pilot technologies/projects

Management, Assistance, and Outreach • Strategy #7 - Maintain and expand technical and
financial assistance and communication and outreach to communities to support local efforts to address the challenges of erosion, flooding, storms, sea level rise, and other climate change impacts – Action 7-A: Continue and expand the new Coastal
Community Resilience and Green Infrastructure for Coastal Resilience grants, that provide funds to cities and towns to increase awareness of hazards and risks, assess vulnerabilities, identify and implement measures to increase community resilience, and implement natural and nonstructural approaches, called green infrastructure
Management, Assistance, and Outreach • Strategy #7 - Maintain and expand technical and
financial assistance and communication and outreach to communities to support local efforts to address the challenges of erosion, flooding, storms, sea level rise, and other climate change impacts (cont.) – Action 7-B: Support implementation of voluntary program
that facilitates “buy-back” of high hazard or storm-damaged properties, as supported by cost/benefit analyses and other assessments.
– Action 7-C: Increase public awareness of coastal processes, storm events, and risks associated with development on/near coastal shorelines and floodplains; promote understanding and adoption of best practices

Public meetings and comment • Commission’s report released January 7, 2015 • Available for 90-day public comment period and 5
regional public hearings • Comments due 5:00 p.m., Tuesday, April 7, 2015 • To submit comments via email, please send to:
[email protected] or Coastal Erosion Commission c/o Massachusetts Office of Coastal Zone Management ATTN: Coastal Erosion Commission Report 251 Causeway Street, Suite 800 Boston, MA 02114

Coastal Erosion Commission: http://www.mass.gov/eea/erosion-commission


