
Form Approvedx REPORT DOCUMENTATION PAGE OMB No. 0704-0188
Public reporting burden for this collect on of nformation is estimated to averaqe I hour per res ose, including the time for revewing in tructons. searchirg existing data sources.gatherng and mailtalinng the data needed. and completing and reviewing the collection of information Send comments re arding this burden estimate or any other amoect of thisCollection I in sfmation icludhrg auqgestions for reducing this ourcen, to Washington Headquarters Services. Directorate for information Operations and Reports. 15 JeffersonDavis Highway. Suite 1204, Arlington, VA 22202-4302. and to the Office of Management and Budget. Paperwork Reduction Project (0
70
4-0188). Washington, DC 20503.
1. AGENCY USE ONLY (Leave bank) 2. REPORT DATE 3. REPORT TYPE AND DATES COVERED1990 Thesis &xx
4. TITLE AND SUBTITLE 5. FUNDING NUMBERSMODEL COMPOUND INTERACTIONS CHARACTERIZING AQUATICHUNI C SUBSTANCES
6. AUTtIOR(S)
JOSEPH EMMANUEL CASTRO AD-A224 4817. PERFORMING ORGANIZATION NAME(S) AND ADDRESS(ES) 8. PERFORMING ORGANIZATION
AFIT Student at: Univ of Arizona REPORT NUMBERAFIT/CI/CIA - 90-050
9. SPONSORING/MONITORING AGENCY NAME(S) AND ADDRESS(ES) 10. SPONSORING / MONITORING
AFIT/CI AGENCY REPORT NUMBER
Wright-Ptatterson AFB OH 45433
11. SUPPLEMENTARY NOTES
12a. DISTRIBUTION / AVAILABILITY STATEMENT 12b. DISTRIBUTION CODE
Approved for Public Release lAW AFR 190-1Distribution UnlimitedERNEST A. HAYGOOD, ist Lt, USAFExecutive Officer, Civilian Institution Programs
13. ABSTRACT (Maximum 200 words)
DTIC.SELECTEAUGO 1 M
14. SUBJECT TERMS 15. NUMBER OF PAGES
15816. PRICE CODE
17. SECURITY CLASSIFICATION 18. SECURITY CLASSIFICATION 19. SECURITY CLASSIFICATION 20. LIMITATION OF ABSTRACTOF REPORT OF THIS PAGE OF ABSTRACT
UNCLASSIFIED I _
NSN 7540-01-280-5500 , " Standard Form 298 (Rev 2-89)9 1 , , ' I , ,(rd 'd by AN%. Sid 7314-9 0 , '

SUBJECT: Thesis Copy Request 3;1 AA-5cc
TO: AFIT/CIRD (Capt Pa ie)
Enclosed is a copy of my thesis per your request and per AFIT regulations.
Contact me at AVN 574-4430 if you have any other questions.
JOSEPH E. CASTRO, Captain, USAF AtchEx-Graduate Student Thesis (158 p.)University of Arizona
L AMl eOss, For
* TIS CRA&I
DTIC TAB0*U)H1"DOunced 0
_yCodes
DistjAi1. Adr
I'-a'-1113
Vr

MODEL COMPOUND INTERACTIONS
CHARACTERIZING AQUATIC HUMIC SUBSTANCES
by
Joseph Emmanuel Castro
A Thesis Submitted to the Faculty of the
DEPARTMENT OF CIVIL ENGINEERING AND ENGINEERING MECHANICS
In Partial Fulfillment of the RequirementsFor the Degree of
MASTER OF SCIENCEWITH A MAJOR IN CIVIL ENGINEERING
In the Graduate College
THE UNIVERSITY OF ARIZONA
1990
90 "

2
STATEMENT bY AUTHOR
This thesis has been submitted in partial fulfillmentof requirements for an advanced degree at The University of
Arizona and is deposited in the University Library to bemade available to borrowers under rules of the Library.
Brief quotations from this thesis are allowable withoutspecial permission, provided that accurate acknowledgment ofsource is made. Requests for permission for extendedquotation from or reproduction of this manuscript in wholeor in part may be granted by the head of the majordepartment or the Dean of the Graduate College when in hisjudgement the proposed use of the material is in theinterests of scholarship. In all other instances, however,permission must be obtained from the author.
SIGNED:
APPROVAL BY THESIS DIRECTOR
This thesis has been approved on the date shown below:
Gary L. Ary DateProfessor of Civil Engineering

3
ACKNOWLEDGEMENTS
I would like to thank everyone that has contributed tothis research beginning with Len Rothfield who began theproposal, Gary Amy who allowed me to work on this, MarthaConklin whose guidance was appreciated, and contributions inthe lab from Matt Waterbury, Willie Odem, and Jodi Taylor.
I thank my family who has always been there forencouragement and support, and Kimberley who helped me getthrough this long task.

4
TABLE OF CONTENTS
page
LIST OF ILLUSTRATIONS .......... .................. 7
LIST OF TABLES ........... ..................... 9
ABSTRACT ............ ........................ 10
CHAPTER 1 INTRODUCTION ...... ................ 11
1.1 Objectives ........ ................... 11
1.2 Experimental Plan ...... ............... 14
CHAPTER 2 BACKGROUND ....... .................. 16
2.1 Elemental Composition ...... ............... 16
2.2 Functional Groups ... ................ 21
2.3 Metal Complexation o..... ............... 29
2.3.1 Mathematical Models .... ............ 30
2.3.2 Mathematical Applications ... ......... 33
2.3.3 Model Fitting ...... ............... 38
2.4 Chemical Models ...... ................ o.40

5
CHAPTER 3 MATERIALS AND METHODS..............41
3.1 Materials.....................41
3.1.1 Chemicals..................41
3.1.2 Groundwater Samples..............42
3.2 Analytical Methods.................44
3.2.1 Organic Carbon................44
3 .2?.2 pH a nd Cu2+ . . . . . . . . . . . . . . . . . 44
3.2.3 EDTA Titrations...............46
3.3 Experimental Methods...............48
3.3.1 XAD-8 Isolation...............48
3.3.2 Titration Apparatus..............49
3.3.3 Potentiometric Titrations..........52
3.3.4 Complexometric Titrations..........52
3.4 Data Analysis...................55
CHAPTER 4 RESULTS AND MODELING..............57
4.1 Single Model Compound Titration...........57
4.2.1 Potentiometric Titrations..........57
4.2.2 Complexometric Titrations..........61
4.3 Natural Sources and Model Compound Mixtures . .. 69
4.3.1 Potentiometric Modeling...........69
4.3.2 Complexometric Modeling...........77
4.4 Other Modeling Attempts..............92
4.4.1 OCGW XAD-8 Modeling..............92
4.4.2 BA XAD-8 Modeling..............96
4.4.3 Fitting pH 7.5 Titrations..........96

6
CHAPTER 5 DISCUSSION ........ .................. 100
5.1 Titration Experiments ...... .............. 100
5.1.1 Model Compound Binding Constants .. ...... 100
5.1.1 Titration Vessel Interferences .. ....... .101
5.1.2 Titration Reliability .... ........... 101
5.2 Model Compound Mixtures ...... ............ 103
5.2.1 OCGW XAD-8 Mixtures ..... ............ 103
5.2.2 BA XAD-8 Mixtures ...... ............ 104
5.2.3 Possible Other Functional Groups .. ...... 105
CHAPTER 6 CONCLUSIONS ........ ................ 106
6.1 Chemical Modeling of a Humic Acid ... ........ 106
6.2 Recommendations ....... ................. 106
APPENDICES .......... ....................... 108
Appendix A Titration Data of Single Model Compounds .108
Appendix B Titration Data of Model Mixture . ..... 121
Appendix C Titration Data of Natural Sources .... 124
Appendix D Computer Programs ..... ............ 133
REFERENCES .......... ....................... 153

7
LIST OF ILLUSTRATIONS
FIGURE paq e
1.1 Model compound structures .... ............. .13
2.1 Major functional groups in humic substances . . . 22
2.2 Proposed basic units in humic acids .. ........ .. 24
2.3 Postulated structure of a) fulvic acid, b) humicacid, and c) humic acid ..... .............. 25
3.1 Typical copper (II) calibration curve .. ....... .. 45
3.2 EDTA titration curves ...... .............. 47
3.3 Titration apparatus for model compounds and BAgroundwater ........ .................... 50
3.4 Milli-Q complexometric titrations ... ......... .54
4.1a Potentiometric titration of model compounds -catechol and glycine ...... ................ .. 58
4.1b Potentiometric titration of model compounds -phthalic acid and salicylic acid .... .......... .59
4.2 All model compounds - potentiometric titrations . . 60
4.3a Model and experimental curve - catechol . ...... .. 63
4.3b Model and experimental curve - glycine .. ....... .. 64
4.3c Model and experimental curve - phthalic acid . . .. 65
4.3d Model and experimental curve - salicylic acid . . 66
4.4 Glycine complexometric error bars ... ......... .67
4.5 All model compounds - normalized to [LT] = 1complexometric titrations .... ............. .68
4.6a Potentiometric modeling of OCGW XAD-8 - catecholand phenolic effects ...... ................ 73
4.6b Potentiometric modeling of OCGW XAD-8 - nitrogeneffects and final fitting ..... ............. 74
4.7 Potentiometric modeling of BA XAD-8 .. ........ 75

8
4.8 OCGW XAD-8 complexometric titrations .. ....... 78
4.9 BA XAD-8 complexometric titrations .. ........ 79
4.10a Complexometric curve fits with potentiometricmixture of model compounds - OCGW ... ......... 80
4.10b Complexometric curve fits with potentiometricmixture of model compounds - BA .... .......... 81
4.11 OCGW XAD-8 single model compound SAS fitting . . 83
4.12 BA XAD-8 single model compound SAS fitting . . .. 84
4.13a OCGW XAD-8 3-ligand SAS fitting .... .......... 87
4.13b BA XAD-8 3-ligand SAS fitting ... ........... 88
4.14 Titration of OCGW model mixture .... .......... 91
4.15 OCGW XAD-8 amine titration models ... ......... 95
4.16 BA XAD-8 amine titration models .... .......... 98
4.17 pH 7.5 fitting ....... .................. 99

9
LIST OF TABLES
Table pane
2.1 Elemental composition and ratios of groundwaterhumic acids (HA) and fulvic acids (FA). ......... .. 18
2.2 Concentration of amino acids in soil and aquatichumic substances ....... .................. 19
2.3 Average concentration of amino acids present inhumic and fulvic acids from water .. ......... 20
2.4 Functional group composition .... ............ 23
2.5 Dissociation and binding constants ofpossible groups ....... .................. 28
2.6 Terms and definitions ..... ............... 35
3.1 Characteristics of humic fraction .. ......... 43
3.2 SAS equations and adjusted binding constants . . .. 56
4.1 Experimental constants ...... ............... 62
4.2 Titrated XAD-8 characteristics .... ........... 70
4.3 Assumed concentration of model compcunds ....... .. 76
4.4 SAS modeling concentrations .... ............ 85
4.5 Composition of SAS modeling three liand fits . . 86
4.6 Composition of titrated mixture ... .......... 90
4.7 Other amino acids ...... ................. 93
4.8 Amino acid modeling elemental compositionsand ratios -- OCGW XAD-8 ..... .............. 94
9 Am in ac id 7cdelina elenent a! --- fl3cns
and ratios - BA XAD-3 . . . . . . . . . . . . . . . 97

ABSTRACT
An attempt was made to simulate XAD-8 isolates of
Orange County groundwater and Biscayne Aquifer groundwater
using mixtures of single ligands. Mixtures of catechol,
glycine, phthalic acid and salicylic acid were used to
simulate potentiometric and complexometric titrations.
Concentrations used for the mixtures were based on
carboxylic acidity, dissolved organic carbon, and
assumed values for phenolic acidity and nitrogen content.
Potentiometric titrations were reproduced with mixtures of
the ligands; however, complexometric titrations at pH 6.2
and pH 7.5 could not be duplicated. A stronger ligand was
required to fit the pH 6.2 titrations, and higher carboxylic
contents were needed for pH 7.5. At pH 6.2, 70 percent of
the binding sites were attributed to phthalic acid-type
groups and 20 percent to catechol-type groups. At pH 7.5
greater than 98 percent was attributed to phthalic acid-type
groups.
I i

11
CHAPTER 1
INTRODUCTION
Organic matter leaches from plants and soil matter
enters natural systems and becomes dissolved organic carbon
(DOC) or particulate organic carbon (POC). _DOC is -. ! .
operationally defined as the fraction of organic carbon that
passes through a 0.45-micron filter. Of the DOC,
approximately 50 percent or more is typically present as
hum4c substances. These humic substances are a concern in
drinking water supplies and in the transport of trace metals
in the environment.
The modeling of humic substances can only achieve
limited success with fitting experimental data with model
parameters. The advance in computer technology has allowed
even more sophisticated statistical packages that can
readily analyze a set of data.
1.1 Objectives
Humic substances are known to complex trace metals in
the environment and increase the solubility and movement of
these metals. A clear and complete structure of a humic
substance is not available although representative
structures have been postulated (Schnitzer and Khan, 1972;

12
Olofsson and Allard, 1983; Steelink, 1985). Understanding
the complex nature of humic substances may help predict the
role they have in the fate of metals. Attempts to model
metal binding by humic substances have not been successful
due to unambiguous determinations of the functional groups
concentratinns responsible for binding. Along with that has
been the ovei±ooking of the mathematical properties of
complex multi-ligand mixtures (Perdue, et al., 1984).
This author attempted to develop a simple model of a humic
substance by approximating the actual distribution of
functional groups and the complexation behtavior using model
ligands. Verifying probable chemical structures of two
sources of humic substances was performed by reproducing
actual titration curves.
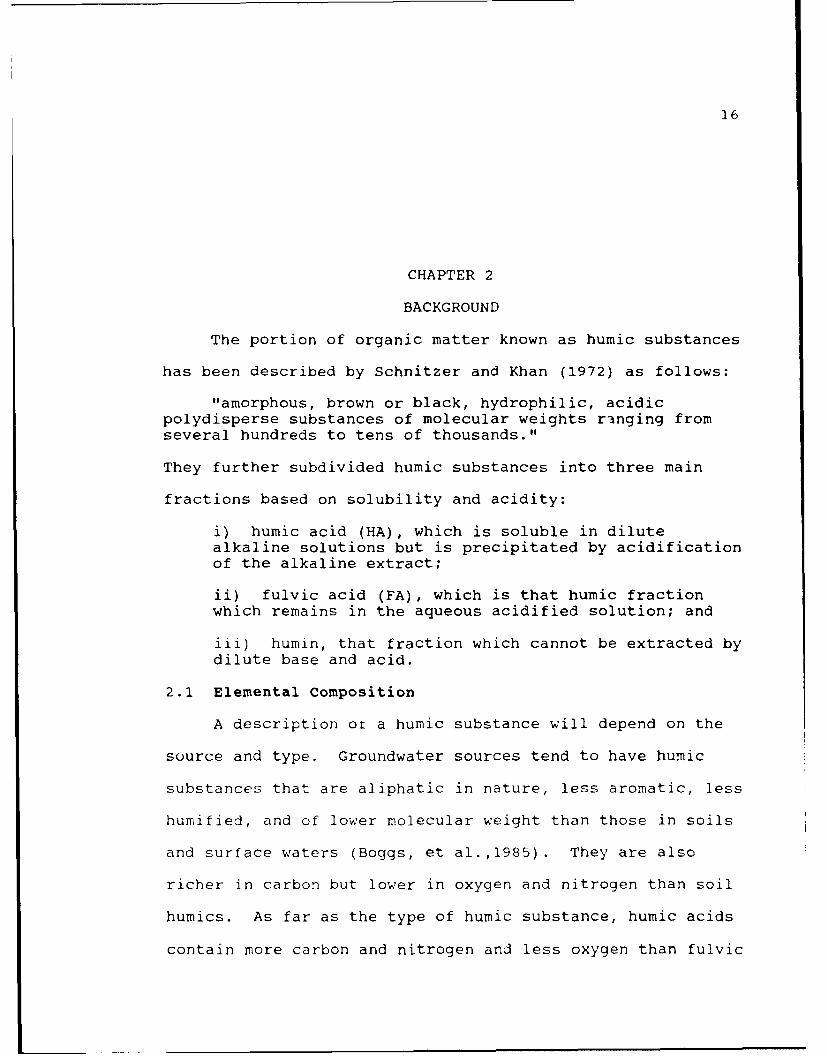
From the postulated structures of a fulvic and humic
acid, carboxylic, phenolic, and amino groups were
reproduced. Catechol, phthalic acid and salicylic acid
represented the carboxylic and phenolic content (see Figure
1.1). Glycine was used as the amino acid due to the high
binding constant for Cu(II)-glycine complexes and the high
content of glycine (Thurman, 1985).
The dissolved organic matter for this research came
from two groundwater sources: Orange County, California, and
the Biscayne Aquifer, Florida. Orange County groundwater
(OCGW) has approximately 80 percent of its DOC as humic
matter and the Biscayne Aquifer (BA) has approximately 50

13
OOHOH
catechol
NH2
CH 2 -COOH
glycine
O COOH
COOH
phthalic acid
o COOH
rOH
salicylic acid
Figure 1.1 Model conpound structures

14
percent (Amy, et al., 1989). The use of these groundwaters
was advantageous due to the following reasons:
i) Accessibility of both waters to the University ofArizona Environmental Engineering Department,
ii) OCGW has been previously investigated (Waterbury,1990),
iii) BA has been previously investigated (Thurman andMalcolm, 1981),
iv) the use of two different sources may furthervalidate the modeling effort, and
v) the current need for the direct study of
groundwater chemistry (Holm and Cur::ss, 1990).
Copper was used as the trace metal :f interest due to
its high affinity towards ligands, its u= quity in the
environment, the numerous studies already conducted on
Cu(II) speciation, and the availability cf ion-selective
electrodes to measure free copper(II) during titrations.
Complexometric titrations were conduzted at pH 6.2 and
pH 7.5 to study the effects of increasinz pH while still
maintaining the natural state of groundw=ters, pH 6 to 8.
1.2 Experimental Plan
Potentiometric and complexometric tt:rations were first
conducted on the model compounds to vali'ate published
values and experimentally-determined valies under controlled
pH and ionic strength. .alidation of d:z:ciation and
binding constants of the model compounds was conducted by
comparing experimental curves with theore:ical curves.
Titrations of the natural sources were then performed and

15
modeled with representative concentrations of the model
compounds from measured carboxylic contents and assumed
phenolic and nitrogen contents. Model mixtures were then
titrated both potentiometrically and complexometrically to
validate the proposed model humic substance.
16
CHAPTER 2
BACKGROUND
The portion of organic matter known as humic substances
has been described by Schnitzer and Khan (1972) as follows:
"amorphous, brown or black, hydrophilic, acidicpolydisperse substances of molecular weights ranging fromseveral hundreds to tens of thousands."
They further subdivided humic substances into three main
fractions based on solubility and acidity:
i) humic acid (HA), which is soluble in dilutealkaline solutions but is precipitated by acidificationof the alkaline extract;
ii) fulvic acid (FA), which is that humic fractionwhich remains in the aqueous acidified solution; and
iii) humin, that fraction which cannot be extracted by
dilute base and acid.
2.1 Elemental Composition
A description or a humic substance will depend on the
source and type. Groundwater sources tend to have humic
substances that are aliphatic in nature, less aromatic, less
humified, and of lower molecular weight than those in soils
and surface waters (Boggs, et al.,1985). They are also
richer in carbon but lower in oxygen and nitrogen than soil
humics. As far as the type of humic substance, humic acids
contain more carbon and nitrogen and less oxygen than fulvic

17
acids (Schnitzer and Khan, 1972). HA also have larger
molecular weights than FA and are thought to be degraded to
fulvic acids.
Several elemental distributions and ratios for
groundwater humic substances are shown in Table 2.1. Some
of the trends discussed above can be seen in the examples
shown on the table. Amino acids account for 15 percent of
the nitrogen in aquatic fulvic acid and 20 percent of the
nitrogen in aquatic humic acid (Thurman, 1985). Tables 2.2
and 2.3 show concentrations of amino acids from different
sources and the types present.

18
Table 2.1 Elemental composition and ratios of groundwaterhumic acids (HA) and fulvic acids (FA)
Percentages
Source: _ H N S 0- _ Ref.
FA Avg. 40-50 <1-3 0-2 44-50 Schnitzerand Khan(1972)
Biscayne 55.44 4.17 1.77 1.06 35.39 0.2 ThurmanFA and
Malcolm(1981)
Suwannee 54.65 3.71 0.47 0.5 39.28 0.2FA
Model FA 45.7 5.4 2.1 1.9 44.8 Schnitzerand Khan(1978)
HA Avg. 40-60 4-6 1-6 0-2 30-50 Lamy, etal.,(1987)
Biscayne 58.28 3.39 5.84 1.43 30.14 0.22 ThurmanHA (1981)
Suwannee 57.24 3.94 1.08 0.63 39.13 0.2HA
Model HA 56.2 4.7 3.2 0.8 35.5 Schnitzer(1978)
Ratios
H/C O/CNC
Biscayne FA 0.69 0.39 0.09
Suwannee FA 0.82 0.51 0.06
Biscayne HA 0.90 0.47 0.03
Suwannee HA 0.81 0.54 0.01

19
Table 2.2 Concentration of amino acids in soiland aquatic humic substances (Thurman, 1985)
Amino AcidsSample (nM/mg)
Groundwater
Fulvic 29 - 44
Humic 121
Streams and Rivers
Fulvic 14 - 127
Wetlands
Fulvic 36 - 79Humic 112
Soils
Fulvic 145 - 170Humic 478 - 707

20
Table 2.3 Average concentration of amino acids presentin humic and fulvic acids from water (Thurman, 1985)
Concentration (nM/mg)Amino acid FA HA
AcidicAspartic acid 5.7 12Glutamic acid 3.0 9Adipic acid 0.5 0.7
NeutralGlycine 11 22Alanine 3 10Leucine 1 4Isoleucine 1 3Valine 1 5Serine 2 5Threonine 2 6
SecondaryProline 2 8Hydroxyprol]ne 1 17
AromaticPhenylalanine 0.5 2Tyrosine 0.5 1
BasicArginine 1 1.4Lysine 0.5 2.5Histidine 0.2 1.3
SulfurCystine 0.2 0.7Methionine 0.2 0.7
Total 36 110

21
2.2 Functional Groups
Although the actual structure of both the HA and FA
fraction are unknown, it is composed of a series of
functional groups; the major functional groups are shown in
Figure 2.1. Functional groups of a model HA and FA
determined by Schnitzer and Khan (1978) are shown in Table
2.4. Liao, et al. (1982), using gas chromatography/mass
spectrometry on surface water from lakes, found that the
general molecular structure of aquatic humics consisted of
(a) single-ring aromatics with mainly three to six
substituents as alkyl side chains, carboxylic acids,
ketones, or hydroxyl groups; (b) short aliphatic carbon
chains; and (c) polycyclic ring structures including
polynuclear aromatics, polycyclic aromatic-aliphatics, and
fused rings. In river waters and lakes, Plechanov, et al.
(1983), used H-NMR (nuclear magnetic resonance) and found
compounds present to be lignin-derived and of alkyl groups.
Steelink (1985) has proposed basic units that are composed
of postulated functional groups (see Figure 2.2). Others
have postulated a representative structure for a FA and HA
as shown on Figure 2.3. What is not shown in these
structures are the small percentages (< 2 percent) of both
nitrogen and sulfur (Perdue, 1985).

22
Carbonyl C0O
Ether C 0 C
0Ester -- -
0Carboxyl -
OH
OH
Phenolic
Alcohol -C-OH
Methoxyl -O-CH 3
Figure 2.1 Major functional groups in humicsubstances (after Snoeyink and Jenkins, 1980)

23
Table 2.4 Functional group composition (Schnitzerand Khan, 1978)
Functional Model ModelGroups HA (meq/q) FA (meq/q)
Total Acidity 6.7 10.3
COOH 3.6 8.2
Phenolic -OH 3.9 3.0
Alcoholic -OH 2.6 6.1
Quinonoid C=O2.9 2.7
Ketonic C=O
OCH 3 0.6 0.8
E 4/E 6 4.8 9.6
* absorbance at 465 nm
absorbance at 665 nm

24
CH 2OH CH 2OH
-C-H -C-OH
COOH
CH OH COOH
H-C- -C-H
H-C-OHH-C-OH
o OH
Figure 2.2 Proposed basic units in humic acids(after Steelink, 1985)

25
a)
( . (-C' CHC 04~
C' .-. I (
T- -" - ,- ]
0
r 0, 0
. . J - (D
1C ;O(C H2)H 3
r, 0 4 C )
0 ol1 -- I i- 0O r 0 , 4 -|
0 OQ4 04- 0 Cb) C5M1105
cow1 0 0ON
Om ON2 0142a -a C - 0--0 r o
OC3 H 0
00
140 COOK
01'
0 - COM4
C) 0 COON
NO Cl- N 0 C0- a1"
H CH - C _ CH20H"C - \~/ \
H-C-OH H-C-O-iz H2 >
VIO\ '
C3 - '
Figure 2.3 Postulated structure of a) fulvic acid(Schnitzer and Khan,1972), b) hunic acid (Oloffson and
Allard, 1983) and c) humic acid (Steelink, "L985)
26
Several researchers have postulated on which types of
functional groups in humic substances are important 4n the
complexation of metals. Gamble (1970) has postulated that
salicylic-type groups are involved in metal complexation
while Manning and Ramanoorthy (1973) have suggested that the
phthalic-type groups were responsible. Schnitzer (1972)
suggested that both types of groups were important with the
addition of C=O type groups and amines. Buffle, et al.
(1980) refuted the idea that salicylic- and phthalic-type
groups were solely responsible. By comparing the complex-
formation properties of different natural water samples with
the binding capacities of salicylic and phthalic acids, they
showed that the binding was not high enough to
satisfactorily explain the complexing properties of a fulvic
acid by copper. McKnight, et al. (1983), modeled the
complexation of aquatic fulvic acids by copper using two
concentrations and binding constants. The most abundant
ligand site (Lj) represented both salicylic- and phthalic-
type acids but only 16 percent of the total functional
groups. The second most abundant ligand (L2) only
represented 5 percent of the carboxylic and phenolic
functional groups. There was also a high variability of
concentrations among the samples. They attributed the
variable concentrations of functional groups to trace
concentrations of possibly nitrogen and/or sulfur. More
recently, Ephraim, et al. (1989), identified 30 - 45 percent

27
of the acidic sites responsible for copper binding as a
salicylic acid-like moiety and 25 - 30 percent as a
catechol-like moiety for an aquatic fulvic acid. Shown in
Table 2.5 are dissociation and binding constants of some of
the proposed types responsible for metal binding.

28
Table 2.5 Dissociation and binding constantsof possible binding groups
Model CompoundsPublished Catechol Glycine Phthalic SalicylicValues (H2L) (HL) AH L) (H2 L)Potentiometric
pKal 13.0 9.57 4.93 13.6(HL/H L)
pKa2 9.23' 2.361 2.751 2.802(H2L/HL" H)
Complexometric
BI 13.583 8.274 4.001 10.802(ML/M" L)
B2 15.194 5.31' 18.456
(ML 2 /M" L2 )
(MHL/M HL) 1. 20'
(MLH/MHL) 0.857
(ML-H 2/MH 2 L) -8.3457
I Smith and Martell, 19752 Condike and Martell, 19693 Athavale, 19664 Greiser and Sigel, 19716 Lumme and Kari, 19756 Neshkova and Sheytanov, 19857 Jameson and Wilson, 1972

29
2.3 Metal Complexation
Humic substances are ubiquitous in the natural
environment and are good ligands for metal binding. Humics
can be important in the solubility of toxic metals in water
sources and in the kinetics of transporting these metals
(Clark and Choppin, 1990). Mantoura, et al. (1978), and
Perdue (1989) described the main factors that control metal-
humic interactions with the following:
i) value of the binding constant; i.e., the natureof the metal and the binding site,
ii) elevated pH that causes increased binding,
iii) humic substance concentration,
iv) elevated ionic strength that causes decreasedbinding, and
v) major ion concentrations that ccntrol thecompetition for humic acid by magnesium and calcium,and the competition for trace metals by chloro- orsulphato- ligands.
Guy and Chakrabarti (1976) used a commercially-available
humic acid (Aldrich) at pH 5 and found the stability
constants of metal-organics to decrease as follows:
Pb(II) > Cu(II) > Cd(II) > Zn(II) .
They also found that humic acids can maintain the binding of
metal ions to as low as pH 3. Takamatsu and Yoshida (1978)
also found increasing binding constants * :th pH for several
soil humic acids, but unlike the previous authors, they
found Cu(II) to have higher binding than Pb(II), and Cd(II)
to have significantly lower binding at pH 5. Schnitzer and

30
Khan (1978), at pH 5.8 with soil-derived fulvic acids,
showed the following binding trends:
Hg = Fe = Pb = Al = Cr = Cu > Cd > Zn > Ni > Co > Mn
Dobbs, et al. (1989), also recently showed the increase in
metals bound with an increase in the number of binding
sites.
Of the metals available for binding by humic
substances, copper (II) is the most studied. Copper is a
concern to the environment due to its toxicity to aquatic
organisms. Copper toxicity is dependent not on the total
copper concentration but on free copper activity (Anderson
and Morel, 1978; Sunda and Guillard, 1976). Sunda and
Hanson (1979) found through the UV-photooxidation of organic
matter in river waters that the copper was bound
predominantly to organic ligands. This directly affects the
toxicity and bioavailability of copper to organisms as well
as copper adsorption onto surfaces, copper precipitation,
and solid solubility. It is therefore important that metal-
humic interactions be part of any computational scheme in
any modeling of natural water systems (Bassett and Melchior,
1990).
2.3.1 Mathematical Models
Some attempts to mathematically model the affinity of
metals to humic substances were derived from earlier
attempts of modeling proton binding to acidic polymers, ion
exchange resins, and so on (Perdue, 1985). Current metal-

3]
humate models are similar in the assumpti -ns that follow:
i) reactions at individual sites (ligands) aregoverned by mass law equations, and
ii) microscopic mass law constants do not change withincreased metal loading, i.e., there are nointeractions among sites (Dzombak, et al., 1986).
Discrete and continuous multi-ligand models are currently
used to describe metal-humate interactions.
The discrete ligand model uses only a few ligands (<
10) to fit experimental data. Dzombak, et al. (1986), noted
that the optimal number of ligands can be estimated as one
ligand for each order of magnitude of bound metal
concentration observed in the titration data. Perdue (1985)
described the discrete ligand model as inappropriate due to
the complex mixture of nonidentical ligands that are
expected in humic substances. The goal of this model though
is not to represent a humic substance but to represent those
sites that are important in metal binding and are of the
most use (Fish, et al., 1986).
The continuous distribution models include the normal
distribution model, the affinity spectrum model and the
continuous stability function model. These models are based
on the assumptions that the binding constant of a humic
substance to a metal varies continuously and that the ligand
frequency distributions can be integrated over the varying
binding constant. Continuous distribution models offer an
integral solution for ligand distributions, but the solution

32
is complex and numerical attempts to solve the integral
equation are plagued by spurious oscillations (Dzombak, et
al., 1986). A solution to the problems with the continuous
distribution models is to assume a distribution. Such is
the case with normal or Gaussian distribution models in
which the probability of occurrences for a given ligand is
assumed to be described by the symmetrical Gaussian
distribution function (Perdue, 1985). Due to the generality
of the theoretical normal distribution, the model only
becomes useful as a good first approximation of the most
probable acidic functional groups responsible for binding
metals. The affinity spectrum model attempts to avoid the
problems associated with solving an integral equation
through the use of an affinity spectra. Peaks in the
affinity spectrum reflect the importance of certain ligands
and can be used as an aid for selecting discrete ligands
from experimental data (Dzombak, et al., 1986). A similar
model developed by Gamble, et al. (1972, 1973, 1980, 1983)
is called the continuous stability function model. The
approach in this model is to chose a dominant binding
constant at each titration point and fit a ligand
concentration to it. Shortfalls, however, include the
characterization of only the weakest and most abundant
ligand in a distribution (Dzombak, et al., 1986).
It should be recognized, though, that with metal-
binding interaction, as the number of components or ligands
33
that bind the metal increase so does the number of sites for
binding. The result is a smooth curve that can be modeled
fairly easily, and if fitted, the output is only curve-
fitted values.
2.3.2 Mathematical Applications
Current geochemical models experience difficulty
incorporating humic substances into speciation calculations
(Bassett and Melchior, 1990). The problem is due to the
complex nature of humic substances. Classical attempts such
as the Debeye-Huckel equation cannot be applied.
Perdue (1978) described the generalized reaction of a
metal (M) and a protonated ligand complex (HL) to a
complexed metal (ML) with the following expression:
M + HL ML + H+ (1)
This equation is thermodynamically equivalent to the
following:
HL - H + L (2)and
M + L ML (3)
The knowledge of dissociation constants helps to better
understand the concentration and chemical characteristics of
humic substances.
Direct potentiometric titrations can give
operationally-defined estimates of carboxylic groups which
relate to dissociation constants for the humic
substance(Perdue, 1980; Oliver, et al., 1983). Currently,
operationally-defined carboxylic content is that acidity

34
required to titrate a solution from pH 3 to 8, and phenolic
content is estimated at twice the acidity required to
titrate from pH 8 to 10 (Thurman, 1985). Phenolic content
taken as the difference between total acidity and carboxylic
content has, however, not achieved complete certainty
(Perdue, et al., 1980).
The binding of copper by DOC can assume the simplest
form according to Cabaniss and Shuman (1988a) with a 1:1
complex stoichiometry, no site interactions, and a single
binding site of concentration LT. The binding constant
expression (see Table 2.6 for term definitions)
[CuL] (4)K Cu=
[Cu] [L]
rearranges to the form below to give the concentration of
bound copper, [CuLl,
[L-1 [Cul K C- (5)[CuL] ----------------
1 + [Cu] KCU
If the simplifying assumptions are dropped, the model gets
more complicated.
When the assumption that all the binding sites within
the humic acid are identical is dropped, [CuLl is expressed
as folIows (Cabaniss and Shuman, 1988a)
N (L] [Cu] KC (6)[CuLl Z
i=1 1 + [Cu] Kc
Models such as the discrete ligand, continuous distribution,
and normal distribution model make different assumptions of

Table 2.6 Terms and definitions (after Cabaniss
and Shuman, 1988a; Neshkova and Sheytanov, 1985)
[Cu T ] total copper concentration
[Cu] cupric ion concentration
[CuL] copper-organic complex concentration
[L] free ligand concentration
[CuOH] hydrolyzed copper concentration
[CuOHL] hydrolyzed copper-ligand complex concentration
N, i number of binding sites, site being considered
[L T ] total ligand concentration
[L ] con-entration of ligand i
(H) >_oton activity
P, j maximum coordination number, number beingconsidered
B copper binding constant for j ligandmolecules
KCU copper binding constant for 1:1complex
K H proton binding constant
K a apparent K CU for givencharge on polyelectrolyte
K CUH copper-proton exchange constant
K CuH' copper-proton 2
exchange constant
K oH copper hydrolysis constant
K ctH hydrolyzed copper-ligand binding constant
side-reaction coefficient for protonation ofa ligand (see eqn. 18)
T temperature (°K)
36
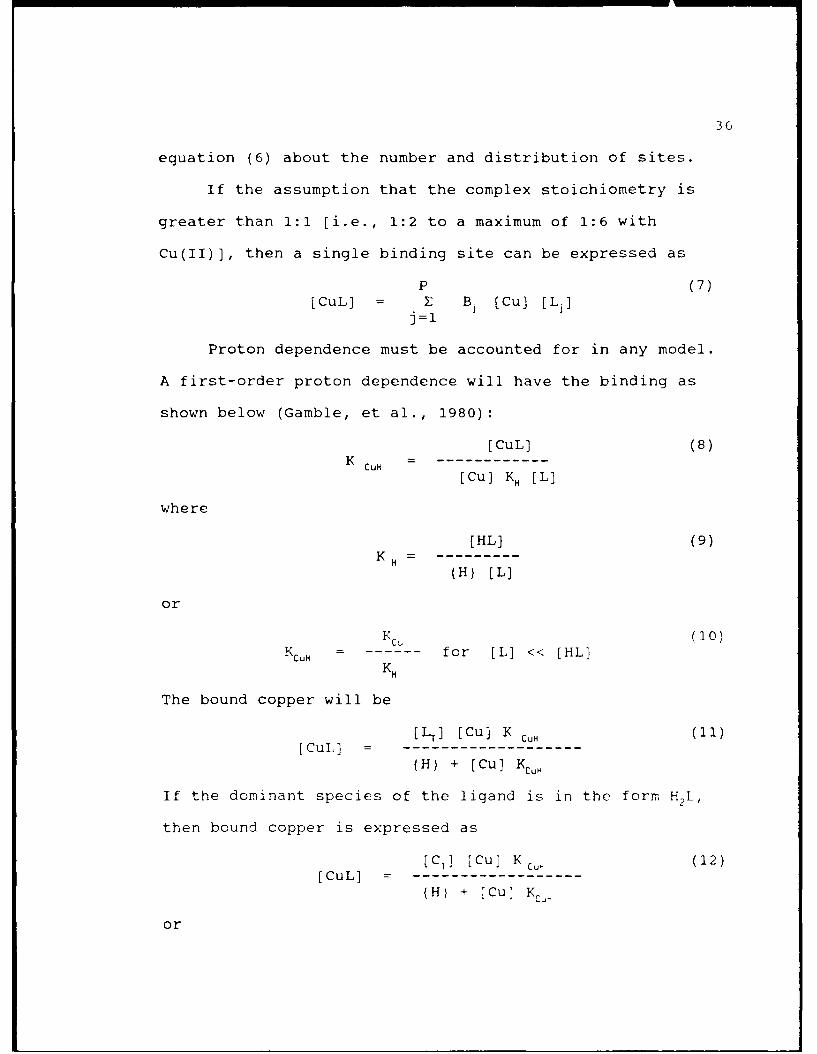
equation (6) about the number and distribution of sites.
If the assumption that the complex stoichiometry is
greater than 1:1 [i.e., 1:2 to a maximum of 1:6 with
Cu(II)], then a single binding site can be expressed as
P (7)[CuL] = E B [Cu] [L]]
j=l
Proton dependence must be accounted for in any model.
A first-order proton dependence will have the binding as
shown below (Gamble, et al., 1980):
[CuL] (8)K=K CuH
(Cu] K. [L]
where
[HL] (9)K H
(H) [L]
or
Yc,. (10)KCuH ------ for [L] << [HL]
K H
The bound copper will be
[ L T] [Cu] K CoH 11i
[CuL] -
(H) + [Cu] KCu H
If the dominant species of the ligand is in the form H L ,
then bound copper is expressed as
[CT] [Cu] K cu (12)[CuL] -
{H + [Cu] Kcu-
or

37
[CT] [Cu] KCuHH (13)[CuL] ---
(H) 2 + [Cu] K CuHH
If the bound copper is being hydrolyzed or a hydrolyzed
copper is being bound then the binding of hydrolyzed copper
can be expressed as
[CuOHL] [CuOHL] (H) (14)K CuOHL
[CuOH] [L] [Cu] K0H [L]
where
[CuOH] (H) (15)Kom -- - -- - -
[Cu]
and the hydrolyzed copper is
[L[] K COHL K OH [Cu] (16)[CuOHL] -----------------
(H) + KCuOHL KOH [Cu]
The above equations are used for theoretical and
modeling calculations, but for more applicable use, the
binding constants can be determined from experimental data
with the following expressions (Neshkova and Sheytanov,
1985):
[Lt] LT 2[Cu] = [CuT 1]/(l + B .------- B2----------
aL(H) L(H)
aLn(H (H
[L ]n
B-------) (17)nn
where
QL(H) 1 + (H) KH + jH}2 K K 2 +
(HT n KH Kf2o t tri K nH (18)
Temperature effects for titration data can be corrected
38
by the following equation (Smith and Martell, 1975):
log Kcu2 = log Kcu1 + AH(T2 - Tl)/1701.3654 KJ 0K/mole (19)
where 6H is the enthalpy change.
Ionic strength corrections are tabula:ed in Smith and
Martell (1975). They found that stability constants usually
decrease with increasing ionic strength and generally reach
a minimum at an ionic strength of about C.5. Stability
constants were also observed to increase :nrough an ionic
strength of at least 3.0, and ionic stre:,:hs of 0.1 and 1.0
frequently had the same magnitude.
2.3.3 Model Fitting
Copper titration data can be fitted ith any of the
above modeling methods to obtain parameters. Although these
fitting parameters are operational bindin: constants and are
highly dependent on experimental conditi:7s, comparing metal
speciation that was computed with model parameters is
appropriate (Holm and Curtiss III, 1990). It is, however,
inappropriate to compare complexation parim-eters determined
by different methods or for different water samples
(Cabaniss and Shuman, 1988c). For this reason, only a few
modeling attempts will be discussed. Van. Den Berg and
Krarer (1979) assumed the simplest bindin: of 1:1 of copper
with no proton dependency, and they obt _ ed binding
constants for a fulvic acid and ligands 'I Lake Ontario of
107.8 and 108.8, respectively. They calculazed these
constants with no knowledge of the dissoc-ation constant of

39
the water sample and at a pH of 7.6.
A discrete ligand model was used by Hering and Morel
(1988) for a Suwannee Stream humic acid at pH 8.2 to 8.3.
They obtained the best fit with a 3-ligand system at
concentrations of 5.0 X 10'5 M, 2.0 X 10 .4 M and 1.8 X 10⁻⁸ M
with binding constants of > 1011, 109.2 and 106.6,
respectively. Copper titrations were done at pH 8.2 to 8.3.
In comparison, Cabaniss and Shuman (1988b) modeled Suwannee
fulvic acid with a 5-ligand system for the pH range of 5 to
8.5.
Groundwater from Orange County, California, was
titrated by Waterbury (1990) and the best fit was obtained
using e 2-ligand system. He modeled an XAD-8 humic acid
fraction with L 1 at 10 -7,5 and L 2 at 10 -11.2 with binding
constants of pL 1 at 5.2 and pL 2 at 4.9 for pH 6.2 and an
ionic strenath of 10 mM.

40
2.4 Chemical Models
In the attempt to attribute some chemical significance
to the structural and modeling work, several researchers
have used different chemicals. EDTA (Dursma, 1970),
nitrilotriacetic acid (Childs, 1971), salicylic acid (Morel
and Morgan, 1972), and citric acid (Stumm and Brauner, 1975)
were some of the single compounds tried in the modeling of a
humic substance. Bresnahan (1978) attempted a 1:2 and a 1:1
mixture of salicylic and phthalic acid to simulate a soil
fulvic acid but also had no success. Lamy, et al. (1987),
did not try to simulate a humic substance but went directly
to a commercially-available humic-like substance called PCTG
(catechol + triglycine polycondensate). PCTG had the
following elemental composition in percentages:
C - 45.4, H - 4.0, N - 11, 0 - 36.9, S - 0.5.
All of the percentages fell within the average composition
of a humic acid with the exception of the nitrogen content,
which was high.
Strict adherence to elemental compositions will not by
itself describe a humic substance. Steelink (1985) showed
that chemical formulas of humic substances can also describe
the same empirical formula for whole wood. Elemental
composition can help one devise hypothetical structures for
humates.
41
CHAPTER 3
MATERIALS AND METHODS
The stages of this research included (1) the selection
and verification of model compounds, (2) the titrations of
two XAD-8 isolates, and (3) the modeling with experimental
verification. The two XAD-8 isolates were groundwaters from
Orange County and the Biscayne Aquifer.
3.1 Materials
3.1.1 Chemicals
All chemicals used for this research were reagent
grade. Adjusting of pH was done with diluted concentrations
of HNO3 (1.0 N, 0.1 N, and 0.01 N) and NaOH (1.0 N, 0.1 N,
0.08 N, and 0.01 N). Distilled water passing through a
Millipore cartridge system (referred to as Milli-Q water)
was used for dilutions.
pH control was accomplished with the zwitterion buffer
MES (4-morpholineethane sulfonic acid, Aldrich) for pH 6.2
and HEPES [1,4-(2-hydroxyethyl)-1-piperazineethanesulfonic
acid, Aldrich] for pH 7.5. Ionic strength was adjusted to
10 mM with sodium nitrate (Mallinckrodt). Copper (II)
nitrate (Cu(N03)2.3H20, Alfa] was used. Determining the
concentration of the stock solution of copper was
accomplished with EDTA titrations(Nutritional Biochemicals
Corp.).

42
The model compounds used were catechol (1,2-
dihydroxybenzene, Aldrich); glycine (aminoacetic acid,
Baker); phthalic acid (benzene-l,2-dicarboxylic acid,
Aldrich); and salicylic acid (2-hydroybenzoic, Aldrich).
All of the labware used was acid washed. Washing
consisted of rinsing and then soaking in a 3:1 (Milli-
Q:HNO3) nitric acid bath for 8 hours. Rinsing and soaking
in Milli-Q followed for at least 3 hours.
3.1.2 Groundwater Samples
The two sources of humic substances were from
groundwaters collected in five-gallon polypropylene
containers in Orange County Water District, California, and
the Biscayne Aquifer in Dade County, Florida. Upon receipt,
samples were stored at 4' C as received. Groundwaters were
filtered with prewashed 0.45-Am filters to isolate dissolved
organic matter (DOM). From analyses provided by Orange
County Water District and specific conductance measurements,
the ionic strength of OCGW was determined to be 3 mM
(Waterbury, 1990). BA groundwater had a similar
conductivity measurements and ionic strength as OCGW.
Characteristics of the XAD-8 isolates are shown in Table
3.1.

43
Table 3.1. Characteristics of humic fraction (Odem, 1990)
COOHDOC Humic Conductivity Acidity
Source (xnQ/L) %___ jL Avg. MW (uohins/cm) (ineQ/g-C)
OCGW
XAD-8 5.23 80 7.95 1700 420 19.7
BA
XAD-8 5.66 50 8.05 1600 480 13.4
44
3.2 Analytical Methods
3.2.1 Organic Carbon
Concentrations of dissolved organic carbon were
measured with a Shimadzu Model TOC-500 carbon analyzer.
Standards were at 5.0 and 10.0 ppm DOC. Prior to injection,
a 10-ml sample was acidified to pH 2 - 3 and purged for ten
minutes with N2 gas. Injection volume was 50 i.
3.2.2 pH and Cu2
pH and free copper was measured with a Fisher
Scientific Accumet 950 pH/ion Meter. The pH probe used was
a Radiometer America pH electrode, and the copper probe was
an Orion cupric electrode in combination with an Orion
double junction reference electrode. The pH was calibrated
with pH 4.00, 7.00, 8.00, and 10.00 buffers (Metrepak) in
combination with a Fisher Scientific automatic temperature
probe. Cupric electrodes were calibrated with 10-6 M, 10-5
M, and 10-4 M Cu(N0 3)2 adjusted to an ionic strength of 10 mM
and pH 6. Copper standards and titrants were made in
polypropylene, 100-ml beakers from a stock concentration of
0.3707 M Cu(N03)2. Standard were made weekly and titrants
daily. The stock Cu(II) was kept refrigerated at 40 C
between uses. Linear regressions from the millivolt
responses of the copper standards provided a standard curve
for free copper concentrations. A typical copper
calibration curve is shown in Figure 3.1. For this standard
curve, dilutions of 10" , 10-6, 105 , and 10,4 M were measured

45
1 8D
170
1
140
130
ID I
-7.5 -7.0 -6.5-' -6.0 -5.5 -50 -4.5 -4.0 -.3.5
Frez copze (bgr~~L
Figure 3.1 Typical copper (II) calibration curve

46
with the copper probe and plotted. A linear regression done
with Quattro spreadsheet software yielded the following
expression for 10-4 to 10-7 M:
log [Cu] = 0.038786 (mV) - 11.0349 . (20)
The r2 for this range was 0.996. Since the linear response
of the copper probe becomes non-linear below approximately
10-6.7 M (Orion, 1986), a three-point standard curve was used
for concentrations of 10-6, 10-5, and 10-4 M for the
complexometric titrations. For the same standard curve
shown in Figure 3.1, the linear expression changed to
log [Cu] = 0.0363 (mV) - 10.6248, 21)
and r2 was 0.399. Linearity assumed to 10-7 M had only
slight deviations.
3.2.3 EDTA Titrations
EDTA titrations using the cupric electrode probes were
performed on the diluted stock copper (II) solution as
described in the cupric electrode instruction manual (Orion,
1986). Figure 3.2 shows two titrations conducted. The
inflection point on the curves indicated the concentration
for the stock copper (II) solution to be the following:
Titration A: 0.3680 M
Titration B: 0.3730 M
The mean of the two titration curves of 0.3707 M was used
for the stock copper (II) solution concentration.

47
210
2 0 0 ....... ............. .. ... .. A
190
18D B
1 7 0 . . . .. .... .... ...
16 .....
120 .. ... ...
100...
90
00 05 1.0 1.5 2.0 2.5 3.0 3.5 4.0
EDI A cxitd (ml)
Figure 3.2 EDTA titration curves

48
3.3 Experimental Methods
3.3.1 XAD-8 Isolation
The procedure of Thurman and Malcolm (1981) for
isolating humic substances was used with some modifications.
The apparatus consisted of a 2-ft long, 3-inch diameter
column filled a quarter from the bottom with XAD-8 resin. A
separating funnel served as a reservoir for the groundwater
feed and connected to the column with 1/4-inch tygon tubing
along with a stopcock for flow control. Procedures used
follow:
a) Column prepared with three liters of Milli-Q water
passed through until the outflow pH was zetween 5 and 6.
b) 600 mls of pH 2 HN03 solution passed through the
column.
c) 0.45 gm-filtered groundwater a: pH 2 adjusted with
HNO3 passed through the column at an outflow rate of 25 + 2
ml/min.
d) 250 mls of pH 2 HNO3 solution passed through until
one inch of water remained in the resin.
e) 0.1 N NaOH passed through until the outflow
absorbance equaled the inflow with the eluate of humic acid
collected.
f) A hydrogen cation exchange res - was added to the
collected eluate in a batch mode and stirred for 1.5 hours.
The amount of resin added was determined with the following
equations (Waterbury, 1990):
49
(ml of eluate) (0.1 N NaOH) = (meq of active material)
(meq of active material)= (g of resin added) (22)
(5.1 meq / dry g resin)
g) The resin and eluate solution passed through a 0.45
Mm filter membrane to separate the resin from the dissolved
humic substance.
The OCGW humic concentrate was diluted with Milli-Q then
stored at its natural DOC of 5.66 mg/L. BA humic
concentrate was stored in its concentrated form with a DOC
of 50.2 mg/L and later diluted with Milli-Q for the
titrations.
3.3.2 Titration Apparatus
Potentiometric and complexometric titrations for the
model compounds, BA groundwater, and mixtures of model
compounds were performed in 400-ml, polypropylene, jacketed
beakers (see Figure 3.3). Titrations for the OCGW were
performed in 150-ml, glass, jacketed beakers with
temperatures controlled by recirculating water to 230 C.
Titrations in polypropylene beakers were performed at room
temperature (230 C ± 2). The apparatus for titrating the
model compounds and BA groundwater was continually updated
through this research project. Initial experiments were
conducted with a Fisher Accumet 925 pH meter. A Fisher 753
electrode switch was then added to allow the measuring of

50
•tank Steper
Eet97 ditaorl syrine
N2 bubler
r electrode
CO 2 S" rb ree
box ,xt - ow ',' trtw
Stirring Table
Figure 3.3 Titration apparatus for model compoundsand BA groundwater (after Waterbury, 1990)

51
both pH and free copper. Finally, a Fisher Accumet 950
pH/ion meter replaced both the pH meter and the electrode
switch. Measurements were taken with a Radiometer America
combination pH electrode and an Orion double junction
reference and cupric electrode. A VWR model 310 magnetic
stirrer ensured adequate mixing. A nitrogen atmosphere was
used in all titrations. N2 gas was washed by bubbling
through solutions of 2.0 N NaOH and Milli-Q water. An
autoburette was used to add aliquots of acid or copper. The
autoburette consisted of a Superior Electric Slo-syn
synchronous/stepping motor, type M061-FC02, equipped with a
Breg autoburette P/N JJ-9. The motor was controlled by an
IBM-compatible microcomputer through a AST Research CK 7260
multi I/O, a John Bell 86-108A Universal Parallel Interface,
and a Rogers Lab R2D23 dual axis stepper motor driver board.
The experimental set-up for OCGW titrations also included a
Haake KT2 water temperature recirculator. A BASIC software
program (see Appendix D) allowed parameter controls by the
user and provided both hardcopy and printed data. For each
aliquot added; time, millivolt or pH, and the volume of
titrant was recorded.
Prior to starting a titration, the samples were reduced
to pH 3 with HNO 3 and then purged with N2 gas for at least 4
hours to remove CO2 gas. NaNO3 was added to the solutions
to adjust the ionic strength to 10 mM.

52
3.3.3 Potentiometric Titrations
Potentiometric titrations were performed on catechol,
glycine, phthalic, salicylic, and the XAD-8 humic acid
fractions of OCGW and BA. Replicates were only performed
for glycine. The XAD-8 isolates were titrated at a DOC of
5.66 mg/L for OCGW and 12.5 mg/L for BA ( a 3:1 dilution of
the XAD-8 eluate). Titrations began at pH 3 and ended at pH
10. Carboxylic acidities were determined from the
operational definition by Thurman (1985) with Milli-Q water
corrections.
3.3.4 Complexometric Titrations
All complexometric titrations were conducted in the
dark to prevent light interferences to the cupric electrode.
A 200-ml volume of the samples at varying compound
concentrations was used for the titrations. Concentrations
from 1 X 10⁻⁴ M to 5 X 10-' M was required of MES to maintain
the pH at 6.2 + 0.1. Titrations performed at pH 7.5 needed
0.5 to 5 mM HEPES to maintain the pH at 7.5 + 0.01. DOCs of
the OCGW samples were the same as the potentiometric
titrations. For BA the DOC was reduced by 2.5 times to 5.02
mg/L to get complexation within the range of the copper
probe. Aliquots of 1 mM copper were titrated and allowed to
equilibrate for 10 minutes. Complexometric titrations for
BA, however, were allowed to equilibrate for up to 30
minutes towards the end of the titrations. Replicates were
again only performed on glycine at pH 6.2 and pH 7.5.

53
Prior to determining the binding effects of the
compounds, Milli-Q blanks were titrated to show any sorption
on the titrating vessels, complexation by the Miilli-Q water
source and buffers, and error in measurements. Shown in
Figure 3.4 are Milli-Q titrations compared to an ideal blank
of ultrapure water with no carbonate species at an ionic
strength of 10 mM modeled with TITRATOR using Cu-OH
constants from Paulson and Kester (1980). MES buffer
concentration at pH 6.2 was 0.1 mM, and HEPES buffer at pH
7.5 was 5 mM. The loss in linearity of the copper probe can
be seen on the curves.
OCGW XAD-8 was titrated under temperature-controlled
conditions in a glass beaker; whereas, BA XAD-8 was titrated
at room temperature in a polypropylene beaker.

54
pH 6.2 Titrations
-4.5____ _
-5.5
I-7.-7.5 -...
-7.0 -&5 -50D -5.5 -5-0 -4.5
TotJ Ccpe (bg mces,/L)
PH 7.5 Titrations
icd-5.0
-6.0
-7.C--
Figure 3.4 Milli-Q complexometric titrations

55
3.4 Data Analysis
Dissociation and binding constants from the titrations
were verified with published constants using an interactive
computer program called TITRATOR (Cabaniss, 1987).
Potentiometric titrations were fitted using an iterative
process with TITRATOR. Values for the model compound
concentrations were based on carboxylic content, phenolic
content, and nitrogen content. Complexometric data of the
natural sources were initially fitted with a non-linear
squares regression, statistical package (SAS, 1979) using an
approach similar to Cabaniss and Shuman (1988a).
Assumptions for which ligand species dominated at a certain
pH were based on pK, values. Once optimum fitting
parameters were calculated, adjustments to the parameters
were made using TITRATOR. Adjustments were only required
for catechol and glycine (see Table 3.2).
The fitting of the complexometric data first included
fitting each of the model compounds with SAS to identify the
ligand and concentrations to use for further modeling. Two
of the model compounds (either catechol, phthalic or
salicylic acid) were then fitted to the data, and then those
concentrations were used for a 3-ligand fit to the data with
a set concentration of glycine based on assumed values of
nitrogen content.
56
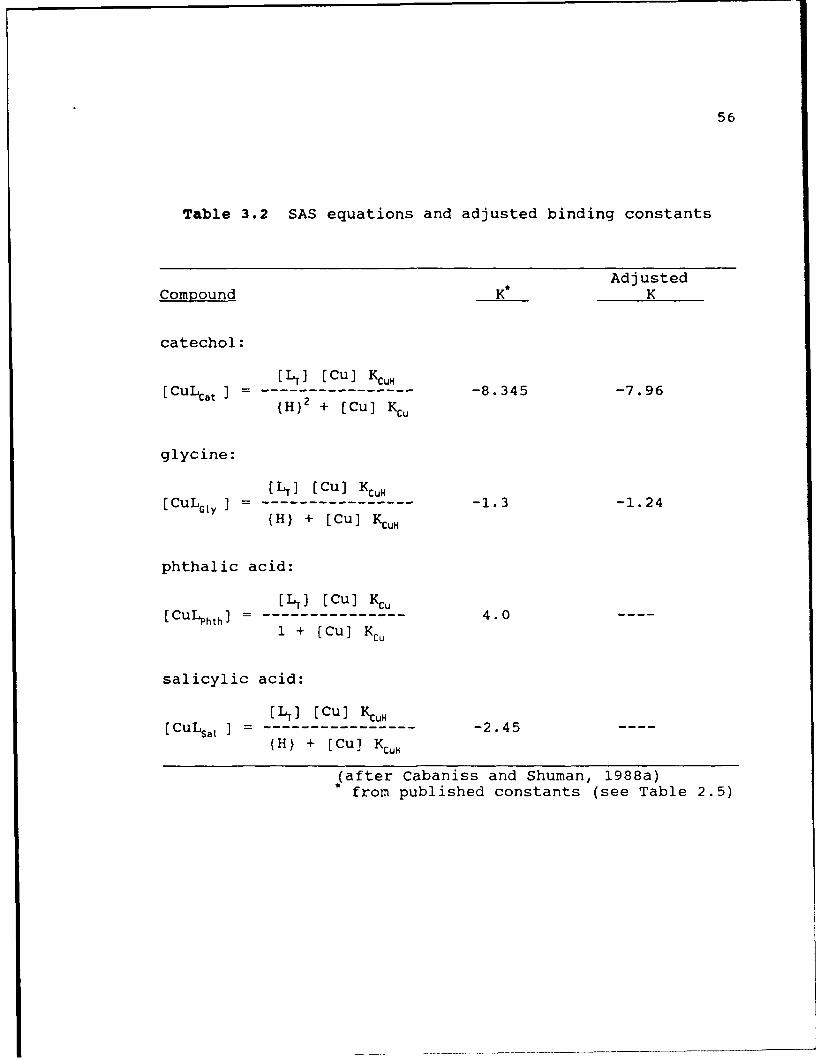
Table 3.2 SAS equations and adjusted binding constants
Adj ustedCompound K~ K
catechol:
[LT [Cu ) KcUIH[CuLC~tI ------- ------ 8.345 -7.96
(H) 2 + [ Cu ] KC
glycine:
[CuL~t LT-----------------1.3 -1.24(H) + [Cu] K CuH
phthalic acid:
[ LT) [Cu] ) c[CUL'Phth] - -- -- -- -- -- - -- 4.0 --
1 + [Cu] KC
salicylic acid:
[ LT] [Cu] 'cuH[CULSat I =---------------------------------- -2.45 - -
(H) + [Cu] K CuH
*(after Cabaniss and Shuman, 1988a)from published constants (see Table 2.5)

57
CHAPTER 4
RESULTS AND MODELING
4.1 Single Model Compound Titrations
Potentiometric and complexometric titrations of
catechol, glycine, phthalic acid, and salicylic acid were
done to verify dissociation and binding constants with the
published values. The replicates performed on glycine, with
error bars for the complexometric titrations, are included
in the figures. Titration data are included in Appendix A.
4.1.1 Potentiometric Titrations
Potentiometric titrations performed on each model
compound and the model fits are shown in Figures 4.1a and
4.1b. With the exception of glycine, all of the model
compounds were titrated without adjusting the pH to 3.
Figure 4.2 shows potentiometric titrations of all the model
compounds.

58
Catechol
.. .....1. ...1- .. ...
6.. ................... ......- I........ ...... ..........
4.............................. .... ,"'* .... - ..... *............
3 ....... ... ....... ---...... ............ ........ ...........
0 QO5 am~ OLi 5 OXXI2 O025 011X
NaOH ~o~c (mcdft/L)
Glycine
11tu
5.
3
Figure 4.1a Potentiometric titration of modelcompounds - catechol (1.37 X 1O' 3 M) and
glycine (2. 0 X 10-3 M

59
Phthalic Acid
10 ................................ . .. .................................... O L C
a .. .................. ..... .................. ............ .....
0 .. ........ .. ..... .... .... .......... 5. . .. .2 ...... ...... .. .. .... .
10 ______O L aD5 D
8 .. . . . ............. ............... ......*...
0 D.ODx 0OD 0fjD1 5 0.IXY2 .0~25 0.XCO
Figure 4.1b Potentiometric titration of modelcompounds - phthalic acid (8.25 X 10⁻⁴ M) and
salicylic acid (1.04 X 10. M)

60
x +x
cotechd
x
5 ............................ .. .......................... ......
o 00005 0.0 0.Wf5 O.002 0.025 0.003
wD Altims (mcSA-)
Figure 4.2 All model compounds -potentiometric
titrations

61
4.1.2 Comrlexometric Titrations
Determining binding constants for the model compounds
used required more careful attention to changes caused by
temperature and ionic strength. Calculated experimental
values per Neshkova and Sheytanov (1985) and temperature and
ionic corrections per Smith and Martell (1975) are shown in
Table 4.1.
Experimental binding values calculated and summarized
on Table 4.1 do not reflect all the binding that occurs.
Validating binding constants was accomplished by comparing
the actual experimental curves with model curves based on
published values (see Table 2.5) using TITRATOR. Figures
4.3a, 4.3b and 4.3c show a good fit for the experimental and
model curves of catechol, glycine and phthalic. For
salicylic, the experimental curves did not fit with model
curves (see Figure 4.3d). In this case, the binding
constants were determined and used for further modeling.
Binding constants of B, and B2 at 11.15 and 18.96,
respectively, were used as opposed to published values of
10.80 and 18.45 (see Table 2.5). Replicates of glycine
performed have the error bars shown in Figure 4.4. Values
normalized to the total ligand concentrations (LT) equal to
one for all the model compounds are shown in Figure 4.5.

62
Table 4.21 Experimental constants
Model CompoundsExperimental Catechol Glycine Phthalic SalicylicValues (H 2L) (HL H 2 L) (H 2 L~
Potentiometric same as published values(see Table 2.5)
Complexometric (temp. 0C, ionic strength)
BI 13.59 8.40 4.02 10.52pH 6.2 (23,0.01) (21,0.01) (21,0.01) (23,0.008)
8.42(22,0.01)
B1 12.6 8.01 4.14 11.18pH 7.5 (21,0.011)(23,0.008)(23,0.01) (22,0.01)
8.24(21, .01)
B1 = ML/M L

63
Catechol pH 6.2
-4.5
MO bcn-5.0 .. ..
catechd
-7 5 ... ... ... ... ---
-7.5 -7.0 -565 -5&0 -5,5 -5.0 -4.5
Toti Capper (bC mois/L)
Catechol pH 7.5
cotechd
7.4.
-7. 5. -.
-7. pH. - 7.. 5 -54.99 X~ -45,21 C =00

64
Glycine pH 6.2
-4.5
glcine
mcde
ED
-7.5 -7.0 -6.5 -EL0 -5.5 -5.0 -4.5
Totd Ccpe (bg mcesAL)
Glycine pH 7.5
-4.5
MOD Bu.4-5-n. ......
gtyc ne
-70,
-7 7 5 -4ff
Tc~cl Cc"-et (u mac, L')
Figure 4.3b Model and experimental curve - glycineAt pH 6.2 - 1.0 X 10.' M, 210 C, I=0.01At pH 7.5 - 1.0 X 10-' M, 230 C, I=0.008

65
Phthalic Acid pH 6.2
-4.5
MO bn2k
-Sndi
-5 .5 . . ... .. .. . ... .. ........ .
_ Mode0
-7.5 -70 -6.......... . . -.................. - .5...... -. - 5.....
Totcj Upper (bg mci-s/L)
Phthalic Acid pH 7.5
-4.5
MO bhork
T" -sow (groisL
AtpH7. 1.5- XC 10 M, 230 C,10 1

66
Salicylic Acid pH 6.2
-5.5 ... .
-7.5
-8.0 I
-7.5 -7.0 -. &5 --50 -5.5 -5.0 -4.5
Totd CC~Per (bg MCL-S/L-)
Salicylic Acid pH 7.5
-4.5
MQC bk-5.0'e
curected
-7.5
fctj CCi,(- Cr r-O-s
Figure 4.3d Model and experimental curve -salicylic acidAt pH 6.2 - 5.36 X 10- M, 230 C, I=0.008At pH 7.5 - 1.13 X 10⁻⁴ M, 220 C, I=0.01

67
pH 6.2 Titratioris
-45
- . ... .................... ......... ....I. .... ............... ...
- . .. ...5. . .... ........... ....... ..... ...---------
H & ..... .. .. .. .... .. .. ..... .......... ... ......-. ........ ...... .. .. . .. .
-7T5 -7.0 -as-&5-. -5,0 -4-5ToWt Co4pw (kzg mcieAj
pH 7.5 Titrations
-4.5
-5.0 ...
-55
-7aD
-7.0
7.5-.
Tctd Cc".e (hckmc'l
Figure 4.4 Glycine complexometric error bars

68
pH 6.2 Titrations
D.Cf ine
cotechd
C-9~
-2C
Totdd Ccr (b; Cc s/
pH 7.5 Titrations
4. ii cotecht'0.0'
U3 -05
T~~ ~ ~ c) cio- r
to [LT) = 1 complexometric titrations

69
4.3 Natural Sources and Model Compound Mixtures
The XAD-8 isolates of Orange County groundwater and
Biscayne Aquifer groundwater were titrated
potentiometrically and complexometrically (see Appendix C).
4.3.1 Potentiometric Modeling
Attempting to model each of the natural sources began
by obtaining the carboxylic and phenolic acidities and DOC
content of each of the solutions titrated (see Table 4.2).
In keeping with the goal of using as much information about
the chemical composition of the XAD-8 isolates to develop a
model of a humic acid, concentrations for each of the single
model compounds were calculated based on the following
assumptions:
1) Glycine (NH2CH2COOH):
(Gly] = nitrogen (N) concentration
2) Catechol (C6H602):
[Cat] = fraction (phenolic -OH concentration)/2
3) Salicylic acid (C7H603):
[Sal] = remaining phenolic -OH concentration
4) Phthalic acid (C8H604):
[Phth] = (Carboxylic conc. - [Gly] - [Sal])/2

70
Table 4.2 Titrated XAD-8 characteristics
Carboxylic Phenolic* Nitrogen*DOC Acidity Acidity Content
Source and type (mg/L) (meq/a-C) (me/qg-C) (mq/L)
OCGW XAD-8
5.66 19.5 + 3.531 3.9 0
BA XAD-8
12.55 11.79 2.5 0.11
* assumed per Thurman (1985)1 Waterbury (1990)

71
To verify that reasonable concentrations were calculated,
elemental compositions were compared to the ranges of
measured compositions from different water sources.
DOC and the carboxylic content were experimentally
determined. Values for phenolic and nitrogen content,
however, were assumed using typical ranges (Thurman, 1985).
The fraction of phenolic content present as catechol was
varied with assumption (2) to obtain a good fit.
OCGW fitting was first attempted with no glycine and a
catechol fraction of 1/2 the phenolic -OH content of 2
meq/g-C at 2.83 X 10.5 M. Increasing the catechol fraction
had the effect of fitting the upper portion of the titration
curve better (the phenolic portion), but too high a fraction
(greater than 7/8) increased the error in the lower portion
of the potentiometric fit (the carboxylic portion). The
optimum fraction for catechol was determined at 75 percent
of the phenolic -OH content. Next, the phenolic content was
increased to better fit the upper portion of the curve.
With increasing phenolic -OH content the error was reduced
in the upper portion of the curve. However, concentrations
of greater than 10 meq/g-C were needed to reduce the error.
Schnitzer (1978) suggested a value of 3.9 meq/g-C as more
appropriate. The addition glycine had little effect
improving the potentiometric fit; therefore, it was assumed
that nitrogen concentration in the form of glycine was
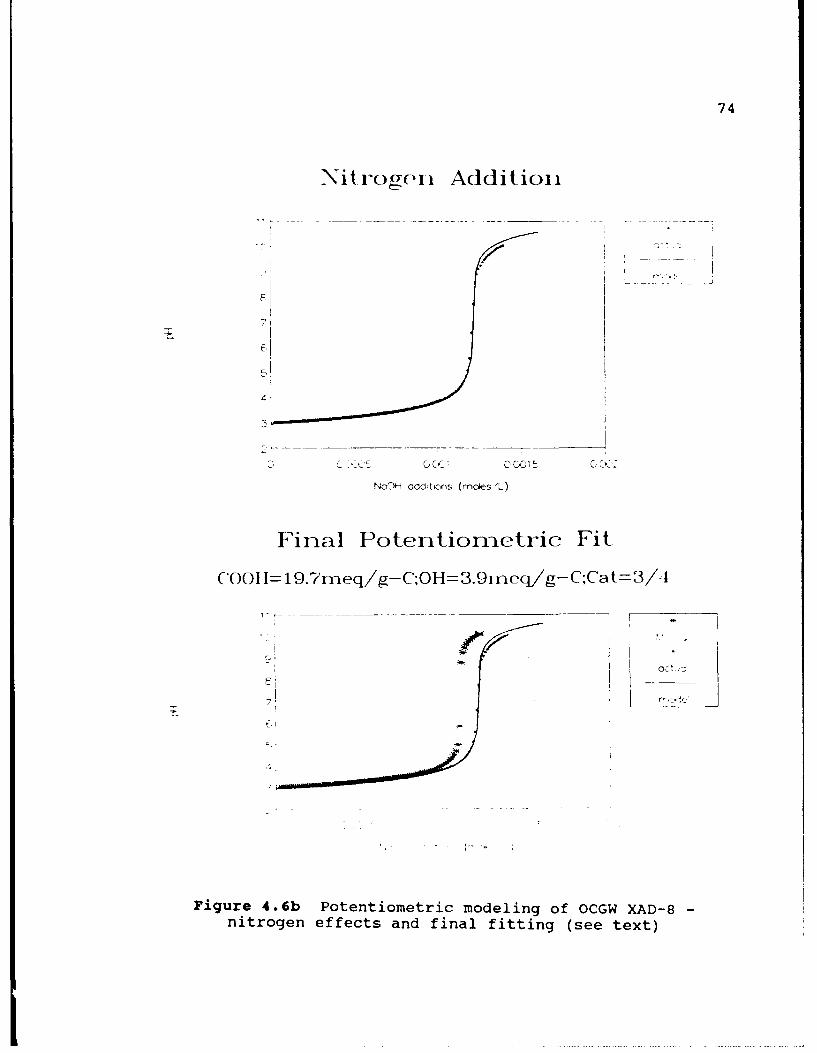
present at 0.005 mg/L. The effect of these changes are

72
shown in Figures 4.6a and 4.6b.
For BA groundwater, the process of obtaining a good fit
to the potentiometric titration data was similar to that
performed on OCGW. Results are shown in Figure 4.7 and
Table 4.3. Since the addition of salicylic acid did not
help the fit, all the phenolic content at 2.5 meq/g-C was
attributed to catechol. For the concentration of glycine,
two concentrations were investigated: a low value of 121
nM/mg (0.1 percent), representing the concentration of amino
acids present in BA humic acid, and a high of 5.8 percent
nitrogen (Thurman, 1985). A value in between these two
ranges provided the best fit. Phenolic -OH content was
assumed to be constant at 2.5 meq/g-C per Thurman (1985).

73
High Cateehol Fractioni
r C. Y-1 0 O(J' I,~
NcOH ad<tDn~s (MC*eS/L)
High Phenolic OH Content
Figure 4.6a Potentiometric modeling of OCGW XAD-8-catechol and phenolic effects (see text)
74
Nritrogeri Addition
Final Potentiornetrie Fit
C'OOH19.7eq/g-C;OH=3.9eqJg- C;Ca t3/4
Figure 4.6b Potentiometric modeling of OCGW XAD-8-nitrogen effects and final fitting (see text)

75
All Salicylic Acid
r 1 . _.. .... ...
9
0 O..CC5l1 . 5
Nit-rdjgen Effects
.0 .1 ..... ... ..... N 0 5 0
7 - ----- .. .. ... ......... .. ....... ... .. N a 0 1%
... . .. . . . ..I. . . . ..
c:Lr ocr'
Final Potentionetric Fit
Cat=1OO5% of OIL N 0 a0%
10,
141
Figure 4.7 Potentiometric modeling of BA XAD-8(see text)

76
Table 4.3 Assumed concentrations (pL) of model compounds
Phthalic SalicylicSource Catechol Glycine -Acid Acid
OCGW 5.082 --- 4.276 5.258
BA 4.804 4.699 4.194 --
77
4.3.2 Complexometric Modeling
Figures 4.8 and 4.9 show complexometric titration
curves of OCGW XAD-8 and BA XAD-8, respectively. As shown
on Figure 4.8, the pH 6.2 titration of OCGW showed problems
with the Milli-Q blank titration. Values for the OCGW XAD-8
titration at pH 6.2 were corrected by subtracting the
difference from the ideal Milli-Q titration and the actual
from the XAD-8 titration. Since total copper concentrations
for the data points did not match, a fitted model data set
derived from Waterbury (1990) was used. No significant
problem was noted for the other blank titrations of pH 6.2
in polypropylene an pH 7.5 in polypropylene or glass;
therefore, the data was used without correcting for the
blank (see Appendix C).
The same concentrations for the single model compounds
were used to try to fit the complexometric curves. As shown
on Figure 4.10a and 4.10b, there was not a good
correspondence between fitted and actual values. Curve-
fitting was attempted using SAS (see Appendix D). To an
extent this effort was considered to be a divergence from
the chemically approach being used.

78
J)HI 6.2 Titrations,
* 4--C C
/ .4
Totao Copper (g rnc~es/L)
pH 7.5 Titrations;
Fiur 4. OCG XAD-8 -opeoercttai

79
pH 6.2 Titrations
-4.5
_ o... .... ... .. ... . ... .... . .... .. .. ... . ... .. M il
XAD-8
5- . ..... ....
-7 5.. ........... ... . .. ..... ..
- 7 D - -- .. ...... 30 ............ .... ...... -5. _ - . 5...
TcO Cxxer (bog mcL-s/L)
pH 7.5 Titrations
-4.5
X A -8
-7.0K
-7.5
Tc,,j Ccc~(,.X 't L;
Figure 4.9 BA XAD-8 coinpiexoinetric titrations

80
OCGW XAD-8 pH 6.2 Titratioris
-4.5
-5.0 ..... ......
XAD-8-5 .5 .. _._._...._ _........... .....
mcde
-. 5 -50....... -* - . ...... 4. 5
TotJ Ccpw (bg mcL-esA)
OCGW XAD-8 pH 7.5 Titrations
-4.5
-5.D~~~ ~ ~ ..... . ......
XAD-8- a 5 . ..... ............ . . .
-7.0
-7-5
Figure 4.10a Complexometric curve fits with potentiometricmixture of model compounds - OCGW

81
BA XAD-8 pH 6.2 Titrations
-45
-5,5
-7.0 .. .
~~-7. )K .............. ..................................
54--ao I I
--,5 -6, -5.5 -5O -4.5
Totac 0Cp- (1a; modes,,L)
BA XAD-8 pH 7.5 Titrations
-4.5 [
i M1--0
. . .... . ... xAD-8
-- 55- 0 _ _ " .. "...... .. ro
5,5,5
Totj i .tZ.t k r' .
Figure 4.10b Complexometric curve fits with potentiometricmixture of model compounds - BA

82
For both XAD-8 isolates at pH 6.2, single-ligand
concentrations of catechol, phthalic and salicylic acid were
similar. Attempts at pH 7.5 had phthalic and salicylic acid
with similar curves (see Figures 4.11 and 4.12). Since
using both concentrations of salicylic acid and catechol
would exceed the assumed phenolic -OH content, phthalic acid
and catechol were chosen for the two-ligand fitting. After
the concentrations of the two ligands were obtained on SAS,
a reasonable guess was made for the three-ligand fitting.
Results of the SAS outputs are shown on Table 4.4. Even
though the best possible combination of elements was fitted
with SAS, the elemental composition and acidities resulted
in too high an estimate for carboxylic acidities (see Table
4.5) nor were the actual curves properly fitted with the sum
of squares errors unacceptably large - OCGW pH 6.2 at 6.39 X
10 9 , OCGW pH 7.5 at 4.03 X 10- , BA pH 6.2 at 3.05 X 10',
and BA 7.5 at 2.97 X 10 .8 (see Figure 4.13a and 4.13b).

pH 6.2 1-Ligand Models
-4.5
-. .. ... ... .
L -7.0: __ VA
-an-55 --E0 -5a5 -5,0 -4.5
Totd Ccpper (bg rncmA/)
PH 7.5 1-igand Models
-4.5
- . Df . .. . ... .... ... ... . . .. .. .. .........- -----
-7.0 w . .. . g irle
4+ 4-
F-4
Tckj Cczpe- (bcg rnck*-si)
Figure 4.11 OCGW XAD-8 single model compound SASfitting (see Table 4.4)

pH 6.2 1-L-igand Models
-4.5.
XA-
- 5.a-- -......
X
...............................
- 7 .5......*...... ...... .
-saO-EXI --&0 -5.5 -5.0 -4.5
Totd Ccper (bg mces/L)
pH 7.5 1-L-igand Models
-4.5 -_ _ _ _ _ _ _ _ _ _ _ _ _ _ _ _ _ _ _ _ _ _ _ _
- 5 0 ............- .................
X:-
-7.0 ......
-7.0
-7.55 -4.
Figlure 4.12 BA XAD-8 single model compound SASfitting (see Table 4.4)

Table 4.4 SAS modeling concentrations
CONCENTRATIONS (pL)
OCGW (DOC=5.66 mg/L) BA (DOC=5.02 img/L)pH 6.2 PH 7.5 pH 6.2 PH 7.5
1-ligand Fit
catechol 4.2 4.2 4.3 4.7
glycine 4.5 4.1 4.8 4.55
phthalic acid 3.83 2.703 3.9 3.13
salicylic acid 3.6 3.595 3.7 4.0
2-ligand Fit
catechol 4.2 4.6 4.2 5.03
phthalic acid 4.25 2.86 4.6 3.25
3-ligand Fit
catechol 4.434 5.3 4.91 5.3
phthalic acid 4.4 2.78 8.02 3.3
glycine 5.0 5.0 5.1 5.1

86
Table 4.5 Composition of SAS modelingthree ligand fits
Elemental OCGW (DOC=5.66 mg/L) BA (DOC=5.02 mg/L)
PercentaQes pH 6.2 pH 7.5 PH 6.2 pH 7.5
C 66.5 + 43.6 60.6 57.7
H 5.0 27.3 + 5.7 3.7
O 27.1 + 29.0 - 31.0 38.5
N 1.2 0.04 -- 2.7 0.1 --
Total 99.8 99.94 100 100
Ratios
H/C 0.90 7.48 ++ 1.11 + 0.76 -
O/C 0.31 - 0.50 0.38 - 0.50
N/C 0.02 0.0008 - 0.04 0.002 -
Acidity (meq/g-C)
Carboxylic 16.03 - 586.4 ++ 0.004 -- 199.7++
Phenolic -OH 14.12 + 1.77 - 4.92 1.20 -
+ high++ very high- low-- very low

87
pH 6.2 3-Ligand Model
-4.5
-5.0
XA[-&
-7.0.. . ...
-6&0 -5.5 -50-45
Totd Ccipe (bg mcks/L)
pH 7.5 3-Ligand Model
-4.5
- .0 .. .... .
-6 1 -1
Figure 4.13a OCGW XAD-8 3-ligand SAS fitting(pH 6.2 XAD-8 corrected for blank)

88
pH 6.2 3-Ligand Model
-4.5
- 5 .0 .. .... . . .......
-5,5 .__.....
-7.0K
-- 5--F0 -5,5 -5.0 -4.5
Totd CC~Pe (bg9 mckes/L
pH 7.5 3-Ligand Model
-4.5_
- 5 .. ................
iff
-7.5
-.- as
Figure 4.13b BA XAD-8 3-ligand SAS fitting

89
To show that modeling mixtures were as expected for the
actual titrations, the OCGW model mixture for pH 6.2 was
titrated (see Table 4.6). Figure 4.14 shows the results of
the potentiometric and complexometric titrations with the
outcome as expected. For the potentiometric curve, the
titration is positioned to the left of the Milli-Q titration
due to the basic condition caused by the presence of
glycine.

90
Table 4.6 Composition of titrated mixture
OCGW Model (DOC=5.66 mqj Average HA(Lamy,et al., 1987;Steelink, 1985;Thurman, 1985)
Compound concentrations (PL)
catechol 4.849phthalic acid 4.254glycine 5.00
Elemental percentages
C 57.2 40-60
H 4.1 4-6
0 37.5 30-50
N 1.2 1-6
Ratios
H/C 0.85 0.91
O/C 0.49 0.50
N/C 0.02 0.04
Acidity (mep/g-C)
Carboxylic 19.7
Phenolic 5.0

91
Potentiometric Titrations
10 .............. ... ....... .............. -............. .. Xded MO
.. . . .......... -.....
2
0 0.0005 0.01 0.001 5 0.002
NcOJH a~iditicyn9 (mces/0
pH=6.2 Complexometric
-5.............
-7.0i --&5 -5D -4
Totcd cer (bg mde--,/L)
Figure 4.14 Titration of OCGW model mixture

92
4.4 Other Modeling Attempts
Without any further titrations, each of the natural
sources were modeled with other amino acids because glycine
did not provide enough binding capacity.
4.4.1 OCGW XAD-8 Modeling
Using the pH 6.2 complexometric data and concentrations
cf catechol and glycine, the SAS program was ailcwed to fit
for a third ligand concentration and binding constant. The
result was a pL of 5.20 and a binding constant of 9.00 for a
non-protonated binding site. In Smith and Martell (1975),
two possible compounds were found that fit the binding
constant requirement: N-N-glycine and N-Uriodoiminodiacetic
acid (N-U acid). Properties of these two amines are shown
in Table 4.7.
Using assumptions (1) to (4), concentrations of
phthalic acid and catechol were modeled with SAS for both
amino acids at pH 6.2 and 7.5. The results are shown in
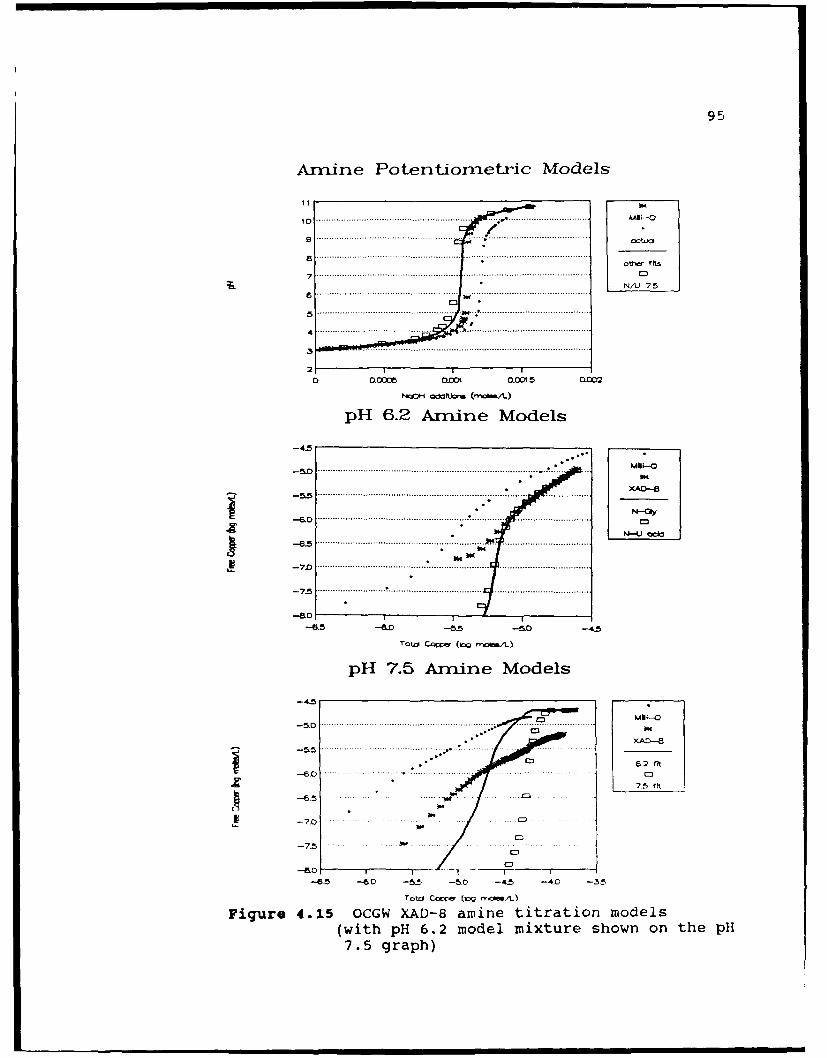
Table 4.8 with calculated chemical compositions. Figure
4.15 shows the potentiometric and complexometric plots of
the mixtures with better results than the previous ligand
used, glycine.
For both -H models, the potentiometric plots fit close
to one another but not near to the actual XAD-8 titration.
In Figure 4.15 the pH 6.2 model mixture fit better on the
upper portion of the complexometric curve but had too much
binding at the lower portions of the curve. The pH 6.2

93
Table 4.7 Other amino acids (Smith and Martell, 1975)
Name:N-(Phosphonomethyl) -N-(2-cargoxethyl) glycine or(N- (phosphonomethyl) glycine-N-propanoic acid(H4 L)
Chemical formula: C6H12 07NP
Structure: H 2 3 PCH 2 N~ CH2C2COOH
Constants (log K): HL/H.L 10.41H. L/HL.H 5.59H 3 L/H 2 L.H 3.48H 4 L/H L.H 2.72
CuL/Cu.L 13.0CuHL/CuL.H 4.71
Name:
N-Uriodoiminodiacetic acid (H 2L)
Chemical Formula: C5 H905N,
0 CH2 COOH
Structure: H 2 NCNHNCH2O H
Constants (log K) HL/H.L 4.04
H 2 L/HL.H 2.96
CuL/Cu.L 8.40

94
Table 4.8 Amino acid modeling elemental compositionsand ratios - OCOW XAD-8
OCGW XAD-8pH 6.2 with pH 7.5 with
N-N-gly N-U acid N-N-crly N-U acid
Mixture (pL - %)-the same for both amino acids
amine 5.2 - 8.9 % 4.35catechol 4.85 - 20.0 % 4.85phthalic 4.3 - 71.0 % 4.96
Percentages
C 55.1 45.4 37.4 - 39.9H 4.1 4.3 4.9 4.70 38.3 39.4 43.5 39.7N 0.8 - 10.8 + 4.4 15.7 +P 1.7 + --- 98+ -
Ratios
H/C 0.88 1.14 + 1.56 + 1.39 +0/C 0.52 0.65 + 0.87 + 0.75 +N/C 0.01 - 0.20 + 0.10 + 0.34 +
+ high++ very high
low-- very low
95
Amine Plotentiomnetric Models
10 -- --1 1 1. . . .4 .. . . . . .. . . . . .... .
9 -- -- ... . ...
Ouvr fits
NA) 75
3C
2 10 0ZOL0 ODW CLOCI 5
PH 6.2 Amaine Models
-4 5
XAD-8
-~ N--Qy-6.0 ....................... .................. ....... ........ C
N-4J Ocd
-6................
-7&0 , - - I
--6-5 -&.0 --55 --510-45
ToaCoppff (o mrft&A)
pH17. Amnine Models
XA-B
6-2 Mi
-7.0
-65 -6.0 55 -0 -4 5 -4
Figure 4.15 OCGW XAD-8 amine titration models(with pH 6.2 model mixture shown on the pH7.5 graph)

96
modeling concentrations were compared to the 7.5
concentrations and showed no match nor a fit to the actual
titration.
4.4.2 BA XAD-8 Modeling
Concentrations for the two amines were determined
similarly to OCGW modeling (see Table 4.9). Also similar to
OCGW modeling, only the pH 6.2 titration showed a good fit
with the stronger amine models (see Figure 4.16) but with
too much binding occurring at the lower portions of the
curves.
4.4.3 Fitting pH 7.5 Titrations
The fiti g of each of the pH 7.5 titrations came about
by using the concentrations of catechol and phthalic acid
obtained from the 3-ligand fitting with SAS (see Table 4.5)
and substituting the stronger binding amines of N-N-glycine
and N-U acid for glycine. The pL concentration of each
amine required to fit the data was 5.4 for both water
sources. The results of the fitting are shown in Figure
4.17. Acidities for the model mixtures to fit the pH 7.5
titrations were even higher than that shown in Table 4.5.

97
Table 4.9 Amino acid modeling elemental compositionsand ratios - BA XAD-8
BA XAD-8pH 6.2 with pH 7.5 with
N-N-gly N-U acid N-N-ply N-U acid
Mixture (pL - %)-the same for both amino acids
amine 5.4 - 12.0 % 5catechol 5.2 - 19.0 % 5.2phthalic 4.64 - 69.0 % 4.77
Percentages
C 53.9 55.0 47.3 49.5H 4.1 4.0 4.5 4.30 38.7 37.8 40.6 38.4N 1.0 3.28 2.4 7.8 +P 2.3 ++ --- 5.2 ++ ---
Ratios
H/C 0.91 0.88 1.11 + 1.03 +O/C 0.54 0.52 0.64 + 0.58 +N/C 0.02 0.05 0.04 0.01 -
+ high++ very high- low-- very low

98
Amnine Potentiomnetxic Models
10 .. .... ........ . ..... .... .. . .. M I 0
CI rits7 .. ....... . .. .. ....
21
IIo 0JO l 0.=~ 5
NOH Ocddftfr. (MriftA)
pH 6.2 Amnine Models
-- 4.5O
-S ....................................-. .....
XAD-68
-.. 0..................... .......... .........................
N-0y
..... ...... ... ...........
7 ...... .......................... ...... * *.............. . ....
--6.5 --6.0 -5-5 -5-0 -4 t,
rTW CqP~d 000 -- :AA-)
pH- 7.5 Amnine Models
-4.5
-All
.9 ~N-UI OCiC
-6z --60 - 5 -510 -45 -4,0
Figure 4.16 BA XAD-8 amine titration models

99
QCGW XAD-8 pH 7.5 Amnine
-4.5
~ -560 ................ ...
- 5 5. N-U mxid
- 7. 5 w
--&5 -5.0 -a.5 -5.0 -4.5 -4.0 -a~5
ToItj Ccppr~ (icg mcies/L)
IBA XAD-8 pH 7.5 Amnine
-4.5 1
5.5 XA0--8
__ N-LI cid
-7.
-7.5
Totcl C-,pe (k-, rn , I-)
Piqure 4.17 PH 7.5 fitting

100
CHAPTER 5
DISCUSSION
Although the results of the experimentation and
modeling did not achieve the objective of developing a model
of a humic substance based on a combination of ligands, it
does give further insight into the behavior of a humic
substance in an experiment protocol.
5.1 Titration Experiments
5.1.1 Model Compound Binding Constants
Verifying published binding constants for each of the
model compounds to those experimentally obtained was
necessary because of the dependence on temperature and ionic
strength. Although experimental temperatures and ionic
strengths did change the binding by no more than 1/2 an
order of magnitude, modeled curves fitted well with
experimental curves. Temperature and ionic strength
corrections were inherent in TITRATOR and were, therefore,
not required for modeling. Salicylic acid was the only
compound which did not agree with the published binding
constants. In this case, experimental values were used
since the published values did not fit either complexometric
titration at pH 6.2 or 7.5.
Compared to Ephraim's, et al. (1989), work identifying
30 - 45 percent of acidic sites responsible for copper
101
binding to a salicylic acid-like group and 25 - 30 percent
as a catechol-like group for an aquatic fulvic acid, this
research found for the models that fit the complexometric
curves at pH 6.2, 70 percent of the copper binding was by
phthalic acid groups, 20 percent for catechol, and 10
percent by amines for an aquatic humic acid. Work at pH 7.5
showed less than 1 - 2 percent of the groups responsible for
copper binding were of the catechol and amine type, and a
large percentage (> 98 percent) characterized a phthalic
acid-type group.
5.1.2 Titration Vessel Interferences
As shown in Figure 3.4, the type of titration vessel
used will effect complexometric results. The decrease of
free copper with glass was observed by Cabaniss and Shuman
(1988c) along with no decrease observed in opaque, teflon
beakers. This study showed slight interferences with
polypropylene which may have not been due to adsorption. In
comparing glass and polypropylene titrations, though, glass
had much higher adsorption of copper (II) occurring.
5.1.3 Titration Reliability
Repeats done on glycine showed good repeatability for
potentiometric titrations. Error bars for complexonetric
titrations did not, however, show as good a repeatability.
At the lower portions of the titration curve, where free
copper was less than 10-7 M, some error was expected due to
the loss of linearity with the copper probes. The error for

102
the titration was at its lowest at a total copper
concentration of 10.5.5 M, and increased from that point with
increasing total copper concentration. This trend can be
explained by the number of binding sites for the ligands
being occupied decreasing as more copper is introduced. The
remaining ligand sites take a longer time to be occupied by
the free copper; therefore, enough time should pass before
further copper additions. In this research, titrations were
automated, and ten minutes were allowed between copper
additions. Cabaniss and Shuman (1988a) allowed 3 to 30
minutes between additions, depending on the total copper
concentration. Holm and Curtiss (1990) equilibrated for 60
minutes.
Between the two pH titrations, the pH 7.5 titrations
had greater error than the pH 6.2 titrations. This could be
due to the presence of another ligand (OH) requiring even
longer equilibration times. It may have been also due to
the difficulty experienced in maintaining a constant pH at
7.5. A HEPES concentration of 5 mM was found to be adequate
to maintain the pH to ± .01 units. Holm and Curtiss (1990)
buffered their titrations with HEPES at 6.7 mM.

103
5.2 Model Compound Mixtures
The selection of the model compounds used - catechol,
phthalic acid and salicylic acid - was partially based on
previous work that attributed binding sites of humic
substances to these groups on humic substance molecules (see
Section 2.2). Of the previous work, this research effort
agreed with Buffle, et al. (1980), in showing that salicylic
and phthalic acids do not have high enough binding
capacities to explain a humic substance. Also in this
research, catechol and glycine were not adequate. What was
also shown is that if it is assumed that phenolic and
carboxyl groups are responsible for the majority of the
complexation of metals that occurs, then phenolic acidity
measurements limit the use of salicylic acid and catechol
quantities. With the similarity in behaviors of salicylic
acid and phthalic acid in modeling each of the groundwater
sources, chemical constraints of phenolic -OH content
required the use of phthalic acid and catechol to describe
the complexation of copper (II) by a humic substance. In
previous work that had carboxylic acidities closer to
phenolic acidities, salicylic acid-type groups may have been
more appropriate.
5.2.1 OCGW XAD-8 Mixtures
For this groundwater source, phthalic acid and catechol
did not adequately model the complexometric curves. The
addition of glycine was also not successful. The
104
substitution of glycine with N-N-glycine and N-U acid did
fit the titration at pH 6.2, but there too much binding
occurring at the lower portions of the curve. This
indicated that the nitrogen content used was excessive.
Problems occurred when concentrations of phthalic acid,
catechol and the higher binding amino acids were modeled to
the pH 7.5 titrations. The parameters which provided a good
fit at pH 6.2 titrations were not adequate to explain pH 7.5
titrations. Only by using the high phthalic acid
concentrations from the 3-ligand fitting was a good fit
approached with the higher binding amino acids. The result
though of using the higher concentration cf phthalic acid
was a mixture that did not contain a reascnable carboxylic
acidity. Use of the higher binding amino acids also caused
a poor fit of the potentiometric curves due to the loss in
overall acidity.
5.2.2 BA XAD-8 Mixtures
Modeling of the BA XAD-8 groundwater had the same
results as OCGW. Final fitting of the pH 5.2 complexometric
titration was possible with catechol, phthalic acid and N-N-
glycine or N-U acid; but this combination of ligands gave a
poor fit to potentiometric data. The same concentrations
did not fit the pH 7.5 titrations, and fi::ing was possible
by using high concentrations of phthalic acid. The phthalic
acid concentration was not as high for BA as OCGW due to the
lower carboxylic content of BA.

105
5.2.3 Possible Other Functional Groups
The results indicated that the complexation behavior of
a humic acid is best modeled by a strong amino acid at pH
6.2 and with carboxylic and phenolic groups. Titrations at
pH 7.5 needed a strong carboxylic-type group for proper
fitting. For a model mixture to fit at both pHs, the
carboxylic-type group would need to have a strong
unprotonated binding ligand at pH 7.5 that dominates the
speciation. At pH 6.2, a relatively-weak, protonated ligand
would need to dominate. This suggests a site with an acid
dissociation constant between 6.2 and 7.5 and a multidentate
character.
Even if such a ligand was available, the necessity of
also fitting potentiometric curves and satisfying reasonable
concentrations and elemental percentages and ratios may not
be possible. For example, the carboxylic acidities may be
exceeded by such a ligand to fit the pH 7.5 titrations. An
increased binding with pH might be due to another minor
functional group such as the sulfur groups. However, at
this point the model system begins to mirror the complexity
of the item being modeled.

106
CHAPTER 6
CONCLUSIONS
6.1 Chemical Modeling of a Humic Acid
This research project set out to find a simple model
mixture for a highly complex system. The model had to fit
the constraints of being chemically-valid and of being able
to describe experimental data. In attempting to
characterize a groundwater humic/fulvic acid with simple
model compounds, some of the constraints were satisfied for
some of the conditions. The modeling of a humic substance
was possible at pH 6.2 with phthalic acid, catechol and N-N-
glycine, tit the presence of N-N-glycine reduced the mixture
acidity and caused an improper characterization of
potentiometric data. At pH 7.5, experimental fitting of the
complexometric curves was possible with the same compounds,
but with high concentrations of phthalic acid, resulting in
carboxylic acidities that were excessive. Carboxylic and
phenolic acidities occurring as multidentate ligands would
better model the complexation behavior of humic substances
than the excessive binding observed by nitrogen present as
amino acids. The low concentrations of highly complexing
nitrogen did not characterize the behavior of .he humic
substances properly.

107
6.2 Recommendations for Future Work
Future work of finding a simple model for a humic
substance should begin with a systematic approach of
modeling a proposed model mixture with the computer programs
available prior to expending time in the laboratory.
Experimental verification is the final and necessary step to
the modeling process of the model compound constants and the
model mixtures. The apparatus for complexometric
titrations should include the use of appropriate, non-
adsorbing titration vessels. Polypropylene or opaque teflon
should be adequate. Temperature control of complexometric
titrations is not as vital as for potentiometric titrations,
but for consistency, a jacketed, temperature-controlled,
vessel would be ideal. The DOC of the titrated natural
sources should be kept between 4 - 6 mg/L to ensure adequate
response for the titration range of copper (II). The
titrant additions are also important and should be between 2
X 10-5 M and 2 X 10⁻⁴ M per addition of copper (II). One
item not fully recognized in this research was the long
equilibration times required as total copper concentration
increases. Automated programs can be adjusted so that
longer times are allowed as the titration progresses. An
increase in time will likely result in the need for greater
buffering capacity. The effects of increasing buffering
should be examined as buffer concentrations begin to
overwhelm the ligand concentrations.

108
APPENDICES
Appendix A Titration Data of Single Model Comipounds
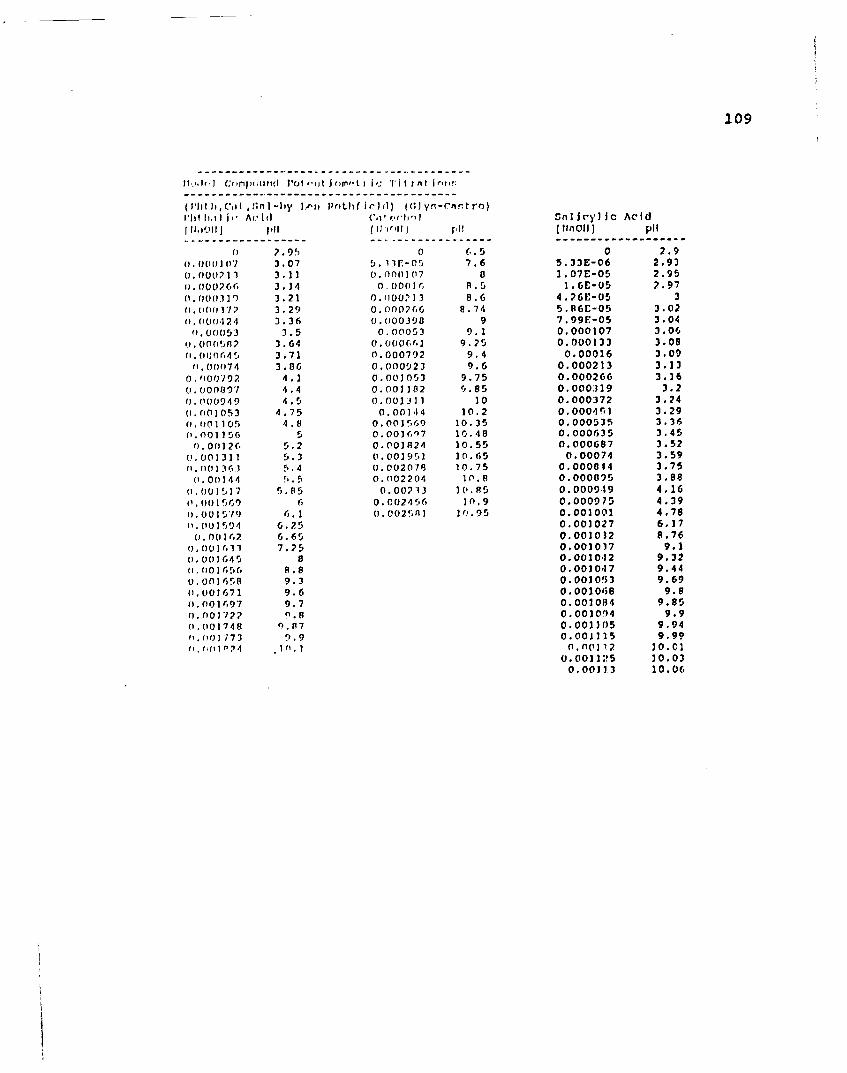
109
----------------------------..-------------II.-),, I C(Pin|, io tid I it ,ijt J or,.L t i( 'rli t r n t ,'r
( Pht I iCivlt !n I-Ihy I,")m PrithIf ,I rI r ) ((',)yn-r~rtro)
lht lto IIP Al id ',(d rI'h l I Jcy)Ic Acidl 1h,10 l1J I,II (11,1(011 r [ l t tj,^1 ll ) P11
1; 2.9' 0 (,.5 0 2.9O.0(007 3.07 5.33E-05 7.6 5.33E-06 2.93
(). (1002 13 3.22 0. 0(7 8 1.07E-05 2.951). 000266 3.24 0 1000]1 r, 8.5 I.G6E-05 2.970. o0031) 3.21 0.000'23 8.6 4.26E-05 3(. ((072 3.29 0.000266 8.74 5.S6--05 3.02
0).0(24 3.36 0.000398 9 7.99E-05 3.040..00053 3.5 0,00053 9.1 0.000107 3.06
rp. 0005132 3.64 0. 00064"2 9.25 0.000133 3.08(I. (U0)(4 5 3.71 0.000792 9.4 0.00016 3.09
0.000174 3.86 0.000923 9.6 0.000213 3.130.000192 4.2 0.00.1053 9.75 0.000266 3.16(. 0001397 4.4 0.001282 9.85 0.000:329 3.20.0(1(0949 4.5 0.002311 20 0.000372 3.24
(00 053 4.75 0.001,14 10.2 0.000451 3.29
().001109 4.8 0.001569 10.35 0.000535 3.36n.0156 5 0.00]6n7 10.48 0.000635 3.45
0.0(1126 5.2 0.002824 20.55 0.000687 3.52(1,001311 5.3 0.002951 10.65 0.00074 3.591.10o363 5.4 0.002078 20.75 0.000844 3.75
(.00144 5.5 0.002204 10.8 0.000095 3.88(. (001'17 5 1.85 0.00213 20.R5 0.0009.19 4.16(,001569 6 0.002456 V0.9 0.000975 4.39(1.001579 6. 1 0.0025A1 20.95 0.001001 4.78(.0,94 6.25 0.002027 6.170.001,2 6.65 0.001032 8.76
o.0014,31 7.25 0.002037 9.1o001645 a 0.0020,12 9.32(,001656 8.8 0.0020,17 9.440.0016 . 9.3 0.001053 9.69(1,001671 9.6 0.001068 9.80.01r,97 9.7 0.0010114 9.850.001722 0.8 0.001094 9.90.001748 (.S7 0.001305 9.94".0(1 173 9.9 0.001235 9.99
n* '.01 074 .11.1 0.)0112 20.010.00211!5 20.030.0011.3 10.06
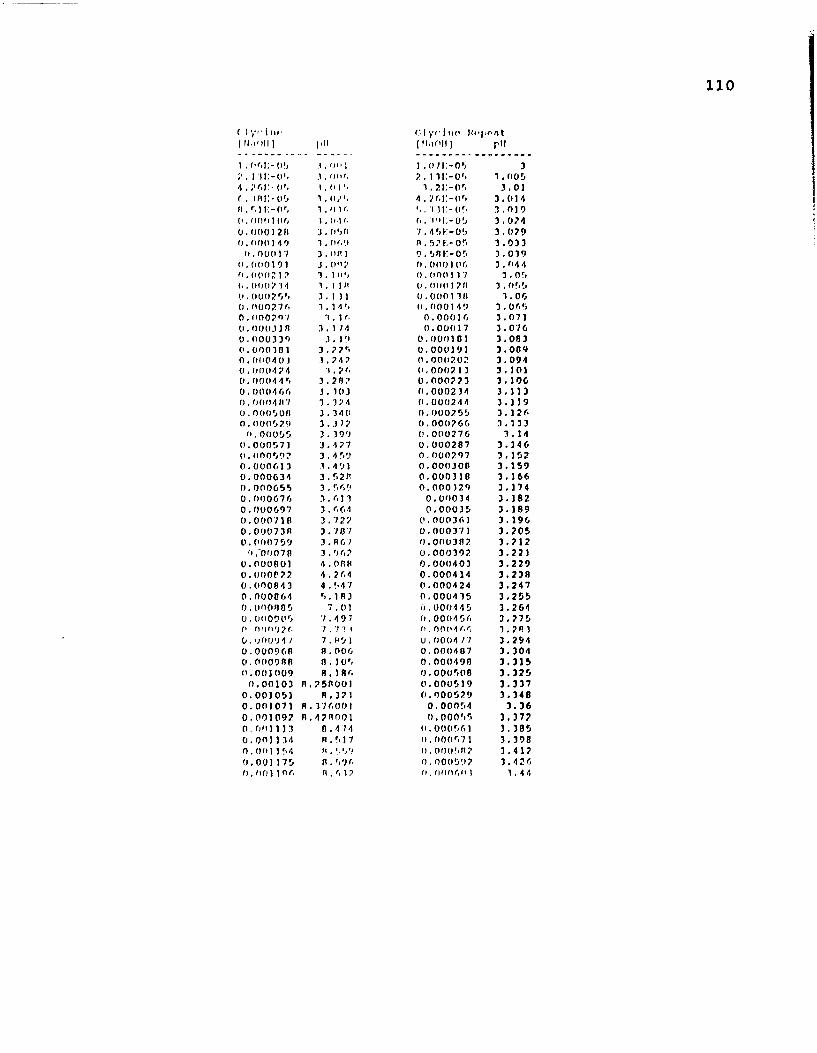
110
C~' ,' I II1 I fir, V .'r-nit
( OlI ) p11
I WI;~-0!, 3,n1. 021 31-' .0
4 01, 1.' (II 3 j; 0 r 3.01
6I. (10(110 I, (Q1 C.261:-O' 3 .014
V.* (1010614 1 0 '.111 52~0' 3.,33
1. 000 17 3 (In 1 9 . FI F- 05 3,0190I. (100 19 1 . (),1,, ( (10001 W.1 3 . (144h .110 ()( ) ,I: 3 . I(I 1, 0.01 01 17 3 , 0!,
N .0002 V, 3. 1 31 0.00013111 1.0or0 . (1002176 3 . 1 4,, 0 .(000 149 3 .0of"0.1.10024 7 1 1( 0.00016 3.071C) .0003.111 3 I. 1 4 0 .00017 3.0160. 00033) 3 .1"f 0.000181 3.083Q1.000 30 1 3. 2r, 0.000191 3.0090 .01104 01 3.747 (. 000120i 3.0940,001024 13.2r. 01.000213 3. J01(0004 4 " 3.,2 n ' 0.000273 3 106 N0.0010466 3.103 (1,000234 3.11301. 0004117 3.324 0(.00(0244 3. 1190 .00015of) 3.34S' 0. 00025t) 3 .1260 .0(00529 3 .3 2 0.00(0266 3 .133(1.000!05 3.399 01.000276 3.14
0.000571 3.427 0.000287 3.2460 .1()()O)!) 3 .4 59 0.000797 3.152
0.000613 .1.49.1 0.00(0300 3.1590.000634 3.52P 0.000318 3.1660. 000655 3 .rr49 0.0(0032q 3.1740.0100670 31.611 0.001034 3.1820.000697 3.f,(4 01.00035 3.1890.000711 3.722 0.00036'1 3.1960.00973A1 3.781 0.000371 3.2050, 000(759 3 .1A6) 01.000(302 3.212
(1.00078 3 .962 0.000392 3.2210.000801 4.0111 0.000)403 3.2290.000('27 4.264 0.000414 3.2380.0100843 4 . !47 0.000424 3.2470.000864 5l.1913 0.000415 3.2550),0001185 7.()l w.000445 3.264()001)(111 7.497 0.000456 3.275P ('100I926 71.71 Ih ('1004 16 I .2113().,1(109 4 7 . W1 .. 0004 /7 3.2940.000960 8.006 0.0(10487 3.30401.]009809 fl .I Or 0.000498 3.3151.001009 8.186r 0.000508O 3.325(.0010311.2511001 0.000519 3.337
0.001051 A1.321 0.000529 3.3400.0(11071 11.316001 0.00054 3.360,001092 R.4714001 0.00055 3.3770. 001113 n1. 4 74 (1. 00056,(1 3.385
0.0n)134 R . 17 (. 00"17 1 3.398n.0off1154 A . 5''i 0). 00lll.11 3.4120,001175 S.',')(. 0 1 n059.2 3. 42r6

111
C I yr I no Glyci" '-,01t
0. 0n1237 8. 69,R 0. 000r,24 1.410.001758 It. 129991 0,000614 1.486,0.001278 8.759 0.000645 3.5030.002299 8.788991 0.0006,15 3.5210.001319 8.014991
) 0.000666 3.54
-1.00134 8.8409119 0.000676 3.5590. 0)36(1 8. 1166999 0.000687 3.500.001381 8.892 0.000697 3.60.0n402 8.917 0.000708 3.6230.001422 P.93c999 0.000718 3.6470.001443 8.(¢2 0.000729 3.6720.001461 t 818499
r" (1.000739 3.70.0(1484 9.00) O.onn!5 3.7280.001504 9.02P 6.00076 3.7590.001525 9.049 0.000771 3.7920.001545 9 .0. 0.000781 3.830.001566 9. Of,* 0.000791 3.870.001586 9.109 0.000802 3.9140.001607 9.128 0.000812 3.9640,001627 9.148 0.000823 4.018.0.001648 9.165 0.000833 4.0830.0o11668 ). 185001 0.000844 4.1590.001688 9.201 0.000854 4.2490.001709 9.212 0.000864 4.3630.001729 9.239001 0.000875 4.5090.00175 9.2 1r7 0.000885 4.7050.00177 9.27499" 0.000896 5.0090.00179 9.292 0.000906 5.624
0,001811 9.311 0.0009)7 6.801
0.001831 9.326 0.000927 7.2290.001851 9.343001 0,000937 7.451'),.nn1872 m.15999, 0 .00048 7.605P.fl1892 ).171 (1.( On(1 ',1n 7.773U. ol1 ;'1 9. 09299', 0 (100969 7.1160.001933 9.409001 0.000979 7.890.001953 9.425909 0.000989 7.9560.001973 9.442 0.001 8.029
0.001993 9.45fl 0.001021 8.1130.002014 9.474 0.001041 R.1990010.002034 9.49 0.001062 8.2730.002054 9. F05 0.001083 8.3370.002074 (j.r,22001 0.001104 8.395001
C.002094 9.537 0.001124 8.446999(.007115 9.552 0.001145 P.496C.0r,2135 9.569 0.001166 8.54(.002151, n . r, 81 i 0011 p86 , .r5
(.021217 ( 9.59 o.001207 P.,11001(.,12195 1.n 4fl0( .(12)1 P.655
.)01 2211 ' 9. r, 1.0 , ' 9 .(2 sf .00223f
. 9. r,,It(1 0 (112 (,1 e.'722( .i 1 ;.'( 9. r,. r.O ' , P.7!54f. 0 "',7 7 f , 1) , f, I P ,,1', I I 1 8 . 7P I

112
Glycine Glycine Repeat Glycine Repeat(NaOH] pH (NaOHI pH [NaOH pH------------- ----------- ------------------0.002296 9.692 0.001331 8.812 0.002248 9.6440.002316 9.708 0.001352 8.839 0.002288 9.6750.002336 9.724 0.001372 8.866 0.002328 9.7070.002356 9.741 0.001393 8.891 0.002368 9.7390010.002376 9.755999 0.001413 8.916001 0.002409 9.7710.002396 9.771 0.001434 8.941 0.002449 9.8020.002416 9.786 0.001454 8.963 0.002489 9.8330.002436 9.802 0.001475 8.986 0.002529 9.8640010.002456 9.818 0.001496 9.008001 0.002569 9.8960.002476 9.833999 0.001516 9.03 0.002608 9.9280010.002496 9.850001 0.001537 9.050999 0.002648 9.9589990.002516 9.865 0.001557 9.071999 0.002688 9.9910.002536 9.88 0.001578 9.0920.002556 9.896 0.001598 9.113 0.002728 10.0220.002576 9.912 0.001619 9.130999 0.002768 10.0530.002596 9.927 0.001639 9.1510.002616 9.944 0.001659 9.170.002636 9.958999 0.00168 9.1890.002656 9.974 0.0017 9.2080.002676 9.99 0.001721 9.2250010.002696 10.004 0.001741 9.244001
0.001762 9.2609990.001782 9.2790.001802 9.2959990.001823 9.3130.001843 9.3320.001863 9.3479990.001884 9.3650.001904 9.3809990.001924 9.3970010.001945 9.4129990.001965 9.430.001985 9.4460.002005 9.4610010.002026 9.4750010.002046 9.4870010.002086 9.5179990.002127 9.5490.002167 9.5810010.002207 9.613

113
Ili II -Q Cv ' l,rx m,.t I I' I Jt.rnt Intir, P 1,1l - 6.2
I; li -) T I,11k 0 pA11 G.2 Hill 1- I II W OO P I'l (.2 IdenI M ii1 -0I I. I'I y,. .y Ii'. GIn,.s (Wat lt tury, 1)9() 0 I'l (.2
I. JUISF) 1(-,) 14:11 1o, Cl or It'" Io¢ C)C) ul ; t iv
0(0oO -7.532 -6.P8413 -7.75338 -7 -7.01963-1..,,23 -/'.OF ') -',.9838 -7.44776 -6.03152 -6.05117-. .31( -r. . 7(' -r. 80771 -7. 1814 -5.754 49 -5.77416
j -6.535 -5.682 7 -6.880628 -5.5867 -5.60639-V,.(i1. -6.431 -5.58506 -6.64108 -5.46597 -5.48561-5 .9!,9 -6.272 -5.506611 -6.34257 -5.371161 -5.39133-5.15v6 -6.182 -5.43973 -6.11S34 -5.29414 -5.31398-5.11", -6.072 -5.38174 -5.94101 -5.22841 -5.24817-'.770 -5.995 -5.33059 -5.80597 -5.17134 -,.19112-5.7"2 -5.957 -5.284n 3 -5.69936 -5.1209 -,. 1407-,.r.'I -5.902 -5.24344 -5.60341 -5.0757; -5.09554-s.', ".a .8 1J -5. 11604 -5.37242 -5.034F -5.05163
',€93 -5.7HR -5.01766 -5.21251 -4.9974 -5.01126.510 -. 746 -4.9375 -5.10234 -4.96297 -4,98284
-,.,39 -!.73 6 -4.869n6 -r,.0135 -4.9310o -4.95(1'6-5.510 - ,.677 -4.81135 -4.93010 -4.90136 -4.92127-,.48 1 -5.636 -4.75979 -4.17136 -4.87354 -4.89347
-- 4'.7 -5.61$1 -4 .71371 -4.8145 -4 .84741 -4.96735-5.4(1 -5.594 -4.67205 -4.76119 -4 .8227!, -4.84212.410 -5.559 -4.63404 -4.7185!
, -4.7994. -4.81941
-, 39 -5.535 -4.59909 -4.67591 -4 .77728 -4.79728
-I.r.1 -5.525 -4.56675 -4.63692 -4.75622 -4.77624-1.49 -5.480 -4.53665 -4.60483 -4.73613 -4.75617
-5.330 -5.494 -4.50849 -4.5725 -4.71693 -4.73698r,1 -5.459 -4.48206 -4.54087 -4.69A54 -4.71861
-. 29.1 -5.424 -4.45714 -4.51244 -4.680S9 -4.70099-5.2/li -5,442 -4.43357 -4.40756 -4.66394 -4.68405-5.262 -5.400 -4.41122 -4.46269 -4.64762 -4.66776-5.2,16 -5.373 -4.39996 -4.44136 -4.6319 -4.65205- ,11 -5.376 -4.3697 -4.41649 -4..61672 -4.63689
-5.211 -5.348 -4.35033 -4.39517 -4.60206 -4.6222r,
-r,.203 -5.314 -4.3318 -4.3774- .190 -5.331 -41.31402 -4.35,08-',.177 -5.279 -4.29694 -4.33031-. A.4 -5.314 -4.280r1 -4. 32054-5. I'.? -5.300 - 4.26468 -4 30277
,. ft -,.279 -4.2414 -4 211'I',6.1. 'f -',.29., -4.23465 -4 27 0 9
-11. / -5.283 -4.22037 -4.25302-. W,1' -5.227 -4.20,6 -4 24236-5,095 -5.206-5.iq4 -5.193 )(,,1 iCul'Jlo'j (Cul')-',,074 -5.272 ..................-'. I -5.28 -4.1821 -4.943
A'4 -5.203 -4 .144 -4.8R8- .' - . 1I 2
- 1..~ -,. 11
1 ' S% -. 1 ,

114
cr,l' I,ry.or1I rI IC T1IATIOfi. P p1 - 6.2 or MODrLr CoHOrUftS
I'hth,l it.- Ac'id ( .11,:: ? .O)JO 1 1, I .",1] r,, nc t o u i {gt r uI'
-6.2.12 -7.024-6.097 -6.R',2-6. 000 -6.741-5.022 -6.64(-5.Pl 4 -6.555-5.79" -6.485-5.746 -6.423
-5.69 -6.369
-5.621 -6.26P- .51l(, -6,229-. 5",4 -6.292-5.574 -6.2'2-5.4"1 -6.121-5.470 -6.0P
¢
-5.445 -6.055-5.42A -6.032-5.400 -6.000-5.379 -5.977-r . 1 ,n -5 .951D
-5. 39 -5.931-5.171 -5.904-5.303 -5.8A4-5.2fl -5.B 5
-5.270 -5.845-5.254 -5.82t,-5.2J9 -5.807-5.274 -5.791-5.210 -5.77f-5.197 -5.75-5.183 -5.744-5.170 -5.725-5.)59 -5.710
-5.146 -5.69S-5.131 -516e.
-5,I1 -9,64
-5.10 -5.62-5. 00 -5.628
-5.079 -5.616-5.069 -5.605-5.059 -5.593-5.050 -5.582-5.040 -5.57C-5.031 -5.55 r
-€,.02r -5.547

115
;' '',.1io," (r9 .',t1) -ly ( or.-49t1I.,:t,' o,j I C'1I I II CT 1
~ I ('31 ,_iI l I' c") ( IrjC'I 1C') Cu1 10-,CU) ci l o'j
-7.00 -7.65 3 -4 ,0 5 -r.64 9 -7.000 -7.867 -4.975 9,- . .5 -1. 374 -49, -5.424 -6.'P3 -7.619 -4.960 -5.917
-r.301 -7. 224 -4. 944I - .5, -6.301 - 7. 4 65 -4.*944 -5,.8 -7
-6.155 -7.0(6 -4.93o -5.518 -6.155 -7.337 -4.930 -5.917-6.046 -6.9!9 - .915 -5.553 -6.046 -7.27 -4.916 -5.77S-6.0hi -6.916 -4.902 -. 531 -5.959 -7.139 -4.902 -5.807-5.921 -6.830 -4.111 -5.1 -5. B87 -7.060 -4.8p9 -5.764-5.855 -6.750 -5.825 -6.997 -4.876 -5.729-5.79? -6.694 -5.770 -6.936 -4.863 -5.689-5.74, -6.637 -5.722 -6.886 -4.851 -5.654-5.70) -6.511 -5.679 -6.537 -4.839 -5.618-5. 65') -6.517 -5.639 -6.791 -4.828 -5.5 sb'-5,6'1 -6.4')4 -5.603 -6.751 -4.817 -5.554-5.58 -6.451 -5.570 -6.712 -4.806 -5.523-5.551 -6.415 -5.539 -6.677 -4.795 -5.494-5521 -6.379 -5.510 -6.641 -4.785 -5.46-5.496 -6.143 -5.483 -6.606-5.47,) -6.515 -5. 4f, -6.057 7
-5.44", -6.283 -5.434 -6.542-5.422 -6.254 -5.411 -6.517-5.40 -6.225 -5. 3W) -6.405-5.3il -6.200 -5.369 -6.460-5.35') -6.175 -5.349 -0.435-5331 -6.1r)o -5.310 -6.407-5.321 -G. 121, -5.312 -6.38A-5.301 -6.104 -5.295 -6.361-5.284 -6.079 -5.278 -6.336-5.270 -6.061 -5.262 -6.315-5.251 -6.039 -5.247 -6.297-',.23') -6.018 -5.232 -6.272-5.225 -6.000 -5.218 -6.254-5.210 -5.979 -5.204 -6.233-5.197 -5.91,1 -5.190 -6.225-5.183 -5.943 -5.177 -6.394-5.171 -5.92!5 -5.164 -6.176
- " -,. -'..5.152 -6.158-'~~~~~ .e4 9 -'.]: 14 1
-5.128 -6.123-. 12.j -5.85'7 -5.217 -6 .105-5.I1 -5.043 -5.106 -6.091-5.100 -5.828 -5.095 -6.073-5.090 -5.014 -5.015 -6.055-5.0/9 -5.800 -5.074 -6.041-. 069 -5.785 -5.0r4 -6.027!. ,') -5.771 -5. 0 ,5 -6.013-. t." -5.7'7 -5.045 -5.999-5.I4 -5.'4 -5 .01. -5. CIA1-€..,;,. -5 "/:,' -5.021 -5.9,10
-5.00" -5. "'C -5. 00!, -6.01)-4,l
2 -r, 4,74 -

116
:;Illcytlic Acid (5.357r6,6-4M) Catochol (1.36125E-.1)lllt:rI . O0 2 ..) n H-.00048? 1-.0o,,,nI'q(CiTI oq(CuF'l ioqIcu'rJ oq-cuvj
-A.999 -7.657 -7.000 -7.545-6.522 -7.178 -6.523 -7.205-6.501 -r.961n -6.302 -7.011-6.155. -6.796 -6.156 -6.862-6.045 -6.660 -6.046 -6.751-5.958 -6.576 -5.959 -6.662-5.886 -6.502 -5.887 -6.585-5.824 -6.440 -5.825 -6.522-5.770 -6.382 -5.771 -6.461-5.721 -6.324 -5.722 -6.407-5.678 -6.272 -5.679 -6.363-5.639 -6.227 -5.640 -6.322-5.602 -6.191 -5.603 -6.283-5.569 -6.159 -5.570 -6.249-'1.53,3 -6. 126 -5.539 -6.217-5.1.r9 -6.094 -5.510 -6.182-5.4132 -6.065 -5.483 -6.153-5.157 -6.036 -5.458 -6.125-5.133 -6.010 -5.434 -6.099-5.-10 -5.981 -5.411 -6.071-5.388 -5.958 -5.389 -6.048-5.368 -5.935 -5.369 -6.026-5.348 -5.913 -5.349 -6.001-5.329 -5.890 -5.330 -5.982-5.311 -5.871 -5.312 -5.96j-5.204 -5.051 -5.295 -5.940-5.277 -5.829 -5.278 -5.921-5.2r1 -5.812 -5.262 -5.905-5.28: -5.79) -5.247 -5.886-5.231 -5.777 -5.232 -5.867-5.217 -5.757 -5.218 -5.851-5.203 -5.741 -5.204 -5.836-5.189 -5.725 -5.190 -5.820-5.176 -5.712 -5.177 -5.804-5.163 -5.696 -5.164 -5.791-5.151 -5.683 -5.152 -5.775-5.139 -5.670 -5.140 -5.76:-5.128 -5.654 -5.129 -5.747-5.116 -5,641 -5.117 -5.734-5.105 -5.628 -5.106 -5.721-5.094 -5.615 -5.095 -5.708-5.081 -5.605 -5.085 -5.696-5.074 -5.592 -5.075 -5.683-5.0r4 -5.583 -5.065 -5.670-5.054 -5.570 -5.055 -5.658-5.0,14 -5.560 -5.045 -5.648-5.035 -5.547 -5.036 -5.639-5.026 -5.537 -5.027 -5.626-,1 .91 -5.495 -4.992 -5.616-4 .59 -5.460 -4.960 -5.57F.!'1'9 -5.424 -4.930 -5.51--9 f?1 -5.392 -4.902 -5.499-4.875 -5.362 -4.876 -5.461-4.850 -5.333 -.1.851 -5.426-1.327 -5.307 -4.828 -5.394-1.005 -5.282 -4.806 -5.365

117
Q ((,I I --I. 0. .eyr,,mvtrI I" TIt In LI fin 0 pi I , 1,
III ., IIIi}: M I IJ- 11 I ,H k Id a I Ank'1/ t |' It.If C, InI: r. rill 7, 5CWI I I ' I,,I (,,Cil I,rj IC1l'l*1|0,i (V'IIII,, CU |01 [ og0, (Cu 1'l
/.fr( -7.104 -6.11795 -6.80266 -7.000 -7.13629
•,', -6.i'5 -5.0111695 -6.39791 -5.585 -5.73417,. l -6.5,,0 -5.71008 -6.1743 -5.293 -5.45304
.... -6.'.)' -5.50597 -6.01,97 -5.120 -5.29045.,11, -6.4 2" -5.48909 -5.91493 -4.996 -5,1769
-' ,1,1' -61 -5.40993 -5.84011 -4.900 -5.0902
'.,, 51/ -6.249 -5.34301 -5.77208 -4.821 -5.02041
-'..rs -6.:Rl -5.20505 -5.71426 -4.755 -4.96223
-',.171 -6.119 -5.23392 -5.65984 -4.697 -4.91248
-'.7'2 -6.06r, -5.10819 -5.61903 -4.646 -4.86912
-' .a9 -6.018 -5.14683 -5.57821 -4.601 -4.83078
-1j.6,40 -,..")? -5.10907 -5.5442 -4.560 -4.79046
-,,.,3 -5.933 -5.07433 -5.51019 -4.522 -4.76543
-, -5.197 -4.98391 -5.42856 -4.407 -4.73715
, -5.1:64 -4.90936 -5.35713 -4.455 -4.7112
-b..,0 -5.1132 -4.84577 -5.29251 -4.425 -4.7
-r.45. -5.806 -4.79034 -5.23809 -4.397 -4.7
-!,.4',R -5.776 -4.7412 -5.19727 -4.371 -4.7
-11.414 -5.751 -4.69709 -5.1!,646 -4.346 -4.7
-'.411 -5.731 -4.65704 -5.1904 -4.323 -4.7
-5. s~l" -5.704 -4.6204 -5.00503 -4.301 -4.7
-5ir,'9 -5.685 -4.58662 -5,05782 -4.279 -4.7
-'.349 -5.665 -4,55529 -5.03061 -4.259 -4.7
-', J30 -5.646 -4,52609 -5.0068 -4.240 -4.7
-, 32 -5.626 -4,49873 -4.9864 -4.222 -4.7
-1 -5.630 -4.473 -4.96599 -4.204 -4.7
-. 78 -5.!97 -4.44873 -4.94558 -4.187 -4.7
-. .? -5.51 -4.42574 -4.93198 -4.170 -4.7
-5.,247 -5.S-4 -4.40392 -4.91837 -4.155 -4.7
-5.2)2 -5.551 -4.31315 -4.90477 -4.339 -4.7
-'.218l -5.535 -4.36334 -4.89116 -4.175 -4.7
-r,.204 -5.522 -4.3444 -4.88436 -4.111 -4.7
-' . 1'0 -5.-'09 -4.32625 -4.87415 -4.097 -4.7
-1,. 7/ -5.4905 -4.30884 -4.87075 -4.083 -4.1
-',,'. -5.4p3 -4.79211 -4.86395 -4.071 -4.7
_ . -5.471 -4.276 -4.86055 -4.058 -4.7-'.14 5. 61-4. 760'4 R -4 .800r.5 -4 ,04r, -4.7
- '*" -. 447 -4.2455 -4.1n5115 -4.034 -4.7
-",.1); -5.437 -4.23102 -4.85375 -4.022 -4.7
-. 1,. l6 -5.427 -4.21701 -4.85375 -4.011 -4.7
-15095 -5.417 -4.20345 -4.85375 -4,000 -4.7
-I,,ri5 - 5,4Aq "1 j (cu'l']loej (Cur)- 1 WI4 -5,398 -------------------o,6(,4 -5.391 -4.851 -5.179
-5. "5'9 -5,378 -4 .5'2n -5.157
I t, 4 ' . 5 . 3 -4 . 7 nO , -5 .1 3 7- ,, f . , -5.36 Y -4 ,7 6l5 -5 . 0 5
-5.326 -4.746 -5.080
- | .,o -5 ;91.) "4.7,17 -5.072- ',U . P -4. "• , •
-' "i, . .2, r."

118
14.fl] Comi,uuricdr Comr.p1exometric Titrat onn 0 p'1 7.5
Hithl I Ic Acjd
HIIIl .; . 0005M ( L ' .- 5P-4Mlo'j [CuT)Iog (cur] log (CuTJlOg icur)-------------- --- ------------. . . -----
-6.700 -7.231 -4. 66S -5.147
-6.399 -6.900 -4.638 -5.124-(.223 -6.003 -4.6.10 -5.104
-6.098 -6.673-6.001 -6.565-5.922 -6.477-5.855 -6.402-5.'797 -6.337-5.746 -6.275-5.700 -6.220-5.659 -6.17]-5.621 -6,132-5.587 -6.093-5.555 -6,060-5.525 -6.027-5,497 -5.998-5.470 -5.969-5.446 -5.943-5.422 -5.916-5.400 -5.894-5.379 -5.872-5.359 -5.851-5.340 -5.832-5.321 -5.812-5.304 -5.796-5.287 -5.776-5,270 -5.760-5,255 -5.744-5.240 -5.727-5.225 -5.711-5.211 -5.698-5.197 -5.685-5.184 -5.672-5.1)7 -5.659-5,)5R -5.646-5.146 -5.636-!1.134 -5.623
-5.123 -5.613-5.122 -5.600-5.101 -5.590-5.090 -5.582-5.080 -5.571-5.070 -5.561
-5.060 -5.551-5.(150 -5.541-5.005 -5.499-4.972 -5.460-4.941 -5.424-4.912 -5.395-4.1360 -5.339-,I.14 -5.290-1.77? -5.24P

119
Gj y<r t fir.o rtp(nIf! c~ii; .Or', ltj )j l,]-~jr-sr. flii E; .r,-g Iu--lJ- -- --i''------
0o1 [Cu']log CuIJ 2r" [CuTI]og (CurJ-Ct 097 -7.466 -6.398 -7.919 -4 -5.502-5.92] -7.293 -6.222 -7.759 .727 -5,502-' 796 -7. ].2 -6.091 -7.6,7 -4.693 -5.437-',.700 -/,032 -6.00n -7.52 -4.612 5.3C2
S-6.97 - -4.632 -5.336
-!,,6 2 ] -G .9 7 4- 5 9 2 1 -7 .4 10 -4 6 4 - . 0.554 G. O -5.854 -7.348 -4.579 -5.254-5.496 -6.742 -5.796 -7.273 .579 -52-5.445 -6.657 -5.745 7.20 -4.554 -5.219-5.399 -6.578 -5.700 -7.279 -4510 -5.160-5. 358 -6.503 -5.678 -7.117 -4.510 -5.160-5.321 -6.435 -5.629 -7.061 -4.489 -5.134
- •-4.40 -5.104-5.286 -6.366 -5.603 -7.A15 -4.45 -5.085-!.254 -6.305 -5.570 -6.970 °-5.224 -6.243 -5.539 -6.924-51.96 -6.214 -5.520 -6.885-570 -6.128 .483 -6.843-5.246 -6.076 -5.457 -6.80v-5.122 -6.074 -5.433 -6.76R-5.I00 -5.915 -5.410 -6.732-5.019 -5.929 -5.389 -6.699-5.059 -5.9ol -5.368 -6.667-5.013 -5.835 -5.349 -6.637-4.979 -5.753 -5.330 -6.621-4.948 -5.682 -5.312 -6.5R2-4.919 -5.616 -5.294 -6.552-4.891 -5,558 -5.278 -6.523-4.866 -5.505 -5.262 -6.500-4.842 -5.460 -5.246 -6.474-4.R19 -5.417 -5.231 -6.440
-5.217 -6.422-5.203 -6.396-5.190 -6.373-5.177 -6.350-5.164 -6.324-5.152 -6.30n-5.140 -6.262-5.128 -1.21,.-5.117 -6.239-5.105 -6.220-5.095 -6.200-5.084 -6.177-5.074 -6.2!.-5.064 -6.141-5.054 -6.319-5.045 -6.202-5.035 -6.086--. 0 2 6 - C. o r
-4.992 -6.070-4.959 -5.99p-4.930 -5.920-4.902 -5.pl4-4 .R, -'. ".

120
!. 'yl jc, Iic k'DI CI fto -h4l1
]o(I [(111 1' lr~' If'I l'' l (C0 0l) 1'l [C01 1J 1C'1 (Cu'I)2oq IC''F)----. ---- --------- .--..............--. ---- . - ..--- -- --
-(,. 11uii -1.7,(l, -11.3!11 -!.353 -6.700 -0.,12-6, 09] -7. 35f ,
-4.324 -5,320 -6.399 -8.341
-#,.'021 -7.154 -4.799 -5.2S4 -6.302 -7.949.r, -7.014 -4 .7/4 -5.252 -6. 156 -7.703
o',(,'I't -6."')( -4.2",1 -1.219 -6.047 -7 .4,66•6 ,,.,' -6. 1 1, -4,219 - .]93 -3. 960 -7.310*5,',, -6.740 -4,710) -5., 64 -5.00J11 -7.171r,4 r , - 6 ".1672 -4,190 -5.141 -5.826 -7.032
-5.4 , -6.616 -4.37? -5.18 -5.771 -6.939.399 -6. 564 -4.1 54 -5.092 -5.723 -6.021
-s.ls, -6.522 -4,130 -5,073 -5.680 -6.737-5 320 -6 470 -4,121 -5.050 -5.640 -6.640-5.286 -6.437 -4,106 -5.030 -5.604 -6.567-; .754 -6.405 -4.091 -5.014 -5.571 -6.491-5.224 -6.369 -4.077 -5.001 -5.540 -6.428-5.196 -6.340 -5.521 -6.376-s.,70 -6.307 -5.484 -6.341-5.14 -6.201 -5.458 -6.209-'.. ] -6.2 2R -5.434 -6.255-'r.009 -6.232 -5.412 -6.213-5.069 -6.2Vi -5.390 -6.292-5.049 -6.200 -5.369 -6.271-,,,031 -6,37/ -5.350 -6.137-',.0 3 -6.157 -5.331 -6.078-4.995 -6.142 -5,313 -6.039-4.979 -6.125 -5.296 -6.005-4.9063 -6.102 -5.279 -5.987-.1.949 -6.086 -5.263 -5.95i-1.933 -6.07 -5.248 -5.946-4.919 -6.05r6 -5.233 -5.907-4.905 -6.04 9 -5.218 -5.894-4. R1 -6.024 -5.204 -5.897-4.07F -6.02 -5.191 -5.838-4.1166 -5.998 -5.178 -5.841-4..54 -5.985 -5.165 -5.028-4.842 -5.968 -5.153 -5.00O-4,830 -5.959 -5,241 -5,782-4.811 -5.949 -5129 -5.758
. .[n -, ,r, -5.11 -5.7/41
-4. )/ -5.926 -5.107 -5.734-4.18/ -!0.913 -5.096 -5.723
-1.771 -5.903 -5.085 -5.706-4.767 -5.890 -5.075 -5.703-4.757 -5.871 -5.065 -5.689-1.739 -5.845 -5.055 -5.671-4.72) -5.822 -5.046 -5.668-4.687 -5.783 -5.041 -5.675-4.656 -5,',0 -5.032 -5 668-4.f,27 -51,.7!, -5.023 -5 650-1,60) -5.,672 -5.014 -5.598-4.574 -5. -4.997 -5.505-,1.55 - ' -4.980 -!,,435- 4.12/ -" 7 f',r-4,964 -. ,397
- .I!€ -J 5;-P -4.9"14 -, 317- I . .1 , -. -4 .109 6 -!, A0

121
Appendix B Titration Data of Model Mixture

122
POTENTIOMETRIC TITRATION OF OCGW XAD-8 MODEL MIXTUIRE
Titrator Model ActualMODEL MQ OCGW-SAS Model Titration
[NaOH] pH pH [NaOH] pH
2.67E-05 2.96727 3.01618 7.97E-06 35.35E-05 2.97818 3.02822 1.59E-05 3.0048.02E-05 2.98937 3.0406 2.15E-04 3.10.000107 3.00086 3.05334 3.81E-04 3.2020.000134 3.01266 3.06645 5.07E-04 3.30.000161 3.02479 3.07998 5.62E-04 3.3510.000187 3.03726 3.09393 6.09E-04 3.40.000214 3.05011 3.10833 6.56E-04 3.4570.000241 3.06335 3.12323 6.95E-04 3.5060.000268 3.077 3.13865 7.27E-04 3.5550.000294 3.0911 3.15463 7.58E-04 3.610.000321 3.10567 3.17121 7.81E-04 3.6570.000348 3.12075 3.18845 8.05E-04 3.7090.000375 3.13637 3.20638 8.20E-04 3.7470.000401 3.15257 3.22508 8.75E-04 3.9190.000428 3.1694 3.24461 8.83E-04 3.950.000455 3.1869 3.26505 8.98E-04 4.0210.000482 3.20515 3.28648 9.61E-04 4.4990.000508 3.22419 3.30901 9.92E-04 4.9750.000535 3.24411 3.33275 1.01E-03 5.5290.000562 3.26498 3.35785 1.02E-03 5.8430.000589 3.28691 3.38446 1.03E-03 6.5310.000615 3.31001 3.41279 1.04E-03 8.3340.000642 3.3344 3.44306 1.05E-03 8.7679990.000669 3.36024 3.47555 1.05E-03 8.9989990.000696 3.38772 3.51063 1.07E-03 9.2810.000722 3.41706 3.54872 1.09E-03 9.5340010.000749 3.44852 3.59039 1.1OE-03 9.5960.000776 3.48244 3.63642 1.11E-03 9.6499990.000803 3.51923 3.68772 1.12E-03 9.6990010.000829 3.55944 3.74565 1.12E-03 9.7440010.000856 3.60374 3.81214 1.13E-03 9.7830.000883 3.65307 3.89 1.14E-03 9.8190.00091 3.70882 3.98365 1.15E-03 9.852999
0.000936 3.77272 4.10036 1.16E-03 9.9150.000963 3.84767 4.25285 1.18E-03 9.9670.00099 3.93831 4.46408 1.19E-03 9.9910.001017 4.053 4.77284 1.19E-03 10.0140.001043 4.20926 5.257620.00107 4.4558 8.21701
0.001097 5.0829 9.282010.301124 9.26697 9.617770.00115 9.65553 9.21881
0.301177 9.85728 9.96C20.001204 9.9945 10.0685

123
~(" J flirlq'l ;gI . l l'Jr'] 'Itr.t J ol P pll r,.2
l1c,10' I AcLttil Morl-.I Actu1] ?otlnl.f ()CGW ( 1,1 6.2 Tltrat Ion Titration
]oq, CuT]1nq (CWI*] ]orj [cim:log [ccFj Iog (CuT'jlog (cur]
-7 -7.44448 -7.000 -7.883 -5.064 -5.560-6.03152 -6.47197 -6.523 -7.4.3 -5.054 -5.553-n.75449 -6.19098 -6.301 -7.296 -5.045 -5.546-5.5867 -6.01932 -6. 155 -6.998 -5.036 -5.546
-5.46597 -5.S9479 -6.046 -6.859 -5.031 -5.543-5.37161 -5.7967 -5.959 -6.748 -4.992 -5.498
-5.29414 -5.71550 -5.887 -6.647 -4.959 -5.453-5.22841 -5.64627 -5.825 -6.574 -4.930 -5.428-5.17134 -5.58568 -5.770 -6.519 -4.902 -5.376
-r.1209 -;. 531A -5.722 -6.435 -4.051 -5.331-1.07572 -5.48323 -5.679 -6.3(9 -4.805 -5.269-5.0348 -5.43899 -5.639 -6.317 -4.764 -5.209
-4.9974 -5.39833 -5.603 -6.269 -4.727 -5.164-4.96297 -5.3601] -5.570 -6.227 -4.693 -5.119
-4.93107 -5.32567 -5.539 -6.185 -4.632 -5.043
-4.9013, -5.29287 -5.5]0 -6.137 -4.579 -4.963-4.87354 -5.26203 -5.493 -6.109 -4.532 -4.904-4.R1741 -5.23292 -5.457 -6.071 -4.489 -4.848
-4.82275 -5.20535 -5.433 -6.046 -4.451 -4.793-4.79942 -5.17915 -5.411 -6.039
-4.77728 -5.15419 -5.389 -6.001-4,75622 -5.13035 -1,.368 -5.980-4.73613 -5.10754 -5.349 -5.932-4,71693 -5.08566 -5.330 -5.911-4.69854 -5.06464 -5.312 -5.876-4,68089 -5.04441 -5.295 -5.887
-4.66394 -5.02491 -5.278 -5.852-4.r.1762 -5.00609 -5.262 -5.871
" , ! : - : .' 1 1 " - , 4 1 -5 .7 14 6
-4.61672 -4.9703 -5.132 -5.769-4.40206 -4.05,324 -5.217 -5.762
-5.203 -5.755
-5.390 -5.748-5.177 -5.734-5.164 -5.706-5.252 -5.689-5.140 -5.66f8-5.128 -5.654-!,.117 -5.64
r)
-5.106 -5.626-. 095 -5.616-. is -S . 60!
-r, f) ,1
-€ rpAn

124
Appendix C Titration Data of Natural Sources

125
Put -iil. I ()I It I ic I Jit u tt Jon of OC.GW XAI3-A
Wl . 0(1('M~ Ta1 I~ylor)DO r, m(,rq/1.
II~mAI I p ~(1; lid Ill I l
I* "I- W, 3.002? 2. 31 C-0f. 3.003
1: * I -011 3.043 1 .04F-04 3. fl3,
I ([04 3 . C65 1.501-,-04 3.04WM')-04 3.092 2.07E~-04 3.082
2,'-31:-04 3.114 2.53F-04 3.)04'.,'p9[l-04 3.139 3.31F-04 3. 132'I..,(.1-04 3.171 3.33E-04 3.1454.02E-04 3.299 3.68E-04 3.1034.'Wr-04 3.235 4.36EF-04 3.203
~.('l204 3.267 4.71E-04 3.224'([-4 3.301 5. 3()E-04 3.269
6.0"Fl:-04 3.349 5.73E-04 3.2936. , M- 04 3.3189 6.30F:-04 3.336.I Or-04 3.447 6.87r-04 3.385/.If', -- 04 3.5 ~ 7.32F-04 3.4288 .(O-04 3.56 7.89E-04 3 .489A . OF-04 'I1A 8 . 4E-Cf1 3.5429.112F-0.1 3.73A 8.79r-04 3.60C
9.l-4 3.091 9 .3t(--04 3.69e1.00r-03 4.041 9.81F.-04 3.79
1.0)51,-03 4.298 1.03r-03 3.8951.07C:-0) 4.523 1.OBE-03 4,0771 . 'I-o J 4.698 1. 11r-03 4,319
. if)[- 03 4.986 1 . I4E-03 4.405
.I ('E-03 5.848 1 .17E-03 4.817I IFE-O) P.7"1001 3.]BE-03 5.078
1.111:-03 9.245 1.19E-03 5.5581.1.1';-03 11.472999 1.21F-03 6.568J.1',I2-03 9.627 1.22E-03 7.712).,7V-03 9.038 1.23t:-03 9.5591. 19C.-03 9.983 1,24E-03 8.8970011.:!2U-03 10.093 1.25E-03 9.1000011.: '9;-01 10.09 1.26E-03 9.252I .:,.ir;-03 P).1? 1 .fI27L-03 9.3711 .;' 41- r' IfI f. I ;P 1. ?2I'-01 9.477
.2I -CI 0. 125 1 .2'4[-03 9.564.22:'3r.-03 10.124 1.3JE-03 9.6391.;19>03 10.12 1.32E-03 9.70e1.?s9:-03 10.22 1.34E.-03 9,8290011.11,11-03 10.11 1.36r-03 9.9292. ;,If;-03 10.118 1.37E-03 9.976
1.7i-0i 30.116 1.19F-03 10.055

126
('('W ):AII-1 ComplI crome't r Ic l it rnt I Jowl; P 11 A.2.- . . I ft r W ort lury, 1 9"-) -............ (Can tro)
Correctrd forOCI'M; X101d-1 P I, i,;,t Hil | I -0 III-nW:k
I(,,I [(il Ir,: [ uI] Cu I I CII'lJ ' 1 cu] Jog [cu'rjlog (Cull
-6 r)0W I - . 157/1 -C . (,f)(06G -9.14829 -5.46597 -6.80693-G,.3017', -"015 V-6". 60114 -A .A0A0 -5.37161 -6.74058
- G. 12',2A -It. 7311-'. -6. 12'16 -S. 57 115 -5.29414 -6.60931-6.00(141 -U.52671 -6,00(33 -8.38678) -5.22841 -6.43878
-!.90-161 -t. 35 154 -5.90 152 -A1.21574 -5.17134 -6. 25661
-5.82456 -0.2008 -5.82445 -8. 12167 -5.1209 -6.09253
-5.75172 -8.07044 -5.75761 -n.0076 -5.07572 -5.95679
-5.69984 -7.95637 -5.69973 -7.89354 -5.0348 -5.84512-5.641179 -7.84639 -5.60293 -7.70342 -4.9974 -5.75107
-5.60314 -7.74046 -5. V2396 -7.51331 -4.96297 -5.66965-5.5116 -7.64269 -5.45723 -7.32319 -4.93107 -5.59753
-5.524111 -7.54899 -5.39946 -7.20913 -4.90136 -5.5325
-5. 48953 -7.45931 -5. 34A52 -7.05703 -4.87354 -5.47303
-5.45745 -7.37789 -5.1029R -6.44297 -4.84741 -5.41809
-5.42759 -7.292J4 -5.2611 -6.e289 -4.82275 -5.36692
-5.39967 -7.21096 -5.22423 -6.71483 -4.79942 -5.31901
-5.37,45 -7.12938 -5.18968 -6. 600c76 -4.77728 -5.27391
-5.341.74 -7.05398 -5.12775 -6.41065 -4.75622 -5.23136
3-,. 3253G -6.97865 -5.073D3 -6.25P,56 -4.73613 -5. 9109-,.3032 -6.9094 -5.02595 -,.14449 -4.71693 -5.15292
-5.20;12 -6.R4014 -4,9727 -5.9724 -4.69854 -5.11666
-5.26202 -6.77089 -4.92546 -5.87833 -4.68089 -5.00221
--5.24282 -6.7057 -4.89297 -5.80228 -4.66394 ;5.04941
-r,.22445 -6.6446 -4.04435 -5.611821 -4.64762 -5,01817-. ,20683 -6.58349 -4.10897 -5.61217 -4.6319 -4.98839
-1,.11199 -6.52646 -4.77G34 -5.57414 4.61672 -4.95996
-5. ]7:96 2 -6.47349 -4.60206 -4.932P2
-,. 15.'93 -6.42054-,.142n -6.37165-5.1218 -6.311 69-5.11405 -6.273R8-5.10037 -6.22907-5.08711 -6.)8833-5,07426 -6.14759-5.06177 -6. 11092-5, 04'6
r, -6.07426
0 3 ;'(11 -C"-. 3175'- 0, .:3"; -5.97241
-4.915 -5.90723-4..96132/ -5.R4612-4.94n96 -5.79317-4.93(149 -5.73613-4.9128 -5.69539
-4.89581 -5.64651-4. 1P1'4 -5.60577-4 .C 6.17'- -5. 5650J
-,I 4fjrn
__5, 57836-4 .03 .1; 6 - 5. 4S 763
- 1 1.81"'1 -5,4592 ]-4 .. A'') 1 -',.'4(76,72

127
'o0'(;3 XA-fl I'II 7.5 CO,1II.'fl hTI;'JI1IC T37RIATIO11U)nq IC 11] lot) cis" loq jCitT) 2oe (CuF1
-5.2 505 -6.0706S -4.01019 -5.28911-5.180I'1 -6.68702 -3.99901 -5.28S7-!,. 10901 -6.54757 -3.98812 -5.2755
-5.04217 -6.43192 -3.97751 -5.2687-4.98424 -6.34349 -3.96715 -5.2653-4.93314 -6.26526 -3.95704 -5.2687-4.80744 -6.19384 -3.94716 -5.2755-4.0461 -6.13261 -3.93751 -5.2653
-4.80836 -6.0816 -3.92807 -5.25169-4.77365 -6.03738 -3.91884 -5.24829-4.74152 -5.99316 -3.9098 -5,23809-4.71161 -5.96255 -3.90U95 -5,23128-4.68364 -5.92854 -3.89229 -5.22448-4.65737 -5.89453 -3.88379 -5.21768
-4.6326 -5.97752 -3.97547 -5.21426-4.60917 -5.85711 -3.8673 -5.20407
-4.58695 -5.8333 -3.85929 -5.19727
-4.56581 -5.8095 -3.85143 -5.19387
-4.54566 -5.79249-4.52641 -5.77548-4.50798 -5.75848-4.49031 -5.74147-4.47333 -5.72787-4.45699 -5.71426-4.44125 -5.69725
-4.42607 -5.68365-4.4114 -5.68025
-4.39721 -5,66664-4.38340 -5.65304-4.37017 -5.64283-4.35726 -5,62923-4.34472 -5,61562-4.33254 -5.60542-4.32069 -5,59182-4.30917 -5.58161-4.29794 -5.56801
-4.287 -5.5578-4.27633 -5.5578-4.26592 -5.5476-4.25575 -5.5374-4.24502 -5.52379-4.71612 -5.51C99-4,22662 -5.50679-4.20825 -5.47277-4.19063 -5.44556-4.1737 -5.42516
-4.15742 -5.40815-4.14173 -5.40475-4.1266 -5.38774
-4,11199 -5.37414-4.09705 -5.36393-4.08427 -5.35033-4.07092 -5.33672-4.05906 -5.32652-4.04558 -5.32632-4.03345 -5.30951-4.02166 -5.29931

128
P ' ,'! , .lot i n " ,t I i t. 'F it r a t i n o f W A X A ) - R
(I ',' U. 0 .,,,, 3, .. T'ay lor)
*il I O I fiid" I IA 1 Ai-fi .'fiI ;(l j tIln~llJ pll
I 1.1S-n-5 3.002 1.15F-05 2.996.1IIL-05 3.007 2.31E-05 3.001t. -14,I-017 J.0)I 1.46F-05 3.005
-1 .,21. 0', 3.017 4 .62F-05 1.00?,7 -05 3.072 r-.77r-05 3.013(.',j-(5 3.021 6.92E-05 3.018
(?.(~F'l-(5 3.032 8.OE-05 3.022'.255.-os, 3.011 9.23E-95 3.026o 000o104 3. 043 0.000204 3.0320.000115 3.048 0.000115 3.036(0.000127 3.054 0.000127 3.041
"(1001 38 3.059 0.000238 3.046". 00l5 3.065 0.00015 3.05
0.000161 3.07 0.000161 3.0540.000173 3.074 0.000273 3.0590. 000104 3.09 0.000284 3.0650.000196 3.087 0.000196 3.07ro.000207 3.092 0.000207 3.075(). 1079 3.097 0.000219 3.081(0.00023 3.103 0.00023 3.006
(.)000742 3. 10O 0.000242 3.0920.000253 3. 14 0.000253 3.0980.000265 3.121 0.000265 3.1040.000276 3.127 0.000276 3.1090.000280 3.233 0.000288 3.1150.000299 3.139 0.000299 3.121().0011 3.246 0.000311 3.128(P.000322 3.]51 0.000322 3.1320.)1203)3 3.151) 0.000333 3.139(1.000145 3.164 0.000345 3.2450. 00 156 3.171 0.000356 3.15V.000368 3.)78 0.000368 3.1560.000379 3.184 0.000379 3.1610.000391 3.191 0.000391 3.1690.00()102 3.199 0.000402 3.173f). n04 14 3.206 0.000414 3.18"-.'").", 1.214 0.000425 3.207''.'O10436 5.22 0. 000436 3. 11 5
.'j0014.4S 3.221 0.000448 3.2030.000459 3.235 0.000459 3.211
(.00471 3.243 0.000471 3.219(.00-4l2 3.252 0.000482 3.226
0.090493 3.259 0.000493 3.2340.000505 3.267 0.000505 3.2430.000516 3.275 0.000516 3.2t2(.000528 3.284 0.000528 3.;6n ,0-)Or, 39 3.292 0.000539 3.269
0,.00055 3.301 6.00055 3.278(.1 00562 1.31 0.000562 3.2117
0.0')0573 3.32 0.000573 3.2"7o u. O'(0, 5 3.329 O. n '05R5 3. 31)7
0. 3t','(, .31P n. t~forl.' r, 1.317V'. ',O" 1 ] . 1.1'.*n. .,) 1 .. I;' 7

129
Potentiometric Titration of BA XAD-8
(by W. Odem & J. Taylor)DOC-12.66 mg/L
Milli-Q Blank BA XAD-8[NaOH] pH [NaOH] pH
0.000619 3.358 0.000619 3.3370.00063 3.369 0.00063 3.3480.000641 3.378 0.000641 3.3590.000653 3.389 0.000653 3.370.000664 3.4 0.000664 3.3820.000675 3.412 0.C00675 3.3920.000687 3.424 0.000687 3.4050.000698 3.435 0.000698 3.4170.00071 3.447 0.00071 3.43
0.000721 3.46 0.000721 3.4430.000732 3.473 0.000732 3.4570.000744 3.487 0.000744 3.4710.000755 3.5 0.000755 3.4850.000766 3.515 0.000766 3.50.000777 3.529 0.000777 3.5160.000789 3.544 0.000789 3.530.0008 3.56 0.0008 3.547
0.000811 3.577 0.000811 .5640.000823 3.594 0.000823 3.5820.000834 3.611 0.000834 3.60.000845 3.631 0.000845 3.6190.000857 3.65 0.000857 3.6380.000868 3.67 0.000868 3.6580.000879 3.692 0.000879 3.680.00089 3.715 0.00089 3.702
0.000902 3.738 0.000902 3.7250.000913 3.763 0.000913 3.750.000924 3.79 0.000924 3.7750.000936 3.817 0.000936 3.8020.000947 3.849 0.000947 3.8310.000958 3.881 0.000958 3.860.000969 3.916 0.000969 3.8920.000981 3.954 0.000981 3.9250.000992 3.996 0.000992 3.960.001003 4.041 0.001003 3.9980.001014 4.093 0.001014 4.0370.001026 4.152 0.001026 4.0790.001037 4.22 0.001037 4.1250.001048 4.298 0.001048 4.1740.001059 4.398 0.001059 4.2260.001071 4.523 0.001071 4.283
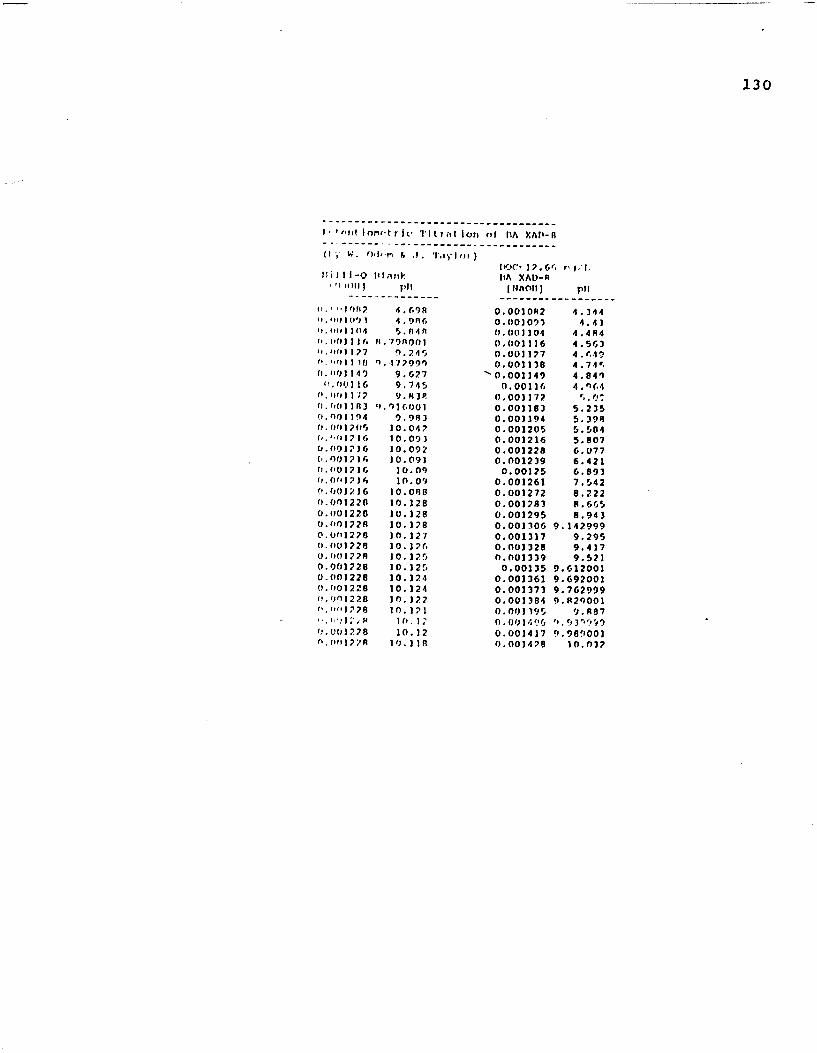
130
I*",it Iom,-tri . 1lt at;,! for) ci IA XAV-8
I I W . 1~, -in 16 .1. . l I() I )
I V 1 C , . 6 , r ,Sb iJ 1- l It). I1A XAD-n
,1 i ll)I 1,11 1 NAMtll) Fill
. 1 12 4.698 0.001092 4.3441.1) 1(1)'1 4.9n6 .0. 0 093 4.41
,. i I104 5. n4n 0.001204 4.4R4N,.(N 116 A .79001 0.001116 4.563I,.ii 12 7 9.245 0.001127 4. f-49
l1 I .,1"299n 0.001138 4.74r ,
f,. rt) 149 9.627 "0.001249 4.84011 •r. J 16 9.745 0.00131( 4 n(.4
(). I I ; 2 9.838 0.001172 ",.fjr.6,0113 ')1.6001 0.001183 5.235r0.00)I194 9.983 0.001194 5.3980. fi)1205 10.042 0.001205 5.584b,.'-0 12 16 10.093 0.001216 5.8070.091216 10.092 0.001228 6.077(,001 2 16 10.09) 0.001239 6.4210.001216 20.09 0.00125 6.893(.00,1216 10.09 0.001261 7.542(.001216 10.08 0.001272 8.222o.on228 20.228 0.001783 8.6650.001228 20.128 0.001295 8.9430.001228 10.128 0.001306 9.1429990.001228 10.127 0.001317 9.295(.001228 10.226 0.00)328 9.417u.oO122A 10.2275 n.001339 9.5210.001228 10.125 0.00135 9.6120010.001228 10.124 0.001361 9.6920010.0)01228 10.124 0.001373 9.762999o.On1228 20.122 0.001384 9.R29001
1r. ( i 28 10.121 01001195 9.187I I R1 I (I.1 I ) .0 014 Qr. 13 ) .0 ,9 )
0.001228 10.12 0.001417 9.9810001rf. (10 12) R 11). 1 in 0.001428 10.)037

131
'BISCAYNE AQUIFFr XAD-8 I'll 6.2 COJIPLEXOMETRIC TITRATION'169 (CUT) log (CuF]
-5.784 -6.989-5.711 -6.887-5.649 -6.798-5.595 -6.714-5.504 -6.496-5.464 -6.442-5.428 -6.360-5.395 -6.221-5.364 -6.170-5.335 -6.109-5.308 -6.011-5.283 -5.997-5.259 -5.943
-5.236 -5.882-5.214 -5.807-5.194 -5.770-5.174 -5.749
-5.155 -5.719-5.137 -5.675-5.120 -5.627
-5.104 -5.596-5.088 -5.563
-5.072 -5.532-5.057 -5..505-5.043 -5.484-5.022 -5.474-5.009 -5.464-4.984 -5.413-4.960 -5.383-4.937 -5.332-4.916 -5.291-4.876 -5.243-4.140 -5.209-4.775 -5.050-4.719 -4.958-4.670 -4.807

132
'1] :CAYNE AQUIFER XAD-8 I'll 7.5 CO71'LEXOMETr:IC TITRATIOI'
log [CUT] log [CuF]
-5.428 -6.942
-5.395 -6.866-5.364 -6.773
-5.335 -6.732-5.308 -6.649-5.283 -6.590-5.259 -6.507-5.236 -6.473-5.215 -6.417-5.194 -6.359-5.174 -6.321-5.156 -6.269-5.138 -6.255-5.120 -6.207-5.104 -6.196-5.088 -6.138
-5.073 -6.110-5.058 -6.096-5.043 -6.069-5.023 -6.062-5.009 -6.055
-4.984 -5.996-4.960 -5.937-4.938 -5.896-4.916 -5.858-4.876 -5.761-4.840 -5.733-4.806 -5.702-4.746 -5.626-4.694 -5.547-4.647 -5.533-4.605 -5.512-4.567 -5.499-4.532 -5.464-4.500 -5.450-4.470 -5.436-4.443 -5.385
-4.417 -5.333-4.392 -5.305-4.369 -5.281-4.327 -5.219-4.289 -5.198-4.254 -5.146-4.222 -5.098-4.193 -5.063

n 3
Appendix D Computer Programs

134
' I, - 01I N PUTr "O~l' U't FI-Il I, AMUl (0000,cdn ) * . ":i fl7,
I ) II hll1Ti "N~~ITUP PINT 1iIT'LIuVAI III MI 1IP'ITES->":PI41 1111111'!' "ALIVIOT SI ZE FOR ACID" :MI4. 1, I II N'IT "'JiI(I11r101'O ACID III (M) * >" 3d
44 1 UNITui 11S'rI'i.3151j or IlASE It$M :" '
I ", I hI I' I "Pit 1OtF(IWICE ->" iTl.if, AVD - II * .00025 * CI /1000147 OlAn - 142 * .00025 * C2 /1000!
,0 b$ Cullk$(4)
(0 Il I IT D$: OFPE.1 111 pt I: " OR otjiiu'r AS I II$ PR 101111 0,1'EX'EI(IMI'I I,FIIXF and DATE *":ID$,ILF$,DATIZ$2 i'R1 Iir #1 , uioijx oF ACID P'ER ADDITION -"IACO3 PR 11I'' 01,111101,E 0f' BASE PER AnnlITIOll -1101.9
r,1 NI IIT 1I, "pit TOLEtAUCE -11ITL -
G UA I'flIT I1,"SrT POIT pi *":sf'l
I 'RIIi' 12,"TIMF.(01EC) #ACID NBASE OpIl",
i'n9 wrl~ll MOCJOSE 0170 OPENa FILE$ FOR OUTP'UT AS 1271 PIN~T I2, NEXPERIF1t4r IV and FILE --> ":IDS,rIL.$'7 IR1IT 02, -DATE OF F.XPERIMCIJT --> ";DATE$73 IIIIT #2, "MOLES OF ACID PERt ADDITIOU * ":ACD74 Fit I1HT 12, tiouEs oF DASE PER ADDITION *~"M~AS
75zw PJI ? 0, "pit SET POIT w~"IBI'l74 PHI IIT 02, "till TOLERANlCr ~ "iTt,71 N? ItI UT#2, 11t Ime", H0ac I d' 0 bn so" 11pll o79 CIAOSE 02140 00501 2000I,,() Conlin 30001 r0r 10 - MIll 4 srC / r.0 + 110 * cn1,10 C'0Stif 6000100n C LS190 Collin 5000192 K I'EEK(1fl11) AII) 120191 IF K -12A TIIEFJ COSUP 11000I"( or r ri 0 cofl) 14o
I'l' f~rllf 2U0
210 Jr- (Pi1 - SJII1) > - TI1. TIIEII 00200 4000225f IF (01,11 - 1'11) > - I'l TlIIh 000011 10000P20 rOSUO 3000215 T114F w MIll 4 SI:C/GO 411R*(6o240 IF (TIME - TO) < PI COT7110240( 00501 600017n TO - TIME
2" '010 192
2"" OCATE 24,1
P'yI, cIS

135
it,) T^4= TIMES''3'. IMI VAICMID$(TS, I ))
mr3(3 1,1111 VAI,(MI14('$,4 .2))( iO S EC 'VA1, 1111$ ('1$, 7, 2))107. IF F1 ', > 0 G010 307A
.3 n 4 IIIR IIR: IMII- MIll307Th ]SEC SEC10316 F1 I2o 711 IF SIX > -ISEC COTO 30132
14111 Mii mill I: sEC - 60 4 SEC -ISE.C
.33)0I G0TO 308430832 SEC -SEC -ISEC
30n4. IF MINl > IMIIJ COTO 3088301 ol( IRn - ItO - I:MIll - 60 4MIll - 711113)87 COrO 30903083) MINl -4MIN - 1111331090 GOSUII 9300309T. OS - IIGlIT$(T4.,8)*07$ -LF.ETs(TS,13)
A3 100 RETURN)1)000 OUT I DRfl,136.)% FOR I -I TO III
41003 OUT I'll, I1
10ll 1 ) EXT I.10.35 AC=AC 4 11051) RETURN5000( CLS11005 PRINT U7$1 0]0 LOCATE o0,1';ri1u pIRjr~ 11 pit ELAPSED TVlIE TIME #ADD"'i030 Pi I wr)1c,03 5 TS - T I ME * 60!50340) Pitr I'll; 'AB(13) ;IR:"':":Mltu;":";SPFC:TAo(26) 0$.A050 LOCATE 12,36: PRINT3 AC;"/":AO505~5 LOCATE 20, 1
55 PRI14T "TO INTERRUPT THlE PROGRAM: PRESS 'Ins' key (num lock light must Leoff!) VELEASE KEY OtlLY AFTER MENUO APPEARS"
5 060 f RETURN.(000) PRINT MSOPEll 'Iptl:" AS 91
(.)3 IF F1 < > 0 COTO 6020r134 PINwr #],*: PRINT31 #I,: rR!?)? #I,: PRINT? 91, D$:PrIIJfT 91,: rPiNT #I,NZ'3N' t0 li 1," 1 I'l t'VZI 11 11111 PAM~l "
f-.00? F1 - 1: F'RIIT 91,(.fl 10 P3)1)'r 01,TS; TAB(15):AC: TA130)1):At1; TAI3(35): Pit6,02110 PrtirT 91, D$: CLOSE 9]60325 OPEN FILE$ FOR APPEND AS 92(.!02, Pi111112, TS,AC,AI3,Pil1(111 1 CLOSE#2(Ili3 0 RETUI;,rioo PRINT OS :OPEI1 "IXrI :1 AS 01i (I10 Il3IIlT 111, :PRINT 01,; ():, n mmr '0111,D7$.030 P111331' 91,: ['Riftr #, 91,: n JO fi #,D: CLOSE #1-,,)3If) P ETUI, W0') J:--OCL,S:CoI.OR 0,7
.31j PRINT111 "t'ARAIIrrER CIIAtlGF I4rElU" :311lli:3'RIIJT
3013) "2) i t1i,'lrl'ry sp:cE

136
P 020 PR Ir1' "2) SET POINT pil'030 '11 IIT "3) SET 1'14 1'1'T INTITRVAL"S0.10 P Ill r "4) RE2r.T EI\I'S1 ED THIL"o0,0 I VINlrr "5) IMSri AIIQUOT SIM7,"110,0 PHI 111 "6) HETURIIJ TO PROGIIAl"9070 VPlr 1117 1) EXIT"l
0015 V' I I IT "8) SET TOLERANCE"8080 IRIT: INPUIT "ErTER TIlE fJUMIrR OF YOUR CICOICE ->";98081 OPEl FILES FOP AI'PEND AS 128082 PRINT 92, "CIIAtIrG '":IK9
8083 CLOSE 92808.1 CLS:COLOR 7,08085 IF K(9 - 6 TIIEN RETURN8090 Of 1(9 OSUB 83O0,8l3O,8150,8170,IAO,8I20.8200,82208100 GcOTO 80008120 RETURN8130 INPUT "EN$TER pit SET POIIT ->";.':8] 40 RETURN"8150 INPUT "ENTER PRIIIT INTERVAL IN MINUTES ->";I'i8160 RETURN8170 INPUT "ENTER NUMBER OF ELAPSED DAYS ->",DAY8172 ]]INPUT "ENTER IITIAL HOUR ->"';IIIR8173 IfPUT "ENTER INITIAL MINUTES ->";MIlN8174 INPUT "ENTER INITIAL SECONDS ->":ISrC8175 PETURN8380 INPUT "ENTErI ALIQUOT SIZE FOR ACID";M8290 REI UIN8200 COLOR 7,0:EID8220 ]INiPUT "ElTER TOI.RAICE IN pit UNITS ->":Tl,8230 RETURN8300 1-200
8400 OUT DDRD,136[430 1i'1 hr "mIrI1'Y (i) FILl(2
041, .10 I NIIIUT Ni8441 IF lN=1 TIIEN GOTO 84458442 IF 11-2 TIENl GOTO 85458443 RETURIi8445 FOR 1-1 TO M0450 OUT PB,18460 3.08470 OUT P0,O8.nO IEXT I94.,lh C "I F l4 i08055 FOR IJ I TO 148550 OUT Ill,3
0560) jI"C1:,'10 (PUT Il, ;
8,0l1O NEXT I8590 COTO 84309100 If IIR > - 1111 GOTO 91609110 IF F3 - I GOTO 91709120 DAY - DAY 4 193.49 13 -1935U Co10 91709160 F3 , 09170 IM1 I fIR 4 DAY*24 - I111'1 jo I U 02II 0!I U'I I 0 1)P[ 10 '22
I Or Il, I rip. I - I TO 012

137
10015 JJ = 010020 OUT 1B,110030 JJ = 010040 OUT PB,010050 NEXT I10060 AD = AD 4 110070 RETURN20080 END10010 FOR I = 1 TO M210015 JJ = 010020 OUT PB,110030 JJ = 030040 OUT PB,010050 NEXT I10060 AB = AD 4 110070 RETURN10080 END

138
SI'I .g o; o cis ::ri o:F3 - :t'Y - o1: - 1I:Z9 - - IA3S4DI)I% - 547:AC - 0
All - 0
1' TI, - nI. I III'' lT"OrUTP IL E NAME '>":Fl .r$
I HHINT "ENTER EXPEI1MEIJr ID ->";I$titiiUT "ENTER IUHOER OF COPPER sowJTrLo ADDITIOIS ")" SPIII IlIIT "ENrER PRINT INITERVAL IN MIIITE'>":PIINPUT "AI.IQUOT siiZ rol COPPER SOLUT1011";MIIm ]IIV'rIT "COIICENTRATI Oi or COPPER Ill (m) ->":Ci
I., ACI) M1 * .00025 * C1 / 1000!t., D$ CII$(4)
W$ CIIR$(23)(" miP1 I m, Ds:OPENl "]pt 1:" FOR OUTPUT AS I 1,;1 PRINT I],"EXPERIMENT ID,FILE and DATE *';ID$,FILE$,DATE$
PRINT 91,"MOLES OF COPER PER ADDITION -":ACD!. PRINT 1I,"1HUMBER OF COPPER SOIUTION ADDITIONS -":SPII
PRINT 91,:PRINT 9i.:T'PRINT 91,:PRINT 91, "PRINUT 9I,"TIMF(SEC) ICOPPER SOLUTION 9MV"uR'nTr # -------------------------------------------- o
9' PRINT D$:CIOSE 91j O'rIN FILrS FOR OUTPUT AS 92"I PRINT 12, "EXPERIMFrNT ID and FILE -- > "; IDs,mTx$,1;, PRINT 92, "DATE or EXPERIMENT -- > ";DATE$11 PRINT 12, "MOLES OF COPPER PER ADDITION -- > ";ACD
PRINT 92, "NUMDER OF COPPER SOLUTION ADDITIONS -=> ";SPII; PRINT 12, "tiime", "l COPPER SOLTIO","W"
i.. CLOSE #2]I" GOSUD 2000
. , GOSIUB 30001 T0 = MIN 4 SEC / 60 4 IIR * 6012' GOSIIR 60001U" CLSI' GOSUD 50001",) K - PEE(1048) AND 128I" IF K 2 128 THEN GOSUS o00oI',,. IF Fl - 0 GOTO 140I'); OSUB 2000
'', '1OSUJB 400022o GOSUB 30003', TIME M MIN 4 SFC/60 411R*rO
21'. IF (TIME - TO) < PI GOTO 2807', GoTl coonH
'10 - TIMEGosun 5000
29," GOTO 1922(1"" PRINT D$'OPEN "COI :600,.s,7,2,CS, DSCD" FOR INPUT AS #22 " LOCATE 24,1201 INPUT 12, iVS: CLOSE 122,I
r, CLS
7").' , rRINT L $,".... 1!V VAL(LErT$(*I'"$,7))2f' MV - INT(HV*1000 4 .5)/1000S:. RE'rUP;Y', 5T$ TIME$
,C'1'. IhR - I.AL()ID$(TS, 1.})11," * f1111 - VAI(f.ID$(T$,4, .))
, ' : I,: VAI,(frn ID ' T .o , 2) )

139
3';' r ii < > ( GOlO 3017l3014 1 lilt Ilp: 1 11 - mi iI"'5 ISFC - SEC
3 07 Fl - 1)0;r IF SE.C > - ISEC GOTO 301323f ;' 111J MINl - I:SE.C - 60 4 SEC - ISPC3n0lr GO'TO 308430 2 SEC - SEC - ISEC308.1 IF Mill > ihIN COTO 30883(1 , fIR - lt - l:MIN - 60 4M]W - IMIll
3007 COTO 30903088 MIl i" MIN - IMIN3099 GO:;UB 91003095 O$ - RICIIT$(T$,f1) :57$ LErT$(T$,II)I I 0 RETURN4000 IF TL >- SP11 TIIEH COTO 100204001 OUT DDRB,1364001 FOR I 1 TO MI4010 OUT PB,l,1020 J3 04030 OUT P0,04040 NEXT I40.15 AC-,AC 4 140.16 TL - TL 4 14050 RETURN
5000 CL5005 PRINT D7$5010 LOCATE 10,15020 PRINT " MV ELAPSED TIME TIME #ADD"5030 PRINT
5035 TS - TIME * 60!50.0 PRINT MV: TAD(13);IIR:":":MINl;":";SEC;TAR(26):O$5050 LOCATE 12,36: PRINT AC:"/":AS5055 LOCATE 20,15056 PRINT "TO INTERRUPT TIIE PROGRAM: PRESS 'Ins' key (num lock light must beoff!) RELEASE KEY ONLY AFTER MENU APPEARS"
5060 RETURN6000 PRINT D$:OPEN "lptl:" AS #16003 IF F] < > 0 GOTO 60106004 PRINT #1,: PRINT #1,: PRINT #1,: PRINT #I, D$:PRINT I],: PRINT I,6005 PRINT il," MV ELPSD T TIME #ADD"6007 Fl - 1: PRINT 01,,0ln PRINT #I,TS; TAP(25):AC: TAS(35): MVr.020 IRIIiT 0], V$: CLOSE II
Z OrENl FIlE, FOR APIEND AS 120026 PRINTI2, TS,AC,MV s(027 CLOSE126030 RETURN7000 PRINT D$:OPEN "LPTI:" AS #17010 PRINT #1,:PRIIIT #I,7020 PRINT *1,D7S7030 PRINT I],: PRIN1T 01,: PRINT #I,D$: CLOSE 01;040c RETURN
00C K 0:ClS:COIOR 0,7?110 P RINT "PAPAr.TER CHANGE MENU": PRINT:PRINT11r)5 IRIIIT "1) FILL/EMPTY SYRINGE"9020 PRINT "2) NUII1IER OF COPPER SOI.ITION ADDITIOlIr"V:0I0 PRINT "3) SET PRINT INTERVAL"P.1 P1itIlI' "4) RESET FlAPFED TIME"
rvt, iF irrT "5) JP.rIVI" AL.IQUOT r,171:1

140
8)GO PRINT "6) RETURN TO PROGRAM"1970 PRINT "7) EXIT"180pS PRINT: INPUT "ENTER TIlE NUMFR OF YOUR CIIOICE -,"MC0ri OPENm FIIE$ FOR APPEND AS 0280R2 PRINT 12, "CIIANGE #";K9Vo83 CLOSE 02P084 CLS: COLOR 7,08085 IF K9 - 6 TIIEN RETURN8090 ON1 K9 OSUB 8300,8130,8150,8170,8180,8120,82008100 GOTO 80008120 RETURN8130 INPUT "ENTER NUMBER OF COPPER SOLUTION ADDITIONS =>";SPIt840 RETURN8150 INPUT "ENTER PRINT INTERVAL IN MINUTES ->":PIS1 ",O RETURN8170 INPUT "ENTER NUMBER OF ELAPSED DAYS ->";DAYL172 INPUr "ENTER INITIAL HOUR ->"; iR817) INPUT "ENTER INITIAL MINUTES ->":MIN8174 INPUT "ENTER INITIAL SECONDS ->":ISEC8175 RETURN
8380 INPUT "ENTER ALIQUOT SIZE FOR COPPER SOLUTION";MI-190 RETURN8200 COLOR 7,0:END9300 1H=2008400 OUT DDRB,136C1 30 PRINT "EMPTY (]) FI LL(2)"?440 INPUT NV1I IF N=I THEN GOTO 84458412 IF N2 THEN GOTO 8545
.43 RETURNP.1,15 FOR 1=1 TO M8450 OUT PB,1C460 J=08470 OUT PB,O8480 NEXT I8490 OTO 8430
15 FOR 1-1 TO Fl3550 OUT ID,38560 3-08570 OUT PB,28590 NEXT I8590 GOTO 84309100 IF H1R > - 11R GOTO 91609110 IF F3 - 1 GOTO 9170920 DAY - DAY 4 191.10 F3 = 1
9150 GO'rO 91709160 F3 09170 H1R - 1IR 4 DAY*24 - I1tR7189 rETURN10015 JJ - 010,Q1" OPEN "LI'T]:" Ar 119'2, |'RIll1 #1,TS: TAIl(2r) :AC: TAP(lr,) ?IV| . 13"1 Ci//') . #II 1' I' r)
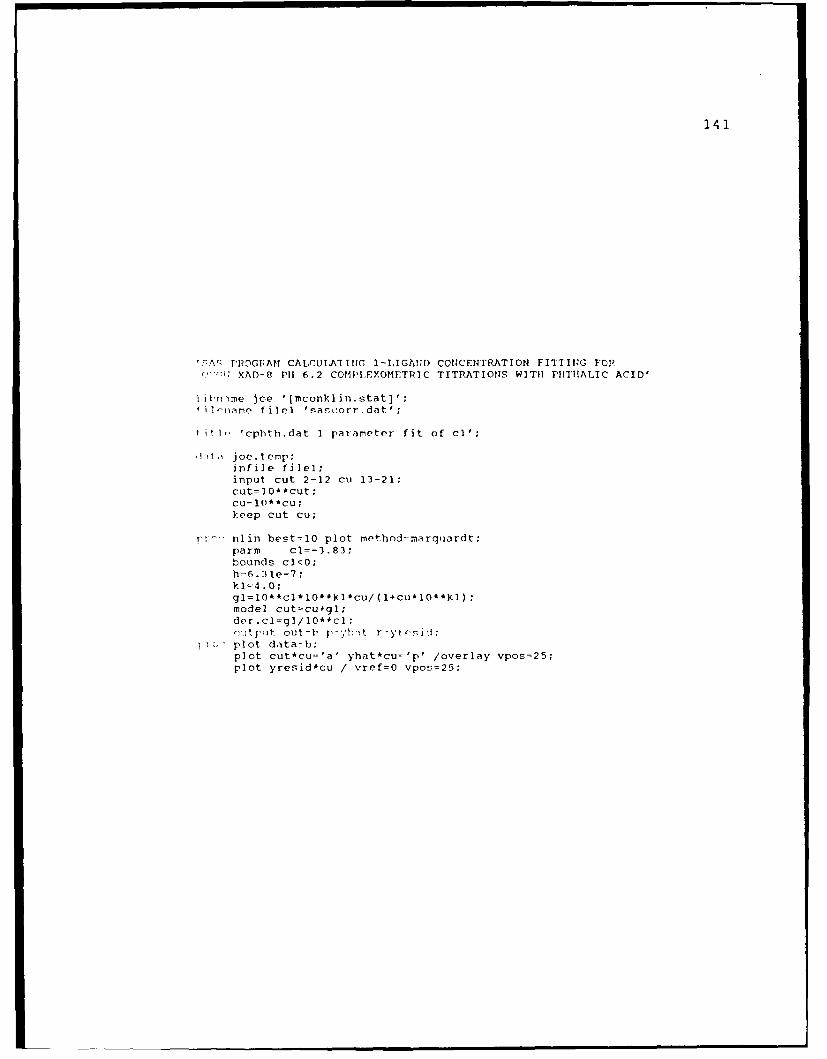
141
'!7A,' PPC )GFAM CALCULATINUG 1-LIGAND COIICE14TRATIOII FITTINhG FOPr::XAD-B P11 6.2 COMPLFY.OMFTPIC TITRATIONS WIT11 PTITIIALIC ACID'
I ilnime jcoe ' (mconklin.stat];
it l- 'cphth.dat I parameter fit of ci';
,lI ta j oe. temp;infile filel;input cut 2-12 cu 13-21;cut=1 0**cut;cu-10* *cu;keep cut cu;
Fr'r7 nlin bpst 1O plot method-rarqtiordt;parm cl=-3.83;bounds cl<0;h 6.3 le-7;k1l=4 .0;gl=1O**c1*1O**kl*cu/ (l+cu*1O**kl);model cut~cu~ql;dter.cl-gl/10**clr-,itP;)t out-b, p-yh-lt r -yrcrsi ci
ic; plot data-b;plot cut*cu='a' yhat*cu-'p' /overlay vpos-25;plot yresid~cu / vref=O vpos=25;

142
P~rROGRAM CALCULATING 2-LIGAJO CONCENTRAT1ONS OF PIITHALIC ACID AND(All CHOL FOR OCGW XAD-8 PH 6.2 COMPLEXOMETRIC TITRATIONS'
]iln~ie joe '[nconklin.stat]';filename filel 'sascorr.dat';
title 'cphthcat.dat 2 parameter fit: cl,c3';
dct joe.temp;infile fulel;input cut 2-12 cu 13-21;cut=10**cut;cu= 10 **~cu;keep cut cu;
pi-oc nlin best=1O plot method=marquardt;*parm cl=-4.25
c3=-4 .2;bounds cl<0,c3<0;h-6. 31e-7;Yl=4 .0;k3=-7 .96;
gl=10**cl*l0**kl*cu/ (1-fcu*10**kl);g3=10I*c3*10**k3*cu/ (h**2+cu*l0**k3);model cut=cugl+g3;
dnr.cI=ql/l0**cl;dr~r.c3=g3/l0**c3;output out'-b p~yhat r~yresid;
rr-o,: plot data~-b;plot cut*cu-'a' yhat*cu~'p' /overlay vpos=25;plot yresid*cu / vref=0 vpos=25;

143
'5 A Ii',"GRAM CALCULATING CONCENTRATIONS OF PIITIALIC ACID AND141711L IT A FIXLD CONCENJTRATION OF GLYC'INE FOR PA XAD-S
r-)miPirXOIETRIC TITRATIONS AT PH1 7.5'
1ii~njoe '[mconklin.stat)';filenamf-n filel 'ba7.dat';
titlb, 'BA73lig.dat 2 parameter fit: cl,c3';
d'Ita joe.temp;irifile filel;input cut 2-12 cu 13-21;Ctut=10**cut;(-U- 10**cu;1)r'(p cut cu;
yr-oc nuin best -1O plot rethodorrarquardt;parm cl=-3.3
bounds cl<O,c3<0;h-1.1r6228e-8;c4- -5.095;
I - 4 .0;
P 3-7. 96;Y 4 -1 .24;
g1-10**cl*10**kl*cu/ (14cu*10**kl);93- 10**c3*10**}k3*cu/(h1**24cu*10**k3);g47 1O**c4*1O** :4*Cu/ (h4cu*10**k4);mr-3-1 cut-cu4q14q34q4;
do(-r.cl-q3/10**cl;drr. c3=g3/ 10* *c3;output out-b p-yhat r=yresid;
proc plot data-b;plot cut~cu-'a' yhat*cu 'p' /overlay vpos=25;plolt yrrsid*cu / vref-0 vpor,-25;

144
f W; UPOCPAM CALCULATING CONCENTRATIONS OF TIITIIALIC ACID ANDCAICHIIO. WI'II1 A FIXED CONCENTRATION OF GLYCINE FOR BA XAD-8CCRFPLEXOMETRIC TITRATIONS AT 111 7.5'
litnram joe '[mconklin.stat]';filename filel 'ba7.dat';
title 'BA73lig.dat 2 parameter fit: cl,c3';
d~atai joe.temp;infile filel;input cut 2-12 cu 13-21:Cut=l0**cut;cu=l0**cu;Keep cut cu;
proc nlin best=1O plot rethod=marquardt;parn cl=-3.3
c3=-5. 3;bounds cl<O,c3<0;h=3. 16228e-8;c4=-5 .095;kl=4 .0;k3=-7 .96;k4=-1 .24;
91=10**cl*10**kl*cu/ ( +cu*10**kl);q>I10**c3*1O**k3*cu/(h**2+cu*1O**k3);
model cut~cu+gl4g3+g4;
der.cl-gl10**cl;der.c3=g3/10**c3;output out~b p=yhat r~yresid;
proc plot data=b;plot cut*cu-'a' yhat*cu-'p' /overlay vpos--25;*plot yroF-id*cu / vref=0 vpos=25;

145
'A> Pl 'Y~AM CALCTILATI NG A THIPiD LIGAN) CO!4CENTPAT] 01 AND;>PilCr CONSTANT FOR OCGW XAD-8 I'll 7.5 C0MPLEXOME~TRIC TITRATION'
iiln~nmc joe '[mconklin.stat)';f i1c1narC filel 'ocgw7.dat';
titlo 'OC7flo.dat 2 parameter fit: c9,k9';
(hl - jce.temp;!ni le file);input cut 2-12 cu 13-21;ctt 0**CUt;
CU- 1O*icu;kr~P cut cu;
I ,7c nlin best=lO plot method-marquardt maxiter=30;parrn c9 -4.4 to -4.3 by 0.01
bounds c9<0.k9*>5;h' 3.16228e-B;c) --4 .3;c3=-4 .85;k1i 4.0;
g3 1o*Ac3*10**k3*cu/(h**2{culO0*k3);lg10l**c,9*10**k9*CU/ (l4Cu*]O**k9);
7--il Cut-CU4qj q34qO;
der.c9=g9/10**o9;der.k9=g9/10**k9-(g9**k9/((10**k9)**2*10**c9));output out~b p=yhat r~yresid;
mco plot data~b;plot cut~cu='a' yhat*cu-'p' /overlay vpos=25;plot yre5id*cu / vrpf 0 vpns-25;

146
'U'AY Ul<OCIPA? CALCULATIN'G rI-fl-GjYclrq CONCENTRATION FORPfAIEAQUIFER XAE)-8 PH! 6.2 COMIE,XOMFTRIC TITRATION
W1111 CATECIOL, AND PlITHALIC ACID)
ILime joe '(mconklin.statJ';
f lonriim file] 'ba6.dat';
title '13A(,3ngly.dat I parameter fit: c8';
datia joe.terp;infile filel;input cut 2-12 cu 13-21;cut~-1O**cut;cu- 10* *cuI;keep cut cu;
prof- nlin best-=10 plot method~-marquardt maxiter=10;parm c8=-5.4 to -4.4 by .02:
hounds c8<0c;h-6.30957e-7;c1l--4 .6395;c3--5. 2006;
k3-~-7 .96;kB=8.4;giI0*cl*lo**klI*cu/ (1+cu*10**kl);g3-1O)**c3*1Q**k3*cu/ (h**24cu*10**k3);
modiel CUt CU4gl4q3+qS;
d-r.c8-gP/10**c8;output out~b p-y.-at r=yresid;
pi , plot data=b;plot cut*cu-'a' yhat*cu=~'p' /overlay vpos=25;pl'-t yresid*cu / vref-0 vpor.-25;

147
flA63ngly.d.it I prartr t ilt
1OJJ-1,TNEAR LEAST SQUARES GPID SEAR('l [1)I 'H
C8 PESIDUAI S ?
-5.40 3.6742351307E-1 1
-5.38 3.7244576549F-1 )-5.36 4.0456504235F-3 1-5.34 4.6764982353E-11-5.32 5.6600092189E-11
-5.30 7.0439597964E-11-5.28 8.8813838906E-11-5.26 1. 1231110703E-I0-5.24 1 .4158355818E-1O-5.22 1.7735370838T -10
BA63ng1y.dat 1 parareter fit:
NON-LINEAR LEAST SQUARES ITERA'IIV
DErEJDENT VARIABLE: CUT METHOD: MAP
ITEPA T I ON C8 FE :
0 -5.4 3.671221 -5.4 3.6742'
11"141: CONVERGENJCE CRITERION MET.

~~J U
122
Ii I I I X
r- In - HC
C3 fnI In ODI 0) E I
a i E 4 Ul I
-4 U-) %D C
En 0
01l 94 U)OHO
tO~ ~~~ HC)~f0 O CJ.4~~E- C; )) U C
Ol U) c)~ N
H 0 O 0 P) M )-0
z m) 00 0 P
u) Nf u US C)
H z04 . -
z :

149
040
I C
12 00
C) mm ~0
CC)12..
1 04-'C C10
0 00
4 00
C) 12.

150
40
1 01 0
1 100+
4J -0I
+0
ID -W
Cl)10f 10
+ 01 10
01
0 I
0
+~ I
0+

T:TRATCR DATA FELE. - POTE::0 ,ETRIC TITRATIO:;
OCGW --Lin Pcten E:06 pr March 19, 199')
[ly)=1E-5m[Phth.] 5.575lE-M [CatJ=l.415E-SMOrg-N=0.17 mg/L -OH=5 -COOH=15.7 meq/g C
Chemical Components: OCGW 3Lig Poten
# Name Cl Charge Total Initial Log Free Error
1 H2Phth 1 0 5.57510E-05 0. 000 0.000 0.00000E-002 OH- -I -I. 1050E -03 -11. 000 0.000 0. OOC)0OE002 Na I I 1. O,000E -02 0.0(0 0. 000 0. 00.OOE 0r,4 N02- 1 - 1. 00000E -02 0.000 0.000 0. OOOOE(*E ' 005 H2Cat 1 0 1.41500E-05 0.000 0.000 0.OOOOE0O6 HGly 1 0 1. 00000E-05 0.000 0.000 O. 00000E 00
Ionic Strength 0.00000Maximum iterations -- no convergence
Equilibrium Species: OCGW 2Lig Poten
# Name C1 H 0 N N H H Log K Molarity2 H a 0 2 GP - +, 3 C 1
r, a y
1 H 1 0 -1 0 0 0 0 -14. 001 0. O000E00- HPh t h - I 1 1 0 0 0 0 11. 1 5 0. ':,,'c',E-1
Ph -- I 1 2 0 0 {C (-)2 .4 HCat- 1 0 1 0 0 1 C) .77, 0.o::',O-,5 Cat-- 1 0 2 0 0 1 0 5. 770 0. 00c CGE-H2 Gvl 1 0 -1 0 0 0 1 -11.77 t. .0 000 ' ,E :'
0 1 0 0 1 4.4 Z'. O',E-',

152
CGW S-e: 8:,E pm March, 1 , Ijj,.,
[ Pht ]= .5 5-S CCat = .4S -5I[GI y) 1E -tM @ Or Q-N=O. I17mc /Lcar~:xyli1=;.7meq/g C phe-*iic=5 mee/o C
Chemical Compconents: DCGW 3-Lia
# Name CI Charge Total Initial Loa Free Error
I Cu.*+ 1 2 1. 00000E-07 -12.000 0.000 0. 00000E-002 N02- 1 -1 I1 . 0(),)E -02 0. 000 0.000 0. 000))3 Na 1 1 1. 00000E-02 0.000 0.000 0. OOO00E-004 Gly- I - I I. 0;000E -05 o. 0:0 0. 000 O. 000".E0)05 Phth-- 1 -Z 5. 57510E-05 0. 000 0.000 0.00000E-006 Cat-- 1 -2 1. 41500E-05 0.000 0.000 0. 0000E-)7 H- 2 1 6. 20-6?0E-07 -6. Aco 0. 000 0. 000(E-0c
Ionic Strength 00000Maximum iterations -- no convergence
Equilibrium Species: 0CGW 3-Lig
# Name C' C N N G P C H Loa K Molarity
u 0 a I h a ++ 3 * y t t
O - -0.iOH - 0 0 0 0 0 0 -1 -14.0 c, 0. 000E-,"
2 C"OH. I 1 0 0 1 ' 0 L -S. 0,1(, 0. 0000E-0,)Z C . ' 1 0 0 0 0 E..4 Ci'O, 1t 0 "1
O C0H -I 1 0 0 I 0 0 4). 0 Et: (C CH 2 0 0 0 0 E- 1.5 0 )l E ,- . C '" i 1 1 0 0 ")- .' ,, '. 0 0E :,
; fl . ,. ,' 0 -. i II: ir 5 , I.,U', E .. ..: 0 , C N C ,
"o. .'0,
*F -

153
REFERENCES
Anderson, D. M. and Morel, F. M. M. Copper sensitivity ofgonvaulax tamarensis. Limnol Oceanog, 23, 283-295 (1978).
Athavale, V. T.; Prabhu, L. H.; and Vartak, D. G. Solutionstability constants of some metal complexes of derivativesof catechol. J Inorq Nucl Chem, 28, 1237-1249 (1966).
Bassett, R. L. and Melchior, D. C. Chemical modeling ofaqueous systems. In Chemical Modeling of Aqueous SystemsII, ed. Melchior, D. C. and Bassett, R. L., Amer Chem Soc,Wash D. C., 1-14 (1990).
Bresnahan, W. T.; Grant, C. L.; and Weber, J. H. Stabilityconstants for the complexation of copper (II) ions withwater and soil fulvic acids measured by ion selectiveelectrode. Anal Chem, 50, 12, 1675-1679 (1978).
Buffle, J., et al. Study of the complex formation of copper(II) by humic and fulvic substances. Anal Chim Acta, 116,255-274 (1980).
Cabaniss, S. E. Titrator: An interactive program foraquatic equilibrium calculation. Env Sci & Tech, 21, 2,209-210 (1987).
Cabaniss, S. E. and Shuma M. S. Copper binding bydissolved organic matter: I. Suwannee River fulvic acidequilibria. Geoch Cosmo Acta, 52, 185-193 (1988a).
Cabaniss, S. E. and Shuman, M. S. Copper binding bydissolved organic matter: II. Variation in type and sourceof organic matter. Geoch Cosmo Acta, 52, 195-200 (1988b).
Cabaniss, S. E. and Shuman, M. S. Fluorescence quenchingmeasurements of copper-fulvic acid binding. Anal Chem, 60,2418-2421 (1988c).
Childs, C. W. Chemical equilibrium models for lake waterwhich contains nitrilotriacetic acid and for normal lakewater. Proc. of 14th Conference on Great Lakes Research,198-210 (1971).

154
Clark, S. B. and Choppin, G. R. Kinetics of rare earthmetal binding to aquatic humic acids. In Chemical Modelingof Aqueous Systems II, ed. Melchior, D. C. and Bassett, R.L., Amer Chem Soc, Wash D. C., 519-525 (1990).
Condike, G. F. and Martell, A. E. Mixed ligand chelates ofcopper (II). Inorg Nucl Chem, 31, 2455-2466 (1969).
Dobbs, J. C., et al. Characterization of metal bindingsites in fulvic acids by lanthanide ion probe spectroscopy.Anal Chem, 61, 483-488 (1989).
Duursma, E. K. Organic chelation of 6Co and 65Zn by leucinein relation to sorption by sediments. In Symposium onOrganic Matter in Natural Waters, ed. Hood, D. W., Univ. ofAlaska, 387-397 (1970).
Dzombak, D. A.; Fish, W.; and Morel, F. M. M. Metal-humateinteractions. 1. Discrete ligand and continuous distributionmodels. Env Sci & Tech, 20, 7, 669-675 (1986).
Ephraim, J. H., et al. A novel description of the acid-baseproperties of an aquatic fulvic acid. Env Sci & Tech, 23,3, 356-362 (1989).
Fish, W.; Dzombak, D. A.; and Morel, F. M. M. Metal-humateinteraction. 2. Application and comparison of models. EnvSci & Tech, 20, 7, 676-682 (1986).
Gamble, D. S. Potentiometric titration of fulvic acid:equivalence point calculations and acidic functional groups.Can J Chem, 50, 2680-2687 (1972).
Gamble, D. S. Titration curves of fulvic acid: theanalytical chemistry of a weak acid polyelectrolyte. Can JChem, 48, 2662-2669 (1970).
Gamble, D. S. and Schnitzer, M. The chemistry of fulvicacid and its reactions with metal ions. In Trace Metals andMetal-Organic Interactions in Natural Waters, ed. Singer, P.C., Ann Arbor Sci, Ann Arbor, Mich, 265-302 (1973).
Gamble, D. S.; Schnitzer, M.; Kerndorff, H.; and Langford,C. H. Multiple metal ion exchange equilibria with humicacid. Geoch Cosmo Acta, 47, 7, 1311-1323 (1983).
Gamble, D. S.; Underdow, A. W.; and Langford, C. H. Copper(II) titration of fulvic acid ligand sites with theoretical,potentiometric, and spectrophotometric analysis. Anal Chem,52, 12, 1901-1908 (1980).

155
Greisser, R. and Sigel, H. Ternary complexes in solution.XI. Complexation between the cobalt (II)-, nickel (II)-,copper (II)-, and zinc (II)-2, 2'-bipyridyl 1:1 complexesand ethylenediamine, glycinate, or pyrocateholate. InorgChem, 10, 10, 2229-2232 (1971).
Guy, R. D. and Chakrabarti, C. L. Studies of metal-organicinteractions in model systems pertaining to natural waters.Can J Chem, 54, 2600-2611 (1976).
Hering, J. G. and Morel, F. M. M. Humic acid complexationof calcium and copper. Env Sci & Tech, 22, 10, 1234-1237(1988).
Holm, T. R. and Curtiss III, C. D. Copper complexation bynatural organic matter in ground water. In ChemicalModeling of Aqueous Systems II, ed. Melchior, D. C. andBassett, R. L., Amer Chem Soc, Wash, D. C., 508-518 (1990).
Jameson, R. F. and Wilson, M. F. Thermodynamics of theinteractions of catechol with transition metals. Part II.Copper and nickel complexes of catechol. J Chem Soc DaltonTransactions, 23, 2614-2616 (1972).
Kragten, J. Atlas of Metal-Ligand Equilibria in AqueousSolution, John Wiley & Sons, New York (1978).
Larry, I.; Cromer, M.; and Scharff, J. P. Binding strengthevaluation of Cu(II) complexation with organic ligands ofenvironmental interest. The Science of the Total Env, 62,271-274 (1987).
Liao, W., et al. Structural characterization of aquatichumic material. Env Sci & Tech, 16, 403-410 (1982).
Lumme, P. and Kari, E. Phthalic acid as a reagent ininorganic qualitative analysis of metal ions. Part IV.Thermodynamics of the complexation of phthalate ion withdivalent copper, nickel, and cobalt ions in aqueous sodiumperchlorate solutions. Acta Chem Scand, 29, 125-135 (1975).
Manning, P. G. and Ramanoorthy S. Equilibrium studies ofmetal-ion complexes of interest to natural waters - VII.Mixed-ligand complexes of Cu(II) involving fulvic acid asprimary ligand. J Inorg Nucl Chem, 35, 1577-1581 (1973).
Mantoura, R. F. C.; Dickson, A.; and Riley, J. P. Thecomplexation of metals with humic materials in naturalwaters. Estuarine Cos Mar Sci, 6, 387-408 (1978).

156
McKnight, D. M., et al. Complexation of copper by aquatichumic substances from different environments. The Scienceof the Total Env, 28, 65-76 (1983).
Morel, F. M. M. and Morgan, J. A numerical method forcomputing equilibria in aqueous chemical systems. Env Sci &Tech, 6, 58-67 (1972).
Neshkova, M. and Sheytanov, H. The behavior of two types ofcopper ion-selective electrodes in different copper (II)-ligand systems. Talanta, 32, 10, 937-947 (1985).
Odem, W. Department of Environmental Engineering,university of Arizona, Tucson, AZ, Verbal communication(1990).
Oliver, B. G.; Thurman, E. M.; and Malcolm, R. L. Thecontribution of humic substances to the acidity of colorednatural waters. Geoch Cosmo Acta, 47, 2031-2035 (1983).
Olofsson, U. and Allard, B. Complexing of Actinides withNaturally Occurring Organic Substance - Literature survey,SKBF/KBS Teknisk Report 83-09, 27 p. (1983).
Orion. Model 94-29 Cupric Electrode Instruction Manual,Orion Research Inc., 33 p. (1986).
Paulson, A.J. and Kester, D. R. Copper (II) ion hydrolysisin aqueous solution. J Soln Chem, 9, 4, 269-277 (1980).
Perdue, E. M. Acidic functional groups of humic substances.In Humic Substances in Soil, Sediment, and Water, ed. Aiken,G. R.; McKnight, D. M.; Wershaw, R. L.; and MacCarthy, P.;John Wiley & Sons, New York, 493-526 (1985).
Perdue, E. M. Effects of humic substances on metalspeciation. In Aquatic Humic Substances. ed. Buffet andMacCarthy, Amer Chem Soc, 281-295 (1989).
Perdue, E. M. Solution thermochemistry of humic substances- I. Acid-base equilibria of humic acid. Geoch Cosmo Acta,42, 1351-1358 (1978).
Perdue, E. M.; Reuter, J. H.; and Ghosal, M. Theoperational nature of acidic functional group analyses andits impact on mathematical descriptions of acid-baseequilibria in humic substances. Geoch Cosmo Acta, 44, 1841-1851 (1980).

157
Perdue, E. M.; Reuter, J. H.; and Parrish, R. S. Astatistical model of proton binding by humus. Geoch CosmoActa, 48, 1257-1263 (1984).
Plechanov, N., et al. Investigations on humic substances innatural waters. In Aquatic and Terrestrial Humic Materials,ed. Christman, R. F. and Gjessing, E. T., Ann Arbor Science,Ann Arbor, Mich., 387-405 (1983).
SAS Institute Inc. SAS User's Guide: Basics, Version 5edition, Cary, N. C. (1985).
Schnitzer, M. and Khan, S. U. Humic Substances in theEnvironment, Marcel Kekker, Inc., New York, 327 p. (1972).
Schnitzer, M. and Khan, S. U. (eds.). Soil Organic Matter,Developments in Soil Science 8, Elsevier Sci Publ Co, NewYork, 319 p. (1978).
Smith, R. M. and Martell, E. E. Critical StabilityConstants, Plenum Press, New York (1975).
Snoeyink, V. L. and Jenkins, D. Water Chemistry, John Wiley& Sons, New York, 463 p. (1980).
Steelink, C. Implications of elemental characteristics ofhumic substances. In Humic Substances in Soil, Sedimentand Water, ed. Aiken, G. R.; McKnight, D. M.; Wershaw, R.L.; and MacCarthy, P.; John Wiley & Sons, New York, 457-476(1985).
Stumm, W. and Brauner, P. A. Chemical Speciation. InChemical Oceanography, ed. Riley, J.P. and Skirrow, G., 2nded., I, Academic Press, London, 173-234 (1975).
Sunda, W. G. and Guillard, R. R. L. The relationshipbetween cupric ion activity and toxicity of copper tophytoplankton. J Water Res, 34, 513-529 (1976).
Sunda, W. G. and Hanson, P. J. Chemical speciation ofcopper in river water. In Chemical Modeling in AqueousSystems, ed. Jenne, E. A., Amer Chem Soc, 147-180 (1979).
Takamatsu, T. and Yoshida, T. Determination of stabilityconstants of metal-humic acid complexes by potentiometrictitration and ion-selective electrode. Soil Science, 125,6, 377-386 (1978).
Thurman, E. M. Organic Geochemistry of Natural Waters,Martinus Nijhoff/Dr. W. Junk Publishers, Dordrecht, 497 p.(1985).

158
Thurman, E. M. and Malcolm, R. L. Preparative isolation ofaquatic humic substances. Env Sci & Tech, 15, 4, 463-468(1981).
Thurman, E. M. and Malcolm, R. L. Structural study of humicsubstances: new approaches and methods. In AquaticTerrestrial Humic Matter, ed. Christman, R. F. and Gjessing,E. T., Ann Arbor Sci, Ann Arbor, Mich, 1-23 (1983).
Van Den Berg, C. M. G. and Kramer, J. R. Conditionalstability constants for copper ions with ligands in naturalwaters. In Chemical Modeling in Aqueous Systems, ed. Jenne,E. A., Amer Chem Soc, Wash D.C., 115-132 (1979).
Waterbury, M. J. M. S. Thesis. The effects of naturalorganic matter on the speciation and transport of Cu(II) ingroundwater, Dept of Hydrology, Univ. of Arizona, Tucson,160 p. (1990).


