
Commercial Real Estate, Distress and Financial Resolution: Portfolio Lending versus Securitization * David H. Downs a
The Kornblau Institute, Virginia Commonwealth University, USA Pisun (Tracy) Xu b
University of Denver, USA Current version: December 20, 2013 a David H. Downs, The Kornblau Institute, Virginia Commonwealth University, Snead Hall, 301 West Main Street, Richmond, Virginia 23284-4000, USA, or email [email protected]. b Pisun (Tracy) Xu, Reiman School of Finance, Daniels College of Business, University of Denver, Denver, CO 80208-8951, USA or email [email protected].
1
Commercial Real Estate, Distress and Financial Resolution: Portfolio Lending versus Securitization
Abstract
This paper examines the contrasting influence of portfolio lending and
securitization in the resolution of distressed commercial real estate. The
empirical analysis utilizes a large and unique data set of distressed commercial
mortgages for securitized and portfolio loans. The data set is constructed based
on the recent financial crisis and includes U.S. and International agents. The
main hypotheses address the marginal impact of portfolio versus securitized loans
on resolution outcome, time to resolution and capital recovery rates. Conditional
on a loan becoming troubled, we find a significantly higher foreclosure rate
associated with loans held in a portfolio, compared to those that are securitized.
Furthermore, portfolio loans experience shorter time to resolution and higher
recover rates in the foreclosure process. Our study is intended to contribute to the
growing literature on distressed asset resolution and to provide new perspectives
on agents at the nexus of real estate and capital market decisions.
Keywords: Commercial real estate, distressed debt, securitization, financial
resolution
JEL Classification: D8, G1, R33
1. Introduction
As a consequence of the recent economic and financial crisis, commercial mortgages
experienced historically high default and delinquency rates. The overall delinquency rate of
commercial multifamily mortgages climbed to 13.03% in 2012. As a significant source of
financing for commercial mortgages, the commercial mortgage-backed security (CMBS) has
become an important player in the distressed real estate market. Delinquent and non-performing
CMBS loans increased from approximately $14 billion in 2009 to over $90 billion in 2012. The

2
enormous size of distressed CMBS loans poses a challenge to market participants; yet, they offer
an opportunity to study how distressed loans in the commercial real estate market are resolved.
There is an important debate taking place in both academic and policy circles regarding whether
securitization affects resolution outcomes of troubled loans, specifically whether securitization
precludes loan renegotiation. A few recent studies have turned to the data and examine the issue.
They mainly focus on the residential mortgage market and the evidence is inconclusive.
Piskorski, Seru, and Vig (2009) and Agarwal, Amromin, Ben-David, Chomsisengphet and
Evanoff (2011) find that portfolio-held loans are more likely to be modified and less likely to be
foreclosed upon, compared to securitized mortgages. Adelino, Gerardi and Willen (2013) and
Foote, Gerardi, Goette and Willen (2009) find no material difference in the rate of renegotiation
between portfolio-held and securitized loans and conclude that securitization does not impede
renegotiations. Little has been done on commercial mortgages.
In this paper, we make the first attempt to explore the role of securitization in the distressed
commercial real estate market. The objective is to provide new perspective on how
securitization impacts financial resolution of distressed commercial mortgages. Specially, we
examine the impact of securitization on resolution outcome, length of time to resolution and
capital recovery rates. We find that portfolio loans are more likely to be foreclosed upon in the
commercial real estate market. Furthermore, we find that portfolio loans experience shorter time
to resolution and higher recovery rates in the foreclosure process. The paper responds to recent
debate and provides new evidence on the role of securitization in the workout of distressed
commercial mortgages. The paper also contributes to the literature related to the costs and
benefits of securitization.
The rest of the paper is organized as follows: Section 2 reviews the literature and develops
hypotheses. Section 3 describes the data and sample. Section 4 presents the empirical
methodology and results. Section 5 concludes.

3
2. Literature Review and Hypotheses
Literature Review
The existing literature on distressed real estate focuses on default behavior and prepayment
decisions. The literature on the strategy and process of distress resolution in the commercial real
estate market is relatively sparse. We provide a brief overview as follows.
A few studies consider the theory of resolution of distressed debt and its implication on
commercial loan defaults and workout strategy. Ciochetti and Riddiough (1998) examine the
commercial mortgage foreclosure process using a sample of 480 defaulted commercial
mortgages originated by a single, large life insurance company. They find that foreclosure time
varies by property type, region of loan origination and year in which the mortgage is foreclosed.
States classified as power-of-sale have approximately a two and one-half month shorter
foreclosure period. The overall investment performance of modified-foreclosed loans is inferior
to that of loans that are straight foreclosures. Brown, Ciochetti and Riddiough (2006) develop a
model of financial distress with an owner-managed project and empirically examine distress
resolution using a large sample of defaulted commercial real estate loans from a single, large
insurance company. They find that foreclosures occur more frequently with loans that default
during the worst years of the downturn while restructuring is more prevalent as market
conditions improve and a ready market for foreclosed properties exists.
A nascent literature explores the role of securitization on loan renegotiation in the residential
mortgage market. Piskorski, Seru, and Vig (2009) examine the impact of securitization on loan
servicing and whether securitization inhibits modifications of loans for distressed borrowers.
They find that securitized loans are more likely to be foreclosed upon. Agarwal, Amromin, Ben-
David, Chomsisengphet and Evanoff (2011) identify modification directly from the servicers’
reports and provide a direct test of the impact of securitization on the renegotiation rates. They
find that the renegotiation rates of securitized mortgages are lower. Adelino, Gerardi and Willen
(2013) and Foote, Gerardi, Goette and Willen (2009) use an algorithm to identify renegotiations.
Based on their algorithm, they find no material difference in the rate of renegotiation between
4
portfolio and securitized loans. The authors of both studies conclude that securitization does not
impede renegotiations.
Another strand of literature empirically analyzes the role of special servicing in the resolution of
distressed commercial mortgages. Gan and Mayer (2006) find that a small percentage of loans
get liquidated more quickly when the special servicer owns the B-piece. However, special
servicers delay liquidation when they hold the B-piece in mortgage pools with a larger
percentage of delinquent loans. Ambrose, Sanders and Yavas (2010) examine the correlation
between the default risk of commercial mortgage loans and whether, or not, the master and
special servicing rights are held by the same firm. They find that 40.8% of the loans in their
sample include CMBS deals where the master and special servicing rights are held by the same
firm. The time-in-default is shorter and the foreclosure rate is higher when the servicing rights
are concentrated. Chen and Deng (2012) analyze both the servicers’ choice of workout options
and the borrower’s default decision-making process. They find that cash flow is the most
significant factor in the servicers’ decision-making process; while, borrowers make default
decisions based upon both the equity position in the mortgage and the cash flow condition in the
space market.
Institutional Detail
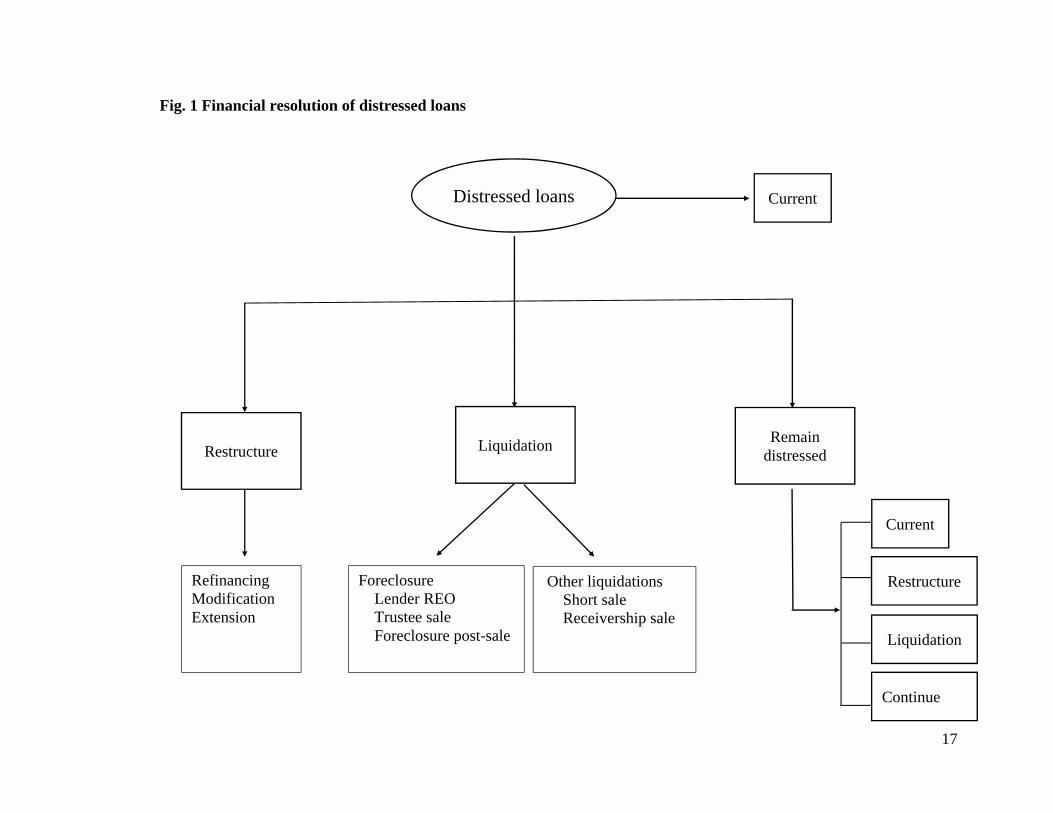
A distressed loan can be resolved through one of the following alternatives: restructure
(including loan refinancing, loan modification, and extension), foreclosure (including lender
REO, trustee sale, post-foreclosure sale) and non-foreclosure liquidations (including short sale,
receivership sale). Figure 1 illustrates the different potential workout choices. The resolution
process dynamic is different between portfolio-held loans and securitized loans. Portfolio loans
are owned, managed and serviced by the originating lender, mainly a bank or an insurance
company. The original lender makes all decisions in the event of delinquency and default.
In contrast, a securitized loan is transferred by the originator to a trust with, potentially, many
other loans. In this case, the original lender has little or no ongoing relationship with the
borrower. The document governing the pool of securitized loans is called a Pooling and
Servicing Agreement (PSA). This agreement is an important document governing the servicing

5
and workout if the loan becomes distressed. The PSA appoints a master servicer to act on behalf
of the trust and administer the loans on a day-to-day basis. Another difference is that securitized
commercial loans often are tranched into multiple classes, both within the mortgage and
sometimes also including one or more classes of mezzanine loans. When a securitized loan fails
to perform as expected, the special servicer, typically appointed through the PSA, takes over
responsibility for managing distressed loans and functions as an agent between borrowers and
investors. The rights, duties and compensation of special servicers are set out in a PSA. Special
Servicers are normally compensated by receiving a percentage of the unpaid balance on the loans
they service. The fee rate can be anywhere from one to twenty five basis points depending on the
size of the loan, whether it is secured by residential or non-residential real estate, and the level of
service required.
Hypotheses
Several factors may affect the resolution of financial distress: (1) contracting frictions; (2)
asymmetric information; (3) agency conflicts. Servicers of portfolio loans and securitized loans
in the commercial real estate market may have different incentives to choose one workout
strategy versus another. In this section, we develop the hypotheses centering around the impact
of securitization on a servicer choosing foreclosure versus restructure when dealing with
distressed commercial mortgages.
A widely held view suspects that securitization of mortgages impedes the process of loan
restructure or renegotiation. First, there are several institutional reasons. For securitized loans,
the PSA governs the servicing and may place restrictions on how workouts should be carried out.
The multi-tranche structure of securitized loans can result in a much more contentious workout
process. Different investors may have competing interests. Consequently, the disagreements
among investors in renegotiation could be greater than those with borrowers. Second, with
relationship lending, the amount of information asymmetry between a borrower and portfolio
lender are reduced. The portfolio lender might possess soft information about the underlying loan
and borrower when evaluating loan defaults, which may lead to a smoother negotiation process.
Third, in the case of a securitized loan, the special servicer is an agent of the investors. Fiduciary
responsibilities to obtain the highest price for investors may incentivize a special servicer to

6
manage the foreclosure process and take ownership of the property. The lender-owned property
will then be put through an auction process to elicit a fair price, whereby the fiduciary can show
they have met their responsibility. This leads to the first of two alternative hypotheses. In each
case, the null hypothesis is no marginal effect.
Hypothesis 1A: Compared to securitized loans, portfolio-held loans are more likely to be
restructured and less likely to be foreclosed upon.
However, there are reasons to expect that portfolio-held loans are more likely to be foreclosed.
First, the potential loss of a commercial mortgage re-default could be higher. Hence, servicers
may choose to foreclose a distressed loan ex-ante to minimize the cost. Second, Adelino et al.
(2013) present an array of institutional evidence against foreclosure, including the fact that
lender’s own filings with the SEC show that foreclosures reduce the value of special servicing
rights whereas modifications increase them. Third, the information asymmetry is higher when
dealing with commercial mortgages. The borrower may know more about underlying property
value and profitability. Portfolio lenders may incur losses if they choose to restructure or modify
a distressed loan which has a probability of curing. Hence, they may choose to foreclose
properties with higher information asymmetry and restructure those with lower information
asymmetry.
The second alternative and competing hypothesis is stated as follows:
Hypothesis 1B: Compared to securitized loans, portfolio-held loans are more likely to be
foreclosed upon and less likely to be restructured.
Given the institutional features listed above, we expect that portfolio-held loans experience
shorter time to resolution. Portfolio lenders are the sole decision-maker in the workout process
and thus have more flexibility in terms of choosing a workout strategy. In addition, portfolio
lenders fully internalize the costs and benefits of any resolution decision. Hence, they are more
likely to act quickly.

7
As hypothesized above, portfolio lenders are likely to take prompt actions to resolve distress. In
this scenario owners of distressed real estate are less likely to incur additional risks and delay
necessary capital improvements or renovations. Consequently, the distressed property might
result in a smaller loss to the portfolio lenders and are less likely to be liquidated at a sub-optimal
value. We expect the capital recovery rate of foreclosed portfolio loans is higher than those of
securitized loans.
Hypothesis 2: Compared to securitized loans, portfolio-held loans experience shorter time to
resolution.
Hypothesis 3: The capital recovery rate of foreclosed loans that are held in a portfolio is higher
than those of foreclosed loans that are privately securitized.
3. Data
The distressed commercial real estate data is from Real Capital Analytics (RCA).1 Since 2008,
RCA has tracked loan level and property level economic distress in the commercial real estate
markets. RCA identifies the troubled mortgages as in delinquency/default or maturity default and
records the date. The data track the performance and resolution of distressed loans. The
distressed status is updated across the lifecycle of a property. RCA data capture information
about property characteristics and loan characteristics at origination.
Our sample includes commercial mortgages that became troubled beginning with the first quarter
of 2008 and tracks the performance of those mortgages until the third quarter of 2012. We
include only the distressed loans that are securitized through private-label mortgage backed
securities, namely CMBS. We classify the resolution outcomes as restructure and liquidation.
Restructure includes loan refinancing, modification, extension and mezz takeover. Liquidation
includes foreclosure and sale through other practices, such as short sale and receivership sale.
1 We gratefully acknowledge Real Capital Analytics (RCA) for providing the distressed real estate data.
8
Foreclosure includes lender REOs, trustee sales and foreclosure post-sales.2 Our sample includes
11340 commercial mortgages that become troubled at some point during the study period. After
deleting observations where we cannot identify the lender and do not have loan or property
characteristics data at origination, our final sample includes 4075 distressed commercial
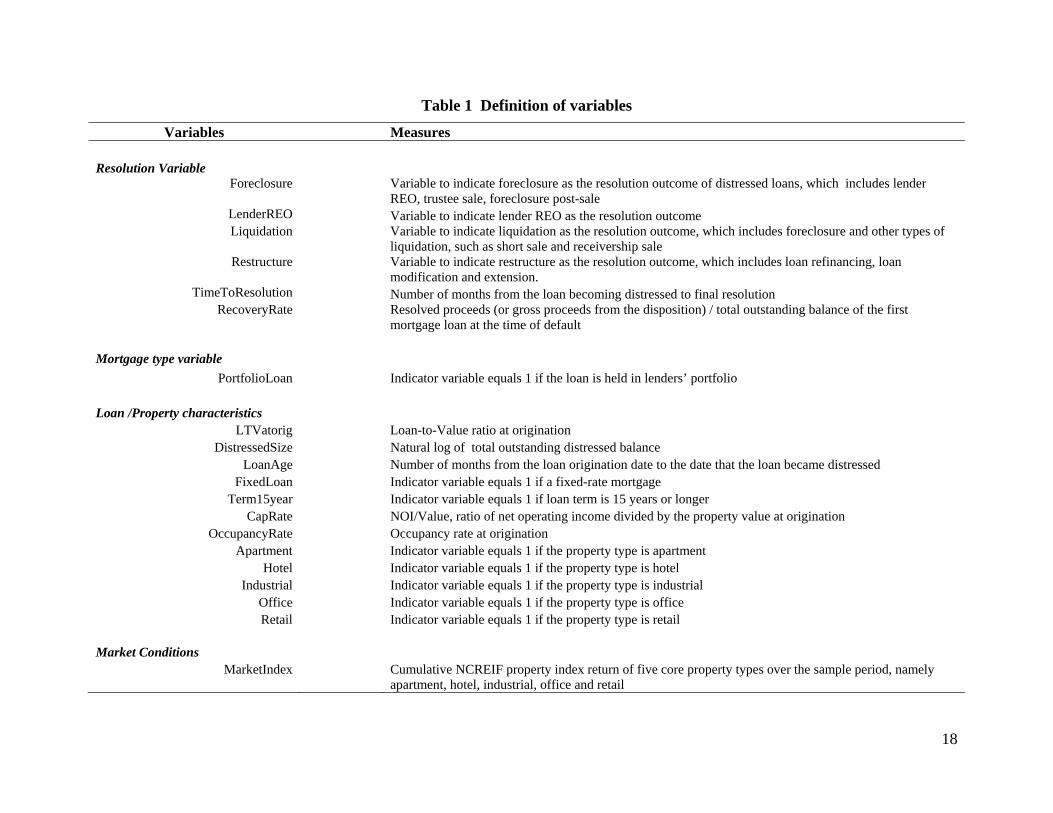
mortgages. Table 1 defines our set of variables.
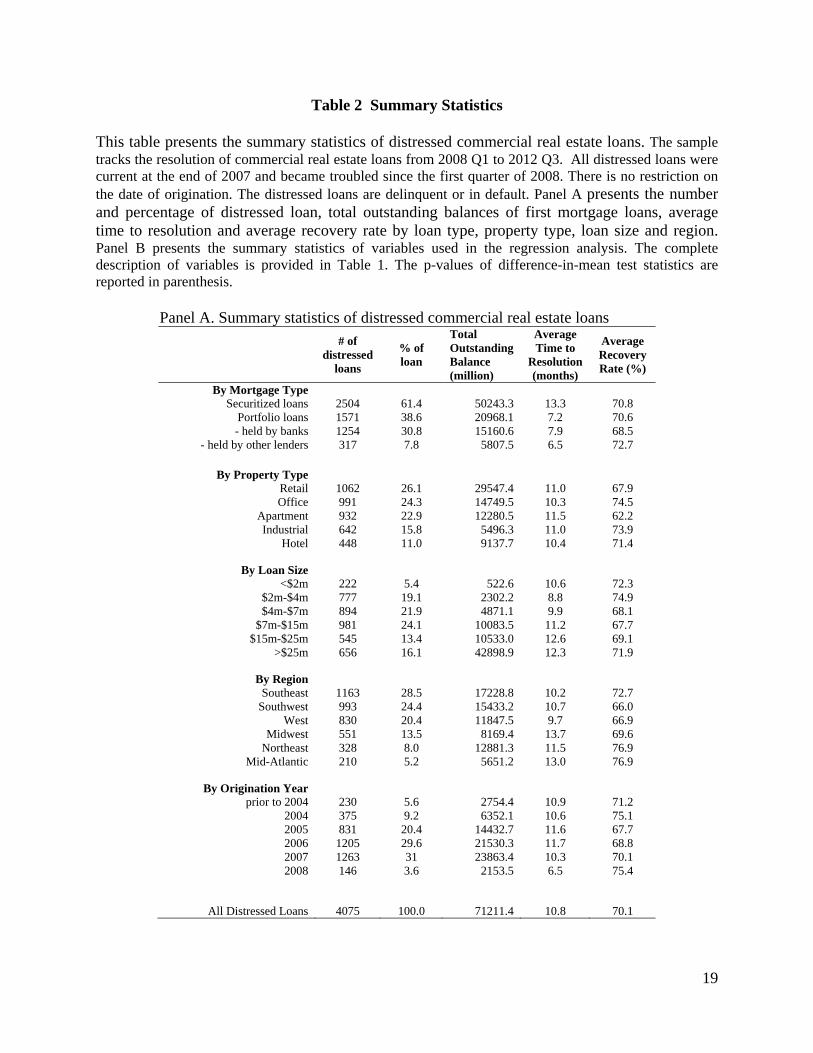
Table 2, Panel A reports the descriptive statistics of distressed commercial real estate loans
during the sample period of 2008 Q1 to 2012 Q3. We find that 61.4% of distressed commercial
loans in our sample are securitized, 30.8% are portfolio loans held by banks, 7.8% are portfolio
loans held by other private lenders, such as insurance companies, pension funds. Securitized
commercial mortgages show a larger scale of distress with a total outstanding balance of about
$50 billion. This compared to about $21 billion for commercial mortgages held in a portfolio.
About 26.1% and 24.3% of distressed commercial mortgages are secured by retail and office
properties, respectively. This equates to a total outstanding balance of distressed loans secured
by retail and office properties of $29.5 billion and $14.7 billion. In terms of regions, the
percentage of distressed commercial real estate loans is highest in the southeast and southwest
regions at 28.5% and 24.4%, respectively. The total outstanding balance of distressed loans is
about $17.2 billion in the southwest region and about $15.4 billion in the southeast region. About
50% of distressed loans in our sample are originated in years 2005 and 2006, immediately prior
to the recent crisis. The total outstanding balance of those distressed loans is over 35 billion.
Table 2 Panel A also presents the average time to resolution and average recovery rate in
different category. Time to resolution is calculated as the number of months from the loan
becoming troubled to final resolution, either as a restructure or liquidation. Recovery rate is the
resolved proceeds from sale, divided by total outstanding balance of the first mortgage loan at
the time of default. Securitized loans experience a longer time to resolution with an average time
2 RCA classifies the distress status into three major groups – Troubled, Restructured/Extension and Resolved. Troubled includes foreclosures, bankruptcy and Lender REO. Restructured is the status where the ownership or debt terms of the mortgage have changed but a long term solution to the cause of distress may not have been reached. Resolved is the status where properties have moved out of distress via refinancing or through a sale to a financially stable third party. However, their classification is rather broad. Hence, we reclassify the resolution outcome based on RCA’s internal comments for each loan.
9
to resolution of 13.3 months, compared to 7.2 months for portfolio loans. The average recovery
rate of securitized loans and portfolio loans are similar at about 70%. Among different property
types, distressed loans secured by office and hotel properties experience shorter time to reach
resolution at about 10 months and distressed loans secured by office and industrial properties
have higher average recovery rate at 74%. The distressed loans of properties in the Midwest
region have the longest time to resolution at 13.7 months while the distressed loans of properties
in the Northeast and Mid-Atlantic region show the highest recovery rate at 77%. We also find
that distressed loans originated in year 2005 and 2006 experience longest time to resolution, at
about 12 months. Distressed loans originated in year 2004 and 2008 have highest recovery rate at
about 75%.
Table 2 Panel B presents the summary statistics of all distressed commercial loans in our sample
and across securitized and portfolio loans. The table shows that during our sample period, the
percentage of distressed loans resolved through foreclosure (49%) or liquidation (56%) is
substantially higher than through restructure (6%). The difference-in-mean test statistics show a
significant difference in how distress is resolved across securitized and portfolio loans. The
percentage of portfolio loans resolved through foreclosure (59%) or liquidation (67%) is higher
than that of securitized loans, 42% and 49% respectively. The average time to resolution is 10.84
months and the average recovery rate is 70%. The difference-in-mean test statistics also confirms
the significant difference in time to resolution between securitized loans and portfolio loans.
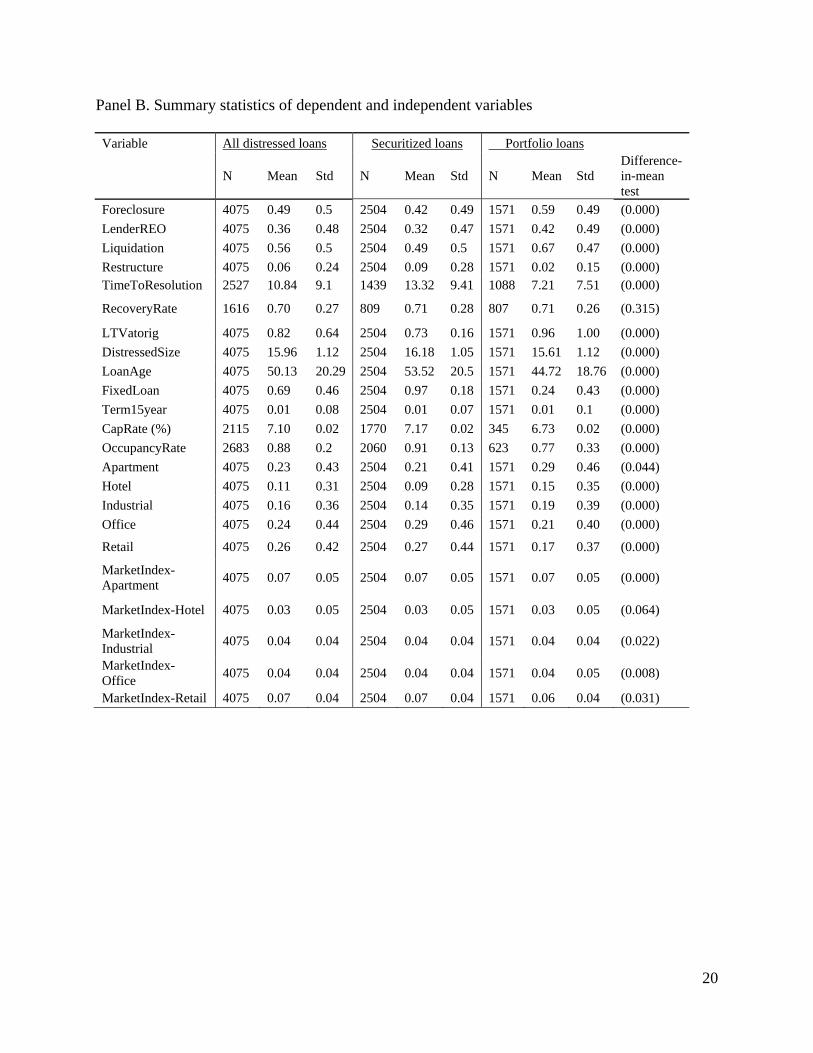
We control for the financial information of individual loans. DistressedSize is the outstanding
balance of the first mortgage. LoanAge is the number of months from origination to the start
date of the distressed cycle. Table 2 Panel B shows that the average loan-to-value ratio of
distressed loans in our sample is 21%. The average loan age is 50.13 months. About 59% of
distressed loans are fixed rate mortgages. The difference-in-mean test shows the significant
difference in loan characteristics between securitized loans and portfolio loans.
10
4. Empirical Analysis
Our goal is to investigate the role of securitization in the financial resolution of distressed
commercial mortgages. We explore this issue from two perspectives. First, we examine whether
differences in foreclosure rates of distressed loans depend on their securitization status.
Specifically, we test the relationship between securitization status and the likelihood of
foreclosure using a sample of distressed commercial real estate loans that are either portfolio-
held or securitized during the period of 2008 Q1 to 2012 Q3. Second, we analyze the impact of
securitization on the length of time to resolution and the capital recovery rate for foreclosed
loans. We discuss the empirical analyses and results in this section.
4.1 Resolution outcome across mortgage types and test windows
We begin the analysis by examining the percentage of different resolution outcomes across
distress time horizon and whether it is a portfolio loan or securitized. Table 3 presents summary
statistics about resolution outcomes of distressed loans by time elapsed since they became
troubled. Panel A shows the statistics for the entire sample. Panel B shows the statistics for
portfolio loans and securitized loans.
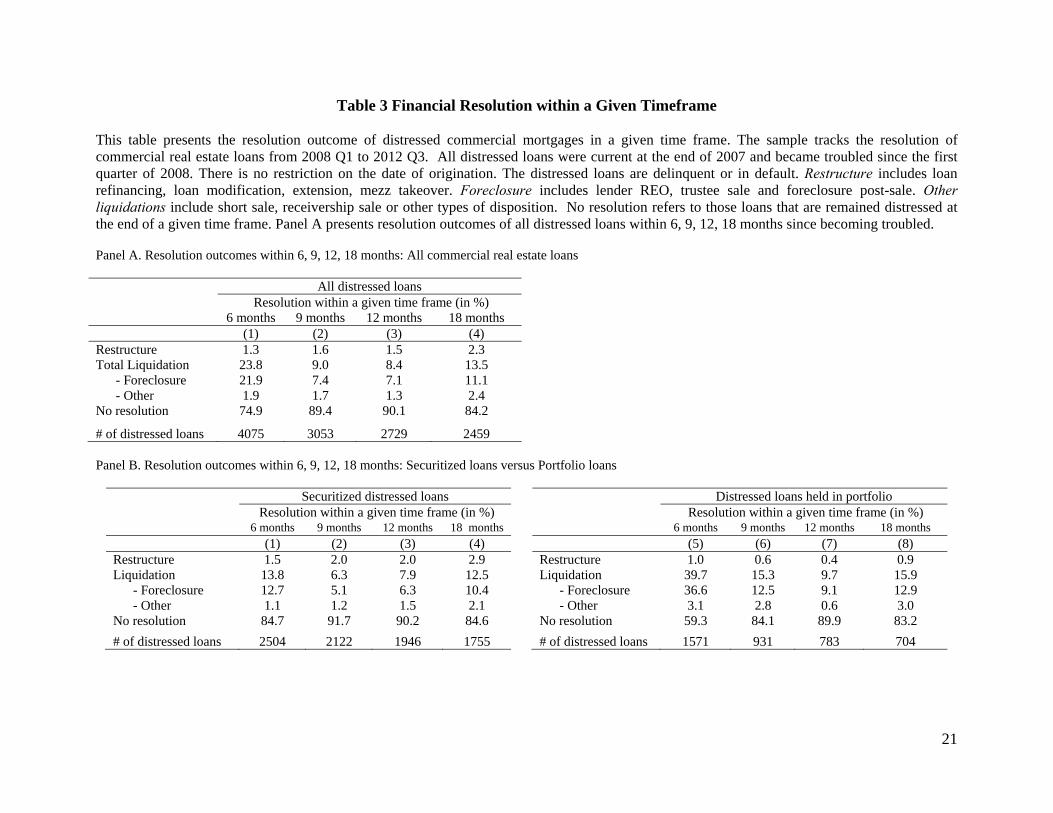
The results show that the most common resolution within the first 6 months of becoming
troubled is liquidation and, specifically, foreclosure. About 23.8% of distressed loans are
liquidated and 21.9% are foreclosed. The liquidation and foreclosure rate decrease significantly,
more than half, within the 9 months (9% and 7.4%) and 12 months (8.4% and 7.1%) of default.
Restructure takes place in about 1.3% of all cases within 6 months and remains low at about 1.6%
within 9 months and 1.5% within 12 months. Compared to previous literature based on
residential mortgage data (e.g. Agarwal et al, 2011), this restructure rate is particularly low.
Comparing securitized loans and portfolio loans, the likelihood of liquidation and foreclosure is
higher and the likelihood of restructure is lower for portfolio loans across all time frames. For
portfolio loans, it appears that the restructure rate is highest within 6 months and decreases with
the time. In contract, for securitized loans, the restructure rate is lowest within 6 months (1.5%)
and increases to 2.9% within 18 months. Previous literature in distressed debt workout points out
that negotiation appears to be easier when the debt is privately placed and owned by fewer
11
lenders. One possible reason is that it may be easier to negotiate with a portfolio lender in which
case requires less time to reach an agreement.
An interesting fact is that the percentage of distressed loans with no resolution is lower within 6
months and within 18 months. In addition, the rate of “no resolution” is lowest for portfolio loans
across all time frames, which may suggest that portfolio lenders take a more active approach to
resolve distress.
4.2 The determinants of resolution outcome
In this section, we examine the determinants of the financial resolution of distressed loans. We
employ a Probit approach to examine the relationship between securitization and the resolution
outcome, with a focus on foreclosure. The basic model setup is as follows:
Pr(R |distressed) ( + PortfolioLoan + control variables + ) i i i i i (1)
The dependent variable, Ri, is an indicator variable, which equals one if a distressed loan i is
liquidated or foreclosed. The explanatory variable of interest is PortfolioLoani, which is a
dichotomous variable to indicate whether a commercial loan is privately securitized or held in a
portfolio. The coefficient β would measure the marginal impact on the financial resolution of
distressed loans in the commercial real estate market. We include a set of control variables to
control for loan and property characteristics, including loan-to-value ratio, loan age, distressed
size, property type and year of origination dummies. We also include the cumulative NCREIF
property index return of the core property types over the sample period to control for market
conditions.
However, loans that are selected to be securitized could be systematically different from those
held in the portfolio. Hence, to control for the sample selection bias, following Ambrose, Capone
and Deng (2001) and Cheng and Deng (2013), we employ the Heckman 2-stage approach. In the
first stage, we regress a securitization indicator in a sample of all loans (securitized and portfolio
loans) on a set of loan and property characteristics at the time of origination, and estimate the

12
inverse Mills ratio.3 In the second stage, we include the inverse Mills ratio from the first-stage
model as an additional explanatory variable in the model. Heckman (1976) shows that including
the inverse Mills ratio in the second-stage estimation corrects the sample selection bias and
provides more consistent estimates of the parameters.
The empirical results are presented in Table 4. In the analysis, we estimate model (1) across the
entire sample period and within a given time frame. Columns (1) to (3) show the results of the
determinants of liquidation. Columns (4) to (6) show the results of the determinants of
foreclosure. Columns (7) to (9) show the results of the determinants of lender REO. All models
show that the coefficient on the portfolio loan variable is significantly positive at the 1% level,
which suggests that portfolio loans have a significantly greater likelihood of liquidation and
foreclosure. The portfolio loans are more likely to be foreclosed instead of restructured. Our
results are contradictory to previous evidence based on a sample of residential mortgages, e.g.
Agarwal (2011) and Piskorski et al. (2010). They find that foreclosures are less likely to take
place for portfolio loans than securitized loans which were sold to investors. Our results suggest
that distressed commercial mortgages are managed differently in the commercial real estate
market as compared to the residential real estate market.
The regressions also present evidence about other factors affecting the likelihood of foreclosure.
We find that distressed loans with larger distress sizes and more seasoning (i.e., longer time from
origination) are less like to be foreclosed. Distressed loans with fixed rates are more likely to be
foreclosed. In terms of property type, distressed loans secured by apartment properties are more
likely to be foreclosed while distressed loans secured by hotel properties are less likely to be
foreclosed. In addition, the likelihood of foreclosure is lower when the market is better.
3 In the first stage, we run a probit model to examine the determinants of commercial loans selected to be securitized. We find evidence that banks are less likely to secure loans than nonbanks. which is consistent with Gonas, Highfield and Mullineaux (2004). We also find a lower incidence of securitization on larger loans, which is consistent with Boot, Thakor and Udell (1991). The empirical results are available upon request.
13
4.3 Time to resolution and recovery rate
We further examine whether securitization affects the time to resolution and the capital recovery
rate of distressed loans in the commercial real estate market. Time to resolution is calculated as
number of months from the loans becoming distressed to final resolution. The recovery rate is
calculated as the resolved transaction amount or gross proceeds from the disposition divided by
the total outstanding balance of the first mortgage loan at the time of default.
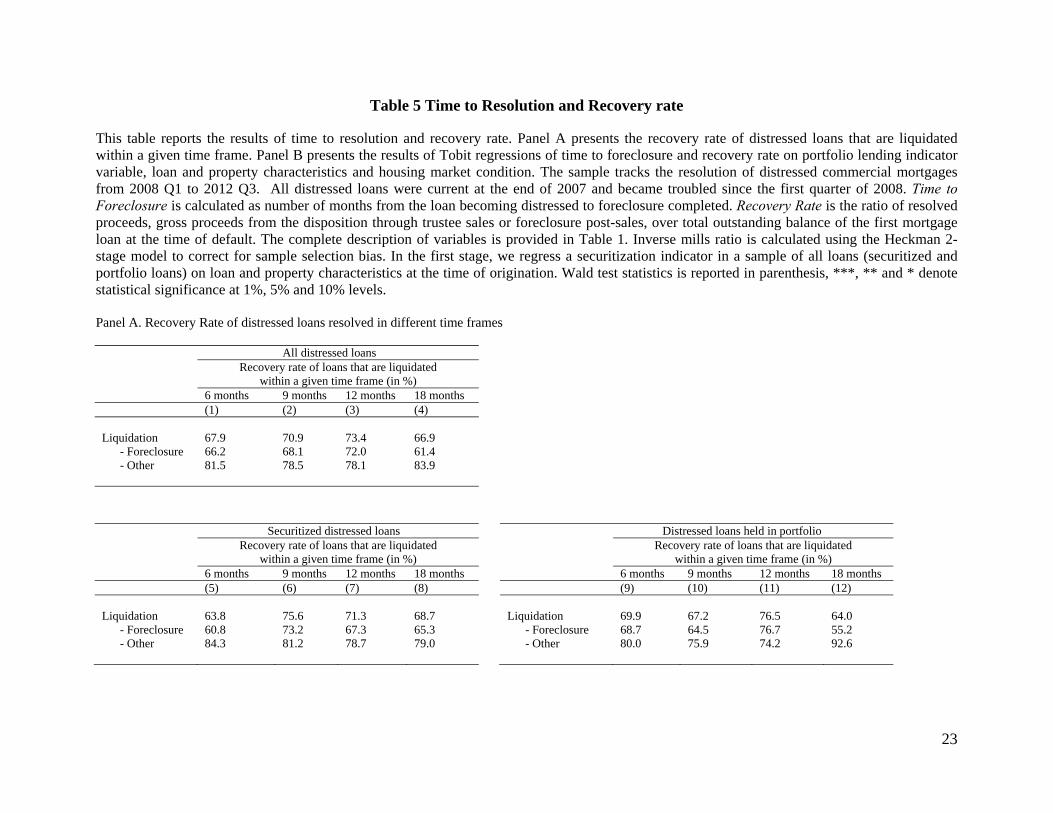
Table 5, Panel A presents the recovery rate of distressed loans foreclosed within 6, 9, 12, 18
months from becoming troubled. The results show that the recovery rate of foreclosed portfolio
loans is higher than those of securitized loans across all time frames. The recovery rate of the
loans that are resolved within 9 and 12 months is higher than those resolved within 6 and 18
months.
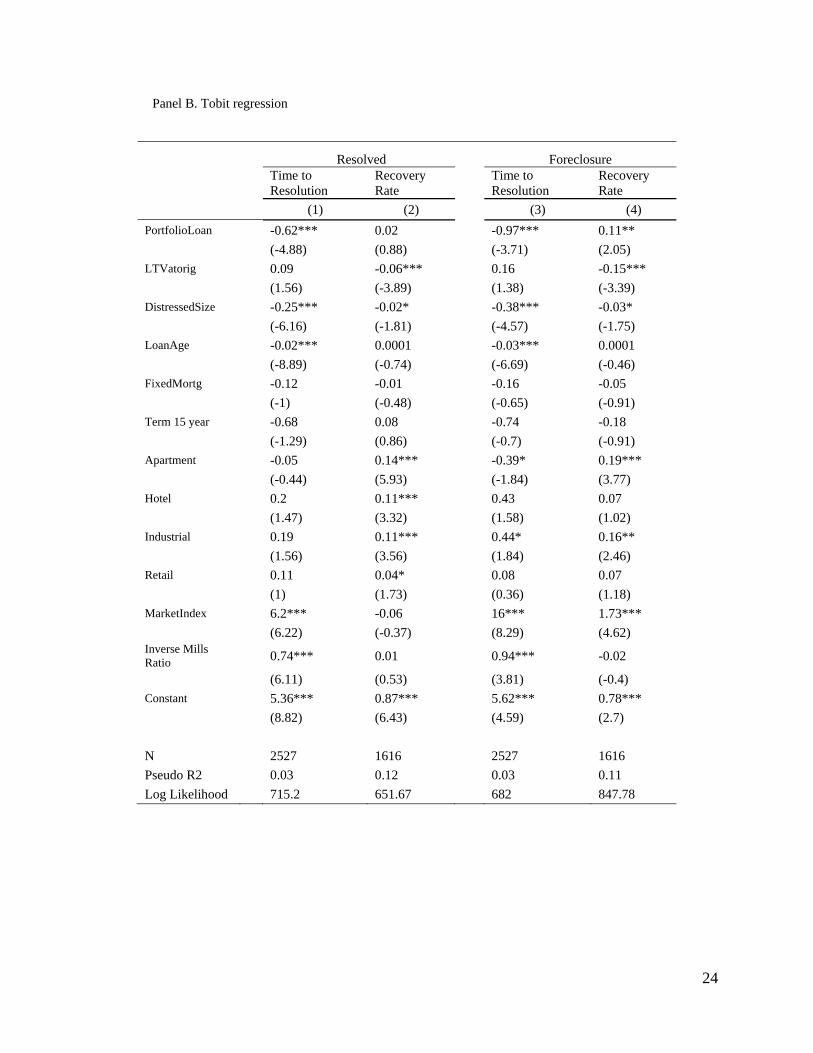
Furthermore, we employ a Tobit regression approach to examine the impact of securitization on
time to resolution and recovery rate for all resolved loans and loans that are foreclosed. Column
(1) and (3) in Table 5, Panel B show that the coefficients of portfolio loan indicator variables are
significantly negative, which suggest that it takes longer for a securitized loan to reach resolution
in the distress cycle. As discussed previously, there are several reasons that may cause a longer
resolution period. Column (2) and (4) in Table 5, Panel B show that securitization has a
significant impact on the recovery rate of foreclosed loans, but not on the recovery rate of loans
with other resolution outcomes. In foreclosure, the recovery rate of portfolio loans is higher than
those of securitized loans. The results in Table 5, Panel B indicate that portfolio loans experience
shorter time and higher recovery during the foreclosure process, which is consistent with our
hypothesis 2 and hypothesis 3.
For the control variables, we find that the time to resolution is shorter for larger loans and more
seasoned loans. The time to resolution of distressed loans secured by apartment properties is
shorter and the time to resolution of distressed loans secured by industrial properties is longer,
compared to other property types. The recovery rate is lower for a distressed loan with higher
loan-to-value ratio at origination.
14
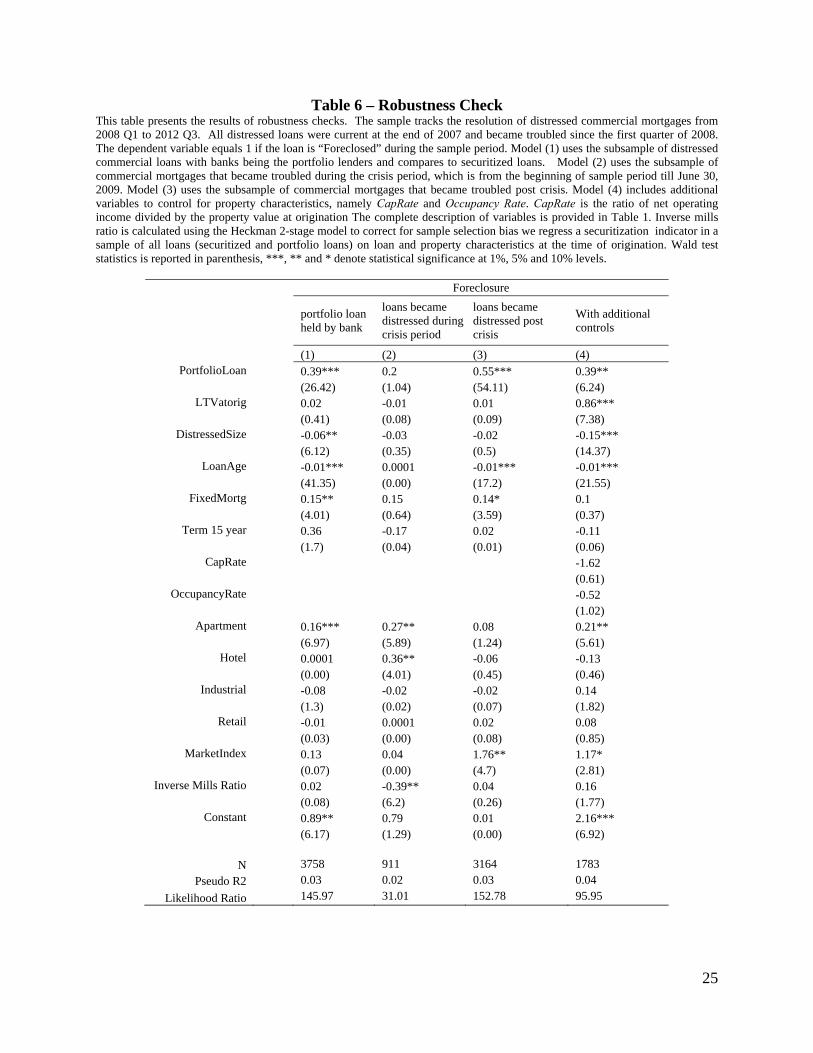
4.3 Robustness check
We run several robustness tests. The results are reported in Table 6. We begin with Column (4)
of Table 6 where we include two additional control variables, namely capitalization rate and
occupancy rate at origination. The results in Column (4) show that the coefficient on portfolio
loan indicator variable is positive and significant. Next we turn to the first three columns. Here
we use a subsample of portfolio loans held by banks. The results show that loans held in a bank’s
portfolio are more likely to be foreclosed upon relative to other loans. Next, we run regressions
using the subsamples of distressed loans that became troubled during the crisis period (prior to
June 30, 2009) and those that started the distress cycle post crisis. The higher foreclosure rate on
bank-held commercial mortgages suggests that the resolution outcome is less likely to be driven
by bank’s unwillingness to recognize losses and other institutional reasons. We find no
significant relationship between securitization and the likelihood of foreclosure for loans that
became distressed during the crisis period. But the positive relationship between portfolio
lending and the likelihood of foreclosure holds post crisis.
5. Conclusion
This paper seeks to shed new light on how securitization impacts the financial resolution of
distressed loans in the commercial real estate market. The empirical analysis utilizes a large and
unique data set of distressed commercial mortgages for securitized and portfolio loans. The data
set is constructed based on the recent financial crisis and includes a diverse set of lenders. The
main hypotheses address the impact of securitization on resolution outcome, time to resolution
and capital recovery rates.
We find that portfolio loans are more likely to be foreclosed upon relative to securitized loans.
We also find that portfolio loans experience shorter time to resolution and higher recovery rate in
the foreclosure process. The study is intended to contribute to the growing literature on
distressed asset resolution and to provide new perspectives on agents at the nexus of real estate
and capital market decisions.

15
Reference
Adelino, M., Gerardi, K., P. Willen, 2013. “Why Don’t Lenders Renegotiate More Home Mortgages? Redefaults, Self-Cures and Securitization,” Journal of Monetary Economics 60:835-853. Agarwal, S., G. Amromin, I. Ben-David, S. Chomsisengphet, and D. D. Evanoff, 2011. “The Role of Securitization in Mortgage Renegotiation.” The Journal of Financial Economics 102(3): 559-578. Ambrose, B.W., and A.B. Sanders. 2003. Commercial Mortgage-backed Securities: Prepayment and Default. Journal of Real Estate Finance and Economics 26(2-3): 179-196. Ambrose, B.W., A. B. Sanders, and A. Yavas. 2010. Special Servicers and Adverse Selection in Informed Intermediation: Theory and Evidence. Pennsylvania State University, Institute for Real Estate Studies Working Paper. An, X., Y. Deng and S. Gabriel. 2011. Asymmetric Information, Adverse Selection, and the Pricing of CMBS. Journal of Financial Economics, 100 (2): 304-325. Boot, A. W. A., A. V. Thakor and G. F. Udell, 1991. “Secured Lending and Default Risk: Equilibrium Analysis, Policy Implications and Empirical Results”, Economic Journal, 101: 458-72. Brown, D., 2000. Liquidity and Liquidation: Evidence from Real Estate Investment Trusts. Journal of Finance, LV(1): 469-485. Brown, D., B. Ciochetti, and T. Riddiough. 2006. Theory and Evidence on the Resolution of Financial Distress. Review of Financial Studies 19: 1357-1397. Chen, J. and Y. Deng . 2012. Commercial Mortgage Workout Strategy and Conditional Default Probability: Evidence from Special Serviced CMBS Loans. Journal of Real Estate Finance and Economics 46: 609-632. Ciochetti, B. and T. Riddiough. 1998. Timing, Loss Recovery and Economic Performance of Foreclosed Commercial Mortgages. working paper. Crockett, J.H., 1990. Workouts, Deep Pockets, and Fire Sales: An Analysis of Distressed Real Estate. AREUEA Journal, 18(1): 76-90. Gonas, J. S., Highfield, M., & Mullineaux, D., 2004. When are Commerical Loans Secured? Financial Review, 39 (1): 79-99.
16
Fan, G.Z., S.E. Ong, and T.F. Sing. 2006. Moral Hazard, Effort Sensitivity and Compensation in Asset-Backed Securitization. Journal of Real Estate Finance and Economics, 32: 229-251. Foote, Chris, Kris Gerardi, Lorenz Goette, and Paul Willen, 2009. Reducing Foreclosures: No Easy Answers. NBER Macroeconomics Annual 24, 89-138. Gan, Y. H. and C. Mayer. 2006. Agency Conflicts, Asset Substitution, and Securitization. NBER working Paper. Harding, J.P. and C.F. Sirmans. 2002. Renegotiation of Troubled Debt: The Choice Between Discounted Payoff and Maturity Extension. Real Estate Economics 30(3): 475-503. Liu, P. and D. Quan. 2011. Foreclosure of Securitized Commercial Mortgages – A Model of the Special Servicer. Journal of Real Estate Finance and Economics,46 : 321-338. Piskorski, T., A. Seru, and V. Vig, 2010. “Securitization and distressed loan renegotiation: Evidence from the subprime mortgage crisis,” Journal of Financial Economics 97(3): 360– 397. Riddiough, T.J., and S.B. Wyatt. 1994. Strategic Default, Workout, and Commercial Mortgage Valuation. Journal of Real Estate Finance and Economics 9: 5-22.
17
Fig. 1 Financial resolution of distressed loans
Distressed loans
Restructure
Current
Liquidation Remain distressed
Refinancing Modification Extension
Foreclosure Lender REO Trustee sale Foreclosure post-sale
Other liquidations Short sale Receivership sale
Current
Restructure
Liquidation
Continue
18
Table 1 Definition of variables
Variables Measures
Resolution Variable Foreclosure Variable to indicate foreclosure as the resolution outcome of distressed loans, which includes lender
REO, trustee sale, foreclosure post-sale LenderREO Variable to indicate lender REO as the resolution outcome Liquidation
Variable to indicate liquidation as the resolution outcome, which includes foreclosure and other types of liquidation, such as short sale and receivership sale
Restructure
Variable to indicate restructure as the resolution outcome, which includes loan refinancing, loan modification and extension.
TimeToResolution Number of months from the loan becoming distressed to final resolution RecoveryRate
Resolved proceeds (or gross proceeds from the disposition) / total outstanding balance of the first mortgage loan at the time of default
Mortgage type variable PortfolioLoan Indicator variable equals 1 if the loan is held in lenders’ portfolio
Loan /Property characteristics LTVatorig Loan-to-Value ratio at origination
DistressedSize Natural log of total outstanding distressed balance LoanAge Number of months from the loan origination date to the date that the loan became distressed
FixedLoan Indicator variable equals 1 if a fixed-rate mortgage Term15year Indicator variable equals 1 if loan term is 15 years or longer
CapRate NOI/Value, ratio of net operating income divided by the property value at origination OccupancyRate Occupancy rate at origination
Apartment Indicator variable equals 1 if the property type is apartment Hotel Indicator variable equals 1 if the property type is hotel
Industrial Indicator variable equals 1 if the property type is industrial Office Indicator variable equals 1 if the property type is office Retail Indicator variable equals 1 if the property type is retail
Market Conditions
MarketIndex
Cumulative NCREIF property index return of five core property types over the sample period, namely apartment, hotel, industrial, office and retail
19
Table 2 Summary Statistics
This table presents the summary statistics of distressed commercial real estate loans. The sample tracks the resolution of commercial real estate loans from 2008 Q1 to 2012 Q3. All distressed loans were current at the end of 2007 and became troubled since the first quarter of 2008. There is no restriction on the date of origination. The distressed loans are delinquent or in default. Panel A presents the number and percentage of distressed loan, total outstanding balances of first mortgage loans, average time to resolution and average recovery rate by loan type, property type, loan size and region. Panel B presents the summary statistics of variables used in the regression analysis. The complete description of variables is provided in Table 1. The p-values of difference-in-mean test statistics are reported in parenthesis. Panel A. Summary statistics of distressed commercial real estate loans
# of distressed
loans
% of loan
Total Outstanding Balance (million)
Average Time to
Resolution (months)
Average Recovery Rate (%)
By Mortgage Type Securitized loans 2504 61.4 50243.3 13.3 70.8
Portfolio loans 1571 38.6 20968.1 7.2 70.6 - held by banks 1254 30.8 15160.6 7.9 68.5 - held by other lenders 317 7.8 5807.5 6.5 72.7
By Property Type
Retail 1062 26.1 29547.4 11.0 67.9 Office 991 24.3 14749.5 10.3 74.5
Apartment 932 22.9 12280.5 11.5 62.2 Industrial 642 15.8 5496.3 11.0 73.9
Hotel 448 11.0 9137.7 10.4 71.4
By Loan Size <$2m 222 5.4 522.6 10.6 72.3
$2m-$4m 777 19.1 2302.2 8.8 74.9 $4m-$7m 894 21.9 4871.1 9.9 68.1
$7m-$15m 981 24.1 10083.5 11.2 67.7 $15m-$25m 545 13.4 10533.0 12.6 69.1
>$25m 656 16.1 42898.9 12.3 71.9
By Region Southeast 1163 28.5 17228.8 10.2 72.7
Southwest 993 24.4 15433.2 10.7 66.0 West 830 20.4 11847.5 9.7 66.9
Midwest 551 13.5 8169.4 13.7 69.6 Northeast 328 8.0 12881.3 11.5 76.9
Mid-Atlantic 210 5.2 5651.2 13.0 76.9
By Origination Year prior to 2004 230 5.6 2754.4 10.9 71.2
2004 375 9.2 6352.1 10.6 75.1 2005 831 20.4 14432.7 11.6 67.7 2006 1205 29.6 21530.3 11.7 68.8 2007 1263 31 23863.4 10.3 70.1 2008 146 3.6 2153.5 6.5 75.4
All Distressed Loans 4075 100.0 71211.4 10.8 70.1
20
Panel B. Summary statistics of dependent and independent variables Variable All distressed loans Securitized loans Portfolio loans
N Mean Std N Mean Std N Mean Std Difference- in-mean test
Foreclosure 4075 0.49 0.5 2504 0.42 0.49 1571 0.59 0.49 (0.000)
LenderREO 4075 0.36 0.48 2504 0.32 0.47 1571 0.42 0.49 (0.000)
Liquidation 4075 0.56 0.5 2504 0.49 0.5 1571 0.67 0.47 (0.000)
Restructure 4075 0.06 0.24 2504 0.09 0.28 1571 0.02 0.15 (0.000) TimeToResolution 2527 10.84 9.1 1439 13.32 9.41 1088 7.21 7.51 (0.000)
RecoveryRate 1616 0.70 0.27 809 0.71 0.28 807 0.71 0.26 (0.315)
LTVatorig 4075 0.82 0.64 2504 0.73 0.16 1571 0.96 1.00 (0.000)
DistressedSize 4075 15.96 1.12 2504 16.18 1.05 1571 15.61 1.12 (0.000)
LoanAge 4075 50.13 20.29 2504 53.52 20.5 1571 44.72 18.76 (0.000)
FixedLoan 4075 0.69 0.46 2504 0.97 0.18 1571 0.24 0.43 (0.000)
Term15year 4075 0.01 0.08 2504 0.01 0.07 1571 0.01 0.1 (0.000)
CapRate (%) 2115 7.10 0.02 1770 7.17 0.02 345 6.73 0.02 (0.000)
OccupancyRate 2683 0.88 0.2 2060 0.91 0.13 623 0.77 0.33 (0.000)
Apartment 4075 0.23 0.43 2504 0.21 0.41 1571 0.29 0.46 (0.044)
Hotel 4075 0.11 0.31 2504 0.09 0.28 1571 0.15 0.35 (0.000)
Industrial 4075 0.16 0.36 2504 0.14 0.35 1571 0.19 0.39 (0.000)
Office 4075 0.24 0.44 2504 0.29 0.46 1571 0.21 0.40 (0.000)
Retail 4075 0.26 0.42 2504 0.27 0.44 1571 0.17 0.37 (0.000)
MarketIndex-Apartment
4075 0.07 0.05 2504 0.07 0.05 1571 0.07 0.05 (0.000)
MarketIndex-Hotel 4075 0.03 0.05 2504 0.03 0.05 1571 0.03 0.05 (0.064)
MarketIndex-Industrial
4075 0.04 0.04 2504 0.04 0.04 1571 0.04 0.04 (0.022)
MarketIndex-Office
4075 0.04 0.04 2504 0.04 0.04 1571 0.04 0.05 (0.008)
MarketIndex-Retail 4075 0.07 0.04 2504 0.07 0.04 1571 0.06 0.04 (0.031)
21
Table 3 Financial Resolution within a Given Timeframe This table presents the resolution outcome of distressed commercial mortgages in a given time frame. The sample tracks the resolution of commercial real estate loans from 2008 Q1 to 2012 Q3. All distressed loans were current at the end of 2007 and became troubled since the first quarter of 2008. There is no restriction on the date of origination. The distressed loans are delinquent or in default. Restructure includes loan refinancing, loan modification, extension, mezz takeover. Foreclosure includes lender REO, trustee sale and foreclosure post-sale. Other liquidations include short sale, receivership sale or other types of disposition. No resolution refers to those loans that are remained distressed at the end of a given time frame. Panel A presents resolution outcomes of all distressed loans within 6, 9, 12, 18 months since becoming troubled. Panel A. Resolution outcomes within 6, 9, 12, 18 months: All commercial real estate loans All distressed loans
Resolution within a given time frame (in %) 6 months 9 months 12 months 18 months (1) (2) (3) (4) Restructure 1.3 1.6 1.5 2.3 Total Liquidation 23.8 9.0 8.4 13.5 - Foreclosure 21.9 7.4 7.1 11.1 - Other 1.9 1.7 1.3 2.4 No resolution 74.9 89.4 90.1 84.2
# of distressed loans 4075 3053 2729 2459 Panel B. Resolution outcomes within 6, 9, 12, 18 months: Securitized loans versus Portfolio loans
Securitized distressed loans Distressed loans held in portfolio
Resolution within a given time frame (in %) Resolution within a given time frame (in %) 6 months 9 months 12 months 18 months 6 months 9 months 12 months 18 months (1) (2) (3) (4) (5) (6) (7) (8) Restructure 1.5 2.0 2.0 2.9 Restructure 1.0 0.6 0.4 0.9 Liquidation 13.8 6.3 7.9 12.5 Liquidation 39.7 15.3 9.7 15.9 - Foreclosure 12.7 5.1 6.3 10.4 - Foreclosure 36.6 12.5 9.1 12.9 - Other 1.1 1.2 1.5 2.1 - Other 3.1 2.8 0.6 3.0 No resolution 84.7 91.7 90.2 84.6 No resolution 59.3 84.1 89.9 83.2
# of distressed loans 2504 2122 1946 1755 # of distressed loans 1571 931 783 704

22
Table 4 Determinants of Resolution Outcome
This table presents the maximum-likelihood parameter estimates from the Probit regression of resolution outcome on the portfolio lending indicator variable, loan and property characteristics and housing market condition. The sample tracks the resolution of distressed commercial mortgages from 2008 Q1 to 2012 Q3. All distressed loans were current at the end of 2007 and became troubled since the first quarter of 2008. The dependent variable equals 1 if the distressed loan is “Liquidated”, “Foreclosed” or becomes “Lender REO” during the sample period, within 6 or 12 months from the start of distress cycle. The complete description of variables is provided in Table 1. Inverse mills ratio is calculated using the Heckman 2-stage model to correct for sample selection bias. we regress a securitization indicator in a sample of all loans (securitized and portfolio loans) on loan and property characteristics at the time of origination. Wald test statistics is reported in parenthesis, ***, ** and * denote statistical significance at 1%, 5% and 10% levels.
Liquidation Foreclosure LenderREO
All within 6 months
within 12 months All
within 6 months
within 12 months All
within 6 months
within 12 months
(1) (2) (3) (4) (5) (6) (7) (8) (9) PortfolioLoan 0.52*** 0.89*** 0.46*** 0.46*** 0.86*** 0.46*** 0.3*** 0.69*** 0.37***
(56.07) (147.25 (22.03) (45.14) (136.36 (19.94) (19.24) (79.78) (10.86) LTVatorig 0.01 -0.01 0.01 0.0001 -0.02 0.02 0.05 0.0001 0.05
(0.09) (0.14) (0.03) (0.00) (0.41) (0.17) (2.01) (0.01) (1.25) DistressedSize -0.05** -0.03 0.0001 -0.04* -0.04* 0.01 -0.08*** -0.11*** -0.02
(3.99) (1.96) (0.01) (2.81) (3.02) (0.03) (12.91) (16.06) (0.21) LoanAge -0.01*** 0.0001** 0.0001 -0.01*** 0.0001** 0.0001 -0.01*** 0.0001 0.0001
(63.32) (14.71) (0.71) (39.91) (14.7) (0.27) (43.4) (0.71) (1.97) FixedMortg 0.19*** 0.16** 0.12 0.16** 0.14** 0.08 0.14** 0.12 0.15
(7.44) (5.05) (1.39) (5.34) (4.04) (0.68) (4.23) (2.45) (1.91) Term 15 year 0.26 0.3 0.09 -0.04 0.04 -0.07 -0.27 -0.15 -0.2
(0.93) (1.32) (0.06) (0.02) (0.02) (0.03) (1.05) (0.26) (0.17) Apartment 0.26*** 0.1 0.32*** 0.14** 0.08 0.18** -0.05 0.01 0.01
(18.37) (2.25) (15.44) (6.01) (1.58) (4.52) (0.58) (0.02) (0.02) Hotel -0.05 -0.19** 0.07 -0.04 -0.22** -0.06 0.09 -0.19** 0.01
(0.45) (5.06) (0.45) (0.31) (6.16) (0.23) (1.4) (4.42) (0.00) Industrial -0.11 -0.26*** 0.2** -0.07 -0.25*** 0.19** 0.03 -0.2** 0.19*
(2.67) (11.74) (4.57) (1.02) (10.57) (4.26) (0.22) (6.15) (3.68) Retail -0.03 -0.05 0.08 -0.02 -0.02 0.1 0.04 0.04 0.09
(0.27) (0.46) (0.99) (0.12) (0.12) (1.23) (0.37) (0.25) (1.03) MarketIndex -3.03*** -3.16*** -2.54*** -0.02 -1.69*** -0.59 2.53*** -0.13 0.4
(40.77) (40.66) (17.57) (0.00) (11.16) (0.82) (29.64) (0.06) (0.31) Inverse Mills
Ratio 0.08 -0.24*** 0.04 0.0001 -0.21*** 0.02 0.07 -0.07 0.03 (1.43) (11.22) (0.24) (0.01) (8.63) (0.04) (1.07) (0.77) (0.1)
Constant 1*** -0.45 -1.37*** 0.58* -0.44 -1.53*** 0.82** (1.07) -1.29** (8.43) (1.4) (8.49) (2.97) (1.31) (9.52) (5.68) 0.41 (5.79)
N 4075 4075 3053 4075 4075 3053 4075 4075 3053 Pseudo R2 0.05 0.1 0.03 0.03 0.09 0.02 0.03 0.06 0.01
Likelihood Ratio 289.08 442.83 79.78 176.25 382.99 54.64 133.98 229.07 28.78
23
Table 5 Time to Resolution and Recovery rate This table reports the results of time to resolution and recovery rate. Panel A presents the recovery rate of distressed loans that are liquidated within a given time frame. Panel B presents the results of Tobit regressions of time to foreclosure and recovery rate on portfolio lending indicator variable, loan and property characteristics and housing market condition. The sample tracks the resolution of distressed commercial mortgages from 2008 Q1 to 2012 Q3. All distressed loans were current at the end of 2007 and became troubled since the first quarter of 2008. Time to Foreclosure is calculated as number of months from the loan becoming distressed to foreclosure completed. Recovery Rate is the ratio of resolved proceeds, gross proceeds from the disposition through trustee sales or foreclosure post-sales, over total outstanding balance of the first mortgage loan at the time of default. The complete description of variables is provided in Table 1. Inverse mills ratio is calculated using the Heckman 2-stage model to correct for sample selection bias. In the first stage, we regress a securitization indicator in a sample of all loans (securitized and portfolio loans) on loan and property characteristics at the time of origination. Wald test statistics is reported in parenthesis, ***, ** and * denote statistical significance at 1%, 5% and 10% levels. Panel A. Recovery Rate of distressed loans resolved in different time frames
All distressed loans Recovery rate of loans that are liquidated
within a given time frame (in %) 6 months 9 months 12 months 18 months (1) (2) (3) (4) Liquidation 67.9 70.9 73.4 66.9 - Foreclosure 66.2 68.1 72.0 61.4 - Other 81.5 78.5 78.1 83.9
Securitized distressed loans Distressed loans held in portfolio
Recovery rate of loans that are liquidated within a given time frame (in %)
Recovery rate of loans that are liquidated within a given time frame (in %)
6 months 9 months 12 months 18 months 6 months 9 months 12 months 18 months (5) (6) (7) (8) (9) (10) (11) (12) Liquidation 63.8 75.6 71.3 68.7 Liquidation 69.9 67.2 76.5 64.0 - Foreclosure 60.8 73.2 67.3 65.3 - Foreclosure 68.7 64.5 76.7 55.2 - Other 84.3 81.2 78.7 79.0 - Other 80.0 75.9 74.2 92.6
24
Panel B. Tobit regression
Resolved Foreclosure
Time to Resolution
Recovery Rate
Time to Resolution
Recovery Rate
(1) (2) (3) (4)
PortfolioLoan -0.62*** 0.02 -0.97*** 0.11**
(-4.88) (0.88) (-3.71) (2.05)
LTVatorig 0.09 -0.06*** 0.16 -0.15***
(1.56) (-3.89) (1.38) (-3.39)
DistressedSize -0.25*** -0.02* -0.38*** -0.03*
(-6.16) (-1.81) (-4.57) (-1.75)
LoanAge -0.02*** 0.0001 -0.03*** 0.0001
(-8.89) (-0.74) (-6.69) (-0.46)
FixedMortg -0.12 -0.01 -0.16 -0.05
(-1) (-0.48) (-0.65) (-0.91)
Term 15 year -0.68 0.08 -0.74 -0.18
(-1.29) (0.86) (-0.7) (-0.91)
Apartment -0.05 0.14*** -0.39* 0.19***
(-0.44) (5.93) (-1.84) (3.77)
Hotel 0.2 0.11*** 0.43 0.07
(1.47) (3.32) (1.58) (1.02)
Industrial 0.19 0.11*** 0.44* 0.16**
(1.56) (3.56) (1.84) (2.46)
Retail 0.11 0.04* 0.08 0.07
(1) (1.73) (0.36) (1.18)
MarketIndex 6.2*** -0.06 16*** 1.73***
(6.22) (-0.37) (8.29) (4.62) Inverse Mills Ratio 0.74*** 0.01 0.94*** -0.02
(6.11) (0.53) (3.81) (-0.4)
Constant 5.36*** 0.87*** 5.62*** 0.78***
(8.82) (6.43) (4.59) (2.7)
N 2527 1616 2527 1616
Pseudo R2 0.03 0.12 0.03 0.11
Log Likelihood 715.2 651.67 682 847.78
25
Table 6 – Robustness Check This table presents the results of robustness checks. The sample tracks the resolution of distressed commercial mortgages from 2008 Q1 to 2012 Q3. All distressed loans were current at the end of 2007 and became troubled since the first quarter of 2008. The dependent variable equals 1 if the loan is “Foreclosed” during the sample period. Model (1) uses the subsample of distressed commercial loans with banks being the portfolio lenders and compares to securitized loans. Model (2) uses the subsample of commercial mortgages that became troubled during the crisis period, which is from the beginning of sample period till June 30, 2009. Model (3) uses the subsample of commercial mortgages that became troubled post crisis. Model (4) includes additional variables to control for property characteristics, namely CapRate and Occupancy Rate. CapRate is the ratio of net operating income divided by the property value at origination The complete description of variables is provided in Table 1. Inverse mills ratio is calculated using the Heckman 2-stage model to correct for sample selection bias we regress a securitization indicator in a sample of all loans (securitized and portfolio loans) on loan and property characteristics at the time of origination. Wald test statistics is reported in parenthesis, ***, ** and * denote statistical significance at 1%, 5% and 10% levels.
Foreclosure
portfolio loan held by bank
loans became distressed during crisis period
loans became distressed post crisis
With additional controls
(1) (2) (3) (4) PortfolioLoan 0.39*** 0.2 0.55*** 0.39**
(26.42) (1.04) (54.11) (6.24) LTVatorig 0.02 -0.01 0.01 0.86***
(0.41) (0.08) (0.09) (7.38) DistressedSize -0.06** -0.03 -0.02 -0.15***
(6.12) (0.35) (0.5) (14.37) LoanAge -0.01*** 0.0001 -0.01*** -0.01***
(41.35) (0.00) (17.2) (21.55) FixedMortg 0.15** 0.15 0.14* 0.1
(4.01) (0.64) (3.59) (0.37) Term 15 year 0.36 -0.17 0.02 -0.11
(1.7) (0.04) (0.01) (0.06) CapRate -1.62
(0.61) OccupancyRate -0.52
(1.02) Apartment 0.16*** 0.27** 0.08 0.21**
(6.97) (5.89) (1.24) (5.61) Hotel 0.0001 0.36** -0.06 -0.13
(0.00) (4.01) (0.45) (0.46) Industrial -0.08 -0.02 -0.02 0.14
(1.3) (0.02) (0.07) (1.82) Retail -0.01 0.0001 0.02 0.08
(0.03) (0.00) (0.08) (0.85) MarketIndex 0.13 0.04 1.76** 1.17*
(0.07) (0.00) (4.7) (2.81) Inverse Mills Ratio 0.02 -0.39** 0.04 0.16
(0.08) (6.2) (0.26) (1.77) Constant 0.89** 0.79 0.01 2.16***
(6.17) (1.29) (0.00) (6.92)
N 3758 911 3164 1783
Pseudo R2 0.03 0.02 0.03 0.04
Likelihood Ratio 145.97 31.01 152.78 95.95


