Community Resilience and Vulnerability
ZOOM MeetingAugust 07, 20201:30-3:30 p.m.
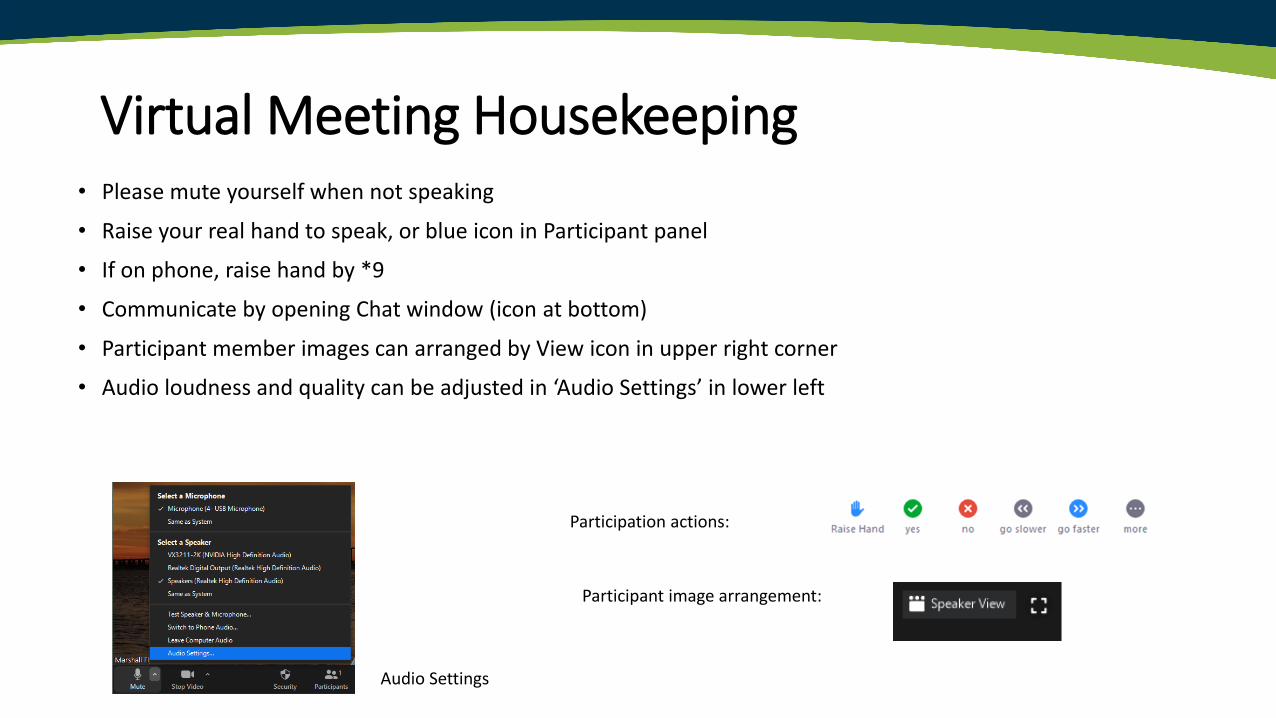
Virtual Meeting Housekeeping• Please mute yourself when not speaking
• Raise your real hand to speak, or blue icon in Participant panel
• If on phone, raise hand by *9
• Communicate by opening Chat window (icon at bottom)
• Participant member images can arranged by View icon in upper right corner
• Audio loudness and quality can be adjusted in ‘Audio Settings’ in lower left
Audio Settings
Participation actions:
Participant image arrangement:
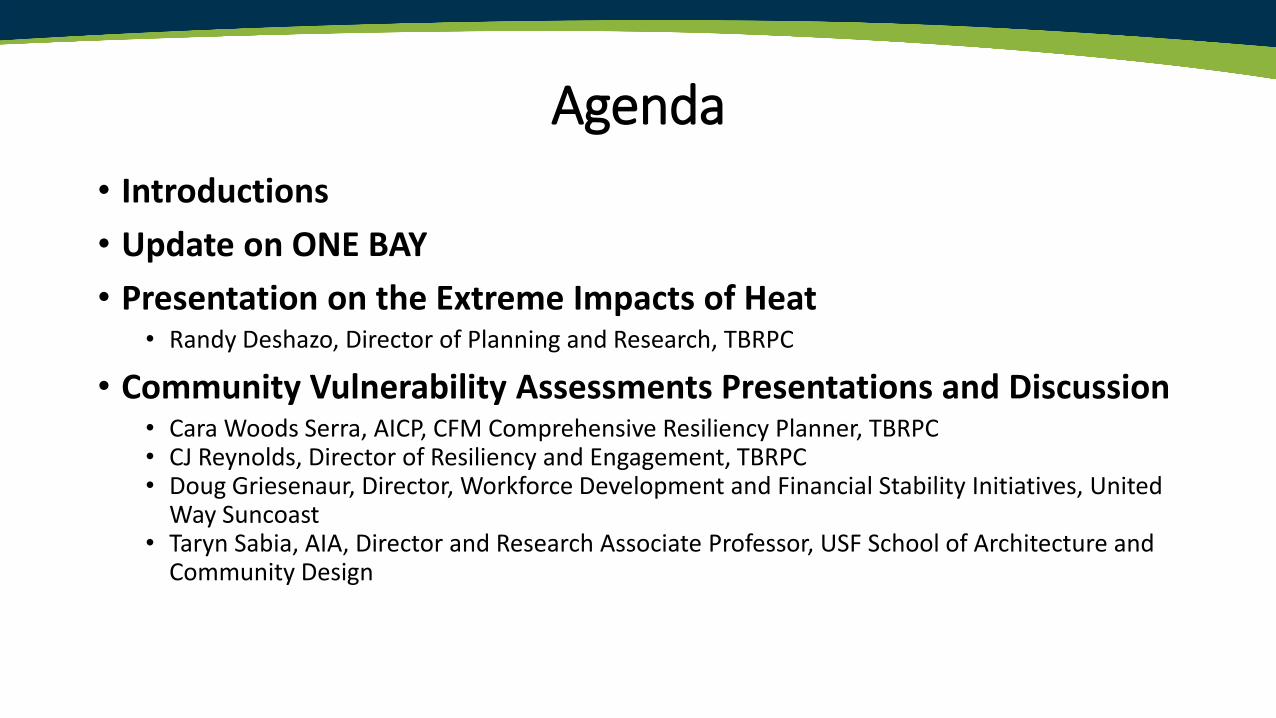
Agenda
• Introductions
• Update on ONE BAY
• Presentation on the Extreme Impacts of Heat• Randy Deshazo, Director of Planning and Research, TBRPC
• Community Vulnerability Assessments Presentations and Discussion• Cara Woods Serra, AICP, CFM Comprehensive Resiliency Planner, TBRPC• CJ Reynolds, Director of Resiliency and Engagement, TBRPC• Doug Griesenaur, Director, Workforce Development and Financial Stability Initiatives, United
Way Suncoast• Taryn Sabia, AIA, Director and Research Associate Professor, USF School of Architecture and
Community Design
New Role for ONE BAY
• Catalyst for emerging topics of regional interest
• Define needs and new resources
• Collect input on programs and projects
Extreme Impacts of HeatRandy Deshazo, Director of Planning and Research
The Cost of Doing Nothing: Climate Change and the Tampa Bay EconomyAn Update on Heat Mortality
Randy Deshazo, Director of Planning + Research, TBRPCOne Bay Meeting, August 7, 2020
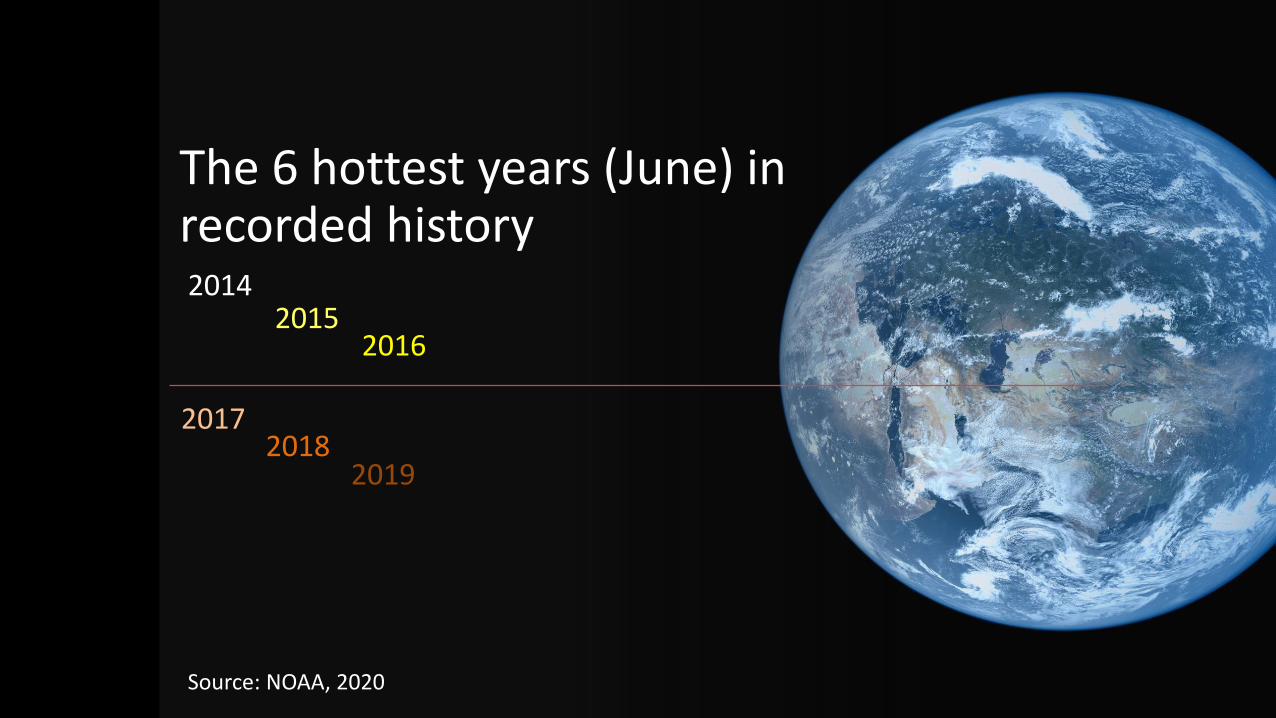
The 6 hottest years (June) in recorded history2014
20152016
20172018
2019
Source: NOAA, 2020
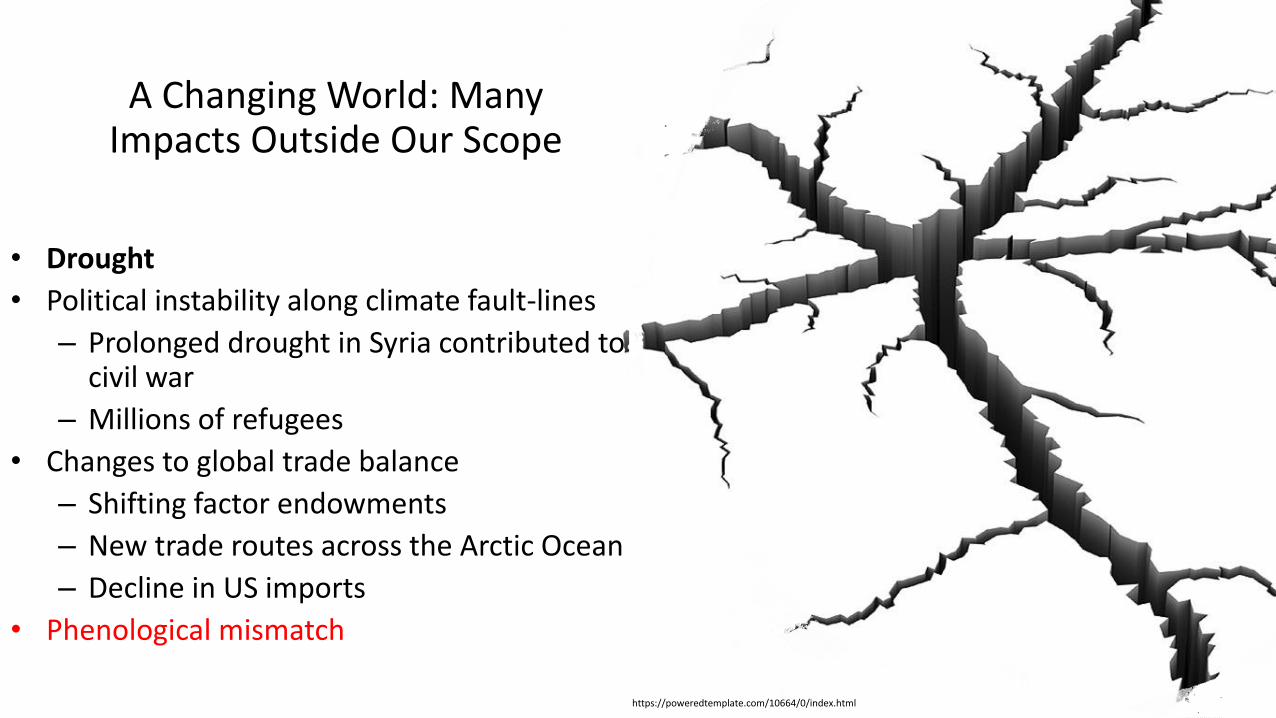
A Changing World: Many Impacts Outside Our Scope
• Drought
• Political instability along climate fault-lines
– Prolonged drought in Syria contributed to civil war
– Millions of refugees
• Changes to global trade balance
– Shifting factor endowments
– New trade routes across the Arctic Ocean
– Decline in US imports
• Phenological mismatch
https://poweredtemplate.com/10664/0/index.html
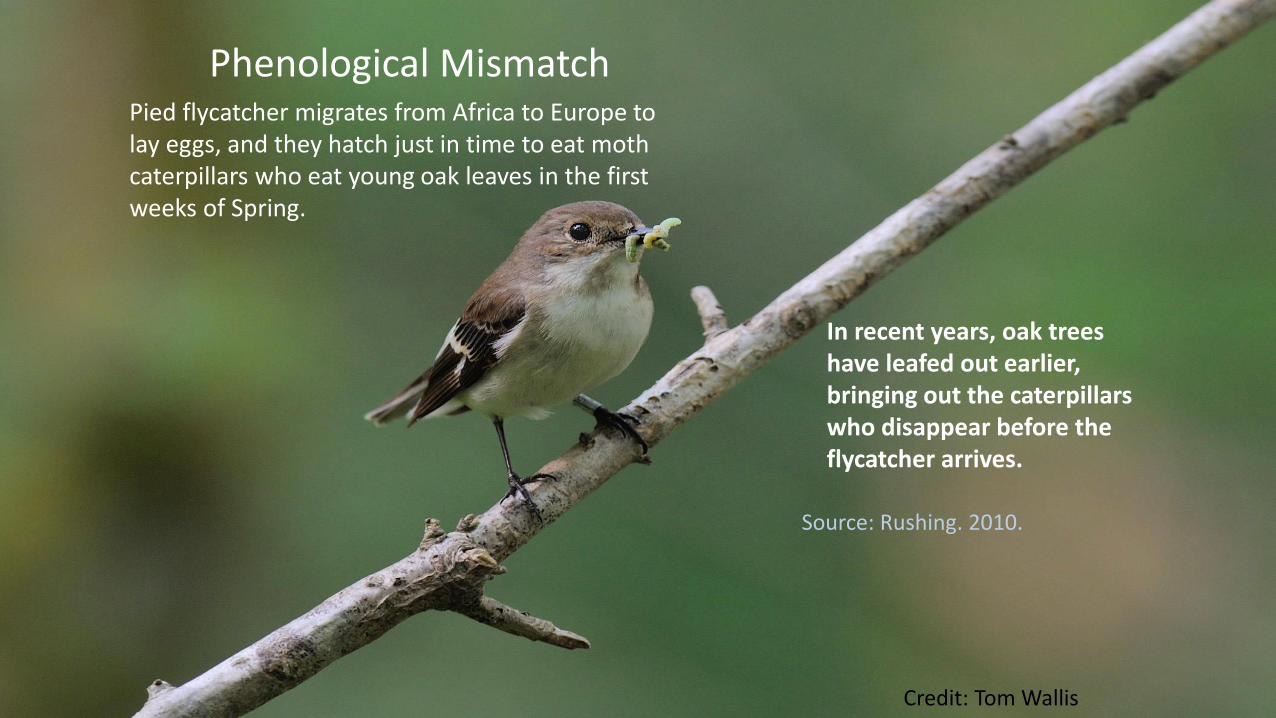
Phenological MismatchPhenological Mismatch
Credit: Tom Wallis
Pied flycatcher migrates from Africa to Europe to lay eggs, and they hatch just in time to eat moth caterpillars who eat young oak leaves in the first weeks of Spring.
In recent years, oak trees have leafed out earlier, bringing out the caterpillars who disappear before the flycatcher arrives.
Source: Rushing. 2010.
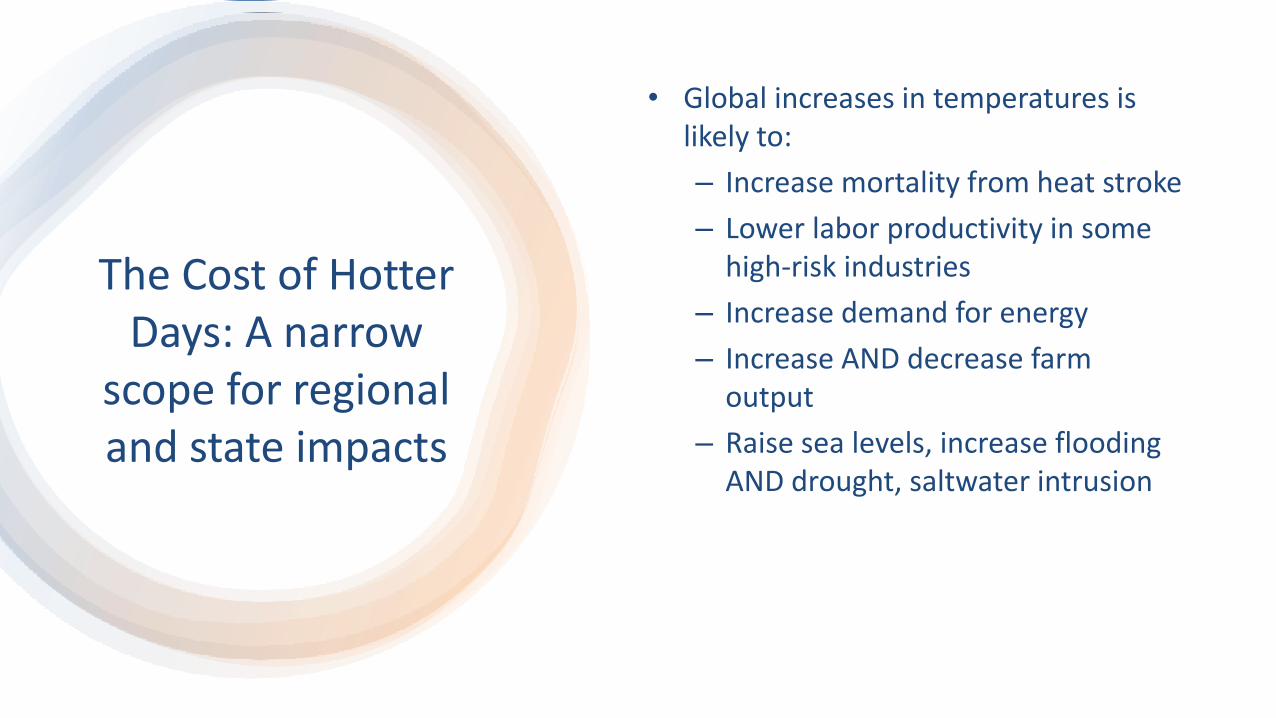
The Cost of Hotter Days: A narrow
scope for regional and state impacts
• Global increases in temperatures is likely to:
– Increase mortality from heat stroke
– Lower labor productivity in some high-risk industries
– Increase demand for energy
– Increase AND decrease farm output
– Raise sea levels, increase flooding AND drought, saltwater intrusion
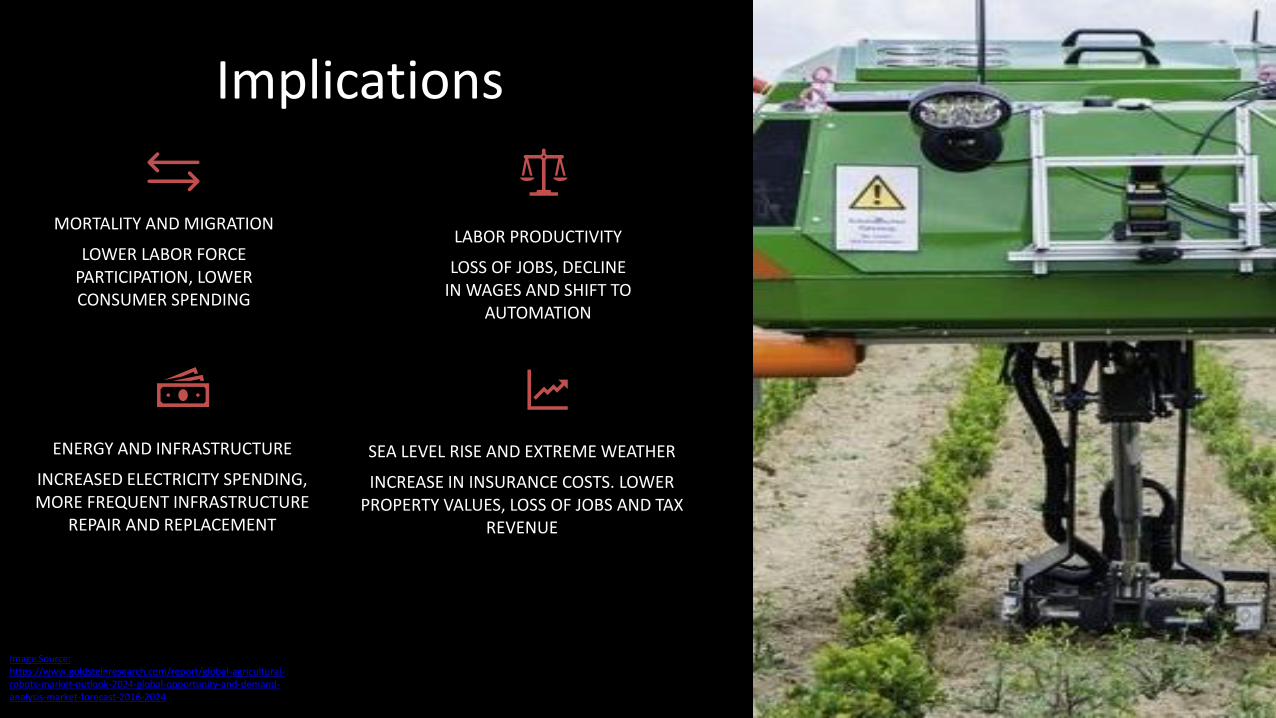
Implications
MORTALITY AND MIGRATION
LOWER LABOR FORCE PARTICIPATION, LOWER CONSUMER SPENDING
LABOR PRODUCTIVITY
LOSS OF JOBS, DECLINE IN WAGES AND SHIFT TO
AUTOMATION
ENERGY AND INFRASTRUCTURE
INCREASED ELECTRICITY SPENDING, MORE FREQUENT INFRASTRUCTURE
REPAIR AND REPLACEMENT
SEA LEVEL RISE AND EXTREME WEATHER
INCREASE IN INSURANCE COSTS. LOWER PROPERTY VALUES, LOSS OF JOBS AND TAX
REVENUE
Image Source: https://www.goldsteinresearch.com/report/global-agricultural-robots-market-outlook-2024-global-opportunity-and-demand-analysis-market-forecast-2016-2024
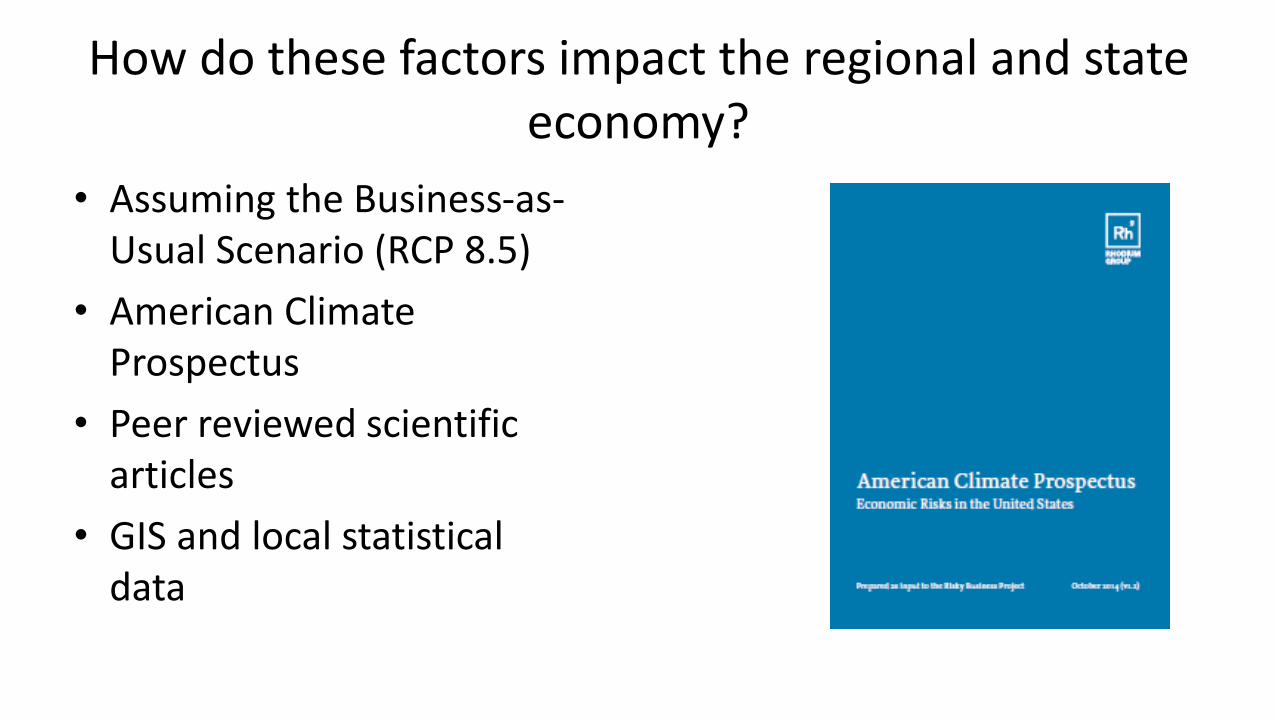
How do these factors impact the regional and state economy?
• Assuming the Business-as-Usual Scenario (RCP 8.5)
• American Climate Prospectus
• Peer reviewed scientific articles
• GIS and local statistical data
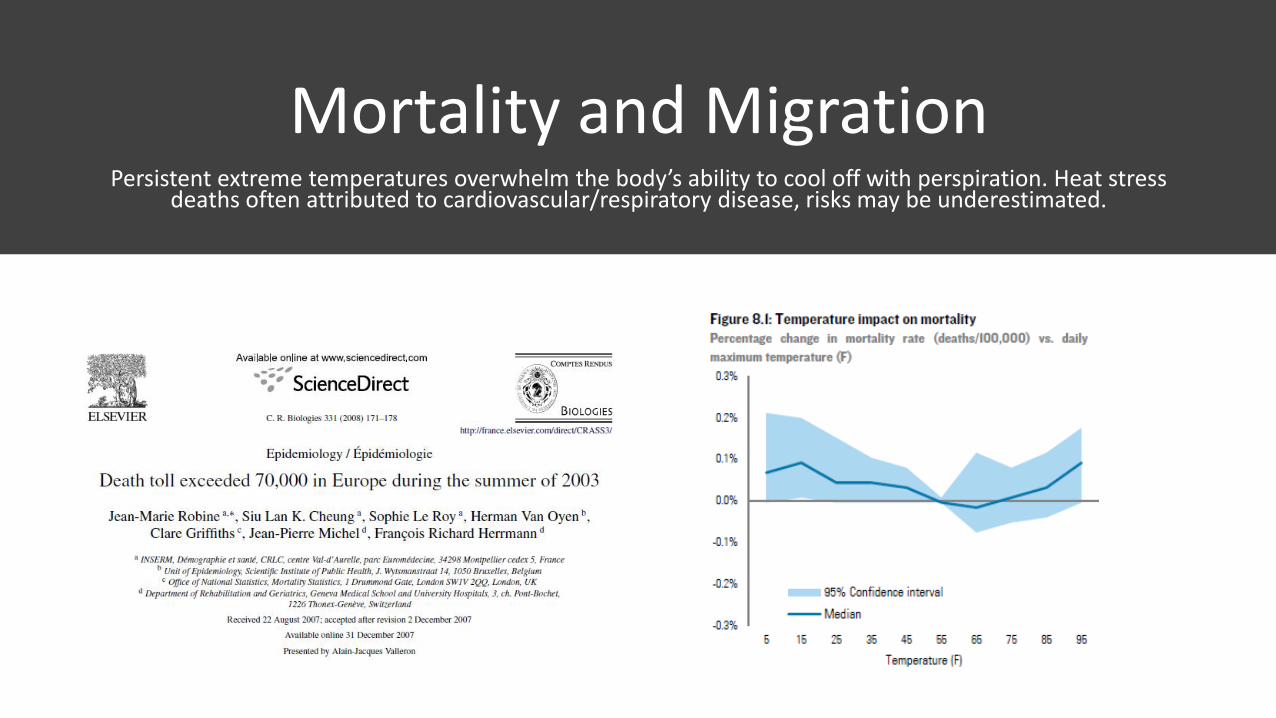
Mortality and MigrationPersistent extreme temperatures overwhelm the body’s ability to cool off with perspiration. Heat stress
deaths often attributed to cardiovascular/respiratory disease, risks may be underestimated.
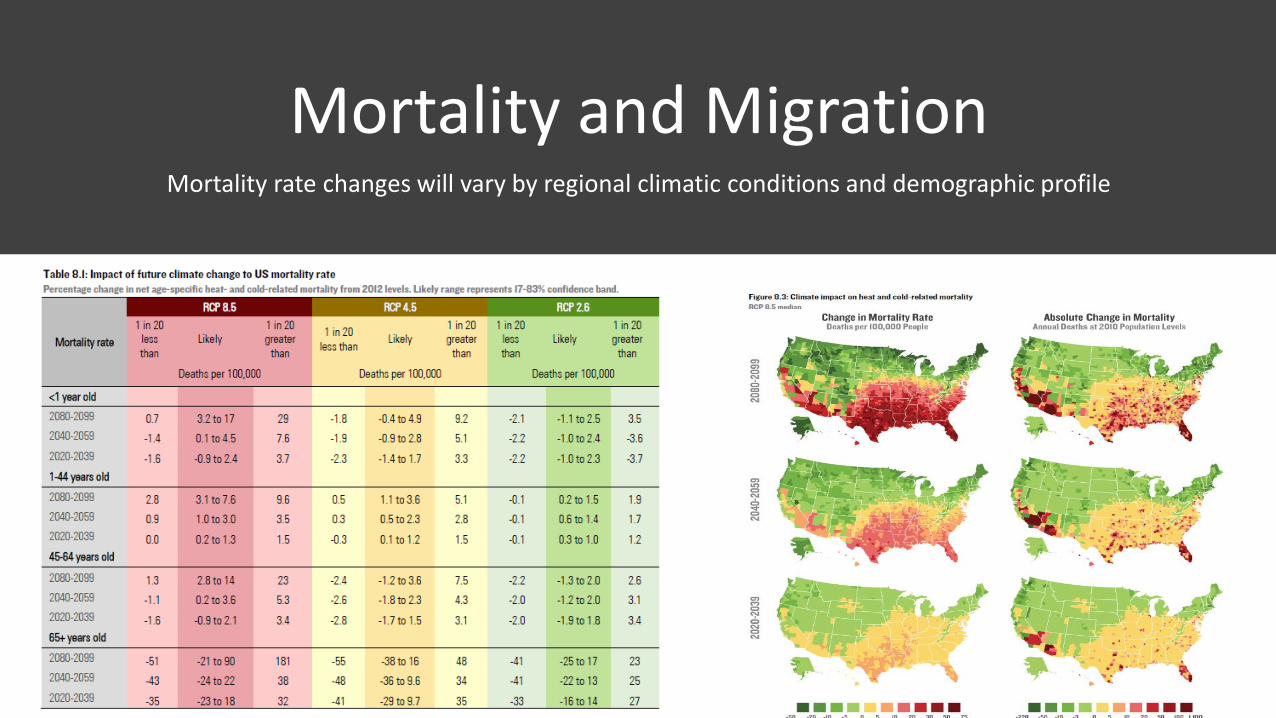
Mortality and MigrationMortality rate changes will vary by regional climatic conditions and demographic profile
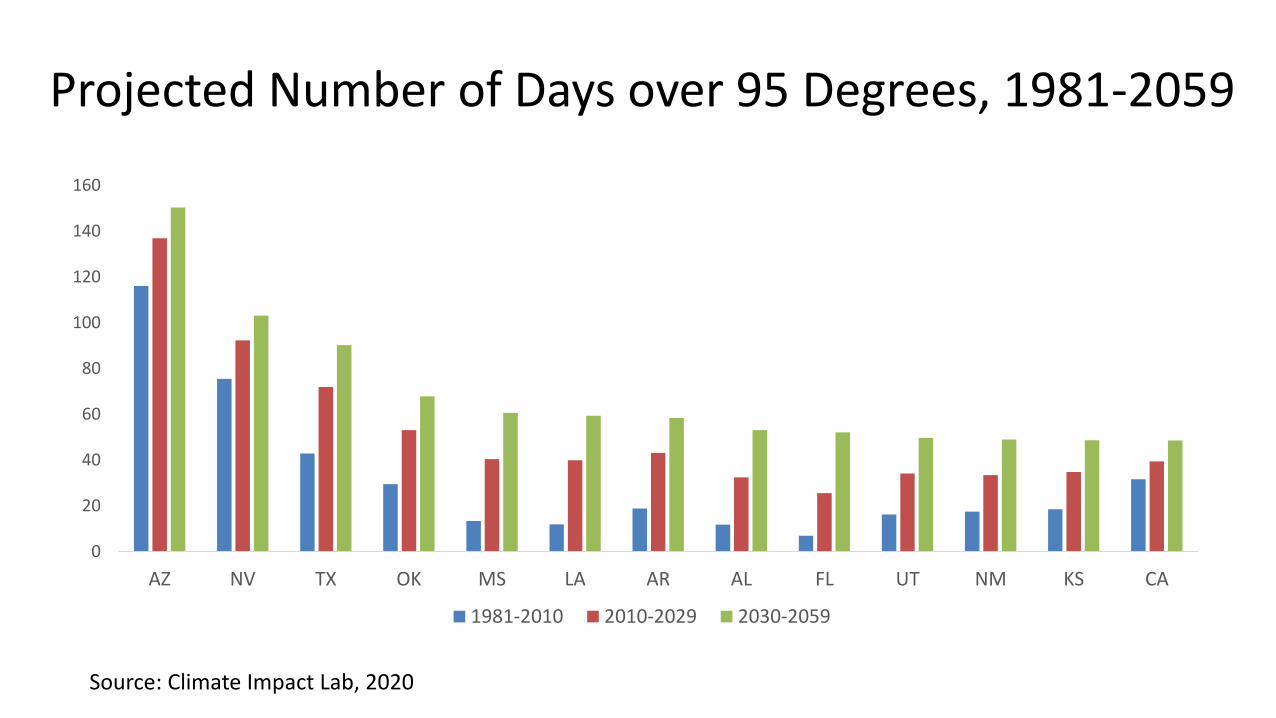
Projected Number of Days over 95 Degrees, 1981-2059
0
20
40
60
80
100
120
140
160
AZ NV TX OK MS LA AR AL FL UT NM KS CA
1981-2010 2010-2029 2030-2059
Source: Climate Impact Lab, 2020
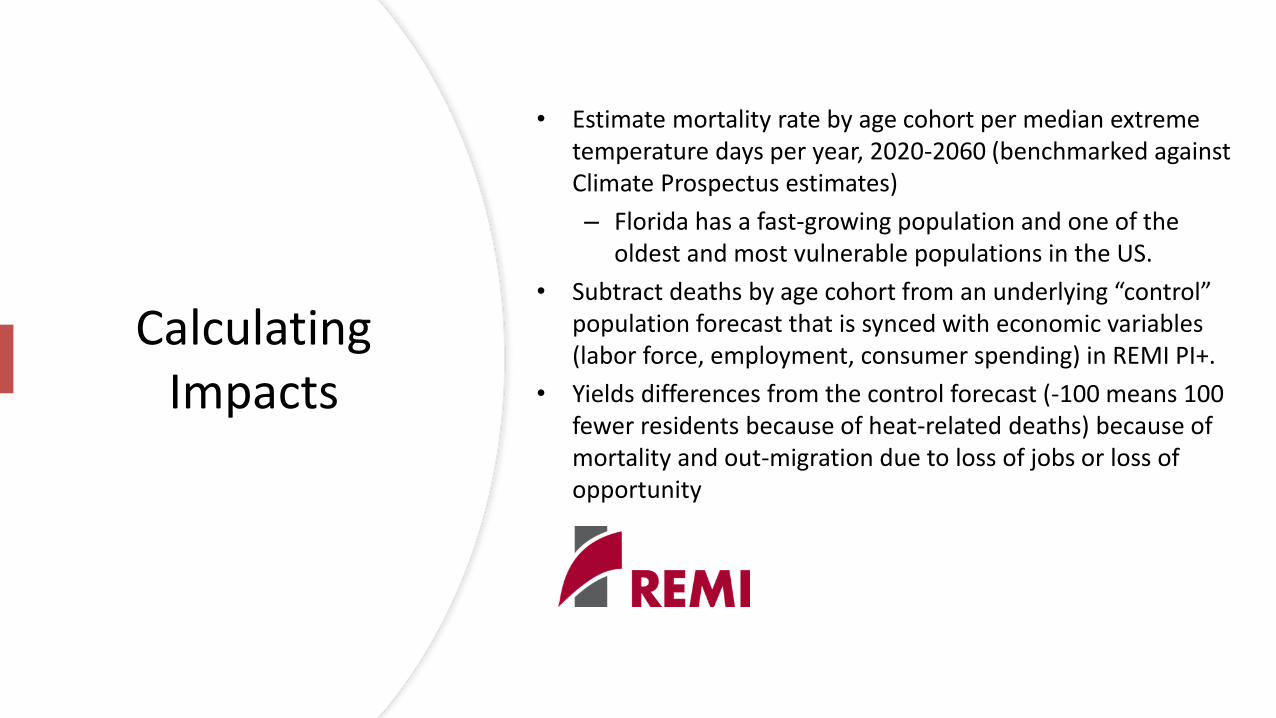
Calculating Impacts
• Estimate mortality rate by age cohort per median extreme temperature days per year, 2020-2060 (benchmarked against Climate Prospectus estimates)
– Florida has a fast-growing population and one of the oldest and most vulnerable populations in the US.
• Subtract deaths by age cohort from an underlying “control” population forecast that is synced with economic variables (labor force, employment, consumer spending) in REMI PI+.
• Yields differences from the control forecast (-100 means 100 fewer residents because of heat-related deaths) because of mortality and out-migration due to loss of jobs or loss of opportunity
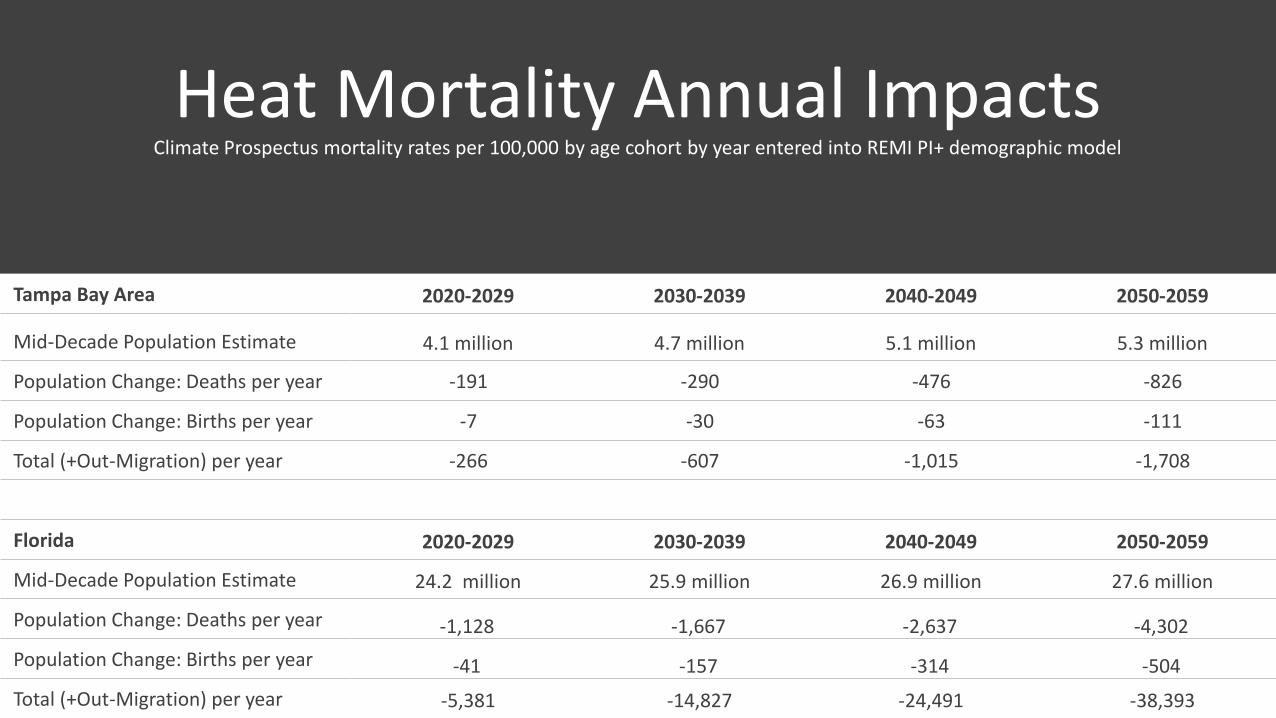
Heat Mortality Annual ImpactsClimate Prospectus mortality rates per 100,000 by age cohort by year entered into REMI PI+ demographic model
Tampa Bay Area 2020-2029 2030-2039 2040-2049 2050-2059
Mid-Decade Population Estimate 4.1 million 4.7 million 5.1 million 5.3 million
Population Change: Deaths per year -191 -290 -476 -826
Population Change: Births per year -7 -30 -63 -111
Total (+Out-Migration) per year -266 -607 -1,015 -1,708
Florida 2020-2029 2030-2039 2040-2049 2050-2059
Mid-Decade Population Estimate 24.2 million 25.9 million 26.9 million 27.6 million
Population Change: Deaths per year -1,128 -1,667 -2,637 -4,302
Population Change: Births per year -41 -157 -314 -504
Total (+Out-Migration) per year -5,381 -14,827 -24,491 -38,393
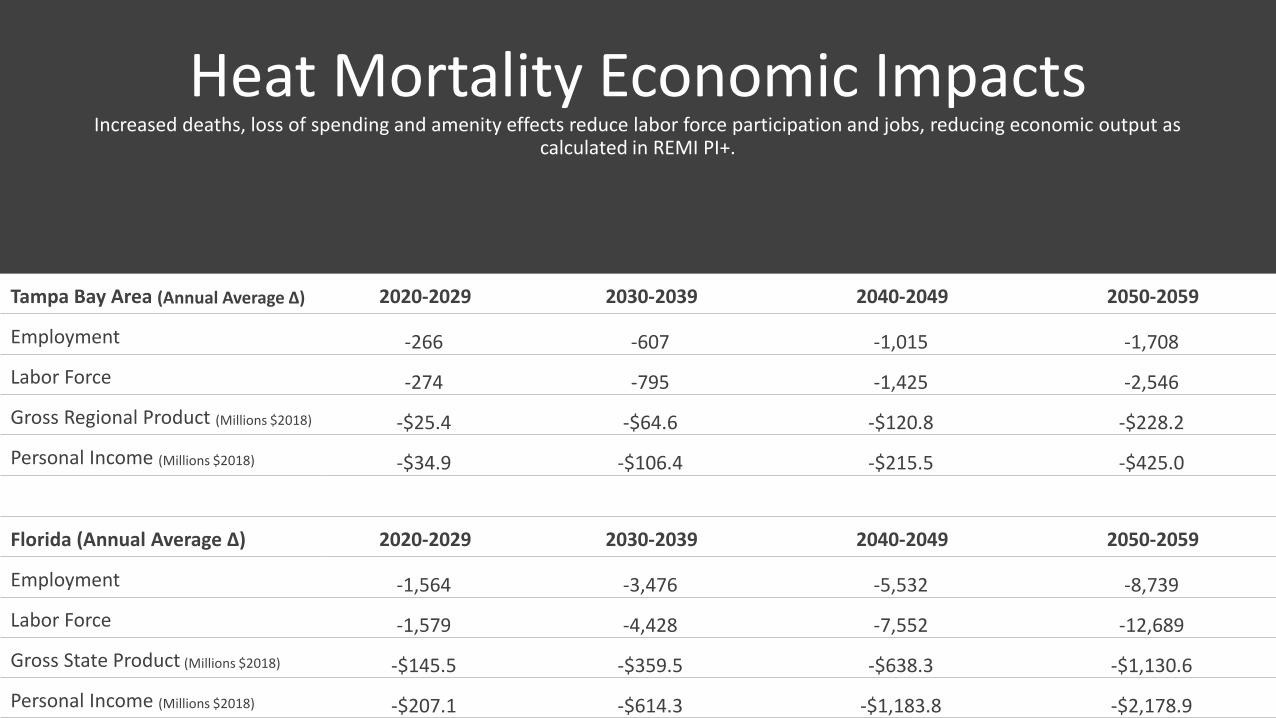
Heat Mortality Economic ImpactsIncreased deaths, loss of spending and amenity effects reduce labor force participation and jobs, reducing economic output as
calculated in REMI PI+.
Tampa Bay Area (Annual Average ∆) 2020-2029 2030-2039 2040-2049 2050-2059
Employment -266 -607 -1,015 -1,708
Labor Force -274 -795 -1,425 -2,546
Gross Regional Product (Millions $2018) -$25.4 -$64.6 -$120.8 -$228.2
Personal Income (Millions $2018) -$34.9 -$106.4 -$215.5 -$425.0
Florida (Annual Average ∆) 2020-2029 2030-2039 2040-2049 2050-2059
Employment -1,564 -3,476 -5,532 -8,739
Labor Force -1,579 -4,428 -7,552 -12,689
Gross State Product (Millions $2018) -$145.5 -$359.5 -$638.3 -$1,130.6
Personal Income (Millions $2018) -$207.1 -$614.3 -$1,183.8 -$2,178.9
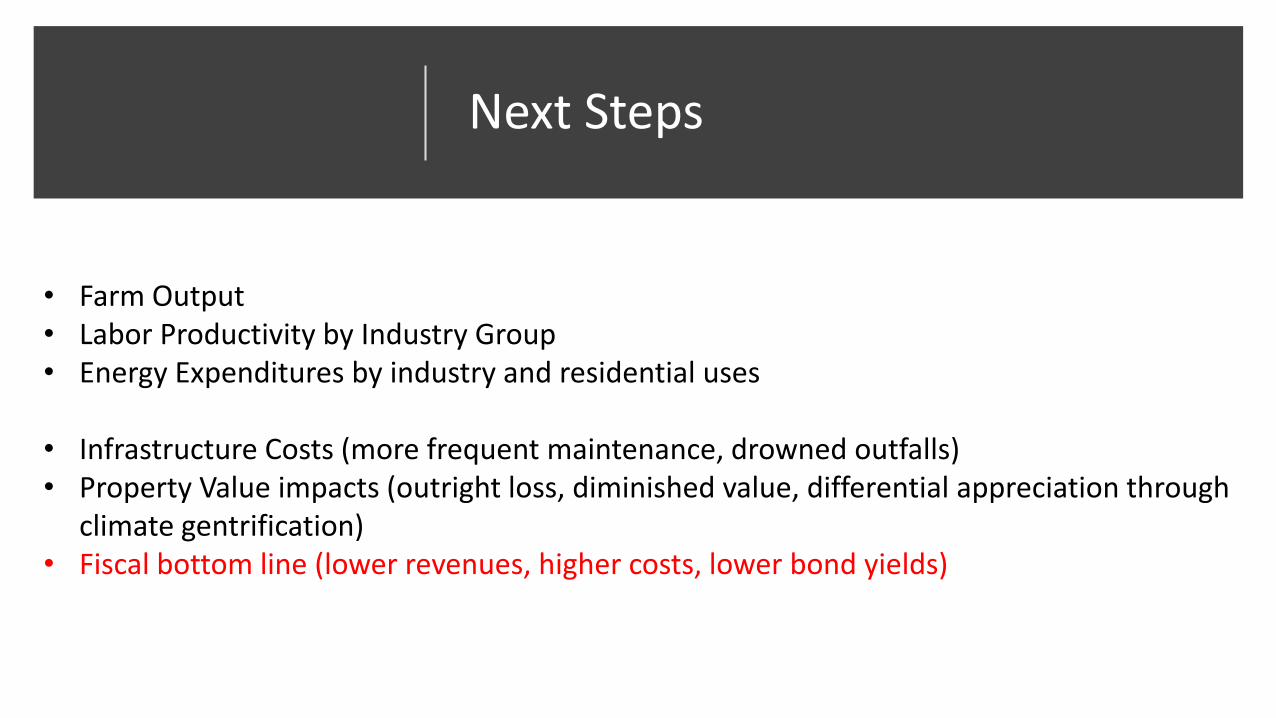
Next Steps
• Farm Output• Labor Productivity by Industry Group• Energy Expenditures by industry and residential uses
• Infrastructure Costs (more frequent maintenance, drowned outfalls)• Property Value impacts (outright loss, diminished value, differential appreciation through
climate gentrification)• Fiscal bottom line (lower revenues, higher costs, lower bond yields)
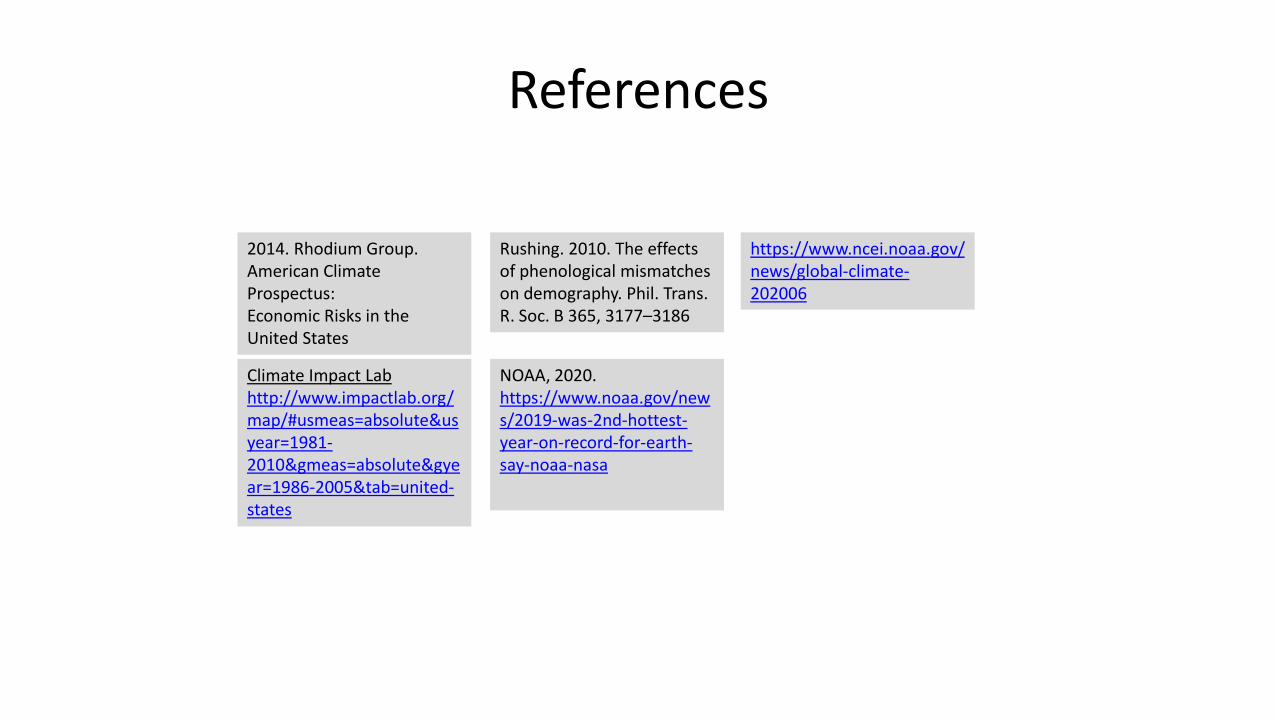
References
fdasd2014. Rhodium Group. American Climate Prospectus: Economic Risks in the United States
Rushing. 2010. The effects of phenological mismatches on demography. Phil. Trans. R. Soc. B 365, 3177–3186
https://www.ncei.noaa.gov/news/global-climate-202006
Climate Impact Labhttp://www.impactlab.org/map/#usmeas=absolute&usyear=1981-2010&gmeas=absolute&gyear=1986-2005&tab=united-states
NOAA, 2020. https://www.noaa.gov/news/2019-was-2nd-hottest-year-on-record-for-earth-say-noaa-nasa
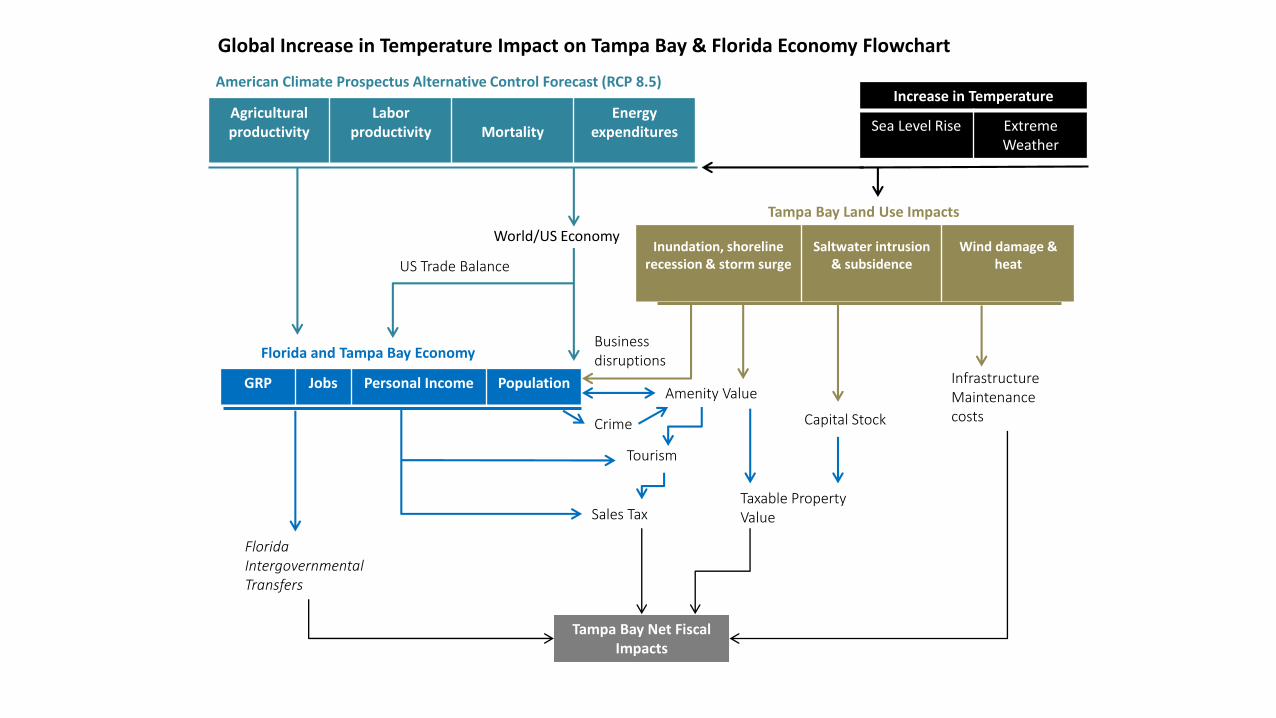
Global Increase in Temperature Impact on Tampa Bay & Florida Economy Flowchart
Infrastructure Maintenance costs
Tampa Bay Land Use Impacts
US Trade Balance
Tampa Bay Net Fiscal Impacts
Taxable Property ValueSales Tax
Amenity Value
Crime
World/US Economy
Florida and Tampa Bay Economy
Tourism
Agricultural productivity
Labor productivity Mortality
Energy expenditures
Inundation, shoreline recession & storm surge
Saltwater intrusion & subsidence
Wind damage & heat
GRP Jobs Personal Income Population
Capital Stock
Florida Intergovernmental Transfers
Business disruptions
American Climate Prospectus Alternative Control Forecast (RCP 8.5) Increase in Temperature
Sea Level Rise Extreme Weather

Poll Questions
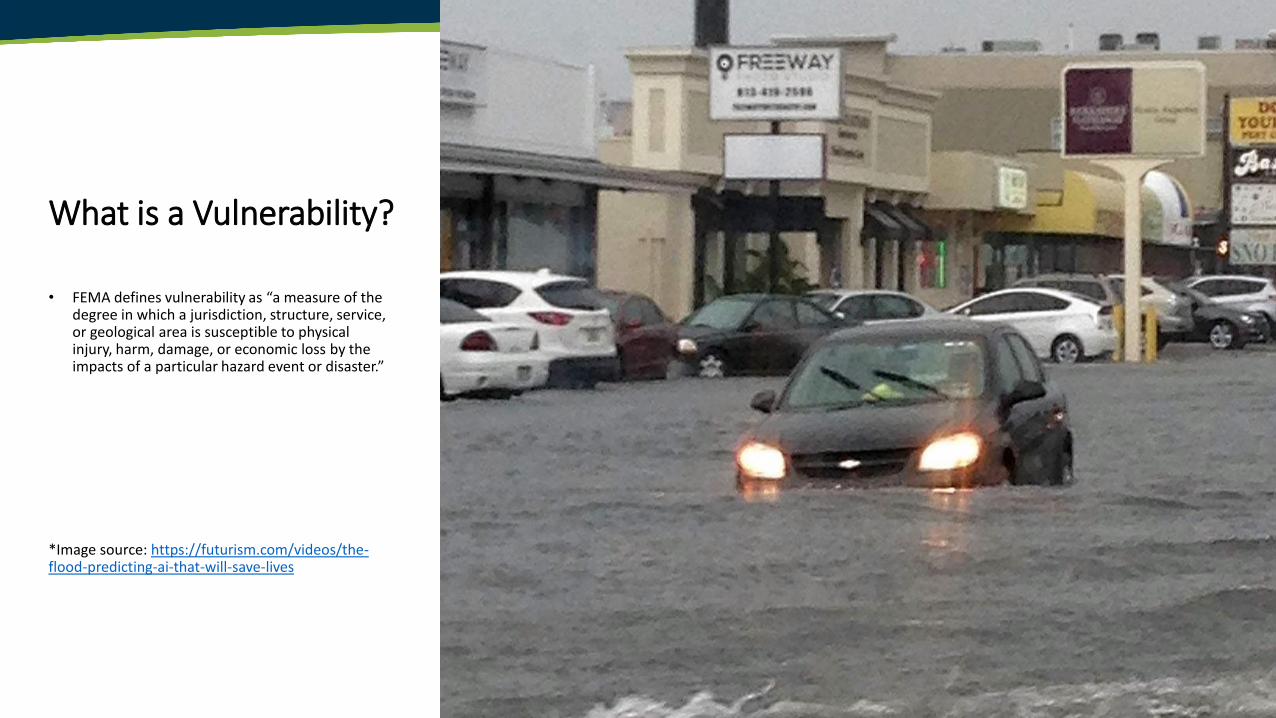
What is a Vulnerability?
• FEMA defines vulnerability as “a measure of the degree in which a jurisdiction, structure, service, or geological area is susceptible to physical injury, harm, damage, or economic loss by the impacts of a particular hazard event or disaster.”
*Image source: https://futurism.com/videos/the-flood-predicting-ai-that-will-save-lives
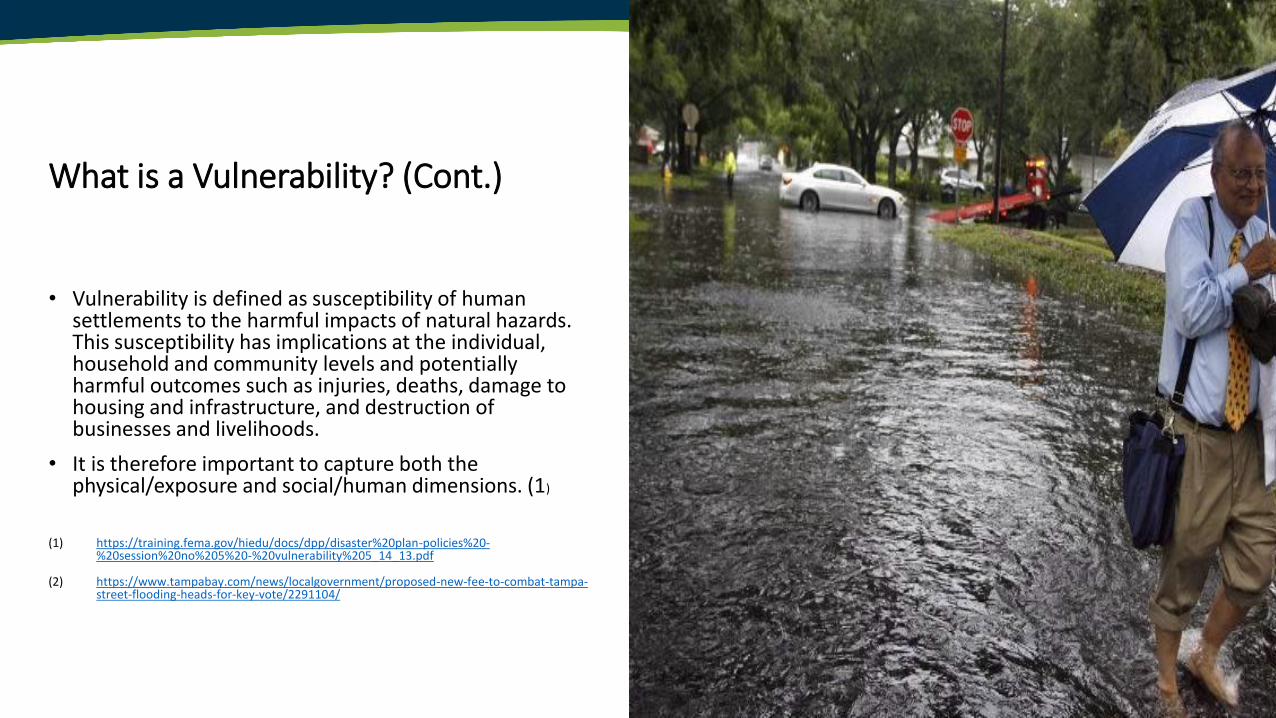
What is a Vulnerability? (Cont.)
• Vulnerability is defined as susceptibility of human settlements to the harmful impacts of natural hazards. This susceptibility has implications at the individual, household and community levels and potentially harmful outcomes such as injuries, deaths, damage to housing and infrastructure, and destruction of businesses and livelihoods.
• It is therefore important to capture both the physical/exposure and social/human dimensions. (1)
(1) https://training.fema.gov/hiedu/docs/dpp/disaster%20plan-policies%20-%20session%20no%205%20-%20vulnerability%205_14_13.pdf
(2) https://www.tampabay.com/news/localgovernment/proposed-new-fee-to-combat-tampa-street-flooding-heads-for-key-vote/2291104/
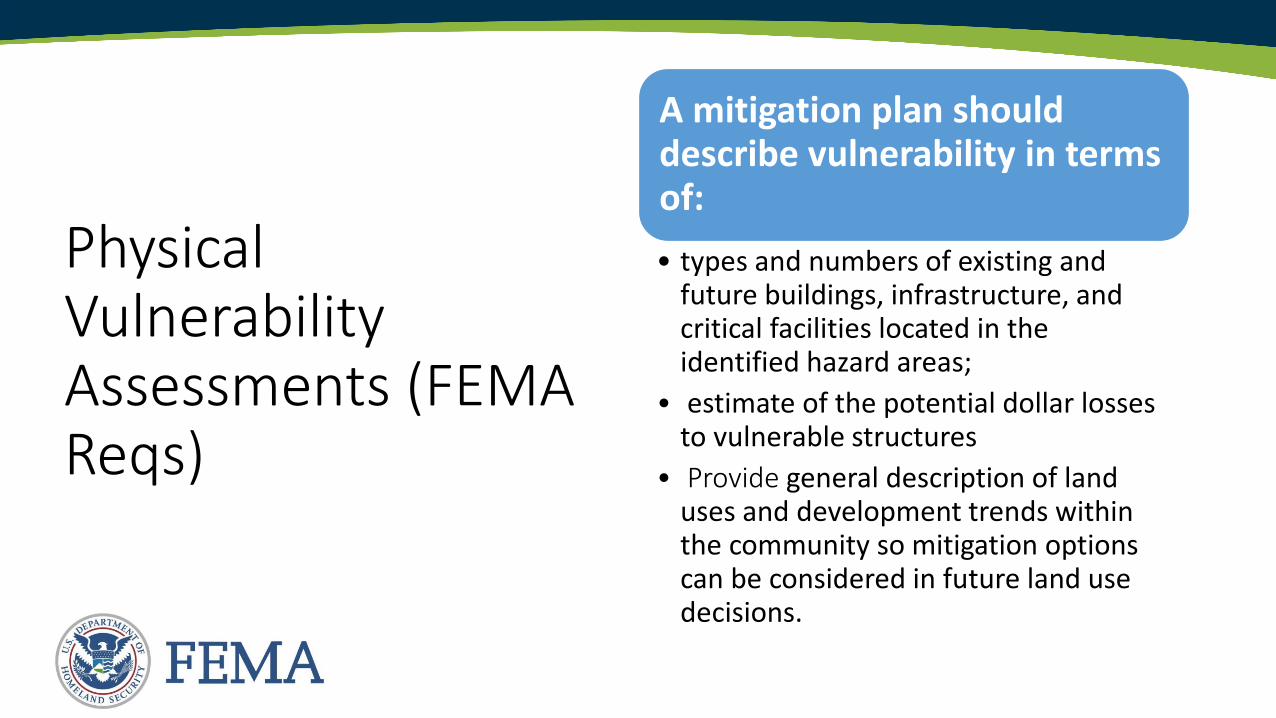
Physical Vulnerability Assessments (FEMA Reqs)
A mitigation plan should describe vulnerability in terms of:
• types and numbers of existing and future buildings, infrastructure, and critical facilities located in the identified hazard areas;
• estimate of the potential dollar losses to vulnerable structures
• Provide general description of land uses and development trends within the community so mitigation options can be considered in future land use decisions.
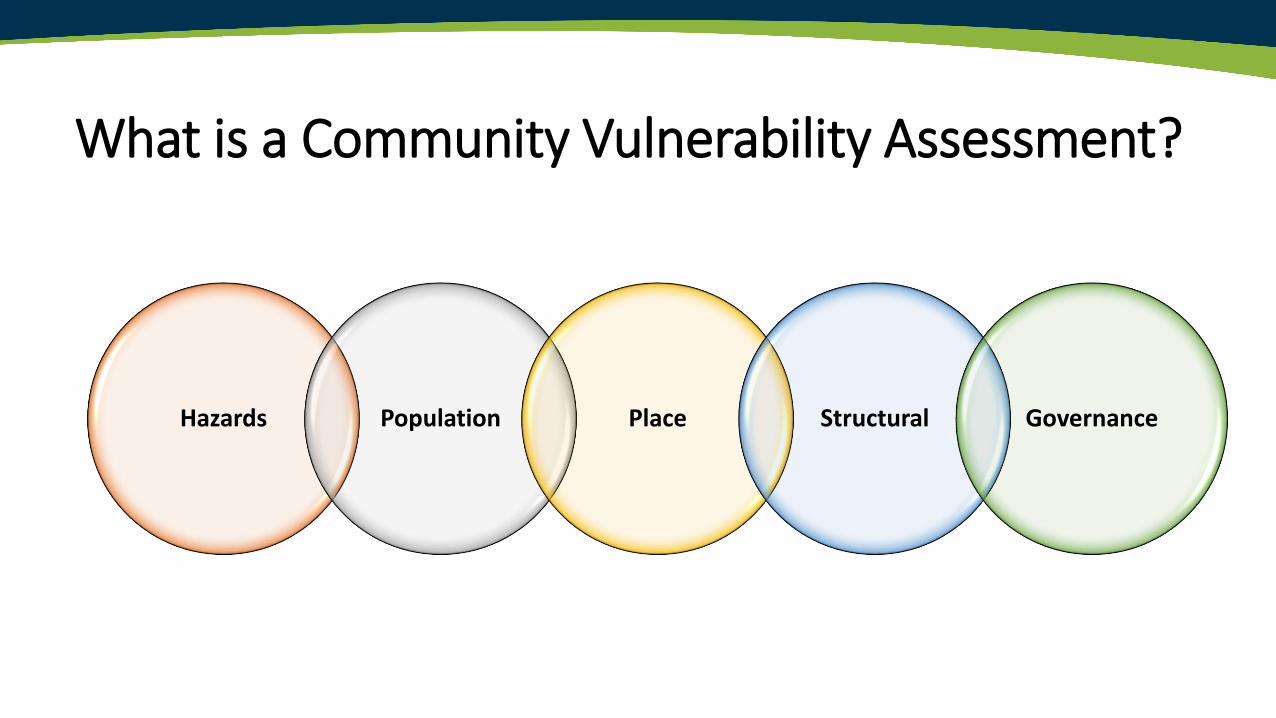
What is a Community Vulnerability Assessment?
Hazards Population Place Structural Governance

Poll Questions
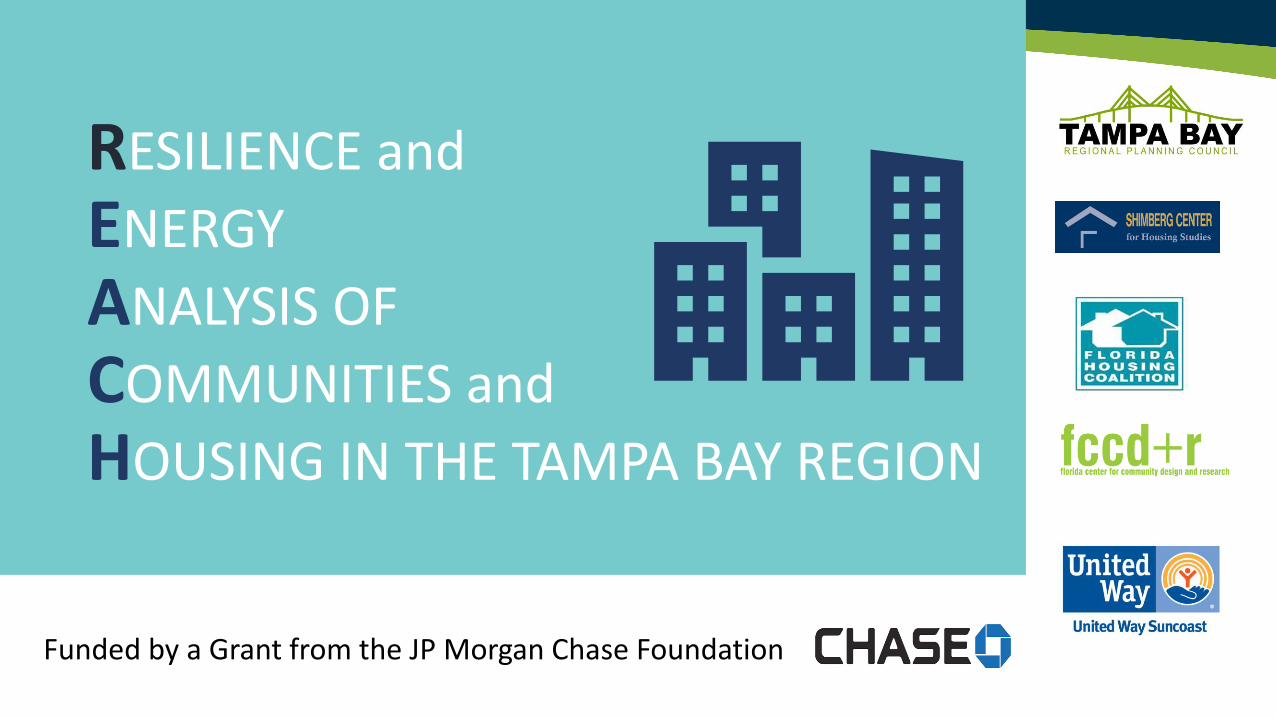
RESILIENCE and
ENERGY
ANALYSIS OF
COMMUNITIES and
HOUSING IN THE TAMPA BAY REGION
Funded by a Grant from the JP Morgan Chase Foundation
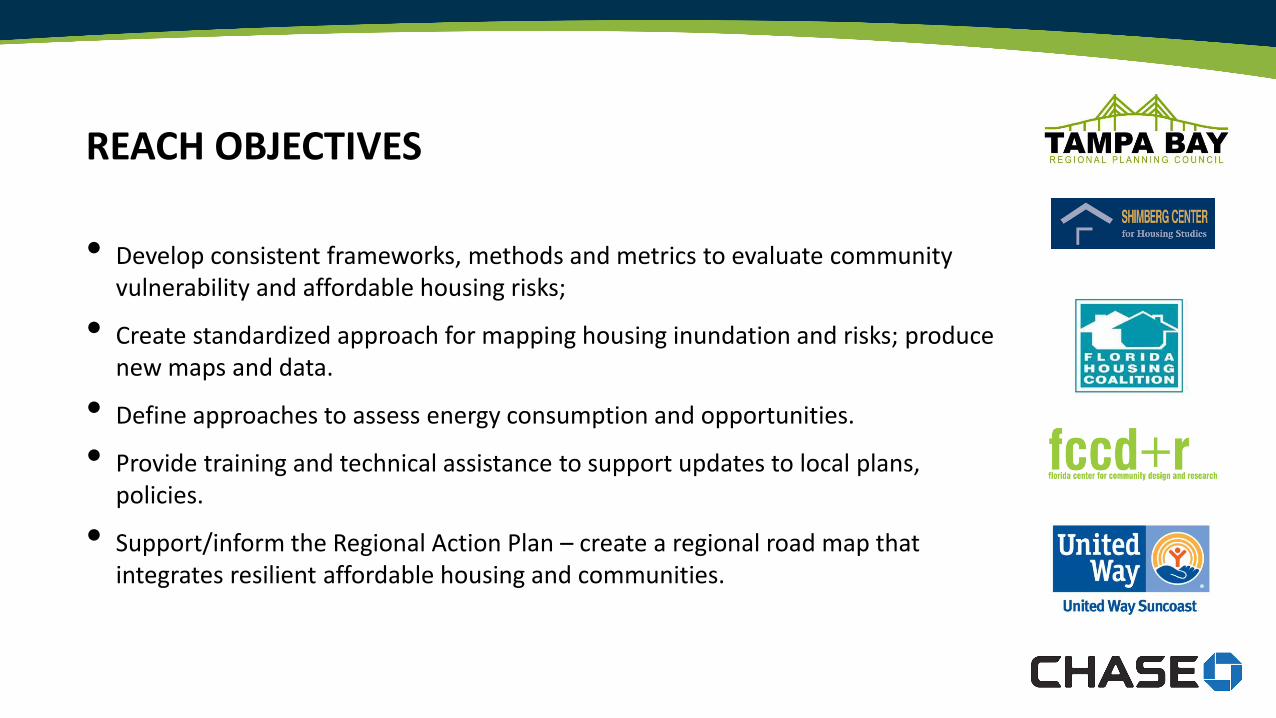
REACH OBJECTIVES
• Develop consistent frameworks, methods and metrics to evaluate community vulnerability and affordable housing risks;
• Create standardized approach for mapping housing inundation and risks; produce new maps and data.
• Define approaches to assess energy consumption and opportunities.
• Provide training and technical assistance to support updates to local plans, policies.
• Support/inform the Regional Action Plan – create a regional road map that integrates resilient affordable housing and communities.
REACH Core Components
1. Community Vulnerability Assessment
2. UF Housing and Flood Risk Tool
3. Policy-Planning Analysis and Crosswalk
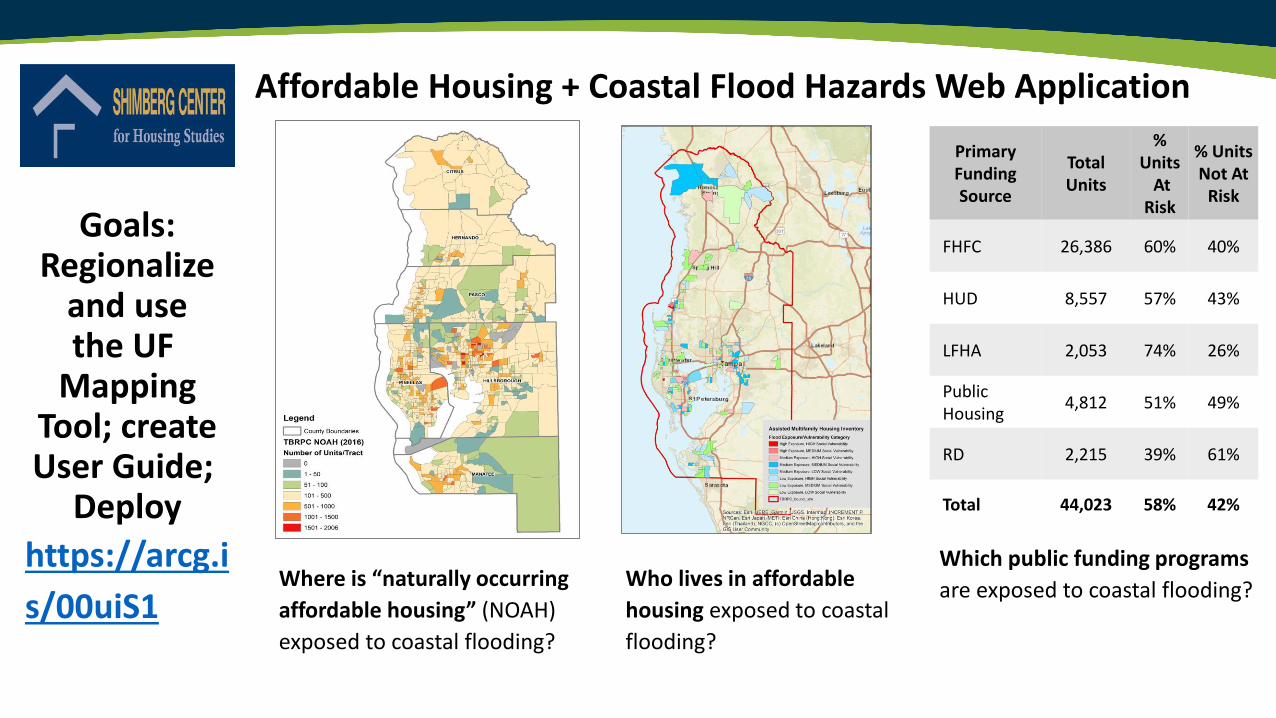
Goals: Regionalize
and use the UF
MappingTool; create User Guide;
Deploy
https://arcg.i
s/00uiS1Who lives in affordable
housing exposed to coastal
flooding?
Primary Funding Source
TotalUnits
% Units
At Risk
% UnitsNot At
Risk
FHFC 26,386 60% 40%
HUD 8,557 57% 43%
LFHA 2,053 74% 26%
Public Housing
4,812 51% 49%
RD 2,215 39% 61%
Total 44,023 58% 42%
Which public funding programs
are exposed to coastal flooding?Where is “naturally occurring
affordable housing” (NOAH)
exposed to coastal flooding?
Affordable Housing + Coastal Flood Hazards Web Application
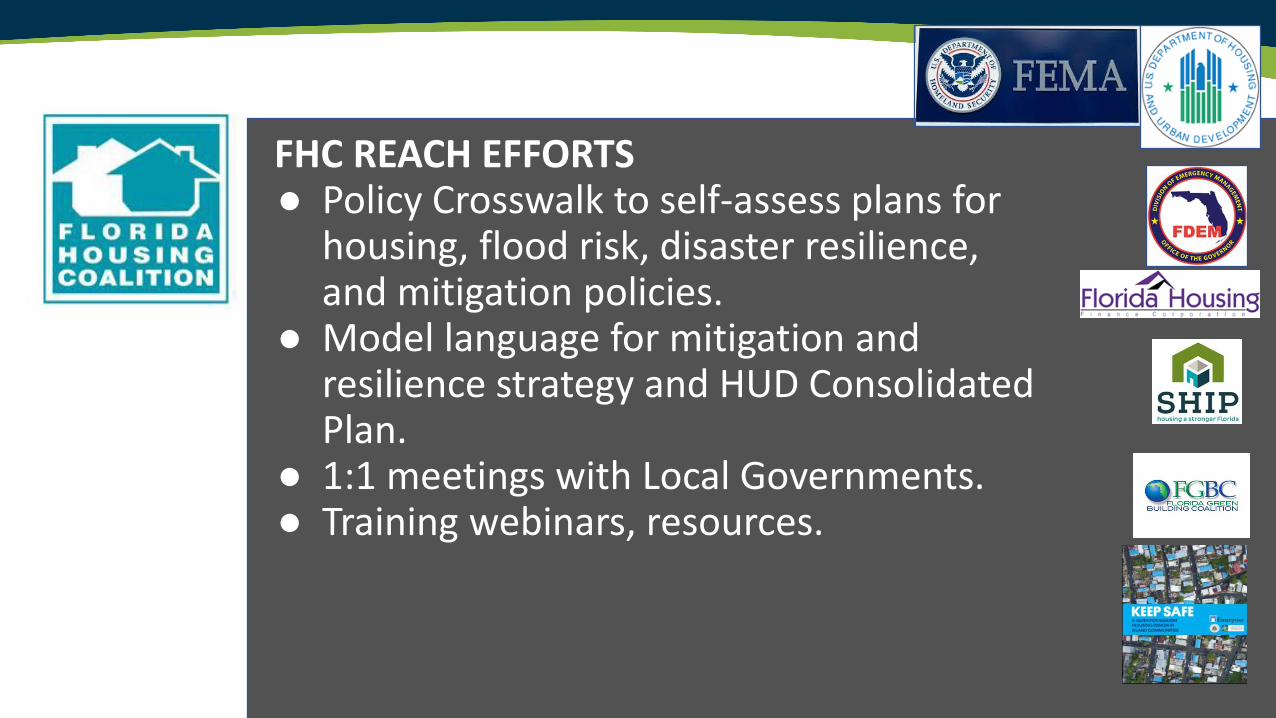
FHC REACH EFFORTS● Policy Crosswalk to self-assess plans for
housing, flood risk, disaster resilience,and mitigation policies.
● Model language for mitigation and resilience strategy and HUD Consolidated Plan.
● 1:1 meetings with Local Governments.● Training webinars, resources.
Defining Community Vulnerability Metrics
• ALICE Overview
• Background on the draft CVA
• Go into Break out groups
• Come back together
• Goal – get a small group to workshop the CVA and input over the next 2 months…
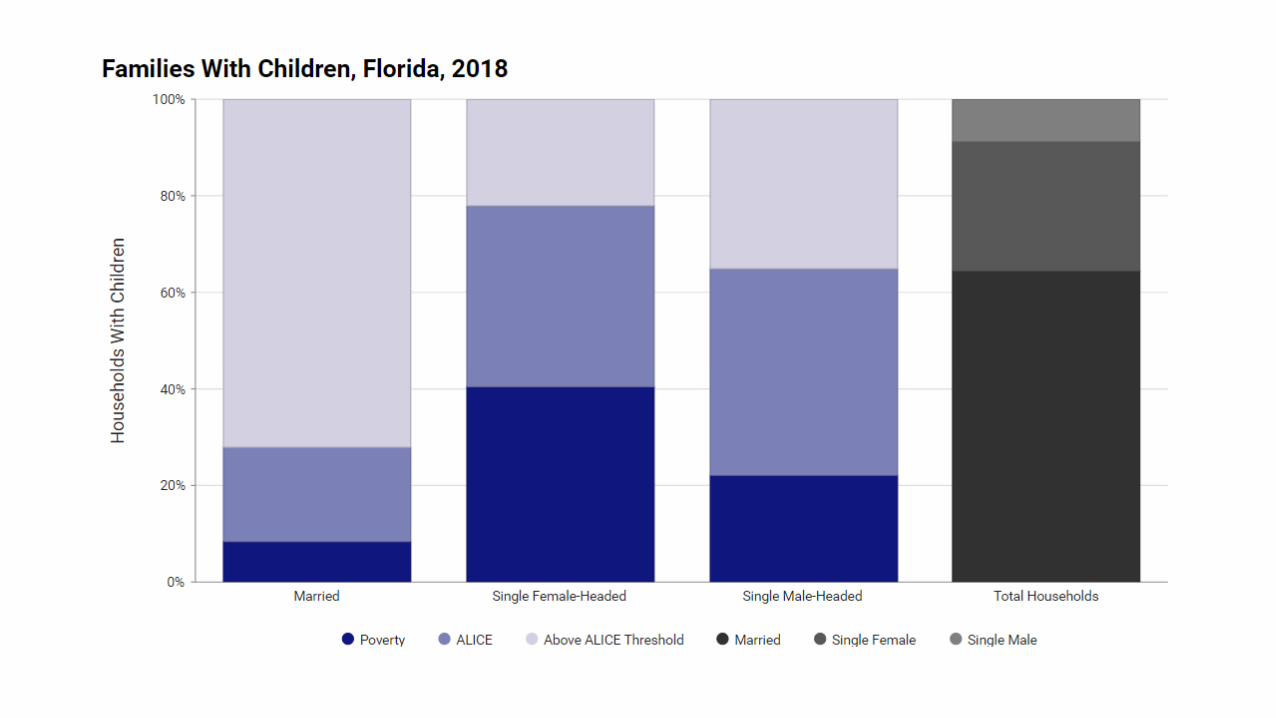
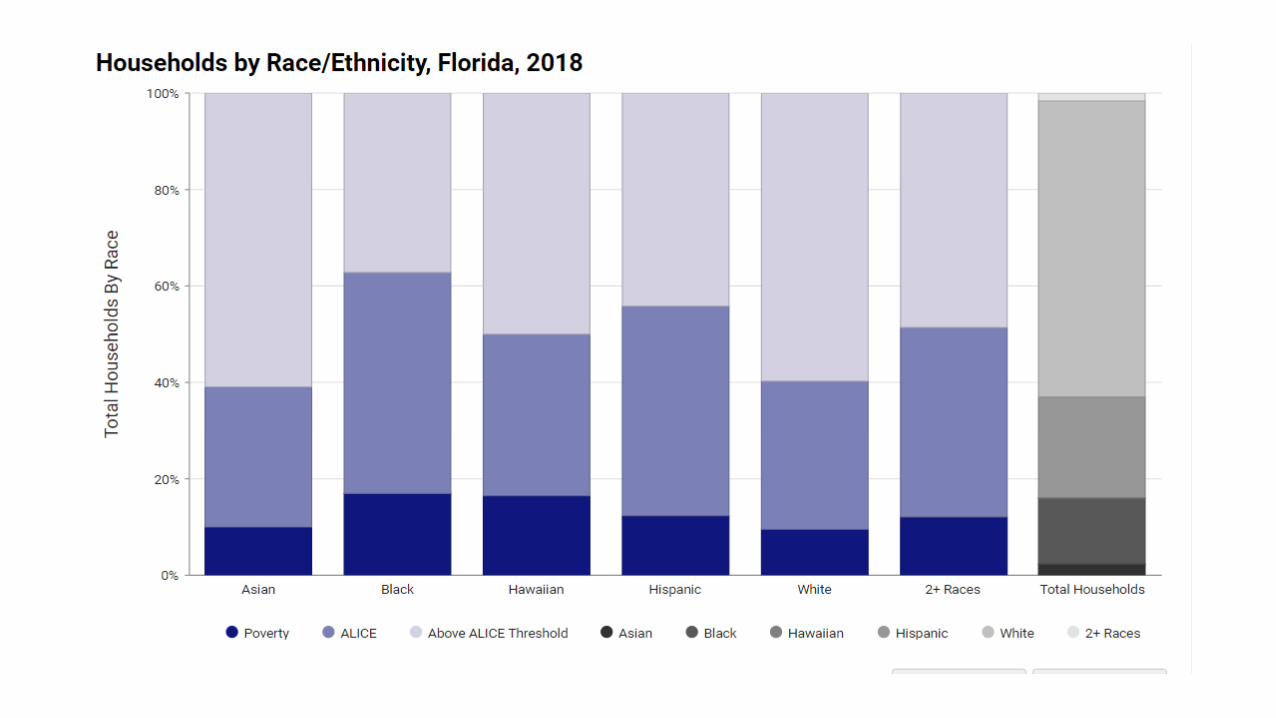
Community Vulnerability and Understanding ALICE*
(*struggling Floridians that are Asset Limited, Income Constrained, Employed)
Doug Griesenaur
Director, Workforce Development and Financial Stability Initiatives


Questions?
Developing the Community Vulnerability Assessment
Taryn Sabia, Director,
USF Florida Center for Community Design and Research
Community Vulnerability Assessment
Indicators of Resiliency
Three Main Categories
1. Social Vulnerabilities
2. Structural Vulnerabilities
3. Place Vulnerabilities
Community Vulnerability Assessment
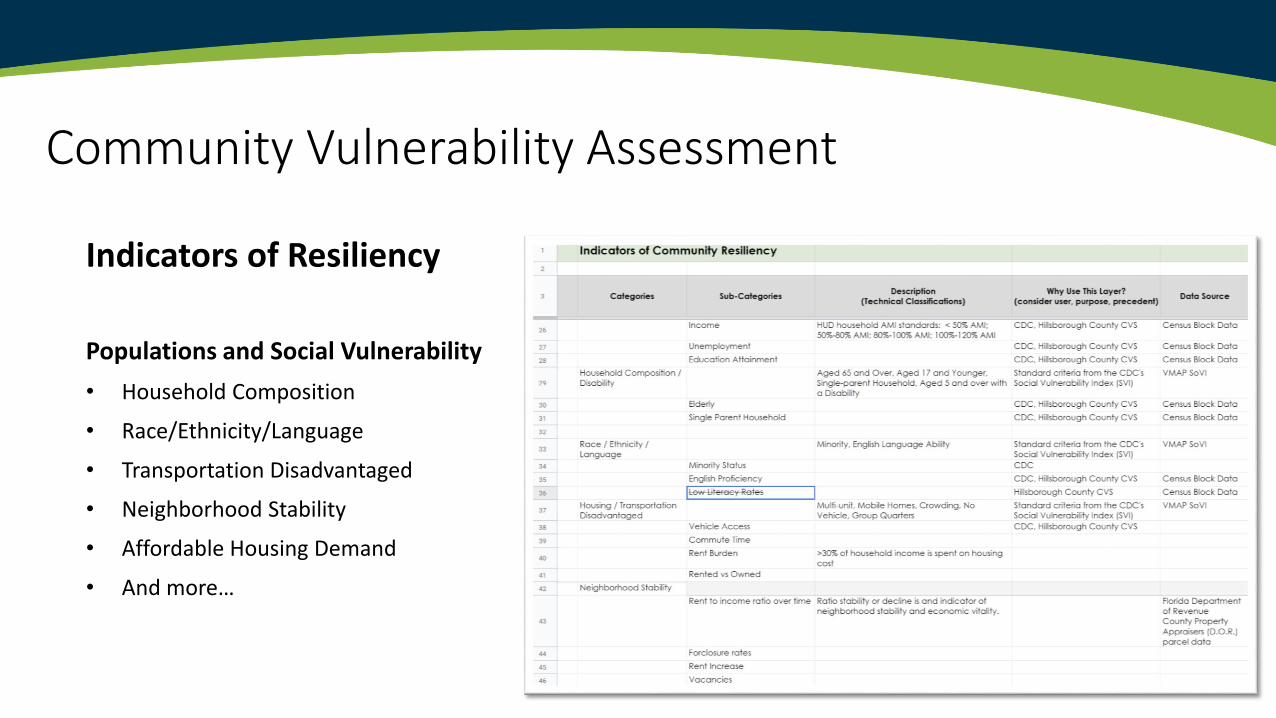
Indicators of Resiliency
Populations and Social Vulnerability
• Household Composition
• Race/Ethnicity/Language
• Transportation Disadvantaged
• Neighborhood Stability
• Affordable Housing Demand
• And more…

Community Vulnerability Assessment
Indicators of Resiliency
Structural Vulnerability
• Repetitive Loss Properties
• Building Elevation
• Types of Structures
• Age of Structures
• Housing Quality
• Infrastructure
• And more…
Community Vulnerability Assessment
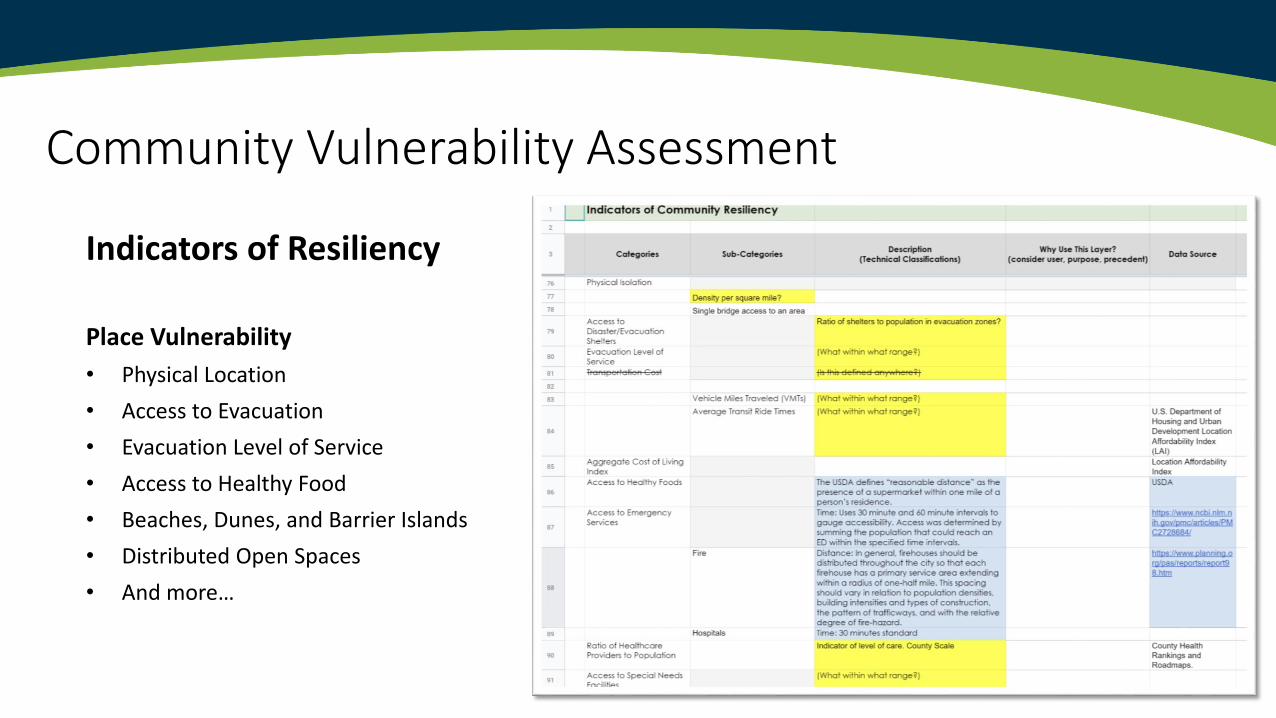
Indicators of Resiliency
Place Vulnerability
• Physical Location
• Access to Evacuation
• Evacuation Level of Service
• Access to Healthy Food
• Beaches, Dunes, and Barrier Islands
• Distributed Open Spaces
• And more…
Community Vulnerability Assessment
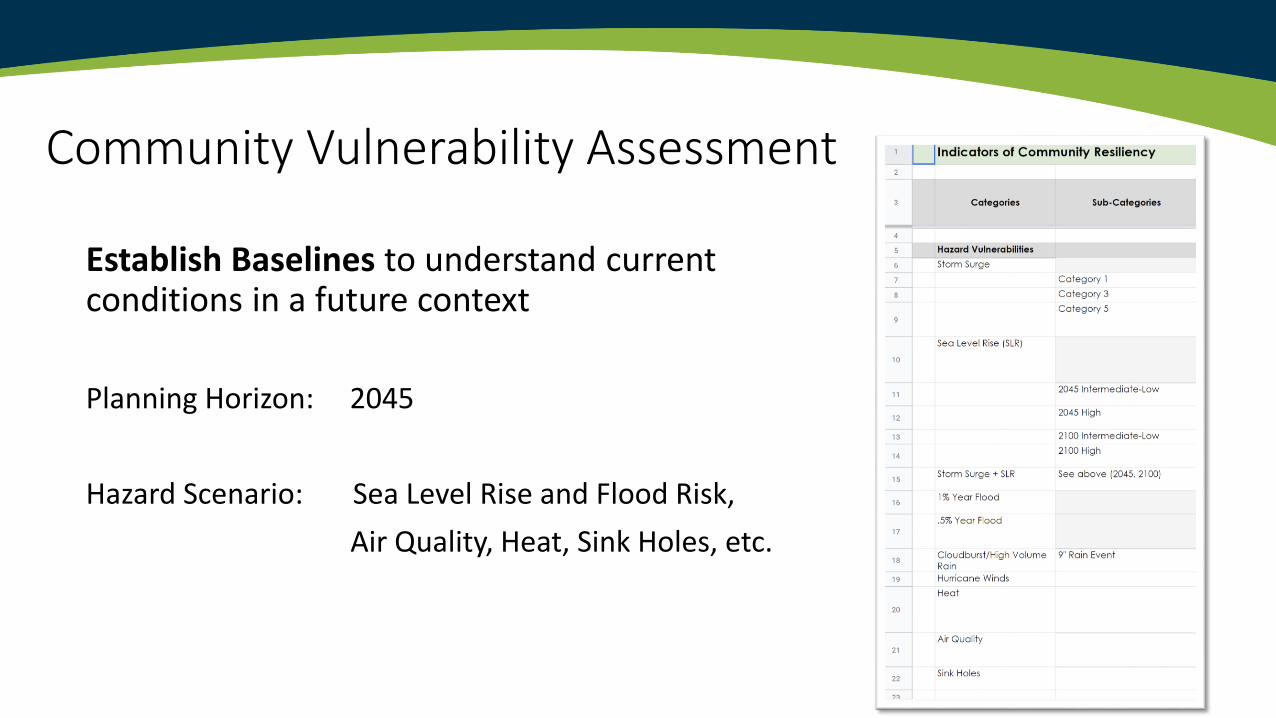
Establish Baselines to understand current conditions in a future context
Planning Horizon: 2045
Hazard Scenario: Sea Level Rise and Flood Risk,
Air Quality, Heat, Sink Holes, etc.
Community Vulnerability Assessment
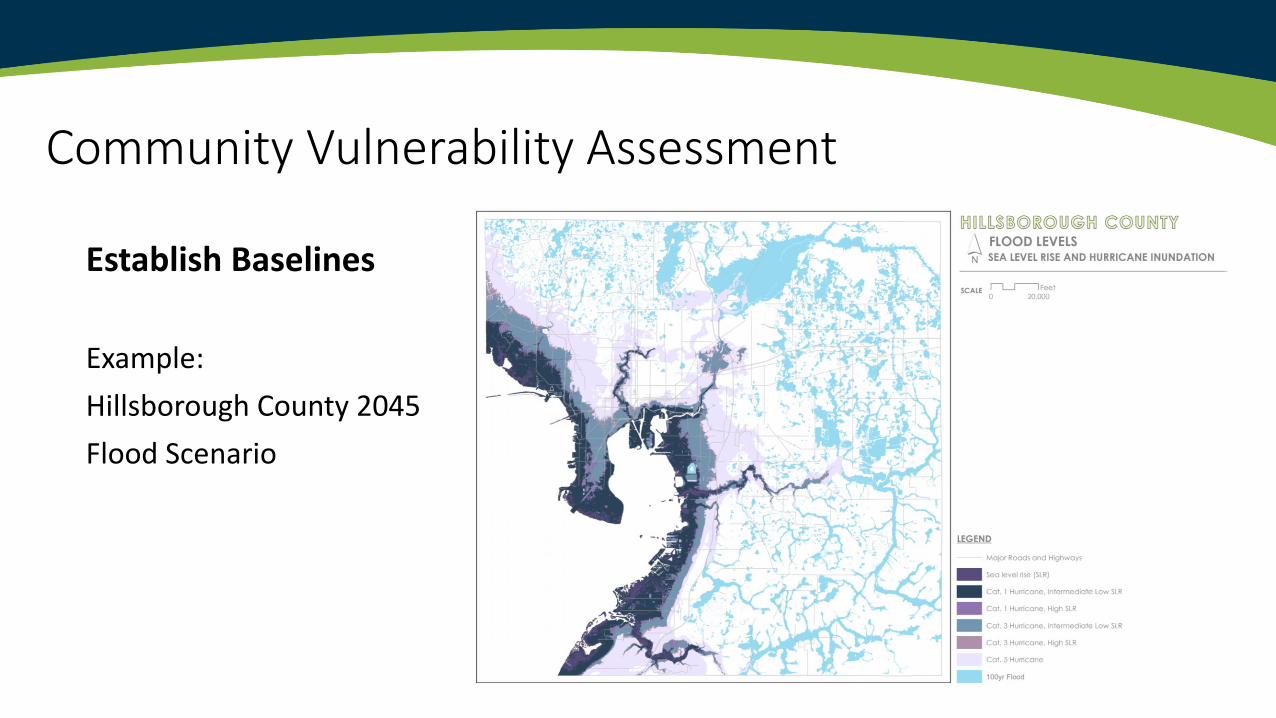
Establish Baselines
Example:
Hillsborough County 2045
Flood Scenario
Community Vulnerability Assessment
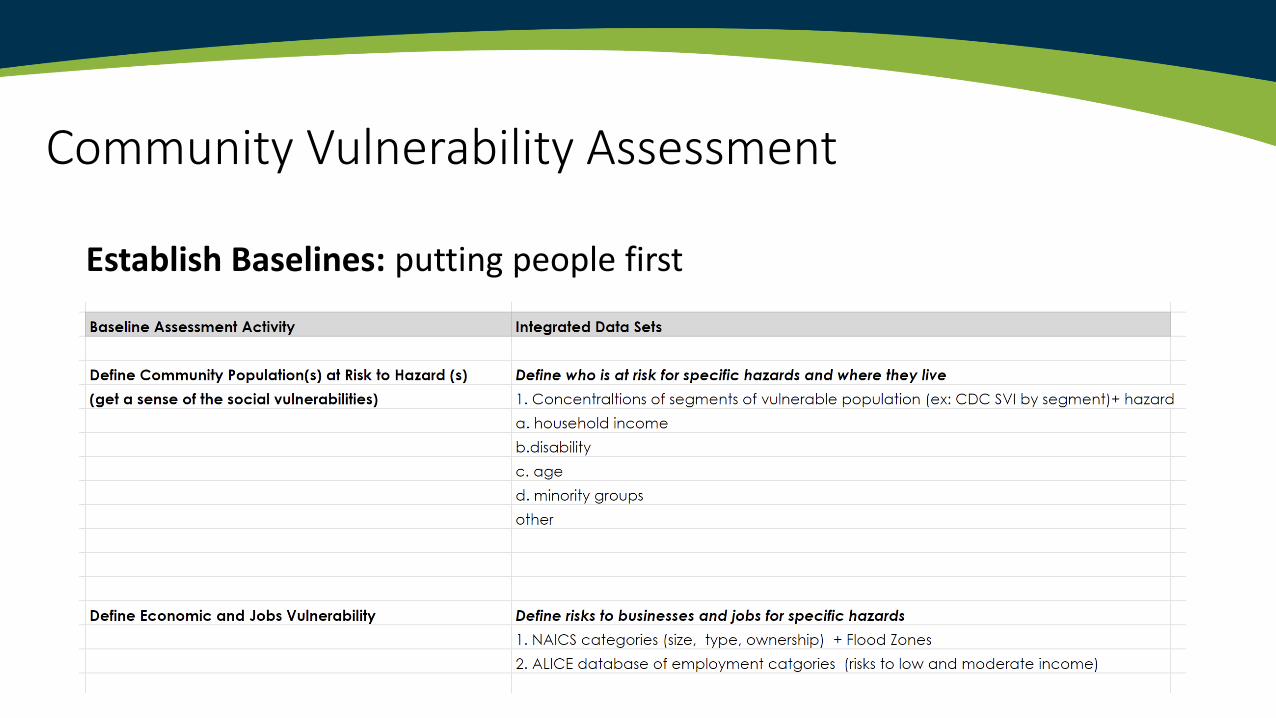
Establish Baselines: putting people first
Community Vulnerability Assessment
Integrated Data Sets
Adaptation Strategies
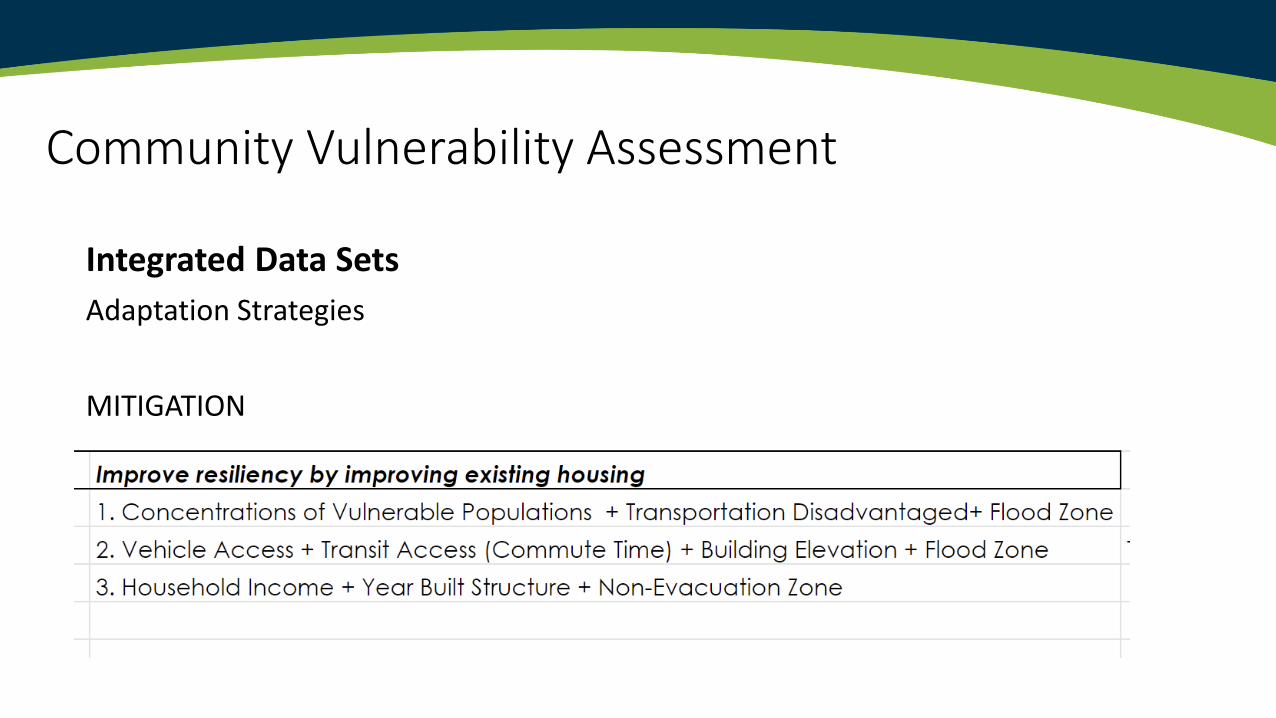
MITIGATION

Community Vulnerability Assessment
Integrated Data Sets
Adaptation Strategies
REDEVELOPMENT
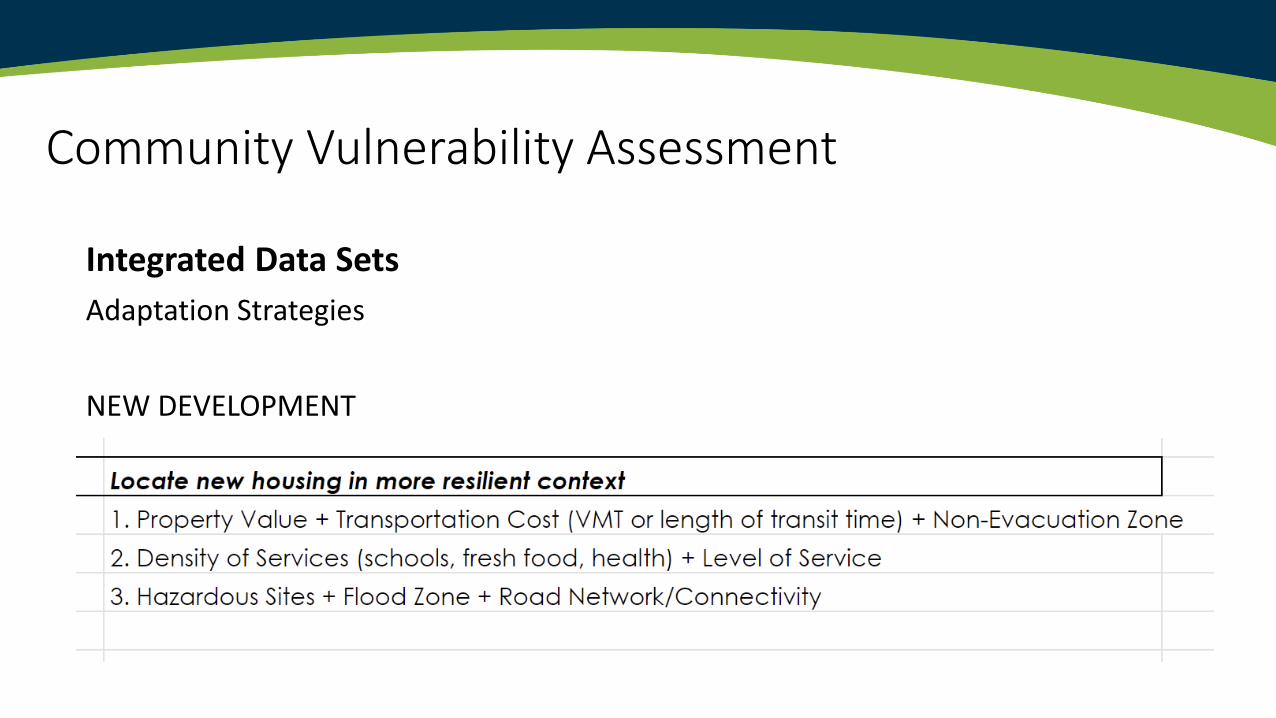
Community Vulnerability Assessment
Integrated Data Sets
Adaptation Strategies
NEW DEVELOPMENT
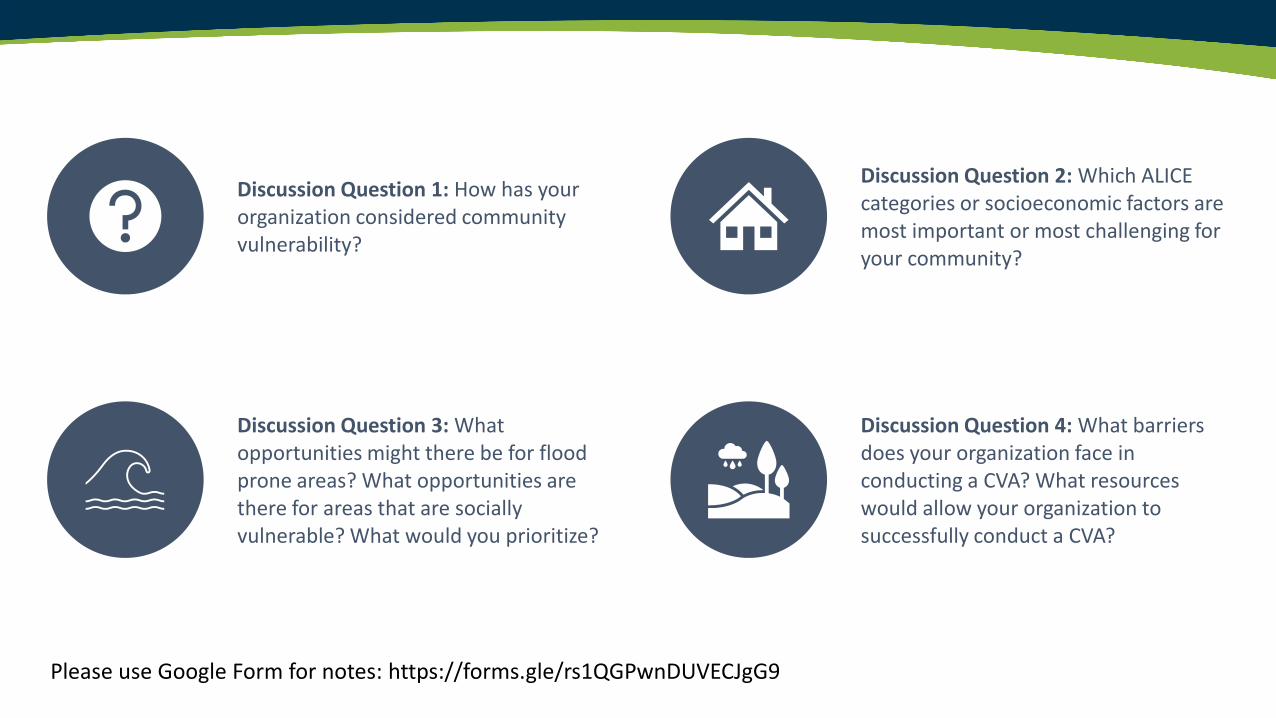
Breakout DiscussionDiscussion Question 1: How has your organization considered community vulnerability?
Discussion Question 2: Which ALICE categories or socioeconomic factors are most important or most challenging for your community?
Discussion Question 3: What opportunities might there be for flood prone areas? What opportunities are there for areas that are socially vulnerable? What would you prioritize?
Discussion Question 4: What barriers does your organization face in conducting a CVA? What resources would allow your organization to successfully conduct a CVA?
Please use Google Form for notes: https://forms.gle/rs1QGPwnDUVECJgG9
Group Discussion
Discussion Question 7: What resources have you used to conduct a CVA? What would you recommend to staff beginning the CVA process?
Discussion Question 8: What barriers does your organization face in conducting a CVA? What resources would allow your organization to successfully conduct a CVA?


