
Computation and Validation of the Dynamic Response Index (DRI) 6 August 2013 Dacie Manion
UNCLASSIFIED: Distribution A. Approved for public release

Report Documentation Page Form ApprovedOMB No. 0704-0188
Public reporting burden for the collection of information is estimated to average 1 hour per response, including the time for reviewing instructions, searching existing data sources, gathering andmaintaining the data needed, and completing and reviewing the collection of information. Send comments regarding this burden estimate or any other aspect of this collection of information,including suggestions for reducing this burden, to Washington Headquarters Services, Directorate for Information Operations and Reports, 1215 Jefferson Davis Highway, Suite 1204, ArlingtonVA 22202-4302. Respondents should be aware that notwithstanding any other provision of law, no person shall be subject to a penalty for failing to comply with a collection of information if itdoes not display a currently valid OMB control number.
1. REPORT DATE 06 AUG 2013
2. REPORT TYPE Briefing Charts
3. DATES COVERED 10-05-2013 to 01-08-2013
4. TITLE AND SUBTITLE Computation and Validation of the Dynamic Response Index (DRI)
5a. CONTRACT NUMBER
5b. GRANT NUMBER
5c. PROGRAM ELEMENT NUMBER
6. AUTHOR(S) Dacie Manion
5d. PROJECT NUMBER
5e. TASK NUMBER
5f. WORK UNIT NUMBER
7. PERFORMING ORGANIZATION NAME(S) AND ADDRESS(ES) U.S. Army TARDEC,6501 East Eleven Mile Rd,Warren,Mi,48397-5000
8. PERFORMING ORGANIZATIONREPORT NUMBER #24165
9. SPONSORING/MONITORING AGENCY NAME(S) AND ADDRESS(ES) U.S. Army TARDEC, 6501 East Eleven Mile Rd, Warren, Mi, 48397-5000
10. SPONSOR/MONITOR’S ACRONYM(S) TARDEC
11. SPONSOR/MONITOR’S REPORT NUMBER(S) #24165
12. DISTRIBUTION/AVAILABILITY STATEMENT Approved for public release; distribution unlimited
13. SUPPLEMENTARY NOTES Smart Scholarship Program Briefing 2014
14. ABSTRACT Briefing Charts
15. SUBJECT TERMS
16. SECURITY CLASSIFICATION OF: 17. LIMITATION OF ABSTRACT
Public Release
18. NUMBEROF PAGES
21
19a. NAME OFRESPONSIBLE PERSON
a. REPORT unclassified
b. ABSTRACT unclassified
c. THIS PAGE unclassified
Standard Form 298 (Rev. 8-98) Prescribed by ANSI Std Z39-18

Introduction • Motivation and background • DRI overview • 1-DOF and 3-DOF models • Usage • Validation • EARTH metric • Summary • Ongoing work
UNCLASSIFIED: Distribution A. Approved for public release 2

DRI Code: Motivation • Develop a fast in-house code for calculating the
Dynamic Response Index (DRI) injury metric using test or simulation results as input.
• Code should be stand-alone in nature and should lend itself easily to process automation.
UNCLASSIFIED: Distribution A. Approved for public release 3
Test
Simulation
Acceleration data
DRI Code DRI
Injury Metric

Background • Various metrics are used to
predict the occupant response and evaluate the safety of vehicle designs in underbody blast events.
• Underbody blast events cause a predominant risk of thoraco-lumbar spine injury.
• The Dynamic Response Index (DRI) has been used historically as a metric for spinal compression.
4 UNCLASSIFIED: Distribution A. Approved for public release
From (NATO, 2007).

Dynamic Response Index (DRI)
• Measure of spinal injury risk that accounts for the time duration of a load.
• Occupant torso modeled as a spring-mass-damper system. • Calculated from maximum relative displacement between
the pelvis and upper torso.
• Tolerance level of 17.7 for 10% risk of AIS 2+ injuries.
ωn = natural frequency (of spring-mass system) δmax = maximum relative displacement g = gravitational acceleration
UNCLASSIFIED: Distribution A. Approved for public release 5
m
k c

1-DOF model Takes anthropomorphic test device (ATD) pelvis acceleration or seat acceleration as input (pelvis preferred).
Spine
Upper Torso
Pelvis
= k/m
=
x
x1
= (x1-x)
UNCLASSIFIED: Distribution A. Approved for public release 6
spinal compression δ = x1 – x

1-DOF Computational model Input time and acceleration •Time series •Triangular pulse
Simulation •Trapezoidal rule for
numerical integration • Spring and damper forces
DRI
Acceleration data from physical test:
UNCLASSIFIED: Distribution A. Approved for public release 7
Acceleration DRI

3-DOF model
UNCLASSIFIED: Distribution A. Approved for public release 8
• Takes hull acceleration as input. • Accounts for energy absorption by
the floor and seat. • Springs representing the floor and
seat are piecewise-linear. • The spring representing the spine is
still linear.
Sprin
g st
iffne
ss (k
)
Spring deformation (m)
Piecewise Linear Spring Stiffness
m3
m2
m1
k3 c3
k2 c2
k1 c1
x3
x2
x1
Seat/ Pelvis
Spine
Upper Torso
Floor
Hull
Seat EA
Floor EA

3-DOF Computational model Input time and acceleration •Time series •Triangular pulse
Simulation •Trapezoidal rule for
numerical integration • Spring and damper forces
DRI
Triangular pulse input data (from previously developed Excel code):
UNCLASSIFIED: Distribution A. Approved for public release 9
Acceleration DRI

• Written in Python. • Requires Python
2.7+ and matplotlib plotting library.
• Executed from command line.
• Allows several optional arguments.
• Runs on Windows, Linux, UNIX, and Mac OS X.
10 UNCLASSIFIED: Distribution A. Approved for public release
DRI Code Outputs from 1-DOF code with triangular
pulse input

User manual
• Explains input formatting and output files generated.
• Includes example command-line calls and full test cases.
• Test cases used to validate code against: – Previously developed Excel code – Known DRI values for several
physical tests
UNCLASSIFIED: Distribution A. Approved for public release 11

Validation
• Validated against Excel code for both 1-DOF and 3-DOF.
• Used physical test results with DRI calculations previously done in other software to further validate 1-DOF model.
• Validated 3-DOF model against 1-DOF model by setting very large spring constants.
12
DRI output from Excel: DRI output from Python:
UNCLASSIFIED: Distribution A. Approved for public release
0 10 20 30 40 50 60
0.00
0 0.
005
0.01
0 0.
015
0.02
0 0.
025
0.03
0 0.
035
0.04
0 0.
045
0.05
0
DRI v
alue
Time (s)
Acceleration data from physical test:
Python output DRI vs. Time:
Triangular pulse input data with given time duration and peak acceleration:
Time (s)

EARTH Code: Motivation • Error Assessment of Response Time Histories (EARTH)
– Compares time histories to validate M&S results. – New rigorous, quantitative tool for in-house VV&A.
• MATLAB code delivered by the Automotive Research Center (ARC) with several papers but no user manual – (Pan, 2012) – (Sarin, 2008) – (Sarin et al., 2010)
13 UNCLASSIFIED: Distribution A. Approved for public release
Acceleration data
EARTH Code
Validation Metric
DRI v
alue
Time (s)
Time History 1
Time History 2
Time (s)
DRI V
alue

EARTH code • Combines existing measures and
algorithms. • Quantifies and separates error due to:
– Phase shift – Magnitude differences – Topology (shape) discrepancy
• Takes two time histories as inputs along with a few parameters.
• Outputs: – Plots of original, shifted, and warped
time histories – Derivatives of shifted and warped
time histories – Error metrics for phase, magnitude,
and topology – Uses Bayesian framework to
determine model confidence for original, phase-shifted, warped, and warped derivative data.
UNCLASSIFIED: Distribution A. Approved for public release 14
Time
Acce
lera
tion
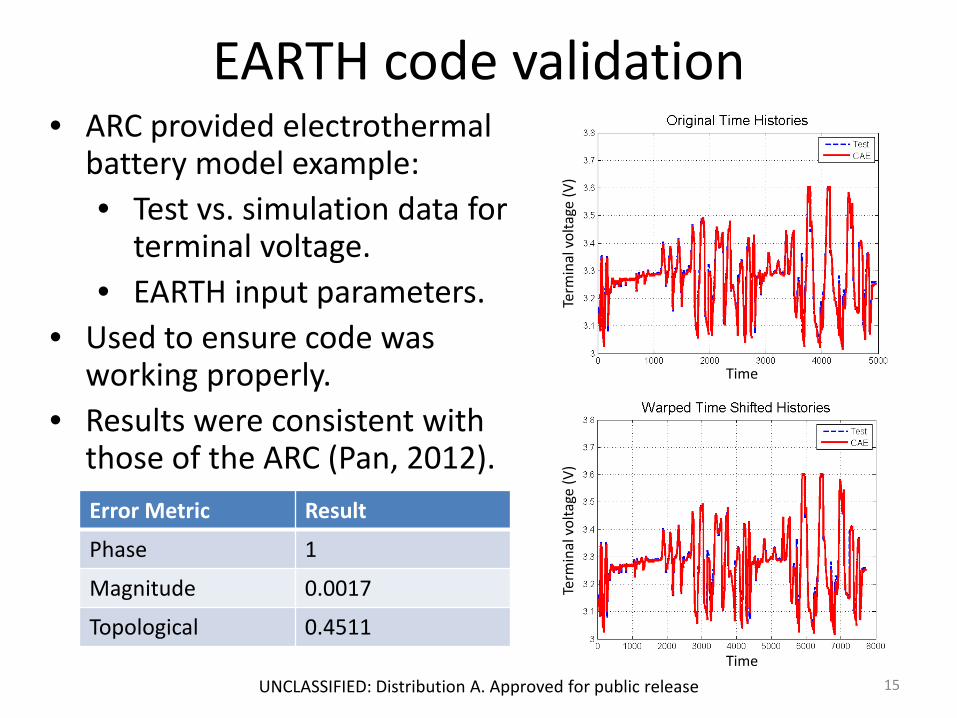
EARTH code validation
15 UNCLASSIFIED: Distribution A. Approved for public release
• ARC provided electrothermal battery model example: • Test vs. simulation data for
terminal voltage. • EARTH input parameters.
• Used to ensure code was working properly.
• Results were consistent with those of the ARC (Pan, 2012).
Error Metric Result
Phase 1
Magnitude 0.0017
Topological 0.4511
Time
Time
Term
inal
vol
tage
(V)
Term
inal
vol
tage
(V)
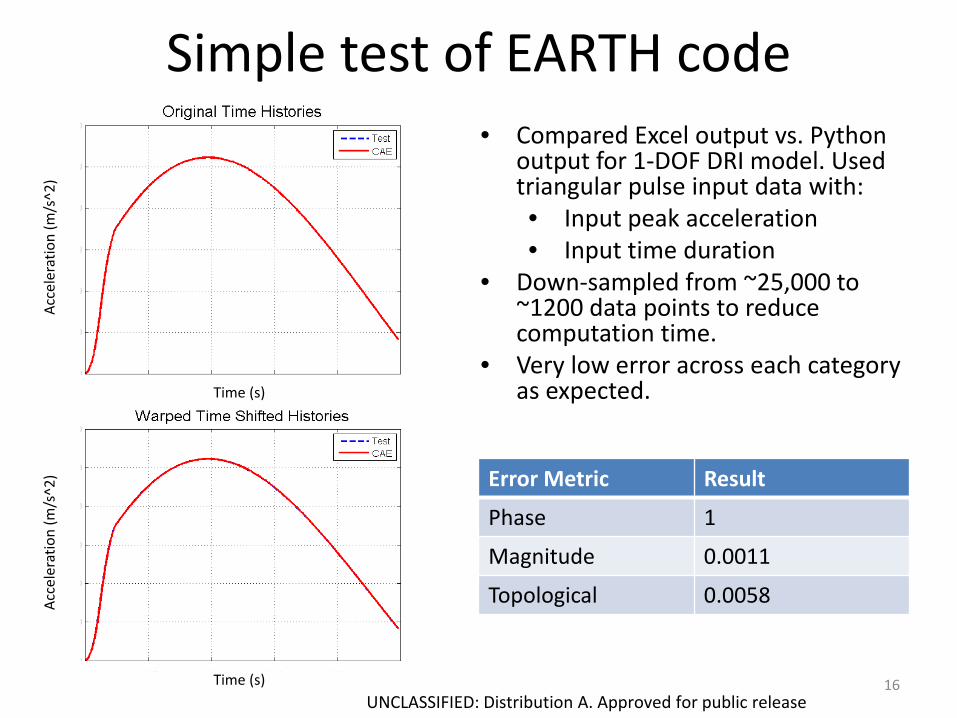
Simple test of EARTH code • Compared Excel output vs. Python
output for 1-DOF DRI model. Used triangular pulse input data with: • Input peak acceleration • Input time duration
• Down-sampled from ~25,000 to ~1200 data points to reduce computation time.
• Very low error across each category as expected.
UNCLASSIFIED: Distribution A. Approved for public release 16
Error Metric Result
Phase 1
Magnitude 0.0011
Topological 0.0058
Time (s)
Time (s)
Acce
lera
tion
(m/s
^2)
Acce
lera
tion
(m/s
^2)

Phase shift test of EARTH code • Introduced a phase shift of
1000 data points in the original vector.
• Down-sampled to ~800 data points. (phase shift of 33)
• EARTH code recognized and handled the phase shift, yielding low magnitude and topological error again as expected.
UNCLASSIFIED: Distribution A. Approved for public release 17
Error Metric Result
Phase 34
Magnitude 0.0022
Topological 0.0103
Time (s)
Time (s)
Acce
lera
tion
(m/s
^2)
Acce
lera
tion
(m/s
^2)

Validation of EECS models Case 1 Case 2
UNCLASSIFIED: Distribution A. Approved for public release 18
Error Metric Result
Case 1
Phase 3
Magnitude 0.4508
Topological 0.7635
Case 2
Phase 4
Magnitude 0.6779
Topological 0.8296
Time
Time
Time
Time
Acce
lera
tion
(g)
Acce
lera
tion
(g)
Acce
lera
tion
(g)
Acce
lera
tion
(g)
Original data from drop tower tests.

Ongoing work • Write EARTH code user
manual for in-house use at TARDEC.
• Use DRI code to help evaluate new concept vehicles for DARPA.
• Update Hybrid Lumped-Finite Element (HLF) code (HyperMesh script for generating hull models) to add 3-DOF occupant models.
UNCLASSIFIED: Distribution A. Approved for public release 19
V-hull model from HLF code

Summary 1. DRI
– Developed 1-DOF and 3-DOF code in Python. – Validated against Excel code and physical test results. – Documented usage and examples.
2. EARTH code – Learned and tested EARTH code. – Gathered example I/O data. – Applied to EECS Team data to support in-house
model VV&A efforts. – Documented code for future VV&A at TARDEC.
3. Summarized all work in a technical report.
20 UNCLASSIFIED: Distribution A. Approved for public release

References • NATO Science and Technology Organization. Test
Methodology for Protection of Vehicle Occupants against Anti-Vehicular Landmine Effects. RTO-TR-HFM-090 AC/323(HFM-090)TP/72, Technical Report, April 2007.
• Pan, H. (2012), On the Integration of EARTH metric into the Bayesian Validation Framework, Technical Report, University of Michigan, Ann Arbor, MI, USA.
• Yorra, A.J. (1956), The Investigation of the Structural Behavior of the Intervertebral Discs, Masters Thesis, Massachusetts Institute of Technology, Cambridge, MA, USA.
• Ruff, S. (1950), Brief Acceleration: Less than One Second, German Aviation Medicine in World War II, Vol. I, Chapter VI-C, Department of the Air Force.
• Ramalingam, J. and R. Thyagarajan. (2013, Jan 23). Design and Analysis of Vertically Stroking Floors (OCP-TECD). Technical briefing.
• Sarin, H. (2008), Error Assessment of Response Time Histories (EARTH): A metric to validate simulation models, M.S. Thesis, Department of Mechanical Engineering, University of Michigan, Ann Arbor, MI, USA.
• Sarin, H., Kokkolaras, M., Hulbert, G., Papalambros, P., Barbat, S., and R.-J. Yang (2010), Comparing Time Histories for Validation of Simulation Models: Error Measures and Metrics, Journal of Dynamic Systems, Measurement, and Control, Vol. 132, pp. 061401-1 – 061401-10.
UNCLASSIFIED: Distribution A. Approved for public release 21
• Matt Castanier • Ravi Thyagarajan • Sara Pace • Hao Pan • Gregory Hulbert • Michael Kokkolaras
Acknowledgments


