Computational Study of Compounds with
Application in Dye Sensitized Solar Cells
Narges Mohammadi
Dissertation submitted in fulfilment of requirements for the degree of
Doctor of Philosophy
Faculty of Science, Engineering and Technology
Swinburne University of Technology
Australia
2014

Copyright © 2014
By Narges Mohammadi

i
Abstract
The global need for energy is estimated to double by 2050 and triple by the end of
this century. Currently, fossil fuels are the primary source for energy supply in the
world. However, the excessive use of fossil fuels has resulted in serious
environmental impact such as global warming. Another major problem is the
limited resources of fossil fuels. As a result of these problems associated with
fossil fuels, the demand for replacing them with clean, renewable and
sustainable energy sources is increasing.
Solar energy is the largest source of clean energy readily available. Nevertheless,
it is not the main source of electricity power generation yet; mainly because of the
high price of the current conventional silicon-based solar cells. Dye sensitized
solar cells (DSSC) are a newer type of solar cells. They have gained considerable
attention in the last two decades, as potentially inexpensive alternative to
conventional costly silicon solar cells. However, their efficiencies are still lower
than the traditional solar cells. DSSC is a complex device composed of several
components. That is, the conversion of solar radiation into electrical energy in this
device relies on the interplay of several key components. The unique architecture
of DSSC provides numerous possibilities to alter its components. As a result, over
the past twenty years a considerable and increasing amount of research efforts
have been devoted to design and synthesis new materials such as dye sensitizers
as a route to improve DSSC’s power conversion efficiency. However, most of
such efforts have been based on the costly and time-consuming synthesis
procedures. This drawback calls for applying new methods such as computational
modelling and rational designing of new materials.
This thesis has focused on the state-of-the-art computational methods to study,
model and rationally design compounds for application in DSSC. Two main
components of DSSC, i.e. the dye sensitizer and the redox mediator have been the
subject of this thesis. The density functional theory (DFT) and time dependent
DFT (TD-DFT) methods have been employed. The electronic structures of two
already well-performing reference dyes, TA-St-CA and Carbz-PAHTDDT, have
ii
been studied quantum mechanically. New dyes have been rationally designed by
chemically modifying these reference dyes. In order to improve the light
harvesting efficiency of the cell, the rational design of the dyes have been aimed
at producing new sensitizers with reduced energy gap between the highest
occupied molecular orbital (HOMO) and the lowest unoccupied molecular orbital
(LUMO), as well as enhanced red-shifted electronic absorption spectra, with
respect to the reference dyes.
Computational methods are powerful tools to study and design new materials for
DSSC. Dewar's rules which are based on perturbational molecular orbital theory
have been applied to design a number of new dyes based on the reference TA-St-
CA dye. Dewar's rules have been found to serve as a good indicator for
determination of the appropriate substitution positions on the π-conjugated bridge
of the reference dye. Two new dyes have also been designed by modifying the
donor group of the TA-St-CA dye. This thesis reveals that for this reference dye,
the donor modifications have more profound impact on the absorption spectra
compared to the linker alternations.
Two new carbazole-based organic dye sensitizers have also been designed
through chemical modifications of the π-conjugated bridge of the Carbz-
PAHTDDT (S9) dye. Reduced HOMO-LUMO gap and red-shifted absorption
spectra have been achieved for both new dyes. It is also found that the long-range
correction to the theoretical model in the TD-DFT simulation is important to
produce accurate absorption wavelengths for this reference dye and its derivatives.
This thesis has further studied the electronic structure, molecular properties and
conformers of ferrocene (Fc) as an important candidate for the redox mediator of
DSSC. This thesis has found a fingerprint in the infrared (IR) spectral region of
450–500 cm−1 of ferrocene as a key to differentiate its eclipsed and staggered
conformers. It is shown that the basis set plays an important role in the accuracy
of DFT calculations of ferrocene and the B3LYP/m6-31G(d) model provides
excellent agreement with experiments on the simulated IR spectra of Fc. The
B3LYP/m6-31G(d) model is also found to be a very efficient and accurate model
for calculations of the redox potential of the Fc/Fc+ redox couple.

iii
To my beloved Alireza, Mom and Dad

iv
Acknowledgment
I take this opportunity to express my profound gratitude and deep regards to my
supervisor, Professor Feng Wang, for the continuous support of my PhD study
and research. I would like to thank her for encouraging my research and for
allowing me to grow as an independent research scientist. I would also like to
thank my other supervisor, Dr. Peter J Mahon, for the assistance he provided at all
levels of the research project.
I am grateful for the funding sources and high-tech facilities that made this
research project possible. I would like to acknowledge the Swinburne University
of Technology for the Vice-Chancellors’ Postgraduate Research Award and also
the Australian Government for the International Postgraduate Research
Scholarship (IPRS), that provided the necessary financial support for this
research. The library facilities and the high performance supercomputing facilities
of the Swinburne University have been indispensable. I also acknowledge the
Victorian Partnership for Advanced Computing (VPAC) for supercomputing
facilities. I acknowledge the THz/Far-IR beamline at the Australian Synchrotron,
Victoria, Australia. I also thank the Australian Synchrotron for travel funding
under the International Synchrotron Access Program (ISAP) to access the
GasPhase beamline at the Elettra Sincrotrone Trieste, Italy.
I have been very privileged to get to know and to collaborate with many great
people. I thank Professor Christopher T. Chantler (School of Physics, The
University of Melbourne, Australia) for the motivation of the ferrocene study, as
well as his continuous collaboration and support for this research work.
Appreciation also goes out to Dr. Stephen Best (School of Chemistry, The
University of Melbourne, Australia) for his collaboration and support in this work
and for providing the experimental FTIR data of ferrocene. He has patiently
taught me many new things and helped me get confidence to do experimental
work at Australian Synchrotron. Thank you Dr. Stephen Best. A very special
thanks goes out to Professor Kevin C. Prince (Elettra Sincrotrone Trieste, Italy)

v
for his kind support and hospitality during my visit. I also thank Dr. Dominique
Appadoo (THz/Far-IR beamline, Australian Synchrotron) for his technical support
to measure the experimental IR data of ferrocene in gas-phase. I would also like to
thank Dr. Bob Laslett for kindly letting me work as a lab demonstrator under his
guidance.
I owe my deepest gratitude to Dr. François Malherbe and Dr. Karen Farquharson.
I can’t say thank you enough for your tremendous support and help when I needed
it most.
I would like to show my gratitude to Professor Richard Sadus, Professor Billy
Todd, Ms. Jennifer Lim, Ms. Alyssa Wormald, Ms. Robyn Watson and Ms.
Hayley Mowat. Thank you for your smile, positiveness and the assistance you
provided to me in the past four years.
My sincere thanks goes to all my friends in Swinburne University. We have
shared many smiles and many tears, and you became a part of my life. Thank you
Lalitha, Fangfang, Anoja, Aravindhan, Marawan, Bita, Azadeh, Sanjida, Ronit
and Qudsia for your friendship.
I would like to thank my loved ones, who have supported me throughout entire
life. Mom and Dad, it's impossible to thank you adequately for everything you've
done, for your love, encouragement, support, and patience. Thank you for
everything. Thank you my dear Parisa, Najmeh, Javad, and my always little cute
ones, Kosar, Mohammad, Yasmin, and Orkideh. You enlighten my life.
I have saved the last words of acknowledgment for my better half and beloved
Alireza. Thank you for your unconditional love and endless support. You have
been by my side throughout this journey, living every single minute of it. I love
you.
vi
Declaration
I hereby declare that the thesis entitled “Computational study of compounds with
application in dye sensitized solar cells”, which is submitted in fulfilment of the
requirements for the degree of Doctor of Philosophy in the Swinburne University
of Technology, is my own work. To the best of my knowledge and belief, it
contains no material previously published or written by another person, except
where due references are made in the text of the thesis. Any contribution made to
the research by colleagues, with whom I have worked at Swinburne or elsewhere,
during my candidature, is fully acknowledged. I affirm that this thesis contains no
material, which has been accepted for the award to the candidate of any other
degree or diploma.
Narges Mohammadi
April 2014
vii
Refereed Publications
• Mohammadi, N., & Wang, F. (2014). First-principles study of Carbz-PAHTDDT dye sensitizer and two Carbz-derived dyes for dye sensitized solar cells. Journal of Molecular Modeling, 20(3), 2177.
• Ganesan, A., Mohammadi, N., & Wang, F. (2014). From building blocks of proteins to drugs: A quantum chemical study on structure-property relationships of phenylalanine, tyrosine and dopa. RSC Advances, 4 (17), 8617–8626.
• Mohammadi, N., Mahon, P. J., & Wang, F. (2013). Toward rational design of organic dye sensitized solar cells (DSSCs): an application to the TA-St-CA dye. Journal of Molecular Graphics and Modelling, 40, 64-71.
• Mohammadi, N., Ganesan, A., Chantler, C. T., & Wang, F. (2012). Differentiation of ferrocene D5d and D5h conformers using IR spectroscopy. Journal of Organometallic Chemistry, 713(0), 51-59.
• Chantler, C. T., Rae, N. A., Islam, M. T., Best, S. P., Yeo, J., Smale, L. F., Hester, J., Mohammadi, N., & Wang. F. (2012). Stereochemical analysis of ferrocene and the uncertainty of fluorescence XAFS data. Journal of Synchrotron Radiation, 19, 145-158.
• Ivanova, E. P., Truong, V. K., Webb, H. K., Baulin, V. A., Wang, J. Y., Mohammodi, N., Wang, F., Fluke, C., & Crawford, R. J. (2011). Differential attraction and repulsion of Staphylococcus aureus and Pseudomonas aeruginosa on molecularly smooth titanium films. Scientific Reports, 1, 165.
• Mohammadi, N., Wang, F. (Accepted, to be published in April 2015). Application of Computational Methods to the Rational Design of Photoactive Materials for Solar Cells. In Computational Chemistry Methodology in Structural Biology and Material Sciences. Apple Academic Press (USA and Canada).

viii
Conference Presentations
• Mohammadi, N., Wang, F., Best, S., Appadoo, D., Islam, T. M., & Chantler, C. T. (2013). Use of IR spectra and isotope label to probe ferrocene conformers: theory and experiment. Australian Synchrotron User Meeting 2013, Melbourne, Australia, December 2013 (Poster Presentation).
• Mohammadi, N., Arooj, Q. & Wang, F. (2013). XPS studies of (S)-α-(Z-Amino)-γ-butyrolactone, a signaling molecule in bacterial cell communication. Australian Synchrotron User Meeting 2013, Melbourne, Australia, December 2013 (Poster Presentation).
• Mohammadi, N., & Wang, F. (2013). TD-DFT Simulation of the UV-Vis Spectra of Ferrocene. 38th International conference on Vacuum Ultraviolet and X-ray Physics, Hefei, Anhui Province, China, 12-19 July, 2013. (Poster Presentation).
• Wang, F., & Mohammadi, N. (2013). Use of IR spectra to probe ferrocene conformers: theory and experiment. 4th Asian Spectroscopy Conference, Singapore, December 15-18, 2013. (Oral Presentation).
• Mohammadi, N., & Wang, F. (2012). Bathochromic shift in photoabsorption spectra of organic dye sensitizers through structural modifications for better solar cells. 20th Australian institute of physics congress, University of New South Wales, Australia, 9-13 December 2012 (Oral Presentation).
• Mohammadi, N., & Wang, F. (2012). Toward rational design of organic dye sensitized solar cells through chemical modifications: an application to the TA-St-CA dye, Melbourne Meeting of Molecular Modellers, University of Melbourne, Australia, 25 September 2012 (Poster Presentation).
• Uppiah, O. J., Mohammadi, N., & Wang, F. (2012). Sugar saturation of nucleoside antibiotics revealed by simulated IR spectra: Thymidine and Stavudine. Melbourne Meeting of Molecular Modellers, University of Melbourne, Australia, 25 September 2012 (Poster Presentation).
• Mohammadi, N., & Wang, F. (2011). A computational study of the HOMO-LUMO gap reduction through modifications of the π –conjugated bridge of TA-St-CA organic dye. Australian Synchrotron User Meeting 2011, Melbourne, Australia, December 2011 (Poster Presentation).
• Mohammadi, N., & Wang, F. (2010). A study of phenothiazine using quantum mechanical modeling. MM2010 - Molecular modelling for the life and materials sciences, Melbourne, Australia, 28th November-1st December 2010 (Poster Presentation).
ix
Contents
List of figures xii
List of tables xvi
List of abbreviations xviii
1. Introduction 1
1.1. Background 1
1.2. Dye sensitized solar cells 4
1.3. Device structure and working principles 6
1.3.1. The semiconducting photoanode 7
1.3.2. Redox shuttles 8
1.3.3. Dye sensitizers 10
1.3.3.1. Features of ideal dye sensitizers 12
1.4. Motivation of this thesis 15
1.4.1. Rational design of organic dyes 17
1.5. The aim, focus and overview of this thesis 21
References 24
2. Methods and theoretical details 35
2.1. Introduction 35
2.2. Background 36
2.3. The time-independent Schrödinger equation 37
2.4. The Born-Oppenheimer approximation 39
2.5. Hartree-Fock theory 41
2.6. Molecular orbital theory and basis set 46
2.7. Density functional theory 48
2.7.1. Hohenberg–Kohn theorems 50
2.7.2. Kohn–Sham approach 51
2.7.3. Approximate exchange-correlation functionals 52
2.8. Time-dependent density functional theory 54
2.9. Potential energy surface and geometry optimization 56

x
2.10. Vibrational frequency calculation 57
2.11. UV-Vis spectroscopy 58
2.12. Solvent effects 60
References 62
3. Rational design of new dyes based on TA-St-CA sensitizer 70
3.1. Introduction 70
3.2. Dewar’s rules and design of new dyes 73
3.3. Computational details 77
3.4. Molecular properties 78
3.5. Frontier molecular orbital analysis 82
3.6. UV-Vis absorption spectra 86
3.7. Summary and conclusions 95
References 96
4. Novel annulene-based dyes 101
4.1. Introduction 101
4.2. Design of the new dyes 102
4.3. Computational details 107
4.4. Geometrical details 108
4.5. Frontier molecular orbital analysis 115
4.6. UV-Vis absorption spectra 117
4.7. Molecular orbital spatial distribution 121
4.8. Summary and conclusions 124
References 126
5. Carbz-PAHTDDT dye and its derivatives 130
5.1. Introduction 130
5.2. Methods and computational details 132
5.3. Molecular structures and design of the new dyes 135
5.4. Frontier molecular orbitals 142
5.5. Nonlinear optical properties 147
5.6. Excitation energies and UV-Vis spectra 150
5.7. Summary and conclusions 154
References 156

xi
6. Ferrocene 162
6.1. Introduction 162
6.2. Computational methods and experimental details 163
6.3. Ferrocene structure 166
6.3.1. Geometries and potential energy scan 170
6.3.2. Molecular electrostatic potential 178
6.3.3. Infrared spectroscopy of ferrocene in isolation 180
6.3.4. Differentiation of the D5h and D5d conformers 186
6.3.5. Influence of deuteration on the IR spectra 189
6.3.6. Infrared spectroscopy of ferrocene in solution 195
6.4. Ferrocene-based electrolyte 205
6.4.1. Ferrocene/ferrocenium redox potential 205
6.5. Conclusions 209
References 211
7. Summary, conclusions and outlook 220
Appendix 226
xii
List of Figures
Fig.1.1: Schematic illustration of DSSC structure and components and
working principle of a typical DSSC.
6
Fig.1.2: Structure of the representative members of the Ru-based dyes:
N3, N719 and black dye.
10
Fig.1.3: The photon flux density of solar radiation. 13
Fig.1.4: A scheme of D-π-A dye configuration. 19
Fig.1.5: The cyanoacrylic acid acceptor/anchoring group. 20
Fig.2.1: Various transitions between the bonding and anti-bonding
electronic states of a molecule, when light energy is absorbed.
59
Fig.3.1: Molecular structure of the reference TA-St-CA dye. 71
Fig.3.2: A scheme Dewar’s rules. 74
Fig.3.3: The structure of reference dye TA-St-CA. 78
Fig.3.4: The calculated frontier MO energy levels using PBE0/6-31G*
in vacuum.
83
Fig.3.5: Comparison of the charge density of HOMOs and LUMOs of
the new dye, ED-I and EW-I with respect to those of the
reference TA-St-CA dye.
86
Fig.3.6: The simulated UV–Vis absorption spectra of TA-St-CA dye in
gas-phase and ethanol solution, compared with the
experimental spectra in ethanol solution.
87
Fig.3.7: The simulated UV–Vis absorption spectra of TA-ST-CA dye
and its substituted new dyes generated from the substitutions
of –NH2, and (b) from –N(CH3)2 ED groups.
89
xiii
Fig.3.8: The simulated UV–Vis absorption spectra of TA-ST-CA dye
and its substituted new dyes generated from the substitutions
of the electron withdrawing group (–CN).
90
Fig.4.1: Molecular structure of different annulenes. 102
Fig.4.2: Molecular structure of the reference TA-St-CA sensitizer and
new dyes AN-14 and AN-18.
106
Fig.4.3: Optimized 3D structures of the new dyes AN-14 and AN-18. 109
Fig.4.4: Optimized 3D structure and labelling of the [14]-annulene
ring.
110
Fig.4.5: Optimized 3D structure and labelling of the [18]-annulene
ring.
113
Fig.4.6: The calculated frontier MO energy levels using PBE0/6-31G*
model in vacuum.
115
Fig.4.7: The simulated UV–Vis absorption spectra of the TA-ST-CA,
AN-14 and AN-18 in ethanol solution.
119
Fig.4.8: Comparison of the HOMOs and LUMOs of the new dye, AN-
14 and AN-14 with respect to those of the reference dye.
122
Fig.5.1: Optimized 3D structures of the reference Carbz-PAHTDTT
(S9) dye sensitizer.
135
Fig.5.2: Optimized 3D structures of S9, S9-D1 and S9-D2. 138
Fig.5.3: Sketch of the reference S9 dye and the structure of the bridge
of S9, S9-D and S9-D2 dyes showing NBO charge of atoms.
140
Fig.5.4: Calculated frontier MO energy levels using B3LYP/6-
311G(d)// PBE0/6-311G(d) model in DCM solution.
144
Fig.5.5: Comparison of the charge density of HOMOs and LUMOs of
the reference S9 dye, and the new S9-D1 and S9-D2 dyes.
146
Fig.5.6: The simulated UV-Vis spectra of three dyes, S9, S9-D1 and
S9-D2 using TD-BHandH/6-311G(d) model in DCM solution.
154

xiv
Fig.6.1: Proposed structures for ferrocene: stretched, sandwich and
double cone.
167
Fig.6.2: Optimized molecular structures of the eclipsed (D5h) and
staggered (D5d) conformers of ferrocene in (3D) space.
168
Fig.6.3: Optimized molecular structures of the eclipsed conformer of
ferrocene in 3D space, visualized by different GUI tools.
171
Fig.6.4: Molecular orbital diagrams of ferrocene conformers. 174
Fig.6.5: The highest occupied molecular orbitals (HOMOs) and the
lowest unoccupied molecular orbitals (LUMOs) of D5h and D5d
conformers of ferrocene.
176
Fig.6.6: Potential energy scan (PES) of the dihedral angle rotating the
axis connecting the middle Fe atom as well as the centres of
two Cp rings.
177
Fig.6.7: Two-dimensional (2D) cross sections of the molecular
electrostatic potential (MEP) of ferrocene
179
Fig.6.8: Comparison of the simulated and the experimental IR spectra
of ferrocene in the region of 400-1200 cm-1.
181
Fig.6.9: Comparison of simulated IR spectra of ferrocene, D5h and D5d
in vacuum in the region of 400-4000 cm-1.
183
Fig.6.10: Comparison of high resolution (FWHM =5 cm-1) IR spectra of
D5h and D5d ferrocene based on in the region of 400-650 cm-1.
186
Fig.6.11: The IR spectra of the eclipsed (D5h) and staggered (D5d)
ferrocene in the fingerprint region.
188
Fig.6.12: The IR spectra of the eclipsed (D5h) and staggered (D5d)
ferrocene (Fc-h-10) and deuterated ferrocene (Fc-d-10).
190
Fig.6.13: The IR spectra of ferrocene (Fc-h-10) and deuterated ferrocene
(Fc-d-10) in the fingerprint region.
194

xv
Fig.6.14: Measured FTIR spectra of ferrocene in the region of 400-1200
cm-1 in a number of solvents at room temperature.
196
Fig.6.15: The measured IR spectrum of Fc in acetonitrile solution with
the simulated infrared spectra inthe region of 400-1200 cm-1.
198
Fig.6.16: The simulated IR spectra of eclipsed Fc in the DOX solution
using PCM, CPCM and SMD solvation models with the FTIR
spectral measurement.
202
Fig.6.17: Comparison of the simulated IR spectra of the eclipsed Fc in
the region of 400-600 cm-1 with the FTIR measurement in
various solvents.
204

xvi
List of Tables
Table.3.1: Molecular structure of the TA-ST-CA dye and new dyes. 75
Table.3.2: Molecular properties of the new dyes and the reference TA-
ST-CA dye.
81
Table.3.3: Calculated excited energy (in nm), transition configuration,
and oscillator strengths (f) for the two most intense peaks of
TA-ST-CA dye and the new dyes in ethanol solution.
91
Table.3.4: Comparison of the substitution effects on the energies of the
HOMOs, LUMOs, the HOMO-LUMO energy gap, shift of
the spectral peaks and spectral widths in ethanol solution.
94
Table.4.1: Compression of the optimized geometries of the [14]-
annulene ring of the present work with data reported in
literature.
112
Table.4.2: Compression of the optimized geometries of the [18]-
annulene ring of the present work with data reported in
literature.
114
Table.4.3: Calculated excited energy (in nm), transition configuration,
and oscillator strengths (f) for the two most intense peaks of
TA-ST-CA dye and the new dyes in ethanol solution.
120
Table.5.1: The selected bond length, dihedrals, π-lengths and dipole
moment of the S9, S9-D1 and S9-D2 dyes.
142
Table.5.2: Energy levels of HOMO, LUMO and HOMO-LUMO gap
calculated by different functionals.
143

xvii
Table.5.3: The first total hyperpolarizability (βtot), isotropic
polarizability (α) and polarizability anisotropy (Δα) of S9,
S9-D1 and S9-D2 dyes.
149
Table.5.4: Calculated excited energy (in nm), oscillator strengths (f),
and transition configurations for the three most intense peaks
of S9, S9-D1 and S9-D2 dyes in DCM solution.
151
Table.6.1: Comparison of the optimized geometries of eclipsed and
staggered conformers of ferrocene.
172
Table.6.2: Calculated IR frequencies and their assignment for the D5h
and D5d conformers of ferrocene using the B3LYP/m6-
31G(d) model.
185
Table.6.3: Calculated IR frequencies and their assignment for the D5h
and D5d conformers of Fc-h-10 and Fc-d-10 and their
corresponding spectral shifts.
191
Table.6.4: Comparison of the measured Fc spectral peak positions in
various solvents and available experiment and calculations.
197
Table.6.5: Comparison of the measured and simulated Fc IR spectral
peak positions in various solvents in the region of 400-1200.
cm-1.
200
Table.6.6: Calculated values required to obtain the redox potential of
Fc/Fc+ in DSMO solution.
208

xviii
List of Abbreviations
ACN Acetonitrile
BO Born-Oppenheimer approximation
Cp Cyclopentadiene
CT Charge-Transfer
DCM Dichloromethane
DFT Density Functional Theory
DMSO Dimethyl Sulfoxide
DOX Dioxane
D-PCM Dielectric Polarized Continuum Model
DSSC Dye Sensitized Solar Cells
D-π-A Donor-π linker-Acceptor
ED Electron-Donating
EDS Electron Donating Substitution
EDS Electron Donating Substitutions
EW Electron-Withdrawing
Fc Ferrocene
Fc/Fc+ Ferrocene/Ferrocenium
FTIR Fourier Transform Infrared Spectroscopy
GED Gas phase Electron Diffraction
GUI Graphical User Interface
HF Hartree-Fock
HK Hohenberg-Kohn
HOMO Highest Occupied Molecular Orbital
I−/I3− Iodide/Triiodide
ICT Intra-molecular Charge Transfer
IR Infrared
IUPAC International Union of Applied Chemistry
LUMO Lowest Unoccupied Molecular Orbital

xix
MEP Molecular Electrostatic Potential
MO Molecular Orbitals
NBO Natural Bond Orbital
NLO Nonlinear Optical
PCM Polarizable Continuum Model
PES Potential Energy Scan
PES Potential Energy Surface
PMO Perturbation Molecular Orbital Theory
PV Photovoltaics
SCE Saturated Calomel Electrode
SMD Solute Molecule Density
SS-DSSC Solid State DSSC
TD-DFT Time Dependent Density Functional Theory
THF Tetrahydrofuran
TiO2 Titanium Dioxade
TPA Triphenylamine

1
Chapter 1
Introduction “When the sun is shining I can do anything; No mountain is too high,
no trouble too difficult to overcome.” Wilma Rudolph
1.1. Background As the world’s population increases and lifestyles becomes more dependent on
new technologies and machines, the world energy consumption increases. The
global need for energy is estimated to double by 2050 [1]. Currently, carbon-
based fossil fuels such as oil, coal, and natural gas provide the majority of our
primary energy needs which is about 14 terawatts (TW). There are a couple of
major problems with this sort of energy: the limited reserves of fossil fuels and the
environmental impact. As an example, generating electricity in Australia relies
mainly on coal. The coal industry is the largest contributor to Australia's total
greenhouse gas emissions (approximately 38%) [2]. Other air pollutants, such as
nitrogen oxides, sulphur dioxide, volatile organic compounds and heavy metals
are the other consequences of the combustion of fossil fuels. As a result of these
major problems, clean and sustainable energy sources become of dramatic
importance.

Introduction Chapter 1
2
There are several renewable alternatives for energy existing today such as:
hydropower, wind, biomass, geothermal and solar sources. Among them, solar
energy is the most abundant source of clean energy which is readily available. The
sun radiates about 100,000 TW of energy to the surface of the earth [3, 4].
Conversion of only a fraction of this abundant energy to other usable energy
forms, such as heat or electricity, can meet most of our energy needs. Today,
electricity production from solar radiation, which is known as photovoltaics (PV),
is in the frontline of the research and development of solar-based renewable
energy. Photovoltaics technology is capable of generating direct current (DC)
electricity from the semiconductors that are illuminated by photons [5].
The discovery of photovoltaic effect dates back to 1839 by a French physicist
named Edmond Becquerel [6]. He observed an electric current by illuminating
two metal sheets (electrodes) which were dipped into an electrolyte solution [7].
However, it wasn’t until 1905 when Albert Einstein explained these observations
in terms of “photoelectric effects” being the result from the “light quanta”, which
means that light energy is carried in discrete quantized packets [8]. As a result of
this work, the 1921 Nobel Prize in Physics was awarded to Einstein “especially
for his discovery of the law of the photoelectric effect” [9]. Moreover, this
revolutionary discovery by Einstein was central to the early development of
quantum theory.
Photovoltaic cells, also known as solar cells, are the electric devices which can
directly generate electricity when they are illuminated by the sun. The most
conventional type of solar cells (also known as first generation) are based on
crystalline silicon wafers [10]. Today, most of the commercially produced
residential solar panels belong to this generation. In spite of showing a high
efficiency of up to 25% [11], the high cost of the energy-intensive manufacturing
processes of this type of solar cells have limited this technology and stimulated
the development of other technologies such as “thin-film” solar cells (also known
as the second generation). The most commonly used materials for thin-film
photovoltaics are cadmium telluride (CdTe), copper indium gallium selenide

Introduction Chapter 1
3
(CIGS) and amorphous silicon. The costs associated with their productions are
far less than the first generation, as they require less material to be produced.
However, the efficiencies of thin-film cells are also lower than the first
generation. Their wide-spread production and application is also limited by the
scarcity of their materials (e.g. indium, selenium and tellurium), as well as the
high toxicity of cadmium [12]. Finally, the third generation of solar cells
encompasses all emerging technologies, based on various new materials, to
develop new PV devices. The focal point of the third generation is producing
more cost-effective and more efficient solar cells for different types of
applications.
The dye sensitized solar cell (DSSC) is a representative member of the third
generation of the PV devices. The DSSC differs from the conventional solar cells
in design and working principles. In conventional solar cells, the semiconductor is
responsible for both absorbing the light and transporting the charge. In contrast, a
DSSC separates these two tasks. That is, light is absorbed by a dye, with charge
separation and electron transport taking place at a semiconductor electrode (e.g.
titanium dioxide).
In the past twenty years, researchers have shown an increased interest in the
development and investigation of this type of solar cell. DSSCs are attractive
because they are economically viable, owing to cost-effective materials and
fabrication processes associated with them. The main focus of this thesis is on the
DSSC. As a result, the rest of the present chapter is aimed at introducing this type
of solar cell and the rationale behind this thesis.

Introduction Chapter 1
4
1.2. Dye sensitized solar cells Dye sensitized solar cells are developed by inspiration from the nature. These
cells are able to mimic the charge separation process which takes place during
photosynthesis in plants. The stacked structure of titanium dioxide semiconductor
in DSSC also resembles the piled thylakoid membrane in green leaves [13]. Such
unique structure and process of electron generation and charge separation in
DSSC differentiates it from all other solar cells.
Dye sensitization of wide band gap semiconductors, such as titanium dioxide
(TiO2), forms the basic idea of dye sensitized solar cells. The electronic band gap
of TiO2 is about 3.2 eV [14], which is much greater than that of the commonly
used silicon semiconductor (1.1 eV) in conventional solar cells. As a result, wide
band gap semiconductors are not able to absorb most of the solar emission
themselves and need to become sensitive to the visible light by means of dye
sensitizers. However, wide band gap semiconductors have several important
advantages over the silicon-based semiconductor. They are very inexpensive,
abundant and stable.
Prior to the invention of DSSC, this concept (i.e. dye sensitization of wide band
gap semiconductors) had been employed in technologies such as colour
photography and xerography [15]. Application of this concept to the
photoelectrochemical (PEC) processes had been reported since late 1960s. For
example, Gerischer and Tributsch [16] and Hauffe et al. [17] first investigated the
sensitization of wide band gap semiconductor zinc oxide (ZnO) by organic dyes.
A photo conversion efficiency of 1% was achieved by Tsubomura et al. in 1976
for a dye sensitized zinc oxide photo cell [18]. Dye sensitization of titanium
dioxide (TiO2) can be traced back to Chen et al. who reported such usage in a US
patent issued in late 1978 [19].
The real breakthrough in the field of dye-sensitized solar cell (DSSC) research
resulted from the work of Grätzel and O’Regan which was published in 1991 [20].
Introduction Chapter 1
5
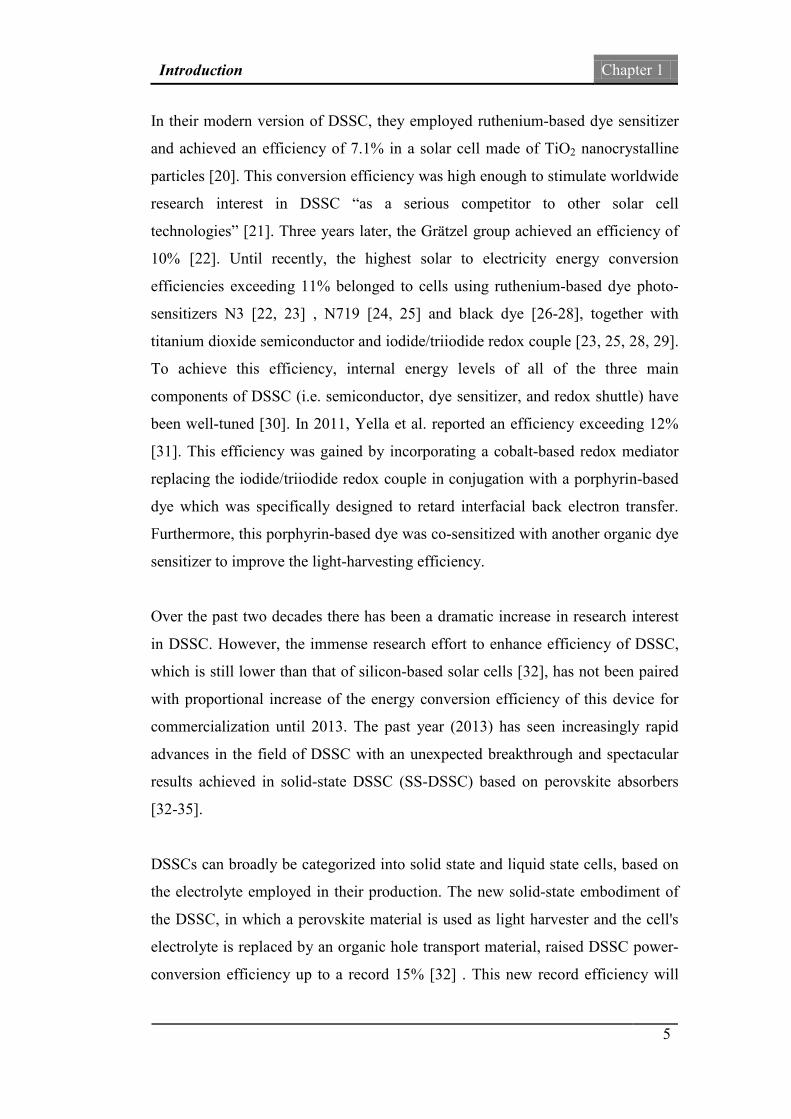
In their modern version of DSSC, they employed ruthenium-based dye sensitizer
and achieved an efficiency of 7.1% in a solar cell made of TiO2 nanocrystalline
particles [20]. This conversion efficiency was high enough to stimulate worldwide
research interest in DSSC “as a serious competitor to other solar cell
technologies” [21]. Three years later, the Grätzel group achieved an efficiency of
10% [22]. Until recently, the highest solar to electricity energy conversion
efficiencies exceeding 11% belonged to cells using ruthenium-based dye photo-
sensitizers N3 [22, 23] , N719 [24, 25] and black dye [26-28], together with
titanium dioxide semiconductor and iodide/triiodide redox couple [23, 25, 28, 29].
To achieve this efficiency, internal energy levels of all of the three main
components of DSSC (i.e. semiconductor, dye sensitizer, and redox shuttle) have
been well-tuned [30]. In 2011, Yella et al. reported an efficiency exceeding 12%
[31]. This efficiency was gained by incorporating a cobalt-based redox mediator
replacing the iodide/triiodide redox couple in conjugation with a porphyrin-based
dye which was specifically designed to retard interfacial back electron transfer.
Furthermore, this porphyrin-based dye was co-sensitized with another organic dye
sensitizer to improve the light-harvesting efficiency.
Over the past two decades there has been a dramatic increase in research interest
in DSSC. However, the immense research effort to enhance efficiency of DSSC,
which is still lower than that of silicon-based solar cells [32], has not been paired
with proportional increase of the energy conversion efficiency of this device for
commercialization until 2013. The past year (2013) has seen increasingly rapid
advances in the field of DSSC with an unexpected breakthrough and spectacular
results achieved in solid-state DSSC (SS-DSSC) based on perovskite absorbers
[32-35].
DSSCs can broadly be categorized into solid state and liquid state cells, based on
the electrolyte employed in their production. The new solid-state embodiment of
the DSSC, in which a perovskite material is used as light harvester and the cell's
electrolyte is replaced by an organic hole transport material, raised DSSC power-
conversion efficiency up to a record 15% [32] . This new record efficiency will
Introduction Chapter 1
6
open a new era of DSSC development. However, the focus of this thesis is only
on the liquid state DSSC, as this “game changing breakthrough” in SS-DSSC was
introduced just towards the completion of this thesis.
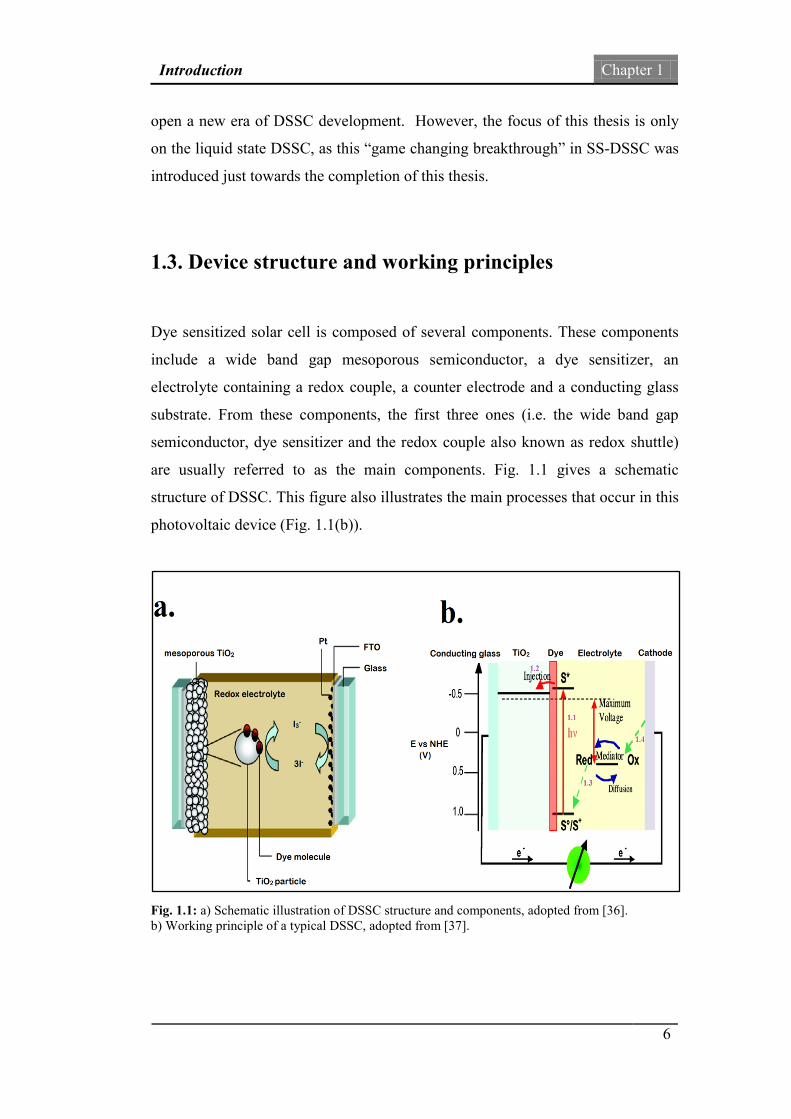
1.3. Device structure and working principles
Dye sensitized solar cell is composed of several components. These components
include a wide band gap mesoporous semiconductor, a dye sensitizer, an
electrolyte containing a redox couple, a counter electrode and a conducting glass
substrate. From these components, the first three ones (i.e. the wide band gap
semiconductor, dye sensitizer and the redox couple also known as redox shuttle)
are usually referred to as the main components. Fig. 1.1 gives a schematic
structure of DSSC. This figure also illustrates the main processes that occur in this
photovoltaic device (Fig. 1.1(b)).
Fig. 1.1: a) Schematic illustration of DSSC structure and components, adopted from [36]. b) Working principle of a typical DSSC, adopted from [37].

Introduction Chapter 1
7
As shown in Fig 1.1(a), the working electrode or photoanode of DSSC is
constructed from a mesoporous oxide layer of TiO2 nanoparticles (or other wide
band gap mesoporous semiconductor networks), which are deposited on a
transparent conducting substrate. This substrate is usually a glass coated with
fluorine-doped tin oxide (FTO). A monolayer of the charge-transfer dye sensitizer
is attached to the surface of the nanocrystalline film (TiO2) by chemical bonding.
The mesoporous oxide layer provides a high internal surface area to adsorb as
many dye sensitizer molecules as possible. By employing a high surface area, the
light harvesting efficiency (LHE) of the cell is increased. The electrolyte (or hole
conductor) of a conventional DSSC (liquid state DSSC as mentioned previously)
is usually an organic solvent containing the iodide/triiodide (I−/I3−) redox system.
This component is responsible for the regeneration of the sensitizer. The counter
electrode of a conventional DSSC consists of a thin catalytic layer of platinum
which is deposited onto a conducting glass substrate.
1.3.1. The semiconducting photoanode
In a DSSC, light is absorbed by a dye sensitizer which is grafted onto the
semiconductor surface through a suitable anchoring group. Incident photons, with
enough energy to be absorbed, create an excited state of the dye (Fig. 1.1(b)).
TiO2|S + ℎ𝑣 → TiO2|S∗ (1.1)
where TiO2 is the semiconductor and, S*, represents the excited sensitizer. Please
note that titanium dioxide (TiO2) is by far the most employed oxide
semiconductor and we will use it to represent the semiconductor.
The excited dye rapidly injects an electron into the conduction band of the TiO2
resulting in an oxidized state of the photo sensitizer.
TiO2|S∗ → TiO2|S+ + 𝑒𝑐𝑏 − (1.2)

Introduction Chapter 1
8
where, 𝑒𝑐𝑏− , stands for an electron in conduction band of semiconductor and, S+, is
the oxidized dye.
Electrons that are injected into the conduction band of the TiO2 are then
transported between TiO2 nanoparticles by diffusion and will be collected at the
front-side transparent conducting oxide (TCO) electrode and reach the counter
electrode through the external load and wiring. A plethora of materials is available
for different components of dye sensitized solar cells. For example, alternative
metal oxides to the standard TiO2 semiconductor include SnO2 [38-42], ZnO [43-
46], and Nb2O5 [47-50].
1.3.2. Redox shuttles
The oxidized dye is regenerated by accepting an electron from a redox shuttle
such as iodide/triiodide (I3-/I-
) dissolved in an organic solvent.
S+ +32
I− → S +12
I3− (1.3)
The oxidized form of the shuttle, I3-, diffuses to the counter electrode to be
reduced to I- ions to complete the circuit.
12
I3− + 𝑒𝑝𝑡
− →32
I− (1.4)
where, ept-, stands for the electron from the Pt-coated counter electrode.
Many attempts have been made to employ alternative redox couples to the
conventional iodide/triiodide (I−/I3−) redox mediator. The alternative redox
shuttles include organic redox systems (e.g. halogens [51-53], nitroxide radicals
[54-56] and sulphur-based [57, 58] mediators) and transition-metal redox couples
(e.g. ferrocene [59-61], copper (I/II) [62], cobalt (II/III) [31, 63-67] and nickel
Introduction Chapter 1
9
(III/IV) [68, 69] –based complexes) to name a few. Recent reviews have
summarized progress in electrolyte development [36, 59, 70, 71].
Until recently, the iodide/triiodide couple was the unsurpassed redox shuttle in
almost all high-efficiency DSSCs (η > 10%) [21, 72-74]. Its efficient dye
regeneration capability combined with its exceedingly slow interception of
injected electrons at the TiO2, which prevents loss of generated electrons, has
made it the most commonly used redox mediator [30, 61, 72, 75]. However, the
iodide/triiodide redox shuttle has several drawbacks, such as: (a) corrosiveness,
(b) limitations on the achievable open-circuit voltage and (c) incapability to
regenerate far-red-absorbing dyes at acceptable rates, which limits achievable
photocurrent and thus efficiency of the cell, to name a few [30, 59, 61, 63, 72, 75,
76]. As a result, many alternative redox couples have been reported [61, 75].
Among them are “one electron outer-sphere transition-metal” redox couples, such
as ferrocene/ferricinium (Fc/Fc+).
The ferrocene/ferricinium redox couple is a kinetically fast mediator which can
work under low driving force conditions. As a result, it is possible, in principle, to
reduce the redox potential difference between the dye and the electrolyte to
enhance the efficiency by employing ferrocene or its derivatives as the redox
shuttle in DSSC. However, due to the low efficiency of the cells in which Fc/Fc+
couple were employed, this redox mediator was not considered as a viable
alternate to iodide/triodide until 2012, when Daeneke et al. reported a promising
efficiency by coupling the Fc/Fc+ mediator with a novel dye sensitizer called
Carbz-PAHTDDT [59]. This impressive efficiency stimulated two chapters of this
thesis that will be discussed later.
Introduction Chapter 1
10
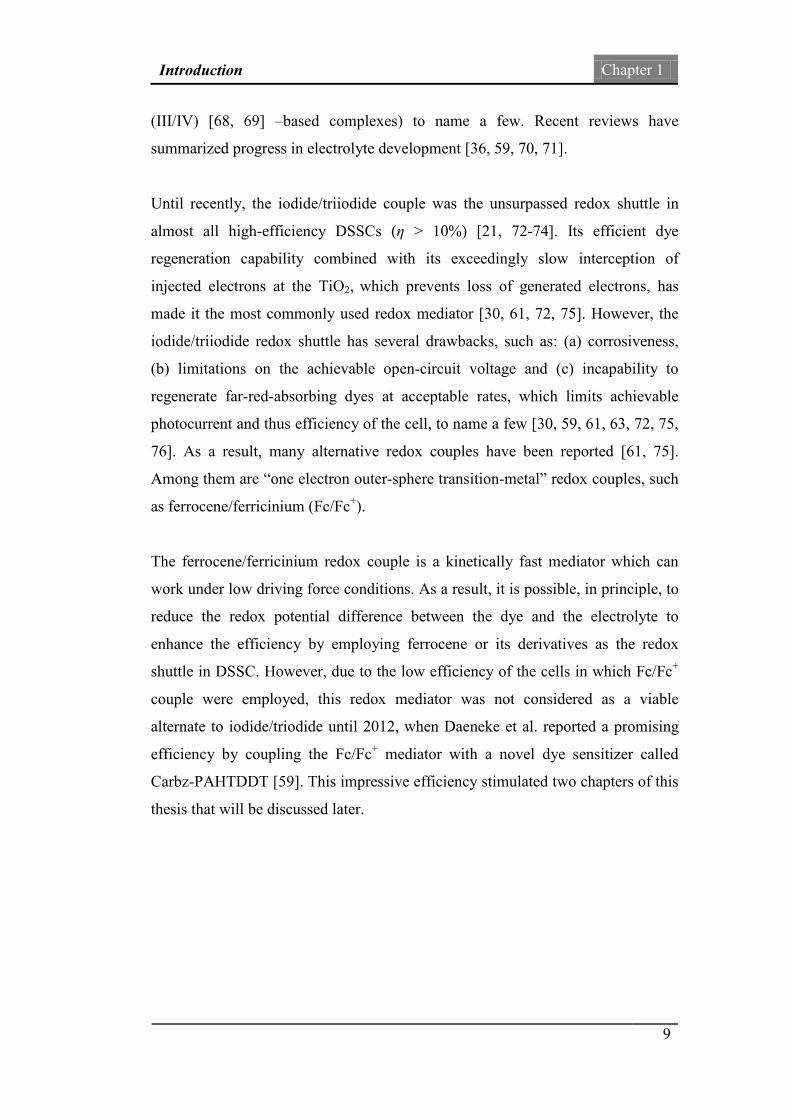
1.3.3. Dye sensitizers
As for the dye sensitizers, there are numerous classes of dyes available for
semiconductor sensitization [36, 77, 78]. Dye sensitizers can broadly be classified
into metal complexes and metal-free organic dyes. The former class of
compounds are typically functional ruthenium (II)–polypyridyl complexes. The
N3 [22], N719 [25] and black dye [26] (Fig. 1.2) are perhaps the most renowned
members of the ruthenium-based sensitizers for their superior performances over
other dyes. The good performances of these dyes are attributed to their broad
absorption through metal-to-ligand charge transfer (MLCT), the longer exciton
lifetime and their long-term chemical stability [79]. Several reviews have
summarized development of ruthenium (II)–polypyridyl complexes [80-83].
Metal-free all-organic dye sensitizers have several advantages over the metal
complexes (Ru) that can be listed as follows:
• High molar extinction coefficients. The molar absorption coefficient or molar
extinction coefficient is a measurement of how strongly a chemical species
absorbs light at a given wavelength. The high absorption coefficient feature of
organic dyes allows thinner layers of semiconductor nanoparticles to be
Fig. 1.2: Structure of the representative members of the Ru-based dyes: N3, N719 and black dye.

Introduction Chapter 1
11
exploited compared to metal-based dyes without a loss of comparable light-
harvesting efficiency [84-86].
• Relatively easy and low cost preparation process [84-86].
• Elimination of environmental issues as they don’t contain any rare materials
such as ruthenium [79].
• Their optical properties are easily tuneable [86].
• Organic dyes are suitable to construct semitransparent and/or multicolour
solar cells. This feature is useful in their application in power producing
windows as an example [85].
• Last but not the least, new organic dyes can be developed by rational design
methods [87]. This feature is central to the present thesis and will be explained
shortly in Section 1.4.1.
As a result of these attractive features, various metal-free dyes have been
developed and investigated intensively. These dyes may contain different
functional groups, such as indoline, triphenylamine, carbazole, coumarin,
merocyanine or fluorene moieties in their structures.
However, organic dyes are usually less efficient and practical compared to their
metal-based counterparts. The major factors hindering the efficiency of organic
sensitizers are: (a) relatively narrow absorption in the visible region; (b) shorter
exciton lifetimes in their excited states; (c) chemical and photochemical
degradation; and (d) aggregation.
This thesis will address the first disadvantage of metal-free organic dye
sensitizers, which is their absorption profile. One of the objectives of this research
is to design new dye sensitizers with better absorption properties. More
specifically, the new dyes should absorb the near infrared region of the spectrum,
as will be explained shortly. As a result, the following section gives a brief
overview of an ideal dye sensitizer which should be considered to design new
dyes.

Introduction Chapter 1
12
1.3.3.1. Features of ideal dye sensitizers
The ideal sensitizer should have several characteristics. It should absorb all light
below a threshold wavelength of about 920 nm (i.e. visible and near infra-red
spectrum) [36, 88, 89]. Up to now, no dye has been found that injects in the whole
visible and the near infra-red region (NIR) with the same efficiency. Most of the
well-performing dyes such as N3 ruthenium-based dye lack the absorption in the
NIR region (e.g. 750-900 nm).
The short-circuit current density of DSSC, Jsc, can be increased by extending the
absorption region of the dye sensitizer into near infra-red region. To better
understand how this happens, the photon flux density of solar radiation needs to
be considered. The photon flux is an important factor which influences the
number of electrons that can be generated and consequently determines the
electrical current produced from a solar cell. Fig. 1.3 (a) illustrates the photon flux
density of solar radiation on earth against the corresponding wavelength of the
photons and Fig. 1.3 (b) lists the expected current density by different harvesting
degrees. As seen in the figure, the photon flux exhibits a non-uniform distribution,
with the highest photon flux density observed in ca. 600-800 nm [79].
From Fig. 1.3 (b) it can be interpreted that if a dye sensitizer absorbs all solar
radiation from 280-500 nm, then in principle, it can generates a maximum current
density of 5.1 mA cm-2 [79]. However, if it covers a smaller region of the
spectrum, but a region that has higher photon flux density, it can generate more
current density. For example, if the dye only covers the region of 600 nm to 700
nm (which is smaller than the 280-500 nm region), in theory it can generate a
maximum current density of 6.5 mA cm-2 (calculated as 17.6−11.1= 6.5 mA cm-2).
This example clearly shows how absorption range of a dye can influence the
corresponding expected current. Therefore, the unique distribution of the photon
flux needs to be considered when designing new dye sensitizers. It is therefore
suggested to alter the optical band gap of a dye, so that its absorption range
matches the high photon flux region of the solar spectrum [79].

Introduction Chapter 1
13
Fig. 1.3: a) Flux of photons per area and time and wavelength interval. b) The dependence of the
current density, the degree of harvested light and the harvested wavelengths. This figure is
reproduced based on ref. [79].
Introduction Chapter 1
14
The increase of the short-circuit current density, Jsc, can increase the overall solar
conversion efficiency of the cell, η, which is calculated according to the following
equation:
𝜂 =
𝐽sc × 𝑉oc × 𝐹𝐹𝑃in
(1.5)
where Voc is the open-circuit voltage, FF is fill factor and Pin is the total solar
power incident on the cell. A comprehensive review of improving efficiency
based on the above equation for DSSC is given in reference [30].
Another aspect of the dye structure is related to the physical stability of the DSSC
as the dye sensitizer must also carry attachment groups such as carboxylate or
phosphonate to firmly graft it to the semiconductor oxide surface [36, 90]. To
produce a photocurrent density, the energy of the dye excited-state (manifested as
the energy of the lowest unoccupied molecular orbital (LUMO)) necessarily must
be higher than the conduction band edge of the n-type semiconductor (e.g. TiO2).
High quantum efficiency for injection is achieved when the LUMO of the dye is
both energetically matched and reasonably strongly coupled to the underlying
semiconductor [5-7].
In order to be rapidly regenerated via donation of electrons from a redox shuttle or
hole-conductor, the highest occupied molecular orbital (HOMO) of the dye
sensitizer should lie below the energy level of the redox shuttle [3-5, 8, 9]. The
dye should not have significant degradation for at least 20 years (108 turnover
cycles) of operation and should sustain natural light for this period of time. In
other words, it should satisfy long term stability [5].

Introduction Chapter 1
15
1.4. Motivation of this thesis
With a boom in research effort to develop cost-effective renewable energy
devices, dye sensitized solar cells [20] have been the topic of more than a
thousand published papers just in 2010 [91]. However, the bottleneck of the
design and testing of the new materials (e.g. dye sensitizer) for DSSCs, which is
dominated by the often costly and time-consuming synthesis procedures [78], has
prevented the rapid increase of their efficiencies. As in the case of new dye
sensitizer materials development, it is difficult for synthetic chemists to generate
high-performance dyes with the desirable properties prior to the experiments on
the assembled cell, without any support on the information of the new dyes [92].
For example, the energy conversion efficiencies of the recently constructed
DSSCs based on two chemically similar dyes were very different [93]. One is
η=6.79% and the other is η=4.92%. And interestingly, the two dyes only differ in
their π-spacers: one takes thiophene (η=6.79%) and the other is thiazole
(η=4.92%). Both spacers have a sulphur embeded in the pentagon ring, but the
former contains two C=C bonds and the latter has one C=C bond and one C=N
bond.
Unfortunately, the structure and property relationship of the new dyes would
hardly be obtained from “chemical intuition” without the use of quantum
mechanical calculations. In some cases, disappointing results from final stage
testing of the synthesized dye indicate an urgent need to understand the physical
behaviour of dyes at the molecular level, prior to experiments taking place. To
overcome this bottleneck in the development of new DCCSs with better
efficiency, state-of-art computational methods need to be utilised.
Today, first-principle quantum chemical calculations are made available on
supercomputing facilities accessible to more research groups. Such calculations
are a powerful and reliable tool to probe the already existing materials, as well as
to design, study and screen new materials prior to synthesis.
Introduction Chapter 1
16
It should be kept in mind that a holistic theoretical and computational simulation
of DSSC is very challenging and difficult as it is a very complex device composed
of many different components with complex interatomic interactions. A
comprehensive model, which can simulate the entire working-cell, is still very
ambitious given the dimensions of DSSC system. The need to study the system
not only in the ground state but at excited state which also includes different
phases (gas, solution and interface) is another hurdle. Then there is the common
problem when applying computational methods, which is finding the balance
between accuracy of the computational methods and the required computational
power. However, such a model is perhaps the ultimate goal of computational
simulations [94].
Nevertheless, computational simulations have proven to be efficient in many
aspects of DSSC materials and processes studies. A very recent review of the
first-principles computational simulations of DSSC is reported by Pastore and De
Angelis [95]. Pastore and co-workers have also reported another comprehensive
review of how state-of-the-art computational methodologies can be applied to
model and probe DSSCs [94]. A very significant overview of the main
applications of computational investigations to the simulation of DSSC is given
by De Angelis and Fantacci [96]. Labat et al. have designed and tested their
computational framework based on density functional theory (DFT) to model,
reproduce and predict the spectroscopic properties of the isolated components of
the DSSC [97]. According to above references, quantum mechanical calculations
based on DFT and time dependent DFT (TD-DFT), are suitable tools to
computationally model and study DSSC (DFT and TD-DFT will be explained in
details in Chapter 2). Such studies can be categorized into two main areas, the
computational simulation of individual components of DSSC (e.g. the dye
sensitizer, the TiO2 semiconductor and the redox couple) in isolation, and the
computational study of the interactions between two or more components.
As for the investigations of individual components in isolation, numerous studies
have been performed on the ground and excited state properties of the dye

Introduction Chapter 1
17
sensitizers through DFT and TD-DFT calculations. For example, the molecular
geometry, the shape and the energy levels of the frontier molecular orbitals (e.g.
HOMO and LUMO), polarizability and hyperpolarizability, and UV-Vis
absorption spectra of dye sensitizers can be studied by DFT and TD-DFT
approaches [95]. Similarly, due to its wide range of applications, many
computational modelling studies have been conducted on the surface and
nanoparticles of TiO2 by employing either cluster-based approaches or periodic
boundary conditions (PBC). The PBC model is capable of modelling an infinite
periodic solid. This model is usually applied on a periodic slab of 3-4 layers of
TiO2 [96]. The most studied type of the interactions between two components is
the computational modelling of the dye adsorption on TiO2 semiconductor
surfaces. For example, binding modes, aggregation, the UV-Vis spectra of the
dye-TiO2 system, and electron injection have been computationally studied [95].
Returning to the issue of expensive and time-consuming laboratory development
of dyes, computer-aided rational design of new dye sensitizers is a promising
approach to reduce the cost and to discover new dyes more efficiently. The
systematic chemical modifications of the dye structures to produce new dyes has
recently drawn the attention of several groups, including ours [87, 98-106], and
motivated the current thesis. In addition to the in silico rational design of new dye
sensitizers, computational studies can be employed to probe other components of
DSSC such as redox couples (e.g. ferrocene/ferrocenium), which has motivated
another significant part of this thesis.
1.4.1. Rational design of organic dyes
The term ‘rational design’ is generally understood to mean a design strategy to get
a well-defined goal or target [107]. This goal is usually achieving a desired
behaviour for the object under design. Rational design can be applied to any
system; however its application in chemical biology is well-established. In the
context of chemical biology, rational design can be defined as generating new

Introduction Chapter 1
18
molecules with a desired functionality, based on the biological principle that states
“structure determines function”. Here, new molecules are designed by predicting
their behaviour through physical modelling or calculations on their structure.
Applications of this type of rational design include protein design, nucleic acid
design and drug design. As mentioned in Section 1.3.3, an advantage of metal-free
organic dyes is the possibility of applying rational design on them. To understand
this feature, the typical configuration of a metal-free organic dye needs to be
considered.
Central to the structure of organic dye sensitizers is the concept of D-π-A
configuration, shown in Fig. 1.4 (a), where ‘D’ stands for a donor group, ‘π’ for a
π-conjugated bridge (also known as spacer or linker) and ‘A’ for an acceptor
moiety [36, 78, 108-114]. For each moiety (i.e. donor, bridge and acceptor), some
examples of chemical groups, which have been reported in literature [36], are also
shown in Fig. 1.4 (b). The D-π-A structure is an effective and flexible approach to
adjust the properties of dye sensitizers and to accommodate rational design of
dyes with desirable properties. For example, the highest occupied molecular
orbital (HOMO) and the lowest unoccupied molecular orbital (LUMO) energy
levels of a dye sensitizer can be tuned by independent modification of individual
moieties [115]. This feature is employed in this thesis to rationally design new
dyes as will be explained shortly.
In this thesis, the rational design is applied on a couple of already well-performing
dyes with D-π-A configurations. These dyes are designated as “the reference”,
“the original” or “the parent” dyes throughout this thesis. They are selected based
on their overall performance in an assembled working solar cell from the
literature. By modifying the chemical structure of the reference dyes, new dye
sensitizers are designed. The main target is producing new dyes with reduced
HOMO-LUMO energy gap and red-shifted absorption spectra in comparison to
their parent dyes. A variety of approaches can be adopted to red-shift the
absorption spectra of a particular D-π-A dye, such as: (1) increasing the length of
the π-conjugated bridge, (2) employing stronger electron-donating groups, (3)

Introduction Chapter 1
19
increasing the electron-withdrawing character of the acceptor group, and (4)
making modifications into the structure of the π-conjugated bridge [116].
Fig. 1.4: a) A scheme of D-π-A dye configuration. b) Some example of chemical groups employed for different moieties of the metal-free organic dye sensitizers.
Introduction Chapter 1
20
The first approach, i.e. the extension of the conjugating bridge has several
disadvantages. For example, it is applicable only on certain types of dyes.
Moreover, it makes the molecules unstable to heat and light, which restricts its
application [116]. As a result, this approach will not be employed in the present
thesis.
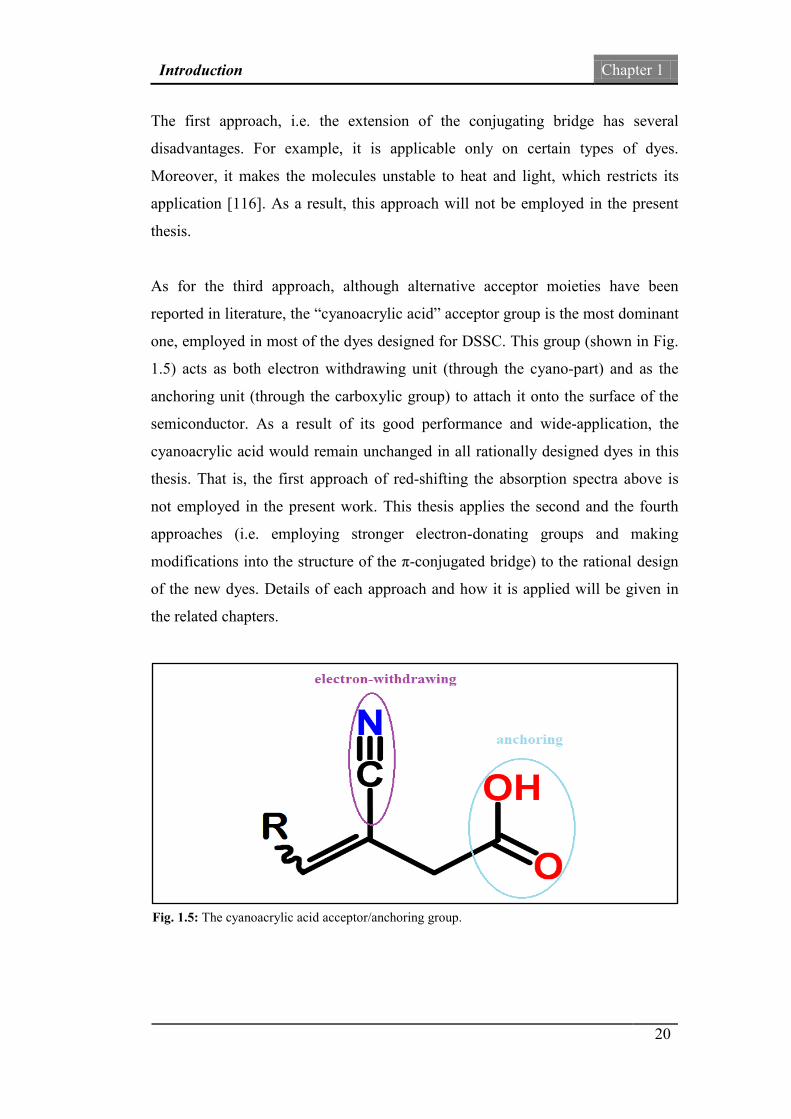
As for the third approach, although alternative acceptor moieties have been
reported in literature, the “cyanoacrylic acid” acceptor group is the most dominant
one, employed in most of the dyes designed for DSSC. This group (shown in Fig.
1.5) acts as both electron withdrawing unit (through the cyano-part) and as the
anchoring unit (through the carboxylic group) to attach it onto the surface of the
semiconductor. As a result of its good performance and wide-application, the
cyanoacrylic acid would remain unchanged in all rationally designed dyes in this
thesis. That is, the first approach of red-shifting the absorption spectra above is
not employed in the present work. This thesis applies the second and the fourth
approaches (i.e. employing stronger electron-donating groups and making
modifications into the structure of the π-conjugated bridge) to the rational design
of the new dyes. Details of each approach and how it is applied will be given in
the related chapters.
Fig. 1.5: The cyanoacrylic acid acceptor/anchoring group.

Introduction Chapter 1
21
The new dyes are rationally designed in silico. As a result, their properties need to
be predicted. In this thesis, computational methods based on quantum mechanical
calculations are employed to model and calculate properties of the new dyes. The
most important properties of the new dyes that will be studied in this thesis are the
energy level of the HOMO and the LUMO, as well as the UV-Vis absorption
spectra. The quantum mechanical calculations in this thesis are based on density
functional theory (DFT) and time-dependent density functional theory (TD-DFT).
The DFT and TD-DFT models (here model means a combination of DFT
functionals and basis set, which will be explained in Chapter 2) employed in this
thesis vary and are validated based on the agreement of the calculations with
available experimental data for each reference dye. That is, for each parent dye,
the computational calculations are performed and the results are compared with
available experimental data for that parent dye. Models which provide the best
agreement with experiment for the reference dye are then selected to study the
corresponding new rationally designed dyes. The initial decision to employ which
model for the parent dye is made by consulting with literature.
1.5. The aim, focus and overview of this thesis
This thesis addresses two important components of DSSC, the dye sensitizer and
the redox couple by first-principle quantum chemical calculations, with more
weight given to the study of dyes.
The aim is to rationally design well-performing organic dyes, with enhanced
spectral response, through “chemical modification” and “computational
modelling”. This thesis studies how rational and in silico design can be exploited
in the design of new organic dye sensitizers with red-shifted (also known as
bathochromic) absorption spectra. Such bathochromic shifts can be obtained by
reducing the HOMO-LUMO energy gap of the dye sensitizers. Because of this,
the relationship between the molecular structure and the HOMO-LUMO gap, as
Introduction Chapter 1
22
well as the UV-Vis absorption spectra of organic dyes is the main focus of this
project. Investigation of other features, such as long-term stability, adsorption to
the semiconductor surface, kinetics of electron injection, transfer, etc. are beyond
the scope of the current thesis.
As for the study of the redox couple, the aim is to probe the electronic properties
of ferrocene, CpFeCp, a sandwich organometallic compound and its Fc/Fc+ redox
couple, quantum mechanically.
This thesis has been organised in the following way.
Chapter 2 provides a general overview of the theory behind the quantum
chemical calculations. But the specific computational methods and details for the
investigation of each compound that are studied in this thesis are given separately
in their related chapters.
Chapter 3 reports a computer aided rational design which is performed on a
reference dye sensitizer with D-π-A structure, known as TA-St-CA. This dye
sensitizer is among good performing dyes in experimental settings. Rational
design of new dyes in this chapter is based on the chemical modifications of the
“π-bridge” moiety of the parent TA-St-CA dye. A number of electron-donating
(ED) and electron-withdrawing (EW) units based on Dewar’s rules are substituted
into the π-conjugated bridge of the reference TA-St-CA dye to produce new dyes.
The effects of these alterations on the molecular structures, HOMO-LUMO
energy gap, and the electron absorption spectra of the new dyes are calculated and
compared to those of the reference dye [87].
Chapter 4 describes new designs for the “donor” moiety of the same parent, TA-
St-CA. Two novel dyes are designed by substitution of different aromatic
annulenes, [14]- and [18]- annulene, as the building blocks of the donor moiety.
As a result, this chapter investigates the influence of increasing the number of sp2
Introduction Chapter 1
23
hybridized atoms (in the donor moiety) on the reduction of the HOMO-LUMO
energy gap and enhancing the absorption spectra of organic dye sensitizers.
Chapter 5 investigates geometric and electronic structure of the Carbz-
PAHTDDT (S9) organic dye sensitizer, quantum mechanically [106]. This dye
has a reported promising efficiency when coupled with ferrocene-based
electrolyte composition [59]. As there is no computational study available on the
structure of the S9 dye, this chapter begins by probing different DFT and TD-DFT
models to calculate features of the reference dye. Based on the agreement with the
experimental values available, the best model is then selected to study the new
dyes in this chapter. New dyes are produced by altering the chemical structure of
the original Carbz-PAHTDDT dye on the π-conjugated bridge. The effects of
these structural alterations on the molecular structures, HOMO-LUMO energy
gap, and the electron absorption spectra of the new dyes are calculated for
comparision to those of the reference dye.
Chapter 6 is devoted to the study of ferrocene (Fc) as an important compound for
alternative redox mediator preparation in liquid state DSSC. The correct structure
of this compound has been a disputed subject within the field of organometallic
chemistry. As a result, a substantial part of this chapter is concentrated on the
study of the ferrocene structure and its conformers, i.e. eclipsed and staggered.
This chapter begins by studying different properties of Fc to find the ones which
can differentiate the eclipsed and staggered conformers. Different properties
including geometry, molecular electrostatic map, infrared spectra in the gas and
solvent phase are discussed [117, 118]. This chapter further investigates the
molecular properties of this compound that are related to its application as a redox
mediator in dye sensitized solar cells. These properties include UV-Vis absorption
spectra and Fc/Fc+ redox potential. A very accurate DFT model for the calculation
of the redox potential of Fc/Fc+ couple will be presented in this chapter.
Finally, Chapter 7 gives a summary and some important conclusions drawn from
the thesis. Furthermore, this chapter outlines the prospects for future research.

Introduction Chapter 1
24
References
1. (2013) World Energy Issues Monitor 2013. World Energy Council. http://www.worldenergy.org/wp-content/uploads/2013/02/2013-World-Energy-Issues-Monitor-Report-Feb2013.pdf. Accessed 24/03/2014
2. (2003) Australia's Polluting Power:Coal-fired electricity and its impact on global warming
http://www.wwf.org.au/news_resources/resource_library/?1382/Australias -Polluting-Power-Coal-fired-electricity-and-its-impact-on-global-warming. Accessed 24/03/2014
3. S. Quirin, T. Jeff, S. Tony, W. Alexandra and M. Oliver, Energy alternatives: Electricity without carbon. Nature, 2008. 454(7206): p. 816.
4. P.R. Ehrlich and A.H. Ehrlich, The Dominant Animal: Human Evolution and the Environment. 2009: Island Press.
5. A. Luque and S. Hegedus, Handbook of Photovoltaic Science and Engineering. 2003: Wiley.
6. A.-E. Becquerel, Mémoire sur les effets électriques produits sous l'influence des rayons solaires. Comptes rendus hebdomadaires des seances de l'Academie des Sciences, 1983. 9: p. 561–567.
7. R. Williams, Becquerel Photovoltaic Effect in Binary Compounds. Journal of Chemical Physics, 1960. 32(5): p. 1505-1514.
8. A. Einstein, Über einen die Erzeugung und Verwandlung des Lichtes betreffenden heuristischen Gesichtspunkt. Annalen der Physik, 1905. 322(6): p. 132-148.
9. The Nobel Prize in Physics 1921. http://www.nobelprize.org/nobel_prizes/physics/laureates/1921/index.html. Accessed 24/03/2014
10. A. Green, Third Generation Photovoltaics: Advanced Solar Energy Conversion. 2006: Springer.
11. M.A. Green, K. Emery, Y. Hishikawa, W. Warta and E.D. Dunlop, Solar cell efficiency tables (version 43). Progress in Photovoltaics: Research and Applications, 2014. 22(1): p. 1-9.
12. Z. Yu, Liquid Redox Electrolytes for Dye-Sensitized Solar Cells. 2012, KTH.
13. M. Grätzel (2011) Solar energy / Dye-Sensitized Solar Cells http://www.youtube.com/watch?v=LYVwJyQBXcM. Accessed 24/03/2014

Introduction Chapter 1
25
14. M. Ni, M.K.H. Leung, D.Y.C. Leung and K. Sumathy, A review and recent developments in photocatalytic water-splitting using TiO2 for hydrogen production. Renewable & Sustainable Energy Reviews, 2007. 11(3): p. 401-425.
15. B.J. Thompson, Research Reports of the Link Energy Fellows Volume 11. 1996: University Of Rochester Press.
16. H. Tributsch and H. Gerischer, Elektrochemische Untersuchungen über den Mechanismus der Sensibilisierung und übersensibilisierung an ZnO-Einkristallen. Berichte der Bunsengesellschaft für physikalische Chemie, 1969. 73(3): p. 251-260.
17. K. Hauffe, H.J. Danzmann, H. Pusch, J. Range and H. Volz, New Experiments on the Sensitization of Zinc Oxide by Means of the Electrochemical Cell Technique. Journal of The Electrochemical Society, 1970. 117(8): p. 993-999.
18. H. Tsubomura, M. Matsumura, Y. Nomura and T. Amamiya, Dye sensitised zinc oxide: aqueous electrolyte: platinum photocell. Nature, 1976. 261(5559): p. 402-403.
19. S.-n. Chen, S.K. Deb and H. Witzke, Dye-titanium dioxide photogalvanic cell. 1978.
20. B. O'Regan and M. Gratzel, A low-cost, high-efficiency solar cell based on dye-sensitized colloidal TiO2 films. Nature, 1991. 353(6346): p. 737-740.
21. B.E. Hardin, H.J. Snaith and M.D. McGehee, The renaissance of dye-sensitized solar cells. Nature Photonics, 2012. 6(3): p. 162-169.
22. M.K. Nazeeruddin, A. Kay, I. Rodicio, R. Humphry-Baker, E. Mueller, P. Liska, N. Vlachopoulos and M. Graetzel, Conversion of light to electricity by cis-X2bis(2,2'-bipyridyl-4,4'-dicarboxylate)ruthenium(II) charge-transfer sensitizers (X = Cl-, Br-, I-, CN-, and SCN-) on nanocrystalline titanium dioxide electrodes. Journal of the American Chemical Society, 1993. 115(14): p. 6382-6390.
23. G. Michael, Conversion of sunlight to electric power by nanocrystalline dye-sensitized solar cells. Journal of Photochemistry and Photobiology A: Chemistry, 2004. 164(1–3): p. 3-14.
24. M.K. Nazeeruddin, R. Splivallo, P. Liska, P. Comte and M. Gratzel, A swift dye uptake procedure for dye sensitized solar cells. Chemical Communications, 2003(12): p. 1456-1457.
25. M.K. Nazeeruddin, F. De Angelis, S. Fantacci, A. Selloni, G. Viscardi, P. Liska, S. Ito, B. Takeru and M. Grätzel, Combined Experimental and DFT-TDDFT Computational Study of Photoelectrochemical Cell
Introduction Chapter 1
26
Ruthenium Sensitizers. Journal of the American Chemical Society, 2005. 127(48): p. 16835-16847.
26. P. Péchy, T. Renouard, S.M. Zakeeruddin, R. Humphry-Baker, P. Comte, P. Liska, L. Cevey, E. Costa, V. Shklover, L. Spiccia, G.B. Deacon, C.A. Bignozzi and M. Grätzel, Engineering of Efficient Panchromatic Sensitizers for Nanocrystalline TiO2-Based Solar Cells. Journal of the American Chemical Society, 2001. 123(8): p. 1613-1624.
27. M. K. Nazeeruddin, P. Pechy and M. Gratzel, Efficient panchromatic sensitization of nanocrystalline TiO2 films by a black dye based on a trithiocyanato-ruthenium complex. Chemical Communications, 1997(18): p. 1705-1706.
28. Y. Chiba, A. Islam, Y. Watanabe, R. Komiya, N. Koide and L. Han, Dye-Sensitized Solar Cells with Conversion Efficiency of 11.1%. Japanese Journal of Applied Physics, 2006. 45(25): p. L638-L640.
29. J.M. Kroon, N.J. Bakker, H.J.P. Smit, P. Liska, K.R. Thampi, P. Wang, S.M. Zakeeruddin, M. Grätzel, A. Hinsch, S. Hore, U. Würfel, R. Sastrawan, J.R. Durrant, E. Palomares, H. Pettersson, T. Gruszecki, J. Walter, K. Skupien and G.E. Tulloch, Nanocrystalline dye-sensitized solar cells having maximum performance. Progress in Photovoltaics: Research and Applications, 2007. 15(1): p. 1-18.
30. T.W. Hamann, R.A. Jensen, A.B.F. Martinson, H. Van Ryswyk and J.T. Hupp, Advancing beyond current generation dye-sensitized solar cells. Energy & Environmental Science, 2008. 1(1): p. 66-78.
31. A. Yella, H.-W. Lee, H.N. Tsao, C. Yi, A.K. Chandiran, M.K. Nazeeruddin, E.W.-G. Diau, C.-Y. Yeh, S.M. Zakeeruddin and M. Grätzel, Porphyrin-Sensitized Solar Cells with Cobalt (II/III)–Based Redox Electrolyte Exceed 12 Percent Efficiency. Science, 2011. 334(6056): p. 629-634.
32. J. Burschka, N. Pellet, S.-J. Moon, R. Humphry-Baker, P. Gao, M.K. Nazeeruddin and M. Grätzel, Sequential deposition as a route to high-performance perovskite-sensitized solar cells. Nature, 2013. 499(7458): p. 316-319.
33. H.J. Snaith, Perovskites: The Emergence of a New Era for Low-Cost, High-Efficiency Solar Cells. The Journal of Physical Chemistry Letters, 2013. 4(21): p. 3623-3630.
34. J.T.-W. Wang, J.M. Ball, E.M. Barea, A. Abate, J.A. Alexander-Webber, J. Huang, M. Saliba, I. Mora-Sero, J. Bisquert, H.J. Snaith and R.J. Nicholas, Low-Temperature Processed Electron Collection Layers of Graphene/TiO2 Nanocomposites in Thin Film Perovskite Solar Cells. Nano Letters, 2013.

Introduction Chapter 1
27
35. P.V. Kamat, Evolution of Perovskite Photovoltaics and Decrease in Energy Payback Time. The Journal of Physical Chemistry Letters, 2013. 4(21): p. 3733-3734.
36. A. Hagfeldt, G. Boschloo, L. Sun, L. Kloo and H. Pettersson, Dye-Sensitized Solar Cells. Chemical Reviews, 2010. 110(11): p. 6595-6663.
37. M. Grätzel, Recent Advances in Sensitized Mesoscopic Solar Cells. Accounts of Chemical Research, 2009. 42(11): p. 1788-1798.
38. C. Bauer, G. Boschloo, E. Mukhtar and A. Hagfeldt, Ultrafast studies of electron injection in Ru dye sensitized SnO 2 nanocrystalline thin film. International Journal of Photoenergy, 2002. 4(1): p. 17-20.
39. Y. Fukai, Y. Kondo, S. Mori and E. Suzuki, Highly efficient dye-sensitized SnO2 solar cells having sufficient electron diffusion length. Electrochemistry Communications, 2007. 9(7): p. 1439-1443.
40. A. Birkel, Y.-G. Lee, D. Koll, X.V. Meerbeek, S. Frank, M.J. Choi, Y.S. Kang, K. Char and W. Tremel, Highly efficient and stable dye-sensitized solar cells based on SnO2 nanocrystals prepared by microwave-assisted synthesis. Energy & Environmental Science, 2012. 5(1): p. 5392-5400.
41. G. Sadoughi, V. Sivaram, R. Gunning, P. Docampo, I. Bruder, N. Pschirer, A. Irajizad and H.J. Snaith, Enhanced electronic contacts in SnO2-dye-P3HT based solid state dye sensitized solar cells. Physical Chemistry Chemical Physics, 2013. 15(6): p. 2075-2080.
42. S. Gubbala, H.B. Russell, H. Shah, B. Deb, J. Jasinski, H. Rypkema and M.K. Sunkara, Surface properties of SnO2 nanowires for enhanced performance with dye-sensitized solar cells. Energy & Environmental Science, 2009. 2(12): p. 1302-1309.
43. M. Quintana, T. Edvinsson, A. Hagfeldt and G. Boschloo, Comparison of Dye-Sensitized ZnO and TiO2 Solar Cells: Studies of Charge Transport and Carrier Lifetime. The Journal of Physical Chemistry C, 2006. 111(2): p. 1035-1041.
44. E.A. Meulenkamp, Electron Transport in Nanoparticulate ZnO Films. The Journal of Physical Chemistry B, 1999. 103(37): p. 7831-7838.
45. H. Rensmo, K. Keis, H. Lindstrom, S. Sodergren, A. Solbrand, A. Hagfeldt, S.E. Lindquist, L.N. Wang and M. Muhammed, High Light-to-Energy Conversion Efficiencies for Solar Cells Based on Nanostructured ZnO Electrodes. The Journal of Physical Chemistry B, 1997. 101(14): p. 2598-2601.
46. M. Saito and S. Fujihara, Large photocurrent generation in dye-sensitized ZnO solar cells. Energy & Environmental Science, 2008. 1(2): p. 280-283.

Introduction Chapter 1
28
47. K. Sayama, H. Sugihara and H. Arakawa, Photoelectrochemical Properties of a Porous Nb2O5 Electrode Sensitized by a Ruthenium Dye. Chemistry of Materials, 1998. 10(12): p. 3825-3832.
48. R. Ghosh, M.K. Brennaman, T. Uher, M.-R. Ok, E.T. Samulski, L.E. McNeil, T.J. Meyer and R. Lopez, Nanoforest Nb2O5 Photoanodes for Dye-Sensitized Solar Cells by Pulsed Laser Deposition. ACS Applied Materials & Interfaces, 2011. 3(10): p. 3929-3935.
49. A. Le Viet, R. Jose, M.V. Reddy, B.V.R. Chowdari and S. Ramakrishna, Nb2O5 Photoelectrodes for Dye-Sensitized Solar Cells: Choice of the Polymorph. The Journal of Physical Chemistry C, 2010. 114(49): p. 21795-21800.
50. J.-J. Lee, M.M. Rahman, S. Sarker, N.D. Nath, A.S. Ahammad and J.K. Lee, Metal oxides and their composites for the photoelectrode of dye sensitized solar cells. Composite Materials for Medicine and Nanotechnology: p. 181-210.
51. C. Teng, X. Yang, C. Yuan, C. Li, R. Chen, H. Tian, S. Li, A. Hagfeldt and L. Sun, Two Novel Carbazole Dyes for Dye-Sensitized Solar Cells with Open-Circuit Voltages up to 1 V Based on Br−/Br3− Electrolytes. Organic Letters, 2009. 11(23): p. 5542-5545.
52. Z. Ning, Q. Zhang, W. Wu and H. Tian, Novel iridium complex with carboxyl pyridyl ligand for dye-sensitized solar cells: High fluorescence intensity, high electron injection efficiency? Journal of Organometallic Chemistry, 2009. 694(17): p. 2705-2711.
53. S. Rani, P. Suri and R.M. Mehra, Mechanism of charge recombination and IPCE in ZnO dye-sensitized solar cells having I−/I 3− and Br−/Br 3− redox couple. Progress in Photovoltaics: Research and Applications, 2011. 19(2): p. 180-186.
54. F. Kato, A. Kikuchi, T. Okuyama, K. Oyaizu and H. Nishide, Nitroxide Radicals as Highly Reactive Redox Mediators in Dye-Sensitized Solar Cells. Angewandte Chemie International Edition, 2012. 51(40): p. 10177-10180.
55. J. Lee, C. Lee, Y. Lee, K. Cho, J. Choi and J.-K. Park, Thiophene–nitroxide radical as a novel combination of sensitizer–redox mediator for dye-sensitized solar cells. Journal of Solid State Electrochemistry, 2012. 16(2): p. 657-663.
56. G. Gryn'ova, J.M. Barakat, J.P. Blinco, S.E. Bottle and M.L. Coote, Computational Design of Cyclic Nitroxides as Efficient Redox Mediators for Dye-Sensitized Solar Cells. Chemistry – A European Journal, 2012. 18(24): p. 7582-7593.
Introduction Chapter 1
29
57. D. Li, H. Li, Y. Luo, K. Li, Q. Meng, M. Armand and L. Chen, Non-Corrosive, Non-Absorbing Organic Redox Couple for Dye-Sensitized Solar Cells. Advanced Functional Materials, 2010. 20(19): p. 3358-3365.
58. H. Tian, X. Jiang, Z. Yu, L. Kloo, A. Hagfeldt and L. Sun, Efficient Organic-Dye-Sensitized Solar Cells Based on an Iodine-Free Electrolyte. Angewandte Chemie International Edition, 2010. 49(40): p. 7328-7331.
59. T. Daeneke, A.J. Mozer, T.-H. Kwon, N.W. Duffy, A.B. Holmes, U. Bach and L. Spiccia, Dye regeneration and charge recombination in dye-sensitized solar cells with ferrocene derivatives as redox mediators. Energy & Environmental Science, 2012. 5(5): p. 7090-7099.
60. T. Daeneke, T.-H. Kwon, A.B. Holmes, N.W. Duffy, U. Bach and L. Spiccia, High-efficiency dye-sensitized solar cells with ferrocene-based electrolytes. Nature Chemistry, 2011. 3(3): p. 211-215.
61. T.W. Hamann, O.K. Farha and J.T. Hupp, Outer-Sphere Redox Couples as Shuttles in Dye-Sensitized Solar Cells. Performance Enhancement Based on Photoelectrode Modification via Atomic Layer Deposition. The Journal of Physical Chemistry C, 2008. 112(49): p. 19756-19764.
62. Y. Bai, Q. Yu, N. Cai, Y. Wang, M. Zhang and P. Wang, High-efficiency organic dye-sensitized mesoscopic solar cells with a copper redox shuttle. Chemical Communications, 2011. 47(15): p. 4376-4378.
63. W. Xiang, F. Huang, Y.-B. Cheng, U. Bach and L. Spiccia, Aqueous dye-sensitized solar cell electrolytes based on the cobalt(ii)/(iii) tris(bipyridine) redox couple. Energy & Environmental Science, 2013. 6(1): p. 121-127.
64. M.K. Kashif, M. Nippe, N.W. Duffy, C.M. Forsyth, C.J. Chang, J.R. Long, L. Spiccia and U. Bach, Stable Dye-Sensitized Solar Cell Electrolytes Based on Cobalt(II)/(III) Complexes of a Hexadentate Pyridyl Ligand. Angewandte Chemie International Edition, 2013. 52(21): p. 5527-5531.
65. W. Xiang, W. Huang, U. Bach and L. Spiccia, Stable high efficiency dye-sensitized solar cells based on a cobalt polymer gel electrolyte. Chemical Communications, 2013. 49(79): p. 8997-8999.
66. J. Fan, Y. Hao, A. Cabot, E.M.J. Johansson, G. Boschloo and A. Hagfeldt, Cobalt(II/III) Redox Electrolyte in ZnO Nanowire-Based Dye-Sensitized Solar Cells. ACS Applied Materials & Interfaces, 2013. 5(6): p. 1902-1906.
67. Y. Liu, J.R. Jennings, Y. Huang, Q. Wang, S.M. Zakeeruddin and M. Grätzel, Cobalt Redox Mediators for Ruthenium-Based Dye-Sensitized Solar Cells: A Combined Impedance Spectroscopy and Near-IR

Introduction Chapter 1
30
Transmittance Study. The Journal of Physical Chemistry C, 2011. 115(38): p. 18847-18855.
68. A.M. Spokoyny, T.C. Li, O.K. Farha, C.W. Machan, C. She, C.L. Stern, T.J. Marks, J.T. Hupp and C.A. Mirkin, Electronic Tuning of Nickel-Based Bis(dicarbollide) Redox Shuttles in Dye-Sensitized Solar Cells. Angewandte Chemie International Edition, 2010. 49(31): p. 5339-5343.
69. T.C. Li, A.M. Spokoyny, C. She, O.K. Farha, C.A. Mirkin, T.J. Marks and J.T. Hupp, Ni(III)/(IV) Bis(dicarbollide) as a Fast, Noncorrosive Redox Shuttle for Dye-Sensitized Solar Cells. Journal of the American Chemical Society, 2010. 132(13): p. 4580-4582.
70. S. Yanagida, Y. Yu and K. Manseki, Iodine/Iodide-Free Dye-Sensitized Solar Cells. Accounts of Chemical Research, 2009. 42(11): p. 1827-1838.
71. T.W. Hamann and J.W. Ondersma, Dye-sensitized solar cell redox shuttles. Energy & Environmental Science, 2011. 4(2): p. 370-381.
72. G. Boschloo and A. Hagfeldt, Characteristics of the iodide/triiodide redox mediator in dye-sensitized solar cells. Accounts of chemical research, 2009. 42(11): p. 1819-26.
73. C. Qin, W. Peng, K. Zhang, A. Islam and L. Han, A Novel Organic Sensitizer Combined with a Cobalt Complex Redox Shuttle for Dye-Sensitized Solar Cells. Organic letters, 2012.
74. H. Nusbaumer, J.-E. Moser, S.M. Zakeeruddin, M.K. Nazeeruddin and M. Grätzel, CoII(dbbip)22+ Complex Rivals Tri-iodide/Iodide Redox Mediator in Dye-Sensitized Photovoltaic Cells. The Journal of Physical Chemistry B, 2001. 105(43): p. 10461-10464.
75. S. Feldt, Alternative Redox Couples for Dye-Sensitized Solar Cells. 2013, Uppsala University.
76. M.K. Wang, N. Chamberland, L. Breau, J.E. Moser, R. Humphry-Baker, B. Marsan, S.M. Zakeeruddin and M. Gratzel, An organic redox electrolyte to rival triiodide/iodide in dye-sensitized solar cells. Nature Chemistry, 2010. 2(5): p. 385-389.
77. K. Cao and M. Wang, Recent developments in sensitizers for mesoporous sensitized solar cells. Frontiers of Optoelectronics, 2013: p. 1-13.
78. A. Mishra, M.K.R. Fischer and P. Bauerle, Metal-Free Organic Dyes for Dye-Sensitized Solar Cells: From Structure: Property Relationships to Design Rules. Angewandte Chemie-International Edition, 2009. 48(14): p. 2474-2499.
Introduction Chapter 1
31
79. B.G. Kim, K. Chung and J. Kim, Molecular Design Principle of All-organic Dyes for Dye-Sensitized Solar Cells. Chemistry-A European Journal, 2013. 19(17): p. 5220-5230.
80. N. Robertson, Optimizing Dyes for Dye-Sensitized Solar Cells. Angewandte Chemie International Edition, 2006. 45(15): p. 2338-2345.
81. M. Ryan, Progress in Ruthenium Complexes for Dye Sensitised Solar Cells. Platinum Metals Review, 2009. 53(4): p. 216-218.
82. S. Ito, Investigation of Dyes for Dye-Sensitized Solar Cells: Ruthenium-Complex Dyes, Metal-Free Dyes, Metal-Complex Porphyrin Dyes and Natural Dyes.
83. Y.C. Qin and Q. Peng, Ruthenium Sensitizers and Their Applications in Dye-Sensitized Solar Cells. International Journal of Photoenergy, 2012.
84. S.-L. Li, K.-J. Jiang, K.-F. Shao and L.-M. Yang, Novel organic dyes for efficient dye-sensitized solar cells. Chemical Communications, 2006(26): p. 2792-2794.
85. D. Heredia, J. Natera, M. Gervaldo, L. Otero, F. Fungo, C.-Y. Lin and K.-T. Wong, Spirobifluorene-Bridged Donor/Acceptor Dye for Organic Dye-Sensitized Solar Cells. Organic letters, 2009. 12(1): p. 12-15.
86. M. Pastore, E. Mosconi, F. De Angelis and M. Grätzel, A Computational Investigation of Organic Dyes for Dye-Sensitized Solar Cells: Benchmark, Strategies, and Open Issues. The Journal of Physical Chemistry C, 2010. 114(15): p. 7205-7212.
87. N. Mohammadi, P.J. Mahon and F. Wang, Toward rational design of organic dye sensitized solar cells (DSSCs): an application to the TA-St-CA dye. Journal of Molecular Graphics and Modelling, 2013. 40: p. 64-71.
88. M. Grätzel, Dye-sensitized solar cells. Journal of Photochemistry and Photobiology C: Photochemistry Reviews, 2003. 4(2): p. 145-153.
89. S. Agrawal, N.J. English, K.R. Thampi and J.M. Macelroy, Perspectives on ab initio molecular simulation of excited-state properties of organic dye molecules in dye-sensitised solar cells. Phys Chem Chem Phys, 2012. 14(35): p. 12044-56.
90. N. Martsinovich and A. Troisi, Theoretical studies of dye-sensitised solar cells: from electronic structure to elementary processes. Energy & Environmental Science, 2011. 4(11): p. 4473-4495.
91. L.M. Peter, The Grätzel Cell: Where Next? The Journal of Physical Chemistry Letters, 2011. 2(15): p. 1861-1867.
Introduction Chapter 1
32
92. J. Zhang, H.-B. Li, S.-L. Sun, Y. Geng, Y. Wu and Z.-M. Su, Density functional theory characterization and design of high-performance diarylamine-fluorene dyes with different [small pi] spacers for dye-sensitized solar cells. Journal of Materials Chemistry, 2012. 22(2): p. 568-576.
93. C.-H. Chen, Y.-C. Hsu, H.-H. Chou, K.R.J. Thomas, J.T. Lin and C.-P. Hsu, Dipolar Compounds Containing Fluorene and a Heteroaromatic Ring as the Conjugating Bridge for High-Performance Dye-Sensitized Solar Cells. Chemistry – A European Journal, 2010. 16(10): p. 3184-3193.
94. M. Pastore, E. Mosconi, S. Fantacci and F. De Angelis, Computational Investigations on Organic Sensitizers for Dye-Sensitized Solar Cells. Current Organic Synthesis, 2012. 9(2): p. 215-232.
95. M. Pastore and F. Angelis, Modeling Materials and Processes in Dye-Sensitized Solar Cells: Understanding the Mechanism, Improving the Efficiency. 2013, Springer Berlin Heidelberg. p. 1-86.
96. K. Kalyanasundaram, Dye-sensitized Solar Cells. 2010: EFPL Press.
97. F. Labat, T. Le Bahers, I. Ciofini and C. Adamo, First-Principles Modeling of Dye-Sensitized Solar Cells: Challenges and Perspectives. Accounts of Chemical Research, 2012. 45(8): p. 1268-1277.
98. W. Fan, D. Tan and W.-Q. Deng, Acene-Modified Triphenylamine Dyes for Dye-Sensitized Solar Cells: A Computational Study. ChemPhysChem, 2012. 13(8): p. 2051-2060.
99. X. Gu, L. Zhou, Y. Li, Q. Sun and P. Jena, Design of new metal-free dyes for dye-sensitized solar cells: A first-principles study. Physics Letters A, 2012. 376(38–39): p. 2595-2599.
100. J. Zhang, Y.-H. Kan, H.-B. Li, Y. Geng, Y. Wu and Z.-M. Su, How to design proper π-spacer order of the D-π-A dyes for DSSCs? A density functional response. Dyes and Pigments, 2012. 95(2): p. 313-321.
101. R. Sanchez-de-Armas, M.A. San Miguel, J. Oviedo and J.F. Sanz, Coumarin derivatives for dye sensitized solar cells: a TD-DFT study. Physical Chemistry Chemical Physics, 2012. 14(1): p. 225-233.
102. R. Sanchez-de-Armas, M.A. San-Miguel, J. Oviedo and J.F. Sanz, Molecular modification of coumarin dyes for more efficient dye sensitized solar cells. The Journal of Chemical Physics, 2012. 136(19): p. 194702-7.
103. L. Yang, L. Guo, Q. Chen, H. Sun, J. Liu, X. Zhang, X. Pan and S. Dai, Theoretical design and screening of panchromatic phthalocyanine sensitizers derived from TT1 for dye-sensitized solar cells. Journal of Molecular Graphics and Modelling, 2012. 34(0): p. 1-9.

Introduction Chapter 1
33
104. J. Wang, S. Gong, S.Z. Wen, L.K. Yan and Z.M. Su, A Rational Design for Dye Sensitizer: Density Functional Theory Study on the Electronic Absorption Spectra of Organoimido-Substituted Hexamolybdates. Journal of Physical Chemistry C, 2013. 117(5): p. 2245-2251.
105. J. Feng, Y. Jiao, W. Ma, M.K. Nazeeruddin, M. Grätzel and S. Meng, First Principles Design of Dye Molecules with Ullazine Donor for Dye Sensitized Solar Cells. The Journal of Physical Chemistry C, 2013. 117(8): p. 3772-3778.
106. N. Mohammadi and F. Wang, First-principles study of Carbz-PAHTDDT dye sensitizer and two Carbz-derived dyes for dye sensitized solar cells. Journal of Molecular Modeling, 2014. 20(3): p. 1-9.
107. D.L. Parnas and P.C. Clements, A Rational Design Process - How and Why to Fake It. Ieee Transactions on Software Engineering, 1986. 12(2): p. 251-257.
108. M. Velusamy, Y.C. Hsu, J.T. Lin, C.W. Chang and C.P. Hsu, 1-Alkyl-1H-imidazole-Based Dipolar Organic Compounds for Dye-Sensitized Solar Cells. Chemistry-An Asian Journal, 2010. 5(1): p. 87-96.
109. K. Srinivas, C.R. Kumar, M.A. Reddy, K. Bhanuprakash, V.J. Rao and L. Giribabu, D-pi-A organic dyes with carbazole as donor for dye-sensitized solar cells. Synthetic Metals, 2011. 161(1-2): p. 96-105.
110. M.K.R. Fischer, S. Wenger, M. Wang, A. Mishra, S.M. Zakeeruddin, M. Grätzel and P. Bäuerle, D-π-A Sensitizers for Dye-Sensitized Solar Cells: Linear vs Branched Oligothiophenes. Chemistry of Materials, 2010. 22(5): p. 1836-1845.
111. M. Marszalek, S. Nagane, A. Ichake, R. Humphry-Baker, V. Paul, S.M. Zakeeruddin and M. Gratzel, Structural variations of D-π-A dyes influence on the photovoltaic performance of dye-sensitized solar cells. RSC Advances, 2013. 3(21): p. 7921-7927.
112. Y. Ooyama, N. Yamaguchi, I. Imae, K. Komaguchi, J. Ohshita and Y. Harima, Dye-sensitized solar cells based on D-[small pi]-A fluorescent dyes with two pyridyl groups as an electron-withdrawing-injecting anchoring group. Chemical Communications, 2013. 49(25): p. 2548-2550.
113. H. Li, T.M. Koh, A. Hagfeldt, M. Gratzel, S.G. Mhaisalkar and A.C. Grimsdale, New donor-[small pi]-acceptor sensitizers containing 5H-[1,2,5]thiadiazolo [3,4-f]isoindole-5,7(6H)-dione and 6H-pyrrolo[3,4-g]quinoxaline-6,8(7H)-dione units. Chemical Communications, 2013. 49(24): p. 2409-2411.
Introduction Chapter 1
34
114. Z.-S. Wang and F. Liu, Structure-property relationships of organic dyes with D-π-A structure in dye-sensitized solar cells. Frontiers of Chemistry in China, 2010. 5(2): p. 150-161.
115. D.P. Hagberg, T. Marinado, K.M. Karlsson, K. Nonomura, P. Qin, G. Boschloo, T. Brinck, A. Hagfeldt and L. Sun, Tuning the HOMO and LUMO energy levels of organic chromophores for dye sensitized solar cells. Journal of Organic Chemistry, 2007. 72(25): p. 9550-9556.
116. A.T. Peters and H.S. Freeman, Modern Colorants: Synthesis and Structures. 1995: Blackie Academic & Professional.
117. N. Mohammadi, A. Ganesan, C.T. Chantler and F. Wang, Differentiation of ferrocene D5d and D5h conformers using IR spectroscopy. Journal of Organometallic Chemistry, 2012. 713(0): p. 51-59.
118. C.T. Chantler, N.A. Rae, M.T. Islam, S.P. Best, J. Yeo, L.F. Smale, J. Hester, N. Mohammadi and F. Wang, Stereochemical analysis of ferrocene and the uncertainty of fluorescence XAFS data. Journal of Synchrotron Radiation, 2012. 19: p. 145-158.

35
Chapter 2
Methods and Theoretical Details “Everything should be made as simple as possible, but not simpler.”
Albert Einstein
2.1. Introduction
Advances in computational science in the 20th century flourished many emerging
scientific fields dealing with complex problems such as computational chemistry.
Computational chemistry, also known as molecular modelling or molecular
simulation, is an interdisciplinary field that exploits computational science
techniques to develop codes and software programs which can solve chemical
problems. These computer codes implement the results of theoretical chemistry.
As a result, the fundamental principle upon which computational chemistry is
built is theoretical chemistry. Theoretical chemistry itself combines mathematical
methods with fundamental laws of physics to formulate the behaviour of matter
on an atomistic scale.
This chapter will provide a brief introduction and background to the theoretical
foundation of the computational chemistry methods applied to this study,
followed by a number of general important molecular properties and the
computational methods employed to calculate them. However, the more specific

Methods and theoretical details Chapter 2
36
methods and justification of the models applied to study each molecule
throughout this thesis are given separately in the related chapters.
2.2. Background
It is well-known that properties of compounds are derived as a function of their
molecular structure [1-4]. The molecular structure or molecular geometry is
nothing but a set of three dimensional coordinates which describe the position of
atoms within the molecule. Therefore, the type and the geometrical position of
atoms are the key to the differences between molecules. One can think of a
molecule as positively charged nuclei surrounded by electrons which stay together
by Columbic attraction. However, the classical Newtonian equation of motion (i.e.
F=ma) fails to describe the behaviour of electrons and nuclei. That is because
electrons which are very light elementary particles show both wave and particle
characteristics. Therefore, quantum mechanics approaches which provide
mathematical description for dual wave-particle behaviour should be employed.
The mathematical formulations of quantum mechanics were postulated in the
early 20th century, based on the experimental observations to describe those
phenomena which could not be explained by classical physics (e.g. wave-like
behaviour of matter). A fundamental postulate of quantum mechanics specifies
that the state of a quantum system can be described completely by a wavefunction
[5, 6]. This means that all the experimentally measurable information about the
system is contained in the wavefunction and thus wavefunction becomes central
to quantum mechanics.
The wavefunction which is represented by the Greek letter ψ (or the capital letter
Ψ) is a function of position and time for a single particle (i.e. Ψ (position, time))
whose values can be complex numbers which does not have any physical
interpretation. However, the square of the absolute value of the wavefunction (i.e.
complex square or |ψ|2) is a real number. It can be related to the probability of

Methods and theoretical details Chapter 2
37
finding the particle at a given position in a given time based on the statistical
interpretation of Max Born [7]. Even though the wavefunction is not an
experimentally measurable entity itself, it contains all the information about
observable properties which can be determined experimentally. Quantum
mechanics postulates that it is possible to obtain experimental measurements of
physical properties as the expectation (average) values by averaging an
appropriate operator acting on the wavefunction [8, 9].
To obtain wavefunctions, one needs to solve the Schrödinger’s equation. An
Austrian physicist called Erwin Schrödinger formulated this equation in 1925 and
published it in 1926 [10]. There are two types of Schrödinger’s equation, a time-
dependent one (which is the most general form) and a time-independent one. The
time-dependent equation describes the behaviour of a dynamic system which
evolves with time and is analogous to the Newton’s second law (i.e. equation of
motion) in classical mechanics. Although time-dependent equation is the most
general form of the Schrödinger’s equation, it is quite complicated and
challenging to be solved. Moreover, the majority of theoretical chemistry
problems deal with stationary states which do not change over time, which means
that the wavefunction for stationary states is a standing wave which is a function
of the position only (and is not a function of the time). For that reason, the time-
independent Schrödinger equation is sufficient to find the wavefunctions for such
states.
2.3. The time-independent Schrödinger equation
The time-independent Schrödinger equation, which will be called simply as
Schrödinger equation hereafter, is the fundamental equation employed to obtain
the wavefunctions of atomic particles and is given in the form of
𝐻�Ψ = 𝐸Ψ (2.1)
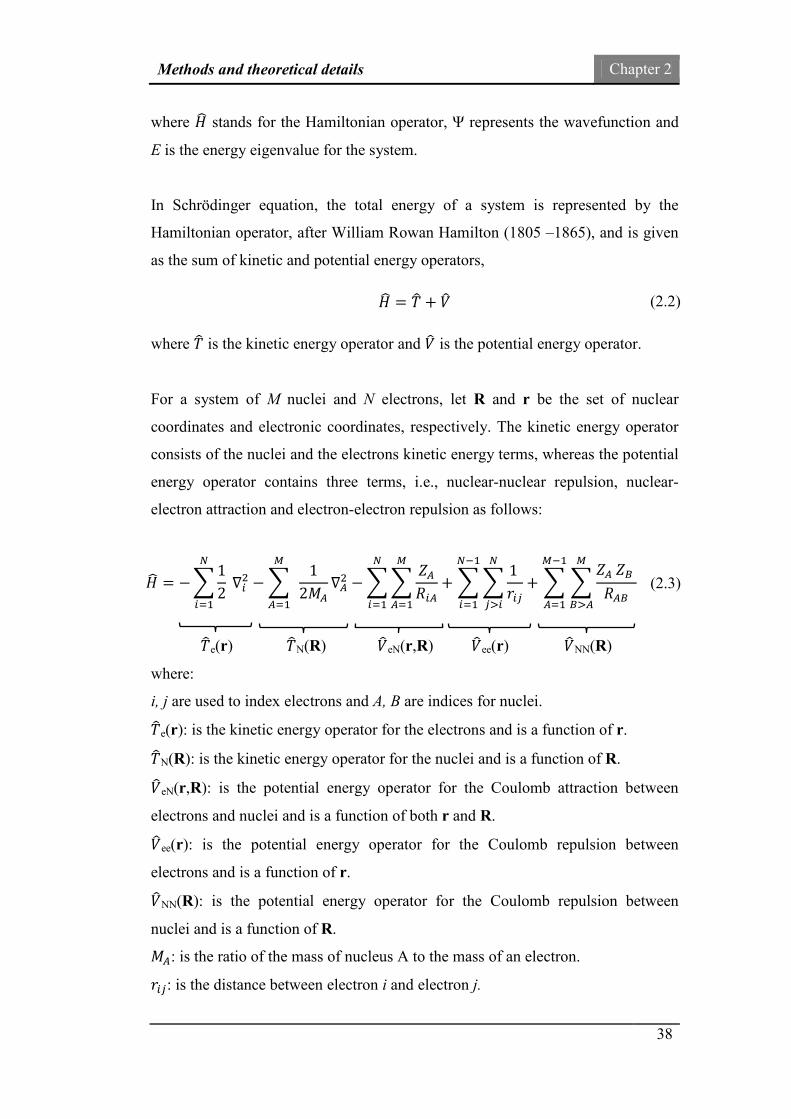
Methods and theoretical details Chapter 2
38
where 𝐻� stands for the Hamiltonian operator, Ψ represents the wavefunction and
E is the energy eigenvalue for the system.
In Schrödinger equation, the total energy of a system is represented by the
Hamiltonian operator, after William Rowan Hamilton (1805 –1865), and is given
as the sum of kinetic and potential energy operators,
𝐻� = 𝑇� + 𝑉� (2.2)
where 𝑇� is the kinetic energy operator and 𝑉� is the potential energy operator.
For a system of M nuclei and N electrons, let R and r be the set of nuclear
coordinates and electronic coordinates, respectively. The kinetic energy operator
consists of the nuclei and the electrons kinetic energy terms, whereas the potential
energy operator contains three terms, i.e., nuclear-nuclear repulsion, nuclear-
electron attraction and electron-electron repulsion as follows:
𝐻� = − �12
𝑁
𝑖=1
∇𝑖2 − �
𝑀
𝐴=1
12𝑀𝐴
∇𝐴2 − � �
𝑍𝐴
𝑅𝑖𝐴
𝑀
𝐴=1
𝑁
𝑖=1
+ � �1
𝑟𝑖𝑗
𝑁
𝑗>𝑖
𝑁−1
𝑖=1
+ � �𝑍𝐴 𝑍𝐵
𝑅𝐴𝐵
𝑀
𝐵>𝐴
𝑀−1
𝐴=1
(2.3)
𝑇�e(r) 𝑇�N(R) 𝑉� eN(r,R) 𝑉� ee(r) 𝑉� NN(R)
where:
i, j are used to index electrons and A, B are indices for nuclei.
𝑇�e(r): is the kinetic energy operator for the electrons and is a function of r.
𝑇�N(R): is the kinetic energy operator for the nuclei and is a function of R.
𝑉� eN(r,R): is the potential energy operator for the Coulomb attraction between
electrons and nuclei and is a function of both r and R.
𝑉� ee(r): is the potential energy operator for the Coulomb repulsion between
electrons and is a function of r.
𝑉� NN(R): is the potential energy operator for the Coulomb repulsion between
nuclei and is a function of R.
𝑀𝐴: is the ratio of the mass of nucleus A to the mass of an electron.
𝑟𝑖𝑗: is the distance between electron i and electron j.

Methods and theoretical details Chapter 2
39
𝑅𝐴𝐵 : is the distance between nucleus A and nucleus B.
𝑅𝑖𝐴 : is the distance between electron i and nucleus A.
𝑍𝐴: is the atomic number of nucleus A.
∇𝑖2 and ∇𝐴
2 : are the laplacian operator acting on ri and RA, respectively (∇𝑖2= 𝜕2
𝜕𝑥𝑖2 +
𝜕2
𝜕𝑦𝑖2 + 𝜕2
𝜕𝑧𝑖2).
And ri = (xi, yi, zi) is the coordinates of the electron i and RA = (xA, yA, zA) is the
coordinates of the nucleus A.
To obtain the energy and wavefunction, the Hamiltonian in Eq. (2.3) should be
inserted into the Eq. (2.1). The resultant Schrödinger equation is a partial
differential eigenvalue equation (PDE) with a large number of variables (i.e.
variables of the spatial coordinates of the electrons and the nuclei). In other
words, the wavefunction of a many-electron molecule (Ψ (R,r)) is a function of
the coordinates of all the nuclei (R) and all the electrons (r).
In fact, such equation is intractable [11] and cannot be solved exactly for most of
the molecular systems (i.e. molecules with more than one electrons, also known as
many-body systems) [12, 13] and several approximations are required to simplify
this equation as will be outlined in the following sections.
2.4. The Born-Oppenheimer approximation
The fundamental Born-Oppenheimer approximation (BO) was proposed by Max
Born and J. Robert Oppenheimer in early days of quantum mechanics (1927) [14],
only a year after the publication of the Schrödinger equation. The term 𝑉� eN(r,R) in
Eq. (2.3) prevents us from seprating the wavefunction into a product of an
electronic part and a nuclear part. But the BO makes it possible to break the
electronic and nuclear components of the wavefunction as will be explained
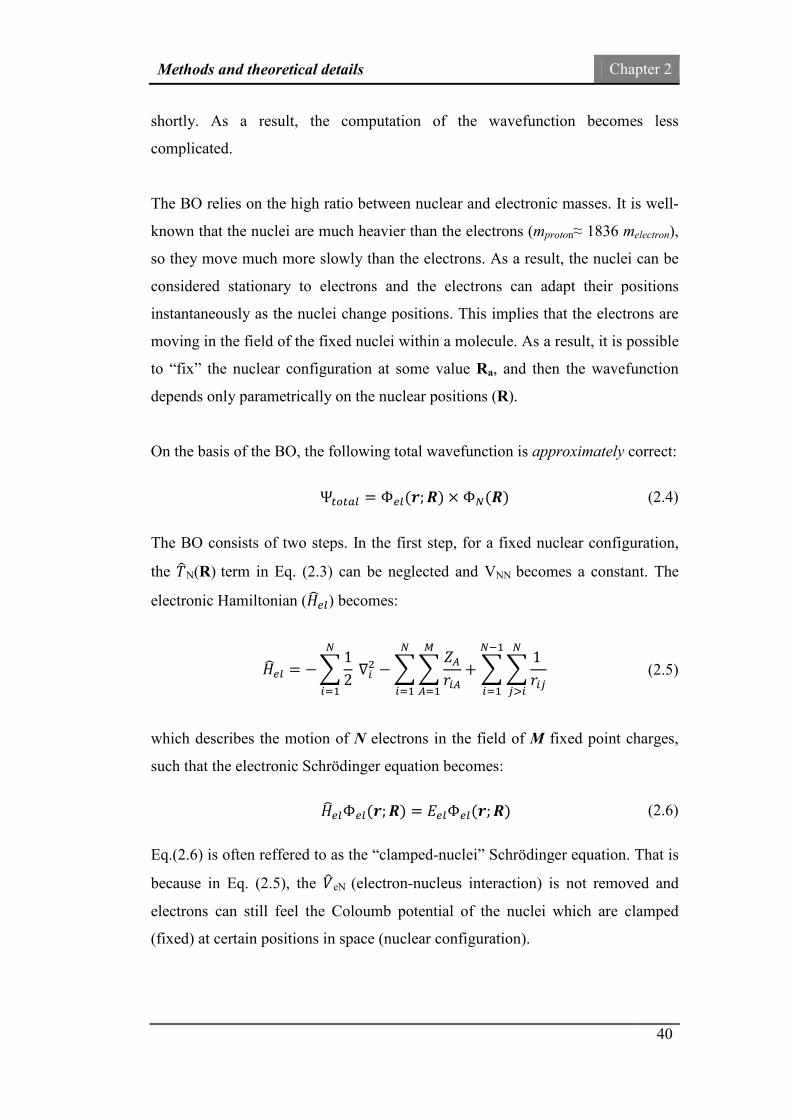
Methods and theoretical details Chapter 2
40
shortly. As a result, the computation of the wavefunction becomes less
complicated.
The BO relies on the high ratio between nuclear and electronic masses. It is well-
known that the nuclei are much heavier than the electrons (mproton≈ 1836 melectron),
so they move much more slowly than the electrons. As a result, the nuclei can be
considered stationary to electrons and the electrons can adapt their positions
instantaneously as the nuclei change positions. This implies that the electrons are
moving in the field of the fixed nuclei within a molecule. As a result, it is possible
to “fix” the nuclear configuration at some value Ra, and then the wavefunction
depends only parametrically on the nuclear positions (R).
On the basis of the BO, the following total wavefunction is approximately correct:
Ψ𝑡𝑜𝑡𝑎𝑙 = Φ𝑒𝑙(𝒓; 𝑹) × Φ𝑁(𝑹) (2.4)
The BO consists of two steps. In the first step, for a fixed nuclear configuration,
the 𝑇�N(R) term in Eq. (2.3) can be neglected and VNN becomes a constant. The
electronic Hamiltonian (𝐻�𝑒𝑙) becomes:
𝐻�𝑒𝑙 = − �12
𝑁
𝑖=1
∇𝑖2 − � �
𝑍𝐴
𝑟𝑖𝐴
𝑀
𝐴=1
𝑁
𝑖=1
+ � �1
𝑟𝑖𝑗
𝑁
𝑗>𝑖
𝑁−1
𝑖=1
(2.5)
which describes the motion of N electrons in the field of M fixed point charges,
such that the electronic Schrödinger equation becomes:
𝐻�𝑒𝑙Φ𝑒𝑙(𝒓; 𝑹) = 𝐸𝑒𝑙Φ𝑒𝑙(𝒓; 𝑹) (2.6)
Eq.(2.6) is often reffered to as the “clamped-nuclei” Schrödinger equation. That is
because in Eq. (2.5), the 𝑉� eN (electron-nucleus interaction) is not removed and
electrons can still feel the Coloumb potential of the nuclei which are clamped
(fixed) at certain positions in space (nuclear configuration).

Methods and theoretical details Chapter 2
41
The solutions of the electronic Hamiltonian (𝐻�𝑒𝑙) are the electronic wavefunctions
(Φ𝑒𝑙). It describes the motion of the electrons for a fixed nuclear configuration. It
should be noted that the electronic energy eigenvalue (𝐸𝑒𝑙) in Eq. (2.6) is not a
constant and depends parametrically on the chosen nuclear configuration. By
repedatly varying the nuclear configurations in small steps for a range of R (one at
a time) and solving the electronic Schrödinger equation, 𝐸𝑒𝑙(𝑅) is obtained as a
function of R, and is generally termed as potential energy surface (PES). That is
because the dependance of the electronic energy on the position of the nuclei
(nuclear configuration) plays the role of the “potential energy” in the Schrödinger
equation for the nuclear motion. This implies that the nuclei move on a potential
energy surface (𝑈(𝑹)).
𝑈(𝑹) = 𝐸𝑒𝑙 + 𝑉� NN (2.7)
Once the PES is obtained, it is possible to solve the second step of BO which is to
solve the Schrödinger equation for the motion of nuclei,
𝐻�𝑁 = − �
𝑀
𝐴=1
12𝑀𝐴
∇𝐴2 + 𝑈(𝑹) (2.8)
𝐻�𝑁Φ𝑁(𝑹) = 𝐸𝑁Φ𝑁(𝑹) (2.9)
As seen in Eq. (2.8), the nuclear kinetic energy term, 𝑇�N(R), which contains
partial derivatives with respect to the components of R is reintroduced. Next,
Schrödinger equation for the nuclear motion, Eq. (2.9) is solved to yeild the the
nuclear wavefunction Φ𝑁(𝑹) which contains all the information about vibration,
rotation and translation of the molecule.
2.5. Hartree-Fock theory
Although Hartree-Fock (HF) method is not directly employed in the calculations
of this work, it is important to briefly introduce this theory as it is fundamental to
the quantum mechanics. The HF theory is also the predecessor of density
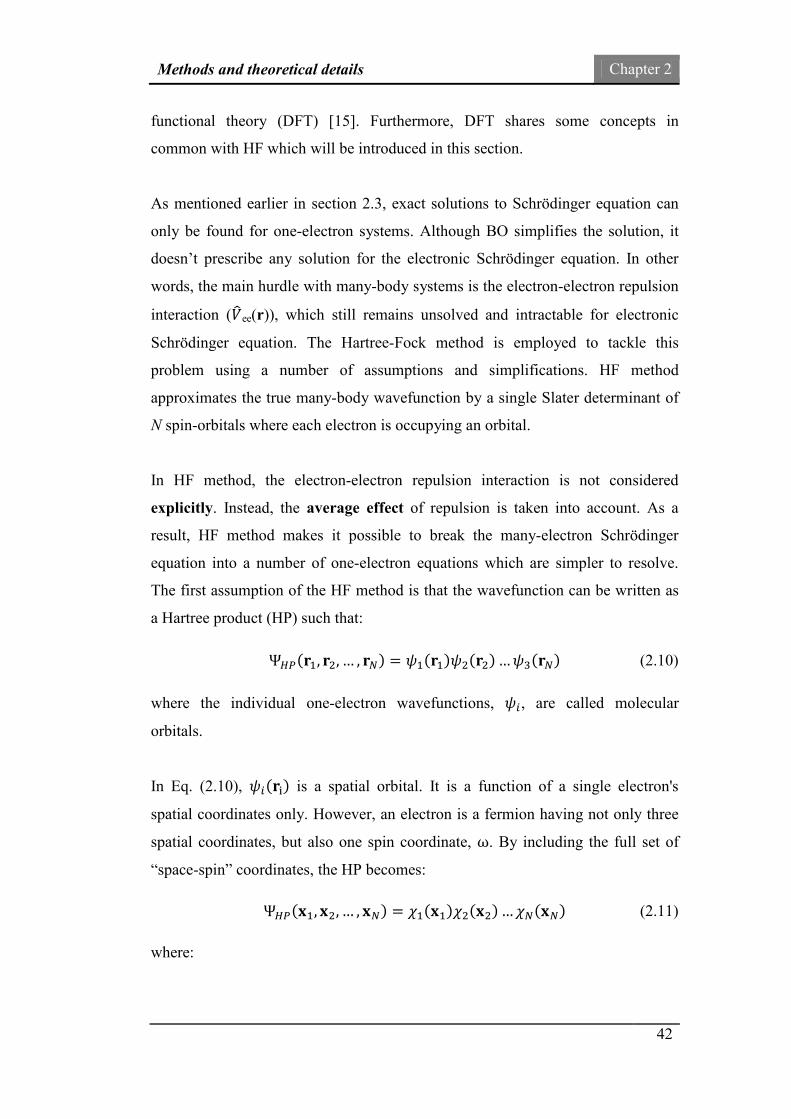
Methods and theoretical details Chapter 2
42
functional theory (DFT) [15]. Furthermore, DFT shares some concepts in
common with HF which will be introduced in this section.
As mentioned earlier in section 2.3, exact solutions to Schrödinger equation can
only be found for one-electron systems. Although BO simplifies the solution, it
doesn’t prescribe any solution for the electronic Schrödinger equation. In other
words, the main hurdle with many-body systems is the electron-electron repulsion
interaction (𝑉� ee(r)), which still remains unsolved and intractable for electronic
Schrödinger equation. The Hartree-Fock method is employed to tackle this
problem using a number of assumptions and simplifications. HF method
approximates the true many-body wavefunction by a single Slater determinant of
N spin-orbitals where each electron is occupying an orbital.
In HF method, the electron-electron repulsion interaction is not considered
explicitly. Instead, the average effect of repulsion is taken into account. As a
result, HF method makes it possible to break the many-electron Schrödinger
equation into a number of one-electron equations which are simpler to resolve.
The first assumption of the HF method is that the wavefunction can be written as
a Hartree product (HP) such that:
Ψ𝐻𝑃(𝐫1, 𝐫2, … , 𝐫𝑁) = 𝜓1(𝐫1)𝜓2(𝐫2) … 𝜓3(𝐫𝑁) (2.10)
where the individual one-electron wavefunctions, 𝜓𝑖, are called molecular
orbitals.
In Eq. (2.10), 𝜓𝑖(𝐫i) is a spatial orbital. It is a function of a single electron's
spatial coordinates only. However, an electron is a fermion having not only three
spatial coordinates, but also one spin coordinate, ω. By including the full set of
“space-spin” coordinates, the HP becomes:
Ψ𝐻𝑃(𝐱1, 𝐱2, … , 𝐱𝑁) = 𝜒1(𝐱1)𝜒2(𝐱2) … 𝜒𝑁(𝐱𝑁) (2.11)
where:
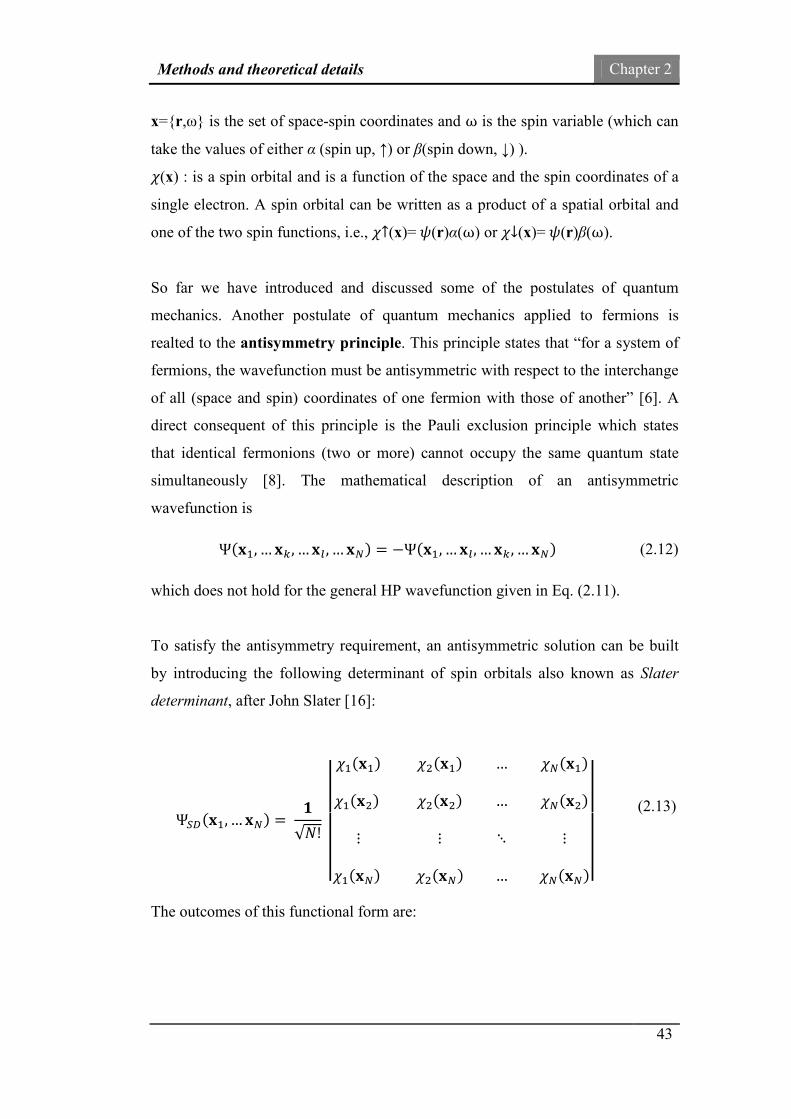
Methods and theoretical details Chapter 2
43
x={r,ω} is the set of space-spin coordinates and ω is the spin variable (which can
take the values of either α (spin up, ↑) or β(spin down, ↓) ).
𝜒(x) : is a spin orbital and is a function of the space and the spin coordinates of a
single electron. A spin orbital can be written as a product of a spatial orbital and
one of the two spin functions, i.e., 𝜒↑(x)= 𝜓(r)α(ω) or 𝜒↓(x)= 𝜓(r)β(ω).
So far we have introduced and discussed some of the postulates of quantum
mechanics. Another postulate of quantum mechanics applied to fermions is
realted to the antisymmetry principle. This principle states that “for a system of
fermions, the wavefunction must be antisymmetric with respect to the interchange
of all (space and spin) coordinates of one fermion with those of another” [6]. A
direct consequent of this principle is the Pauli exclusion principle which states
that identical fermonions (two or more) cannot occupy the same quantum state
simultaneously [8]. The mathematical description of an antisymmetric
wavefunction is
Ψ(𝐱1, … 𝐱𝑘, … 𝐱𝑙 , … 𝐱𝑁) = −Ψ(𝐱1, … 𝐱𝑙, … 𝐱𝑘, … 𝐱𝑁) (2.12)
which does not hold for the general HP wavefunction given in Eq. (2.11).
To satisfy the antisymmetry requirement, an antisymmetric solution can be built
by introducing the following determinant of spin orbitals also known as Slater
determinant, after John Slater [16]:
Ψ𝑆𝐷(𝐱1, … 𝐱𝑁) = 𝟏
√𝑁! �
�
𝜒1(𝐱1) 𝜒2(𝐱1) … 𝜒𝑁(𝐱1)
𝜒1(𝐱2) 𝜒2(𝐱2) … 𝜒𝑁(𝐱2)
⋮ ⋮ ⋱ ⋮
𝜒1(𝐱𝑁) 𝜒2(𝐱𝑁) … 𝜒𝑁(𝐱𝑁)
�
�
(2.13)
The outcomes of this functional form are:

Methods and theoretical details Chapter 2
44
• 𝜒𝑖s are normalized single-particle wave functions for each respective
particle. All 𝜒𝑖 ’s must be different, otherwise the determinant becomes
zero. This feature clearly show the Pauli’s exclusion principle.
• The interchange of two columns or rows, which are equivalent to the
exhchange of two fermions , results in a change of sign and thereby satisfy
Eq. (2.12).
• Since each electron is associated with every orbital (each column is a
function of all ( 𝐱1, 𝐱2, … , 𝐱𝑁)), electrons are all indistinguishable. This is
in agreement with other results of quantum mechanics [17, 18].
The electronic energy of a Slater determinant wavefunction, i.e. ESD, can be
derived in terms of spatial orbitals by integrating out the spin variable (by making
the assumption that there are even number of electrons which doubly occupy each
spatial orbitals, i.e. closed-shell system ):
𝐸𝑆𝐷 = 2 � ℎ𝑖
𝑁/2
𝑖=1
+ � �
𝑁2
𝑗=1
𝑁2
𝑖=1
�2𝐽𝑖𝑗 − 𝐾𝑖𝑗 � (2.14)
where ℎ𝑖 is the the kinetic and nuclear attraction energy of an electron in orbital
𝜓𝑖, and is given by the below equation.
ℎ𝑖 = � 𝜓𝑖∗ (𝒓)ℎ�𝜓𝑖(𝒓)𝑑𝒓
ℎ� = −12
∇2 − �𝑍𝐴
|𝒓 − 𝑹𝑨|
𝑀
𝐴=1
(2.15)
In Eq. (2.14), 𝐽𝑖𝑗>0 is the Columb or electrostatic interaction energy of the
electron in orbital 𝜓𝑖 with an electron in orbital 𝜓𝑗.
𝐽𝑖𝑗 = �
|𝜓𝑖(𝒓𝟏)|2|𝜓𝑗(𝒓𝟐)|2
𝑟12𝑑𝒓𝟏𝑑𝒓𝟐 (2.16)
𝐾𝑖𝑗>0 is the Exchange interaction energy of the electron in orbital 𝜓𝑖 only with
the electrons of the same spin in orbital 𝜓𝑗. The exchange interaction is a
consequence of antisymmetry and is a purely quantum effect.
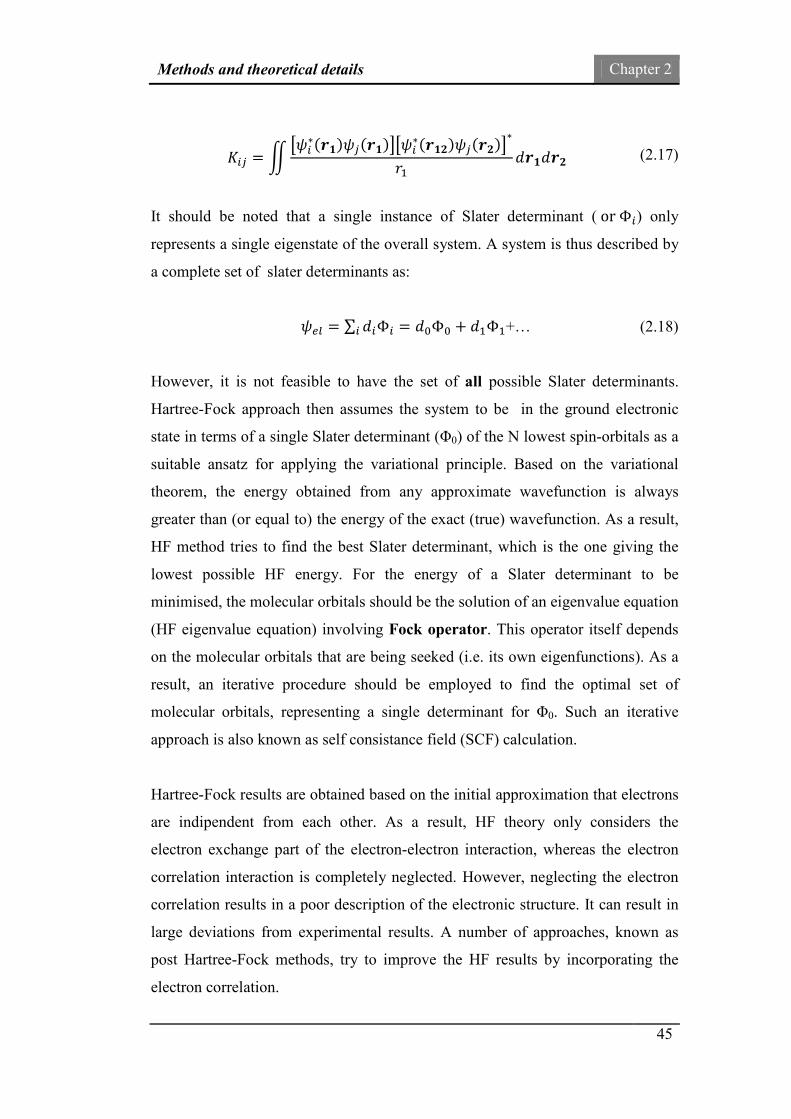
Methods and theoretical details Chapter 2
45
𝐾𝑖𝑗 = �
�𝜓𝑖∗(𝒓𝟏)𝜓𝑗(𝒓𝟏)��𝜓𝑖
∗(𝒓𝟏𝟐)𝜓𝑗(𝒓𝟐)�∗
𝑟1𝑑𝒓𝟏𝑑𝒓𝟐 (2.17)
It should be noted that a single instance of Slater determinant ( or Φ𝑖) only
represents a single eigenstate of the overall system. A system is thus described by
a complete set of slater determinants as:
𝜓𝑒𝑙 = ∑ 𝑑𝑖Φ𝑖 = 𝑑0Φ0𝑖 + 𝑑1Φ1+… (2.18)
However, it is not feasible to have the set of all possible Slater determinants.
Hartree-Fock approach then assumes the system to be in the ground electronic
state in terms of a single Slater determinant (Φ0) of the N lowest spin-orbitals as a
suitable ansatz for applying the variational principle. Based on the variational
theorem, the energy obtained from any approximate wavefunction is always
greater than (or equal to) the energy of the exact (true) wavefunction. As a result,
HF method tries to find the best Slater determinant, which is the one giving the
lowest possible HF energy. For the energy of a Slater determinant to be
minimised, the molecular orbitals should be the solution of an eigenvalue equation
(HF eigenvalue equation) involving Fock operator. This operator itself depends
on the molecular orbitals that are being seeked (i.e. its own eigenfunctions). As a
result, an iterative procedure should be employed to find the optimal set of
molecular orbitals, representing a single determinant for Φ0. Such an iterative
approach is also known as self consistance field (SCF) calculation.
Hartree-Fock results are obtained based on the initial approximation that electrons
are indipendent from each other. As a result, HF theory only considers the
electron exchange part of the electron-electron interaction, whereas the electron
correlation interaction is completely neglected. However, neglecting the electron
correlation results in a poor description of the electronic structure. It can result in
large deviations from experimental results. A number of approaches, known as
post Hartree-Fock methods, try to improve the HF results by incorporating the
electron correlation.
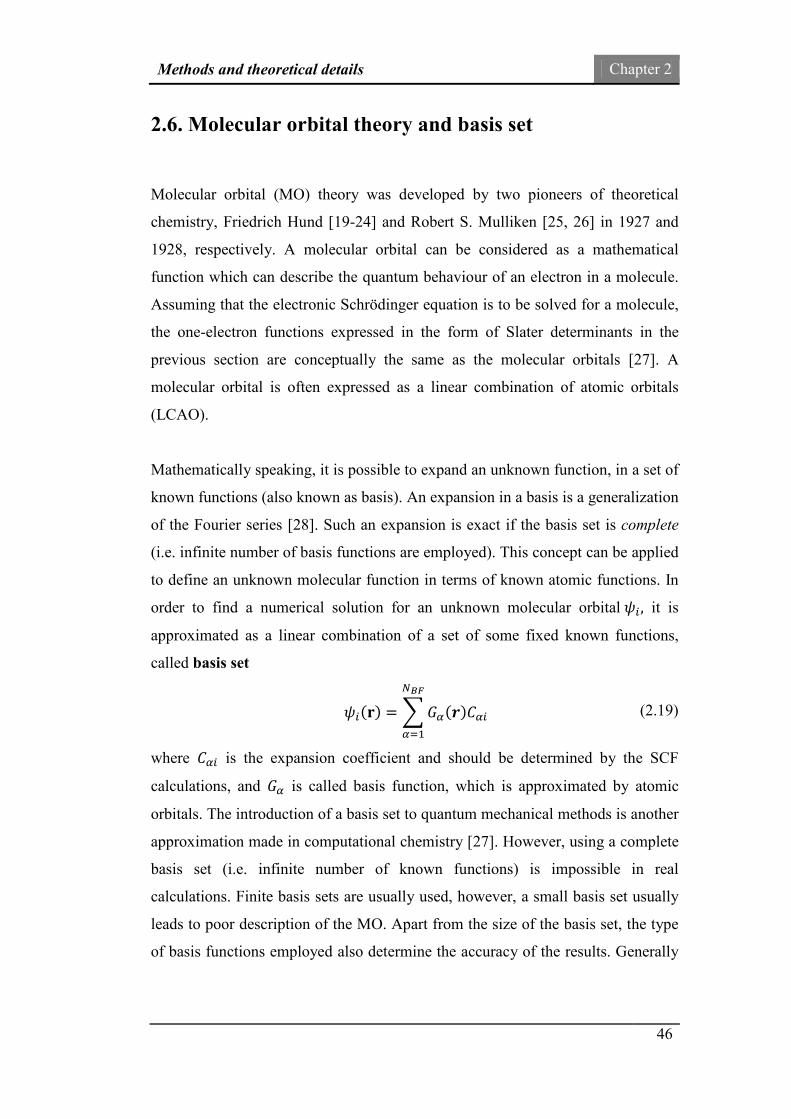
Methods and theoretical details Chapter 2
46
2.6. Molecular orbital theory and basis set
Molecular orbital (MO) theory was developed by two pioneers of theoretical
chemistry, Friedrich Hund [19-24] and Robert S. Mulliken [25, 26] in 1927 and
1928, respectively. A molecular orbital can be considered as a mathematical
function which can describe the quantum behaviour of an electron in a molecule.
Assuming that the electronic Schrödinger equation is to be solved for a molecule,
the one-electron functions expressed in the form of Slater determinants in the
previous section are conceptually the same as the molecular orbitals [27]. A
molecular orbital is often expressed as a linear combination of atomic orbitals
(LCAO).
Mathematically speaking, it is possible to expand an unknown function, in a set of
known functions (also known as basis). An expansion in a basis is a generalization
of the Fourier series [28]. Such an expansion is exact if the basis set is complete
(i.e. infinite number of basis functions are employed). This concept can be applied
to define an unknown molecular function in terms of known atomic functions. In
order to find a numerical solution for an unknown molecular orbital 𝜓𝑖 , it is
approximated as a linear combination of a set of some fixed known functions,
called basis set
𝜓𝑖(𝐫) = � 𝐺𝛼(𝒓)𝐶𝛼𝑖
𝑁𝐵𝐹
𝛼=1
(2.19)
where 𝐶𝛼𝑖 is the expansion coefficient and should be determined by the SCF
calculations, and 𝐺𝛼 is called basis function, which is approximated by atomic
orbitals. The introduction of a basis set to quantum mechanical methods is another
approximation made in computational chemistry [27]. However, using a complete
basis set (i.e. infinite number of known functions) is impossible in real
calculations. Finite basis sets are usually used, however, a small basis set usually
leads to poor description of the MO. Apart from the size of the basis set, the type
of basis functions employed also determine the accuracy of the results. Generally

Methods and theoretical details Chapter 2
47
two types of functions are employed to describe atomic orbitals in MO
calculations: Slater type orbitals (STOs) and Gaussian type orbitals (GTOs).
STO functions were introduced by John C. Slater in 1930 [29]. Their similarity to
the correct shape of the hydrogen atomic orbitals and their accuracy made STO an
appealing choice for basis functions. However, STOs are mathematically difficult
to compute. In 1950, Frank Boy [30] proposed the use of Gaussian type functions,
(i.e. GTOs, although the term GTO is a misnomer) which are computationally
more efficient. GTOs simulate the shape of STOs by summing up a number of
GTOs with different exponents and coefficients. In other words, STOs can be
approximated as a linear combination of Gaussian functions (also known as
Gaussian primitives). A primitive GTO has the polar functional form of:
𝑔𝜁,𝑛,𝑙,𝑚(𝑟, 𝜃, 𝜑 ) = 𝑁𝑌𝑙,𝑚(𝜃, 𝜑)𝑟2𝑛−2−𝑙𝑒−𝜁𝑟2 (2.20)
where N is normalization constant, Yl,m are spherical harmonic functions, ζ (zeta)
controls width of orbital and l=lx+ly+lz determines type of orbital (e.g. l=1 is a p
orbital).
Basis sets are usually classified based on the number of functions used to describe
orbitals. For example, a minimum basis set is the one in which only sufficient
functions are used to contain all the electrons (core through valence) of the neutral
atoms. Based on the fact that the valence electrons are chemically more important
(e.g. bonding take place between valence electrons), it is sensible to treat core and
valence basis functions differently. Such a method where core electrons are
handled with a minimal basis set while the valence electrons are treated with a
larger basis set is called split-valence. The split-valence basis sets of Pople and
coworkers [31] are among the most widely used families of basis sets [32]. The
general notation of Pople basis sets is “M-ijk…G”. Here, M specifies the number
of Gaussian functions which are summed (contracted) to describe the inner shell
(core) orbitals. The number of digits (i.e. ijk…) after the hyphen is variable
(usually 2 or 3) and denotes the number of basis functions per valence atomic

Methods and theoretical details Chapter 2
48
orbital. The value of each digit denotes the degree of contraction to be used for the
given valence basis function.
Other improvements made to basis sets are the addition of polarization and diffuse
functions. Polarization is an effect taking place when atoms approach each other
to form chemical bonds which changes the charge distribution and distorts the
shape of the atomic orbitals. In order to account for the required flexibility to
atomic orbitals to shift to one side or the other when forming chemical bonds,
polarization functions can be added into the Pople basis sets. In Pople’s notation,
polarization functions are denoted by one or two asterisk (* or **) after the basis
set name. Another common addition to basis sets is diffuse functions to represent
electrons far away from the nucleus (i.e. the "tail" portion of the atomic orbitals).
Addition of diffuse functions is necessary for calculation on anions or neutral
molecules with lone pair electrons and very electronegative atoms (e.g. fluorine).
Diffuse functions are indicated by + or ++ in Pople basis set notation.
2.7. Density functional theory
The Hartree-Fock ab initio method which was discussed in the section 2.5 is
based on the electronic wavefunction. Although wavefunction encompasses all the
information of a system in a certain state, its complexity is overwhelming. A
wavefunction for a system of Nel electrons is dependent on all three spatial and
one spin coordinate of each electron and its complexity increases exponentially
with the number of the electrons. Density functional theory (DFT) is another
approach to the electronic structure of matter, in which the properties of interest
are calculated based on the ground state electron density, rather than the
wavefunction. The advantage of electron density (denoted by ρ(r) given in Eq.
(2.21)) is that it is independent of the number of electrons (i.e. it is a function of
only 3 variables) and thus less complicated.
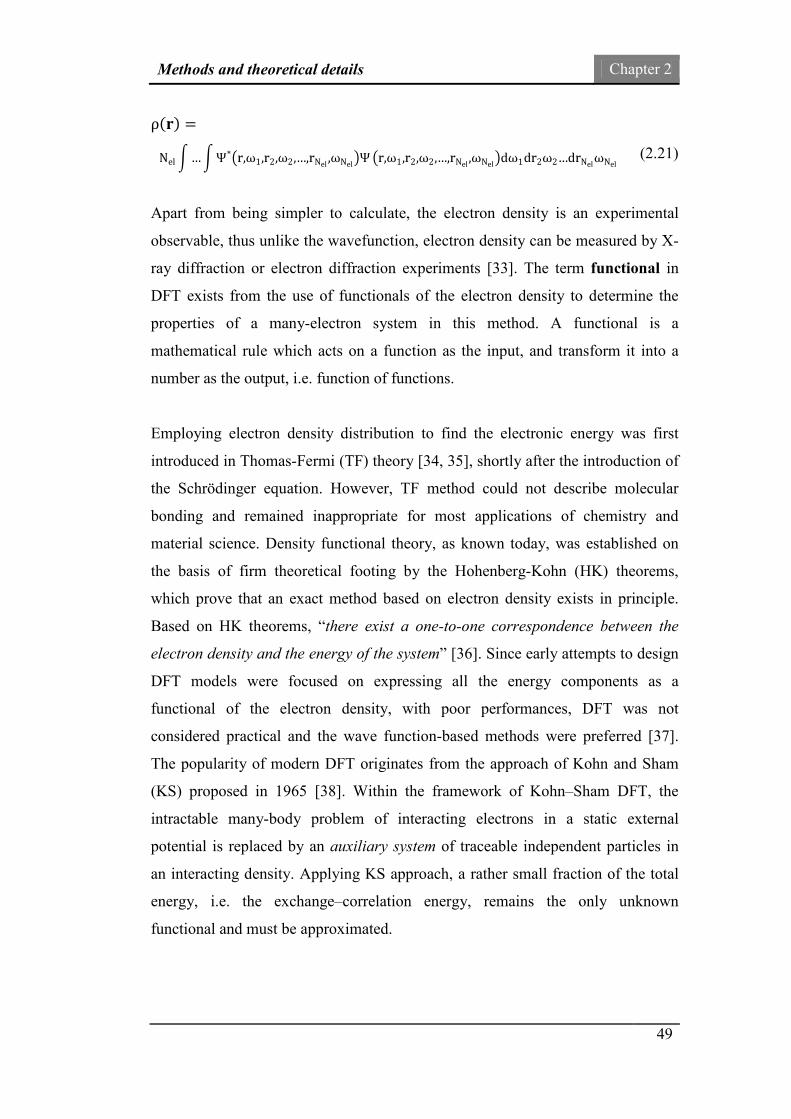
Methods and theoretical details Chapter 2
49
ρ(𝐫) =
Nel � … � Ψ*�r,ω1,r2,ω2,…,rNel ,ωNel �Ψ �r,ω1,r2,ω2,…,rNel,ωNel �dω1dr2ω2…drNelωNel
(2.21)
Apart from being simpler to calculate, the electron density is an experimental
observable, thus unlike the wavefunction, electron density can be measured by X-
ray diffraction or electron diffraction experiments [33]. The term functional in
DFT exists from the use of functionals of the electron density to determine the
properties of a many-electron system in this method. A functional is a
mathematical rule which acts on a function as the input, and transform it into a
number as the output, i.e. function of functions.
Employing electron density distribution to find the electronic energy was first
introduced in Thomas-Fermi (TF) theory [34, 35], shortly after the introduction of
the Schrödinger equation. However, TF method could not describe molecular
bonding and remained inappropriate for most applications of chemistry and
material science. Density functional theory, as known today, was established on
the basis of firm theoretical footing by the Hohenberg-Kohn (HK) theorems,
which prove that an exact method based on electron density exists in principle.
Based on HK theorems, “there exist a one-to-one correspondence between the
electron density and the energy of the system” [36]. Since early attempts to design
DFT models were focused on expressing all the energy components as a
functional of the electron density, with poor performances, DFT was not
considered practical and the wave function-based methods were preferred [37].
The popularity of modern DFT originates from the approach of Kohn and Sham
(KS) proposed in 1965 [38]. Within the framework of Kohn–Sham DFT, the
intractable many-body problem of interacting electrons in a static external
potential is replaced by an auxiliary system of traceable independent particles in
an interacting density. Applying KS approach, a rather small fraction of the total
energy, i.e. the exchange–correlation energy, remains the only unknown
functional and must be approximated.

Methods and theoretical details Chapter 2
50
The vast majority of the modern quantum chemistry calculations are based on
density functional theory (DFT) because of its relatively low computational costs
with good accuracy. In the following subsections, this method will be presented in
more details.
2.7.1. Hohenberg–Kohn theorems
DFT is based on a firm theoretical foundation of two Hohenberg–Kohn theorems
(HK) [39] . The first theorem states that:
“For any system of interacting particles in an external potential Vext(r), the
potential Vext(r) is determined uniquely, except for a constant, by the ground state
particle density ρ0(r).”[37]
The corollary of this theorem is that all the properties of the system such as the
total electronic energy (Eel) are completely determined, given only the ground
state density (ρ0(r)) [37, 40]. The external potential Vext(r) is the nuclear attraction
energy part of the electronic Hamiltonian. It is called external due to the Born-
Oppenheim approximation which assumes nuclei are fixed objects which exert
their Coulomb potential to the electrons. As a result, the total electronic energy
can be written as [40]
𝐸𝑒𝑙[𝜌] = 𝑇[𝜌] + 𝑉𝑒𝑒[𝜌] + 𝑉𝑁𝑒[𝜌] = 𝐹𝐻𝐾[𝜌] + � 𝑉𝑒𝑥𝑡 (𝒓)𝜌(𝒓)𝑑𝒓 (2.22)
where 𝐹𝐻𝐾[𝜌] is a universal functional (i.e. does not depend on the external
potential), which contains the electron kinetic energy, 𝑇[𝜌], and the electron-
electron repulsion potential energy 𝑉𝑒𝑒[𝜌]. The nuclei-electron attraction 𝑉𝑁𝑒[𝜌] is
expressed in terms of external potential. Furthermore, with reference to Hartree–
Fock theory, the 𝑉𝑒𝑒[𝜌] term can be divided into two parts: a classical Coulomb
energy of a charge distribution with itself, 𝐽[𝜌] given by

Methods and theoretical details Chapter 2
51
𝐽[𝜌] =12
�𝜌(𝒓1)𝜌(𝒓2)
𝑟12𝑑𝒓1𝑑𝒓2 (2.23)
and a non-classical exchange-correlation energy term, 𝐸𝑥𝑐′ [𝜌]. The later part,
arising from the antisymmetrization, is a correction that should be made to
Coulomb energy to take into account the effect of spin correlation [27, 36].
According to the second theorem, “a universal functional for the total energy
E[ρ] in terms of the density ρ(r) can be defined, valid for any external potential
Vext(r). For any particular Vext(r), the exact ground state of the system is the
global minimum value of this functional, and the density ρ(r) that minimizes the
functional is the exact ground state density ρ0(r);”[37].
The second theorem establishes a variational principle for density functional
theory. Based on this theorem, any trial electron density function will result in an
energy higher than (or equal to) the true ground state energy.
Although in principle correct, attempts to deduct density functionals for all terms
of Eq. (2.16), also known as “orbital free” approaches, are not very accurate
mainly because of the lack of good approximations for the kinetic energy
functional [41, 42]. The Kohn-Sham approach to DFT was proposed to overcome
this problem [38].
2.7.2. Kohn–Sham approach
The major breakthrough in developing the modern density functional theory
resulted from Kohn and Sham in 1965 [38]. They assumed that the original many-
body interacting system would be replaced by constructing a fictitious set of non-
interacting electrons which have the same density as the original system by
definition [43]. There exists an exact expression for the kinetic energy of non-
interacting electrons in terms of molecular orbitals, 𝜓𝑖 rather than density. In KS

Methods and theoretical details Chapter 2
52
approach, the single particle orbitals (which is a special type of wavefunctions
describing the non-interacting particles), are reintroduced. As a result, the KS
model is closely related to the HF method.
The 𝐹𝐻𝐾[𝜌] functional in Eq. (2.22) can then be written as
𝐹𝐻𝐾[𝜌] = 2 � � 𝜓𝑖∗(𝒓) �−
12
∇2� 𝜓𝑖(𝒓)𝑑𝒓𝑁𝑒𝑙 2⁄
𝑖=1
+ 𝐽[𝜌] + 𝐸𝑥𝑐[𝜌] (2.24)
where 𝐸𝑥𝑐[𝜌] contains all non-classical effects (i.e.𝐸𝑥𝑐′ [𝜌]) as well as the
difference in kinetic energy between the real (interacting) and the reference (non-
interacting) system.
The initial problem of finding the kinetic energy functional for the system of
interacting particles is now shifted to finding the molecular orbitals of non-
interacting electrons. By applying the variational principle, Kohn-Sham equations
are derived which are formally very similar to Hartree-Fock (HF) equations.
Kohn-Sham (KS) method uses an initial guess of the electron density in the KS
equations to calculate the KS orbitals. It is a very similar approach to that of HF
method to solve for molecular orbitals (i.e. basis set expansion of KS orbitals and
SCF method) [13, 40].
2.7.3. Approximate exchange-correlation functionals
The key problem with DFT is that no functional is known for the exchange-
correlation, 𝐸𝑥𝑐[𝜌], term in Eq. (2.24) and approximations should be sought for
this energy term. Several approximations have been made for this entity such as
local-density approximation (LDA), generalized gradient approximations (GGA),
meta–GGA (MGGA) and hybrid functionals. Exchange-correlation functionals
can be written in the form of:
Methods and theoretical details Chapter 2
53
𝐸𝑥𝑐[𝜌] = � 𝜌(𝒓)𝜖𝑥𝑐 [𝜌(𝒓)]𝑑𝒓 (2.25)
where 𝜖𝑥𝑐[𝜌(𝒓)] is the exchange-correlation energy density which represents the
energy per electron, whereas the density, i.e. 𝜌(𝒓) shows the number of electrons
per unit volume.
The simplest approximation is LDA which is based on the assumption of a
uniform electron gas model. The exchange-correlation energy in LDA can simply
be decomposed into exchange and correlation terms, linearly (i.e. Exc=Ex+Ec). The
correlation energy (Ec) is not analytically known and should be approximated. For
example, it can be approximated based on fitting the results of accurate quantum
Monte Carlo simulations). The exchange energy (Ex) is known analytically and
can be expressed as
𝐸𝑥
𝐿𝐷𝐴[𝜌] = 𝐶 � 𝜌43(𝒓) 𝑑𝒓 (2.26)
which only depends on the value of the density at a point. Results of the LDA can
be improved by also incorporating the gradient of density. Such an approach is
known as generalised gradient approximation (GGA):
𝐸𝑥𝑐
𝐺𝐺𝐴[𝜌] = � 𝜌(𝒓)𝜖𝑥𝑐 (𝜌(𝒓), |∇𝜌(𝒓)|)𝑑𝒓 (2.27)
Consequently, in Meta-GGA approach, the Laplacian (the second derivative) of
the density is also incorporated to improve the results.
The most important and widely used class of functionals, which are mainly used
throughout this thesis, is known as hybrid functionals. This approach was first
introduced by Axel D. Becke in 1992 [44]. The main idea of hybridization is to
combine Hartree–Fock (HF) theory with local density‐functional theory. In this
manner, hybrid functionals incorporate a portion of exact exchange from the HF
theory, calculated as a functional of Kohn-Sham molecular orbitals rather than the
density, with exchange and correlation from other sources (ab initio or empirical).
The HF exchange energy can be written as:
Methods and theoretical details Chapter 2
54
𝐸𝑥𝐻𝐹[{𝜓𝑖 }] = − � � �
𝜓𝑖∗(𝒓)𝜓𝑗(𝒓)𝜓𝑗
∗(𝒓′)𝜓𝑖(𝒓′)|𝒓 − 𝒓′|
𝑑𝒓𝑑𝒓′𝑁𝑒𝑙 2⁄
𝑗=1
𝑁𝑒𝑙 2⁄
𝑖=1
(2.28)
The general form of hybrid functionals can be written as a weighted sum of HF
part and DFT part in the form of:
𝐸𝑥𝑐 = (1 − a)𝐸𝑥𝑐
𝐷𝐹𝑇 + 𝑎𝐸𝑥𝐻𝐹 (2.29)
One of the most successful and popular hybrid functionals to this date is B3LYP
(Becke, three-parameter, Lee-Yang-Parr) [44-47]. Another functional which has
recently become very popular is PBE0 functional [48]. These two functionals are
widely used for most of the calculations in this thesis. However, long range
corrected functionals are also investigated in Chapter 5 in time-dependent DFT
calculations (TD-DFT) which will be discussed in that chapter.
2.8. Time-dependent density functional theory
Time-dependent density functional theory (TD-DFT) is an extension to the
density functional theory (DFT) to study the molecular properties arising from
time-dependent domains such as electric or magnetic potential fields. The fact that
DFT is a ground state theory for investigating properties of a system at
equilibrium makes it inappropriate for studying properties such as excitation
energies or photo-absorption spectra. However, the efficiency of DFT, i.e.
exploiting the density variable which is less complex than wavefunction, has been
employed to develop TD-DFT. In principle, TD-DFT can be viewed as a
reformulation of time-dependent quantum mechanics, where the fundamental
variable is the density instead of the complex wavefunction [49].
The formal foundation for TD-DFT is provided by the Runge-Gross theorem [50],
which is analogue of the Hohenberg-Kohn (HK) [39] theorem for the time-
dependent version of the Schrödinger equation, given (in atomic units) as

Methods and theoretical details Chapter 2
55
𝐻�Ψ = i
∂∂𝑡
Ψ (2.30)
where the Hamiltonian and the wavefunction are a function of both the spatial
coordinates and the time, i.e., 𝐻�(𝒓, 𝑡) and Ψ(𝒓, 𝑡). Given the quantum state of the
system at an initial time, t0 , the wavefunction at any other time, t, can be
calculated from Eq. (2.30) [49].
The Runge-Gross theorem proves that for a time-dependent system evolving from
a given fixed initial many-body state, Ψ0, there exist a one-to-one correspondence
(i.e. an invertible mapping, modulo c(t)) between the external potential, Vext(r,t),
and the electron density, ρ(r,t) [49-53]. It follows that the time-dependent density
is sufficient to obtain all observable of a time-dependent many-body system [52].
Similar to the static DFT approach, the next step for developing a practical TD-
DFT method is to replace the interacting system with an auxiliary non-interacting
system (Kohn-Sham system) that reproduces the same density. This becomes
possible by Van Leeuwen theorem [54]. It shows that (under some restrictions and
assumptions) for every interacting time-dependent probability density ρ(r,t), there
exists a non-interacting (i.e. one-body) Kohn-Sham potential which reproduces
the same density of the interacting-system [49].
One of the most popular applications of TD-DFT is the calculation of excited-
state properties and optical spectra using linear response theory [49, 52, 55-57]. In
fact, the primary application of TD-DFT to this date is in the linear response
regime [58]. Linear-response theory can be used if the time-dependent potential is
weak so that it does not completely destruct the ground-state structure of the
system. This is the case with the weak perturbation of the molecular arrangement
as a response to rather weak long-wavelengths optical field (e.g. the UV-Vis
range) [58]. Within the linear response regime, the system is assumed to be in the
ground state initially, and then a weak time-dependent external perturbation is
applied. The linear response of the density (i.e. the induced change in the density
as a result of the perturbation) will be obtained from a “response function”, which

Methods and theoretical details Chapter 2
56
is the central quantity of linear response theory. A linear response treatment of
TD-DFT is therefore the application of the linear response theory to a time-
dependent Kohn-Sham framework (i.e. a fictitious system of non-interacting
electrons). The application of TD-DFT to UV-Vis absorption spectroscopy will be
explained shortly in section 2.11.
2.9. Potential energy surface and geometry optimization
Most of the computational studies of chemical processes and molecular properties
begin with geometry optimization. The reason is that the most stable structure of a
system is the minimum energy structure. There is an established relationship
between the molecular properties and molecular geometry. As a result, it is
important to obtain accurate molecular geometry before any other calculations
take place. This starting step, i.e. geometry optimization, aims at exploring the
potential energy surface (PES) to locate the minimum energy structure. In other
words, the geometry optimization, also known as energy minimization, is a search
to find the minima structures on the PES.
Potential energy surface is perhaps the most fundamental and central concept to
computational study of the molecular structure [33, 59, 60]. A PES, which was
introduced in section 2.4, can be defined as the relationship between the energy of
a molecule and its geometry. This relationship naturally arises from the fact that
the energy of a molecular system varies even with small changes in its structure
(as shown in Born–Oppenheimer approximation).
Geometry optimization calculations usually begin with providing an initial guess
of the structure for the molecule to a computer algorithm that systematically
changes the geometry until a stationary point on the potential surface is found.
Each molecular structure (i.e. geometric set) corresponds to an energy value and
the collection of such points is called potential energy (super) surface. The
minimum energy structure determines the molecular bond lengths, bond angles
Methods and theoretical details Chapter 2
57
and dihedral angles. A number of algorithms are available for geometry
optimization, such as Berny algorithm using GEDIIS [61] in Gaussian 09
computational package [62], which is employed in this thesis.
Once a stationary point on the PES is found by the geometry optimization
procedure, the nature of the stationary point, which can be either a minimum, or a
transition state, or a hilltop needs to be identified. In order to check the character
of a stationary point, it is necessary to determine the curvature of the PES at the
stationary point, i.e. the second derivatives of the energy with respect to the
geometric parameters. This can be done by calculating the vibrational frequencies
on the optimized geometry [33]. A frequency value less than zero is known as
imaginary frequency and mathematically, any stationary point containing
imaginary frequency is not an energy minimum.
2.10. Vibrational frequency calculation
Vibrational frequency calculations can be employed to characterize stationary
points, to obtain infrared (IR) spectrum, to obtain zero point energies and to
realize various thermo-chemical properties. Such calculations usually involve
finding the normal-mode frequencies which are the simplest vibrations of the
molecule. For a nonlinear molecule with n atoms there exist 3n-6 normal modes
which are the simplest type of vibrations of a molecule (3n -5 normal modes in
case of a linear molecule). In fact, calculation of normal-modes yields the IR
spectrum of the molecule [33].
Infrared spectroscopy is among the most important and powerful spectroscopy
techniques employed for analytical study of molecules [63-65]. Any spectroscopy
techniques conceptually study the interaction between the matter and a different
region of the electromagnetic spectrum. In case of the IR spectroscopy, photons of
lower energies and frequencies (and longer wavelengths) in the infrared region are
used to excite vibrations of chemical bonds and functional groups within a sample
Methods and theoretical details Chapter 2
58
molecule. The excitation of a molecular vibration occurs when the molecule
absorbs a quantum of energy, E, from the infrared radiation that corresponds to
the vibration's frequency, ν, according to the relation:
𝐸 = ℎ𝜈 (2.30)
where h is Planck's constant. Such a vibration should lead to a change of the
dipole moment of the molecule to be called IR active.
Vibrational frequency calculations are utilized to identify the nature of all
optimized geometries throughout this work (Chapters 3-7), as well as to
differentiate the conformers of ferrocene (Chapter 7). Furthermore, such
calculations are employed to obtain the zero point energies as well as the thermo-
chemical features of ferrocene/ferrocenium couple in order to study its redox
potential (Chapter 7).
2.11. UV-Vis spectroscopy
While interaction with infrared light causes molecules to undergo vibrational
transitions which can be captured by IR spectroscopy, the higher energy radiation
in the ultraviolet (UV) and visible (Vis) range of the electromagnetic spectrum
leads many molecules to undergo electronic transitions. This means that
absorption of the energy from UV or Vis light by the molecule gives rise to one of
its electrons to jump from a lower energy to a higher energy molecular orbital. As
a result, absorption spectroscopy performed in this region is also called "electronic
spectroscopy" or “UV-Vis spectroscopy”. The feature of absorbing in the UV-Vis
part of electromagnetic spectrum, is the characteristic of a class of molecules
called “dyes” [66]. The functional or elementary group of the compound
responsible for the absorbance is called chromophore [67-70].
Fig. 2.1 shows a diagram of the various kinds of electronic excitation that may
occur in organic molecules which are the subject of this thesis. This figure shows
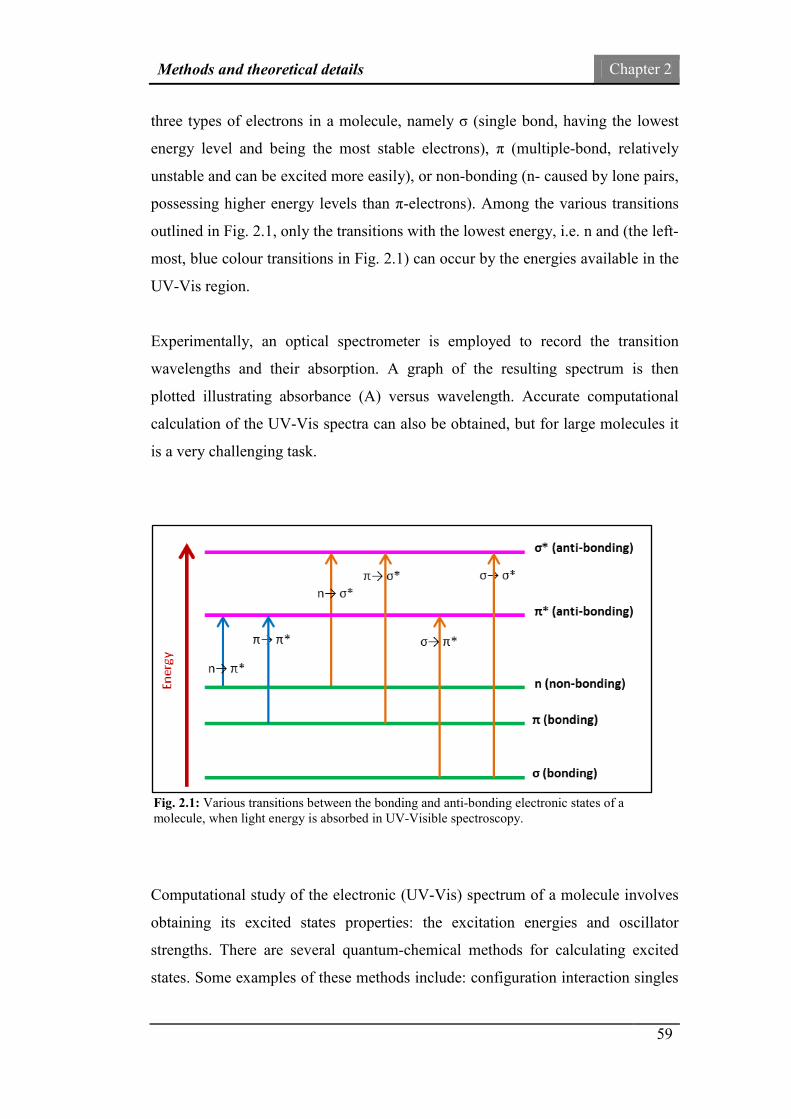
Methods and theoretical details Chapter 2
59
three types of electrons in a molecule, namely σ (single bond, having the lowest
energy level and being the most stable electrons), π (multiple-bond, relatively
unstable and can be excited more easily), or non-bonding (n- caused by lone pairs,
possessing higher energy levels than π-electrons). Among the various transitions
outlined in Fig. 2.1, only the transitions with the lowest energy, i.e. n and (the left-
most, blue colour transitions in Fig. 2.1) can occur by the energies available in the
UV-Vis region.
Experimentally, an optical spectrometer is employed to record the transition
wavelengths and their absorption. A graph of the resulting spectrum is then
plotted illustrating absorbance (A) versus wavelength. Accurate computational
calculation of the UV-Vis spectra can also be obtained, but for large molecules it
is a very challenging task.
Computational study of the electronic (UV-Vis) spectrum of a molecule involves
obtaining its excited states properties: the excitation energies and oscillator
strengths. There are several quantum-chemical methods for calculating excited
states. Some examples of these methods include: configuration interaction singles
Fig. 2.1: Various transitions between the bonding and anti-bonding electronic states of a molecule, when light energy is absorbed in UV-Visible spectroscopy.

Methods and theoretical details Chapter 2
60
(CIS), random-phase approximation (RPA), approaches based on coupled-cluster
(CC-based methods), time-dependent density functional theory (TD-DFT), and a
more recently proposed multi reference configuration interaction DFT method
(DFT/MRCI). Because of its simplicity, low computational cost and reasonable
accuracy, TD-DFT is presently very popular and has become the most widely
used theory for modelling excited states of medium-sized to large molecules [55,
71-74]. Today’s popularity of TD-DFT was predicted in a major review in 2005
as, “Most probably, excited-state calculations will be carried out in near future by
using the TD-DFT (Time-Dependent Density Functional Theory) approach, which
is becoming more and more popular because of their simplicity and apparent
black-box behaviour” [75]. As a result, calculations of the UV-Vis absorption
spectra and excited-state properties of dye sensitizers have been dominated by
TD-DFT method in a number of theoretical studies [76-91], and it is also
employed in this thesis.
2.12. Solvent effects
It is important to include the effects of solvation on the calculations of molecular
properties, because many experimental measurements take place in solutions. For
example, the experimental measurements of the absorption spectra of dye
sensitizers or the infrared spectra of ferrocene are usually measured in the
presence of a solution. Another reason for including the solvent effects is to study
the redox potential of ferrocene/ferrocenium (Fc/Fc+) as liquid electrolyte in this
study.
Ideally, the solvation effects should be calculated by explicit inclusion of solvent
molecules. However, this approach is a computationally demanding task and is
limited to very small solutes [92, 93]. Alternatively, implicit solvation methods
can be employed in which the solute is placed into a cavity of the solvent reaction
field. Here, the solvent is treated as a structure-less dielectric medium with surface

Methods and theoretical details Chapter 2
61
tension at the solute-solvent boundary. Such an approach to the simulation of
solvation is called “continuum” approximation.
In this thesis, continuum solvation methods such as PCM (or D-PCM) [94], C-
PCM [95, 96] and SMD [97] are employed to simulate the molecular properties in
solutions. In all of the above methods, the solvation effect is considered implicitly
as the solvent is modelled in the form of a polarizable continuum rather than
individual molecules. The conventional PCM model, treats the continuum as a
polarizable dielectric, while C-PCM treats the continuum as a conductor-like
media. PCM is also called as D-PCM in recent years [98]. Finally, the SMD
method, models the quantum mechanical charge density (i.e. the full electron
density without defining partial atomic charges) of the solute molecule which
interacts with a continuum description of the solvent [97].

Methods and theoretical details Chapter 2
62
References
1. A.R. Katritzky, M. Kuanar, S. Slavov, C.D. Hall, M. Karelson, I. Kahn and D.A. Dobchev, Quantitative Correlation of Physical and Chemical Properties with Chemical Structure: Utility for Prediction. Chemical Reviews, 2010. 110(10): p. 5714-5789.
2. P.G. Seybold, M. May and U.A. Bagal, Molecular structure: Property relationships. Journal of Chemical Education, 1987. 64(7): p. 575.
3. G.O. Shonaike and S.G. Advani, Advanced Polymeric Materials: Structure Property Relationships. 2003: Taylor & Francis.
4. M. Charton, Advances in Quantative Structure - Property Relationships. 2002: Elsevier Science.
5. A.F.J. Levi, Applied Quantum Mechanics. 2006: Cambridge University Press.
6. C.D. Sherrill, A Brief Review of Elementary Quantum Chemistry 2001, Georgia Institute of Technology.
7. A. Pais, Max Born's Statistical Interpretation of Quantum Mechanics. Science, 1982. 218(4578): p. 1193-1198.
8. Fayyazuddin, Quantum Mechanics. 1990: World Scientific.
9. H. Smith, Introduction to Quantum Mechanics. 1991: World Scientific.
10. E. Schrodinger, An undulatory theory of the mechanics of atoms and molecules. Physical Review, 1926. 28(6): p. 1049-1070.
11. G. Hautier, A. Jain and S. Ong, From the computer to the laboratory: materials discovery and design using first-principles calculations. Journal of Materials Science, 2012. 47(21): p. 7317-7340.
12. C.F. Bunge and A. Bunge, Upper and Lower Bounds to the Eigenvalues of Double-Minimum Potentials. The Journal of Chemical Physics, 1965. 43(10): p. S194-S198.
13. E. Lewars, Computational Chemistry: Introduction to the Theory and Applications of Molecular and Quantum Mechanics. 2003: Springer.
14. M. Born and R. Oppenheimer, Zur Quantentheorie der Molekeln. Annalen der Physik, 1927. 389(20): p. 457-484.
15. S.F. Sousa, P.A. Fernandes and M.J. Ramos, General performance of density functionals. The journal of physical chemistry A, 2007. 111(42): p. 10439-52.

Methods and theoretical details Chapter 2
63
16. J.C. Slater, The theory of complex spectra. Physical Review, 1929. 34(10): p. 1293-1322.
17. G. Aruldhas, Quantum Mechanics. 2002: Prentice Hall of India.
18. M. Chester, Primer of Quantum Mechanics. 2003: Dover Publications.
19. F. Hund, Zur Deutung einiger Erscheinungen in den Molekelspektren. Zeitschrift für Physik, 1926. 36(9-10): p. 657-674.
20. F. Hund, Zur Deutung der Molekelspektren. I. Zeitschrift für Physik, 1927. 40(10): p. 742-764.
21. F. Hund, Zur Deutung der Molekelspektren. II. Zeitschrift für Physik, 1927. 42(2-3): p. 93-120.
22. F. Hund, Zur Deutung der Molekelspektren. III. Zeitschrift für Physik, 1927. 43(11-12): p. 805-826.
23. F. Hund, Zur Deutung der Molekelspektren. IV. Zeitschrift für Physik, 1928. 51(11-12): p. 759-795.
24. F. Hund, Zur Deutung der Molekelspektren V. Zeitschrift für Physik, 1930. 63(11-12): p. 719-751.
25. R.S. Mulliken, Electronic States and Band Spectrum Structure in Diatomic Molecules. IV. Hund's Theory; Second Positive Nitrogen and Swan Bands; Alternating Intensities. Physical Review, 1927. 29(5): p. 637-649.
26. R.S. Mulliken, The Assignment of Quantum Numbers for Electrons in Molecules. I. Physical Review, 1928. 32(2): p. 186-222.
27. F. Jensen, Introduction to Computational Chemistry. 2013: Wiley.
28. R.D. Poshusta (1999) Fourier Series. Washington State University. http://www.idea.wsu.edu/Quantum/fourier_series.htm. Accessed 24/03/2014
29. J.C. Slater, Atomic Shielding Constants. Physical Review, 1930. 36(1): p. 57-64.
30. S.F. Boys, Electronic Wave Functions. I. A General Method of Calculation for the Stationary States of Any Molecular System. Proceedings of the Royal Society of London. Series A. Mathematical and Physical Sciences, 1950. 200(1063): p. 542-554.
31. R. Ditchfield, W.J. Hehre and J.A. Pople, Self-Consistent Molecular-Orbital Methods. IX. An Extended Gaussian-Type Basis for Molecular-Orbital Studies of Organic Molecules. The Journal of Chemical Physics, 1971. 54(2): p. 724-728.

Methods and theoretical details Chapter 2
64
32. C.J. Cramer, Essentials of Computational Chemistry: Theories and Models. 2013: Wiley.
33. E. Lewars, Computational Chemistry: Introduction to the Theory and Applications of Molecular and Quantum Mechanics. 2010: Springer Netherlands.
34. E. Fermi, Eine statistische Methode zur Bestimmung einiger Eigenschaften des Atoms und ihre Anwendung auf die Theorie des periodischen Systems der Elemente. Zeitschrift für Physik, 1928. 48(1-2): p. 73-79.
35. L.H. Thomas, The calculation of atomic fields. Mathematical Proceedings of the Cambridge Philosophical Society, 1927. 23(05): p. 542-548.
36. d. Cuyper and J.W.M. Bulte, Physics and Chemistry Basis of Biotechnology. 2001: Springer.
37. R.M. Martin, Electronic Structure: Basic Theory and Practical Methods. 2004: Cambridge University Press.
38. W. Kohn and L.J. Sham, Self-Consistent Equations Including Exchange and Correlation Effects. Physical Review, 1965. 140(4A): p. A1133-A1138.
39. P. Hohenberg and W. Kohn, Inhomogeneous Electron Gas. Physical Review, 1964. 136(3B): p. B864-B871.
40. P. Nava, Density Functional Theory Calculations on Palladium Clusters and on an AgInS Semiconductor Compound. 2005: Cuvillier Verlag.
41. Y.A. Wang, N. Govind and E.A. Carter, Orbital-free kinetic-energy density functionals with a density-dependent kernel. Physical Review B, 1999. 60(24): p. 16350-16358.
42. S.S. Iyengar, M. Ernzerhof, S.N. Maximoff and G.E. Scuseria, Challenge of creating accurate and effective kinetic-energy functionals. Physical Review A, 2001. 63(5): p. 052508.
43. K. Burke and L.O. Wagner, DFT in a nutshell. International Journal of Quantum Chemistry, 2013. 113(2): p. 96-101.
44. A.D. Becke, A new mixing of Hartree--Fock and local density-functional theories. The Journal of Chemical Physics, 1993. 98(2): p. 1372-1377.
45. A.D. Becke, Density-functional thermochemistry. III. The role of exact exchange. The Journal of Chemical Physics, 1993. 98(7): p. 5648-5652.
46. J.P. Perdew, K. Burke and M. Ernzerhof, Generalized gradient approximation made simple. Physical Review Letters, 1996. 77(18): p. 3865-3868.

Methods and theoretical details Chapter 2
65
47. C.T. Lee, W.T. Yang and R.G. Parr, Development of the Colle-Salvetti Correlation-Energy Formula into a Functional of the Electron-Density. Physical Review B, 1988. 37(2): p. 785-789.
48. C. Adamo and V. Barone, Toward reliable density functional methods without adjustable parameters: The PBE0 model. Chinese Journal of Chemical Physics, 1999. 110(13): p. 6158-6170.
49. M. Marques, Time-Dependent Density Functional Theory. 2006: Springer.
50. E. Runge and E.K.U. Gross, Density-Functional Theory for Time-Dependent Systems. Physical Review Letters, 1984. 52(12): p. 997-1000.
51. G. Giuliani and G. Vignale, The Electron Liquid Paradigm in Condensed Matter Physics. 2004: IOS Press.
52. C.A. Ullrich, Time-Dependent Density-Functional Theory: Concepts and Applications. 2012: OUP Oxford.
53. M.A.L. Marques, N.T. Maitra, F.M.S. Nogueira, E.K.U. Gross and A. Rubio, Fundamentals of Time-Dependent Density Functional Theory. 2012: Springer.
54. R. van Leeuwen, Mapping from Densities to Potentials in Time-Dependent Density-Functional Theory. Physical Review Letters, 1999. 82(19): p. 3863-3866.
55. K. Burke, J. Werschnik and E.K.U. Gross, Time-dependent density functional theory: Past, present, and future. The Journal of Chemical Physics, 2005. 123(6): p. 062206-9.
56. M.E. Casida, Time-dependent density-functional theory for molecules and molecular solids. Journal of Molecular Structure: THEOCHEM, 2009. 914(1–3): p. 3-18.
57. P. Comba, Modeling of Molecular Properties. 2011: Wiley.
58. P. Elliott, F. Furche and K. Burke, Excited States from Time-Dependent Density Functional Theory, in Reviews in Computational Chemistry. 2009, John Wiley & Sons, Inc. p. 91-165.
59. R.M. Minyaev, Molecular structure and global description of the potential energy surface. Journal of Structural Chemistry, 1992. 32(4): p. 559-589.
60. C.E. Dykstra, Theory and Applications of Computational Chemistry: The First Forty Years. 2005: Elsevier.
61. X. Li and M.J. Frisch, Energy-Represented Direct Inversion in the Iterative Subspace within a Hybrid Geometry Optimization Method. Journal of Chemical Theory and Computation, 2006. 2(3): p. 835-839.
Methods and theoretical details Chapter 2
66
62. G.W.T. M. J. Frisch, H. B. Schlegel, G. E. Scuseria, M. A. Robb, J. R. Cheeseman, G. Scalmani, V. Barone, B. Mennucci, G. A. Petersson, H. Nakatsuji, M. Caricato, X. Li, H. P. Hratchian, A. F. Izmaylov, J. Bloino, G. Zheng, J. L. Sonnenberg, M. Hada, M. Ehara, K. Toyota, R. Fukuda, J. Hasegawa, M. Ishida, T. Nakajima, Y. Honda, O. Kitao, H. Nakai, T. Vreven, J. A. Montgomery, Jr., J. E. Peralta, F. Ogliaro, M. Bearpark, J. J. Heyd, E. Brothers, K. N. Kudin, V. N. Staroverov, R. Kobayashi, J. Normand, K. Raghavachari, A. Rendell, J. C. Burant, S. S. Iyengar, J. Tomasi, M. Cossi, N. Rega, J. M. Millam, M. Klene, J. E. Knox, J. B. Cross, V. Bakken, C. Adamo, J. Jaramillo, R. Gomperts, R. E. Stratmann, O. Yazyev, A. J. Austin, R. Cammi, C. Pomelli, J. W. Ochterski, R. L. Martin, K. Morokuma, V. G. Zakrzewski, G. A. Voth, P. Salvador, J. J. Dannenberg, S. Dapprich, A. D. Daniels, Ö. Farkas, J. B. Foresman, J. V. Ortiz, J. Cioslowski, and D. J. Fox, Gaussian, Inc., Wallingford CT, Gaussian 09. 2009, Gaussian, Inc.: Wallingford CT.
63. B.H. Stuart, Infrared Spectroscopy: Fundamentals and Applications. 2004: Wiley.
64. F.A. Settle, Handbook of instrumental techniques for analytical chemistry. 1997: Prentice Hall PTR.
65. N.B. Colthup, L.H. Daly and S.E. Wiberley, Introduction to Infrared and Raman Spectroscopy. 1990: Elsevier Science.
66. D. Jacquemin, E.A. Perpète, I. Ciofini and C. Adamo, Accurate Simulation of Optical Properties in Dyes. Accounts of Chemical Research, 2008. 42(2): p. 326-334.
67. P.S. Callahan, Tuning in to Nature: Solar Energy, Infrared Radiation, and the Insect Communication System. 1977: Routledge & K. Paul.
68. S. Berthier, Iridescences: The Physical Colors of Insects. 2007: Springer.
69. S. Kaurav, Engineering Chemistry with Laboratory Experiments. 2011: PHI Learning.
70. B.K. Sharma, Spectroscopy. 1981: Krishna Prakashan.
71. H. Cox and A.J. Stace, Recent advances in the visible and UV spectroscopy of metal dication complexes. International Reviews in Physical Chemistry, 2010. 29(4): p. 555-588.
72. A. Dreuw and M. Head-Gordon, Single-Reference ab Initio Methods for the Calculation of Excited States of Large Molecules. Chemical Reviews, 2005. 105(11): p. 4009-4037.
73. J. Li, J.-C. Chen, L.-C. Xu, K.-C. Zheng and L.-N. Ji, A DFT/TDDFT study on the structures, trend in DNA-binding and spectral properties of

Methods and theoretical details Chapter 2
67
molecular “light switch” complexes [Ru(phen)2(L)]2+(L = dppz, taptp, phehat). Journal of Organometallic Chemistry, 2007. 692(4): p. 831-838.
74. A. Tsolakidis and E. Kaxiras, A TDDFT Study of the Optical Response of DNA Bases, Base Pairs, and Their Tautomers in the Gas Phase. The Journal of Physical Chemistry A, 2005. 109(10): p. 2373-2380.
75. L. Serrano-Andrés and M. Merchán, Quantum chemistry of the excited state: 2005 overview. Journal of Molecular Structure: THEOCHEM, 2005. 729(1–2): p. 99-108.
76. M. Pastore, E. Mosconi, F. De Angelis and M. Gratzel, A Computational Investigation of Organic Dyes for Dye-Sensitized Solar Cells: Benchmark, Strategies, and Open Issues. Journal of Physical Chemistry C, 2010. 114(15): p. 7205-7212.
77. J. Fabian, TDDFT-calculations of Vis/NIR absorbing compounds. Dyes and Pigments, 2010. 84(1): p. 36-53.
78. M. Pastore, E. Mosconi, S. Fantacci and F. De Angelis, Computational Investigations on Organic Sensitizers for Dye-Sensitized Solar Cells. Current Organic Synthesis, 2012. 9(2): p. 215-232.
79. T. Yakhanthip, S. Jungsuttiwong, S. Namuangruk, N. Kungwan, V. Promarak, T. Sudyoadsuk and P. Kochpradist, Theoretical Investigation of Novel Carbazole-Fluorene based D-pi-A Conjugated Organic Dyes as Dye-Sensitizer in Dye-Sensitized Solar Cells (DSCs). Journal of Computational Chemistry, 2011. 32(8): p. 1568-1576.
80. P. Senthilkumar and P.M. Anbarasan, Molecular modeling of 4-methylphthalonitrile for dye sensitized solar cells using quantum chemical calculations. Journal of Molecular Modeling, 2011. 17(1): p. 49-58.
81. C.J. Yang, Y.J. Chang, M. Watanabe, Y.S. Hon and T.J. Chow, Phenothiazine derivatives as organic sensitizers for highly efficient dye-sensitized solar cells. Journal of Materials Chemistry, 2012. 22(9): p. 4040-4049.
82. A. Baheti, P. Singh, C.P. Lee, K.R.J. Thomas and K.C. Ho, 2,7-Diaminofluorene-Based Organic Dyes for Dye-Sensitized Solar Cells: Effect of Auxiliary Donor on Optical and Electrochemical Properties. Journal of Organic Chemistry, 2011. 76(12): p. 4910-4920.
83. H.W. Ham and Y.S. Kim, Theoretical study of indoline dyes for dye-sensitized solar cells. Thin Solid Films, 2010. 518(22): p. 6558-6563.
84. S. Meng and E. Kaxiras, Electron and Hole Dynamics in Dye-Sensitized Solar Cells: Influencing Factors and Systematic Trends. Nano Letters, 2010. 10(4): p. 1238-1247.

Methods and theoretical details Chapter 2
68
85. R. Ma, P. Guo, H. Cui, X. Zhang, M.K. Nazeeruddin and M. Grätzel, Substituent Effect on the Meso-Substituted Porphyrins: Theoretical Screening of Sensitizer Candidates for Dye-Sensitized Solar Cells. Journal of Physical Chemistry A, 2009. 113(37): p. 10119-10124.
86. M. Velusamy, Y.C. Hsu, J.T. Lin, C.W. Chang and C.P. Hsu, 1-Alkyl-1H-imidazole-Based Dipolar Organic Compounds for Dye-Sensitized Solar Cells. Chemistry-An Asian Journal, 2010. 5(1): p. 87-96.
87. D. Casanova, F.P. Rotzinger and M. Gratzel, Computational Study of Promising Organic Dyes for High-Performance Sensitized Solar Cells. Journal of Chemical Theory and Computation, 2010. 6(4): p. 1219-1227.
88. C.R. Zhang, Y.Z. Wu, Y.H. Chen and H.S. Chen, Geometries, Electronic Structures and Related Properties of Organic Dye Sensitizers JK16 and JK17. Acta Physico-Chimica Sinica, 2009. 25(1): p. 53-60.
89. M.S. Tsai, Y.C. Hsu, J.T. Lin, H.C. Chen and C.P. Hsu, Organic dyes containing 1H-phenanthro[9,10-d]imidazole conjugation for solar cells. Journal of Physical Chemistry C, 2007. 111(50): p. 18785-18793.
90. J. Preat, D. Jacquemin, C. Michaux and E.A. Perpete, Improvement of the efficiency of thiophene-bridged compounds for dye-sensitized solar cells. Chemical Physics, 2010. 376(1-3): p. 56-68.
91. K. Srinivas, C.R. Kumar, M.A. Reddy, K. Bhanuprakash, V.J. Rao and L. Giribabu, D-pi-A organic dyes with carbazole as donor for dye-sensitized solar cells. Synthetic Metals, 2011. 161(1-2): p. 96-105.
92. M. Pavone, P. Cimino, F. De Angelis and V. Barone, Interplay of Stereoelectronic and Enviromental Effects in Tuning the Structural and Magnetic Properties of a Prototypical Spin Probe: Further Insights from a First Principle Dynamical Approach. Journal of the American Chemical Society, 2006. 128(13): p. 4338-4347.
93. O. Crescenzi, M. Pavone, F. De Angelis and V. Barone, Solvent Effects on the UV (n → π*) and NMR (13C and 17O) Spectra of Acetone in Aqueous Solution. An Integrated Car−Parrinello and DFT/PCM Approach. The Journal of Physical Chemistry B, 2004. 109(1): p. 445-453.
94. M. Cossi and V. Barone, Analytical second derivatives of the free energy in solution by polarizable continuum models. Journal of Chemical Physics, 1998. 109(15): p. 6246-6254.
95. M. Cossi, N. Rega, G. Scalmani and V. Barone, Energies, structures, and electronic properties of molecules in solution with the C-PCM solvation model. Journal of Computational Chemistry, 2003. 24(6): p. 669-681.

Methods and theoretical details Chapter 2
69
96. V. Barone and M. Cossi, Quantum calculation of molecular energies and energy gradients in solution by a conductor solvent model. Journal of Physical Chemistry A, 1998. 102(11): p. 1995-2001.
97. A.V. Marenich, C.J. Cramer and D.G. Truhlar, Universal Solvation Model Based on Solute Electron Density and on a Continuum Model of the Solvent Defined by the Bulk Dielectric Constant and Atomic Surface Tensions. The Journal of Physical Chemistry B, 2009. 113(18): p. 6378-6396.
98. J. Tomasi, B. Mennucci and R. Cammi, Quantum mechanical continuum solvation models. Chemical Reviews, 2005. 105(8): p. 2999-3093.

70
Chapter 3
Rational design of new dyes based on TA-St-
CA sensitizer “If you wish to make an apple pie from scratch, you must first invent the
universe.” Carl Sagan
3.1. Introduction This chapter presents rational design of new dyes based on making modifications
to the linker of a reference D-π-A compound known as TA-St-CA dye [1]. The
molecular structure of this compound is given in Fig. 3.1. The donor, acceptor and
spacer moieties of the reference dye are also marked in the figure. As was pointed
out in Chapter 1, a variety of approaches can be adopted to red-shift the
absorption spectra of a particular D-π-A dye, such as making modifications into
the structure of the π-conjugated bridge [2], which is a very efficient strategy [3].
As a result, we concentrate on this approach, i.e. structural modifications of the
linker of the reference dye, to design new dyes in the present chapter.
The reference TA-St-CA dye [1] (Fig. 3.1) belongs to a class of organic
sensitizers known as “TPA-based” dyes. TPA-based dyes are among the most
successful classes of organic dyes. They are based on triphenylamine (TPA)

Rational design of new dyes based on TA-St-CA sensitizer Chapter 3
71
donating group (D) and its derivatives. The exceptional electron-donation nature
of the TPA group, its chemical stability and structural ability to suppress the dye
aggregation has made it an attractive electron-donating candidate for the design of
organic dyes in DSCSs [4-16]. Perhaps the significance and popularity of the TPA
donating group is best realized by a literature search under the keywords
“triphenylamine AND dye”. It brings more than 4000 results in the Scopus
database (as in August 2013). TA-St-CA is a very successful sensitizer based on
TPA which is designed and synthesized by Hwang et al. [1]. DSSC based on this
dye has shown the overall solar-to-energy conversion efficiency of 9.1% [1],
which is very high for a cell with organic dye sensitizer. As a result, this push–
pull dye is selected as the backbone reference structure for the π-bridge
modifications to produce new dyes in the present chapter.
The new dyes [17] in this chapter are rationally designed based on a theory known
as Dewar’s rules. In 1952, Dewar published a series of six famous papers on the
“molecular orbital theory of organic chemistry” in journal of the American
Fig. 3.1: Molecular structure of the reference TA-St-CA dye.
Rational design of new dyes based on TA-St-CA sensitizer Chapter 3
72
chemical society, in which he developed a qualitative/semi-quantitative treatment
of organic chemistry by employing perturbation molecular orbital theory (PMO)
[18-23].
According to Dewar’s rules, the π-conjugated spacer in a D-π-A molecule (dye)
exhibits alternative electronegativity along the charge transfer direction.
Furthermore, based on Dewar’s rules the relationships between substituent groups
(and their positions) on the π-spacer and the molecular energy levels is
predictable. Although more accurate quantitative calculations are possible today,
Dewar’s rules can still serve as a prediction tool to rationally design organic dyes
with desired molecular energy levels. For these reasons, Dewar’s guidelines have
been applied for the engineering of molecular structures of several stable and
efficient nonlinear optical chromophores with enhanced hyperpolarizability [24,
25]. To the best of our knowledge, Dewar’s rules have not been employed in the
rational design of new organic dyes for the application in solar cells. In this
chapter, we apply Dewar’s rules to rationally design new dye sensitizers, based on
the modifications of the linker of the existing and well-performing TA-St-CA dye
[1].
In this chapter, a number of electron-donating (ED) and electron-withdrawing
(EW) units will be considered. The new dyes are obtained by substituting the ED
and EW units onto the π-conjugated oligo-phenylenevinylene bridge of the
reference TA-St-CA dye, based on Dewar’s rules [17]. The molecular structures,
frontier molecular energy levels and the electron absorption spectra of the new
dyes are calculated using density functional theory (DFT) and time-dependant
density functional theory (TD-DFT).
Rational design of new dyes based on TA-St-CA sensitizer Chapter 3
73
3.2. Dewar’s rules and design of new dyes
Fig. 3.2 shows a general graphical scheme of Dewar’s rules employed in this
chapter. According to Dewar’s rules, atoms on the π-conjugated bridge of a
chromophore with D–π–A structure can alternately be indexed as “starred” and
“unstarred”. According to perturbational molecular orbital theory, substituting
electron donating groups on the starred positions results in an increase in the
energy of highest occupied molecular orbital (HOMO). Substituting an EW group
on unstarred positions in the bridge is expected to decrease the energy of the
lowest unoccupied molecular orbital (LUMO). Both of these substitutions reduces
the ∆E between HOMO and LUMO and cause a bathochromic shift [25] .
To improve the original TA-St-CA dye, it is required to red-shift (bathochromic
shift) the absorption spectrum and to reduce the HOMO-LUMO energy gap (∆E)
of the new dyes. Based on Dewar’s rules (i.e., PMO theory) illustrated in Fig. 3.2,
to move up the energy of the HOMO, an electron-donating group (ED) needs to
substitute on the starred positions of the π-conjugated bridge to form a new dye.
Alternatively, to move down the energy of the LUMO, an electron-withdrawing
group (EW) needs to substitute on the unstarred positions of the π-conjugated
bridge to form a new dye. Therefore, the new dyes can rationally be designed by
replacing an ED group on the starred positions or an EW group on one of the
unstarred positions of the π-conjugated bridge of the original dye.
Following Dewar’s rules as a guideline, the present study designed new dye
structures by the substitutions of a couple of electron-donating groups such as
−NH2 and −N(CH3)2 and an electron-withdrawing (−CN) group at various
possible positions along the π–conjugated bridge of the original TA-St-CA dye
(Fig. 3.2). Note that no substitution is possible on position 3 and 6* as the C(3) and
C(6*) carbon atoms are saturated. Table 3.1 lists the reference TA-St-CA dye,
which is labelled as starred and unstarred alternately on its linker, as well as all
rationally designed new dyes.
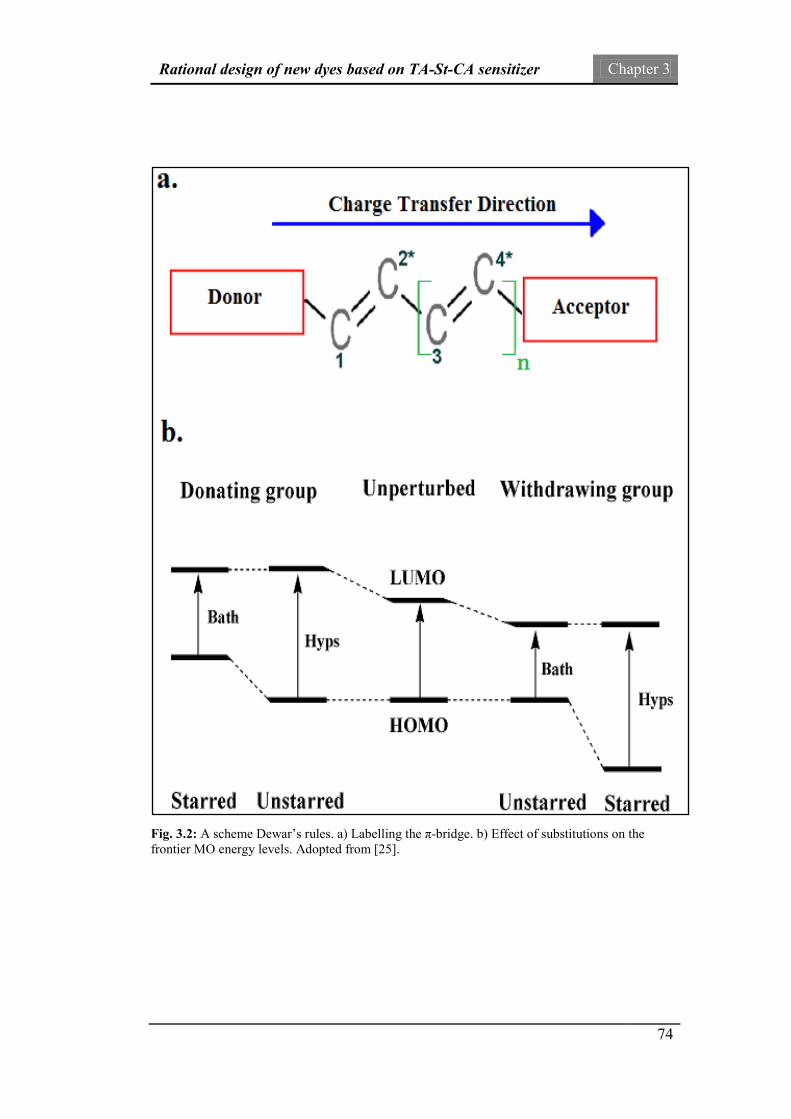
Rational design of new dyes based on TA-St-CA sensitizer Chapter 3
74
Fig. 3.2: A scheme Dewar’s rules. a) Labelling the π-bridge. b) Effect of substitutions on the frontier MO energy levels. Adopted from [25].
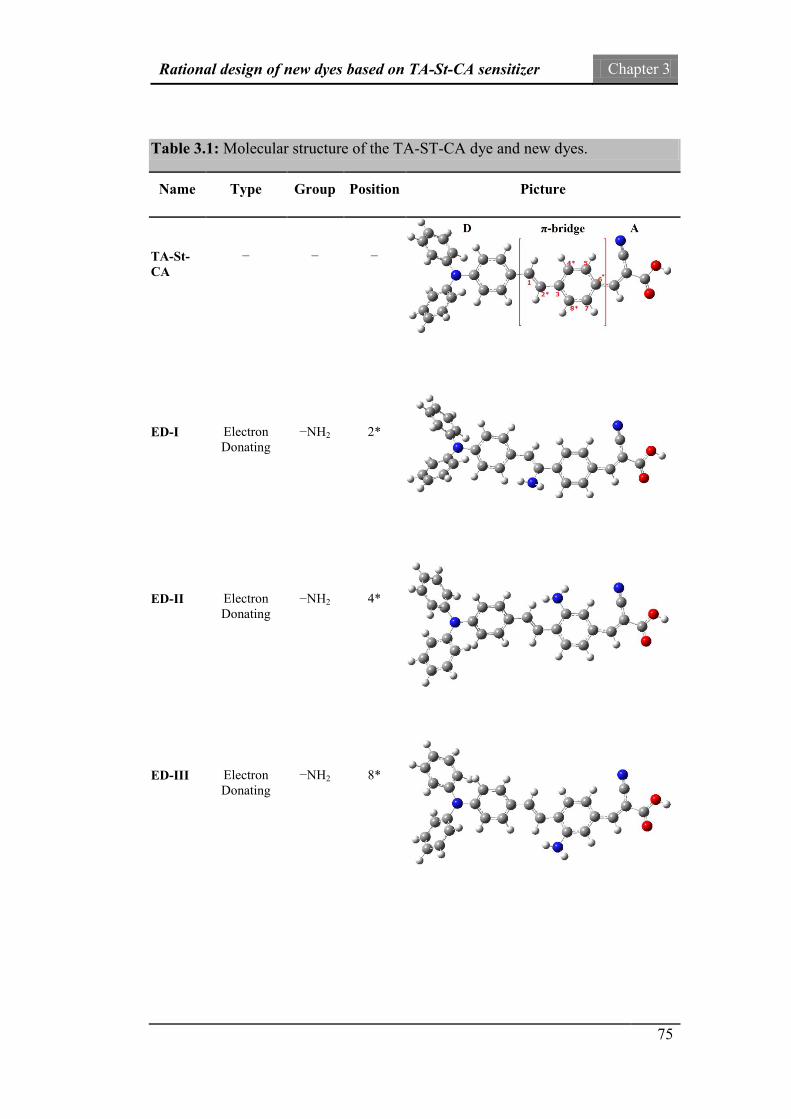
Rational design of new dyes based on TA-St-CA sensitizer Chapter 3
75
Table 3.1: Molecular structure of the TA-ST-CA dye and new dyes.
Name Type Group Position Picture
TA-St-CA
−
−
−
ED-I
Electron Donating
−NH2
2*
ED-II
Electron Donating
−NH2
4*
ED-III
Electron Donating
−NH2
8*

Rational design of new dyes based on TA-St-CA sensitizer Chapter 3
76
Name Type Group Position Picture
ED-IV
Electron Donating
−N(CH3)2
2*
ED-V
Electron Donating
−N(CH3)2
4*
ED-VI
Electron Donating
−N(CH3)2
8*
EW-I
Electron Withdrawing
−CN
1
EW-II
Electron Withdrawing
−CN
5
EW-III
Electron Withdrawing
−CN
7
Rational design of new dyes based on TA-St-CA sensitizer Chapter 3
77
3.3. Computational details
All quantum mechanical calculations are performed using density functional
theory (DFT) based PBE0 hybrid density functionals [26] and polarized split-
valence triple-zeta 6-311G(d) basis set, without any constraints. The DFT based
PBE0 functional (a hybrid of PBE with 25% HF exchange term contribution) is
found to be a reliable functional to estimate the excitation energies of dye
molecules [27, 28]. As a result, it has been widely employed to study the colours
of most industrial organic dyes. In an assessment on a set of more than 100
organic dyes, the PBE0 functional outperformed all other functionals in the study
for reproducing the experimental UV-Vis π→ π* absorption wavelengths [29]. As
a result, the present study employs this functional to study the dye molecules. All
calculations are based on Gaussian 09 computational chemistry package [30].
The optimized geometry of the TA-St-CA dye is obtained using the PBE0/6-
311G(d) model. To verify that the optimized structure is a true minimum,
frequency calculations are performed on the optimized geometry and no
imaginary frequencies are found for the optimized structure. Single point
calculations on the optimized structures in vacuum using the same computational
model are employed to construct the molecular energy levels and isodensity plots.
The experimental UV–Vis spectrum of the reference TA-St-CA dye was
measured in ethanol solution [1]. In order to make comparisions, the present
study has been performed in vaccum and in ethanol solution using the
conductor-like polarizable continuum model (CPCM) [31, 32]. The UV-Vis
spectra of the dyes are calculated using singlet-singlet transitions up to the 30th
lowest spin-allowed excited state of each dye. These lowest-energy electronic
transitions are then transformed into simulated UV-Vis spectra by GaussView 5
visualization software [33], using Gaussian functions with half-widths of 2500
cm–1.

Rational design of new dyes based on TA-St-CA sensitizer Chapter 3
78
3.4. Molecular properties
Fig. 3.3 gives the optimized structure of the reference TA-St-CA dye. It is
composed of three moieties, an electron rich “triphenylamine” group (TPA) acting
as electron donor (D-section), an “oligo-phenylenevinylene” group (π-conjugated
bridge, or linker) and a “cyanoacrylic acid” group which works as electron
acceptor/anchoring moiety (A-section). Between the D-section and the A-section,
there is a π-conjugated bridge (π-bridge section) which connects the electron
donor and acceptor moieties to conduct the excited electrons of the dye sensitizer.
Fig. 3.3: The structure of reference dye TA-St-CA (red: oxygen; blue: nitrogen; grey: carbon). Atoms on conjugated bridge (indicated by brackets) are marked alternatively by asterisks. Note that structure is saturated by hydrogen atoms which are not displayed on the structure [17].

Rational design of new dyes based on TA-St-CA sensitizer Chapter 3
79
As seen in Fig. 3.3, the A-section contains a carboxyl group as an anchoring unit
to attach the dye onto TiO2 semiconductor. The optimized structure of the TA-St-
CA dye in the ground electronic state indicates that the π-conjugated oligo-
phenylenevinylene bridge is almost planar, which is nearly coplanar with the
cyanoacrylic acid group. Such a coplanar structure leads to the conjugation
effects. Chemically modifying the conjugation bridge of the TA-St-CA dye
produces a number of new dyes (structures ED-I to EW-III in Table 3.1) which
slightly deviate from the planarity.
The four benzene rings in the molecular structure of the TA-St-CA dye are
labelled as R1-R4 as seen in Fig. 3.3. Perimeters [34] of the terminal benzene rings
R3 and R4 are slightly longer than the benzene rings inside the molecule, i.e., R1
and R2. For example, R3 and R4 are given by 8.38 and 8.37 Å, respectively,
whereas both R1 and R2 are the same at 8.35 Å, which is the same as an isolated
benzene ring [34]. Other geometrical parameters of the studied dyes vary,
depending on the chemical structure of the molecule. Table 3.2 summarizes
related properties such as geometric, dipole moments, and size of the dyes.
The length of the π -bridge, Lπ, are also listed in Table 3.2. Here, we define the
length of the π -bridge, Lπ, as the direct distance between C(18) and C(23) as
indicated in Fig. 3.3 [17]. For the TA-St-CA dye, Lπ is calculated as 5.23 Å. In the
table, the new dyes produced by the substitutions of the EW group (i.e. −CN) on
1, 5, and 7 positions of the π-conjugated bridge (i.e. dyes “EW-I” to “EW-III” in
last three columns of Table 3.2) exhibit equal or larger Lπ with respect to the
reference dye. For example, Lπ is calculated as 5.33 Å and 5.24 Å for EW-I and
EW-II, respectively. The influence of the electron donating substitutions (EDS) is
not as systematic as the new dyes produced by the EWS. Instead, the ED dyes
have either shorter or longer Lπ with respect to the TA-St-CA dye. However, it is
noted that the new dyes ED-I and ED-IV possess the shortest π-conjugated bridge
lengths of 5.13 and 5.10 Å, respectively, in this table.

Rational design of new dyes based on TA-St-CA sensitizer Chapter 3
80
The molecular size, i.e., electronic spatial extent <R2> (in a.u.), is calculated as
34612.20 a.u for the parent TA-St-CA dye. All new dyes except for ED-I have
larger molecular sizes with respect to the parent dye. The molecular size of ED-I
is calculated as 34474.2 a.u. The dipole moments (μ) of the dyes exhibit a similar
trend to the π-conjugated bridge length (Lπ) in general. That is, the substitutions of
the EW group polarize the molecules and therefore produce a larger than the
reference (6.58 Debye) dipole moment. For example, the new dyes “EW-I”, “EW-
II” and “EW-III” result in a noticeable increase in dipole moment of 8.38, 8.41
and 8.81 Debye, respectively. However, in general, EDS reduce the dipole
moment from the reference dye. For example the new dyes ED-I and ED-IV
possess smaller dipole moments of 4.63 and 4.64 Debye, respectively.

Rational design of new dyes based on TA-St-CA sensitizer Chapter 3
81
Table 3.2: Molecular properties of the new dyes and the reference TA-ST-CA dye*[17].
TA-St-CA
ED-I ED-II ED-III ED-IV ED-V ED-VI EW-I EW-II EW-III
Lπ (a) (Å) 5.23 5.13 5.19 5.26 5.10 5.20 5.27 5.33 5.24 5.23
8-7-14 (°) 120.40 119.99 120.47 120.35 120.07 120.56 120.41 120.61 120.62 120.43
6-7-14 (°) 120.32 120.07 120.29 120.47 120.12 120.27 120.46 120.47 120.52 120.67
18-19-20 (°) 126.53 120.55 128.23 125.31 118.74 128.70 125.76 131.85 126.29 126.19
23-24-25 (°) 132.20 132.11 132.21 132.18 132.16 132.12 132.17 132.07 128.72 131.39
15-16-17-18 (°) -179.67 -179.25 -178.95 -179.03 -176.46 -179.14 -179.10 -178.40 -178.89 179.97
18-19-20-21 (°) -178.70 -146.00 153.77 151.42 -37.68 161.72 157.58 172.85 173.69 -177.33
18-19-20-32 (°) 1.34 34.99 -27.08 -30.47 141.57 -14.86 -26.33 -7.73 -7.67 2.70
22-23-24-25 (°) -179.73 -179.11 177.78 -179.95 -179.91 -177.73 -179.09 179.46 -136.43 -179.76
<R2> ( a.u) 34612.20 34474.2 35088.40 35182.90 35646.00 36605.00 36285.80 35192.60 36808.20 36088.30
μ (Debye) 6.58 4.63 5.82 6.82 4.64 5.68 6.55 8.38 8.41 8.81
*The PBE0/6-311G(d) model.
(a) The length of the π-bridge, Lπ =direct distance between C(18) and C(23) [17].

Rational design of new dyes based on TA-St-CA sensitizer Chapter 3
82
3.5. Frontier molecular orbital analysis
Frontier molecular orbitals (MOs) are sensitive to the changes in the π-spacer of
the dye. The effect of modified π-spacer on the energy levels of the frontier
molecular orbitals (e.g. HOMO and LUMO) of new dyes provides feedback to the
design of the new dyes. As stated in Chapter 1, an important goal of our rational
design is to reduce the HOMO-LUMO energy gap of the new dyes with respect to
the reference dye. The energy level diagrams of the dyes are illustrated in Fig. 3.4.
The orbital energies of the HOMO and the LUMO of the parent TA-St-CA dye in
vacuum are calculated at -5.51 and -2.69 eV, respectively, and the corresponding
energy gap between its HOMO and LUMO is given by 2.82 eV.
As seen in Fig 3.4 the HOMO and LUMO energy levels of the new dyes generally
follow the Dewar’s prediction (refer to Fig. 3.2 (b) for Dewar’s rule). For
example, new dyes “ED-I” to “ED-VI”, generated by the ED substitutions, exhibit
elevated HOMO energies, with respect to the reference dye. A closer look reveals
that the new dyes produced by the ED substitutions on the position “2*” lead to a
noticeable decrease of the HOMO-LUMO gaps. For example, the energy gap for
ED-I (obtained by substitution of –NH2 on 2*) is calculated as 2.60 eV, which is
0.22 eV less than that of the reference dye. Similarly, ED-IV (produced by
substitution of –N(CH3)2 on 2*) gives an energy gap of 2.61 eV, which is 0.21 eV
less than that of the parent dye. As seen in Fig 3.4, both dyes “ED-I” and “ED-IV”
reduce the HOMO-LUMO gap by lifting up the HOMO energies without
apparently lifting up the LUMO energies. As for the ED substitution on position
“4*” (i.e. ED-II and ED-V), the resultant gap is increased with respect to the
reference dye. Such increase is attributed to an apparent increase of their LUMO
energies. As a result, these two positions are not appropriate for the design of new
dyes. New dyes “ED-III” and “ED-VI” are designed by ED substitutions on
position 8* of the reference dye. Both dyes exhibit slightly smaller HOMO-
LUMO gap compared to that of the reference dye.

Rational design of new dyes based on TA-St-CA sensitizer Chapter 3
83
Fig. 3.4: The calculated frontier MO energy levels using PBE0/6-31G* in vacuum [17].
Unoccupied M
Os
Occupied M
Os

Rational design of new dyes based on TA-St-CA sensitizer Chapter 3
84
On the contrary to the ED dyes, the EW dyes exhibit lowered LUMO energy
levels, in agreement with the Dewar’s rules. As can be predicted by the Dewar’s
rules [25, 35, 36], the EW substitutions results in a decrease of the HOMO-
LUMO gap with larger energy drops of the LUMOs than the energy drops in the
HOMOs. As seen in Fig 3.4, all three EW dyes follow this pattern. For example,
in comparison with the reference dye, the HOMO and the LUMO energies of EW-
I are lowered by 0.20 eV and 0.39 eV, respectively. This has resulted in a gap of
2.63 eV for EW-II dye, which is about 0.20 eV less than that of the reference dye.
Fig. 3.4 also provides information about the suitability of the new dyes for the
application in DSSC. As mentioned earlier in Chapter 1, alignment of the LUMO
energy level above the conduction band edge of semiconductor (e.g. TiO2) and the
HOMO energy level below the redox potential of redox couple (e.g.
iodide/triodide) should be considered, when deciding about the suitability of the
newly designed dyes. That is, the HOMO-LUMO gap of a new dye should be
outside of the green parallel dash lines in Fig. 3.4. As seen in this figure, the
LUMO energies of all dyes are well located above the conduction band of the
TiO2 semiconductor, therefore enough energy potential is provided for electron
injection. It is also observed that the HOMO energies of all dyes are located
below the energy level of iodide/triodide for efficient regeneration of the oxidized
dye. As a result, all new dyes meet this criterion. The calculated frontier MO
energy levels in ethanol solution also show the same trend and results. Please refer
to Appendix A-I for the MO energy levels in solution.
To further explore the different behaviours of the ED and EW impact on the
reference (TA-St-CA) dye, Fig. 3.5 provides the charge density information of the
HOMOs and the LUMOs of the reference (TA-St-CA) dye, a new dye produced
by an ED modifications (new dye “ED-I”) and an EW modifications (new dye
“EW-I”). As seen in Fig. 3.5, the HOMO of TA-St-CA is a π orbital, which is
dominated by p electrons from the backbone atoms. It populates over the entire
triphenylamine donor group including R2, R3 and R4 (refer to D-section of the D–
π–A dye in Fig. 3.3). It partially populates the oligo-phenylenevinylene π-
Rational design of new dyes based on TA-St-CA sensitizer Chapter 3
85
conjugated bridge and the R1 ring, as shown in the green box in this figure. The
HOMO is located far away from the A-section and therefore TiO2 surface.
Significant contribution of the triphenylamine donor group into the HOMO
minimizes the probability of charge recombination between the injected electrons
and the resulting oxidized dye [37]. Charge recombination is a determinant factor
of the efficiency of DSSC. Therefore, the present distribution of the HOMO of
TA-St-CA, which minimizes this factor, is desirable.
The LUMO of the reference dye is a singlet π* orbital which largely populates the
cyanoacrylic acid acceptor group (the A-section of the D–π–A dye). The LUMO
also spreads into the π-spacer and into the triphenylamine donor group of R2 ring
in the D-section. As a result, the HOMO to LUMO transition ensures an intra-
molecular charge transfer from the donor end to the acceptor end of the dye,
through the conjugated spacer. The LUMO of a dye is the final state in the charge
transition from HOMO to LUMO. Significant contribution of cyanoacrylic acid
group (A-section) to the LUMO ensures a strong electronic coupling between the
dye's lowest excited state and conduction band of the semiconductor (TiO2). It
facilitates an efficient electron injection as the dye sensitizer is anchored into TiO2
through the A-section.
It is important that the new dyes follow the same pattern of HOMO and LUMO
charge density distribution of the parent TA-St-CA dye. In other words, the
charge distribution of the HOMO should mainly populate the donor (D) end,
whereas the LUMO should be distributed largely on the acceptor (A) end of the
new dyes. This requirement is met for the new dyes, such as ED-I and EW-I.
Please refer to Appendix A-II for the information of all other dyes, which show
the same trend of charge density distribution. Fig. 3.5 further shows that the
modifications made in new dyes changes the charge distribution over the π-spacer,
rather than the donor and acceptor ends. That is, the HOMO and LUMO of the
new dyes “ED-I” and “EW-I” are very similar to those of the reference TA-St-CA
dye in the D and A ends (i.e. outside the green box in the figure).

Rational design of new dyes based on TA-St-CA sensitizer Chapter 3
86
3.6. UV-Vis absorption spectra
Electronic absorption spectroscopy (also known as UV-Vis spectroscopy) is
the most appropriate technique to indicate the presence of chromophores in a
molecule. Chromophores are π-electrons or lone pair electrons in a molecule,
which are likely to absorb light in the UV-Vis region (200 to 800 nm). As a
result, conjugated π-electrons in a molecule becomes the major structural
feature identified by this UV-Vis spectroscopic technique. Time-dependent
density functional theory (TD-DFT) is employed to simulate electronic
absorption spectra with PBE0 hybrid functionals in this chapter.
Fig. 3.5: Comparison of the charge density of HOMOs (left) and LUMOs (right) of the new dye, ED-I and EW-I with respect to those of the reference TA-St-CA dye [17].

Rational design of new dyes based on TA-St-CA sensitizer Chapter 3
87
Fig. 3.6 compares the simulated UV-Vis spectra of the reference TA-St-CA
dye in ethanol solution and in gas-phase with available experiment (in ethanol
solution) [1]. It is seen that the calculated spectra agree reasonably well with the
experiment which is only measured in the region of λ< 450 nm, i.e., the first
absorption spectral peak region. The simulated UV-Vis spectrum of the
reference TA-St-CA dye in ethanol solution closely reproduce the majour
spectral peak at λI= 374.52 nm with respect to the experiment at λI= 386 nm
(I). In the spectral region of λ> 450 nm, the present simulation in ethanol
produces a major peak at λII=545.03 nm in the green region (II), which is in
agreement with an early computational study [38]. In addition, it is observed
that the ethanol solvent causes the simulated spectral peaks of the reference dye to
red-shift from their positions in vacuum. The good agreement with experiment
and literature indicates that the present computational model employed is a
good model.
Fig. 3.6: The simulated UV–Vis absorption spectra of TA-St-CA dye in gas-phase and ethanol solution, compared with the experimental spectra in ethanol solution [17].

Rational design of new dyes based on TA-St-CA sensitizer Chapter 3
88
Fig. 3.7 compares the simulated spectra of the new dyes obtained from electron
donating substitutions (EDS) with the reference dye in ethanol solution. The
absorption spectra of the new dyes which are designed from –NH2 (EDS) group
are plotted in Fig. 3.7(a), and those of the –N(CH3) substitution are illustrated in
Fig. 3.7(b). As seen in this figure, modifications of the reference dye results in
shifts of the spectral peaks, either bathochromic shift (i.e. to the longer
wavelength) or hypsochromic shift (i.e. to the shorter wavelength) from positions
of the reference dye.
Chemical modifications by EDS with respect to the reference dye lead to
bathochromic shift of peak II, but hypsochromic shift of peak I (λI) in the new
dyes “ED-I” to “ED-VI”. For example, the –NH2 (EDS) group on the position
“2*”of the reference dye (i.e. “ED-I”) results in a bathochromic shift of ~44
nm on peak II, whereas a ~31 nm hypsochromic shift on peak I of the TA-St-CA
spectrum (in ethanol solution).
Although the position of the peak I is blue-shifted in new EDS dyes, the intensity
of this peak is increased in all new dyes, with respect to the reference TA-St-CA
dye. On the other hand, the position of peak II is red-shifted in almost all new
dyes but either with the same or less intensity, compared to the reference dye. For
example, peak II of ED-I and ED-IV are both red-shifted and less intense in
comparison to that of TA-St-CA. On the other hand, the intensity of this peak in
all other dyes in Fig. 3.7 is comparable to the parent TA-St-CA dye.

Rational design of new dyes based on TA-St-CA sensitizer Chapter 3
89
a.
b.
Fig. 3.7: The simulated UV–Vis absorption spectra of TA-ST-CA dye and its substituted new dyes in ethanol solution using the (CPCM) TD-DFT calculations [17]. (a) New dyes generated from the substitutions of –NH2, and (b) from –N(CH3)2 ED groups.
I II
I II

Rational design of new dyes based on TA-St-CA sensitizer Chapter 3
90
Fig. 3.8 compares the new dyes obtained from electron withdrawing substitutions
with the original dye. As seen in Fig. 3.8, the EW substituations result in
bathochromic shift in both peak I and II in new dyes “EW-I” to “EW-III” with
enhanced intensity of the peak.
Table 3.3 collects the calculated spectral properties, such as maximum absorption
wavelengths (λ), oscillator strengths (f), and dominant transitions responsible for
the two most intense peaks (λI , λII) of the dyes in this chapter (in ethanol
solution).
Fig. 3.8: The simulated UV–Vis absorption spectra of TA-ST-CA dye and its substituted new dyes in ethanol solution using the (CPCM) TD-DFT calculations [17]. New dyes are generated from the substitutions of the electron withdrawing group (–CN).
I II

Rational design of new dyes based on TA-St-CA sensitizer Chapter 3
91
Table 3.3: Calculated(a) excited energy (in nm), transition configuration, and oscillator strengths (f) for the two most intense peaks of TA-ST-CA dye and the new dyes in ethanol solution. λI (ca. 360 nm) λII (ca. 500 nm)
Structure λ (nm) f Transitions λ (nm) f Transitions
TA-St-CA 374.53 0.77 H-1→LUMO (91%) HOMO→L+1 (7%)
545.03 1.22 HOMO→LUMO (99%)
ED-I 343.43 0.78 HOMO→L+1 (90%) H-4→LUMO (4%) H-2→LUMO (2%)
588.97 0.59 HOMO→LUMO (99%)
ED-II 355.83 0.85 HOMO→L+1 (63%) H-2→LUMO (32%)
545.36 1.04 HOMO→LUMO (98%)
ED-III 358.32 0.75 H-2→LUMO (73%) HOMO→L+1 (18%)
550.33 1.10 HOMO→LUMO (98%)
ED-IV 353.92 1.19 HOMO→L+1 (73%) H-2→LUMO (24%)
608.45 0.50 HOMO→LUMO (97%)
ED-V 362.31 0.85 H-2→LUMO (76%) HOMO→L+1 (17%) H-1→LUMO (5%)
551.43 1.05 HOMO→LUMO (97%)
ED-VI 368.57 0.69 H-2→LUMO (81%) HOMO→L+1 (9%) H-1→LUMO (8%)
559.82 1.15 HOMO→LUMO (97%)
EW-I 380.14 0.89 H-1→LUMO (83%) HOMO→L+1 (15%)
586.65 0.87 HOMO→LUMO (99%)
EW-II 393.67 0.68 H-1→LUMO (93%) HOMO→L+2 (4%)
605.92 1.09 HOMO→LUMO (99%)
EW-III 381.80 0.70 HOMO→L+1 (83%) H-1→LUMO (13%)
560.58 0.92 HOMO→LUMO (99%)
(a) Calculated using TD-DFT based PBE0/6-311G(d) model in ethanol solution (CPCM).
Rational design of new dyes based on TA-St-CA sensitizer Chapter 3
92
It is found from the simulated spectra of the reference TA-St-Ca dye in ethanol
solution that the most intensive absorption band observed at λII=545.03 nm
(f=1.22) corresponds to a transition (excitation) from the HOMO to the LUMO
of the reference dye, as seen in Table 3.3. Since the HOMO-LUMO gap
requires the least energy to excite an electron from an occupied orbital onto a
virtual (unuccupied) orbital, there is no doubt that the HOMO-LUMO
transition is almost always the favourite transition in energy. The second
strongest absorption band near λI=374 nm (f=0.77) is a combination of two major
transitions. One is dominated by the transition from HOMO-1 to LUMO (~91%)
and the other is a minor transition from HOMO to LUMO+1 (~7%). The HOMO-
1→LUMO and/or HOMO→LUMO+1 transition are usually the second
energetically favourite transitions.
The red/blue shifts of the main peaks in new dyes can be rationalised by looking
at the underlying electronic transition orbitals listed in Table 3.3. As explained
earlier, peak II is mainly (i.e. 99%) a HOMO→LUMO transition which are
brought closer to each other in new dye “ED-I”; therefore, this peak is red-
shifted in ED-I compared to TA-St-CA dye. On the other hand, an excitation
transition from HOMO-1→LUMO (∆E=3.76 eV) is mainly (i.e. 91%)
responsible for peak I in TA-St-CA structure, while a HOMO→LUMO+1
(∆E=4.29 eV) exciation contributes 90% to this peak in ED-I. It is seen that
the first peak (I) in ED-I needs more energy compared to that of TA-St-CA dye
because of its bigger energy gap. Therefore, this peak shifted to longer
wavelenghths. Similar justification and reasoning hold for all other
substitutions.
It should also be noted that for a more precise study of the absorption spectra, the
influence of the dye adsorption onto TiO2 nanocrystals should also be taken into
account. A number of TD-DFT calculations on the dyes adsorbed onto TiO2 have
been reported [39-44]. Although such calculations are beyond the scope of the
current thesis, it is important to have a glimpse of the effect of adsorption on the
electronic structure and absorption spectra of dye-TiO2 system. In addition to

Rational design of new dyes based on TA-St-CA sensitizer Chapter 3
93
altering the conduction band of the semiconductor [45], adsorption of dye
sensitizer onto TiO2 will change the electronic properties and absorption spectra
of dye sensitizer. For example, it can change the stabilization of the LUMO of the
dye sensitizer, leading to a red-shift of the absorption spectra of adsorbed dye
compared to isolated dye.
Sánchez-de-Armas et al. studied the optical properties of five coumarin-based
dyes and observed a widening of the first band and small bathochromic shift in the
absorption spectra of adsorbed coumarin dyes compared to free dye molecules
[46]. Another study by Wen et al. shows that morphology and size of TiO2
nanocrystals can influence the UV-Vis spectra of N17 sensitizer [47]. Another
example is the absorption spectra of free and bounded (onto TiO2) catechol and
aliazarin molecules. Although these two molecules have similar binding patterns,
upon binding onto TiO2 an entirely new band is observed in the absorption spectra
along with exactly the same bands of the free catechol spectra, whereas no new
band appears and only red-shifting is observed for alizarin bound onto TiO2
semiconductor [48]. Although adsorption can change the electronic absorption
spectra, the above examples show that such influences are usually positive. That
is, the absorption spectra of the dyes attached onto the surface of semiconductor
are usually enhanced, compared to those of the free molecules. In this study we
only compared the absorption spectra of free dye molecules (which is in the scope
of the current thesis).
Table 3.4 summarises the effects of chemical substitutions on a number of
important properties of organic dyes, such as the energies of the HOMOs (εHOMO),
the LUMOs (εLUMO), the HOMO-LUMO energy gap (∆ε), shift of the spectral
peaks (∆λI and ∆λII ) as well as changes in their spectral widths (∆γ). From Table
3.4, it can be seen that the new dye “ED-I” almost meets all the requirements of
the preferred properties of an improved dye, except for the slight decrease in the
wavelength of its first absorption peak. The EW substituted dyes, “EW-I” to
“EW-III”, enable the bathochromic shift of both absorption peaks, for functionally
enhanced dyes.

Rational design of new dyes based on TA-St-CA sensitizer Chapter 3
94
Table 3.4: Comparison of the substitution effects on the energies of the HOMOs (εHOMO), the LUMOs (εLUMO), the HOMO-LUMO energy gap (∆ε), shift of the spectral peaks (∆λI and ∆λII) and spectral widths (∆γI and ∆γII) in ethanol solution* [17].
Dyes ∆ε (a) εHOMO(b) εLUMO(c) ∆(∆ε)(d) ∆λI (360 nm)(e) ∆λII (500 nm)(e) ∆γI (360 nm)(f) ∆γII (500 nm)(f)
TA-St-CA 2.82 NA(g) NA(g) NA(g) NA(g) NA(g) NA(g) NA(g)
ED-I 2.60 + + – – + + –
ED-II 2.87 + + + – NC(h) – +
ED-III 2.81 + + – – + – +
ED-IV 2.61 + + – – + + –
ED-V 2.83 + + – – + – +
ED-VI 2.76 + + – – + NC(i) NC(i)
EW-I 2.63 – – – + + + –
EW-II 2.59 – – – + + + –
ED-III 2.79 – – – + + + –
(a) HOMO-LUMO gap (eV). (b) Indicates whether HOMO level is shifted up (+) or down (–) compared to TA-St-CA base structure. (c) Indicates whether LUMO level is shifted up (+) or down (–) compared to TA-St-CA base structure. (d) Indicates whether HOMO-LUMO gap is decreased (–) or increased (+) compared to TA-St-CA base structure. (e) Indicates a bathochromic shift (+) or hypsochromic shift (–) of this peak compared to TA-St-CA base structure. (f) Indicates an increase of peak width (+) or a decrease of peak width (–) of this peak compared to TA-St-CA base structure. (g) NA=Not applicable. (h) NC= Not changed.
Rational design of new dyes based on TA-St-CA sensitizer Chapter 3
95
3.7. Summary and conclusions
The present chapter aimed to enhance appropriate properties, such as HOMO-
LUMO gap and red-shift the spectral absorption through rational chemical
modifications. Chemical modifications were made on the π-spacer of a well-
performing organic dye sensitizer (the TA-St-CA dye) for the development of
new and more efficient organic dyes. Perturbational molecular orbital theory (e.g.
Dewar’s rule) has been found to serve as a good indicator for determination of the
appropriate substitution positions on the π-conjugated bridge of the reference dye,
and for selection of electron donating/withdrawing building blocks for new dyes.
It is found that the electron donating groups (ED substitutions) on position 2* of
the reference dye, which is close to the donor section of the reference structure,
exhibit advantages over the electron withdrawing group (EW substitutes) to
reduce the HOMO-LUMO energy gap, as well as to redistribute the electron
density of the frontier orbitals (i.e., HOMO and LUMO) of the new dyes. The
impact on the optical spectra of new dyes are, however, less significant and
warrants further studies in this direction.
To the best of my knowledge, this study demonstrated for the first time that
Dewar’s rule can be employed to rationally design new dye sensitizers for the
application in DSSC. The present study might have an important practical
application. It provides a systematic way (based on Dewar’s rules) to modify an
existing well performing dye. A systematic method of modifying dye structure
provides the possibility to design a software program to automatically design new
dye sensitizers. Therefore, it is recommended that further effort be undertaken to
design and code such software program.
Rational design of new dyes based on TA-St-CA sensitizer Chapter 3
96
References
1. S. Hwang, J.H. Lee, C. Park, H. Lee, C. Kim, C. Park, M.-H. Lee, W. Lee, J. Park, K. Kim, N.-G. Park and C. Kim, A highly efficient organic sensitizer for dye-sensitized solar cells. Chemical Communications, 2007(46): p. 4887-4889.
2. A.T. Peters and H.S. Freeman, Modern Colorants: Synthesis and Structures. 1995: Blackie Academic & Professional.
3. J. Zhang, H.-B. Li, S.-L. Sun, Y. Geng, Y. Wu and Z.-M. Su, Density functional theory characterization and design of high-performance diarylamine-fluorene dyes with different [small pi] spacers for dye-sensitized solar cells. Journal of Materials Chemistry, 2012. 22(2): p. 568-576.
4. M. Liang, W. Xu, F.S. Cai, P.Q. Chen, B. Peng, J. Chen and Z.M. Li, New triphenylamine-based organic dyes for efficient dye-sensitized solar cells. Journal of Physical Chemistry C, 2007. 111(11): p. 4465-4472.
5. S.M. Feldt, E.A. Gibson, E. Gabrielsson, L. Sun, G. Boschloo and A. Hagfeldt, Design of Organic Dyes and Cobalt Polypyridine Redox Mediators for High-Efficiency Dye-Sensitized Solar Cells. Journal of the American Chemical Society, 2010. 132(46): p. 16714-16724.
6. W. Xu, B. Peng, J. Chen, M. Liang and F. Cai, New triphenylamine-based dyes for dye-sensitized solar cells. Journal of Physical Chemistry C, 2008. 112(3): p. 874-880.
7. S.P. Singh, M.S. Roy, K.R.J. Thomas, S. Balaiah, K. Bhanuprakash and G.D. Sharma, New Triphenylamine-Based Organic Dyes with Different Numbers of Anchoring Groups for Dye-Sensitized Solar Cells. Journal of Physical Chemistry C, 2012. 116(9): p. 5941-5950.
8. G. Li, K.J. Jiang, Y.F. Li, S.L. Li and L.M. Yang, Efficient structural modification of triphenylamine-based organic dyes for dye-sensitized solar cells. Journal of Physical Chemistry C, 2008. 112(30): p. 11591-11599.
9. J. Tang, W.J. Wu, J.L. Hua, J. Li, X. Li and H. Tian, Starburst triphenylamine-based cyanine dye for efficient quasi-solid-state dye-sensitized solar cells. Energy & Environmental Science, 2009. 2(9): p. 982-990.
10. F. Zhang, Y.H. Luo, J.S. Song, X.Z. Guo, W.L. Liu, C.P. Ma, Y. Huang, M.F. Ge, Z.S. Bo and Q.B. Meng, Triphenylamine-based dyes for dye-sensitized solar cells. Dyes and Pigments, 2009. 81(3): p. 224-230.
11. X. Jiang, K.M. Karlsson, E. Gabrielsson, E.M.J. Johansson, M. Quintana, M. Karlsson, L.C. Sun, G. Boschloo and A. Hagfeldt, Highly Efficient

Rational design of new dyes based on TA-St-CA sensitizer Chapter 3
97
Solid-State Dye-Sensitized Solar Cells Based on Triphenylamine Dyes. Advanced Functional Materials, 2011. 21(15): p. 2944-2952.
12. C.H. Yang, H.L. Chen, Y.Y. Chuang, C.G. Wu, C.P. Chen, S.H. Liao and T.L. Wang, Characteristics of triphenylamine-based dyes with multiple acceptors in application of dye-sensitized solar cells. Journal of Power Sources, 2009. 188(2): p. 627-634.
13. J. Pei, S.J. Peng, J.F. Shi, Y.L. Liang, Z.L. Tao, J. Liang and J. Chen, Triphenylamine-based organic dye containing the diphenylvinyl and rhodanine-3-acetic acid moieties for efficient dye-sensitized solar cells. Journal of Power Sources, 2009. 187(2): p. 620-626.
14. C.H. Yang, S.H. Liao, Y.K. Sun, Y.Y. Chuang, T.L. Wang, Y.T. Shieh and W.C. Lin, Optimization of Multiple Electron Donor and Acceptor in Carbazole-Triphenylamine-Based Molecules for Application of Dye-Sensitized Solar Cells. Journal of Physical Chemistry C, 2010. 114(49): p. 21786-21794.
15. J.F. Shi, L. Wang, Y.L. Liang, S.J. Peng, F.Y. Cheng and J. Chen, All-Solid-State Dye-Sensitized Solar Cells with Alkyloxy-Imidazolium Iodide Ionic Polymer/SiO2 Nanocomposite Electrolyte and Triphenylamine-Based Organic Dyes. Journal of Physical Chemistry C, 2010. 114(14): p. 6814-6821.
16. D.P. Hagberg, T. Edvinsson, T. Marinado, G. Boschloo, A. Hagfeldt and L. Sun, A novel organic chromophore for dye-sensitized nanostructured solar cells. Chemical Communications, 2006(21): p. 2245-2247.
17. N. Mohammadi, P.J. Mahon and F. Wang, Toward rational design of organic dye sensitized solar cells (DSSCs): an application to the TA-St-CA dye. Journal of Molecular Graphics and Modelling, 2013. 40: p. 64-71.
18. M.J.S. Dewar, A Molecular Orbital Theory of Organic Chemistry. I. General Principles. Journal of the American Chemical Society, 1952. 74(13): p. 3341-3345.
19. M.J.S. Dewar, A Molecular Orbital Theory of Organic Chemistry. II.1 The Structure of Mesomeric Systems. Journal of the American Chemical Society, 1952. 74(13): p. 3345-3350.
20. M.J.S. Dewar, A Molecular Orbital Theory of Organic Chemistry. III.1,2 Charge Displacements and Electromeric Substituents. Journal of the American Chemical Society, 1952. 74(13): p. 3350-3353.
21. M.J.S. Dewar, A Molecular Orbital Theory of Organic Chemistry. IV.1 Free Radicals. Journal of the American Chemical Society, 1952. 74(13): p. 3353-3354.

Rational design of new dyes based on TA-St-CA sensitizer Chapter 3
98
22. M.J.S. Dewar, A Molecular Orbital Theory of Organic Chemistry. V.1 Theories of Reactivity and the Relationship between Them. Journal of the American Chemical Society, 1952. 74(13): p. 3355-3356.
23. M.J.S. Dewar, A Molecular Orbital Theory of Organic Chemistry. VI.1 Aromatic Substitution and Addition. Journal of the American Chemical Society, 1952. 74(13): p. 3357-3363.
24. Y.-J. Cheng, J. Luo, S. Huang, X. Zhou, Z. Shi, T.-D. Kim, D.H. Bale, S. Takahashi, A. Yick, B.M. Polishak, S.-H. Jang, L.R. Dalton, P.J. Reid, W.H. Steier and A.K.Y. Jen, Donor−Acceptor Thiolated Polyenic Chromophores Exhibiting Large Optical Nonlinearity and Excellent Photostability. Chemistry of Materials, 2008. 20(15): p. 5047-5054.
25. J. Hung, W. Liang, J. Luo, Z. Shi, A.K.Y. Jen and X. Li, Rational Design Using Dewar’s Rules for Enhancing the First Hyperpolarizability of Nonlinear Optical Chromophores. The Journal of Physical Chemistry C, 2010. 114(50): p. 22284-22288.
26. C. Adamo and V. Barone, Toward reliable density functional methods without adjustable parameters: The PBE0 model. Chinese Journal of Chemical Physics, 1999. 110(13): p. 6158-6170.
27. J. Tao, S. Tretiak and J.-X. Zhu, Absorption Spectra of Blue-Light-Emitting Oligoquinolines from Time-Dependent Density Functional Theory. The Journal of Physical Chemistry B, 2008. 112(44): p. 13701-13710.
28. C. Adamo and V. Barone, Accurate excitation energies from time-dependent density functional theory: assessing the PBE0 model for organic free radicals. Chemical Physics Letters, 1999. 314(1–2): p. 152-157.
29. D. Jacquemin, E.A. Perpete, G.E. Scuseria, I. Ciofini and C. Adamo, TD-DFT Performance for the Visible Absorption Spectra of Organic Dyes: Conventional versus Long-Range Hybrids. Journal of Chemical Theory and Computation, 2008. 4(1): p. 123-135.
30. M.J.F. Gaussian 09, G. W. Trucks, H. B. Schlegel, G. E. Scuseria, M. A. Robb, J. R. Cheeseman, G. Scalmani, V. Barone, B. Mennucci, G. A. Petersson, H. Nakatsuji, M. Caricato, X. Li, H. P. Hratchian, A. F. Izmaylov, J. Bloino, G. Zheng, J. L. Sonnenberg, M. Hada, M. Ehara, K. Toyota, R. Fukuda, J. Hasegawa, M. Ishida, T. Nakajima, Y. Honda, O. Kitao, H. Nakai, T. Vreven, J. A. Montgomery, Jr., J. E. Peralta, F. Ogliaro, M. Bearpark, J. J. Heyd, E. Brothers, K. N. Kudin, V. N. Staroverov, R. Kobayashi, J. Normand, K. Raghavachari, A. Rendell, J. C. Burant, S. S. Iyengar, J. Tomasi, M. Cossi, N. Rega, J. M. Millam, M. Klene, J. E. Knox, J. B. Cross, V. Bakken, C. Adamo, J. Jaramillo, R. Gomperts, R. E. Stratmann, O. Yazyev, A. J. Austin, R. Cammi, C.

Rational design of new dyes based on TA-St-CA sensitizer Chapter 3
99
Pomelli, J. W. Ochterski, R. L. Martin, K. Morokuma, V. G. Zakrzewski, G. A. Voth, P. Salvador, J. J. Dannenberg, S. Dapprich, A. D. Daniels, Ö. Farkas, J. B. Foresman, J. V. Ortiz, J. Cioslowski, and D. J. Fox, Gaussian, Inc., Wallingford CT, 2009.
31. M. Cossi, N. Rega, G. Scalmani and V. Barone, Energies, structures, and electronic properties of molecules in solution with the C-PCM solvation model. Journal of Computational Chemistry, 2003. 24(6): p. 669-681.
32. V. Barone and M. Cossi, Quantum calculation of molecular energies and energy gradients in solution by a conductor solvent model. Journal of Physical Chemistry A, 1998. 102(11): p. 1995-2001.
33. R. Dennington, T. Keith and J. Millam, GaussView, Version 5. 2009, Semichem Inc. Shawnee Mission KS.
34. A. Ganesan, F. Wang and C. Falzon, Intramolecular interactions of L-phenylalanine: Valence ionization spectra and orbital momentum distributions of its fragment molecules. Journal of Computational Chemistry, 2011. 32(3): p. 525-535.
35. M.J.S. Dewar, 478. Colour and constitution. Part I. Basic dyes. Journal of the Chemical Society 1950: p. 2329-2334.
36. H.H. Jaffe, The molecular orbital theory of organic chemistry (Dewar, Michael J. S.). Journal of Chemical Education, 1970. 47(8): p. A531.
37. A. Mishra, M.K.R. Fischer and P. Bauerle, Metal-Free Organic Dyes for Dye-Sensitized Solar Cells: From Structure: Property Relationships to Design Rules. Angewandte Chemie-International Edition, 2009. 48(14): p. 2474-2499.
38. C.-R. Zhang, Z.-J. Liu, Y.-H. Chen, H.-S. Chen, Y.-Z. Wu, W. Feng and D.-B. Wang, DFT and TD-DFT study on structure and properties of organic dye sensitizer TA-St-CA. Current Applied Physics, 2010. 10(1): p. 77-83.
39. P. Persson and M.J. Lundqvist, Calculated Structural and Electronic Interactions of the Ruthenium Dye N3 with a Titanium Dioxide Nanocrystal. The Journal of Physical Chemistry B, 2005. 109(24): p. 11918-11924.
40. F. De Angelis, Direct vs. indirect injection mechanisms in perylene dye-sensitized solar cells: A DFT/TDDFT investigation. Chemical Physics Letters, 2010. 493(4-6): p. 323-327.
41. S. Agrawal, P. Dev, N.J. English, K.R. Thampi and J.M.D. MacElroy, A TD-DFT study of the effects of structural variations on the photochemistry of polyene dyes. Chemical Science, 2012. 3(2): p. 416-424.
Rational design of new dyes based on TA-St-CA sensitizer Chapter 3
100
42. W. Fan, D. Tan and W. Deng, Theoretical investigation of triphenylamine dye/titanium dioxide interface for dye-sensitized solar cells. Physical Chemistry Chemical Physics, 2011. 13(36): p. 16159-16167.
43. S. Agrawal, P. Dev, N.J. English, K.R. Thampi and J.M.D. MacElroy, First-principles study of the excited-state properties of coumarin-derived dyes in dye-sensitized solar cells. Journal of Materials Chemistry, 2011. 21(30): p. 11101-11108.
44. R. Sanchez-de-Armas, M.A. San-Miguel, J. Oviedo and J.F. Sanz, Molecular modification of coumarin dyes for more efficient dye sensitized solar cells. The Journal of Chemical Physics, 2012. 136(19): p. 194702-7.
45. F. De Angelis, S. Fantacci, A. Selloni, M. Grätzel and M.K. Nazeeruddin, Influence of the Sensitizer Adsorption Mode on the Open-Circuit Potential of Dye-Sensitized Solar Cells. Nano Letters, 2007. 7(10): p. 3189-3195.
46. R.o. Sánchez-de-Armas, J. Oviedo López, M. A. San-Miguel, J.F. Sanz, P. Ordejón and M. Pruneda, Real-Time TD-DFT Simulations in Dye Sensitized Solar Cells: The Electronic Absorption Spectrum of Alizarin Supported on TiO2 Nanoclusters. Journal of Chemical Theory and Computation, 2010. 6(9): p. 2856-2865.
47. P. Wen, Y. Han and W. Zhao, Influence of TiO2 Nanocrystals Fabricating Dye-Sensitized Solar Cell on the Absorption Spectra of N719 Sensitizer. International Journal of Photoenergy, 2012. 2012: p. 7.
48. W.R. Duncan and O.V. Prezhdo, Theoretical studies of photoinduced electron transfer in dye-sensitized TiO2. Annual Review of Physical Chemistry, 2007. 58: p. 143-84.
101
Chapter 4
Novel annulene-based dyes “Imagination is everything. It is the preview of life's coming attractions.”
Albert Einstein
4.1. Introduction
The previous chapter was mainly focused on the design of new dye sensitizers
through chemical modifications of the π-conjugated bridge (linker) of a good-
performing dye. As seen in that chapter, the linker of a reference dye called TA-
St-CA, was subject to the modifications by substitutions of small electronegative/
electropositive groups based on Dewar’s rules. The present chapter takes a new
approach to the design of new dye sensitizers. That is, to employ new chemical
groups in the donor (D) moiety of an existing promising organic dye sensitizer.
Design of the new dyes in this chapter is based on the backbone structure of the
TA-St-CA dye. This chapter is designed to examine how modifications on the
donor moiety of the reference dye affect the properties and absorption spectra of
the new dyes.
Electron donating groups (EDG) (also known as electron releasing group (ERG)
or activating group) may be broadly defined as groups of atoms which can
contribute electron density to a system. This chapter investigates the influence of
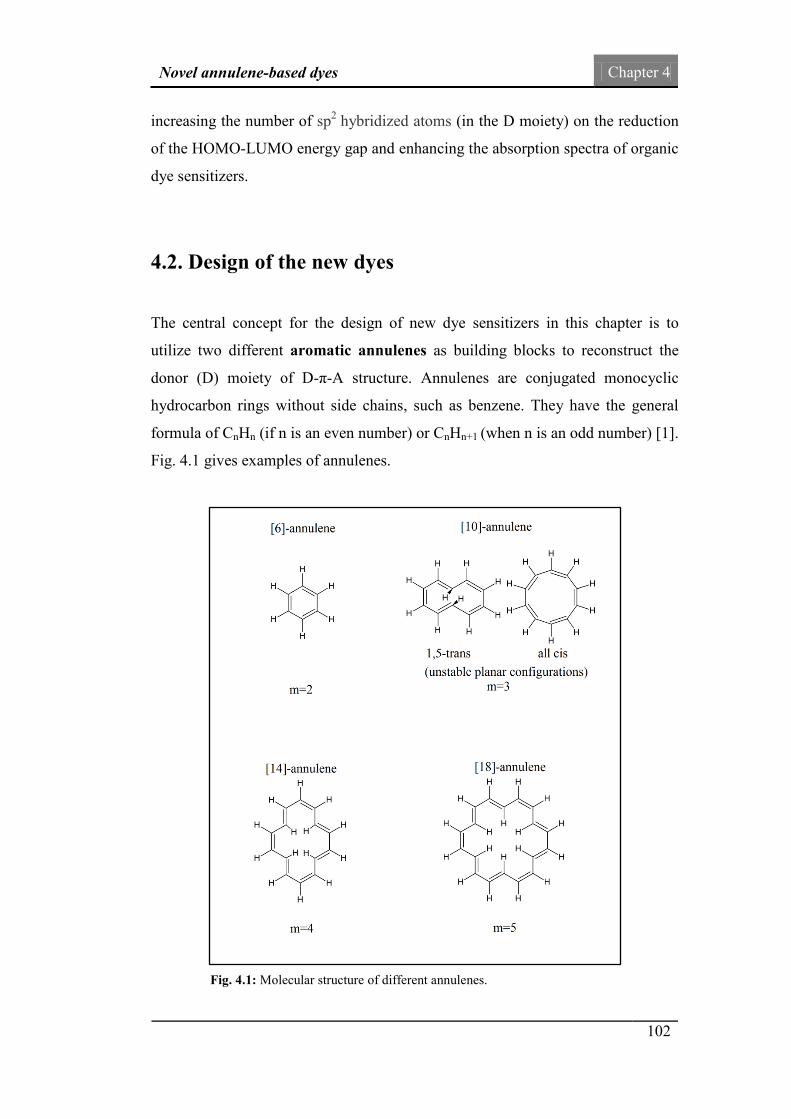
Novel annulene-based dyes Chapter 4
102
increasing the number of sp2 hybridized atoms (in the D moiety) on the reduction
of the HOMO-LUMO energy gap and enhancing the absorption spectra of organic
dye sensitizers.
4.2. Design of the new dyes
The central concept for the design of new dye sensitizers in this chapter is to
utilize two different aromatic annulenes as building blocks to reconstruct the
donor (D) moiety of D-π-A structure. Annulenes are conjugated monocyclic
hydrocarbon rings without side chains, such as benzene. They have the general
formula of CnHn (if n is an even number) or CnHn+1 (when n is an odd number) [1].
Fig. 4.1 gives examples of annulenes.
Fig. 4.1: Molecular structure of different annulenes.

Novel annulene-based dyes Chapter 4
103
Aromaticity of annulenes can be studied by the famous Hückel's rule of
aromaticity formulated in 1931 [2]. Hückel's rule states that a planar (or almost
planar) cyclic ring with a continuous system of π-orbitals is aromatic, if these π-
orbitals are occupied by 4m+2 electrons (where m is a non-negative integer). The
most well-known aromatic member of annulenes is benzene (i.e. C6H6 or [6]-
annulene, n=6, m=1).
Cyclodecapentaene or [10]-annulene (i.e. C10H10, n=10, m=2) should display
aromaticity as it exhibits 10 π–electrons and satisfies the 4m+2 rule (m=2). But
this annulene is not aromatic, due to a combination of steric strain and angular
strain. If the planar all cis-configuration is assumed for it (see Fig. 4.1), there
would be bond angles of as large as 144° between the carbon atoms (instead of the
120° angles required for sp2 hybridized carbon). This creates large amounts of
considerable angle strain, which destabilizes the planar all cis-configuration. Such
destabilization (owing to angle strain) apparently exceeds the stabilization
associated with aromaticity. As a result the planar all cis-cyclodecapentaene is a
highly reactive substance. Another possible planar configuration is 1,5-trans
cyclodecapentaene (i.e. the configuration in which two of the double bonds are
trans, see Fig. 4.1). This isomer is free of angle strain. However the repulsive
force between two hydrogen atoms that are forced together in the interior of the
ring destabilizes this planar structure. As a result, this isomer is also relatively
reactive.
The next two aromatic annulenes, based on Hückel's rule of aromaticity, are [14]-
annulene (also known as Cyclotetradecaheptaene, i.e. C14H14, n=14, m=3) and
[18]-annulene (i.e. C18H18, also known as cyclooctadecanonaene, n=18, m=3). All
of these ring structures (i.e. [6]-annulene, [14]-annulene and [18]-annulene) are
completely conjugated, monocyclic hydrocarbons, which follow the Hückel's rule
of aromaticity (see Fig. 4.1).
The molecular structure and aromaticity of [14]- and [18]- annulenes have been
thoroughly studied in several articles such as Wannere et al. [3, 4], Jug et al. [5] ,

Novel annulene-based dyes Chapter 4
104
Kennedy et al [6] and Gellini et al. [7]. Such studies confirm that both of these
annulenes indeed show aromatic character. However, [14]-annulene tends to be
less planar, because of the steric interactions among the four inner-rings hydrogen
atoms in its structure. Such ring strain might destabilize this compound and make
it quite reactive. Nevertheless, there have been no dye sensitizer designed based
on [14]-annulene to the best of our knowledge. If our novel design based on this
group shows promising results, at least in theory, future studies can be directed to
finding strategies for designing and synthesizing more stable dyes based on [14]-
annulene rings (such as bridged [14]-annulenes).
Several properties of annulenes draw our attention to employ these compounds in
the structure of new dye sensitizers. The existence of n delocalized π-electrons in
their rings (n refers to the number of carbon atoms in annulene formula) makes
annulenes electron-rich compounds, which is ideal for the donor moiety of a push-
pull dye. Moreover, the aromatic annulenes (i.e. [6]-, [14]- and [18]- annulenes)
are able to enhance chemical stability of the new dyes. Stability is an important
requirement for the commercialization of the dye sensitizers. Annulenes are also
conjugated structures. Conjugation increases the electron delocalisation, and
therefore reduces the energy gap between the bonding (π) and anti-bonding
orbitals (π*). As a result, by employing larger conjugated groups, the HOMO-
LUMO energy gap should decrease, and the maximum absorption should move to
longer wavelengths. As mentioned previously, our aim is to design dye
sensitizers, which can absorb in longer wavelengths (i.e. red-shifting the
absorption spectra). As a result, annulenes are suitable candidates for our rational
design.
In this chapter two new dyes are rationally designed by altering the donor (D)
moiety of the parent TA-St-CA dye. These dyes inherit the same π-linker and
acceptor (A) moieties of the parent dye, and only differ in the donor (D) section.
Fig. 4.2 shows structure of these molecules. The D section of the parent dye
consists of a triphenylamine (TPA) moiety. Three phenyl rings of the TPA group
are labelled as R1-R3, as shown in Fig. 4.2(a)). Phenyl groups are derived from
Novel annulene-based dyes Chapter 4
105
benzene ring (i.e. C6H6 or [6]-annulene). In the first rationally designed dye, AN-
14, all three rings (R1-R3) are replaced with [14]-annulene rings (Fig. 4.2(b)). In
the second new dye, AN-18, two of these ring, i.e. R1 and R2 remain unchanged,
while R3 is substituted with [18]-annulene ring. Fig. 4.2(c) shows structure of AN-
18 dye.
As seen in Fig. 4.2, the “oligo-phenylenevinylene” group (π-linker) and the
“cyanoacrylic acid” group which works as electron acceptor/anchoring moiety (A-
section) remains unchanged in all three molecules. A purple box in Fig. 4.2
encompasses the identical sections of the dyes in this study. Theoretical
calculations are performed on AN-14 and AN-18 dye structures to investigate
how modifying the donor moiety affects the HOMO-LUMO energy gap as well as
the UV-Vis absorption spectra.

Novel annulene-based dyes Chapter 4
106
Fig. 4.2: Molecular structure of the reference TA-St-CA sensitizer and new dyes AN-14 and AN-18.

Novel annulene-based dyes Chapter 4
107
4.3. Computational details
Density functional theory (DFT) based PBE0 hybrid density functionals [8] and
polarized split-valence triple-zeta 6-311G(d) basis set are exploited without any
constraints. This computational model is employed to allow comparisons of the
newly designed dyes with the reference TA-St-CA dye, which was studied in
previous chapter. As seen in chapter 3, this computational model (i.e. PBE0/6-
311G(d)) provides good agreement with the experiment for the reference dye. All
quantum mechanical calculations are performed with Gaussian 09 computational
chemistry package [9].
For each of the newly designed dyes, the geometries are optimized followed by
frequency calculations to ensure that the structures are true minimal energy ones.
Single point energy calculations on the optimized structures in vacuum are
conducted by the same PBE0/6-311G(d) computational model to construct the
molecular energy levels and isodensity plots.
In order to make comparisions, the present study simulates the absorption
spectra of the reference TA-St-CA sensitizer and the new dyes in ethanol
solution using the conductor-like polarizable continuum model (CPCM) [10,
11]. The UV-Vis spectra in ethanol solution are simulated using singlet-singlet
transitions up to the 30th lowest spin-allowed excited states of each dye based
on time dependant density functional (TD-DFT) calculations by employing the
PBE0/6-311G(d) model. These lowest-energy electronic transitions are then
transformed into simulated UV-Vis spectra by GaussView 5 visualization
software [12], using Gaussian functions with half-widths of 3000 cm–1.
To address the issue of charge-transfer (CT) excitations [13], a TD-DFT
calculation using CAM-B3LYP functional is also performed on the reference and
new dyes in this chapter. The CAM-B3LYP functional proposed by Yanai et al.
[14] is a long-range corrected density functional. This functional has been found
to be successful in overcoming the problem with CT bands in many different

Novel annulene-based dyes Chapter 4
108
studies [14, 15], including theoretical studies of dye sensitizers [16-18].
Consequently, this long-range corrected functional (i.e. CAM-B3LYP) has been
employed in recent in silico design of new dye sensitizers [19, 20]. As a result, the
UV-Vis spectra in ethanol solution are also simulated using singlet-singlet
transitions up to the 30 lowest spin-allowed excited states of each dye based on
TD-DFT calculations using CAM-B3LYP/6-311G(d) model.
4.4. Geometrical details
Fig. 4.3 gives the optimized 3D structures of the new AN-14 and AN-18 dye
sensitizers. These dyes are rationally designed in silico. No experimental
geometry measurements of the entire structures are available for comparison.
However, the theoretical model employed to optimize the structures of new dyes
has been validated using TA-St-CA dye in Chapter3.
A reverse multi-fragment approach [21] is adopted in this study to validate our
model. That is, the optimized structure is obtained first. The geometry features of
the main fragments of the compounds are then compared with the available
experimental data. For AN-14 molecule, a [14]-annulene ring is selected to be
compared with data from literature. This fragment is labelled as R1 in Fig. 4.3 (a).
In a similar way, the [18]-annulene ring of the AN-18 dye (R3 in Fig. 4.3 (b)) is
investigated in this section.

Novel annulene-based dyes Chapter 4
109
Table 4.1 compares selected bond lengths, bond angles, and dihedrals of the [14]-
annulene ring with available theoretical and experimental data. For better
visualization, this ring is given separately in Fig. 4.4. In the figure, this ring (i.e.
R1) is re-oriented and its atoms are labelled. Table 4.1 is closely related to Fig.
4.4.
Fig. 4.3: Optimized 3D structures of the new dyes AN-14 (a) and AN-18 (b), (red: oxygen; blue: nitrogen; grey: carbon).

Novel annulene-based dyes Chapter 4
110
[14]-annulene was first synthesized by Sondheimer and Gaoni in 1960 [22]. Based
on Hückel's rule of aromaticity, [14]-annulene should be aromatic and likely to be
planar. The photoelectron spectrum of [14]-annulene identifies a vertical
ionization energy which is consistent with an aromatic system [23, 24]. The
structure of [14]-annulene was investigated experimentally by X-ray study [25].
There are also several theoretical studies reported on the structure of this aromatic
ring, employing a variety of theoretical levels. For example, Allinger and Sprague
performed molecular mechanics (MM) calculations on C2h and D2 conformations
of this molecule [26]. Jug and Fasold investigated D2, C2h and Cs symmetries for
[14]-annulene by employing a semi-empirical self-consistent field molecular
orbital method, called SINDO1 [5]. Density functional theory (DFT) approaches
have also been applied to probe the D2, C2h and Cs symmetries of this annulene
ring. Selected results of such studies are listed in Table 4.1.
The potential energy surface of [14]-annulene exhibits multiple minimum
structures. According to the X-ray studies on the crystal structure, [14]-annulene
is centrosymmetric and non-planar, but with approximate C2h symmetry [25].
Arrangement of the inner hydrogen atoms (i.e. H17, H21, H24 and H27 in Fig. 4.4)
Fig. 4.4: Optimized 3D structure and labelling of the [14]-annulene ring (R1).
Novel annulene-based dyes Chapter 4
111
determines the symmetry. From these four atoms, two are above the plane of
carbon rings and two are below this plane. For example, if H17 and H27 in Fig. 4.4
are above the plane, the molecule has C2h symmetry. According to the DFT study
of Wannere et al., [14]-annulene may exhibit C2h or Cs structures [3]. That is, the
C2h symmetry is a local minimum at B3LYP level, whereas a transition state when
functionals such as BHLYP and KMLYP are employed [3]. The latter functionals,
having larger Hartree-Fock component, lead to a more stable Cs structure due to
an imaginary frequency if the C2h symmetry is assumed [3, 7]. Nevertheless, all
investigated DFT levels in Ref. [3] have shown that the C2h symmetry is slightly
more stable (i.e. 2.5 kcal.mol-1) than the D2 form. The [14]-annulene adopts a D2
symmetry if two opposite inner hydrogen atoms (e.g. H17 and H24) are above the
plane of the carbon ring, and the other two are below this plane [5]. It should be
noted that the highest possible symmetry for this annulene ring could be D2h, if
this annulene ring was planar [3]. However, the X-ray structure determines that
this molecule is “clearly and significantly non-planar” [25]. The non-planarity is
attributed to the steric interactions between the four internal hydrogen atoms (e.g.
H17, H21, H24 and H27 in Fig. 4.4) [3, 5, 7, 27]. Since our optimization is performed
on the AN-14 dye structure, not an isolated [14]-annulene ring, a detailed
symmetry analysis of our results is irrelevant. As a result, no point group
assignment is listed in Table 4.1 for this work.
Table 4.1 reports the optimized structure of AN-14 dye. As listed in the table, the
C-C bond lengths range from 1.384 to 1.412 Å, with an average of 1.397 Å. This
leads to a moderate C-C bond alternation (Δr) of 0.053 Å, which indicates the
aromaticity of the conjugated molecular system. From the table, it can be seen that
this bond alternation is very similar to that of the experiment. Other theoretical
studies reported bond alternations that are either substantially smaller [5, 26] or
greater [3] than the experimental measurements. For the angles reported in the
table, our results are on the average in better agreement with the experimental
data, compared to those of the SINDO1 simulations. Results based on the
SINDO1 simulations are larger than the MM calculations, the experimental
measurements and our DFT calculations.

Novel annulene-based dyes Chapter 4
112
Table 4.1: Compression of the optimized geometries of the [14]-annulene ring of the present work with data reported in iterature.
This Work Ref.a Ref.b Ref.c Model PBE0/6-
311G* B3LYP/6-311+G**
SINDO1 MM expt
Point group − C2h D2 C2h CS D2 C2h Ci(C2h) C1-C2(Å) 1.412 1.410 1.420 1.422 1.509 1.407 1.410 1.395 C2-C3(Å) 1.384 1.395 1.423 1.424 1.368 1.409 1.408 1.382 C3-C4(Å) 1.400 1.395 1.418 1.418 1.484 1.403 1.405 1.350 C4-C5(Å) 1.391 1.407 1.426 1.423 1.368 1.413 1.411 1.407 H21…H24(Å) 2.04 H21…H27(Å) 2.91 H24…H27(Å) 2.02 ∡C1-C2-C3(°) 120.3 − 122.7 127.5 127.0 120.4 124.2 123.3 ∡C2-C3-C4(°) 130.1 − 137.7 133.6 132.5 130.3 126.9 130.3 ∡C3-C4-C5(°) 125.4 − 127.1 126.4 125.5 125.2 123.7 125.5 ∡C4-C5-C6(°) 129.1 − 132.0 130.0 128.5 129.7 126.9 128.4 ∡C1-C2-C3-C4 (°) -167.6 − 174.3 158.6 161.1 158.2 158.5 162.5 ∡C2-C3-C4-C5 (°) 174.4 − 177.9 -156.5 -139.6 174.5 163.4 -162.7 ∡C3-C4-C5-C6 (°) -14.0 − 14.7 15.2 -2.5 15.1 18.7 13.1 ∡C4-C5-C6-C7 (°) -10.1 − − − 39.1 − − 15.4 ∡C14-C1-C2-C3 (°) 18.6 − -21.0 − − 23.5 − − Δrd (Å) 0.053 0.015 0.008 0.005 0.141 0.01 0.006 0.057e a. Ref.[3]. b. Ref.[5] c. Ref. [25] d. Δr is the difference between the shortest and the longest C-C bond length. e. For C2h point group, from Ref. [28].

Novel annulene-based dyes Chapter 4
113
Table 4.2 compares selected bond lengths, bond angles, and dihedrals of the [18]-
annulene ring with available theoretical and experimental data. For better
visualization, this ring is given separately in Fig. 4.5. In the figure, atoms of this
ring (R3) are labelled. Table 4.2 is closely related to Fig. 4.5.
The C-C bond lengths of R3 are in the range of 1.379 Å to 1.422 Å, with an
average of 1.397 Å. This corresponds to a C-C bond alternation (Δr) of 0.043 Å.
The difference between the shortest and the longest C-C bond is denoted by Δr
here. The X-ray study of the [18]-annulene by Bregman et al. identifies C-C bond
lengths that range from 1.371 Å to 1.429 Å. This corresponds to a Δr of 0.058 Å
[29]. As seen, this experimental bond alternation (i.e. 0.058 Å) is slightly larger
than the present work (i.e. 0.043 Å). However, other experimental works have
reported [3, 28, 30] Δr value of 0.042 Å which is almost equal to the one obtained
in the present theoretical calculations (i.e. 0.043 Å).
Fig. 4.5: Optimized 3D structure and labelling of the [18]-annulene ring (R3).
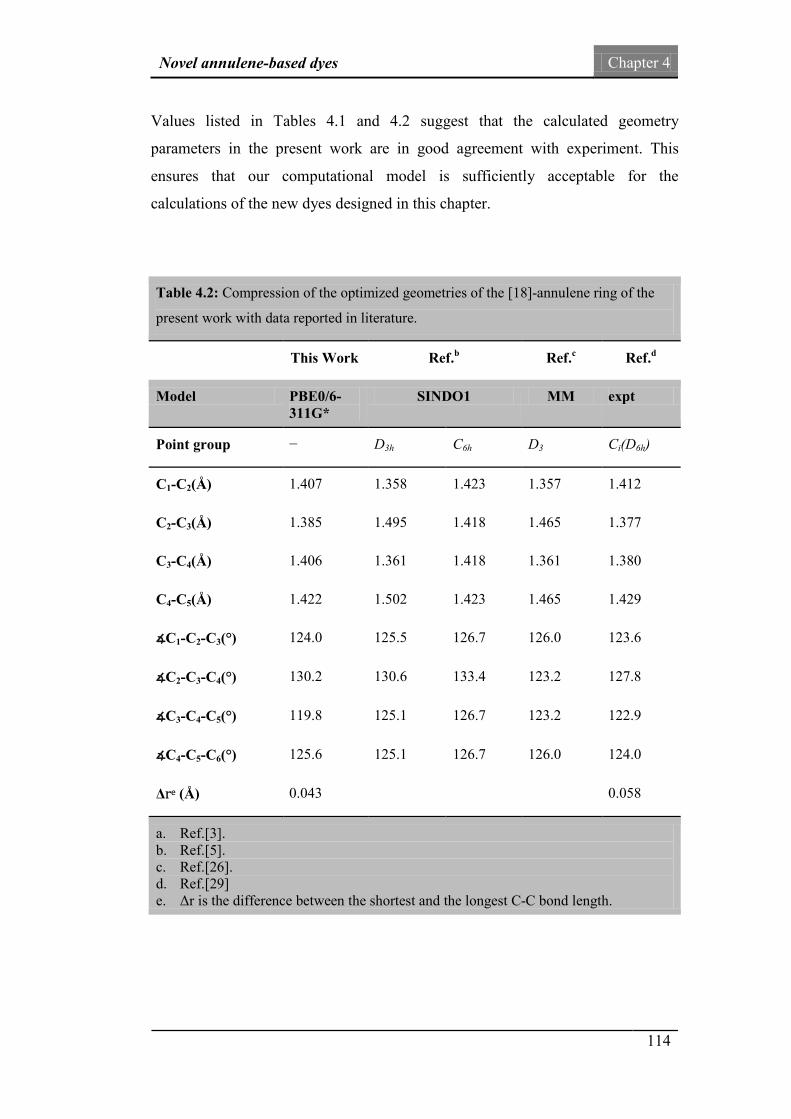
Novel annulene-based dyes Chapter 4
114
Values listed in Tables 4.1 and 4.2 suggest that the calculated geometry
parameters in the present work are in good agreement with experiment. This
ensures that our computational model is sufficiently acceptable for the
calculations of the new dyes designed in this chapter.
Table 4.2: Compression of the optimized geometries of the [18]-annulene ring of the
present work with data reported in literature.
This Work Ref.b Ref.c Ref.d
Model PBE0/6-311G*
SINDO1 MM expt
Point group − D3h C6h D3 Ci(D6h)
C1-C2(Å) 1.407 1.358 1.423 1.357 1.412
C2-C3(Å) 1.385 1.495 1.418 1.465 1.377
C3-C4(Å) 1.406 1.361 1.418 1.361 1.380
C4-C5(Å) 1.422 1.502 1.423 1.465 1.429
∡C1-C2-C3(°) 124.0 125.5 126.7 126.0 123.6
∡C2-C3-C4(°) 130.2 130.6 133.4 123.2 127.8
∡C3-C4-C5(°) 119.8 125.1 126.7 123.2 122.9
∡C4-C5-C6(°) 125.6 125.1 126.7 126.0 124.0
Δre (Å) 0.043 0.058
a. Ref.[3]. b. Ref.[5]. c. Ref.[26]. d. Ref.[29] e. Δr is the difference between the shortest and the longest C-C bond length.

Novel annulene-based dyes Chapter 4
115
4.5. Frontier molecular orbital analysis
An important aim of designing new dyes in this thesis is to obtain a reduced
HOMO-LUMO energy gap (in comparison to a reference dye).To investigate the
influence of the donor moiety variation on the energy levels of the frontier
molecular orbitals (e.g. HOMO and LUMO) of new dyes, the calculated energy
diagram is illustrated in Fig. 4.6. The orbital energies of the HOMO and the
LUMO of the original TA-St-CA dye in vacuum are calculated at -5.51 eV and -
2.69 eV, respectively, and the corresponding energy gap between the HOMO and
the LUMO is given by 2.82 eV. The new designs for the donor moiety of AN-14
and AN-18 lead to a reduction of of their HOMO-LUMO gap by apparently
lifting up the HOMO energies and shifting down the LUMO energies.
Fig. 4.6: The calculated frontier MO energy levels using PBE0/6-31G* model in vacuum.
TiO2 conduction band
Iodide/Triiodide redox level
Novel annulene-based dyes Chapter 4
116
Significant HOMO-LUMO gap energy reduction is in fact obtained for new dyes.
For example, the HOMO and LUMO energy levels of AN-14 are calculated at -
5.00 eV and -2.92 eV, corresponding to a HOMO-LUMO gap of 2.08 eV. In a
similar way, by the variation of the donor moiety of the reference dye, AN-18 can
achieve an increased HOMO energy (-5.11 eV) and decreased LUMO energy (-
2.95 eV), corresponding to a reduced gap of 2.16 eV.
From Fig. 4.6, it can also be seen that the LUMO energies of the new dyes are
very similar, whereas the HOMO energy of AN-14 is about 0.11 eV larger than
that of the AN-18. These findings suggest that in general, the mechanism of the
energy changes on the molecular orbitals of AN-14 and AN-18 are very similar.
However, the influences of the donor modifications are more profound on the
AN-14 dye. In other words, replacing all three [6]-annulene rings of the reference
dye with three [14]-annulene rings results in noticeable increase of the HOMO
energy level.
Fig 4.6 also gives positions of the conduction band of the TiO2 semiconductor
(dotted red line), as well as the redox potential of the iodide/triiodide redox
mediator (dotted green line). As seen in the figure, the HOMO energy levels of
both new dyes are well located below the redox energy level of the
iodide/triiodide redox couple. This implies that sufficient driving force is
available for the regeneration of AN-14 and AN-18. In fact, the HOMO level of
the new AN-14 sensitizer is very close to that of N3 sensitizer. The N3 (i.e.
Ru(4,4-dicarboxylate-2,2-bipyridine)2-(NCS)2)) dye sensitizer [31], is believed to
be one of the the best dyes from the ruthenium–polypyridyl sensitizer family [32].
Yang et al. calculated the HOMO level of the N3 dye sensitizer
(B3LYP/LANL2DZ level of theory) at -5.08 eV [32]. It is suggested that “the
sensitizer candidates with HOMO level close to that of the N3 dye would be
promising for the regeneration since the N3 dye can be regenerated very well”
[32]. As a result, the HOMO energy of the AN-14 dye is in favour of a very
promissing dye for functional DSSC. In general, the increased HOMO energies of
the new dyes suggest that AN-14 and AN-18 are more efficient than the reference
Novel annulene-based dyes Chapter 4
117
TA-St-CA dye in being regenarted fast and effectively by the iodide/triiodide
redox mediator.
Fig. 4.6 also compares the LUMO levels of the investigated dyes with the
conduction band edge of the semiconductor located at -4.0 eV for anatase TiO2
[33] (dotted red line). Although the new dyes exhibit a downshifted LUMO levels
compared to that of the reference dye, their LUMO energies are still well above
the CBE of TiO2. That is, the LUMO levels of both AN-14 and AN-18 are higher
than the conduction band edge of TiO2 by at least 1.0 eV. This means that upon
excitation, the photoexcited electrons posess enough driving force to be rapidly
injected to the conduction band of the semiconductor. As a result, these two new
dye senzitizers, i.e. AN-14 and AN-18, can operate functionally in working
DSSC.
4.6. UV-Vis absorption spectra
The main purpose of designing the new dyes, AN-14 and AN-18, in this chapter
was to broaden and to red-shift the absorption spectra of the reference TA-St-CA
dye by the variation of the donor moiety. To investigate the light absorption
properties of the new dyes, their electronic spectra are simulated in Fig. 4.7. This
figure also gives the simulated UV-Vis spectrum of the parent TA-St-CA dye for
comparison. In the figure, the absorption spectra of the reference TA-St-CA dye is
shown in black line, whereas the spectra of the AN-14 and AN-18 dyes are
illustrated in red and blue lines, respectively. The related electronic and optical
data predicted from time dependent density functional calculations of the
investigated dyes are given in Table 4.3. All spectra reported in Fig. 4.7 and Table
4.3 are simulated at PBE0/6-311G(d) level of theory in ethanol solution. In
Chapter 3, it was shown that this model closely reproduces the experimental
electronic absorption spectra of the reference TA-St-CA dye.
Novel annulene-based dyes Chapter 4
118
Significant enhancement in UV-Vis spectra is achieved in the new AN-14 and
AN-18 dyes over the reference dye. Fig. 4.7 shows that the modifications of the
reference dye resulted in bathochromic shift (i.e. to the longer wavelength or red-
shift) of the spectral peaks from positions of the reference dye. For example, the
two most intense peaks of the reference dye are calculated at λI=374 nm and
λII=545 nm. In new dye “AN-14”, these peaks are significantly red-shifted to
λI=418 nm and λII=763, respectively. For λI, a relatively small red-shift of ca. 44
nm is calculated, whereas a very significant red-shift of ca. 218 nm is seen on the
position of λII in AN-14, when compared to the reference dye.
The effects of structural modifications on the electronic absorption spectra of AN-
18 are similar to those of AN-14. For instance, in AN-18, the positions of both
Peaks I at λI and Peaks II at λII are shifted to longer wavelengths, compared to
those of the TA-St-CA dye. The simulations on AN-18 produce a sharp intense
peak at λI=439 nm and a broader peak at λII=722 nm. As a result, the rational
donor design of AN-18 leads to a bathochromic shift of ca. 65 nm and ca. 177 nm
on the positions of the spectral peaks λI and λII, compared to those of the
reference dye, respectively.

Novel annulene-based dyes Chapter 4
119
As listed in Table 4.3, new dyes exhibit more or less enhancement in the oscillator
strengths (f) of their absorption Peak I and Peak II. For example, the Peak II of the
reference dye exhibits an oscillator strength of 1.22, which is increased to 1.53
and 1.27 in AN-14 and AN-18, respectively. For this peak the oscillator strengths
follow a trend of fTA-St-CA <fAN-18<fAN-14. For the other main absorption peak, the
trend is quite different, that is, fAN-14< fTA-St-CA < fAN-18.
Fig. 4.7: The simulated UV–Vis absorption spectra of the TA-ST-CA, AN-14 and AN-18 in ethanol solution using the (PBE0/6-311G*) TD-DFT calculations.
λI
λII
λI
λII

Novel annulene-based dyes Chapter 4
120
The calculated expansion of the absorption spectra of AN-14 and AN-18 dyes
with respect to the reference dye can be attributed to the reduction of the HOMO-
LUMO energy gap of these dyes. As listed in Table 4.3, Peak II is a charge-
transfer (CT) band corresponding to a HOMO→LUMO transition. As seen in
the table, the contribution of such transition is 99%, 96% and 95% in Ta-St-
CA, AN-14 and AN-18, respectively. As explained in section 4.5 of this
chapter, the HOMO and the LUMO energy levels are brought closer to each
other in new dyes AN-14 and AN-18, compared to the reference dye;
Table 4.3: Calculated (a) excited energy (in nm), transition configuration, and oscillator strengths (f) for the two most intense peaks of TA-ST-CA dye and the new dyes in ethanol solution. I II
Structure λ (nm) f Transition Orbital
λ (nm) f Transition Orbital
TA-St-CA
374.53
0.77
H-1→L (91%) H→L+1 (7%)
545.03
1.22
H→L (99%)
AN-14
418.38
0.61
H-2→L+1 (35%) H-2→L+2 (23%) H-1→L+1 (19%) H-1→L+2 (14%)
763.30
1.53
H→L (96%)
AN-18
439.74
2.10
H-1→L+1 (48%) H-3→L (17%) H→L+2 (13%) H-1→L+2 (7%) H-2→L (5%) H-2→L+2 (5%)
722.76
1.27
H→L (95%) H-1→L+1 (3%)
(a) Calculated using TD-DFT based PBE0/6-311G(d) model in ethanol solution (CPCM).

Novel annulene-based dyes Chapter 4
121
therefore, this CT band (i.e. Peak II) is red-shifted in both new candidates
compared to TA-St-CA. Such justification can also be considered for Peak I.
In short, the results, as shown in Fig. 4.7 and Table 4.3, indicate that the
replacement of [6]-annulene rings in the reference dye by the electron-rich [14]-
annulene rings in AN-14 and [18]-annulene ring in AN-18, leads to significant
improved absorption spectra. New absorption spectra are red-shifted, more
intense, and broadened compared to that of the reference TA-St-CA dye. In
addition, the light absorption spectrum of the AN-14 dyes seems to be superior to
that of the AN-18.
The UV-Vis absorption spectra of the dyes in the present chapter are also
simulated by long-range corrected CAM-B3LYP functional. Results and
discussions of such simulations, as well as their comparison with the PBE0
simulations are provided in Appendix A-III. Regardless of the functional
employed in the TD-DFT calculations, results presented in this chapter clearly
show that both new AN-14 and AN-18 dyes exhibit an enhanced and expanded
absorption spectra, compared to the parent dye. As a result, the new AN-14 and
AN-18 dyes are potentially promising dye candidates for better DSSCs with
enhanced efficiencies. It is therefore recommended that the new dyes to be
synthesized. More information on the experimental absorption spectra of these
dyes and their performances in a working DSSC would help us to establish a
greater degree of accuracy on this matter. Such information can only be obtained
by experimentalists and only after these compounds are synthesized.
4.7. Molecular orbital spatial distribution
To further investigate the influence of modifications on the electronic properties
of the rationally-designed dyes, Fig. 4.8 plots the electron density distribution of
their frontier molecular orbitals.

Novel annulene-based dyes Chapter 4
122
HOMO LUMO
TA-St-CA
AN-14
AN-18
This figure (Fig. 4.8) compares the highest occupied molecular orbital (HOMO)
and the lowest unoccupied molecular orbital (LUMO) of the reference TA-St-CA
dye as well as the AN-14 and AN-18 sensitizers. These molecular orbitals
represent the dominant components of the main band (i.e. Peak II, see Table 4.3).
This band corresponds to a strong transition from the ground state (S0) to the first
Fig. 4.8: Comparison of the HOMOs (left) and LUMOs (right) of the new dye, AN-14 and AN-14 with respect to those of the reference TA-St-CA dye.

Novel annulene-based dyes Chapter 4
123
excited electronic state (S1) in the visible region of the spectrum (Refer to Table
4.3).
It is apparent from this figure that for the three dyes, the HOMOs are spread
mainly over the entire donor (D) moieties (i.e. left hand side of the dyes in the
figure). Moreover, the HOMOs are extended to the conjugated bridge (spacer) of
all three dyes. For example, the HOMOs of AN-14 and AN-18 are π orbitals
(dominated by p electrons from the backbone atoms) and populate over the entire
donor group (R1, R2 and R3, refer to D-section of the D–π–A dye in Fig. 4.2) and
partially populates the oligo-phenylenevinylene π-conjugated bridge and the R4
ring. Similar HOMO distribution is observed on the TA-St-CA dye. The most
noticeable difference between the HOMOs of the reference and the new dyes is a
reduced contribution from the R4 ring (the boxes in Fig. 4.8) of the π-conjugated
bridge on the HOMO of AN-14 and AN-18.
The LUMOs, on the other hand, are mainly localized on the cyanoacrylic acid
group which works as electron acceptor/anchoring moiety (A-section) for all three
dyes. Similar to the HOMOs, the LUMOs are also spread over the entire π-
conjugated bridges. For example, the LUMOs of AN-14 and AN-18 are singlet π*
orbitals which largely populates the cyanoacrylic acid acceptor group and also
spread into the π-conjugated bridge and into the R3 ring in the D-section. For AN-
14, negligible contributions of the R1 and R2 rings in the D section to the LUMO
are also observed. But R1 and R2 do not contribute to the LUMOs of the TA-St-
CA and AN-18 dyes.
Such distribution of the HOMOs and the LUMOs demonstrates that the HOMO-
LUMO excitation has an intra-molecular charge transfer (CT) character. As
mentioned in Chapter 3, such distribution pattern for the HOMOs and the LUMOs
is beneficial to a functional solar cell. This is because: (a) significant contribution
of cyanoacrylic acid group (A-section) to the LUMO ensures a strong electronic
coupling between the dye's excited state and conduction band of the
semiconductor (TiO2), which facilities the ultrafast electron injection, and (b)

Novel annulene-based dyes Chapter 4
124
significant localization of the HOMO on the donor end (left-side of the dyes in the
figure) minimizes the probability of charge recombination between the injected
electrons and the resulting oxidized dye.
4.8. Summary and conclusions
This chapter has investigated new designs for the donor moiety of organic dyes
with D-π-A structure. Two new dyes, AN-14 and AN-18, have been designed by
variation of the donor moity of the backbone structure of the well-performing TA-
St-CA sensitizer. New dyes have been rationally designed with the aim of
reducing the HOMO-LUMO energy gap and producing panchromatic sensitizers.
The broadened and red-shifted absorption spectra compared to that of the
reference dye have been indeed achieved.
It is found that both new dyes exhibit reduced HOMO-LUMO energy gap
compared to that of the reference dye. The new dye AN-14 has a smaller HOMO-
LUMO energy gap than that of AN-18. More importantly, the HOMO-LUMO
energy gap of the new AN-14 dye is very similar to that of the N3 dye. It is well
known that this dye (i.e. N3) is one of the most efficient ruthenium-based
sensitizers for DSSC and is usually used as a benchmark for the evaluation of
other dyes [34]. Based the alignment of the energy levels of HOMOs and
LUMOs, both new dyes from this chapter are also suitable for the application in
DSSCs with conventional settings (i.e. nanocrystalline-TiO2 electrode and
iodide/triiodide redox-based electrolyte).
The UV-Vis absorption spectra of the new dyes have also been simulated by the
TD-DFT calculations. The results of this investigation showed that the absorption
spectra of both new dyes are in general red-shifted and broadened compared to the
reference dye, regardless of the functional employed to simulate them. As a matter
of fact, the absorption spectrum of the new dye AN-14 is much more superior to
Novel annulene-based dyes Chapter 4
125
that of the reference dye in terms of the strengths of the peaks and the coverage of
the visible absorption region.
In summary, these results suggest that the new dye AN-14 is a promising
sensitizer for the application in DSSC. However, determining whether or not these
rationally designed dyes become new dyes in industrial DSSCs also depends on
others properties, such as stability and costs of synthesis. The present chapter has
gone some way towards enhancing our knowledge towards rational dye design.
The findings of this chapter have opened many new questions in need of further
investigation. For example, the stability of the AN-14 dye structure needs to be
addressed by experimental chemists. Of the same importance is how this dye
performs in an assembled cell. The interaction of this dye sensitizer with the other
components of the cell as well as the dynamic processes, which take place for
electron generation and transfer, in the cell should be assessed in a working cell.
In conclusion, further investigation and experimentation into the application of
these novel dyes (and especially AN-14 dye) in DSSC is strongly recommended.

Novel annulene-based dyes Chapter 4
126
References
1. V.I. Minkin, Glossary of terms used in theoretical organic chemistry (IUPAC recommendations 1999). Pure and Applied Chemistry, 1999. 71(10): p. 1919-1981.
2. E. Hückel, Quantentheoretische Beiträge zum Benzolproblem. Zeitschrift für Physik, 1931. 70(3-4): p. 204-286.
3. C.S. Wannere, K.W. Sattelmeyer, H.F. Schaefer and P.v.R. Schleyer, Aromaticity: The Alternating C-C Bond Length Structures of [14]-, [18]-, and [22]Annulene. Angewandte Chemie, 2004. 116(32): p. 4296-4302.
4. C.S. Wannere and P.v.R. Schleyer, How Aromatic Are Large (4n + 2)π Annulenes? Organic Letters, 2003. 5(6): p. 865-868.
5. K. Jug and E. Fasold, Structure and aromaticity of 14-annulene and 18-annulene. Journal of the American Chemical Society, 1987. 109(8): p. 2263-2265.
6. R.D. Kennedy, D. Lloyd and H. McNab, Annulenes, 1980-2000. Journal of the Chemical Society, Perkin Transactions 1, 2002(14): p. 1601-1621.
7. C. Gellini and P.R. Salvi, Structures of Annulenes and Model Annulene Systems in the Ground and Lowest Excited States. Symmetry, 2010. 2(4): p. 1846-1924.
8. C. Adamo and V. Barone, Toward reliable density functional methods without adjustable parameters: The PBE0 model. Chinese Journal of Chemical Physics, 1999. 110(13): p. 6158-6170.
9. G.W.T. M. J. Frisch, H. B. Schlegel, G. E. Scuseria, M. A. Robb, J. R. Cheeseman, G. Scalmani, V. Barone, B. Mennucci, G. A. Petersson, H. Nakatsuji, M. Caricato, X. Li, H. P. Hratchian, A. F. Izmaylov, J. Bloino, G. Zheng, J. L. Sonnenberg, M. Hada, M. Ehara, K. Toyota, R. Fukuda, J. Hasegawa, M. Ishida, T. Nakajima, Y. Honda, O. Kitao, H. Nakai, T. Vreven, J. A. Montgomery, Jr., J. E. Peralta, F. Ogliaro, M. Bearpark, J. J. Heyd, E. Brothers, K. N. Kudin, V. N. Staroverov, R. Kobayashi, J. Normand, K. Raghavachari, A. Rendell, J. C. Burant, S. S. Iyengar, J. Tomasi, M. Cossi, N. Rega, J. M. Millam, M. Klene, J. E. Knox, J. B. Cross, V. Bakken, C. Adamo, J. Jaramillo, R. Gomperts, R. E. Stratmann, O. Yazyev, A. J. Austin, R. Cammi, C. Pomelli, J. W. Ochterski, R. L. Martin, K. Morokuma, V. G. Zakrzewski, G. A. Voth, P. Salvador, J. J. Dannenberg, S. Dapprich, A. D. Daniels, Ö. Farkas, J. B. Foresman, J. V. Ortiz, J. Cioslowski, and D. J. Fox, Gaussian, Inc., Wallingford CT, Gaussian 09. 2009, Gaussian, Inc.: Wallingford CT.
Novel annulene-based dyes Chapter 4
127
10. M. Cossi, N. Rega, G. Scalmani and V. Barone, Energies, structures, and electronic properties of molecules in solution with the C-PCM solvation model. Journal of Computational Chemistry, 2003. 24(6): p. 669-681.
11. V. Barone and M. Cossi, Quantum calculation of molecular energies and energy gradients in solution by a conductor solvent model. Journal of Physical Chemistry A, 1998. 102(11): p. 1995-2001.
12. Roy Dennington, Todd Keith and J. Millam, GaussView, Version 5. 2009, Semichem Inc. Shawnee Mission KS.
13. R. Kobayashi and R.D. Amos, The application of CAM-B3LYP to the charge-transfer band problem of the zincbacteriochlorin–bacteriochlorin complex. Chemical Physics Letters, 2006. 420(1–3): p. 106-109.
14. T. Yanai, D.P. Tew and N.C. Handy, A new hybrid exchange–correlation functional using the Coulomb-attenuating method (CAM-B3LYP). Chemical Physics Letters, 2004. 393(1–3): p. 51-57.
15. A.D. Laurent and D. Jacquemin, TD-DFT benchmarks: A review. International Journal of Quantum Chemistry, 2013. 113(17): p. 2019-2039.
16. D. Jacquemin, E.A. Perpete, G.E. Scuseria, I. Ciofini and C. Adamo, TD-DFT Performance for the Visible Absorption Spectra of Organic Dyes: Conventional versus Long-Range Hybrids. Journal of Chemical Theory and Computation, 2008. 4(1): p. 123-135.
17. M. Pastore, E. Mosconi, F. De Angelis and M. Grätzel, A Computational Investigation of Organic Dyes for Dye-Sensitized Solar Cells: Benchmark, Strategies, and Open Issues. The Journal of Physical Chemistry C, 2010. 114(15): p. 7205-7212.
18. P. Dev, S. Agrawal and N.J. English, Functional Assessment for Predicting Charge-Transfer Excitations of Dyes in Complexed State: A Study of Triphenylamine–Donor Dyes on Titania for Dye-Sensitized Solar Cells. The Journal of Physical Chemistry A, 2012. 117(10): p. 2114-2124.
19. M.I. Abdullah, M.R.S.A. Janjua, A. Mahmood, S. Ali and M. Ali, Quantum Chemical Designing of Efficient Sensitizers for Dye Sensitized Solar Cells. Bulletin of the Korean Chemical Society (Print), 2013. 34(7): p. 2093-2098.
20. R. Tarsang, V. Promarak, T. Sudyoadsuk, S. Namuangruk and S. Jungsuttiwong, Tuning the electron donating ability in the triphenylamine-based D-π-A architecture for highly efficient dye-sensitized solar cells. Journal of Photochemistry and Photobiology A: Chemistry, 2014. 273(0): p. 8-16.
21. V.P. Vysotskiy, J. Boström and V. Veryazov, A new module for constrained multi-fragment geometry optimization in internal coordinates
Novel annulene-based dyes Chapter 4
128
implemented in the MOLCAS package. Journal of Computational Chemistry, 2013: p. n/a-n/a.
22. F. Sondheimer and Y. Gaoni, UNSATURATED MACROCYCLIC COMPOUNDS. XV.1 CYCLOTETRADECAHEPTAENE. Journal of the American Chemical Society, 1960. 82(21): p. 5765-5766.
23. H. Baumann and J.-C. Bunzli, Photoelectron spectrum of [14]annulene. Journal of the Chemical Society, Faraday Transactions, 1998. 94(18): p. 2695-2699.
24. E.L. Spitler, C.A. Johnson and M.M. Haley, Renaissance of Annulene Chemistry. Chemical Reviews, 2006. 106(12): p. 5344-5386.
25. C.C. Chiang and I.C. Paul, Crystal and molecular structure of [14]annulene. Journal of the American Chemical Society, 1972. 94(13): p. 4741-4743.
26. N.L. Allinger and J.T. Sprague, Conformational analysis. XC. Calculation of the structures of hydrocarbons containing delocalized electronic systems by the molecular mechanics method. Journal of the American Chemical Society, 1973. 95(12): p. 3893-3907.
27. S.M. Bachrach, Computational Organic Chemistry. 2007: Wiley.
28. J.F. Oth, Conformational mobility and fast bond shift in the annulenes. Pure and Applied Chemistry, 1971. 25(3): p. 573-622.
29. J. Bregman, F.L. Hirshfeld, D. Rabinovich and G.M.J. Schmidt, The crystal structure of [18]annulene, I. X-ray study. Acta Crystallographica, 1965. 19(2): p. 227-234.
30. C.D. Stevenson and T.L. Kurth, Isotopic Perturbations in Aromatic Character and New Closely Related Conformers Found in [16]- and [18]Annulene. Journal of the American Chemical Society, 2000. 122(4): p. 722-723.
31. M.K. Nazeeruddin, A. Kay, I. Rodicio, R. Humphry-Baker, E. Mueller, P. Liska, N. Vlachopoulos and M. Graetzel, Conversion of light to electricity by cis-X2bis(2,2'-bipyridyl-4,4'-dicarboxylate)ruthenium(II) charge-transfer sensitizers (X = Cl-, Br-, I-, CN-, and SCN-) on nanocrystalline titanium dioxide electrodes. Journal of the American Chemical Society, 1993. 115(14): p. 6382-6390.
32. L. Yang, L. Guo, Q. Chen, H. Sun, J. Liu, X. Zhang, X. Pan and S. Dai, Theoretical design and screening of panchromatic phthalocyanine sensitizers derived from TT1 for dye-sensitized solar cells. Journal of Molecular Graphics and Modelling, 2012. 34(0): p. 1-9.

Novel annulene-based dyes Chapter 4
129
33. L. Kavan, M. Gratzel, S.E. Gilbert, C. Klemenz and H.J. Scheel, Electrochemical and photoelectrochemical investigation of single-crystal anatase. Journal of the American Chemical Society, 1996. 118(28): p. 6716-6723.
34. R. Jitchati, Y. Thathong and K. Wongkhan, Three Synthetic Routes to a Commercial N3 Dye. International Journal of Applied Physics and Mathematics, 2012. 2: p. 107-110.
130
Chapter 5
Carbz-PAHTDDT dye and its derivatives “Research is to see what everybody else has seen,
and to think what nobody else has thought.” Albert Szent-Gyorgyi
5.1. Introduction Rational design of the new dyes in Chapter 3 and Chapter 4 were based on the
TA-St-CA reference dye. This chapter investigates a rational design based on a
new reference dye, known as Carbz-PAHTDTT (S9) dye. Daeneke et al. [1]
reported a highly efficient DSSC in early 2011. In their study, a novel organic dye
sensitizer called Carbz-PAHTDTT (S9) dye was utilized. In addition, the
conventional iodide/triiodide redox mediator was replaced with
ferrocene/ferrocenium (Fc/Fc+) redox couple. This was a noticeable study as the
previous attempts to replace the conventional iodide/triiodide with ferrocene-
based redox couples led to very low efficiencies (η<0.4%) [2, 3], where changes
have only been made on a single component (i.e. redox couple); whereas the dye
sensitizer, i.e. conventional N3 dye remained unchanged.
The recent breakthrough of the DSSC based on Fc/Fc+ redox couple and the
Carbz-PAHTDTT (S9) dye sensitizer, stimulated the present chapter [4] with
more theoretical insight to probe the structure of the S9 dye sensitizer as well as

Carbz-PAHTDDT dye and its derivatives Chapter 5
131
ferrocene compound. To the best of our knowledge, no detailed computational
study on the S9 dye is available. Computational study gives insight into the
geometric and electronic structure of the dye sensitizer and serves as the starting
point for rational design of new dyes with desirable properties such as improved
spectral coverage. As a result, the current chapter will focus primarily on the
study of the Carbz-PAHTDTT dye (See Fig. 5.1). This chapter will also
investigate rational design through chemical modifications on the structure of this
dye sensitizer aiming at red-shifting and broadening the absorption spectra of the
S9 dye that might enhance the efficiency of DSSC by utilising a greater fraction
of the solar spectrum. Chapter 6 will be dedicated to the study of ferrocene
compound.
The present chapter further studies the nonlinear optical properties (NLO) of the
dye sensitizers, in addition to other properties such as the HOMO-LUMO energy
gap and the UV-Vis absorption spectra. It is known that nonlinear optical (NLO)
properties of a push-pull organic dye such as its polarizability (α) and first
hyperpolarizability (β) are associated with its intra-molecular charge transfer
(ICT) character [5-7]. The intra-molecular charge transfer character is a very
important feature of organic D-π-A dye sensitizers. The ICT character of the
push-pull dye sensitizer can affect the short-circuit charge transfer, 𝐽sc , and
therefore the efficiency, 𝜂, of the cell [8]. Edvinsson et al. [9] studied some
perylene-based sensitizers for the relationship between ICT character of the
molecules and their performance in DSSC. It was found that the photocurrent and
the overall solar-to-electrical energy conversion efficiency improve remarkably
with increasing ICT character of the dyes. A later study of Tian and co-workers
on triphenylamine dyes [10] suggests that an effective ICT has a positive effect on
the performance of DSSC. As a result we will study the NLO properties of the
Carbz-PAHTDTT dye and the rationally designed dyes in this chapter.
Carbz-PAHTDDT dye and its derivatives Chapter 5
132
5.2. Methods and computational details
The structure of the Carbz-PAHTDDT (S9) dye in three dimensional (3D) space
is obtained through geometry optimizations in vacuum and in dichloromethane
(DCM, CH2Cl2) solution, respectively. The DCM solution was used in
experimental study of the reference dye [1]. Density functional theory (DFT)
based PBE0 hybrid density functionals [11] and polarized split-valence triple-zeta
6-311G(d) basis set, that is, the PBE0/6-311G(d) model, is employed in the
calculations without any symmetry restrictions. No imaginary frequencies are
found for the optimized structure, which ensures that optimized structure of S9
dye is a true minimum structure. All ab initio calculations are performed in
Gaussian09 package [12].
To analyse the charge population of the dye sensitizer, natural bond orbital (NBO)
analysis is performed on the optimized structure in vacuum using the NBO 3.1
program [13] embedded into Gaussian09 package.
The solvent effects (i.e. DCM) on the absorption spectra and molecular energy
levels are calculated using the polarizable conductor calculation method (CPCM)
[14, 15]. The CPCM model can effectively and accurately compute the influence
of solute-solvent interactions on molecular energies, structures, and properties and
is a particularly good model for large systems such as S9 dye. The model “has
spread in the scientific community due to its accuracy and the relative simplicity
of the expressions involved in the definition of the solvent reaction field” [15]. As
a result, this model is employed to account for the solvent effects (i.e. DCM) on
the absorption spectra and molecular energy levels in the present chapter.
Several hybrid DFT functionals, namely, B3LYP [16], PBE0 [11], and BHandH
(as implemented in Gaussian 09, i.e. BHandH: 0.5*EXHF + 0.5*EX
LSDA + ECLYP)
[17] with the same basis set (6-311G(d)) were employed for the calculations in
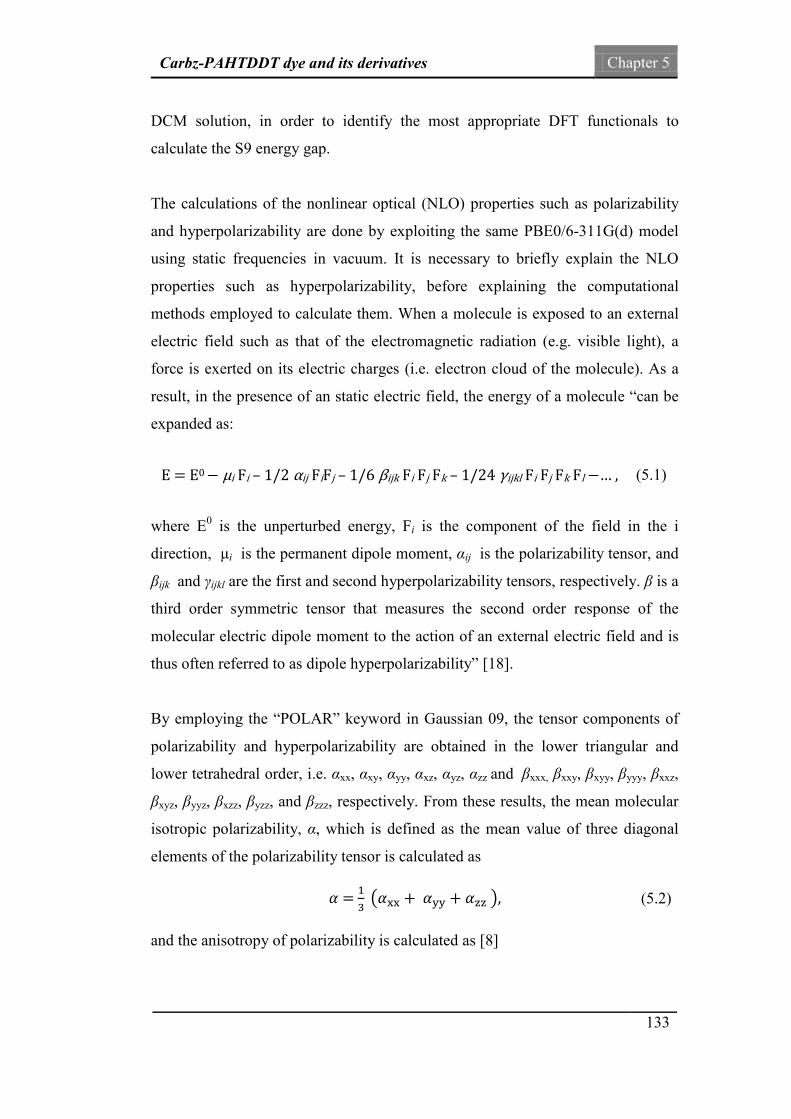
Carbz-PAHTDDT dye and its derivatives Chapter 5
133
DCM solution, in order to identify the most appropriate DFT functionals to
calculate the S9 energy gap.
The calculations of the nonlinear optical (NLO) properties such as polarizability
and hyperpolarizability are done by exploiting the same PBE0/6-311G(d) model
using static frequencies in vacuum. It is necessary to briefly explain the NLO
properties such as hyperpolarizability, before explaining the computational
methods employed to calculate them. When a molecule is exposed to an external
electric field such as that of the electromagnetic radiation (e.g. visible light), a
force is exerted on its electric charges (i.e. electron cloud of the molecule). As a
result, in the presence of an static electric field, the energy of a molecule “can be
expanded as:
E = E0 − μi Fi – 1/2 αij FiFj – 1/6 βijk Fi Fj Fk – 1/24 γijkl Fi Fj Fk Fl −… , (5.1)
where E0 is the unperturbed energy, Fi is the component of the field in the i
direction, μi is the permanent dipole moment, αij is the polarizability tensor, and
βijk and γijkl are the first and second hyperpolarizability tensors, respectively. β is a
third order symmetric tensor that measures the second order response of the
molecular electric dipole moment to the action of an external electric field and is
thus often referred to as dipole hyperpolarizability” [18].
By employing the “POLAR” keyword in Gaussian 09, the tensor components of
polarizability and hyperpolarizability are obtained in the lower triangular and
lower tetrahedral order, i.e. αxx, αxy, αyy, αxz, αyz, αzz and βxxx, βxxy, βxyy, βyyy, βxxz,
βxyz, βyyz, βxzz, βyzz, and βzzz, respectively. From these results, the mean molecular
isotropic polarizability, α, which is defined as the mean value of three diagonal
elements of the polarizability tensor is calculated as
𝛼 = 13
�𝛼xx + 𝛼yy + 𝛼zz �, (5.2)
and the anisotropy of polarizability is calculated as [8]
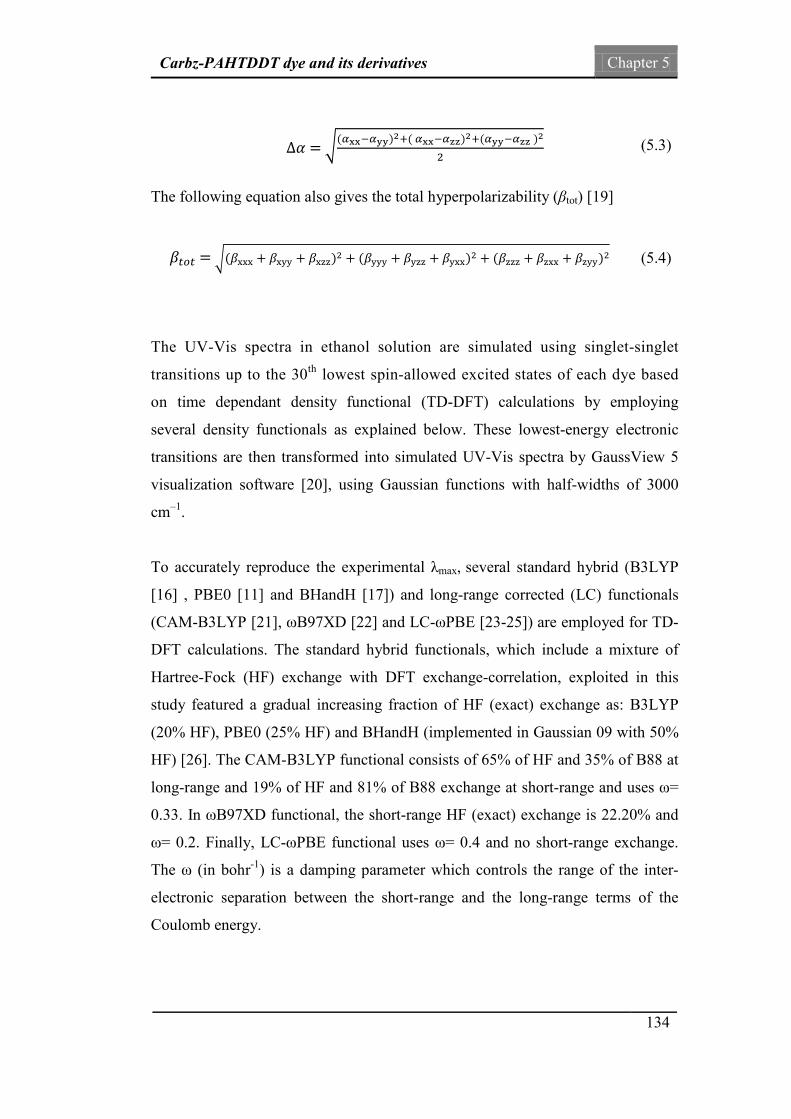
Carbz-PAHTDDT dye and its derivatives Chapter 5
134
∆𝛼 = �(𝛼xx−𝛼yy)2+( 𝛼xx−𝛼zz)2+(𝛼yy−𝛼zz )2
2 (5.3)
The following equation also gives the total hyperpolarizability (βtot) [19]
𝛽𝑡𝑜𝑡 = �(𝛽xxx + 𝛽xyy + 𝛽xzz)2 + (𝛽yyy + 𝛽yzz + 𝛽yxx)2 + (𝛽zzz + 𝛽zxx + 𝛽zyy)2 (5.4)
The UV-Vis spectra in ethanol solution are simulated using singlet-singlet
transitions up to the 30th lowest spin-allowed excited states of each dye based
on time dependant density functional (TD-DFT) calculations by employing
several density functionals as explained below. These lowest-energy electronic
transitions are then transformed into simulated UV-Vis spectra by GaussView 5
visualization software [20], using Gaussian functions with half-widths of 3000
cm–1.
To accurately reproduce the experimental λmax, several standard hybrid (B3LYP
[16] , PBE0 [11] and BHandH [17]) and long-range corrected (LC) functionals
(CAM-B3LYP [21], ωB97XD [22] and LC-ωPBE [23-25]) are employed for TD-
DFT calculations. The standard hybrid functionals, which include a mixture of
Hartree-Fock (HF) exchange with DFT exchange-correlation, exploited in this
study featured a gradual increasing fraction of HF (exact) exchange as: B3LYP
(20% HF), PBE0 (25% HF) and BHandH (implemented in Gaussian 09 with 50%
HF) [26]. The CAM-B3LYP functional consists of 65% of HF and 35% of B88 at
long-range and 19% of HF and 81% of B88 exchange at short-range and uses ω=
0.33. In ωB97XD functional, the short-range HF (exact) exchange is 22.20% and
ω= 0.2. Finally, LC-ωPBE functional uses ω= 0.4 and no short-range exchange.
The ω (in bohr-1) is a damping parameter which controls the range of the inter-
electronic separation between the short-range and the long-range terms of the
Coulomb energy.

Carbz-PAHTDDT dye and its derivatives Chapter 5
135
Two new dyes are also designed and investigated in the current chapter. These
dyes are rationally designed by structural changes in the π-conjugated bridge of
the reference Carbz-PAHTDDT (S9) dye. These derivatives are designed with the
aim of extending the absorption spectra to the near infrared (NIR) region by
reducing the HOMO-LUMO energy gap of the dye sensitizer. Both new dyes are
computationally studied using the same method in the S9 dye study.
5.3. Molecular structures and design of the new dyes
The optimized three dimensional (3D) structure of the Carbz-PAHTDTT dye (S9)
is given in Fig. 5.1. This dye exhibits an electron-rich donor group (D), a π-
conjugated bridge or linker and an acceptor moiety (A) as marked in the figure by
three boxes. As a result, S9 has a D-π-A configuration, which is a common
structure for organic dye sensitizers [27-33].
Fig. 5.1: Optimized 3D structures of the reference Carbz-PAHTDTT (S9) dye sensitizer (red: oxygen; blue: nitrogen; grey: carbon; yellow: sulphur). Note that hydrogen atoms and hexanyl chains are not explicitly displayed.
Lπ

Carbz-PAHTDDT dye and its derivatives Chapter 5
136
A two-carbazole-unit substituted triphenylamine group is employed as the
electron donor unit (D) of the dye. It has been previously shown that this donor
structure suppresses the close π-stacked aggregation between the donor moieties
of dye sensitizers adsorbed onto the surface of TiO2 semiconductor [34].
Aggregation can result in intermolecular quenching and also leads to dye
molecules which are not functionally attached to the semiconductor’s surface and
work like filters [35]. This phenomenon is known to be a detrimental factor of the
efficiency for DSSC which should be avoided either by structural design or by
employing co-adsorbents [36]. The non-coplanar structure of the electron
donating moiety (D) can enhance thermal stability of dye sensitizer molecules by
decreasing the contact between them. Thermal stability of dye sensitizer is an
important factor for long term stability of functional solar cells [34].
The π-bridge (linker, the middle box in Fig. 5.1) consists of five pentagon rings
which are labelled as I, II, III, IV and V in the figure. A dithienothiophene (DTT)
unit forms central part of the π-conjugated bridge of the S9 dye. This moiety leads
to a better stability of the dye sensitizer in high polarity electrolytes used in
DSSC.
To provide additional double conjugation into the linker moiety [37], two hexanyl
(C6H13) chain-substituted thiophene rings (i.e. 3-hexylthiophene or rings I and V
in Fig. 5.1) exist in the π-conjugated bridge of the S9 dye which can form either
trans or cis isomers. A cis-S9 is formed when both of the hexanyl chains (C6H13)
are in the same side of the π-bridge, or a trans-S9 isomer is formed if the hexanyl
chain (C6H13) groups locate on different sides of the π-bridge. The long hexanyl
chains suppress the aggregation of the dye molecules, and also enable longer
electron life time (τ) [38].
The present calculations indicate that the cis-S9 isomer possesses a total energy of
approximately 4.6 kJ⋅mol-1 less than the total energy of the trans conformer,
indicating that the S9 dye slightly favours the cis conformation. Therefore, only
cis conformation will be studied in this chapter (results and discussion of the trans
Carbz-PAHTDDT dye and its derivatives Chapter 5
137
conformation are given in the Appendix A-IV). On the acceptor side of this dye
(A), the conventional acceptor moiety is employed. It contains the cyano group as
an electron withdrawing group and the carboxyl group as an anchoring unit to
attach the dye onto the TiO2 semiconductor.
As was mentioned in Chapter 3, all three moieties of a dye, i.e., the donor, the π-
bridge and the acceptor can be modified to produce new dyes. As mentioned
earlier, in the π-bridge of the S9 dye, a dithienothiophene unit (DTT) is employed.
Kwon et al. who synthesized the S9 dye, have also reported another DTT-based
dye sensitizer (DAHTDTT 13) with a similar structure to the S9 dye, which only
differs in its D group [37]. The absorption spectra of these two dye sensitizers are
very similar for the visible portion of the spectrum, i.e., λ>400 nm (please refer to
Appendix A-V to see the similarity of their absorption spectra). As a result, in the
present chapter, instead of making changes in the D-group and A-group (which is
a standard and commonly used group), the linker (i.e., the π-bridge) of the S9 dye
is modified to produce new dyes. Fig 5.2 shows the 3D structure of the reference
S9 dye and the new dyes S9-D1 and S9-D2.
An aim of the design of the new dyes is to shift the absorption spectra to near
infrared (NIR) region by reducing the HOMO-LUMO energy gap of the new dye
sensitizers. As a result, two new derivatives dyes (S9-D1 and S9-D2) are designed
from the original (cis-) Carbz-PAHTDTT (S9) dye through the modification of
the π-bridge linker. The optimized 3D structures of S9-D1 and S9-D2 are given in
Fig. 5.2(b) and 5.2(c), respectively. In S9-D1, the X1 and X2 groups in S9 dye are
replaced by the −N groups, but in S9-D2 dye, the X1 and X2 groups are substituted
by the −NH groups, respectively.

Carbz-PAHTDDT dye and its derivatives Chapter 5
138
Fig. 5.2: Optimized 3D structures of S9 (a), S9-D1 (b) and S9-D2(c), (red: oxygen; blue: nitrogen; grey: carbon; yellow: sulphur).Note that hydrogen atoms and hexanyl chains are not explicitly displayed. The orange dotted ovals mark where modifications take place.
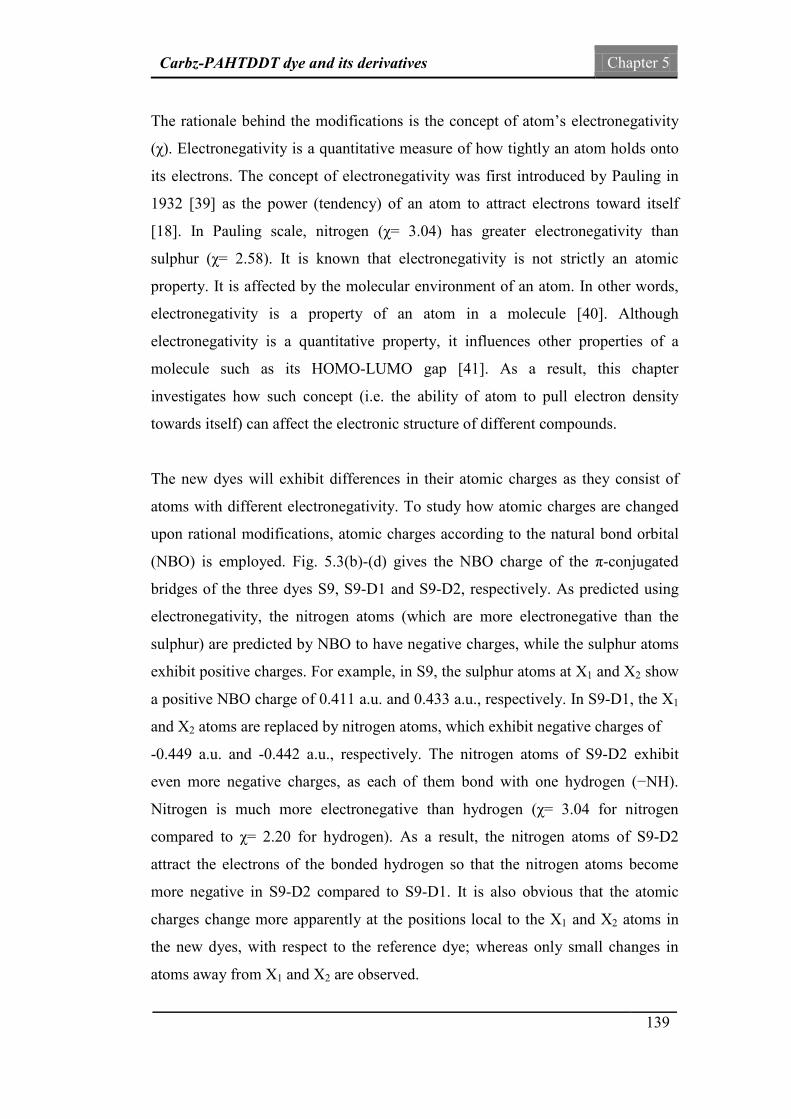
Carbz-PAHTDDT dye and its derivatives Chapter 5
139
The rationale behind the modifications is the concept of atom’s electronegativity
(χ). Electronegativity is a quantitative measure of how tightly an atom holds onto
its electrons. The concept of electronegativity was first introduced by Pauling in
1932 [39] as the power (tendency) of an atom to attract electrons toward itself
[18]. In Pauling scale, nitrogen (χ= 3.04) has greater electronegativity than
sulphur (χ= 2.58). It is known that electronegativity is not strictly an atomic
property. It is affected by the molecular environment of an atom. In other words,
electronegativity is a property of an atom in a molecule [40]. Although
electronegativity is a quantitative property, it influences other properties of a
molecule such as its HOMO-LUMO gap [41]. As a result, this chapter
investigates how such concept (i.e. the ability of atom to pull electron density
towards itself) can affect the electronic structure of different compounds.
The new dyes will exhibit differences in their atomic charges as they consist of
atoms with different electronegativity. To study how atomic charges are changed
upon rational modifications, atomic charges according to the natural bond orbital
(NBO) is employed. Fig. 5.3(b)-(d) gives the NBO charge of the π-conjugated
bridges of the three dyes S9, S9-D1 and S9-D2, respectively. As predicted using
electronegativity, the nitrogen atoms (which are more electronegative than the
sulphur) are predicted by NBO to have negative charges, while the sulphur atoms
exhibit positive charges. For example, in S9, the sulphur atoms at X1 and X2 show
a positive NBO charge of 0.411 a.u. and 0.433 a.u., respectively. In S9-D1, the X1
and X2 atoms are replaced by nitrogen atoms, which exhibit negative charges of
-0.449 a.u. and -0.442 a.u., respectively. The nitrogen atoms of S9-D2 exhibit
even more negative charges, as each of them bond with one hydrogen (−NH).
Nitrogen is much more electronegative than hydrogen (χ= 3.04 for nitrogen
compared to χ= 2.20 for hydrogen). As a result, the nitrogen atoms of S9-D2
attract the electrons of the bonded hydrogen so that the nitrogen atoms become
more negative in S9-D2 compared to S9-D1. It is also obvious that the atomic
charges change more apparently at the positions local to the X1 and X2 atoms in
the new dyes, with respect to the reference dye; whereas only small changes in
atoms away from X1 and X2 are observed.

Carbz-PAHTDDT dye and its derivatives Chapter 5
140
Fig. 5.3: Sketch of the reference S9 dye (a), and the structure of the bridge of S9 (b), S9-D1 (c) and S9-D2 (d) dyes showing NBO charge of atoms in the linker. Note that hexanyl chains are not included.
Lπ

Carbz-PAHTDDT dye and its derivatives Chapter 5
141
The total NBO charges of the π-bridge (linker) in the D-π-A dyes can be either
negative or positive. However, the overall net charge for the donor section (D) of
the dyes is always positive, whereas the acceptor section (A) of the dyes is always
negative [42, 43]. Although new dyes show similar trend in their individual NBO
atomic charges, the total NBO charges (over the linker of the dyes) are not the
same. The total NBO charges over the π-linker of the dyes are calculated at
+0.062 a.u., -0.029 a.u. and +0.118 a.u., for S9, S9-D1 and S9-D2, respectively.
The fact that the original S9 dye and the new dye S9-D2 possess positive charges
of the linker suggests that the π-conjugated bridges of these dyes exhibit electron-
donating character. On the contrary, the negatively charged linker of the S9-D1
dye suggests that the chemical modifications with the –NH group alter the
electron-donating character of the linker in the original dye (S9), to an electron-
withdrawing character in the S9-D1 dye. In following sections, it will be seen that
such a change would affect other properties of the new dyes such as the HOMO-
LUMO energy levels and the UV-Vis absorption spectra of the dyes. It will
shortly be seen that when the total NBO charge decreases from +0.062 a.u in S9
to -0.029 in S9-D1, the LUMO energy level will also be reduced in S9-D1.
Whereas, when the total NBO charges increases from +0.062 a.u in S9 to +0.118
a.u in S9-D2, the HOMO energy level of the S9-D2 dye also increases. Such
results suggest that there might be a correlation between the total NBO charge of
the linker and energy level of the HOMO and the LUMO of dyes.
Table 5.1 lists the important molecular properties of the Carbz-PAHTDTT (S9)
dye (cis isomer) and the new S9-D1 and S9-D2 dyes calculated in vacuum. As all
the dyes are either new dyes (S9-D1 and S9-D2) or recently synthesised dye (S9),
only very limited information is available for comparison. However, the PBE0/6-
311G(d) model has been shown to be reliable in previous studies [11, 44, 45]. The
π-conjugated bridge length (Lπ) of the D-π-A dye is defined as the direct distance
between C(43) and C(61) as shown in Fig. 5.3 (a). It is calculated at 17.14 Å for S9
dye which is shortened in S9-D1 (16.33 Å) and S9-D2 (16.52 Å) as the N atoms
(S9-D1 and S9-D2) have smaller radius than the S atoms (S9). This is also

Carbz-PAHTDDT dye and its derivatives Chapter 5
142
reflected by the calculated molecular sizes (i.e., the electronic spatial extent <R2>)
of the dyes. The dipole moments (μ) of the S9-D2 dye (µ=5.12 Debye) exhibit
very similar values to the original S9 dye (µ=5.10 Debye), whereas the dipole
moment of S9-D1 (6.72 Debye) exhibits larger changes.
5.4. Frontier molecular orbitals
The experimental energy values for the HOMO, LUMO and HOMO-LUMO gap
of the Carbz-PAHTDTT (cis-S9) dye in CH2Cl2 (DCM) solution are estimated at -
5.08 eV, -2.97 eV and 2.11 eV, respectively [1] (Please refer to Appendix A-VI
for more details). The present study employs a number of different DFT
functionals with various levels of exchange energy in order to understand how
exchange energy affects the frontier orbitals. In order to find the most appropriate
functional, the present study exploits three hybrid functionals (B3LYP, PBE0, and
BHandH) calculate the frontier molecular orbital energies of the S9 dye in DCM
solution. These three functionals have an increasing trend in the percentage of HF
(exact) exchange as B3LYP (20%) < PBE0 (25%) < BHandH (50%).
Table 5.1: The selected bond length, dihedrals, π-lengths(a) and dipole moment of the S9, S9-D1 and S9-D2 dyes*[4].
S9 S9-D1 S9-D2
Lπ (a) (Å) 17.14 16.33 16.52
C48-C49 (Å) 1.44 1.37 1.44
X1-C48-C49-X2 (°) -144.91 -179.09 -157.07
X2-C52-C53-S4 (°) 0.93 -0.79 -0.10
S4-C56-C57-S5 (°) 150.10 157.57 148.19
<R2> ( a.u) 275867.82 256546.52 260606.50
μ (Debye) 5.10 6.72 5.12
*Optimized at PBE0/6-311G(d) level. (a) Direct distance of C(43)-C(61).

Carbz-PAHTDDT dye and its derivatives Chapter 5
143
Table 5.2 lists results of the calculated values DFT functionals in DCM solution.
As seen in the first row of this table (Carbz- PAHTDTT results), the B3LYP
functional provides the best agreement with the experiment by less than 0.02 eV
deviations from the experimental values, indicating that the exchange energy in
this case is less important than correlation energy. Results listed in this table
suggest that the same trend exists for the HOMO-LUMO energy gap (Δ) of the
dyes, regardless of the functionals employed to calculate them. That is, ΔS9-D1<
ΔS9-D2< ΔS9. Another result emerged from this table is that for all three dyes, the
Δ values calculated by the BHandH functional are the highest, followed by those
of the PBE0 functional and finally by the B3LYP functional. Since the B3LYP/6-
311G(d) model provides the best agreement with the experimental value, this
model is employed to construct the molecular energy levels graph and isodensity
plots.
Table 5.2: Energy levels of HOMO, LUMO and HOMO-LUMO gap calculated by different functionals in DCM solution.
Structure Model(a) HOMO (eV) LUMO( eV) Δε (eV)
Carbz- PAHTDTT (S9)
Exp. -5.08 -2.97 2.11
B3LYP -5.08 -2.99 2.08
PBE0 -5.31 -2.94 2.37
BHandH -5.90 -2.17 3.72
S9-D1
B3LYP -5.32 -3.66 1.66
PBE0 -5.54 -3.65 1.89
BHandH -6.12 -2.98 3.14
S9-SD2
B3LYP -4.79 -2.91 1.88
PBE0 -5.01 -2.86 2.15
BHandH -5.53 -2.10 3.43
(a) All calculations are performed on the geometries optimized using PBE0 functional in DCM solution. The CPCM model and 6-311G* basis set is employed in all calculations.

Carbz-PAHTDDT dye and its derivatives Chapter 5
144
Fig. 5.4 compares the calculated frontier molecular orbital energy levels of the S9
dye and the new dyes S9-D1 and S9-D2 in DCM solution, focusing on the
HOMO–LUMO energy gap. As seen in this figure, the HOMO-LUMO gap of the
dyes reduces from 2.08 eV in S9 to 1.66 eV in S9-D1 and to 1.88 eV in S9-D2.
Although the energy gaps of both new dyes are reduced with respect to the
reference dye, the mechanism of HOMO-LUMO gap reductions in S9-D1 and S9-
D2 are different. For example, in S9-D1, the most significant change is the
reduction of the LUMO energy, from -2.99 eV in S9 to -3.66 eV in S9-D1. The
energy of the HOMO of S9-D1 also exhibits a small reduction, from -5.08 eV
(S9) to -5.32 eV (S9-D1). On the other hand, the HOMO-LUMO gap reduction in
S9-D2 dye is achieved by shifting up the energy level of the HOMO, from -5.08
eV to -4.79 eV, whereas the energy of the LUMO almost remains the same as -
2.99 eV in S9 and -2.91 eV in S9-D2. From Fig. 5.4, it is noticeable that
modifying the π-conjugated bridge of the reference S9 dye doesn’t produce
sizable impact on the LUMO energy level of S9-D2, while the impact on that of
S9-D1 is very prodigious.
Fig. 5.4: Calculated frontier MO energy levels using B3LYP/6-311G(d) // PBE0/6-311G(d) model in DCM solution.

Carbz-PAHTDDT dye and its derivatives Chapter 5
145
The position of the conduction band minimum (CBM) of TiO2 (i.e. -4.2 eV, taken
from ref. [46]) is also illustrated in this figure. The CBM of TiO2 lies below the
LUMO of the S9 dye and the new dyes S9-D1 and S9-D2. This indicates that
sufficient driving force is provided for ultrafast excited state electron injection as
a main criterion of an effective dye sensitizer. It should also be noted that even
though the LUMO of S9-D1 is closer to the CBM of TiO2 compared to the other
two dyes, it is still above the CBM. This provides enough driving force for the
excited electrons of the S9-D1 to be injected effectively into the conduction band
of TiO2. Moreover, it is well known that adsorption of dye molecules onto the
surface of semiconductor material will change the band energies and is likely to
downshift TiO2 conduction band [47], which can lead to providing even more
driving force for electron injection. The influence of sensitizer adsorption on TiO2
band energies was beyond the scope of the current thesis and warrant further
studies in this direction.
It is worth noting that S9-D1 appears to be a good candidate for the sensitization
of SnO2 semiconductor, too. This is because the conduction band edge of SnO2 is
about 0.5 eV lower than that of TiO2 [31]. This suggests that SnO2 can be a
suitable semiconductor material coupled with S9-D1 dye sensitizer, which is
another advantage of this new dye.
To examine the molecular charge distribution of the dyes, the frontier molecular
orbitals of the reference S9 dye and new dyes “S9-D1” and “S9-D2” are compared
in Fig. 5.5. It is seen that the HOMO and LUMO of S9 exhibit little overlap. That
is, the HOMO dominates the D-region, whereas the LUMO locates in the A-
region. For example, the HOMO of the S9 dye is distributed over the entire
triphenylamine group and mainly nitrogen atoms of the carbazole-units in the D
moiety, and is extended into the π-conjugated bridge over the first hexanyl chain -
substituted thiophene ring and next three fused thiophene rings. For this dye
structure (S9), the LUMO populates the entire cyanoacrylic group in the acceptor
moiety of the dye sensitizer as well as the second hexanyl chain-substituted
thiophene ring in the linker moiety and partially populates the rest of the π-
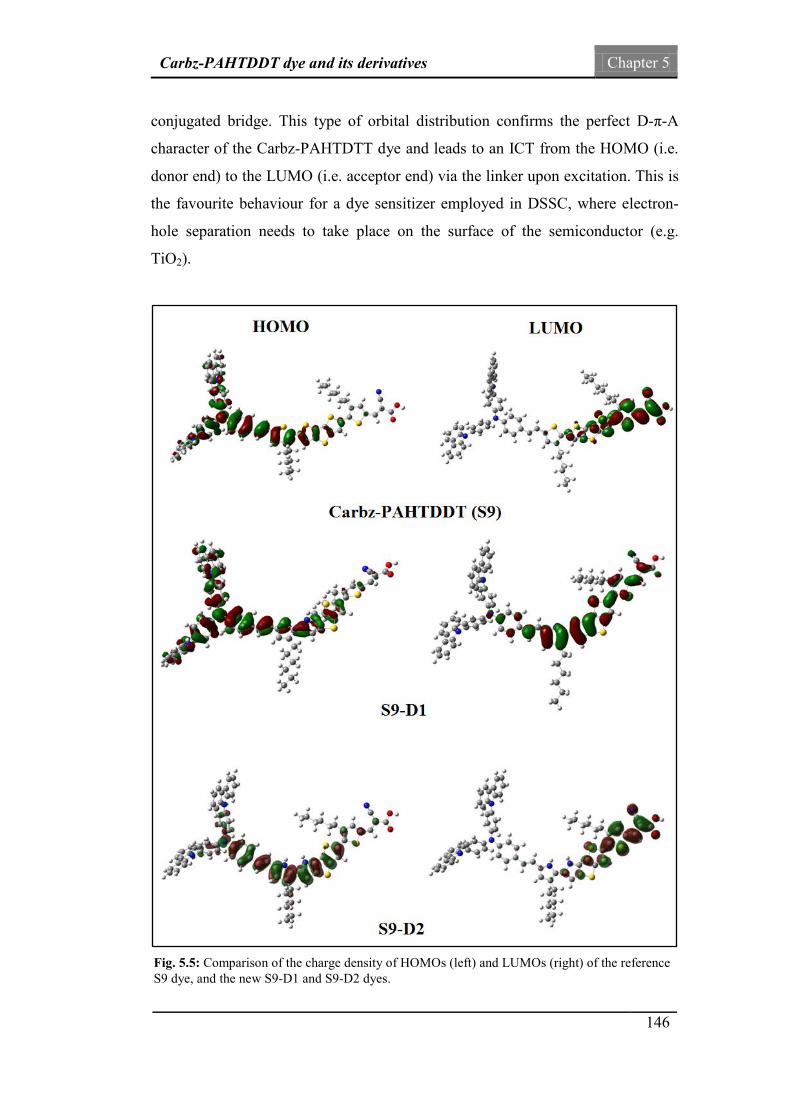
Carbz-PAHTDDT dye and its derivatives Chapter 5
146
conjugated bridge. This type of orbital distribution confirms the perfect D-π-A
character of the Carbz-PAHTDTT dye and leads to an ICT from the HOMO (i.e.
donor end) to the LUMO (i.e. acceptor end) via the linker upon excitation. This is
the favourite behaviour for a dye sensitizer employed in DSSC, where electron-
hole separation needs to take place on the surface of the semiconductor (e.g.
TiO2).
Fig. 5.5: Comparison of the charge density of HOMOs (left) and LUMOs (right) of the reference S9 dye, and the new S9-D1 and S9-D2 dyes.

Carbz-PAHTDDT dye and its derivatives Chapter 5
147
The new dyes, S9-D1 and S9-D2, show some differences from their parent S9
dye. The new dye S9-D1 has similar HOMO distribution to the reference structure
but with more contribution from the carbazole-units in the donor moiety and the
second hexanyl chain-substituted thiophene ring (i.e. ring V) in the linker moiety.
However, the LUMO of S9-D1 populates the linker significantly, and is extended
into a phenyl group in the donor moiety of the dye structure. A small density
decrement is observed on the carboxyl group (A section) which might lead to a
weaker electron coupling with semiconductor surface compared to the reference
S9 structure. Also, S9-D2 dye shows very similar HOMO and LUMO distribution
to the reference S9 dye with the HOMO being slightly shifted from the donor
section toward the π-conjugated bridge. The HOMO-LUMO energy gap
reductions of the new dyes in Fig. 5.4 are also seen in the corresponding orbitals
of the dyes in Fig. 5.5. When the orbitals are more localised, the energies increase,
whereas when the orbitals are more delocalised, the energies decrease.
Fig. 5.4 further shows that the electronic structures of these dyes are in favour of
the high overall efficiency of the solar cells, as explained in previous chapters.
That is, the HOMOs are distributed far away from the acceptor moiety, to prevent
charge recombination (i.e. recombination of the injected electron with oxidized
dye). The LUMOs on the other hand are well located over the acceptor end of the
dye to enhance the electronic coupling between the dye and semiconductor (e.g.
TiO2) and expedite electron injection.
5.5. Nonlinear optical properties
Table 5.3 collects the NLO properties, such as the isotropic polarizability (α),
polarizability anisotropy (Δα) and the first-order hyperpolarizability (βtot) of the
reference S9 dye, as well as the new designed dyes, S9-D1 and S9-S2 dyes. The
full tensor components for α and β are given in Appendix A-VII. As listed in
Table 5.3, the total hyperpolarizabilities, βtot, are calculated as 805 esu for S9,
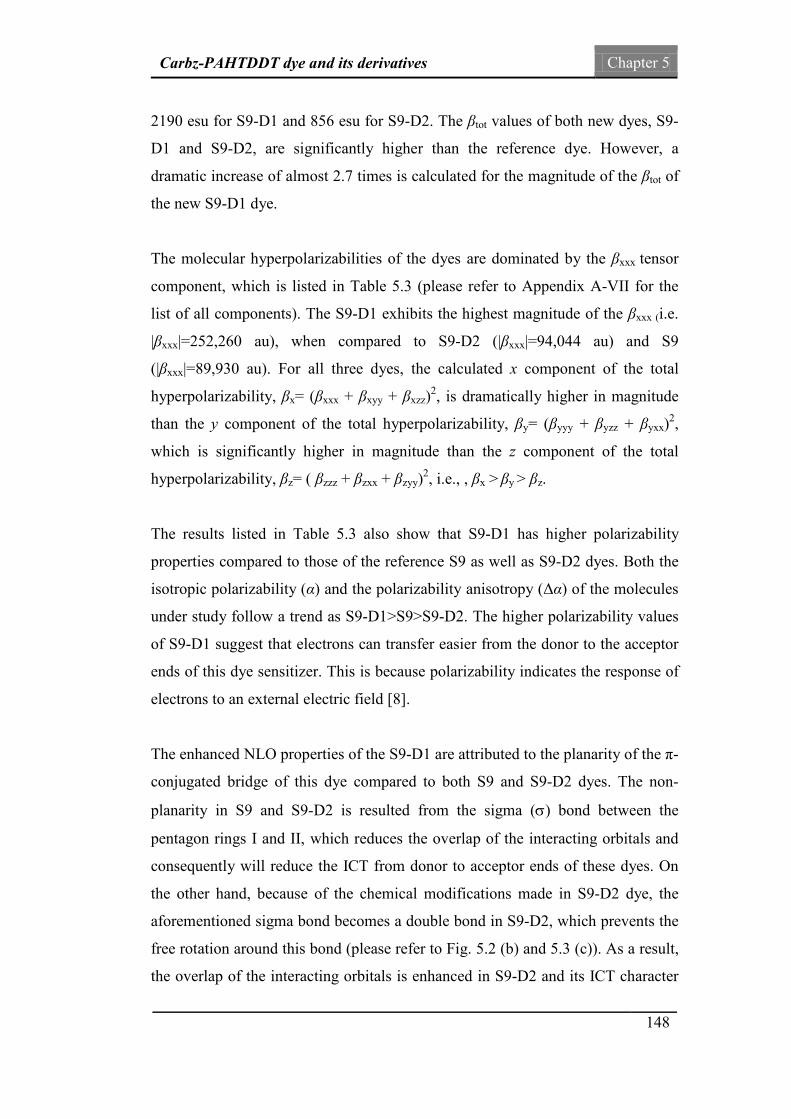
Carbz-PAHTDDT dye and its derivatives Chapter 5
148
2190 esu for S9-D1 and 856 esu for S9-D2. The βtot values of both new dyes, S9-
D1 and S9-D2, are significantly higher than the reference dye. However, a
dramatic increase of almost 2.7 times is calculated for the magnitude of the βtot of
the new S9-D1 dye.
The molecular hyperpolarizabilities of the dyes are dominated by the βxxx tensor
component, which is listed in Table 5.3 (please refer to Appendix A-VII for the
list of all components). The S9-D1 exhibits the highest magnitude of the βxxx (i.e.
|βxxx|=252,260 au), when compared to S9-D2 (|βxxx|=94,044 au) and S9
(|βxxx|=89,930 au). For all three dyes, the calculated x component of the total
hyperpolarizability, βx= (βxxx + βxyy + βxzz)2, is dramatically higher in magnitude
than the y component of the total hyperpolarizability, βy= (βyyy + βyzz + βyxx)2,
which is significantly higher in magnitude than the z component of the total
hyperpolarizability, βz= ( βzzz + βzxx + βzyy)2, i.e., , βx > βy > βz.
The results listed in Table 5.3 also show that S9-D1 has higher polarizability
properties compared to those of the reference S9 as well as S9-D2 dyes. Both the
isotropic polarizability (α) and the polarizability anisotropy (Δα) of the molecules
under study follow a trend as S9-D1>S9>S9-D2. The higher polarizability values
of S9-D1 suggest that electrons can transfer easier from the donor to the acceptor
ends of this dye sensitizer. This is because polarizability indicates the response of
electrons to an external electric field [8].
The enhanced NLO properties of the S9-D1 are attributed to the planarity of the π-
conjugated bridge of this dye compared to both S9 and S9-D2 dyes. The non-
planarity in S9 and S9-D2 is resulted from the sigma (σ) bond between the
pentagon rings I and II, which reduces the overlap of the interacting orbitals and
consequently will reduce the ICT from donor to acceptor ends of these dyes. On
the other hand, because of the chemical modifications made in S9-D2 dye, the
aforementioned sigma bond becomes a double bond in S9-D2, which prevents the
free rotation around this bond (please refer to Fig. 5.2 (b) and 5.3 (c)). As a result,
the overlap of the interacting orbitals is enhanced in S9-D2 and its ICT character
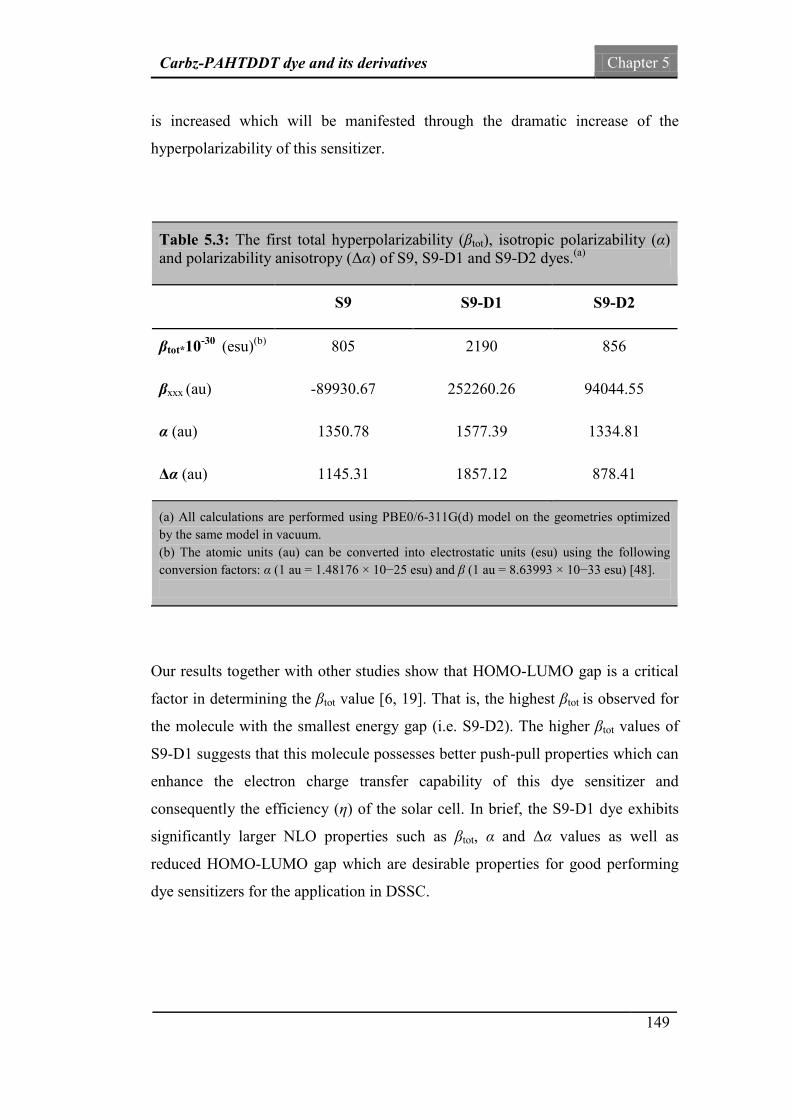
Carbz-PAHTDDT dye and its derivatives Chapter 5
149
is increased which will be manifested through the dramatic increase of the
hyperpolarizability of this sensitizer.
Table 5.3: The first total hyperpolarizability (βtot), isotropic polarizability (α) and polarizability anisotropy (Δα) of S9, S9-D1 and S9-D2 dyes.(a)
S9 S9-D1 S9-D2
βtot*10-30 (esu)(b) 805 2190 856
βxxx (au) -89930.67 252260.26 94044.55
α (au) 1350.78 1577.39 1334.81
Δα (au) 1145.31 1857.12 878.41
(a) All calculations are performed using PBE0/6-311G(d) model on the geometries optimized by the same model in vacuum. (b) The atomic units (au) can be converted into electrostatic units (esu) using the following conversion factors: α (1 au = 1.48176 × 10⁻²⁵ esu) and β (1 au = 8.63993 × 10⁻³³ esu) [48].
Our results together with other studies show that HOMO-LUMO gap is a critical
factor in determining the βtot value [6, 19]. That is, the highest βtot is observed for
the molecule with the smallest energy gap (i.e. S9-D2). The higher βtot values of
S9-D1 suggests that this molecule possesses better push-pull properties which can
enhance the electron charge transfer capability of this dye sensitizer and
consequently the efficiency (η) of the solar cell. In brief, the S9-D1 dye exhibits
significantly larger NLO properties such as βtot, α and Δα values as well as
reduced HOMO-LUMO gap which are desirable properties for good performing
dye sensitizers for the application in DSSC.

Carbz-PAHTDDT dye and its derivatives Chapter 5
150
5.6. Excitation energies and UV-Vis spectra
The experimental absorption spectrum of the S9 dye was measured in the
dichloromethane (DCM) solution [1]. The three main absorption bands in the UV-
Vis spectral region of 300-800 nm of the S9 dye are reported at λ1=491 nm,
λ2=426 nm, and λ3=330 nm [1]. Table 5.4 compares the experimental
measurement with theoretical results using TD-DFT with respect to different DFT
models indicated in the previous section for the original S9 dye. To assess the
overall performance of TD-DFT functionals with reference to the experimental
values in this table, the mean absolute error (MAE) criterion is employed. The
MAE is defined as,
MAE= 1n
� �λicalc. − λi
expt.�n
i=1 , (n=3). (5.5)
The MAEs of the DFT functionals are given in the last row of Table 5.4. In the
table, the CAM-B3LYP model and the BHandH are compatible with MAEs being
14 nm and 18 nm, respectively. Next comes the ωB97XD (MAE=23 nm) and the
LC-ωPBE (MAE=52 nm) models. The PBE0 (MAE=108 nm) and B3LYP
(MAE=149 nm) models exhibit the least accurate performance on prediction of
the spectral line positions. Three long-range (LC) corrected DFT functionals,
namely CAM-B3LYP, ωB97XD and LC-ωPBE show a good general performance
in reproducing the experimental main bands.
Non-LC hybrid functionals are not usually suitable and accurate at large distances
for electron excitations to high orbitals. That is because the non-Coulomb fraction
of exchange functionals usually diminishes very fast. In the range-separated (or
LC) hybrid DFT functionals, the Coulomb energy is divided into long-range and
short-range energies. The HF exchange interaction is included in the long-range
part and the DFT exchange interaction is included in the short-range part [49].
The ω (in bohr-1) parameter is a damping parameter which controls the range of
the inter-electronic separation between these two terms.

Carbz-PAHTDDT dye and its derivatives Chapter 5
151
Table 5.4: Calculated excited energy (in nm), oscillator strengths (f), and transition configurations for the 3 most intense peaks of S9, S9-D1 and S9-D2 dyes in DCM solution*.
Carbz-PAHTDTT(S9) S9-D1 S9-D2
Method TD-B3LYP TD-PBE0 TD-LC-ωPBE TD-ωB97XD TD-CAM-B3LYP
TD-BHandH Exp.(a) TD-BHandH ∆λ(b) TD-BHandH ∆λ(c)
λ1 668 (1.12) 611 (1.48) 420 (2.83) 460 (2.87) 479 (2.74) 490 (2.71) 491 (3.0) 662 (2.55)
172 535 (2.17) 45
H→L (97%) H-1→L (2%)
H→L (90%) H-1→L (6%) H→L+1 (3%)
H-1→L (29%) H→L (25%) H→L+1 (12%) H-3→L (10%) H-6→L (6%) H-6→L+1 (3%) H-1→L+2 (2%)
H→L (32%) H-1→L (28%) H→L+1 (15%) H-3→L (9%) H-6→L (4%) H-6→L+1 (2%)
H-1→L (28%) H→L (40%) H→L+1 (13%) H-3→L (8%) H-6→L (3%)
H→L (52%) H-1→L (23%) H→L+1 (12%) H-3→L (6%)
H→L (78%) H-1→L (14%) H-7→L (2%)
H→L (76%) H-1→L (9%) H→L+1 (5%) H-3→L (5%)
λ2 540 (0.80)
498 (0.71) 365 (0.43)
391 (0.40) 401 (0.40)
402 (0.39)
426 (2.7) 528 (0.13) 126 394 (0.84) -8
H-1→L (91%) H→L+1 (4%) H→L (3%)
H-1→L (82%) H→L (8%) H-3→L (5%) H→L+1 (4%)
H→L+1 (48%) H-6→L (10%) H-3→L (10%) H-1→L (6%) H→L+2 (4%) H-8→L (3%) H-1→L+1 (3%) H-1→L+7 (2%) H-3→L+1 (2%)
H→L+1 (53%) H-3→L (11%) H-6→L (9%) H-1→L (9%) H→L+2 (4%) H-1→L+7 (2%) H-8→L (2%)
H→L+1 (57%) H-1→L (11%) H-3→L(10%) H-6→L (7%) H→L+2 (4%)
H→L+1 (60%) H-1→L (14%) H-3→L (10%) H-6→L (5%) H→L+2 (3%)
H-3→L (45%) H-6→L (26%) H-1→L (17%) H→L (4%)
H→L+1 (72%) H-1→L (7%) H-3→L (6%) H-6-→L (2%)
λ3 488 (1.10)
463 (0.94)
306 (0.29)
325 (0.29) 335 (0.33)
360 (0.29) 330 (2.5) 440 (0.21)
80 374 (0.52)
14
H→L+1(88%) H-1→L (5%) H-3→L (3%)
H→L+1 (89%) H-1→L (6%)
H→L+2 (27%) H-1→L+1(21%) H-8→L (12%) H-3→L+1 (7%) H-6→L (6%) H→L+7 (5%) H-1→L+2 (2%)
H-1→L+1(26%) H→L+2 (26%) H-8→L (11%) H-6→L (9%) H-3→L+1 (6%) H→L+7 (5%)
H→L (38%) H-6→L (15%) H-3→L (11%) H→L+2 (10%) H→L+1 (9%) H-8→L (8%) H-1→L (3%)
H→L (44%) H-1→L (20%) H→L+1 (13%) H-3→L (9%) H-6→L (5%) H-1→L+1(3%)
H-1→L (45%) H-6→L (30%) H→L (8%) H-8→L (4%) H→L+1 (4%) H-3→L+1 (2%) H-7→L+1 (2%)
H-6→L (10%) H-3→L (22%) H-1→L (29%) H→L (22%) H→L+1 (11%) H-8→L (4%)
MAE 149 108 52 23 14 18 * All TD-DFT calculations are performed in DCM solution using CPCM solvation model on geometries optimized at CPCM-PBE0/6-311G(d). (a)See supplementary information of [1]. (b)∆λ= λ(S9-D1)-λ(S9), method= TD-BHandH. (c)∆λ= λ(S9-D2)-λ(S9), method= TD-BHandH.

Carbz-PAHTDDT dye and its derivatives Chapter 5
152
The results in Table 5.4 also suggest that without long-range corrections, the
inclusion of the Hartree-Fock (HF) exchange energy is important to reproduce the
major band, λ1. The TD-BHandH DFT model gives the major absorption peaks of
the S9 dye the most accurate results and the TD-B3LYP DFT model produces the
least accurate results in the table. For example, the TD-BHandH DFT model
almost reproduces the spectral line position of the major absorption band at λ1=
490 nm with respect to the experiment at λ1=491 nm. This model also closely
reproduces the other minor bands at λ2=402 nm (expt. 426 nm) and λ2=360 nm
(expt. 330 nm).Without sufficient inclusion of the exchange energy in the DFT
functionals, the B3LYP and PBE0 hybrid functionals are unable to produce
spectral band positions with sufficient accuracy as seen previously [50, 51].
Table 5.4 also collects the excitation energies, oscillator strengths, and transition
configurations for the three main absorption bands of all three dyes (i.e. S9, S9-
D1 and S9-D2) and the corresponding UV-Vis absorption spectra of these dyes
are plotted in Fig. 5.6. From Table 5.4, it is also noticeable that the calculated
vertical electronic transitions obtained by the best performing functionals for TD-
DFT calculations in this study, i.e. BHandH and CAM-B3LYP, have very similar
assignments. On the other hand, the assignments resulted from other functionals
are different in terms of both the molecular orbitals involved and the percentage
(weight) of the contributions.
The BHandH functional is employed for the TD-DFT calculations of the new
dyes. As mentioned in Chapter 1, the most important absorption region of dye
sensitizers for the application in DSSC is the one close to infra-red region. This
means that the absorption bands at λ1 followed by λ2 are more important than λ3in
the present study. From the MAE results over all three bands, it can be seen that
both CAM-B3LYP and BHandH functional outperformed other functionals in this
study. However, BHandH functional gives the most accurate band positions for
the most important bands, λ1 and λ2, compared to all other functionals. The
accuracy of the calculations at this region is more important, which justify the use

Carbz-PAHTDDT dye and its derivatives Chapter 5
153
of BHandH functional in the TD-DFT calculations of the new rationally designed
dyes.
The effect of modifications on shifting the spectral peaks is also reflected in Table
5.4 and Fig. 5.6. For S9-D1, a remarkable bathochromic shift (i.e. to the longer
wavelengths or red-shift) of 172 nm on λ1 compared to the reference S9 dye is
observed. Based on the results of TD-DFT calculations, this band is mainly
composed of an excitation transition from HOMO → LUMO both for the
reference S9 dye (i.e. 52% contribution from H→L transition) and for the new S9-
D1 dye (i.e. 78% contribution from H→L transition). As discussed earlier, the
energy gap between HOMO and LUMO of S9-D1 is significantly reduced
compared to that of the S9 dye, which in turn results in the red-shift of λ1 as seen
in Fig. 5.6. Very large red-shifts of λ2 and λ3 are also observed for S9-D1
compared to the S9 dye.
The λ1 band of the new dye S9-D1 indeed outperforms the original Carbz-
PAHTDTT (S9) dye with not only a significant preferred spectral shift on the
position of this band, but also this band covers a broader region with nearly
doubled full width at half maximum (FWHM) than the original S9 dye. The
significant bathochromic shift and broadening of the UV-Vis spectra of S9-D1
structure indicates its enhanced light harvesting capability which is an important
criterion for a well-performing dye sensitizer employed in DSSC. In the S9-D2
dye, the λ1 and λ3 spectral bands both show a preferred bathochromic shift of 44
nm compared to the S9 dye. However, an unwanted hypsochromic shift (i.e. to the
shorter wavelengths or blue-shift) of -32 nm on the λ2 spectral band was
calculated for this (S9-D2) dye.

Carbz-PAHTDDT dye and its derivatives Chapter 5
154
5.7. Summary and conclusions
The present chapter was to study the Carbz-PAHTDTT (S9) organic dye
sensitizer and its rationally-designed derivatives, theoretically. An investigation to
search for the accurate and reliable first-principles quantum-mechanical models
for this large-sized dye sensitizer was performed. On the basis of the agreement
with available experimental data, the B3LYP/6-311G(d)// PBE0/6-311G(d) model
Fig. 5.6: The simulated UV-Vis spectra of three dyes, S9, S9-D1 and S9-D2 using TD-BHandH/6-311G(d) model in DCM solution. The electronic transitions are transformed into simulated UV-Vis spectra using Gaussian functions with half-widths of 3000 cm–1[4].

Carbz-PAHTDDT dye and its derivatives Chapter 5
155
in DCM solution reproduced the energy levels of HOMO and LUMO more
accurately. However, to accurately produce the UV-Vis spectra of the dyes, it is
found that the long-range corrected functionals yielded better agreement with the
experiment in general.
By utilizing the mean average error (MAE) criterion over all three bands, the
functionals used for TD-DFT calculations were ranked. The CAM-B3LYP
followed by BHandH functionals gave the least deviation from experiment over
the three main absorption bands of the S9 dye. However, the half and half
BHandH functional, which outperformed all other functionals to reproduce the
spectral region of our interest (i.e. λ1 and λ2), was chosen to predict the absorption
spectra of the rationally designed new dyes S9-D1 and S9-D2. These new dyes
were rationally designed by modifying the π-conjugated bridge of the reference
S9 dye. The modifications were made by substituting two of the sulphur atoms of
the reference dye with −N (in S9-D1) or −NH group (in S9-D2).
Both new dyes showed red-shifted and broadened absorption spectra, reduced
HOMO-LUMO gap, better NLO properties as well as noticeable redistribution of
the electron density compared to the reference dye. However, such improvements
were much more noticeable and significant in new S9-D1 dye compared to S9-
D2. A correlation was observed between the total NBO of the linker of the dyes
with their corresponding HOMO or LUMO energy levels. Furthermore, based on
the LUMO energy level of the new dye S9-D1, it was also suggested that this dye
sensitizer is a suitable candidate for the effective sensitization of both TiO2 and
SnO2 semiconductors. The present study explored a useful direction of rational
design for new dyes in DSSC.

Carbz-PAHTDDT dye and its derivatives Chapter 5
156
References
1. T. Daeneke, T.-H. Kwon, A.B. Holmes, N.W. Duffy, U. Bach and L. Spiccia, High-efficiency dye-sensitized solar cells with ferrocene-based electrolytes. Nature Chemistry, 2011. 3(3): p. 211-215.
2. B.A. Gregg, F. Pichot, S. Ferrere and C.L. Fields, Interfacial Recombination Processes in Dye-Sensitized Solar Cells and Methods To Passivate the Interfaces. The Journal of Physical Chemistry B, 2001. 105(7): p. 1422-1429.
3. T.W. Hamann, O.K. Farha and J.T. Hupp, Outer-Sphere Redox Couples as Shuttles in Dye-Sensitized Solar Cells. Performance Enhancement Based on Photoelectrode Modification via Atomic Layer Deposition. The Journal of Physical Chemistry C, 2008. 112(49): p. 19756-19764.
4. N. Mohammadi and F. Wang, First-principles study of Carbz-PAHTDDT dye sensitizer and two Carbz-derived dyes for dye sensitized solar cells. Journal of Molecular Modeling, 2014. 20(3): p. 1-9.
5. M. Zajac, P. Hrobárik, P. Magdolen, P. Foltínová and P. Zahradník, Donor–π-acceptor benzothiazole-derived dyes with an extended heteroaryl-containing conjugated system: synthesis, DFT study and antimicrobial activity. Tetrahedron, 2008. 64(46): p. 10605-10618.
6. J. Hung, W. Liang, J. Luo, Z. Shi, A.K.Y. Jen and X. Li, Rational Design Using Dewar’s Rules for Enhancing the First Hyperpolarizability of Nonlinear Optical Chromophores. The Journal of Physical Chemistry C, 2010. 114(50): p. 22284-22288.
7. V.B. Jothy, D. Sajan, C. Ravikumar, I. Němec, C.-N. Xia, V.K. Rastogi and I.H. Joe, First order molecular hyperpolarizabilities and intramolecular charge transfer from the vibrational spectra of NLO material: ethyl-3-(3, 4-dihydroxyphenyl)-2-propenoate. Journal of Raman Spectroscopy, 2009. 40(12): p. 1822-1830.
8. M.-J. Lee, M. Balanay and D. Kim, Molecular design of distorted push–pull porphyrins for dye-sensitized solar cells. Theoretical Chemistry Accounts, 2012. 131(9): p. 1-12.
9. T. Edvinsson, C. Li, N. Pschirer, J. Schöneboom, F. Eickemeyer, R. Sens, G. Boschloo, A. Herrmann, K. Müllen and A. Hagfeldt, Intramolecular Charge-Transfer Tuning of Perylenes: Spectroscopic Features and Performance in Dye-Sensitized Solar Cells. The Journal of Physical Chemistry C, 2007. 111(42): p. 15137-15140.

Carbz-PAHTDDT dye and its derivatives Chapter 5
157
10. H. Tian, X. Yang, J. Pan, R. Chen, M. Liu, Q. Zhang, A. Hagfeldt and L. Sun, A Triphenylamine Dye Model for the Study of Intramolecular Energy Transfer and Charge Transfer in Dye-Sensitized Solar Cells. Advanced Functional Materials, 2008. 18(21): p. 3461-3468.
11. C. Adamo and V. Barone, Toward reliable density functional methods without adjustable parameters: The PBE0 model. Chinese Journal of Chemical Physics, 1999. 110(13): p. 6158-6170.
12. G.W.T. M. J. Frisch, H. B. Schlegel, G. E. Scuseria, M. A. Robb, J. R. Cheeseman, G. Scalmani, V. Barone, B. Mennucci, G. A. Petersson, H. Nakatsuji, M. Caricato, X. Li, H. P. Hratchian, A. F. Izmaylov, J. Bloino, G. Zheng, J. L. Sonnenberg, M. Hada, M. Ehara, K. Toyota, R. Fukuda, J. Hasegawa, M. Ishida, T. Nakajima, Y. Honda, O. Kitao, H. Nakai, T. Vreven, J. A. Montgomery, Jr., J. E. Peralta, F. Ogliaro, M. Bearpark, J. J. Heyd, E. Brothers, K. N. Kudin, V. N. Staroverov, R. Kobayashi, J. Normand, K. Raghavachari, A. Rendell, J. C. Burant, S. S. Iyengar, J. Tomasi, M. Cossi, N. Rega, J. M. Millam, M. Klene, J. E. Knox, J. B. Cross, V. Bakken, C. Adamo, J. Jaramillo, R. Gomperts, R. E. Stratmann, O. Yazyev, A. J. Austin, R. Cammi, C. Pomelli, J. W. Ochterski, R. L. Martin, K. Morokuma, V. G. Zakrzewski, G. A. Voth, P. Salvador, J. J. Dannenberg, S. Dapprich, A. D. Daniels, Ö. Farkas, J. B. Foresman, J. V. Ortiz, J. Cioslowski, and D. J. Fox, Gaussian, Inc., Wallingford CT, Gaussian 09. 2009, Gaussian, Inc.: Wallingford CT.
13. A.E.R. E. D. Glendening, J. E. Carpenter, and F. Weinhold, NBO Version 3.1.
14. V. Barone and M. Cossi, Quantum calculation of molecular energies and energy gradients in solution by a conductor solvent model. Journal of Physical Chemistry A, 1998. 102(11): p. 1995-2001.
15. M. Cossi, N. Rega, G. Scalmani and V. Barone, Energies, structures, and electronic properties of molecules in solution with the C-PCM solvation model. Journal of Computational Chemistry, 2003. 24(6): p. 669-681.
16. A.D. Becke, A new mixing of Hartree--Fock and local density-functional theories. The Journal of Chemical Physics, 1993. 98(2): p. 1372-1377.
17. A.D. Becke, Density-functional thermochemistry. III. The role of exact exchange. The Journal of Chemical Physics, 1993. 98(7): p. 5648-5652.
18. V.I. Minkin, Glossary of terms used in theoretical organic chemistry (IUPAC recommendations 1999). Pure and Applied Chemistry, 1999. 71(10): p. 1919-1981.
19. K.S. Thanthiriwatte and K.M. Nalin de Silva, Non-linear optical properties of novel fluorenyl derivatives—ab initio quantum chemical
Carbz-PAHTDDT dye and its derivatives Chapter 5
158
calculations. Journal of Molecular Structure: THEOCHEM, 2002. 617(1–3): p. 169-175.
20. Roy Dennington, Todd Keith and J. Millam, GaussView, Version 5. 2009, Semichem Inc. Shawnee Mission KS.
21. T. Yanai, D.P. Tew and N.C. Handy, A new hybrid exchange–correlation functional using the Coulomb-attenuating method (CAM-B3LYP). Chemical Physics Letters, 2004. 393(1–3): p. 51-57.
22. J.-D. Chai and M. Head-Gordon, Long-range corrected hybrid density functionals with damped atom-atom dispersion corrections. Physical Chemistry Chemical Physics, 2008. 10(44): p. 6615-6620.
23. O.A. Vydrov and G.E. Scuseria, Assessment of a long-range corrected hybrid functional. The Journal of Chemical Physics, 2006. 125(23): p. 234109-9.
24. O.A. Vydrov, J. Heyd, A.V. Krukau and G.E. Scuseria, Importance of short-range versus long-range Hartree-Fock exchange for the performance of hybrid density functionals. The Journal of Chemical Physics, 2006. 125(7): p. 074106-9.
25. O.A. Vydrov, G.E. Scuseria and J.P. Perdew, Tests of functionals for systems with fractional electron number. The Journal of Chemical Physics, 2007. 126(15): p. 154109-9.
26. Y. Zhao and D.G. Truhlar, Density Functionals for Noncovalent Interaction Energies of Biological Importance. Journal of Chemical Theory and Computation, 2006. 3(1): p. 289-300.
27. Y. Ooyama, N. Yamaguchi, I. Imae, K. Komaguchi, J. Ohshita and Y. Harima, Dye-sensitized solar cells based on D-[small pi]-A fluorescent dyes with two pyridyl groups as an electron-withdrawing-injecting anchoring group. Chemical Communications, 2013. 49(25): p. 2548-2550.
28. M.K.R. Fischer, S. Wenger, M. Wang, A. Mishra, S.M. Zakeeruddin, M. Grätzel and P. Bäuerle, D-π-A Sensitizers for Dye-Sensitized Solar Cells: Linear vs Branched Oligothiophenes. Chemistry of Materials, 2010. 22(5): p. 1836-1845.
29. M. Marszalek, S. Nagane, A. Ichake, R. Humphry-Baker, V. Paul, S.M. Zakeeruddin and M. Gratzel, Structural variations of D-π-A dyes influence on the photovoltaic performance of dye-sensitized solar cells. RSC Advances, 2013. 3(21): p. 7921-7927.
30. H. Li, T.M. Koh, A. Hagfeldt, M. Gratzel, S.G. Mhaisalkar and A.C. Grimsdale, New donor-π-acceptor sensitizers containing 5H-
Carbz-PAHTDDT dye and its derivatives Chapter 5
159
[1,2,5]thiadiazolo [3,4-f]isoindole-5,7(6H)-dione and 6H-pyrrolo[3,4-g]quinoxaline-6,8(7H)-dione units. Chemical Communications, 2013. 49(24): p. 2409-2411.
31. A. Hagfeldt, G. Boschloo, L. Sun, L. Kloo and H. Pettersson, Dye-Sensitized Solar Cells. Chemical Reviews, 2010. 110(11): p. 6595-6663.
32. Z.-S. Wang and F. Liu, Structure-property relationships of organic dyes with D-π-A structure in dye-sensitized solar cells. Frontiers of Chemistry in China, 2010. 5(2): p. 150-161.
33. A. Mishra, M.K.R. Fischer and P. Bauerle, Metal-Free Organic Dyes for Dye-Sensitized Solar Cells: From Structure: Property Relationships to Design Rules. Angewandte Chemie-International Edition, 2009. 48(14): p. 2474-2499.
34. Z. Ning, Q. Zhang, W. Wu, H. Pei, B. Liu and H. Tian, Starburst triarylamine based dyes for efficient dye-sensitized solar cells. The Journal of Organic Chemistry, 2008. 73(10): p. 3791-7.
35. D.P. Hagberg, T. Edvinsson, T. Marinado, G. Boschloo, A. Hagfeldt and L. Sun, A novel organic chromophore for dye-sensitized nanostructured solar cells. Chemical Communications, 2006(21): p. 2245-2247.
36. J.-J. Cid, J.-H. Yum, S.-R. Jang, M.K. Nazeeruddin, E. Martínez-Ferrero, E. Palomares, J. Ko, M. Grätzel and T. Torres, Molecular cosensitization for efficient panchromatic dye-sensitized solar cells. Angewandte Chemie International Edition, 2007. 46(44): p. 8358-62.
37. T.-H. Kwon, V. Armel, A. Nattestad, D.R. MacFarlane, U. Bach, S.J. Lind, K.C. Gordon, W. Tang, D.J. Jones and A.B. Holmes, Dithienothiophene (DTT)-based dyes for dye-sensitized solar cells: synthesis of 2,6-dibromo-DTT. The Journal of Organic Chemistry, 2011. 76(10): p. 4088-93.
38. N. Koumura, Z.-S. Wang, S. Mori, M. Miyashita, E. Suzuki and K. Hara, Alkyl-Functionalized Organic Dyes for Efficient Molecular Photovoltaics. Journal of the American Chemical Society, 2006. 128(44): p. 14256-14257.
39. L. Pauling, THE NATURE OF THE CHEMICAL BOND. IV. THE ENERGY OF SINGLE BONDS AND THE RELATIVE ELECTRONEGATIVITY OF ATOMS. Journal of the American Chemical Society, 1932. 54(9): p. 3570-3582.
40. L. Pauling, The Nature of the Chemical Bond and the Structure of Molecules and Crystals: An Introduction to Modern Structural Chemistry. 1960: Cornell University Press.
Carbz-PAHTDDT dye and its derivatives Chapter 5
160
41. C.-G. Zhan, J.A. Nichols and D.A. Dixon, Ionization Potential, Electron Affinity, Electronegativity, Hardness, and Electron Excitation Energy: Molecular Properties from Density Functional Theory Orbital Energies. The Journal of Physical Chemistry A, 2003. 107(20): p. 4184-4195.
42. C.-R. Zhang, Z.-J. Liu, Y.-H. Chen, H.-S. Chen, Y.-Z. Wu, W. Feng and D.-B. Wang, DFT and TD-DFT study on structure and properties of organic dye sensitizer TA-St-CA. Current Applied Physics, 2010. 10(1): p. 77-83.
43. C.-R. Zhang, L. Liu, J.-W. Zhe, N.-Z. Jin, Y. Ma, L.-H. Yuan, M.-L. Zhang, Y.-Z. Wu, Z.-J. Liu and H.-S. Chen, The role of the conjugate bridge in electronic structures and related properties of tetrahydroquinoline for dye sensitized solar cells. International journal of molecular sciences, 2013. 14(3): p. 5461-5481.
44. N. Mohammadi, P.J. Mahon and F. Wang, Toward rational design of organic dye sensitized solar cells (DSSCs): an application to the TA-St-CA dye. Journal of Molecular Graphics and Modelling, 2013. 40: p. 64-71.
45. A.Y. Rogachev, Y. Sevryugina, A.S. Filatov and M.A. Petrukhina, Corannulene vs. C60-fullerene in metal binding reactions: A direct DFT and X-ray structural comparison. Dalton Transactions, 2007. 0(35): p. 3871-3873.
46. M. Gratzel, Photoelectrochemical cells. Nature, 2001. 414(6861): p. 338-44.
47. F. De Angelis, S. Fantacci, A. Selloni, M. Grätzel and M.K. Nazeeruddin, Influence of the Sensitizer Adsorption Mode on the Open-Circuit Potential of Dye-Sensitized Solar Cells. Nano Letters, 2007. 7(10): p. 3189-3195.
48. M.P. Balanay and D.H. Kim, Optical properties of porphyrin analogues for solar cells: An NLO approach. Current Applied Physics, 2011. 11(1): p. 109-116.
49. B. Tian, E.S.E. Eriksson and L.A. Eriksson, Can Range-Separated and Hybrid DFT Functionals Predict Low-Lying Excitations? A Tookad Case Study. Journal of Chemical Theory and Computation, 2010. 6(7): p. 2086-2094.
50. A. Dreuw and M. Head-Gordon, Failure of Time-Dependent Density Functional Theory for Long-Range Charge-Transfer Excited States: The Zincbacteriochlorin−Bacteriochlorin and Bacteriochlorophyll−Spheroidene Complexes. Journal of the American Chemical Society, 2004. 126(12): p. 4007-4016.

Carbz-PAHTDDT dye and its derivatives Chapter 5
161
51. Y. Tawada, T. Tsuneda, S. Yanagisawa, T. Yanai and K. Hirao, A long-range-corrected time-dependent density functional theory. The Journal of Chemical Physics, 2004. 120(18): p. 8425-8433.
162
Chapter 6
Ferrocene “The measure of greatness in a scientific idea is the extent to which it stimulates
thought and opens up new lines of research.” Paul Dirac
6.1. Introduction
In recent years, there has been an increasing interest in developing and employing
new materials (e.g. redox mediators based on ferrocene-derivatives [1]), as a route
to improve the conversion efficiency of dye sensitized solar cells (DSSC). As
aforementioned in chapter five of this thesis, the recently-reported impressive
results obtained by using ferrocene-based redox shuttle in combination with
Carbz-PAHTDTT (S9) organic dye sensitizer [2] stimulated the theoretical
investigation of the structure of the S9 dye sensitizer as well as the ferrocene
compound. While chapter five had focussed on the S9 dye sensitizer, the present
chapter will probe an accurate description of the electronic structure of the
ferrocene complex.
Ferrocene was first discovered unintentionally a few decades ago. Two
independent groups reported the preparation of an orange colour substance from
cyclopentadiene (Cp) and iron with C10H10Fe formula, which showed a

Ferrocene Chapter 6
163
remarkable stability [3, 4]. The correct structure of this compound has been a
disputed subject within the field of organometallic chemistry [5, 6]. As a result, a
substantial part of this chapter is devoted to the study of the ferrocene structure
and its conformers. Apart from the methods section (6.2), this chapter is divided
into two main sections. Section 6.3 investigates the structure of the ferrocene
conformers. The main issues addressed in this section are: a) geometries and
potential energy scan (PES), b) molecular electrostatic potential (MEP) and c)
infrared (IR) spectroscopy of ferrocene both in vacuum and solution. The second
section of this chapter (i.e. section 6.4) focuses on the molecular properties of this
compound that are related to its application as a redox mediator in dye sensitized
solar cells (DSSC). A very accurate DFT model for the calculation of the redox
potential of Fc/Fc+ couple will be presented in this section.
6.2. Computational methods and experimental details
All calculations are performed using Gaussian 09 computational chemistry
package [7], unless stated otherwise. Geometry optimizations of the ferrocene
conformers are carried out using the B3LYP/m6-31G(d) model. The basis set m6-
31G(d), a modified version of the 6-31G(d), is employed in the calculations [8].
This basis set incorporates necessary diffuse d-type functions for the first-row
transition metals such as Fe. It exhibits a better performance than the conventional
6-31G(d) basis set for the iron atom in ferrocene by providing a more appropriate
description for the important energy difference between the atomic 3dn4s1 and
3dn-14s2 states [9].
A potential energy scan (PES) is performed by rotating the central
cyclopentadienyl axis which is defined by a dihedral angle δ (C(1)−X(2)−Fe(3)−C(4))
which connects the centres (X(1)−X(2)) of each cyclopentadienyl planes through
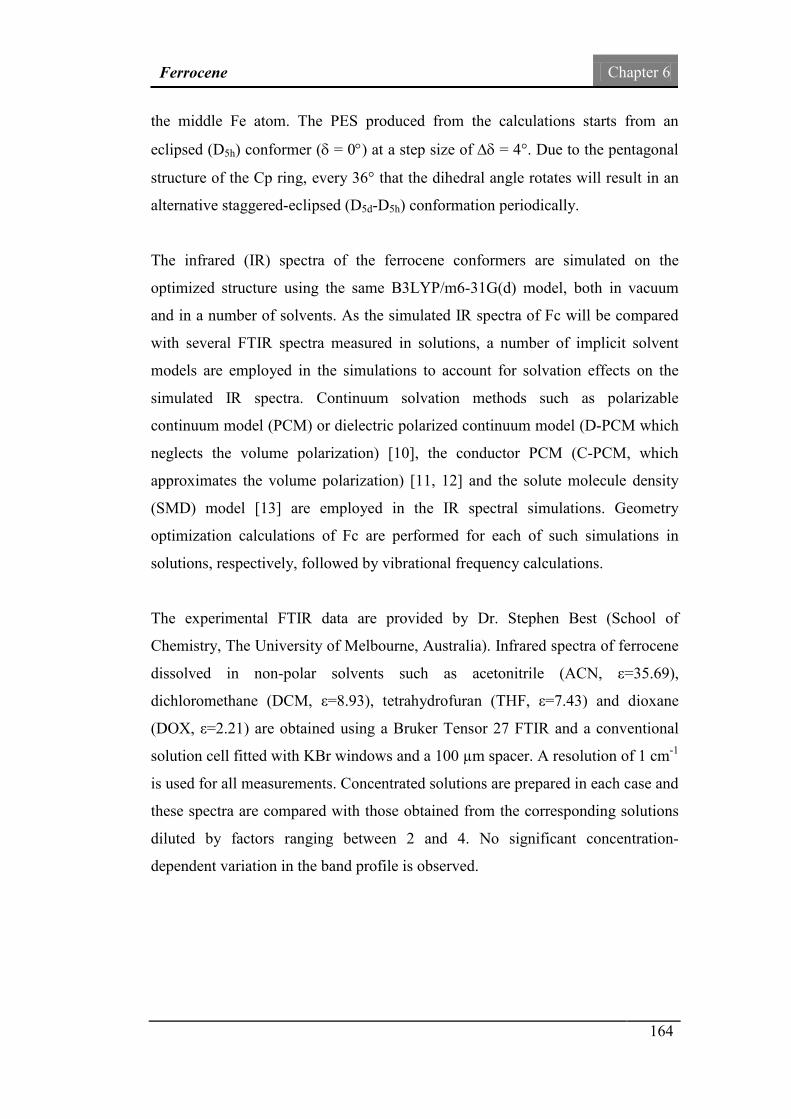
Ferrocene Chapter 6
164
the middle Fe atom. The PES produced from the calculations starts from an
eclipsed (D5h) conformer (δ = 0°) at a step size of ∆δ = 4°. Due to the pentagonal
structure of the Cp ring, every 36° that the dihedral angle rotates will result in an
alternative staggered-eclipsed (D5d-D5h) conformation periodically.
The infrared (IR) spectra of the ferrocene conformers are simulated on the
optimized structure using the same B3LYP/m6-31G(d) model, both in vacuum
and in a number of solvents. As the simulated IR spectra of Fc will be compared
with several FTIR spectra measured in solutions, a number of implicit solvent
models are employed in the simulations to account for solvation effects on the
simulated IR spectra. Continuum solvation methods such as polarizable
continuum model (PCM) or dielectric polarized continuum model (D-PCM which
neglects the volume polarization) [10], the conductor PCM (C-PCM, which
approximates the volume polarization) [11, 12] and the solute molecule density
(SMD) model [13] are employed in the IR spectral simulations. Geometry
optimization calculations of Fc are performed for each of such simulations in
solutions, respectively, followed by vibrational frequency calculations.
The experimental FTIR data are provided by Dr. Stephen Best (School of
Chemistry, The University of Melbourne, Australia). Infrared spectra of ferrocene
dissolved in non-polar solvents such as acetonitrile (ACN, ε=35.69),
dichloromethane (DCM, ε=8.93), tetrahydrofuran (THF, ε=7.43) and dioxane
(DOX, ε=2.21) are obtained using a Bruker Tensor 27 FTIR and a conventional
solution cell fitted with KBr windows and a 100 µm spacer. A resolution of 1 cm-1
is used for all measurements. Concentrated solutions are prepared in each case and
these spectra are compared with those obtained from the corresponding solutions
diluted by factors ranging between 2 and 4. No significant concentration-
dependent variation in the band profile is observed.
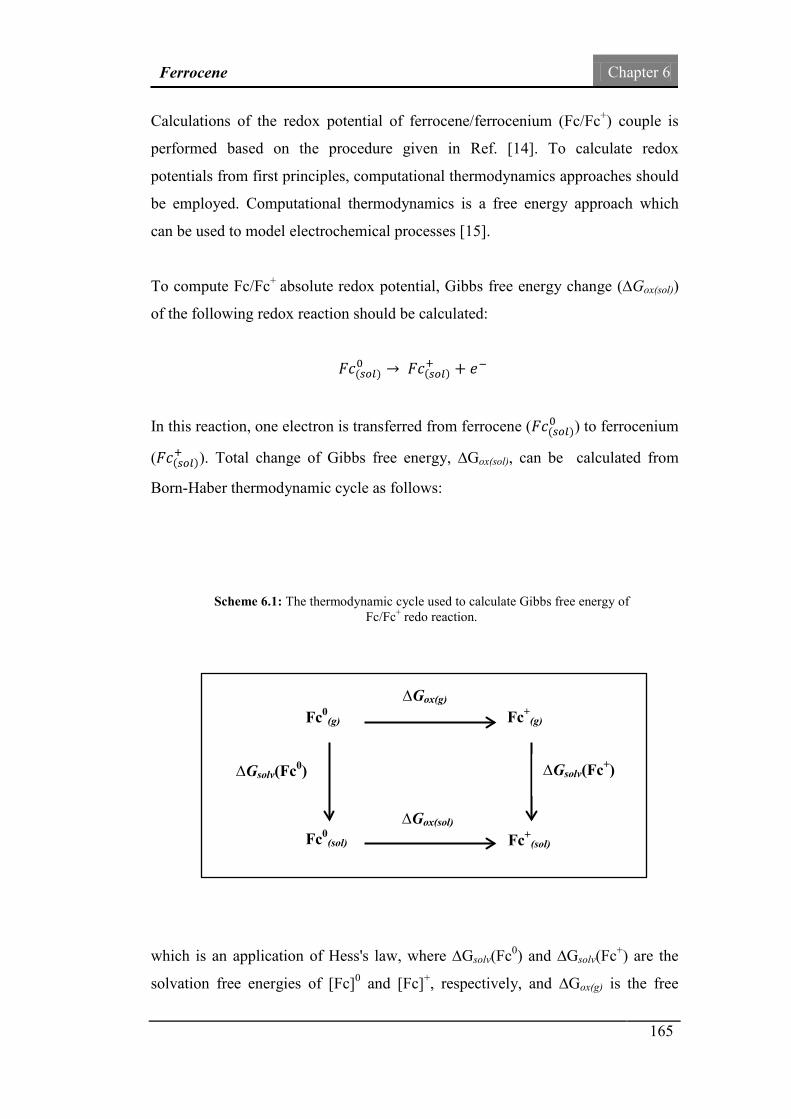
Ferrocene Chapter 6
165
Calculations of the redox potential of ferrocene/ferrocenium (Fc/Fc+) couple is
performed based on the procedure given in Ref. [14]. To calculate redox
potentials from first principles, computational thermodynamics approaches should
be employed. Computational thermodynamics is a free energy approach which
can be used to model electrochemical processes [15].
To compute Fc/Fc+ absolute redox potential, Gibbs free energy change (∆Gox(sol))
of the following redox reaction should be calculated:
𝐹𝑐(𝑠𝑜𝑙)
0 → 𝐹𝑐(𝑠𝑜𝑙)+ + 𝑒−
In this reaction, one electron is transferred from ferrocene (𝐹𝑐(𝑠𝑜𝑙)0 ) to ferrocenium
(𝐹𝑐(𝑠𝑜𝑙)+ ). Total change of Gibbs free energy, ∆Gox(sol), can be calculated from
Born-Haber thermodynamic cycle as follows:
which is an application of Hess's law, where ∆Gsolv(Fc0) and ∆Gsolv(Fc+) are the
solvation free energies of [Fc]0 and [Fc]+, respectively, and ∆Gox(g) is the free
Fc0(g)
Fc0(sol) Fc+
(sol)
Fc+(g)
∆Gox(g)
∆Gox(sol)
∆Gsolv(Fc+) ∆Gsolv(Fc0)
Scheme 6.1: The thermodynamic cycle used to calculate Gibbs free energy of Fc/Fc+ redo reaction.

Ferrocene Chapter 6
166
energy change due to oxidation reaction of [Fc]0 to [Fc]+ in the gas phase. PCM
solvation model and dimethyl sulfoxide (DMSO) solvent are employed in this
study.
Redox potential is calculated from the following equation:
𝐸(𝑚)
(0/+) =𝛥𝐺𝑜𝑥(𝑠𝑜𝑙)
−𝑛𝐹 , (6.1)
where F is the Faraday constant (23.061 kcal.mol-1V-1) and n is the number of
electrons transferred (n=1 for Fc/Fc+ redox reaction). The outputs of frequency
calculations on the optimized structures of both Fc0 and Fc+ are needed to gain
thermodynamics values required to solve eq. (6.1).
6.3. Ferrocene structure
A new era in organometallic chemistry began by the unintentional discovery of
ferrocene (Fc) by two independent groups reported in late 1951 [3] and early 1952
[4]. The “renaissance of inorganic chemistry”, as called by Sir Ron Nyholm in his
inaugural lecture in 1956 delivered at University College London [16], originated
from attempts to find the true structure of the ferrocene compound [6], as the
“stretched” structure (Fig 1.(a)) proposed by Pauson and Kealy in their seminal
paper [3] was not convincing. In 1952 Wilkinson et al. proposed a “sandwich”
structure (Fig 1.(b)), having a symmetry point group of D5d (staggered) for this
compound. However, they also suggested that a D5h structure in which “split d3p2
plane pentagon bonding” exists between iron to carbons, is not unlikely [17].
Fischer and co-workers were also studying the structure of ferrocene at the same
time. Based on their preliminary X-ray crystallography data and coordination
chemistry knowledge, they concluded that in ferrocene molecule, the iron (II)
atom is confined in between the two cyclopentadienyl rings similar to ligands
[18]. Later on in 1952 they assigned a “double cone” structure (Fig 1.(c)) to
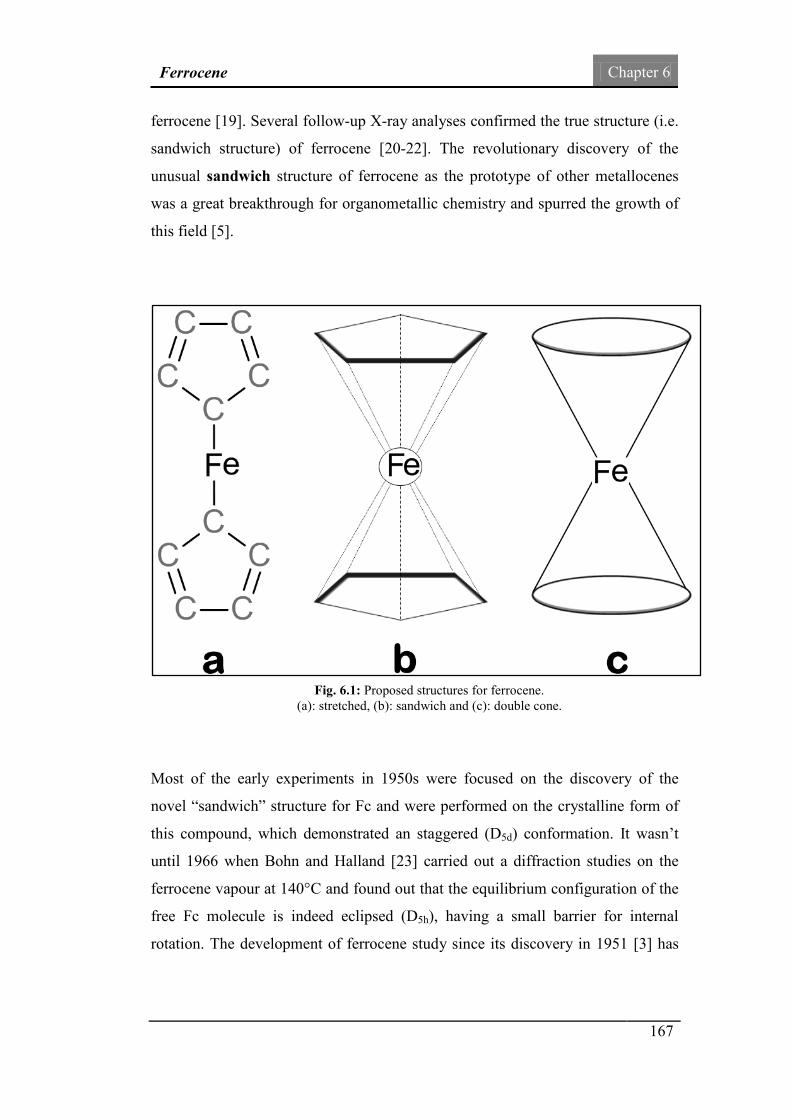
Ferrocene Chapter 6
167
ferrocene [19]. Several follow-up X-ray analyses confirmed the true structure (i.e.
sandwich structure) of ferrocene [20-22]. The revolutionary discovery of the
unusual sandwich structure of ferrocene as the prototype of other metallocenes
was a great breakthrough for organometallic chemistry and spurred the growth of
this field [5].
Most of the early experiments in 1950s were focused on the discovery of the
novel “sandwich” structure for Fc and were performed on the crystalline form of
this compound, which demonstrated an staggered (D5d) conformation. It wasn’t
until 1966 when Bohn and Halland [23] carried out a diffraction studies on the
ferrocene vapour at 140°C and found out that the equilibrium configuration of the
free Fc molecule is indeed eclipsed (D5h), having a small barrier for internal
rotation. The development of ferrocene study since its discovery in 1951 [3] has
Fig. 6.1: Proposed structures for ferrocene. (a): stretched, (b): sandwich and (c): double cone.
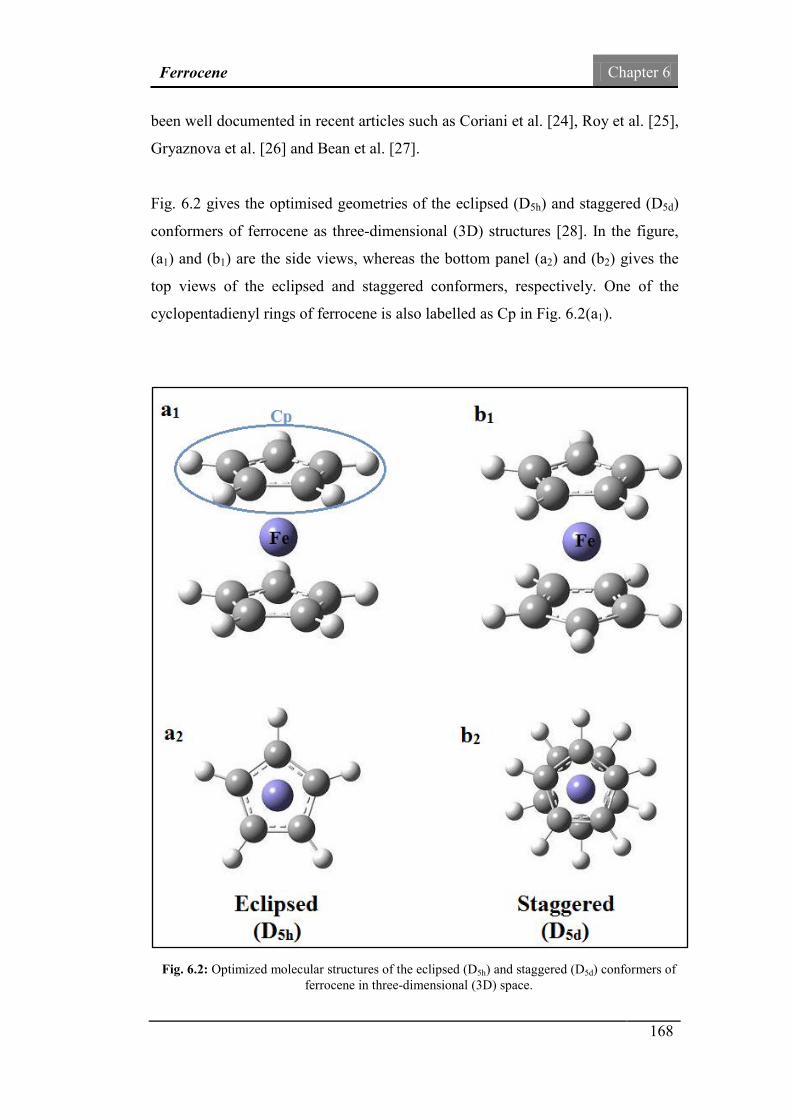
Ferrocene Chapter 6
168
been well documented in recent articles such as Coriani et al. [24], Roy et al. [25],
Gryaznova et al. [26] and Bean et al. [27].
Fig. 6.2 gives the optimised geometries of the eclipsed (D5h) and staggered (D5d)
conformers of ferrocene as three-dimensional (3D) structures [28]. In the figure,
(a1) and (b1) are the side views, whereas the bottom panel (a2) and (b2) gives the
top views of the eclipsed and staggered conformers, respectively. One of the
cyclopentadienyl rings of ferrocene is also labelled as Cp in Fig. 6.2(a1).
Fig. 6.2: Optimized molecular structures of the eclipsed (D5h) and staggered (D5d) conformers of ferrocene in three-dimensional (3D) space.

Ferrocene Chapter 6
169
As a prototypical metallocene with a sandwich structure, ferrocene exhibits only a
small energy barrier separating the staggered (D5d symmetry) and eclipsed (D5h
symmetry) rotational orientations of the parallel cyclopentadienyl rings [29]. The
fact that the barrier to the internal rotation of ferrocene is very small and that the
cyclopentadienyl rings (Cp) in Fc can easily rotate between eclipsed/staggered
conformations makes it difficult to find properties which can differentiate these
two conformers. It has been stated [26] that a staggered ferrocene structure (i.e.
D5d point group symmetry) dominates experiments in the condensed phase [21,
22, 30, 31], whereas the eclipsed structure (D5h) is found in the gas phase [23, 32,
33]. The eclipsed conformation was also observed at 90 K in the solid [34] and at
room temperature in solutions [20]. As most of the theoretical studies of ferrocene
are based on the gas phase or solutions, the eclipsed (D5h) structure of ferrocene
has been more extensively studied than the D5d conformer.
Study of ferrocene conformers will help our understanding of other metallocenes
and their derivatives with applications in biotechnology, nanotechnology and solar
technology [35]. For example, Cooper et al. [36] recently developed a class of
ferrocene synthons which may add to the number for organometallics with useful
medicinal properties [37]. The rotational energy barriers with respect to the metal-
cyclopentadienyl axis between the eclipsed and staggered conformers are only a
few kJ.mol-1 [35, 38]; as a result, it is possible that the ground electron state
structures of ferrocene may contain both of the conformations.
The fact that electronic structures and properties of the ferrocene conformers are
strikingly similar is a key hurdle to differentiate or separate the configurations
from one another. However, detailed studies of D5h and D5d of ferrocene are
important as ferrocene derivatives may inherit particular properties which only
exist in one conformer [38]. For example, additional ligands coordinating to the
metal and the Cp rings while maintaining certain symmetry, can be a geometric
requirement for the D5h conformer [36]. In addition, the understanding of
synthesis pathways, mechanics and reaction dynamics of the ferrocene derivatives
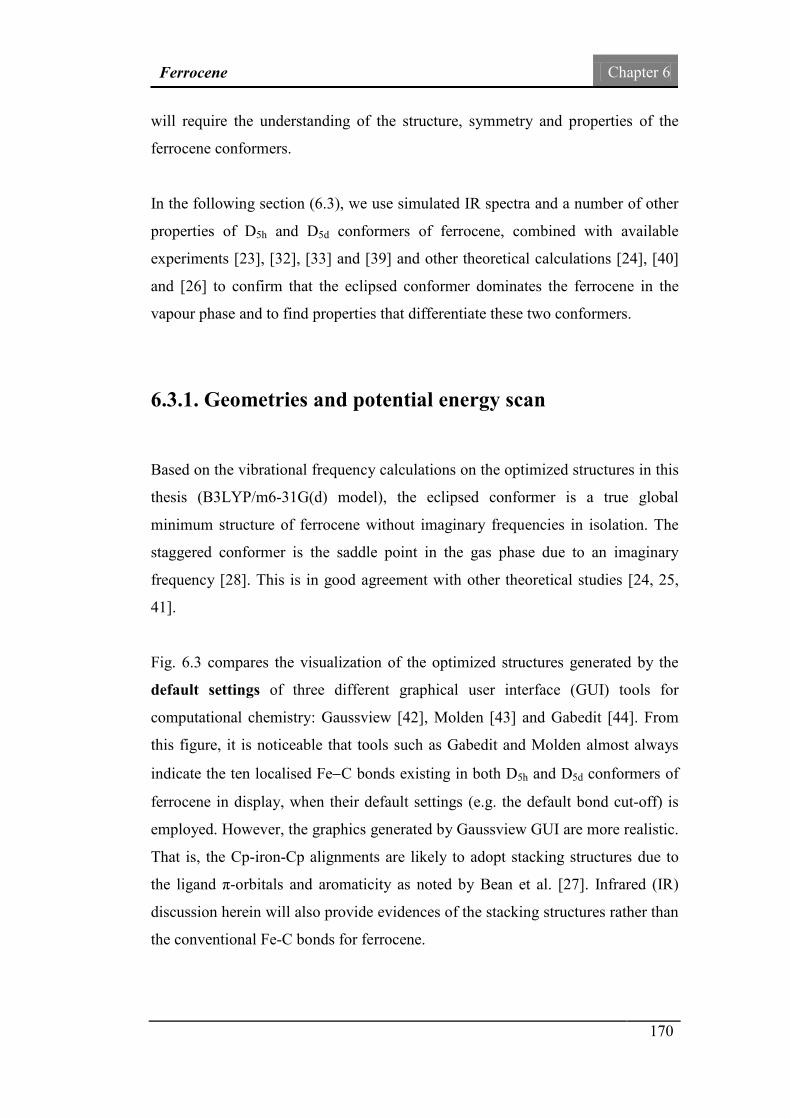
Ferrocene Chapter 6
170
will require the understanding of the structure, symmetry and properties of the
ferrocene conformers.
In the following section (6.3), we use simulated IR spectra and a number of other
properties of D5h and D5d conformers of ferrocene, combined with available
experiments [23], [32], [33] and [39] and other theoretical calculations [24], [40]
and [26] to confirm that the eclipsed conformer dominates the ferrocene in the
vapour phase and to find properties that differentiate these two conformers.
6.3.1. Geometries and potential energy scan
Based on the vibrational frequency calculations on the optimized structures in this
thesis (B3LYP/m6-31G(d) model), the eclipsed conformer is a true global
minimum structure of ferrocene without imaginary frequencies in isolation. The
staggered conformer is the saddle point in the gas phase due to an imaginary
frequency [28]. This is in good agreement with other theoretical studies [24, 25,
41].
Fig. 6.3 compares the visualization of the optimized structures generated by the
default settings of three different graphical user interface (GUI) tools for
computational chemistry: Gaussview [42], Molden [43] and Gabedit [44]. From
this figure, it is noticeable that tools such as Gabedit and Molden almost always
indicate the ten localised Fe−C bonds existing in both D5h and D5d conformers of
ferrocene in display, when their default settings (e.g. the default bond cut-off) is
employed. However, the graphics generated by Gaussview GUI are more realistic.
That is, the Cp-iron-Cp alignments are likely to adopt stacking structures due to
the ligand π-orbitals and aromaticity as noted by Bean et al. [27]. Infrared (IR)
discussion herein will also provide evidences of the stacking structures rather than
the conventional Fe-C bonds for ferrocene.
Ferrocene Chapter 6
171
Table 6.1 compares selected characteristic geometric and electronic properties of
D5h and D5d conformers of ferrocene with other theoretical and experimental
results [28]. The optimized geometric parameters for the conformer pairs are
almost identical using the same model as shown in Table 6.1. For example, all
C−C bonds are given by 1.428Å, which is between a C−C single bond and a C=C
double bond. Also, all C−H bonds are reported as 1.082Å.
The results in Table 6.1 also indicate that the hydrogen atoms of Cp are not in the
same plane with the C5 pentagon ring. The hydrogen atoms slightly bend towards
their counterpart in the opposite Cp ring, again in agreement with experimental
findings [32] that the conformer bond angle involving the hydrogen atoms in D5h
is ∡C5−H = 3.7 ± 0.9°. However, calculations indicated that this angle is much
smaller than the crystalline structure of D5h of Fc, from ∡C5−H = 0.66° in
B3LYP/m6-31(d) to ∡C5−H = 1.03 in CCSD(T)/ TZV2P+f [9].
Theory also indicates that this angle, ∡C5−H, for D5d (0.92° in B3LYP/m6-31(d)
and 1.344° in CCSD(T)/6-31G** [9]) is slightly larger than that of D5h. Small
differences of the distances between Fe and the Cp rings in D5h and D5d are also
observed. The Fe−Cp distance of the latter (D5d) is slightly longer than the Fe−Cp
Fig. 6.3: Optimized molecular structures of the eclipsed conformer of ferrocene in 3D space, visualized by three GUI tools: Gaussview, Molden and Gabedit.

Ferrocene Chapter 6
172
distance in D5h, i.e., 1.674 Å in D5d whereas in D5h this distance is given by
1.670Å.
Table 6.1: Comparison of the optimized geometries of eclipsed and staggered conformers of ferrocene. Bond/angle This worka HFb MP2c CCSD(T)c B3LYP/Type-Id Expte
Eclipsed (D5h) Fe-C5 (Å) f 1.670 1.865 1.464 1.655 1.687 - 1.688 1.660 Fe-C (Å) 2.065 2.219 1.910 2.056 2.079 - 2.080 2.064 ± 0.003 C-C(Å) 1.428 1.413 1.441 1.433 1.428 1.440 ± 0.002
C-H(Å) 1.082 1.074 1.076 1.077 - 1.104 ± 0.006 ∡C5-H (°) 0.66 0.58 0.33 1.03 3.7± 0.9 g
Etotal(Eh) -1650.662
Etotal+ZPE(Eh) -1650.492
<R2> ( a.u) 1358.84
μ (Debye) 0.0
Electronic State
1A1’
∆ HOMO-LUMO(eV)
5.30
A,B,C (GHz) A: 2.19453 B: 1.05862 C: 1.05862
Staggered (D5d) Fe-C5(Å) 1.674 1.866 1.487 1.659 Fe-C(Å) 2.068 2.220 1.925 2.058 C-C(Å) 1.428 1.413 1.437 1.432 C-H(Å) 1.082 1.074 1.076 1.077 ∡C5-H(°) 0.92 0.55 1.39 1.34 Etotal(Eh) -1650.661 Etotal+ZPE(Eh) -1650.491 <R2> ( a.u) 1361.78 μ (Debye) 0.0 Electronic State
1A1g
∆ HOMO-LUMO(eV)
5.26
A,B,C (GHz) A: 2.19455 B: 1.05503 C: 1.05503
a This work with the B3LYP/m6-31G(d) model. The basis set is a modified version of 6-31G(d) basis set [8]. b See [45]. c See [24]. d See [26]. e See [32]. f Denotes the distance from Fe atom to the centre of cyclopentadienyl ring. g See [33]. From an ND experiment (not corrected for thermal motion) the value is 1.7 ± 0.2 [46]. h Energy difference between D5h ,and D5d is : ∆ E= 0.0272 eV = 0.62kcal⋅mol-1 (0.9 kcal⋅mol-
1, expt [32]).
Ferrocene Chapter 6
173
Due to their high symmetries, both D5h and D5d conformers do not possess
permanent dipole moments. As a result, the IR spectroscopy of ferrocene will be
due to induced dipole moments during vibration. The calculated molecule size
(i.e., the electronic spatial extent <R2> as given in Table 6.1) of the D5d conformer
is slightly larger than the D5h conformer. The former (D5d) is 1361.80 a.u. but the
latter (D5h) is 1358.84 a.u. The size of D5d is slightly larger but was found in
condensed phase, whereas the smaller size ferrocene D5h is found in gas phase,
solid and solution. The energy gap between the HOMO and the LUMO, i.e.,
∆ε(HOMO-LUMO), is given by 5.30 eV and 5.26 eV for D5h and D5d,
respectively.
The ground electronic state of ferrocene is a low-spin state as indicated by
Gryaznova et al. [26]. Calculations in this thesis using B3LYP/m6-31G(d) model
gives the configurations as [28]:
D5h, X1A2: (core)… (e1”)4(a1’)2(e1’)4(e2’)4(e2”)4(a2”)2(e1”)4(e1’)4(a1’)2(e2’)4(e1”)0
D5d, X1A1g: (core)…(e1g)4(a1g)2(e1u)4(e2u)4(e2g)4(a2u)2(e1g)4(e1u)4(a1g)2(e2g)4(e1g)0
The major difference between the conformers is due to a symmetric plane for D5h
but a symmetric centre for D5d in their point group character tables. As a result,
the orbital irreducible representations which are correlated as ’ and ” in D5h
become g and u in D5d. The highest occupied molecular orbital (HOMO) of D5h
conformer is a doubly degenerate e2’ state and the next HOMO (HOMO-1) is a1’
but the lowest unoccupied molecular orbital (LUMO) is e1”. On the other hand,
the HOMO for D5d is a doubly degenerate e2g state, the HOMO-1 is a1g and
LUMO is e1g.
In this study, a molecular orbital diagram is also constructed by fragmenting
ferrocene into metal (i.e. Fe+2) and ligand (i.e. (Cp)2-2 ) sections and constructing
the molecular orbital diagrams of the D5h and D5d symmetries of ferrocene (in
ADF package using SAOP/et-pvqz model). The result is shown in Fig. 6.4.
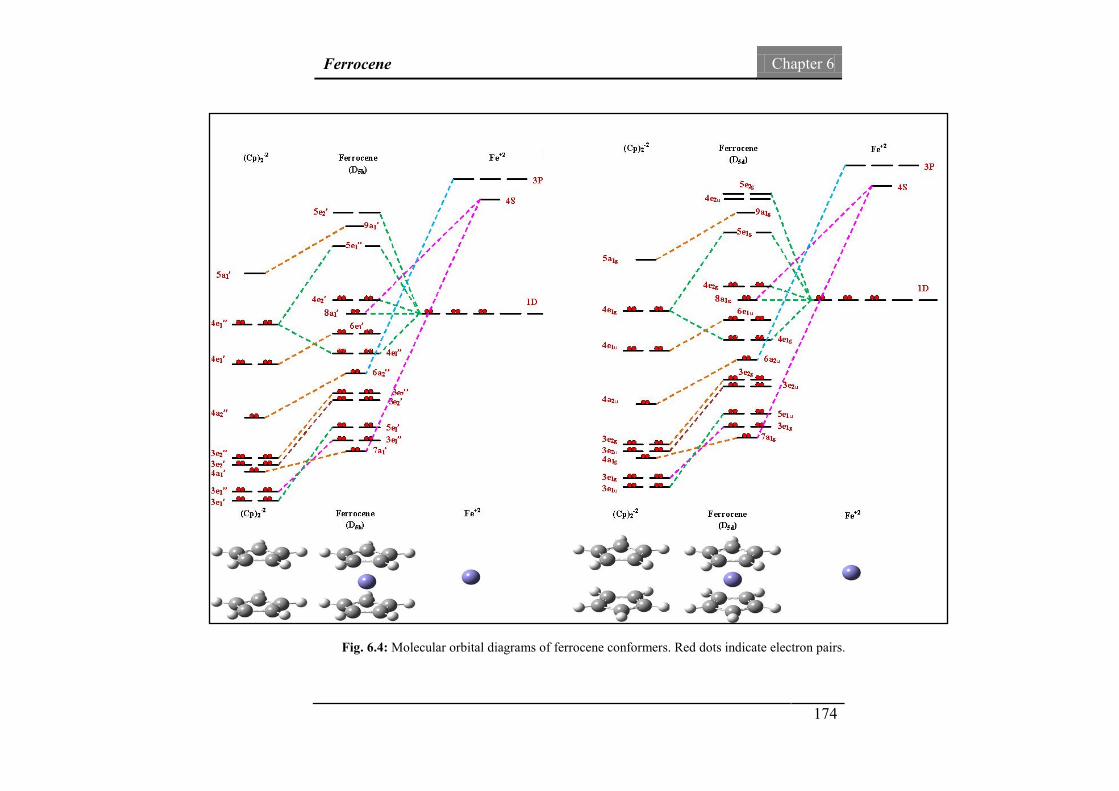
Ferrocene Chapter 6
174
Fig. 6.4: Molecular orbital diagrams of ferrocene conformers. Red dots indicate electron pairs.
Ferrocene Chapter 6
175
In metallocenes such as ferrocene, the primary orbital interactions, that form the
metal‐ligand bonds, occur between the metal orbitals (e.g. d orbitals of Fe in
ferrocene) and the carbon-carbon π‐orbitals of the cyclopentadienyl (Cp) ligand.
Several studies have reported various qualitative molecular orbital diagrams of
ferrocene [47-50]. The present work is, however, more quantitative and
calculational. For each of the fragments (i.e. metal and ligand), a molecular orbital
diagram is calculated separately. The resultant molecular orbital diagram of
ferrocene is constructed by connecting the metal and ligand orbitals which match
both in energy and in symmetry as shown in Fig. 6.4. Another significance of this
figure is that it includes the diagrams of both eclipsed and staggered conformers,
whereas the previous works have just considered the staggered (D5d) form.
Fig. 6.5 gives the orbitals of the doubly degenerate HOMOs for D5h (e2’) and for
D5d (e2g), as well as the doubly degenerate LUMOs for D5h (e1”) and for D5d (e1g),
based on our B3LYP/m6-31G(d) calculations [28]. As can be seen from this
figure, the HOMO-LUMO gaps of the eclipsed and the staggered conformers
exhibit a small difference in energy (0.04 eV).
The HOMOs and LUMOs of the eclipsed and staggered exhibit major similarities
to their corresponding partners, except the bottom Cp of the eclipsed ferrocene
orbitals which are not mirror reflection of the top part as in the staggered. The
HOMOs and LUMOs are dominated by both the iron atom and the carbon atoms
of ferrocene. As a result, the differences between the HOMOs and LUMOs are
not significant enough to differentiate the conformers.

Ferrocene Chapter 6
176
Fig. 6.6(a) reports the potential energy scan (PES) of ferrocene. The PES is
constructed by rotating the central cyclopentadienyl axis, i.e., the dihedral angle, δ
(∡C(1)-X(2)-Fe(3)-C(4)) [28]. In this dihedral angle, X(2) is a dummy atom (purple
colour in the figure) which is located at the centre of the top Cp pentagon plane,
as shown in Fig. 6.6(b). Due to the pentagonal structure of the Cp fragment,
rotation of the dihedral angle δ from 0° to 2π will reproduce D5h and D5d
symmetries five times periodically as the period is 2π/5.
The energy difference, ∆E, between eclipsed (D5h) and staggered (D5d)
conformers of ferrocene is given by 0.62 kcal⋅mol-1 using the B3LYP/m6-31G(d)
Fig. 6.5: The highest occupied molecular orbitals (HOMOs) and the lowest unoccupied molecular orbitals (LUMOs) of the eclipsed (D5h) and the staggered (D5d) conformers of ferrocene.
Ferrocene Chapter 6
177
model, comparing to approximately 0.9(3) kcal⋅mol-1 as measured by gas phase
electron diffraction (GED) [32]. This result is in agreement with other DFT
calculations [24]. For example, Coriani et al. [24] calculated ∆E values of 0.39
kcal⋅mol-1, 0.75 kcal⋅mol-1, 0.99 kcal⋅mol-1, and 1.13 kcal⋅mol-1 by employing
BHLYP, B3LYP, BLYP, and BP86 density functionals, respectively. However,
such small differences in the properties are not sufficient to warrant meaningful
investigation for such differences in most measurements. Other properties which
can differentiate the conformers sensitively ought to be disclosed.
Fig. 6.6: (a) Potential energy scan (PES) of the dihedral angle rotating the axis connecting the middle Fe atom as well as the centres of two Cp rings. Due to the
pentagon structure of Cp, every 36° rotation of the dihedral angle will produce either the D5h or the D5d structure once. This figure only presents one period of the PES.
(b) The definition of the dihedral angle.

Ferrocene Chapter 6
178
6.3.2. Molecular electrostatic potential
Fig. 6.7 gives cross sections of the molecular electrostatic potentials (MEPs) of
D5h and D5d conformers. In this figure, the upper panels, (a1) and (a2), are the
cross sections through one of the pentagon Cp rings of the conformers. As seen in
the figure, (a1) and (a2) are virtually identical in D5h and D5d conformers. That is
because only one of the Cp rings is presented in the MEP which is independent of
the other Cp ring and their orientation. Perhaps the noticeable difference between
(a1) and (a2) is that the projection of the opposite Cp ring overlaps with the
working Cp ring in D5h, whereas the same projection in the D5d case does not
overlap with the working Cp ring due to its reflection centre, i.
In the middle panel of Fig. 6.7, (b1) and (b2) are the MEP cross sections with an
oblique cut through the centre Fe atom. The MEP cross sections in (b1) and (b2)
are very different for D5h and D5d. Such dissimilarity reflects the unique symmetry
of σh for D5h and i for D5d. For example, staggered conformer (D5d) gives a
symmetric 2D MEP showing the character of the symmetric centre, i, whereas the
eclipsed conformer (D5h) provides a butterfly shaped 2D MEP exhibiting a single
σh plane. Furthermore, the bottom panel, (c1) and (c3) gives cross sections through
the centre Fe atom parallel to the Cp rings, which clearly indicate that the electron
densities at the Fe centre and its vicinity are very different in D5h and D5d
conformers. As shown in (c1), the electron density map of the eclipsed Fc presents
a pentagonal MEP, whereas (c2) reports an electron disk centred at the Fe atom in
the staggered Fc. The observation suggests that any properties of ferrocene
reflecting such different σh and i symmetries may be able to differentiate the
conformers. This information provides a clue to concentrate on the investigation
of Fe-centred properties in the next sections.

Ferrocene Chapter 6
179
Fig. 6.7: Two-dimensional (2D) cross sections of the molecular electrostatic potential (MEP) of ferrocene.
(a1) and (a2): the cross section through the Cp plane; (b1) and (b2): the cross section through the oblique plane (via Fe) and the Cp ring plane;
(c1) and (c3): cross sections through the Fe atom and parallel to the Cp planes.

Ferrocene Chapter 6
180
6.3.3. Infrared spectroscopy of ferrocene in isolation
Ferrocene is a highly symmetric compound with no permanent dipole moment. As
a result, the IR spectra of ferrocene are relatively simple with only a few transition
peaks (I≠0) caused by vibrations which lead to induced dipole moments. Fig 6.8
compares the simulated and the experimental IR spectra of ferrocene in the region
of 400-1200 cm-1. In this figure, two experimental IR measurements and three
simulated ones are presented. The first spectrum (Fig 6.8(a)) belongs to a recent
gas-phase infrared spectrum of Fc measured at 1 cm-1 resolution in the region of
400-1200 cm-1 at the Far-IR beamline of the Australian Synchrotron [51]. Fig
6.8(b) shows an earlier experimental measurement of Lippincott and Nelson [39]
in vapour state. Fig 6.8(c) gives a recent simulated IR spectrum of the D5h
conformer using B3LYP/Type-I model [26]. The IR frequencies simulated by the
B3LYP/m6-31G(d) in the present study are also given in Fig 6.8(d) and Fig 6.8(e)
for D5h and D5d conformers of ferrocene, respectively.
As seen in Fig. 6.8, the simulated IR spectra agree well with the major peaks in
the experiment, except that the entire IR band in the region of 600-750 cm-1
shown in the earlier experiment [39] is missing in theoretical results, including the
present study and a previous one [26]. It suggests that this medium strong IR band
in the experiment [39] might be stemmed by vibrations other than ferrocene, such
as impurities and the environment etc.
The agreement between the present results and recent theoretical results (D5h
conformer) [26] is good. However, it is noted that in Ref. [26] the Type-I basis set
in the B3LYP/Type-I model uses the 6-31G* basis set for the ligand atoms, such
as H and C, but the ECP LanL2DZ basis set for the Fe atom. In this reference
[26], the calculated IR frequencies of the eclipsed ferrocene have been scaled by a
number of scaling factors (see Table 1S in the supplementary materials in Ref.
[26]). For example, the calculated Fe−C stretching vibrations need a scale factor
as large as 1.25 in order to fit the corresponding experimental vibrational

Ferrocene Chapter 6
181
frequencies of Lippincott and Nelson [39], also one of the scale factors for the
C−H stretch vibrations is given as 0.889 [26]. Exploiting a number of scaling
factors with respect to the experiment in Ref. [26], leads to loss of the prediction
power of theoretical studies.
Fig. 6.8: Comparison of the simulated and the experimental IR spectra of ferrocene in the region of 400-1200 cm-1. (a) and (b): experimental, (c) simulated for D5h conformer, from Ref. [27],
(d) and (e): simulated for D5h and D5d, respectively in the present study.

Ferrocene Chapter 6
182
In the present study, the IR frequencies for both D5h and D5d conformers of
ferrocene using the B3LYP/m6-31G(d) model are the direct results, without any
scaling and manipulation [28]. The modified m6-31G(d) basis set [8], which
incorporates necessary diffuse d-type functions for the first-row transition metals
such as Fe, exhibits a more accurate description than the ECP LanL2DZ basis set
(Type-I) for the iron atom in ferrocene. To be more specific, the m6-31G(d) basis
set provides a more appropriate description for the important energy difference
between the atomic 3dn4s1 and 3dn-14s2 states [8, 9]. As a result, the present IR
frequencies agree well with experiment without any scaling.
The present simulation only differ in the basis set with Ref. [26], where scaling
were applied. From the agreement of the present IR frequencies with experiment
without any scaling, it can be concluded that basis set plays an important role in
the accuracy of DFT calculations of ferrocene. Such results also support the
previous finding that the centre Fe atom plays a significant role in determining
properties of ferrocene, as the two basis sets discussed here only differ in their
description of the transition Fe metal.
Fig. 6.9 compares the simulated infrared spectra of D5h and D5d conformers of
ferrocene in the region of 400-4000 cm-1 using the B3LYP/m6-31G(d) model. The
spectrum for D5d is in red colour, and for D5h is in black. As mentioned earlier, the
IR spectra of ferrocene are relatively simple with only a few transitions due to
induced dipole moments. The spectra consist of six major peaks in this region.
The IR spectra are very similar in eclipsed (D5h) and staggered (D5d) conformers,
with only small blue shift in the spectra of the D5h ferrocene. For example, the
clustered IR peaks of the eclipsed conformer in the region < 500 cm-1 (i.e. Band
A, highlighted in a blue box) show a small blue shift of ca. 12 cm-1. To further
understand the IR spectra of Fc, more detailed analysis is needed.

Ferrocene Chapter 6
183
Table 6.2 [28] reports the IR spectral analysis in the region of 400-4000 cm-1 for
the six major non-zero intensity (I≠0) transitions in Fig. 6.9. In this table, the IR
frequencies of conformer D5h compare with a recent theoretical study of the same
conformer of Fc (D5h) [26] and an earlier experimental study (D5d) of Lippincott
and Nelson [39].
Based on point group theory, there are eight irreducible representations (modes)
for each of the D5h and D5d [39] ferrocene conformers. According to the selection
Fig. 6.9: Comparison of simulated IR spectra of ferrocene, D5h and D5d in vacuum in the region of
400-4000 cm-1 using the B3LYP/m6-31G(d) model without any scaling.

Ferrocene Chapter 6
184
rules, five of the modes are IR active modes but three of them are IR inactive.
Among the five IR active modes, only two modes will show strong IR transitions,
as indicated by their character table. That is,
D5h: a1’, a2’, e1’, e2’, a1”, a2”, e1”, and e2”;
IR active: a1’, e1’, e2’, a2”, e1”; where e1’ and a2” are strong IR active
modes;
IR inactive: a1”, a2’, and e2”;
D5d: a1g, a2g, e1g, e2g, a1u, a2u, e1u, e2u;
IR active: a1g, e1g, e2g, a2u, e1u; where e1u and a2u are strong IR active
modes;
IR inactive: a2g, a1u, e2u;
The two modes, i.e., e1u and a2u for D5d and e1’ and a2” for D5h produce strong IR
spectral lines. As a result, the major IR spectral peaks in Fig. 6.9 are assigned to
e1u and a2u for D5d and e1’ and a2” for D5h in Table 6.2. It is found that the IR
frequencies of the D5h and D5d conformers are indeed very similar, the
discrepancies are within 5 cm-1 for the vibrations in the region above 800 cm-1 (i.e.
Bands B, C, D, E and F). For example, the largest frequency mode, a2’ for D5h and
a2u for D5d are given by 3268 cm-1 and 3267 cm-1, respectively (Band F). Larger
differences in the IR spectra are shown in the region of 400-500 (Band A) cm-1.
For example, the second smallest mode in this region is given as 488 cm-1 for e1’
(D5h) which corresponds to the first (smallest frequency) IR F peak at 459 cm-1 for
e1u (D5d).

Ferrocene Chapter 6
185
Table 6.2: Calculated IR frequencies and their assignment for the D5h and D5d conformers of ferrocene using the B3LYP/m6-31G(d) model. D5h Ref.a D5d Exp.b Assignment
Band Mode No.
υ(cm-1) (I(km.mol-1)) , Symmetry Type
υ(cm-1) (I(km.mol-1)) , Symmetry Type, Int
Mode No.
υ(cm-1) (I(km.mol-1)) , Symmetry Type
υ(cm-1), I c
A 7 471 (17.75), a2” 470 (13), a2” 11 7,8d 459 (25.54), e1u 480, s ν FeCp
A 8,9 488 (22.30), e1’ 473 (48), e1’, 16 9e 461 (17.39), a2u 496, s Ring tilt
B 18 844(60.31), a2” 825 (79), a2” 10 18 848 (60.85), a2u 816, s γ CH
B 22,23 870 (1.58), e1’ 841 (10), e1’ 15 22,23 871 (1.92), e1u 840, w Asymmetric γCH(2 CH upward, 2 CH downward)
C 30,31 1035 (17.04), e1’ 1017 (34), e1’, 14 30,31 1035 (16.29), e1u 1012, s δ CCH
D 37 1141(20.23), a2” 1141 (15), a2”, 9 36 1139 (20.46), a2u 1112, s Breathing(one Cp shrinks, one Cp expands)
E 46,47 1470 (1.55), e1’ 1441 (4), e1’ 13 44,45 1469 (1.37), e1u 1416, w Asymmetric ν CC: Cp, in plane δ CCH
F 54,55 3257 (23.63), e1’ 3123 (46), e1’, 12 54,55 3256 (23.88), e1u 3106, m ν CH
F 56 3268 (2.75), a2” 3134 (3), a2”, 8 57 3267 (2.54), a2u ν CH
ν= Stretch γ= Out of plane δ=Bend a See [26]. b See [39]. c w=weak, m=medium, s=strong . d Assignment differs from D5h and is ν FeCp here. e Assignment differs from D5h and is ring tilt here.
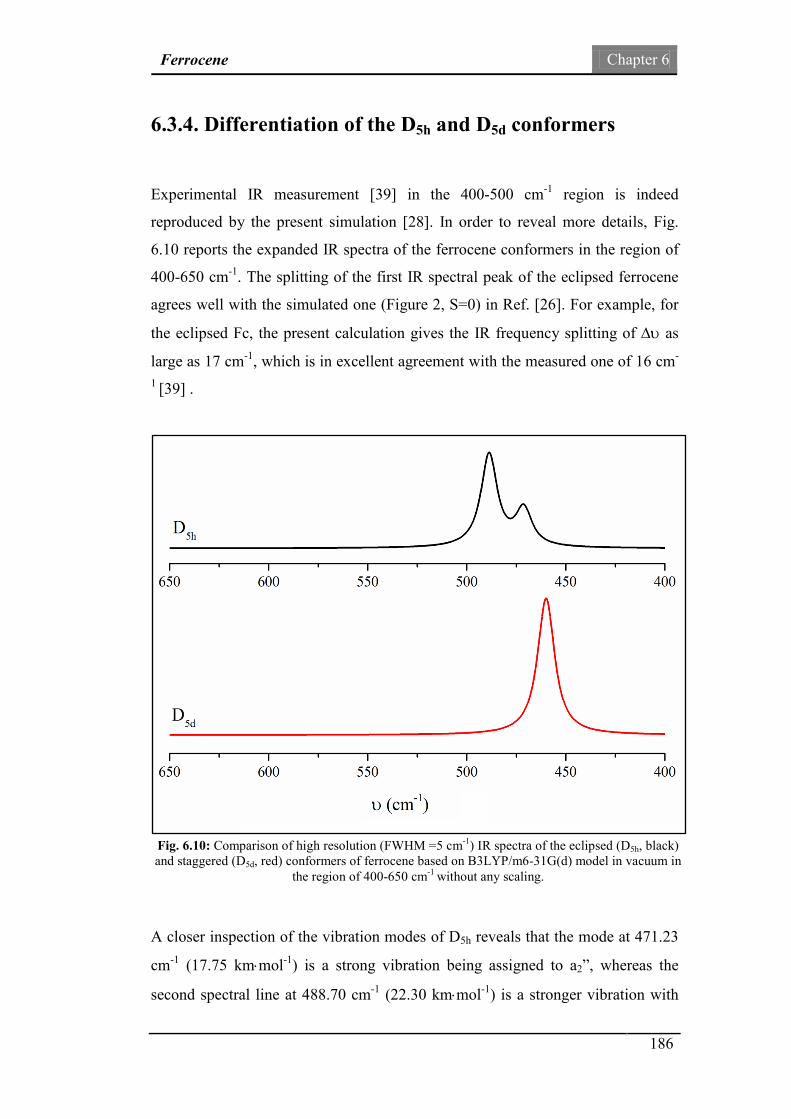
Ferrocene Chapter 6
186
6.3.4. Differentiation of the D5h and D5d conformers
Experimental IR measurement [39] in the 400-500 cm-1 region is indeed
reproduced by the present simulation [28]. In order to reveal more details, Fig.
6.10 reports the expanded IR spectra of the ferrocene conformers in the region of
400-650 cm-1. The splitting of the first IR spectral peak of the eclipsed ferrocene
agrees well with the simulated one (Figure 2, S=0) in Ref. [26]. For example, for
the eclipsed Fc, the present calculation gives the IR frequency splitting of ∆υ as
large as 17 cm-1, which is in excellent agreement with the measured one of 16 cm-
1 [39] .
A closer inspection of the vibration modes of D5h reveals that the mode at 471.23
cm-1 (17.75 km⋅mol-1) is a strong vibration being assigned to a2”, whereas the
second spectral line at 488.70 cm-1 (22.30 km⋅mol-1) is a stronger vibration with
Fig. 6.10: Comparison of high resolution (FWHM =5 cm-1) IR spectra of the eclipsed (D5h, black) and staggered (D5d, red) conformers of ferrocene based on B3LYP/m6-31G(d) model in vacuum in
the region of 400-650 cm-1 without any scaling.

Ferrocene Chapter 6
187
doubly degenerate states being assigned to e1’, a splitting of ∆υ is as large as 17
cm-1 between first two IR spectral peaks as shown in Fig. 6.10 (D5h). Although
Gryanova et al. [26] show only a small splitting of 3 cm-1 between 470 cm-1 (13
km⋅mol-1) and 473 cm-1 (48 km⋅mol-1), respectively, using the B3LYP/Type-I
model, their IR spectra simulated using the OPBE/Type-I model indeed indicate
that the higher vibration mode is the stronger vibration being assigned to e1’, is
consistent with simulated spectra in the present study for the eclipsed ferrocene.
Although the IR experiment in Ref. [39] assigned the structure of ferrocene to the
staggered D5d Fc, the split intensity pattern at ca. 470 cm-1 suggests the opposite,
i.e., being the eclipsed D5h conformer. If the Fc sample were dominated by the D5d
conformer in the experiment, the two spectral lines in the 400-500 cm-1 region
should be as close as 2 cm-1 (B3LYP/m6-31G*) or 3 cm-1 (B3LYP/Type-I) [26].
In addition, the observed first IR spectral peak for D5d in the region of 400-500
cm-1 must be a single and symmetric peak as shown in Fig. 6.10. If the sample is
dominated by the D5h conformer of Fc, however, the first IR spectral peak in the
same region is asymmetric and split into two peaks using a spectrometer with
higher resolution.
The vibrations in the IR spectral region near 500 cm-1 are dominated by vibrations
involving the centre Fe atom. As noted in previous sections (e.g., the MEP), the
eclipsed and staggered structures start to show differences when Fe is involved.
Fig. 6.11 gives the vibrations representing the IR peak clusters at ca. 460-470 cm-1
to demonstrate the Fe centred vibrations. In the eclipsed Fc (D5h), the first IR peak
at υ1 = 471.23 cm-1 which is assigned to a2” is not as strong as the second peak at
υ2(1), υ2
(2) = 488.70 cm-1 which is assigned to the doubly degenerate state of e1’.
The υ1 peak at 471.23 cm-1 of the IR spectrum of eclipsed ferrocene exhibits the
vibration in which the Fe atom moves up and down against the flipping directions
of the Cp rings. That is, if both the Cp rings flip down, the centre Fe atom moves
up and vice versa. The doubly degenerate vibrations of υ2(1) and υ2
(2) of the same
conformer (D5h) at 488.70 cm-1 engage with the centre Fe atom wobbling left and
right, as shown in Fig. 6.11. The Fe atom plays a central role in these vibrations.

Ferrocene Chapter 6
188
Due to the orientation differences of the Cp rings in the eclipsed ferrocene, the
three vibrations present two IR spectral peaks in a 1:2 ratio and a ca. 17 cm-1 split.
The vibrations of D5d exhibit a single spectral peak at ca. 460 cm-1. This peak in
fact consists of two vibrational lines of one doubly degenerate vibrations of υ1(1),
υ1(2) = 459.23 cm-1 and a less intensive transition at υ2 = 461.27 cm-1. The theory
predicts that the transitions are ∆υ = 1.74 cm-1 apart which is insufficient to be
measured by experiment even with state-of-the-arts high resolution IR technique.
The more intensive transition υ1 of D5d is associated with a doubly degenerate Cp
rings flips up and down which leads to the middle Fe atom vibration apparently.
The less intensive transition υ2 at 461.27 cm-1 reveals the pentagonal Cp ring
waging vibration which is similar to sugar puckering of tetrahydrofuran [52-54]
(THF). As seen in Fig. 6.11 the centre Fe atom of D5d exhibits a left and right
wagging vibration.
Fig. 6.11: The IR spectra of the eclipsed (D5h) and staggered (D5d) ferrocene in the fingerprint region.

Ferrocene Chapter 6
189
6.3.5. Influence of deuteration on the IR spectra
Deuteration can be defined as the change of more common isotope of hydrogen
(i.e. protium or light hydrogen, 1H) with deuterium (D or 2H). The nucleus of
deuterium contains one proton and one neutron, while the nucleus of protium
contains no neutron. As a result, deuterium or 2H is heavier than the normal
hydrogen (1H). Such differences in atomic mass have considerable impact on
many physical and chemical properties of deuterated compounds compared to the
hydrogen analogues. For example, vibrational spectra of the molecules will
change upon deuteration. For a fixed vibrational force constant, the transition
energy decreases as the mass of the oscillator increase. Because of this, the
vibrational spectrum of a sample is different than its deuterated analogue. In fact,
selective manipulation of a sample by deutration is a well-known experimental
method for the identification of vibrations involving hydrogen atoms [55].
Lippincott and Nelson employed the vibrational spectrum of fully deuterated
ferrocene (Fc-d-10) to assist in the band assignments of ferrocene spectrum [39].
In their experimental study, the spectrum of Fc-d-10 was exploited for
distinguishing between the CC and CH modes. These days, one can easily
visualize the simulated vibrations and easily realize the band assignments. Tools
such as Gaussview [42] easily allow calculated vibrational data to be displayed as
dynamic screen motions. However, simulation of Fc-d-10 may still reveal useful
information such as differences between ferrocene conformers. As a result, we
have simulated the infrared spectra of fully deuterated ferrocene (Fc-d-10) both
for eclipsed and staggered conformers in isolation (gas-phase). Results are given
in Fig. 6.12 and Table 6.3.
Fig. 6.12 compares the simulated infrared spectra of D5h and D5d conformers of
ferrocene (Fc-h-10) with those of Fc-d-10 in the region of 400-4000 cm-1
simulated using the B3LYP/m6-31G(d) model. The two bottom spectra are for Fc-
d-10 and the upper ones are for Fc-h-10. There is not any scaling or manipulation
in the present simulation.
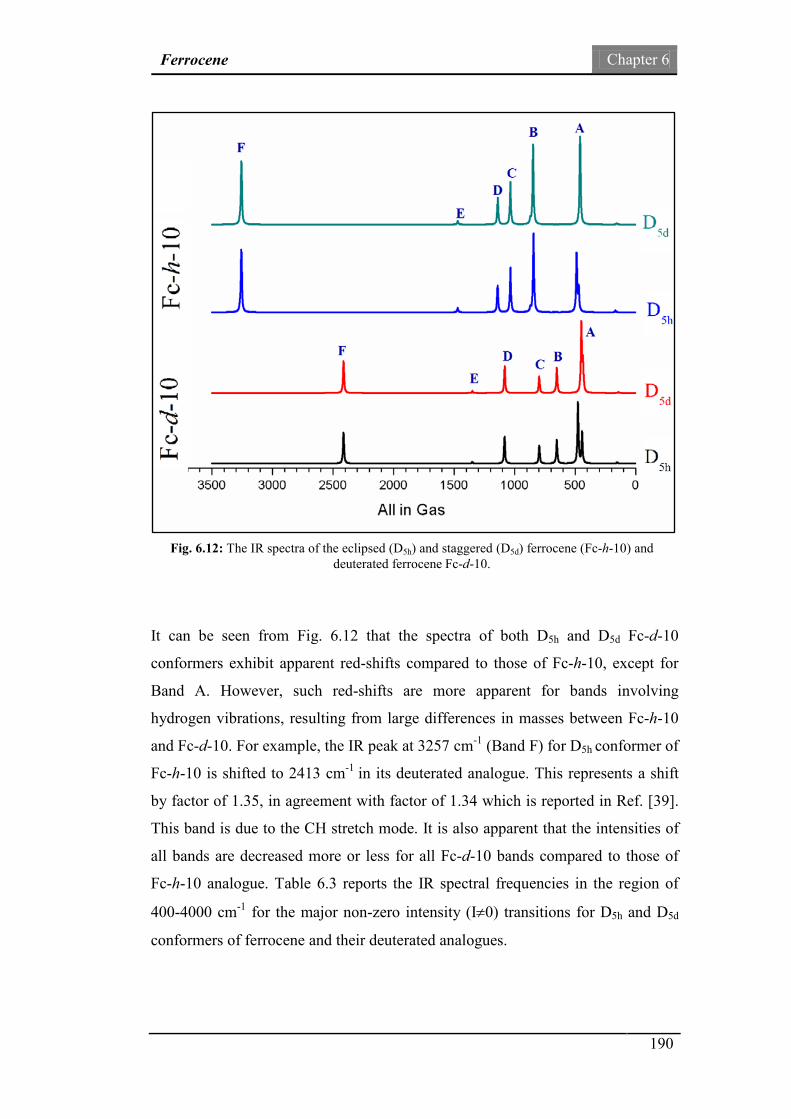
Ferrocene Chapter 6
190
It can be seen from Fig. 6.12 that the spectra of both D5h and D5d Fc-d-10
conformers exhibit apparent red-shifts compared to those of Fc-h-10, except for
Band A. However, such red-shifts are more apparent for bands involving
hydrogen vibrations, resulting from large differences in masses between Fc-h-10
and Fc-d-10. For example, the IR peak at 3257 cm-1 (Band F) for D5h conformer of
Fc-h-10 is shifted to 2413 cm-1 in its deuterated analogue. This represents a shift
by factor of 1.35, in agreement with factor of 1.34 which is reported in Ref. [39].
This band is due to the CH stretch mode. It is also apparent that the intensities of
all bands are decreased more or less for all Fc-d-10 bands compared to those of
Fc-h-10 analogue. Table 6.3 reports the IR spectral frequencies in the region of
400-4000 cm-1 for the major non-zero intensity (I≠0) transitions for D5h and D5d
conformers of ferrocene and their deuterated analogues.
Fig. 6.12: The IR spectra of the eclipsed (D5h) and staggered (D5d) ferrocene (Fc-h-10) and deuterated ferrocene Fc-d-10.
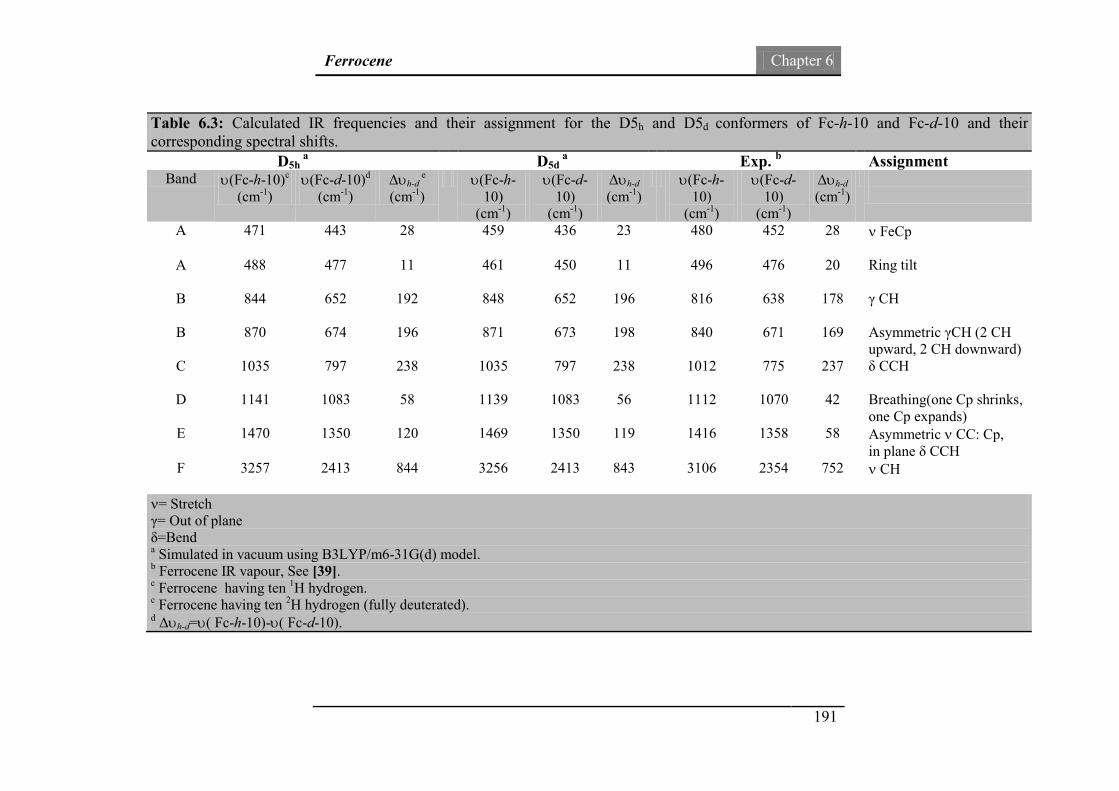
Ferrocene Chapter 6
191
Table 6.3: Calculated IR frequencies and their assignment for the D5h and D5d conformers of Fc-h-10 and Fc-d-10 and their corresponding spectral shifts.
D5h a D5d
a Exp. b Assignment Band υ(Fc-h-10)c
(cm-1) υ(Fc-d-10)d
(cm-1) Δυh-d
e (cm-1)
υ(Fc-h-10)
(cm-1)
υ(Fc-d-10)
(cm-1)
Δυh-d
(cm-1) υ(Fc-h-
10) (cm-1)
υ(Fc-d-10)
(cm-1)
Δυh-d
(cm-1)
A 471 443 28 459 436 23 480 452 28 ν FeCp
A 488 477 11 461 450 11 496 476 20 Ring tilt
B 844 652 192 848 652 196 816 638 178 γ CH
B 870 674 196 871 673 198 840 671 169 Asymmetric γCH (2 CH upward, 2 CH downward)
C 1035 797 238 1035 797 238 1012 775 237 δ CCH
D 1141 1083 58 1139 1083 56 1112 1070 42 Breathing(one Cp shrinks, one Cp expands)
E 1470 1350 120 1469 1350 119 1416 1358 58 Asymmetric ν CC: Cp, in plane δ CCH
F 3257 2413 844 3256 2413 843 3106 2354 752 ν CH
ν= Stretch γ= Out of plane δ=Bend a Simulated in vacuum using B3LYP/m6-31G(d) model. b Ferrocene IR vapour, See [39]. c Ferrocene having ten 1H hydrogen. c Ferrocene having ten 2H hydrogen (fully deuterated). d Δυh-d=υ( Fc-h-10)-υ( Fc-d-10).

Ferrocene Chapter 6
192
In Table 6.3, the simulated IR frequencies of Fc-h-10 and Fc-d-10 are compared
to the experimental data from Lippincott and Nelson study [39]. This table also
compares the results obtained from the preliminary analysis of spectral shifts upon
deutration. In the table, Δυ indicates the difference between frequencies of Fc-h-
10 major bands and their corresponding Fc-d-10 bands.
As seen in Table 6.3, vibrations involving hydrogen motions change more from
Fc-h-10 to Fc-d-10. For example, the frequencies due to CH stretch (νCH, Band
F) show a significant redshift as large as 844 cm-1 for both D5h and D5d
conformers, respectively (experimental value is 752 cm-1 [39]). Another
significant red-shift is observed for vibrations related to CCH bending (i.e. Band
C, δ CCH in Table 6.3). For both D5h and D5d conformers, this band is shifted by a
factor of 1.30 in Fc-d-10, which is in excellent agreement with experimental
factor of 1.30 for the same band [39]. The out of plane CH vibration (i.e. Band B,
γ CH in Table 6.3) is shifted from 844 cm-1 to 652 cm-1 in Fc-d-10 (D5h). This
means that this band is shifted by a factor of 1.30. This band is shifted by the
same factor (i.e. 1.30) for D5d conformer. The frequencies due to the asymmetric
out of plane CH motions (i.e. asymmetric γCH in the table) are observed at 870
cm-1 and 871 cm-1 in D5h and D5d conformers of Fc-h-10, respectively. These
frequencies are shifted by a factor of 1.29 to 674 cm-1 and 673 cm-1 in eclipsed
(D5h) and staggered (D5d) conformers of Fc-d-10, respectively. Analysis of the
results in Table 6.3 indicates that D5h and D5d conformers exhibit very similar
ferrocene (Fc-h-10) and Fc-d-10 bands for modes due to CH vibrations.
Fig 6.12 clearly shows that Band A does not exhibit significant shift, irrespective
of conformer and isotopes. Further analysis of the vibrations in the IR spectral
region near 500 cm-1 reveals interesting results. As mentioned earlier, the
vibrations in this region are dominated by vibrations involving the centre Fe atom.
It was discussed in section 6.3.3 that for eclipsed ferrocene (D5h, Fc-h-10), the
first IR peak at υ1 = 471.23 cm-1 is assigned to a2”, whereas the second peak at
υ2(1), υ2
(2) = 488.70 cm-1 is assigned to the doubly degenerate state of e1’. For the
deuterated analogue of eclipsed ferrocene (D5h, Fc-d-10), the υ1 peak is shifted by

Ferrocene Chapter 6
193
a factor of 1.06 to 443.14 cm-1 and υ2 peak is shifted by a factor of 1.02 to 477.14
cm-1. This means that the splitting (Δυ) between υ1 and υ2 is 17 cm-1 for eclipsed
ferrocene (Fc-h-10), whereas 34 cm-1 for eclipsed Fc-d-10. As a result, this
splitting has increased by the deutration of ferrocene.
As explained earlier in section 6.3.3, for the staggered conformer of ferrocene
(D5d, Fc-h-10), the first IR peak at υ1(1), υ1
(2) = 459.52 cm-1 is assigned to a doubly
degenerate state of e1u, whereas the second peak at υ2 = 461.23 cm-1 is assigned to
a2u. The splitting between υ1 and υ1 is very tiny, i.e. ca. 2 cm-1. However, for the
deuterated analogue of D5d ferrocene (Fc-d-10), υ1 is assigned to a2u, but υ2 is a
doubly degenerate states being assigned to e1u. Therefore, the degeneracy and the
symmetry assignment of the D5d conformer of ferrocene in this region (ca. 500
cm-1) are swapped compared to its deuterated analogue, while no such swapping
is observed for D5h conformer.
Examination of the positions of υ1 and υ2 in staggered Fc-d-10 reveals that υ1 is
shifted by a factor of 1.05 to 435.76 cm-1 in Fc-d-10, while υ2 is shifted by a factor
of 1.02 to 449.82 cm-1. This corresponds to a splitting of 14.06 cm-1 between υ1
and υ2 in staggered Fc-d-10. As was seen in Fig. 6.10, the splitting (Δυ) between
υ1 and υ2 in staggered conformer of ferrocene was so tiny that it couldn’t appear as
two peaks in its IR spectrum. However, Δυ is large enough for its deuterated
counterpart to appear in the IR spectra.
By comparing the splitting (Δυ) of the IR spectra of ferrocene and Fc-d-10 (in the
fingerprint region, ca. 500 cm-1), it is observed that the splitting between spectra
has been enhanced in Fc-d-10. For example, Δυ has increased from 17 cm-1 → 34
cm-1, 2 cm-1 → 14 cm-1 and 16 cm-1 → 24 cm-1 for simulated D5h, simulated D5d
and experimental ferrocene upon deutration, respectively.
Fig. 6.13 gives the IR peaks at ca. 460-470 cm-1 for ferrocene eclipsed (D5h) and
staggered (D5d) conformers and their deuterated analogues. This figure clearly
shows the widening of the splitting (Δυ) of the IR spectra of ferrocene upon

Ferrocene Chapter 6
194
deutration. It can also be seen from this figure than deutration of ferrocene results
in the red-shift of the IR spectral peaks.
Fig. 6.13: The IR spectra of the eclipsed (D5h) and staggered (D5d) ferrocene (Fc-h-10) and deuterated ferrocene (Fc-d-10) in the fingerprint region.

Ferrocene Chapter 6
195
6.3.6. Infrared spectroscopy of ferrocene in solution
As seen previously in section 6.3.3, the B3LYP/m6-31G(d) model accurately
simulated the IR spectra of Fc without scaling in gas phase, as the basis set [8] for
the central Fe atom of the sandwich compound plays a significant role [28]. For
the Fe atom, the modified 6-31G(d) basis set, i.e., m6-31G(d) is an appropriate
basis set for accurately modelling the IR spectra of the complexes containing Fe.
In the present section, we provide a combined study of DFT calculations with
high-resolution FTIR experimental measurements in various solvents, in order to
validate the earlier theoretical prediction of the Fc conformers.
Fig. 6.14 compares the FTIR spectral region of 400-1200 cm-1 in a number of
different solvents at room temperature. The FTIR spectra were recorded in non-
polar solvents such as acetonitrile (ACN, ε=35.69), dichloromethane (DCM,
ε=8.93) and tetrahydrofuran (THF, ε=7.43). As seen in this figure, all spectra
exhibit four major bands at ca. 480-500 cm-1 (Band A), 820 cm-1 (Band B), 1010
cm-1 (Band C) and 1100 cm-1 (Band D). Band A at ca. 480-500 cm-1 consists of
two peaks: a peak of lower intensity at 479.5 cm-1 and another one at 495.0 cm-1.
The latter has a higher intensity. Band B at ca. 820 cm-1 presents two small
shoulders. One of these shoulders is located on the right side, and the other one is
located on the left side of the main peak. From FTIR spectra illustrated in Fig.
6.14, it is apparent that the positions and the intensities of these shoulders slightly
vary in different solutions.
Fig. 6.14 also shows that the Band C at ca. 1010 cm-1 exhibits slightly different
intensity when measured in different solutions. For example, the intensity of this
peak is higher in DCM compared to that of ACN and THF solutions. There are no
significant differences associated with these three solvents for Band D at ca. 1100
cm-1. Perhaps the most noticeable difference is a slightly lower intensity of this
peak in THF solution compared to that of ACN and DCM. The present FTIR
spectra in solutions consistently show excellent agreement with the experimental
IR spectrum of ferrocene reported by Duhovic and Diaconescu in the DCM
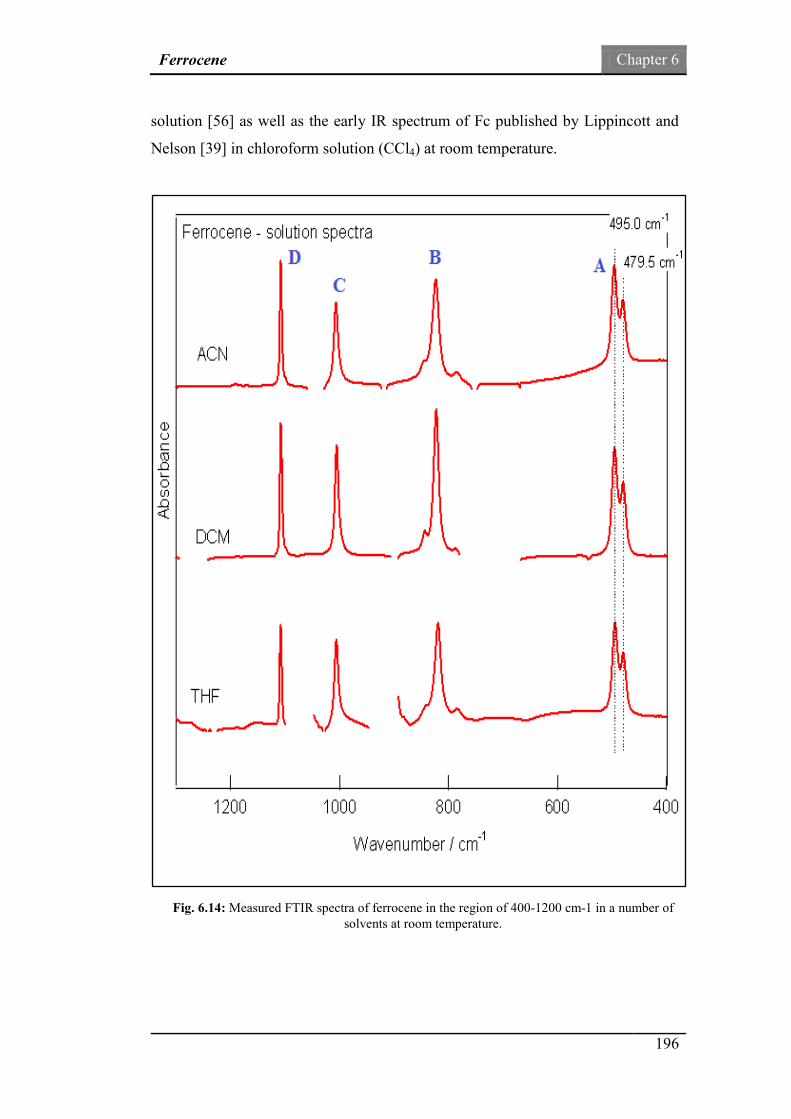
Ferrocene Chapter 6
196
solution [56] as well as the early IR spectrum of Fc published by Lippincott and
Nelson [39] in chloroform solution (CCl4) at room temperature.
Fig. 6.14: Measured FTIR spectra of ferrocene in the region of 400-1200 cm-1 in a number of solvents at room temperature.

Ferrocene Chapter 6
197
To further validate the measured FTIR data, Table 6.4 reports the Fc IR spectral
peak positions in the solutions and compares with other experimental
measurements and calculations in 400-1200 cm-1. It can be seen from the data in
Table 6.4 that the present experimental measurements in different non-polar
solvents consistently agree with the available IR measurements in solutions in this
region. For example, the IR spectral peak positions in the dichloromethane
(DCM) solution were measured as 478 cm-1 and 494 cm-1, 822 cm-1, 1004 cm-1
and 1106 cm-1 in a recent study [56]. The present FTIR measurement reports these
peaks at 478 cm-1 and 495 cm-1, 820 cm-1, 1005 cm-1 and 1107 cm-1. As a result,
the present experimental measurement in DCM solution almost exactly
reproduced all IR spectral peak positions in the region of 400-1200 cm-1. The
experimental results, as shown in Table 6.4, indicate that the positions of the
spectral peaks measured in the non-polar solvents are almost identical, which
are consistently reported within ±3 cm-1 of accuracy. This reveals that the
influence of the solvent on the IR spectra of Fc is small and negligible.
Table 6.4: Comparison of the measured Fc spectral peak positions in various solvents and available experiment and calculations.
This Worka Ref.[56] Ref.[26] Ref.[39]
Expt. B3LYP/m6-31G(d)
Expt. B3LYP/ 6-31G*b
B3LYP/ Type-I
Expt.
ACN DCM THF DOX DOXa Gas[28] DCM Gas Gas CCl4 Gas
υ1 480 478 479 479 471 471 478 480 470 478 480
υ2 496 495 495 495 489 488 494 510 473 492 496
υ3 823 820 820 821 845 844 822 844 825 811 816
υ4 1006 1005 1005 1006 1033 1035 1004 1036 1017 1002 1012
υ5 1107 1107 1108 -c 1141 1141 1106 1140 1141 1108 1112
a DFT model: SMD-B3LYP/m6-31G(d). b A scaling factor of 0.95 was employed in the calculations in Ref. [56] and private communications (2013). c The spectrum cut off in this solution was after 1100 cm-1 as the measurement in this solution concentrated in the region under 1000 cm-1.

Ferrocene Chapter 6
198
Comparisons between the theoretical and the experimental IR spectra of ferrocene
are made using Fig 6.15. This figure compares the measured FTIR spectrum
(middle panel) of Fc in the acetonitrile (ACN) solution with the simulated infrared
spectra of the eclipsed (D5h, top panel) and the staggered (D5d, bottom panel)
conformers of ferrocene in the region of 400-1200 cm-1. In the simulations
reported in Fig. 6.15, the implicit solute molecular density (SMD) model [13] is
applied.
Fig. 6.15: The measured IR spectrum (middle panel) of Fc in acetonitrile (ACN) solution with
the simulated infrared spectra of the eclipsed (D5h, top panel) and the staggered (D5d, bottom panel) conformers of Fc in the region of 400-1200 cm-1. The spectrum clearly indicates the
dominance of eclipsed Fc in this solution.
Ferrocene Chapter 6
199
It can be seen from Fig. 6.15 that the overall agreement between simulations and
experiment (FTIR) is excellent. For example, the major FTIR spectral peaks in the
measurement (middle panel) are reproduced by the simulations of both Fc
conformers. For instance, the measured peak positions are given at 480 cm-1,496
cm-1, 823 cm-1, 1006 cm-1 and 1107 cm-1 in the ACN solution. In the simulated IR
spectrum of the eclipsed Fc conformer in the same solution, these spectral peaks
are calculated as 467 cm-1/484 cm-1, 852 cm-1, 1027 cm-1 and 1133 cm-1,
respectively, without any scaling and shifting. These IR peaks of the staggered Fc
conformer, on the other hand, are given by 458 cm-1 (only one peak), 854 cm-1,
1029 cm-1 and 1134 cm-1, accordingly, under the same conditions.
From Fig. 6.15 it can be seen that only the IR spectral peak(s) of the eclipsed Fc
conformer in the region less than 500 cm-1 splits into two peaks. For the simulated
IR spectrum of D5h conformer, a more intensive peak at a larger frequency (i.e.
495 cm-1) and a less intensive peak at a smaller frequency (i.e. 479 cm-1) are
observed. The staggered Fc conformer, however, does not show such the splitting,
in agreement with our previous study in gas phase [28] (discussed in section 6.3.3
of this chapter).
In addition to the present experimental FTIR measurement, such IR spectral
splitting of Fc has also been observed by a number of earlier experiments
including the ones reported by Lippincott and Nelson [39] and Duhovic and
Diaconescu [56]. Therefore, the most striking result to emerge from comparing
the simulated and the measured IR spectra presented in Fig. 6.15 is that the
measured IR spectra is more likely related to dominance of eclipsed ferrocene
conformer in solution. As explained earlier in section 6.3.3, this particular spectral
feature in the IR fingerprint region of 400-500 cm-1 can be considered as the
signature of the eclipsed Fc conformer.
From Fig 6.15 it is also noticeable that the calculated spectral peaks red-shift (i.e.
shift to smaller wavenumbers) in the region below 500 cm-1 but blue shift (i.e.
shift to larger wavenumbers) in the spectral region above 500 cm-1 compared to

Ferrocene Chapter 6
200
the measurements (Expt.). Further investigation into the related vibrations reveals
that the spectral peak(s) in the region below 500 cm-1 are associated with Fe-C
stretches, whereas the vibrations at 845 cm-1, 1032 cm-1 and 1141 cm-1 are
assigned to C-H out of plane, C-C-H bend and Cp breathing (one Cp shrinks, one
Cp expands) vibrations, respectively. This is in agreement with the gas-phase
studies of ferrocene (discussed in section 6.3.3 ) [26, 28, 39]. Previous studies [26,
57, 58] indicated that the scaling factors of simulated IR spectra (force field) of
compounds are usually smaller than 1.0 [59-61]. That is, the calculated vibrational
frequencies are usually larger than the measurement, except for the Fe-C stretch
vibration which needs a scaling factor as large as 1.25 [26] (1.02 in the present
study due to the more suitable m6-31G(d) basis set), i.e., the calculated
frequencies of Fe-C related vibrations are smaller than the measured ones.
Table 6.5 compares the measurement and calculations for the spectral peaks of the
eclipsed Fc in different solutions. The largest error is within 4% between the
measurements and calculations in the region of 400-1200 cm-1, indicating that the
theoretical model is sufficiently accurate for the Fc conformers. The red shift (by
colour) for the Fe related vibrations and the blue shift for other vibrations are
apparently shown in this table.
Table 6.5: Comparison of the measured and simulated Fc IR spectral peak positions in various solvents in the region of 400-1200 cm-1.
ACN (ε=35.69) DCM(ε=8.93) THF(ε=7.43) DOX(ε=2.21)
Expt Calca ∆υb Expt Calca ∆υb Expt Calca ∆υb Expt Calca ∆υb
υ1 480 467 -13 478 466 -12 479 467 -12 479 471 -8
υ2 496 484 -12 495 484 -11 495 485 -10 495 489 -6
υ3 823 852 29 820 850 30 820 851 31 821 845 24
υ4 1006 1027 21 1005 1029 24 1005 1029 24 1006 1033 27
υ5 1107 1133 26 1107 1134 27 1108 1134 26 - 1141 -
(a) Simulation DFT model: SMD-B3LYP/m6-31G(d). (b) Spectral shift: ∆υ = υcalc.-υexpt.
Ferrocene Chapter 6
201
The present study will concentrate on the IR spectra of the eclipsed Fc in the
region of 400-500 cm-1, as the most noticeable feature of the FTIR spectra in Fig.
6.14 and Fig. 6.15 is the spectral peak splitting in the region of approximately
480-500 cm-1 in all solutions. The major peak locates at 495 cm-1, whereas the
minor peak locates at 479 cm-1 (note that the resolution of the Bruker Tensor
FTIR spectrometer is 1 cm-1), with a measured spectral splitting of approximately
16 cm-1 in the ACN solution. The splitting of the twin peak agrees well with the
earlier IR measurement of Lippincott and Nelson [39], in which the spectral peaks
located at 492 cm-1 and 478 cm-1 in chloroform solution with a spectral splitting of
14 cm-1, and with the recent FTIR measurement at 478 cm-1 and 494 cm-1 in DCM
solution with a splitting of 16 cm-1 of Duhovic and Diaconescu [56]. Note that the
present IR calculations do not use any scaling, whereas the calculated IR spectra
of Ref. [56] employed a scaling factor of 0.95.
In order to simulate solvation effects on the simulated infrared (IR) spectra of
ferrocene, implicit continuum solvation methods are employed in this thesis. Of
the implicit solvent models, some are able to reproduce the experiment
measurements better than other solvent models. Figure 6.16 compares the
simulated IR spectra of eclipsed (D5h) Fc in dioxane (DOX) solution using three
different models including polarizable continuum model (PCM) [26], C-PCM
(conductor PCM) [27, 28] and SMD (solute molecule density) [29], with the
present FTIR spectral measurement.
The solute molecule density (SMD) model seems to achieve a slightly more
accurate agreement with the measurement over the PCM and C-PCM models. As
shown in Fig. 6.16, PCM and CPCM model produce almost exactly the same
result for the peaks in the spectral region below 500 cm-1. For instance both
models predict the frequency of the first peak (i.e. the one with lower-intensity) at
469 cm-1 and the that of the second peak at 487 cm-1 (i.e. the one with higher-
intensity). This means that the deviation from the experimental values, as
presented in the figure, is 10 cm-1 for the first peak and 8 cm-1 for second peak.
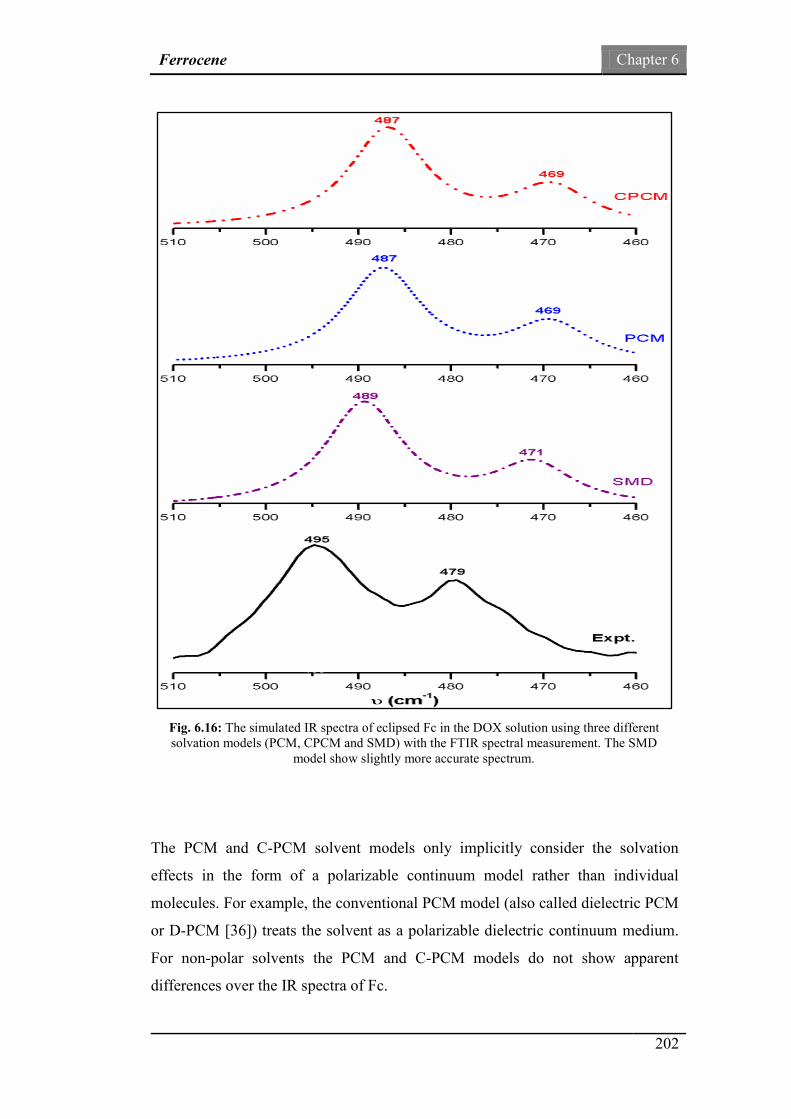
Ferrocene Chapter 6
202
The PCM and C-PCM solvent models only implicitly consider the solvation
effects in the form of a polarizable continuum model rather than individual
molecules. For example, the conventional PCM model (also called dielectric PCM
or D-PCM [36]) treats the solvent as a polarizable dielectric continuum medium.
For non-polar solvents the PCM and C-PCM models do not show apparent
differences over the IR spectra of Fc.
Fig. 6.16: The simulated IR spectra of eclipsed Fc in the DOX solution using three different solvation models (PCM, CPCM and SMD) with the FTIR spectral measurement. The SMD
model show slightly more accurate spectrum.
Ferrocene Chapter 6
203
Fig. 6.16 also shows that SMD model predicts the frequencies of the first and the
second peak at 471 cm-1 and 489 cm-1, respectively. As a result, the deviations
from the experimental values in the figure are 6 cm-1 for the first peak and 8 cm-1
for the second peak. The solute molecule density (SMD) model is a continuum
solvation model based on the quantum mechanical charge density of a solute
molecule interacting with a continuum description of the solvent. From the
deviation data, it can be concluded that the SMD model simulates the IR spectra
of Fc in solutions more accurately and therefore, it is employed to simulate the
solvent effects on the IR spectra of ferrocene in this thesis.
From the previous figure (Fig. 6.16), it can be seen that the simulated (D5h, SMD)
and the measured (FTIR) spectra of ferrocene in the fingerprint region in dioxan
(DOX) solution are in excellent agreement. To investigate solvent effects, Fig.
6.17 compares the simulated IR spectra of the eclipsed Fc in the region of 400-
600 cm-1 with the FTIR measurements in several solvents. The theory (simulation)
employs the DFT based B3LYP/m6-31G(d) model in conjunction with the SMD
continuum solvent model to simulate the IR spectra of the eclipsed Fc in THF,
DCM, ACN and DOX solvents. The theoretical spectra of the eclipsed Fc (D5h)
are produced in the present study without any scaling. However, the simulated
spectra in Fig. 6.17 are presented with a blue shift of 6 cm-1 and 10 cm-1 for
DOX and THF solvents, respectively, and of 11 cm-1 for DCM and ACN solvents.
As seen from this figure, after small shifts, the simulated spectra agree well with
the measurements including the twin peak splitting of the eclipsed Fc.

Ferrocene Chapter 6
204
Fig. 6.17: Comparison of the simulated IR spectra of the eclipsed Fc in the region of 400-600 cm-1 with the FTIR measurement in various solvents. Small shift to align the larger peak is
applied.

Ferrocene Chapter 6
205
6.4. Ferrocene-based electrolyte
So far chapter has focussed on the structure and properties of the ferrocene
conformers. The following section will discuss some of the properties of ferrocene
which needs to be investigated when considering ferrocene application in dye
sensitized solar cells.
6.4.1. Ferrocene/ferrocenium redox potential
Rational approach can be taken to design not only new dye sensitizers, but also
new redox mediators. In chapters 3-5 of this thesis, several rational design
strategies for the development of new dyes have been discussed. The aim of the
current chapter was to study the ferrocene compound as an important candidate
for the redox system. So far this chapter has focussed on the structure of the
ferrocene compound. Turning now to the application of ferrocene in dye
sensitized solar cells (DSSC), the electrochemical characterization of
ferrocene/ferrocenium (Fc/Fc+) redox couple will be discussed hereafter. In
addition, an accurate model for computing the redox potential of Fc/Fc+ redox
couple will be given. This model is particularly important for the rational design
of ferrocene derivatives as new redox couples.
The redox couple, as its name suggests, contains two parts, an oxidizing agent
(oxidant) and a reducing agent (reductant). For example, ferrocene (Fc) is the
reducing part in the Fc/Fc+ redox couple. It means that Fc reduces the dye cation.
This reaction is known as “dye regeneration”. The ferrocenium (Fc+) cation
should be reduced to ferrocene at the counter electrode of the cell. This step is
known as the diffusion of the oxidized form of the redox shuttle (e.g. Fc+ in this
example) to the counter electrode, which completes the electrochemical circuit in
DSSC [62]. As seen, the redox couple functions as one of the key components in
Ferrocene Chapter 6
206
the DSSC. In addition, the open circuit voltage of the cell depends on the redox
couple in the electrolyte [63] (as well as the semiconductor (TiO2)).
There is a large volume of published studies on the redox properties of the
ferrocene/ferrocenium (Fc/Fc+) couple [64-76]. Such considerable attention in
electrochemistry of ferrocene stems from the recommendation of the international
union of applied chemistry (IUPAC) for employing Fc/Fc+ as the reference redox
system in non-aqueous solutions [77]. In addition, derivatives of ferrocene can be
prepared relatively easy by modifications of the cyclopentadienyl rings [78-83].
This allows tuning the redox behaviour of the redox mediator. Such feature also
facilitates rational design of new redox couples based on ferrocene and its
derivatives for the application in DSSC [1].
Ferrocene-based redox couples were not considered as serious alternative to the
conventional iodide/triiodide redox couple until recently. That is because the
previous attempts to replace the iodide/triiodide with ferrocene-based redox
couples led to very low efficiencies (η<0.4%) [84, 85], where changes have only
been made on a single component (i.e. redox couple); whereas the dye sensitizer,
i.e. conventional N3 dye remained unchanged. In 2011, a high-efficiency DSSC
was reported by Daeneke et al., in which Fc/Fc+ redox couple was employed in
combination with a novel organic dye sensitizer (i.e. Carbz-PAHTDTT) [2]. This
cell could achieve energy conversion efficiency (η) of 7.5% under simulated one
sun irradiation (AM1.5, 1000 Wm-2). In a follow-up study published in 2012, the
same authors investigated ferrocene derivatives as redox mediator [1]. The focus
of this latter work was “to examine the effect of the redox potential on charge
transfer process” [1]. Here, the authors chose six already-available (synthesized)
ferrocene derivatives which could cover a redox potential range of 0.09-0.94 V vs.
normal hydrogen electrode (NHE). Such investigation heightens the need for the
“rational design” of alternative redox mediators such as ferrocene derivatives
with desirable redox potential.

Ferrocene Chapter 6
207
A feasible and applicable direction for rational design of ferrocene derivatives
should focus on the modifications of the cyclopentadienyl rings with the aim of
achieving an specific target redox potential (i.e. tuning the redox-potential).
Density functional theory (DFT) has been proven a reliable tool to calculate the
redox potential of couples based on ferrocene [64, 86, 87], ferrocene derivatives
[87], other transition metal complexes [86, 88-95], actinide systems [96] and
organic compounds [97]. As a result, DFT model can be employed for the rational
design of ferrocene derivatives. Here, we probe the performance of the
B3LYP/m6-31G(d) model to accurately reproduce the absolute redox potential of
Fc/Fc+ couple in dimethyl sulfoxide (DMSO) solution. To the best of our
knowledge, this model has not been employed for such calculations on ferrocene.
If this model reproduces the experimental redox potential accurately, it is
anticipated to reproduce the redox potential of ferrocene derivatives, and thus
facilitates the rational design of alternative ferrocene-based electrolyte for DSSC.
The previous results in this chapter showed that D5h is the dominant conformation
of gas-phase ferrocene. Therefore only the eclipsed form is considered to calculate
redox potential. The required values to calculate the redox potential from eq. (6.1)
are given in Table 6.6. These values are obtained from the outputs of geometry
optimization and frequency calculations of Fc and Fc+ in gas and in DSMO
solution.
Based on the values given in Table 6.6, we calculated the redox potential, Em0/+ =
5.079 V. This result is in a very good agreement with the experimental value of
5.10 V. Note that it is calculated from the experimental value of 0.43 V for the
reduction potential of Ferrocene+1/0 couple relative to the reference saturated
calomel electrode (SCE) in DMSO reported by Connelly and Geiger [98]. A
recent value of 4.67 V for nonaqueous SCE [97] is considered in this calculation.
The agreement shows the reliability of the model used here (i.e. B3LYP/m6-
31G(d)) for the calculations of ferrocene features in agreement with our previous
calculations on ferrocene infrared spectra using the same model [28]. To the best
of our knowledge, this is the first time that this model is used to calculate the

Ferrocene Chapter 6
208
absolute redox potential of ferrocene. These findings suggest that the B3LYP/m6-
31G(d) model is suitable in the prediction of the redox potential of ferrocene-
based couples. As a result, this model can be used to develop rational design and
screening procedures aimed at designing new redox couples based on ferrocene-
derivatives with desirable redox values.
Table 6.6: Calculated values required to obtain the redox potential of Fc/Fc+ in
DSMO solution. All energy values are in hartree (Eh).
Fc Fc+
SCFE(g)a -1650.66 -1650.41
GibbsCorrb 0.14 0.137
Gc -1650.52 -1650.27
ΔGox(g)d 0.25
SCFE(solv)e -1650.67 -1650.48
∆Gsolvf -0.0037 -0.0700
∆Gox(solv)g 0.19
a. Energy of the optimized system in gas-phase. b. Thermal correction to Gibbs free energy. c. Absolute value of the Gibbs free energy. G= SCFE(g)+ GibbsCorr d. The free energy change due to oxidation reaction of Fc to Fc+ in the gas phase. ΔGox(g)=G(Fc+)-G(Fc) e. Energy of the system with solvent effects. f. The solvation free energies. g. Gibbs free energy change due to the reaction: [Fc]0 (sol) → [Fc]+ (sol).

Ferrocene Chapter 6
209
6.5. Conclusions
This chapter has investigated the structure and properties of ferrocene as an
important compound for alternative redox mediator preparation. The eclipsed
(D5h) and staggered (D5d) conformers of ferrocene have been investigated. No
properties of Fc have been reported to differentiate the eclipsed and staggered
conformers of Fc until recently [28].
The infrared (IR) spectra of the D5h and D5d conformers of ferrocene have been
simulated using DFT based B3LYP/m6-31G(d) model. It is found that in gas
phase, the eclipsed conformer represents the true minimum structure of ferrocene,
whereas the staggered conformer represents the saddle point structure, in
agreement with a number of other theoretical [24, 45] and recent experimental
studies [35]. The present chapter indicates that the sandwich complexes are
formed by stacking the two Cp rings with an Fe atom in the middle, rather than
being formed with the conventional ten Fe−C bonds as displayed by many of
previous studies of ferrocene. It is further discovered in this study that whenever
the centre Fe is involved, the eclipsed and staggered structures of ferrocene start
to show their unique properties and therefore the conformers can be differentiated
through the fingerprints. The 17 cm-1 IR frequency splitting in the region of 400-
500 cm-1, therefore, becomes one of such fingerprints for the eclipsed conformer
of ferrocene. In addition, the present study suggests that the earlier IR spectral
measurement of Lippincott and Nelson [39] on ferrocene was indeed a mixture of
both eclipsed and staggered ferrocene conformers.
To confirm the aforementioned results, a combined high-resolution Fourier
transform infrared (FTIR) spectra of ferrocene and density functional theory based
quantum mechanical calculations was also performed in this chapter. A number of
non-polar solvents, such as ACN, DCM, THF, and DOX, in a region of 400-1200
cm-1 were investigated. Furthermore, the solutions in high and low concentrations
are measured in the region of 400-600 cm-1, respectively. The measurements
consistently agree well with previously available IR spectra in CCl4 solution of

Ferrocene Chapter 6
210
Lippincott and Nelson [39] as well as the most recent IR spectral measurement in
dichloromethane (DCM) solution [56]. The IR spectra of ferrocene are also
simulated using density functional theory (DFT) based B3LYP/m6-31G(d) model
in dioxane solution for both eclipsed and staggered Fc conformers. All
experimental measurements in solutions unambiguously exhibit an IR spectral
splitting as predicted [99]. When combined the experimental results with theory, it
is concluded that the spectral splitting in the IR fingerprint region of ca. 500 cm-1
must have the structure of eclipsed Fc (D5h), whereas this spectral peak of the
staggered Fc (D5d) do not split. The present chapter further investigated the effects
of solvents on the IR spectra and the solvent model effects on the simulated
spectra. It is found that the IR spectra of ferrocene are not apparently solvent
dependent. Only small spectral shifts are due to different solvent models but the
solute related model, i.e., the solute molecular density (SMD) model seems to
produce the most accurate IR spectrum in the region of 400-600 cm-1 of ferrocene.
Concerning the computational design of alternative redox mediators for dye
sensitized solar cells (DSSC), the results of this chapter show that computational
methods can be employed to accurately calculate the redox potential of
ferrocene/ferrocenium (Fc/Fc+) couple. In particular, we showed that our
B3LYP/m6-31G(d) model is very accurate for such calculations on Fc/Fc+ couple.
An implication of this is the possibility that this model is efficient and accurate in
rational design of new ferrocene-based redox mediators with desirable redox
potential.

Ferrocene Chapter 6
211
References
1. T. Daeneke, A.J. Mozer, T.-H. Kwon, N.W. Duffy, A.B. Holmes, U. Bach and L. Spiccia, Dye regeneration and charge recombination in dye-sensitized solar cells with ferrocene derivatives as redox mediators. Energy & Environmental Science, 2012. 5(5): p. 7090-7099.
2. T. Daeneke, T.-H. Kwon, A.B. Holmes, N.W. Duffy, U. Bach and L. Spiccia, High-efficiency dye-sensitized solar cells with ferrocene-based electrolytes. Nature Chemistry, 2011. 3(3): p. 211-215.
3. T.J. Kealy and P.L. Pauson, A New Type of Organo-Iron Compound. Nature, 1951. 168(4285): p. 1039-1040.
4. S.A. Miller, J.A. Tebboth and J.F. Tremaine, 114. Dicyclopentadienyliron. Journal of the Chemical Society (Resumed), 1952. 0(0): p. 632-635.
5. P. Laszlo and R. Hoffmann, Ferrocene: Ironclad History or Rashomon Tale? Angewandte Chemie International Edition, 2000. 39(1): p. 123-124.
6. H. Werner, At Least 60 Years of Ferrocene: The Discovery and Rediscovery of the Sandwich Complexes. Angewandte Chemie-International Edition, 2012. 51(25): p. 6052-6058.
7. M. J. Frisch, G. W. Trucks, H. B. Schlegel, G. E. Scuseria, M. A. Robb, J. R. Cheeseman, G. Scalmani, V. Barone, B. Mennucci, G. A. Petersson, H. Nakatsuji, M. Caricato, X. Li, H. P. Hratchian, A. F. Izmaylov, G.Z. J. Bloino, J. L. Sonnenberg, M. Hada, M. Ehara, K. Toyota, R. Fukuda, J. Hasegawa, M. Ishida, T. Nakajima, Y. Honda, O. Kitao, H. Nakai, T. Vreven, J. A. Montgomery, J.E.P. Jr., F. Ogliaro, M. Bearpark, J. J. Heyd, E. Brothers, K. N. Kudin, V. N. Staroverov, R. Kobayashi, J. Normand, K. Raghavachari, A. Rendell, J. C. Burant, S. S. Iyengar, M.C. J. Tomasi, N. Rega, J. M. Millam, M. Klene, J. E. Knox, J. B. Cross, V. Bakken, C. Adamo, J. Jaramillo, R. Gomperts, R. E. Stratmann, O. Yazyev, A. J. Austin, R. Cammi, C. Pomelli, J. W. Ochterski, R. L. Martin, K. Morokuma, V. G. Zakrzewski, G. A. Voth, P. Salvador, J. J. Dannenberg, S. Dapprich, A. D. Daniels, Ö. Farkas, J. B. Foresman, J. V. Ortiz, J. Cioslowski and D. J. Fox, Gaussian 09. 2009, Gaussian Inc.: Wallingford CT.
8. A.V. Mitin, J. Baker and P. Pulay, An improved 6-31G* basis set for first-row transition metals. Journal of Chemical Physics, 2003. 118(17): p. 7775-7783.
Ferrocene Chapter 6
212
9. J. Martin, J. Baker and P. Pulay, Comments on the molecular geometry of ferrocene: The dangers of using quantum chemistry programs as black boxes. Journal of Computational Chemistry, 2009. 30(6): p. 881-883.
10. M. Cossi and V. Barone, Analytical second derivatives of the free energy in solution by polarizable continuum models. Journal of Chemical Physics, 1998. 109(15): p. 6246-6254.
11. M. Cossi, N. Rega, G. Scalmani and V. Barone, Energies, structures, and electronic properties of molecules in solution with the C-PCM solvation model. Journal of Computational Chemistry, 2003. 24(6): p. 669-681.
12. V. Barone and M. Cossi, Quantum calculation of molecular energies and energy gradients in solution by a conductor solvent model. Journal of Physical Chemistry A, 1998. 102(11): p. 1995-2001.
13. A.V. Marenich, C.J. Cramer and D.G. Truhlar, Universal solvation model based on solute electron density and on a continuum model of the solvent defined by the bulk dielectric constant and atomic surface tensions. The Journal of Physical Chemistry B, 2009. 113(18): p. 6378-96.
14. J.L. Palma and V.S. Batista Tutorial on Ab Initio Redox Potential Calculations. Yale University. http://www.chem.yale.edu/~batista/CHEM505/redoxpotentials.pdf. Accessed 15/10/2013 2013
15. F. Calle-Vallejo and M.T.M. Koper, First-principles computational electrochemistry: Achievements and challenges. Electrochimica Acta, 2012. 84(0): p. 3-11.
16. R.S. Nyholm, The Renaissance of inorganic chemistry / by R.S. Nyholm. 1956: London : Published for the college by H. K. Lewis.
17. G. Wilkinson, M. Rosenblum, M.C. Whiting and R.B. Woodward, The Structure of Iron Bis-Cyclopentadienyl. Journal of the American Chemical Society, 1952. 74(8): p. 2125-2126.
18. W.P. E. O. Fischer, Z. Naturforsch. B, 1952. 7: p. 377 – 379.
19. E.O.F. E. Ruch, Z. Naturforsch. B, 1952. 7: p. 676.
20. J.D. Dunitz and L.E. Orgel, Bis-Cyclopentadienyl Iron - a Molecular Sandwich. Nature, 1953. 171(4342): p. 121-122.
21. P.F. Eiland and R. Pepinsky, X-Ray Examination of Iron Biscyclopentadienyl. Journal of the American Chemical Society, 1952. 74(19): p. 4971-4971.
Ferrocene Chapter 6
213
22. J.D. Dunitz, L.E. Orgel and A. Rich, The Crystal Structure of Ferrocene. Acta Crystallographica, 1956. 9(4): p. 373-375.
23. R.K. Bohn and A. Haaland, On the molecular structure of ferrocene, Fe(C5H5)2. Journal of Organometallic Chemistry, 1966. 5(5): p. 470-476.
24. S. Coriani, A. Haaland, T. Helgaker and P. Jørgensen, The equilibrium structure of ferrocene. ChemPhysChem, 2006. 7(1): p. 245-249.
25. D.R. Roy, S. Duley and P.K. Chattaraj, Bonding, reactivity and aromaticity in some novel all-metal metallocenes. Proc. Ind. Natl. Sci. Acad., 2008. 74: p. 11.
26. T.P. Gryaznova, S.A. Katsyuba, V.A. Milyukov and O.G. Sinyashin, DFT study of substitution effect on the geometry, IR spectra, spin state and energetic stability of the ferrocenes and their pentaphospholyl analogues. Journal of Organometallic Chemistry, 2010. 695(24): p. 2586-2595.
27. D.E. Bean, P.W. Fowler and M.J. Morris, Aromaticity and ring currents in ferrocene and two isomeric sandwich complexes. Journal of Organometallic Chemistry, 2011. 696(10): p. 2093-2100.
28. N. Mohammadi, A. Ganesan, C.T. Chantler and F. Wang, Differentiation of ferrocene D5d and D5h conformers using IR spectroscopy. Journal of Organometallic Chemistry, 2012. 713(0): p. 51-59.
29. F.A. Cotton and G. Wilkinson Advanced Inorganic Chemistry. 5th ed., 1988, New York John Wiley & Sons.
30. E.O. Fischer and W. Pfab, Zur Kristallstruktur der Di-Cyclopentadienyl-Verbindungen des zweiwertigen Eisens, Kobalts und Nickels. Zeitschrift für Naturforschung, 1952. B7(B7): p. 377–379.
31. J.D. Dunitz and L.E. Orgel, Bis-cyclopentadienyl iron: a molecular sandwich. Nature, 1953. 171(4342): p. 121-122.
32. A. Haaland and J.E. Nilsson, The determination of barriers to internal rotation by means of electron diffraction. Ferrocene and ruthenocene. Acta Chemica Scandinavica, 1968. 22 p. 2653-2670.
33. A. Haaland, J. Lusztyk, D.P. Novak, J. Brunvoll and K.B. Starowieyski, Molecular structures of dicyclopentadienylmagnesium and dicyclopentadienylchromium by gas-phase electron diffraction. Journal of the Chemical Society, Chemical Communications, 1974(2): p. 54-55.
34. P. Seiler and J.D. Dunitz, Low-temperature crystallization of orthorhombic ferrocene: structure analysis at 98 K. Acta Crystallographica Section B, 1982. 38(6): p. 1741-1745.
Ferrocene Chapter 6
214
35. C.T. Chantler, N.A. Rae, M.T. Islam, S.P. Best, J. Yeo, L.F. Smale, J. Hester, N. Mohammadi and F. Wang, Stereochemical analysis of ferrocene and the uncertainty of fluorescence XAFS data. Journal of Synchrotron Radiation, 2012. 19: p. 145-158.
36. D.C. Cooper, C.J. Yennie, J.B. Morin, S. Delaney and J.W. Suggs, Development of a DNA-damaging ferrocene amino acid. Journal of Organometallic Chemistry, 2011. 696(19): p. 3058-3061.
37. U. Schatzschneider and N. Metzler-Nolte, New principles in medicinal organometallic chemistry. Angewandte Chemie International Edition 2006. 45(10): p. 1504-1507.
38. Y. Yamaguchi, W. Ding, C.T. Sanderson, M.L. Borden, M.J. Morgan and C. Kutal, Electronic structure, spectroscopy, and photochemistry of group 8 metallocenes. Coordination Chemistry Reviews 2007. 251(3-4): p. 515-524.
39. E.R. Lippincott and R.D. Nelson, The vibrational spectra and structure of ferrocene and ruthenocene. Spectrochimica Acta 1958. 10(3): p. 307-329.
40. D.R. Roy, S. Duley and P.K. Chattaraj, Bonding, reactivity and aromaticity in some novel all-metal metallocenes. Proceedings of the Indian National Science Academy, 2008. 74: p. 11.
41. T.P. Gryaznova, S.A. Katsyuba, V.A. Milyukov and O.G. Sinyashin, DFT study of substitution effect on the geometry, IR spectra, spin state and energetic stability of the ferrocenes and their pentaphospholyl analogues. J. Organomet. Chem., 2010. 695(24): p. 2586-2595.
42. Roy Dennington, Todd Keith and J. Millam, GaussView, Version 5. 2009, Semichem Inc. Shawnee Mission KS.
43. G. Schaftenaar and J.H. Noordik, Molden: a pre- and post-processing program for molecular and electronic structures. Journal of Computer-Aided Molecular Design, 2000. 14(2): p. 123-134.
44. A.-R. Allouche, Gabedit—A graphical user interface for computational chemistry softwares. Journal of Computational Chemistry, 2011. 32(1): p. 174-182.
45. Z.F. Xu, Y. Xie, W.L. Feng and H.F. Schaefer Iii, Systematic investigation of electronic and molecular structures for the first transition metal series metallocenes M(C5H5)2 (M = V, Cr, Mn, Fe, Co, and Ni). The Journal of Physical Chemistry A, 2003. 107(15): p. 2716-2729.

Ferrocene Chapter 6
215
46. F. Takusagawa and T.F. Koetzle, A neutron diffraction study of the crystal structure of ferrocene. Acta Crystallographica Section B, 1979. 35(5): p. 1074-1081.
47. J.R. Gispert, Coordination Chemistry. 2008: Wiley.
48. J. House and J.E. House, Inorganic Chemistry. 2010: Elsevier Science.
49. R.C. Mehrotra, Organometallic Chemistry. 2007: New Age International (P) Limited.
50. H.B. Gray, Y.S. Sohn and N. Hendrickson, Electronic structure of metallocenes. Journal of the American Chemical Society, 1971. 93(15): p. 3603-3612.
51. N. Mohammadi, F. Wang, S. Best, D. Appadoo, T.M. Islam and C.T. Chantler, Employing IR spectra and isotope labelling to probe ferrocene conformers: theory and experiment. manuscript in preparation, 2014.
52. T. Yang, G. Su, C. Ning, J. Deng, F. Wang, S. Zhang, X. Ren and Y. Huang, New diagnostic of the most populated conformer of tetrahydrofuran in the gas phase. The Journal of Physical Chemistry A, 2007. 111(23): p. 4927-4933.
53. P. Duffy, J.A. Sordo and F. Wang, Valence orbital response to pseudorotation of tetrahydrofuran: A snapshot using dual space analysis. Journal of Chemical Physics, 2008. 128(12): p. 125102-10.
54. C.G. Ning, Y.R. Huang, S.F. Zhang, J.K. Deng, K. Liu, Z.H. Luo and F. Wang, Experimental and theoretical electron momentum spectroscopic study of the valence electronic structure of tetrahydrofuran under pseudorotation. The Journal of Physical Chemistry A, 2008. 112(44): p. 11078-11087.
55. P.C.H. Mitchell, Vibrational Spectroscopy with Neutrons: With Applications in Chemistry, Biology, Materials Science and Catalysis. 2005: World Scientific.
56. S. Duhović and P.L. Diaconescu, An experimental and computational study of 1,1′-ferrocene diamines. Polyhedron, 2013. 52(0): p. 377-388.
57. J. Baker, A.A. Jarzecki and P. Pulay, Direct Scaling of Primitive Valence Force Constants: An Alternative Approach to Scaled Quantum Mechanical Force Fields. The Journal of Physical Chemistry A, 1998. 102(8): p. 1412-1424.
58. S.A. Katsyuba, J. Grunenberg and R. Schmutzler, Vibrational spectra and conformational isomerism of calixarene building blocks. Part I.

Ferrocene Chapter 6
216
Diphenylmethane, (C6H5)2CH2. Journal of Molecular Structure, 2001. 559(1–3): p. 315-320.
59. L. Selvam, F.F. Chen and F. Wang, Methylation of zebularine investigated using density functional theory calculations. Journal of Computational Chemistry, 2011. 32(10): p. 2077-2083.
60. L. Selvam, F. Chen and F. Wang, Solvent effects on blue shifted improper hydrogen bond of C–H⋯O in deoxycytidine isomers. Chemical Physics Letters, 2010. 500(4–6): p. 327-333.
61. F. Chen, L. Selvam and F. Wang, Blue shifted intramolecular C−H···O improper hydrogen bonds in conformers of zidovudine. Chemical Physics Letters, 2010. 493(4–6): p. 358-363.
62. T.W. Hamann, R.A. Jensen, A.B.F. Martinson, H. Van Ryswyk and J.T. Hupp, Advancing beyond current generation dye-sensitized solar cells. Energy & Environmental Science, 2008. 1(1): p. 66-78.
63. G. Boschloo and A. Hagfeldt, Characteristics of the iodide/triiodide redox mediator in dye-sensitized solar cells. Accounts of chemical research, 2009. 42(11): p. 1819-26.
64. M. Namazian, C.Y. Lin and M.L. Coote, Benchmark Calculations of Absolute Reduction Potential of Ferricinium/Ferrocene Couple in Nonaqueous Solutions. Journal of Chemical Theory and Computation, 2010. 6(9): p. 2721-2725.
65. A.J. Zara, S.S. Machado, L.O.S. Bulhões, A.V. Benedetti and T. Rabockai, The electrochemistry of ferrocene in non-aqueous solvents. Journal of Electroanalytical Chemistry and Interfacial Electrochemistry, 1987. 221(1–2): p. 165-174.
66. J. Georges and S. Desmettre, Electrochemistry of ferrocene in anionic, cationic and nonionic micellar solutions. Effet of the micelle solubilization of the half-wave potentials. Electrochimica Acta, 1984. 29(4): p. 521-525.
67. M.H. Baik and R.A. Friesner, Computing redox potentials in solution: Density functional theory as a tool for rational design of redox agents. Journal of Physical Chemistry A, 2002. 106(32): p. 7407-7412.
68. S.M. Batterjee, M.I. Marzouk, M.E. Aazab and M.A. El-Hashash, The electrochemistry of some ferrocene derivatives: redox potential and substituent effects. Applied Organometallic Chemistry, 2003. 17(5): p. 291-297.

Ferrocene Chapter 6
217
69. N.G. Tsierkezos, Cyclic voltammetric studies of ferrocene in nonaqueous solvents in the temperature range from 248.15 to 298.15 K. Journal of Solution Chemistry, 2007. 36(3): p. 289-302.
70. R.M. Crooks and A.J. Bard, Electrochemistry in near-critical and supercritical fluids: Part VI. The electrochemistry of ferrocene and phenazine in acetonitrile between 25 and 300° C. Journal of Electroanalytical Chemistry and Interfacial Electrochemistry, 1988. 243(1): p. 117-131.
71. A.M. Bond, T.L.E. Henderson, D.R. Mann, T.F. Mann, W. Thormann and C.G. Zoski, A fast electron transfer rate for the oxidation of ferrocene in acetonitrile or dichloromethane at platinum disk ultramicroelectrodes. Analytical Chemistry, 1988. 60(18): p. 1878-1882.
72. R.R. Gagne, C.A. Koval and G.C. Lisensky, Ferrocene as an internal standard for electrochemical measurements. Inorganic Chemistry, 1980. 19(9): p. 2854-2855.
73. J.W. Diggle and A.J. Parker, Solvation of ions—XX. The ferrocene—ferricinium couple and its role in the estimation of free energies of transfer of single ions. Electrochimica Acta, 1973. 18(12): p. 975-979.
74. N. Tsierkezos and U. Ritter, Electrochemical impedance spectroscopy and cyclic voltammetry of ferrocene in acetonitrile/acetone system. Journal of Applied Electrochemistry, 2010. 40(2): p. 409-417.
75. M. Sharp, Determination of the Charge-Transfer Kinetics of Ferrocene at Platinum and Vitreous Carbon Electrodes by Potential Step Chronocoulometry. Electrochimica Acta, 1983. 28(3): p. 301-308.
76. E.I. Rogers, D.S. Silvester, D.L. Poole, L. Aldous, C. Hardacre and R.G. Compton, Voltammetric Characterization of the Ferrocene|Ferrocenium and Cobaltocenium|Cobaltocene Redox Couples in RTILs. The Journal of Physical Chemistry C, 2008. 112(7): p. 2729-2735.
77. G. Gritzner and J. Kuta, Recommendations on Reporting Electrode-Potentials in Nonaqueous Solvents (Recommendations 1983). Pure and Applied Chemistry, 1984. 56(4): p. 461-466.
78. G.R. Knox, P.L. Pauson, D. Willison, E. Solcaniova and S. Toma, Ferrocene Derivatives .23. Isocyanoferrocene and Isothiocyanatoferrocene. Organometallics, 1990. 9(2): p. 301-306.
79. G.R. Knox, P.L. Pauson and D. Willison, Ferrocene Derivatives .27. Ferrocenyldimethylphosphine. Organometallics, 1992. 11(8): p. 2930-2933.

Ferrocene Chapter 6
218
80. A. Perjéssy and Š. Toma, On Ferrocene Derivatives. XXI. Elucidation of the Structures of Various Acetylated Derivatives of Ferrocene by Infrared Spectroscopy. Chemical Papers, 1969. 23(7): p. 533-539.
81. G.D. Broadhead, J.M. Osgerby and P.L. Pauson, 127. Ferrocene derivatives. Part V. Ferrocenealdehyde. Journal of the Chemical Society (Resumed), 1958(0): p. 650-656.
82. W.P. McNutt, Ferrocene and Ferrocene Derivatives. 1966: Defense Technical Information Center.
83. D.E. Overton, Synthesis and Study of Ferrocene Derivatives. 1968: University of Wisconsin--Madison.
84. B.A. Gregg, F. Pichot, S. Ferrere and C.L. Fields, Interfacial Recombination Processes in Dye-Sensitized Solar Cells and Methods To Passivate the Interfaces. The Journal of Physical Chemistry B, 2001. 105(7): p. 1422-1429.
85. T.W. Hamann, O.K. Farha and J.T. Hupp, Outer-Sphere Redox Couples as Shuttles in Dye-Sensitized Solar Cells. Performance Enhancement Based on Photoelectrode Modification via Atomic Layer Deposition. The Journal of Physical Chemistry C, 2008. 112(49): p. 19756-19764.
86. L.E. Roy, E. Jakubikova, M.G. Guthrie and E.R. Batista, Calculation of One-Electron Redox Potentials Revisited. Is It Possible to Calculate Accurate Potentials with Density Functional Methods? The Journal of Physical Chemistry A, 2009. 113(24): p. 6745-6750.
87. M.-H. Baik and R.A. Friesner, Computing Redox Potentials in Solution: Density Functional Theory as A Tool for Rational Design of Redox Agents. The Journal of Physical Chemistry A, 2002. 106(32): p. 7407-7412.
88. T. Matsui, Y. Kitagawa, Y. Shigeta and M. Okumura, A Density Functional Theory Based Protocol to Compute the Redox Potential of Transition Metal Complex with the Correction of Pseudo-Counterion: General Theory and Applications. Journal of Chemical Theory and Computation, 2013. 9(7): p. 2974-2980.
89. A. Galstyan and E.-W. Knapp, Accurate redox potentials of mononuclear iron, manganese, and nickel model complexes*. Journal of Computational Chemistry, 2009. 30(2): p. 203-211.
90. M. Uudsemaa and T. Tamm, Density-Functional Theory Calculations of Aqueous Redox Potentials of Fourth-Period Transition Metals. The Journal of Physical Chemistry A, 2003. 107(46): p. 9997-10003.
Ferrocene Chapter 6
219
91. P. Jaque, A.V. Marenich, C.J. Cramer and D.G. Truhlar, Computational Electrochemistry: The Aqueous Ru3+|Ru2+ Reduction Potential. The Journal of Physical Chemistry C, 2007. 111(15): p. 5783-5799.
92. J. Moens, P. Jaque, F. De Proft and P. Geerlings, The Study of Redox Reactions on the Basis of Conceptual DFT Principles: EEM and Vertical Quantities. The Journal of Physical Chemistry A, 2008. 112(26): p. 6023-6031.
93. J. Li, C.L. Fisher, J.L. Chen, D. Bashford and L. Noodleman, Calculation of Redox Potentials and pKa Values of Hydrated Transition Metal Cations by a Combined Density Functional and Continuum Dielectric Theory. Inorganic Chemistry, 1996. 35(16): p. 4694-4702.
94. I. Chiorescu, D.V. Deubel, V.B. Arion and B.K. Keppler, Computational Electrochemistry of Ruthenium Anticancer Agents. Unprecedented Benchmarking of Implicit Solvation Methods†. Journal of Chemical Theory and Computation, 2008. 4(3): p. 499-506.
95. T.F. Hughes and R.A. Friesner, Development of Accurate DFT Methods for Computing Redox Potentials of Transition Metal Complexes: Results for Model Complexes and Application to Cytochrome P450. Journal of Chemical Theory and Computation, 2012. 8(2): p. 442-459.
96. H.M. Steele, D. Guillaumont and P. Moisy, Density Functional Theory Calculations of the Redox Potentials of Actinide(VI)/Actinide(V) Couple in Water. The Journal of Physical Chemistry A, 2013. 117(21): p. 4500-4505.
97. M. Namazian and M.L. Coote, Accurate Calculation of Absolute One-Electron Redox Potentials of Some para-Quinone Derivatives in Acetonitrile. The Journal of Physical Chemistry A, 2007. 111(30): p. 7227-7232.
98. N.G. Connelly and W.E. Geiger, Chemical redox agents for organometallic chemistry. Chemical Reviews, 1996. 96(2): p. 877-910.
99. N. Mohammadi, F. Wang, S. Best, D. Appadoo and C.T. Chantler, Dominance of eclipsed ferrocene conformer in solutions determined by the IR fingerprint spectral splitting. to be submitted, 2014.
220
Chapter 7
Summary, conclusions and outlook “I never see what has been done; I only see what remains to be done.”
Marie Curie
The full potential of the state-of-art computational methods to design new
materials for solar cells has not yet been realized. In this regard, computational
calculations have usually been performed for understanding the already existing
materials, rather than designing, predicting properties and screening new
compounds. The present thesis has addressed this issue and focused on the
computational modelling of compounds for dye sensitized solar cells (DSSC).
This thesis has focused on two components of DSSC, the dye sensitizer and the
redox couple in the liquid electrolyte.
With regard to the dye sensitizer, this thesis has given an account for the
computer-aided rational design of new dye sensitizers. The strategy employed in
the present work has been chemically modifying the structure of already well-
performing organic dyes (reference dyes) with donor, π-conjugated linker,
acceptor structure (D-π-A), to produce new dyes with reduced HOMO-LUMO
energy gap and red-shifted absorption spectra. The rationale behind such
modifications was producing new dyes with enhanced absorption spectra, as a
route to enhance the efficiency of DSSC. Density functional theory (DFT) has
been exploited to study the ground state properties, while time dependant-DFT

Summary, conclusions and outlook Chapter 7
221
(TD-DFT) has been adopted for the study of the excited states of the compounds.
Considering the size and the complexity of the compounds in this thesis, DFT and
TD-DFT provide good balance between accuracy and performance. The
theoretical models (i.e. combination of the functionals and basis sets) employed in
the DFT and TD-DFT calculations of new dyes, have been validated based on the
agreement with available experimental data for the reference dyes.
Two reference dyes with D-π-A structure have been employed in this thesis.
Modifications have been made on either the D section or on the π-conjugated
spacers (linker) of the reference dyes. With respect to the modifications of the
linkers of the reference dyes, this thesis employed two concepts, the classical
Dewar’s rules (applied on TA-St-CA reference dye), and the electronegativity
(applied on Carbz-PAHTDDT reference dye). Modifications made on the donor
moiety of the reference dye (TA-St-CA) have been based on the concept of
aromatic annulenes.
Dewar’s rules are found to serve as a useful guidance for modifying the π-
conjugated linker of reference dyes with D-π-A structure (e.g. TA-St-CA in this
thesis). Dewar’s rules can be employed to predict how molecular energy levels
change when different groups (electron donating or electron withdrawing) are
substituted on different positions of the conjugated linker. As for the substitution
of electron donating groups, it is found that substitutions on the starred positions
closest to the D moiety of the reference dye produce the lowest HOMO-LUMO
energy gap. It seems that the aforementioned substitutions are the most beneficial
ones for DSSC applications. To the best of my knowledge, this study
demonstrates for the first time that Dewar’s rule can be employed to rationally
design new dye sensitizers for the application in DSSC. The present study might
have an important practical application. It provides a systematic way (based on
Dewar’s rules) to modify an existing well-performing dye. A systematic method
of modifying dye structure provides the possibility to design a software program
for computer-aided rational design of new dye sensitizers. The input for such
software can be the structure of the reference dyes, and the outputs are the

Summary, conclusions and outlook Chapter 7
222
structure of the new dyes. Therefore, it is recommended that further efforts be
undertaken to design and code such software program.
This thesis further suggest that modifications made on the donor moiety of the
same reference TA-St-CA dye, are able to produce new dyes with significant
appealing properties for DSSC application. Such properties include reduced
HOMO-LUMO energy gap and expanded absorption range. For example,
replacing the three [6]-annulene rings of the reference dye with three [14]-
annulene rings have produced a new dye, AN-14. Modification of the donor
moiety of the reference TA-St-CA dye has also produced another new dye in this
thesis, the AN-18 dye. This dye has been designed by replacing one of the [6]-
annulene rings of TA-Ct-CA dye with an [18]-annulene ring. The results of this
thesis indicate that both new dyes, AN-14 and AN-18, exhibit reduced HOMO-
LUMO gap and expanded absorption spectra. Furthermore, the rationally
designed AN-14 dye seems to possess a HOMO-LUMO energy gap which is very
similar to that of the N3 dye. The N3 dye is believed to be among the most
efficient ruthenium-based sensitizers for DSSC, and is usually employed as a
benchmark for the evaluation of other dyes. With regards to the absorption of the
sunlight, the TD-DFT calculations on AN-14 and AN-18 indicate that their
simulated absorption spectrum falls within the high photon flux region of the solar
spectrum. As mentioned in Chapter 1, an aim of the current study was to
rationally design new dyes with such absorption profile.
The results of the calculations on new dyes produced by the modification of the
reference TA-St-CA dye, suggest that generally the donor variation have stronger
influence on the studied properties of the new dyes than the linker modifications.
On the other hand, Dewar’s rules provide well-dictated instructions for the
modifications of the linker of the reference dye, which can be employed to
automate the process of designing new dyes. However, the current investigation
of Dewar’s rules to design new dyes was limited by only one reference dye.
Further studies to investigate more reference dyes using the same theoretical set-
up would be very interesting.

Summary, conclusions and outlook Chapter 7
223
The present thesis has also studied the structure and properties of the reference
Carbz-PAHTDTT (S9) dye, quantum mechanically. To the best of my knowledge,
no theoretical investigations have been available on this dye until this study. The
findings of this thesis have indicated that the long-range correction to the
theoretical model in the TD-DFT simulation is important to produce accurate
absorption wavelengths for the reference S9 dye. However, calculations of the
frontier molecular energies of the S9 dye indicate that the B3LYP functional
provides the best agreement with the experiment. This finding indicates that
exchange energy is less important than correlation energy for this reference dye.
This thesis further contributes to the existing knowledge about rational computer-
aided design of new dyes, by providing a design based on the concept of
electronegativity. Two new dyes, S9-D1 and S9-D2, were rationally designed by
modifying the π-conjugated bridge of the reference S9 dye. Both new dyes
exhibited improvements over the reference dye. However, S9-D1 has shown
significant red-shifted and broadened absorption spectra, more reduced HOMO-
LUMO gap, better NLO properties as well as noticeable redistribution of the
electron density, compared to the reference dye and the S9-D1 dye. The findings
of this study also suggest that the new dye S9-D1 is a suitable candidate for the
effective sensitization of both TiO2 and SnO2 semiconductors.
With respect to the redox couple, this thesis has focused on the computational
modelling of ferrocene as an important compound for the redox couple in DSSC.
The ferrocene/ferrocenium (Fc/Fc+) redox couple can be addressed once the
structure and properties of ferrocene conformers are well understood. As a result,
this thesis has investigated two aspects of this compound by computational
modelling: (a) the structure and properties of ferrocene conformers and (b) the
ferrocene/ferrocenium redox couple. The structure of ferrocene, which have been
a disputed subject within the organometallic community, have been addressed in
the current thesis, in order to find properties that can differentiate its eclipsed
(D5h) and staggered (D5d) conformers. The present study has found that the centre
Fe atom plays an important role to differentiate the conformers. Results of this

Summary, conclusions and outlook Chapter 7
224
research indicated that the conformers of ferrocene clearly show differences in
their simulated IR spectra. The 17 cm-1 IR frequency splitting in the region of
400-500 cm-1, has been found to be a fingerprint for the eclipsed conformer of the
ferrocene in gas phase.
The current thesis has employed the DFT-based B3LYP/m6-31G(d) model to
simulate properties of ferrocene. The agreement of the simulated IR frequencies
with experiment, without any scaling, suggests that the basis set plays an
important role in the accuracy of DFT calculations of ferrocene. The present thesis
has further investigated the effects of the solvents on the IR spectra. Furthermore,
the influence of the solvent model on the simulated spectra has been studied. It is
found that the IR spectra of ferrocene are not apparently solvent dependent. In
addition, the solute molecular density (SMD) model seems to produce the most
accurate IR spectrum in the region of 400-600 cm-1 of ferrocene.
In respect of the computational modelling of alternative redox mediators, results
of the present study suggest that the redox potential of the Fc/Fc+ couple can be
calculated with a great accuracy based on computational modelling. In particular,
the B3LYP/m6-31G(d) model has been found to be a very suitable model for such
calculations on the Fc/Fc+ redox mediator. This finding has an important
implication for future practice. It suggests that the B3LYP/m6-31G(d) model can
be employed to predict the redox potential of new rationally designed redox
mediators which are designed based on the ferrocene scaffold.
The current findings add to a growing body of literature on the computer-aided
rational design of new materials for DSSC. A future study to investigate the
particular modifications made in this thesis on other reference dyes would be very
interesting. More researches are also needed to understand the interaction of the
dye molecule with other component of the cell. For example, future studies may
address the adsorption of the new dyes designed in this thesis on the
semiconductor (e.g. TiO2) surface. Furthermore, experimental studies are also
essential to determine the efficiency of the newly designed dyes, as well as their
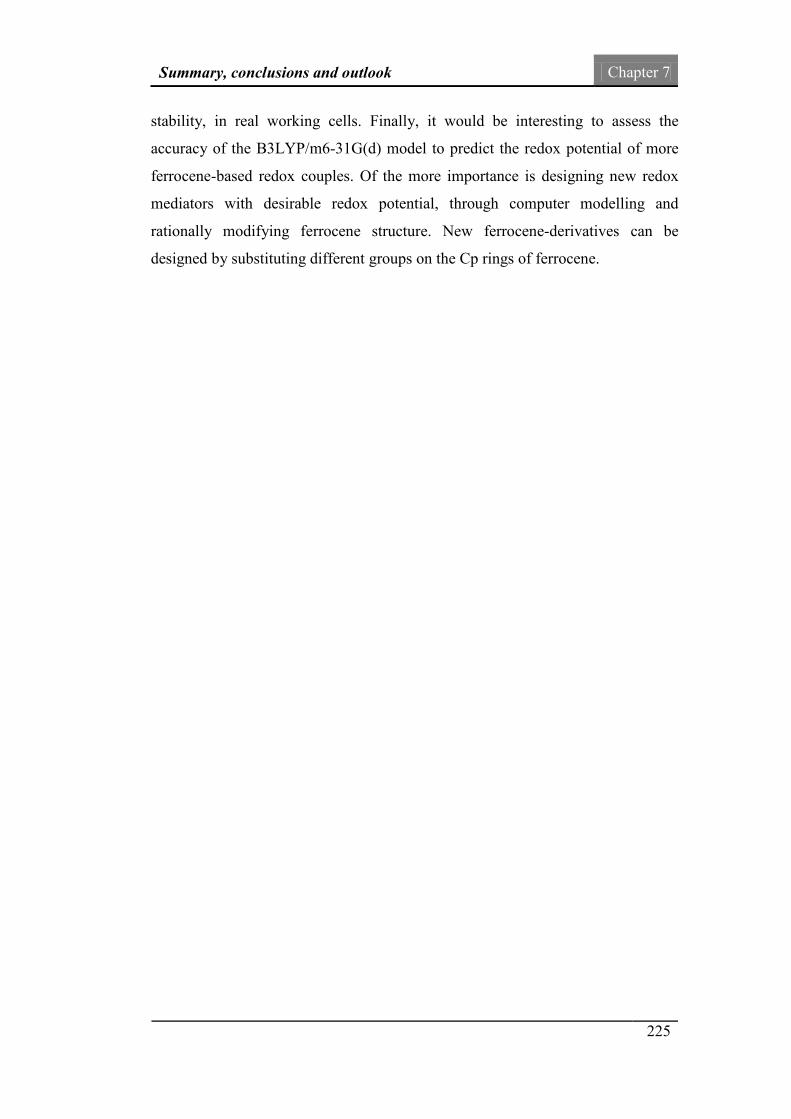
Summary, conclusions and outlook Chapter 7
225
stability, in real working cells. Finally, it would be interesting to assess the
accuracy of the B3LYP/m6-31G(d) model to predict the redox potential of more
ferrocene-based redox couples. Of the more importance is designing new redox
mediators with desirable redox potential, through computer modelling and
rationally modifying ferrocene structure. New ferrocene-derivatives can be
designed by substituting different groups on the Cp rings of ferrocene.
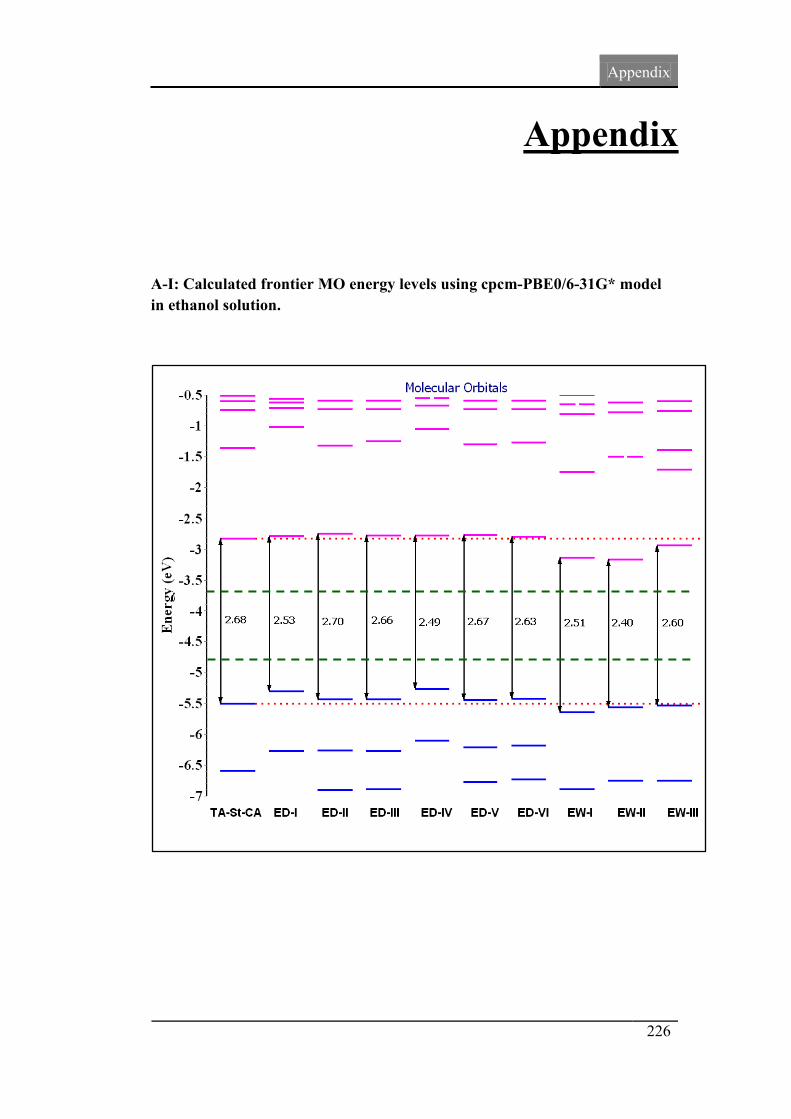
Appendix
226
Appendix
A-I: Calculated frontier MO energy levels using cpcm-PBE0/6-31G* model in ethanol solution.
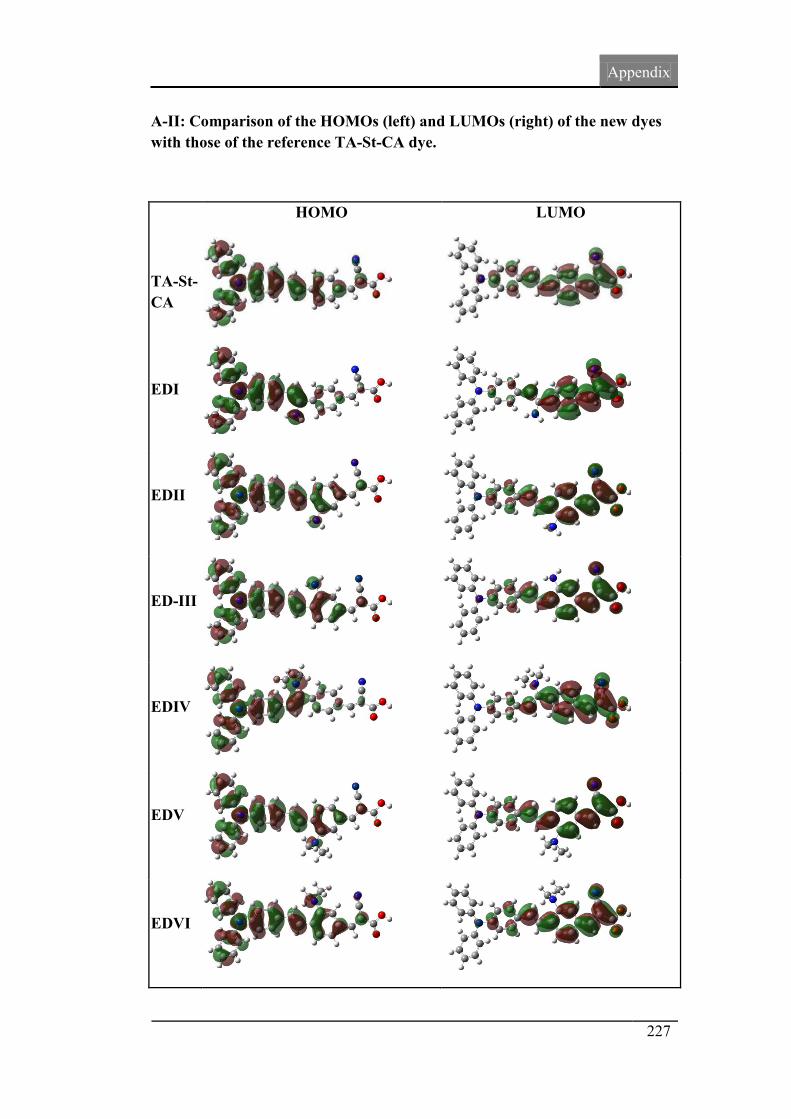
Appendix
227
A-II: Comparison of the HOMOs (left) and LUMOs (right) of the new dyes with those of the reference TA-St-CA dye.
HOMO LUMO
TA-St-CA
EDI
EDII
ED-III
EDIV
EDV
EDVI
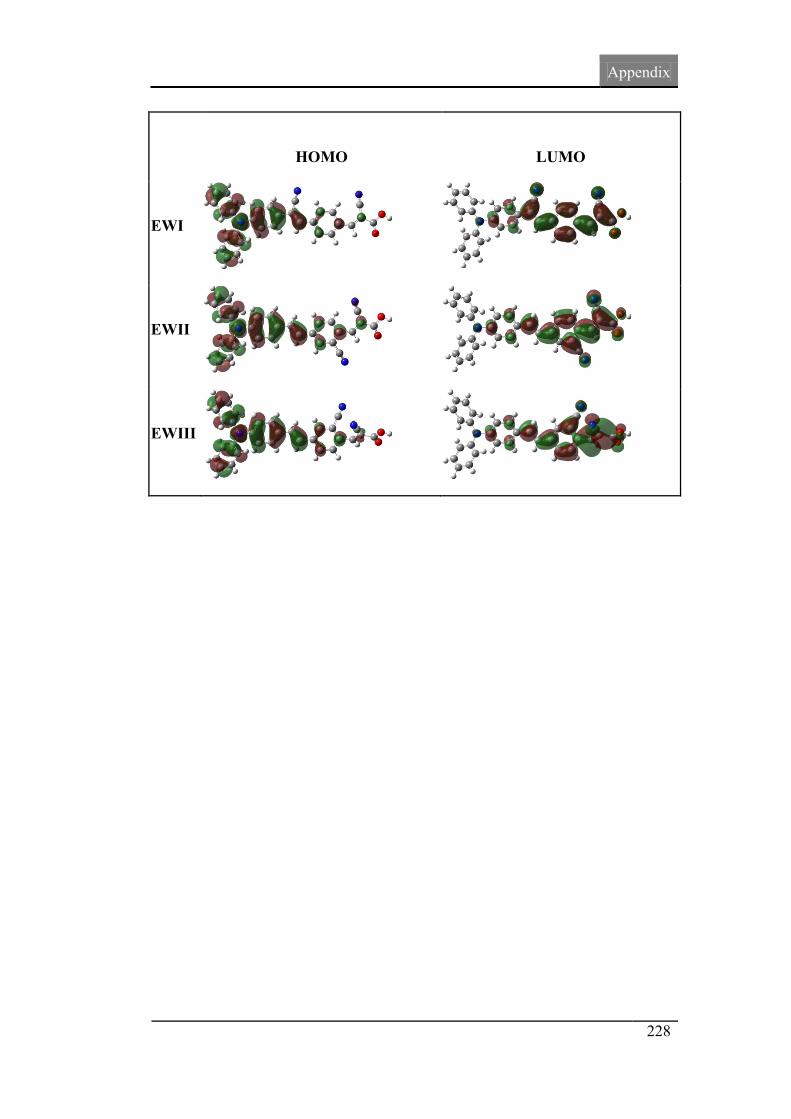
Appendix
228
HOMO
LUMO
EWI
EWII
EWIII
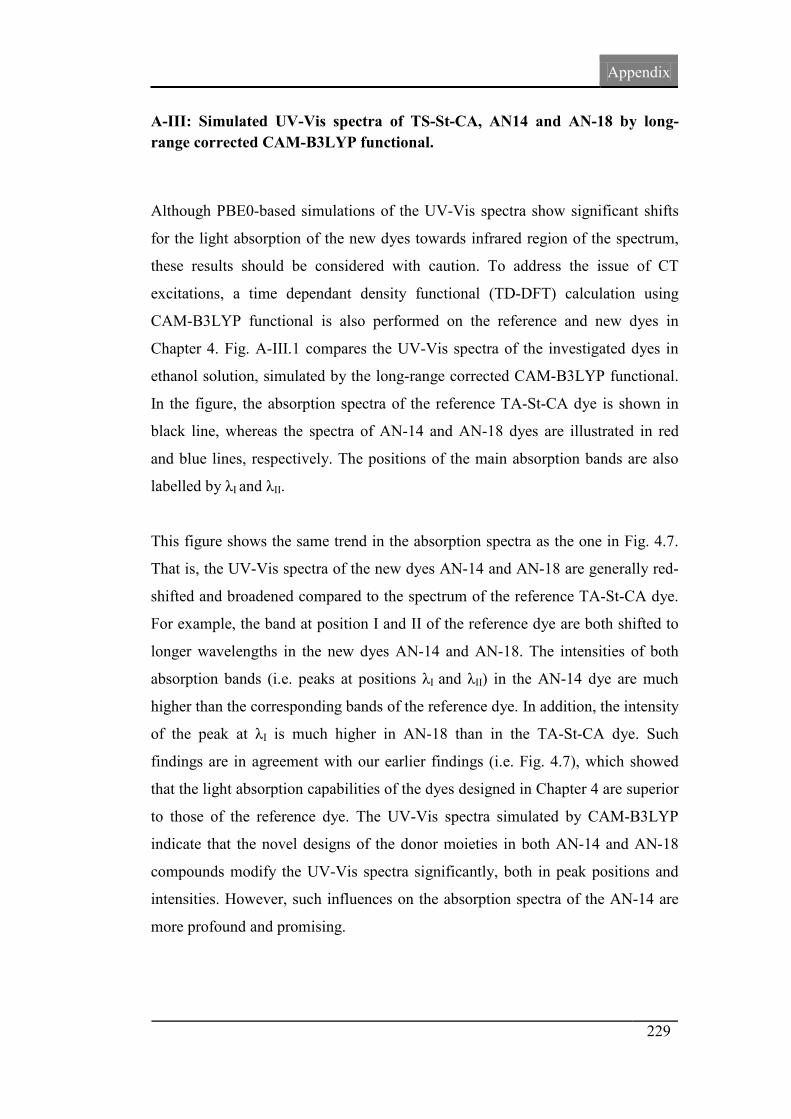
Appendix
229
A-III: Simulated UV-Vis spectra of TS-St-CA, AN14 and AN-18 by long-range corrected CAM-B3LYP functional.
Although PBE0-based simulations of the UV-Vis spectra show significant shifts
for the light absorption of the new dyes towards infrared region of the spectrum,
these results should be considered with caution. To address the issue of CT
excitations, a time dependant density functional (TD-DFT) calculation using
CAM-B3LYP functional is also performed on the reference and new dyes in
Chapter 4. Fig. A-III.1 compares the UV-Vis spectra of the investigated dyes in
ethanol solution, simulated by the long-range corrected CAM-B3LYP functional.
In the figure, the absorption spectra of the reference TA-St-CA dye is shown in
black line, whereas the spectra of AN-14 and AN-18 dyes are illustrated in red
and blue lines, respectively. The positions of the main absorption bands are also
labelled by λI and λII.
This figure shows the same trend in the absorption spectra as the one in Fig. 4.7.
That is, the UV-Vis spectra of the new dyes AN-14 and AN-18 are generally red-
shifted and broadened compared to the spectrum of the reference TA-St-CA dye.
For example, the band at position I and II of the reference dye are both shifted to
longer wavelengths in the new dyes AN-14 and AN-18. The intensities of both
absorption bands (i.e. peaks at positions λI and λII) in the AN-14 dye are much
higher than the corresponding bands of the reference dye. In addition, the intensity
of the peak at λI is much higher in AN-18 than in the TA-St-CA dye. Such
findings are in agreement with our earlier findings (i.e. Fig. 4.7), which showed
that the light absorption capabilities of the dyes designed in Chapter 4 are superior
to those of the reference dye. The UV-Vis spectra simulated by CAM-B3LYP
indicate that the novel designs of the donor moieties in both AN-14 and AN-18
compounds modify the UV-Vis spectra significantly, both in peak positions and
intensities. However, such influences on the absorption spectra of the AN-14 are
more profound and promising.
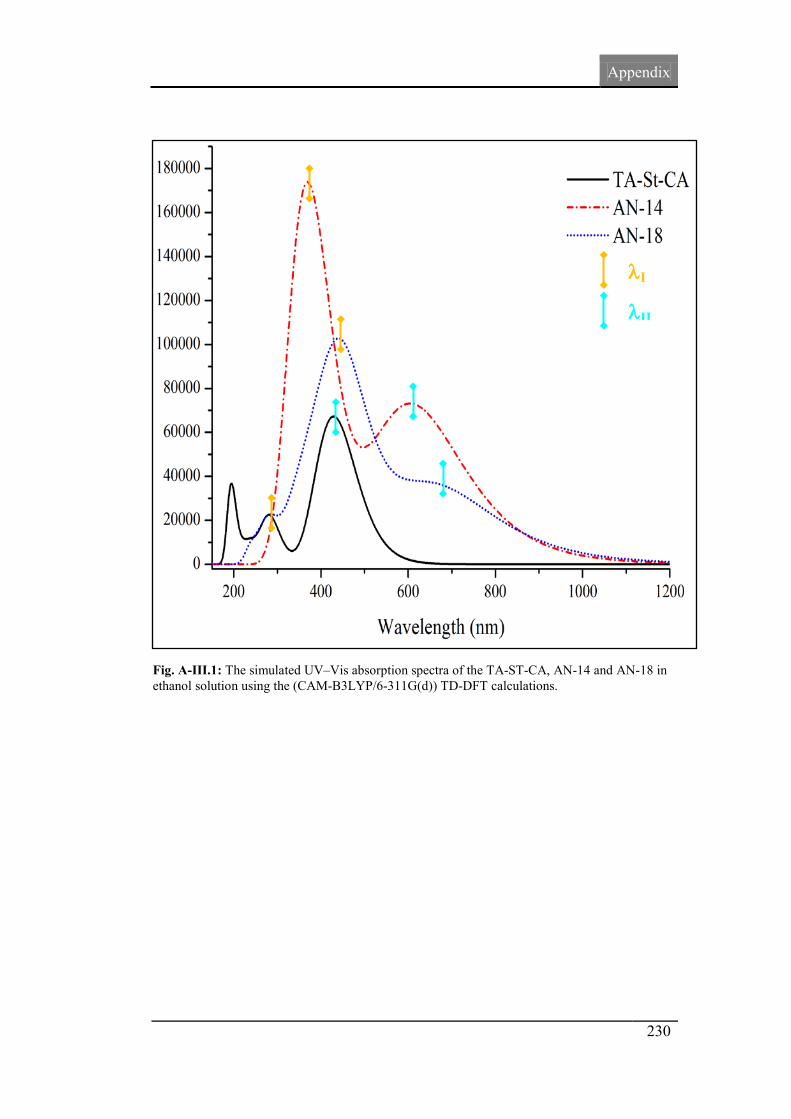
Appendix
230
Fig. A-III.1: The simulated UV–Vis absorption spectra of the TA-ST-CA, AN-14 and AN-18 in ethanol solution using the (CAM-B3LYP/6-311G(d)) TD-DFT calculations.
λI
λII
Appendix
231
Fig. A-III.2 compares the UV-Vis spectra of the investigated dyes in ethanol
solution simulated by the long-range corrected CAM-B3LYP functional and
PBE0 functional. As seen in the figure, the spectra simulated by the CAM-B3LYP
functional are blue-shifted compared to those of the PBE0 functional. In addition,
the intensities of the main bands are different. For example, the simulated
absorption spectra of the reference dye using CAM-B3LYP possess a sharp
intense peak at ca. 200 nm, whereas the intensity of this peak is much lower when
simulated by PBE0 functional.
In Chapter 3, it was shown that time dependant density functional calculations of
the reference TA-St-CA dye using PBE0 functional agreed reasonably well with
the experiment, which was only measured in the region of λ< 450 nm, i.e., the
first absorption spectral peak region. As a result, for this region of the spectrum,
the PBE0 functional is more appropriate one to predict the UV-Vis absorption
spectra. On the other hand, the CAM-B3LYP functional is a long-range corrected
functional, which is able to predict the absorption wavelengths at of charge
transfer excitations (which are seen at longer wavelengths) more accurately. As a
result, it might be implied that the absorption peak positions (or wavelengths),
intensities and the absorption pattern simulated by the PBE0 functional are more
reliable in the region of λ< 450 nm. On the contrary, the absorption features
simulated by long-range corrected CAM-B3LYP functional might be more
appropriate for the spectral region of λ> 450 nm. The long-range corrected
functionals are discussed in more details in Chapter 5.
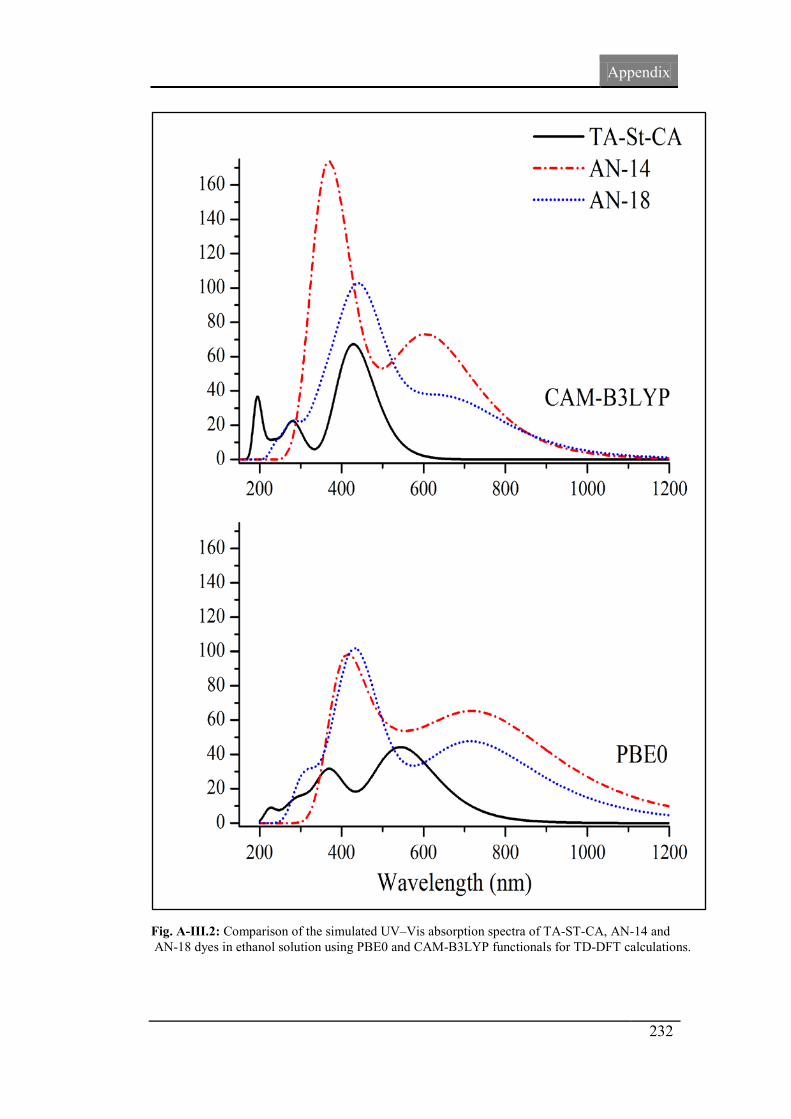
Appendix
232
Fig. A-III.2: Comparison of the simulated UV–Vis absorption spectra of TA-ST-CA, AN-14 and AN-18 dyes in ethanol solution using PBE0 and CAM-B3LYP functionals for TD-DFT calculations.

Appendix
233
A-IV: Results and discussions of the trans-S9 conformation. Since two conformers of the reference S9 dye differ by about 1 kcal/mol, it is
important to probe the conformational dependence of the properties of S9
rotamors (i.e. cis-S9 and trans-S9). Herein a comparison of the results of such
calculations is given.
For trans conformation of the reference S9 dye sensitizer, the frontier molecular
orbital energy obtained by CPCM-B3LYP/6-311G(d)//CPCM-PBE0/6-311G(d)
level of theory are calculated as -4.89 eV, -2.77 eV and 2.12 eV for HOMO,
LUMO, and HOMO-LUMO gap, respectively. These calculated values are in
excellent agreement with the cis conformer. For example, the HOMO-LUMO
energy gap of the trans form differs only by less than 0.05 eV from the calculated
values for cis-S9 conformer using the same level of theory.
Atomic charges according to the natural bond orbital (NBO) scheme of the π-
conjugated bridges of the two conformations are given in Figure S3(a)-(b). As
seen from the figure, the atomic NBO charges are almost exactly the same for
both conformers.
Fig. A-IV.1: The NBO charge of atoms in the linker of cis(a) and trans(b) conformers of
the reference S9 dye. Note that hexanyl chains are not included.

Appendix
234
The βtot are calculated as 805 esu for cis-S9, whereas 621 esu for trans-S9. It can
be seen that the hyperpolarizability of the two rotamors differ by almost 20%.
This finding is in agreement with another study on the conformational dependence
of the first hyperpolarizability of other conjugated molecules [4]. As suggested in
this reference, in such cases one can “consider only one conformation for
estimation of hyperpolarizability” [4].
Based on the mean absolute error (MAE) criterion of the BHandH functional
(employed to calculate the absorption wavelengths of the three most dominant
peaks, Refer to Table S4), the cis-S9 gives MAE of 18 nm whereas the trans- S9
form produces MAE of 29 nm. This suggests that the TDDFT calculations on the
cis-S9 are in better agreement with the experimentally measured values compared
to those of the trans conformer.

Appendix
235
A-V: Experimental absorption spectra of the Carbz-PAHTDTT (S9) and DAHTDTT-13 dyes in DCM solution. Image is reproduced from data available in the supplementary information files of Ref. (J. Org. Chem. 2011, 76, 4088–4093) and Ref. (Nature Chemistry 3, 211–215 (2011).
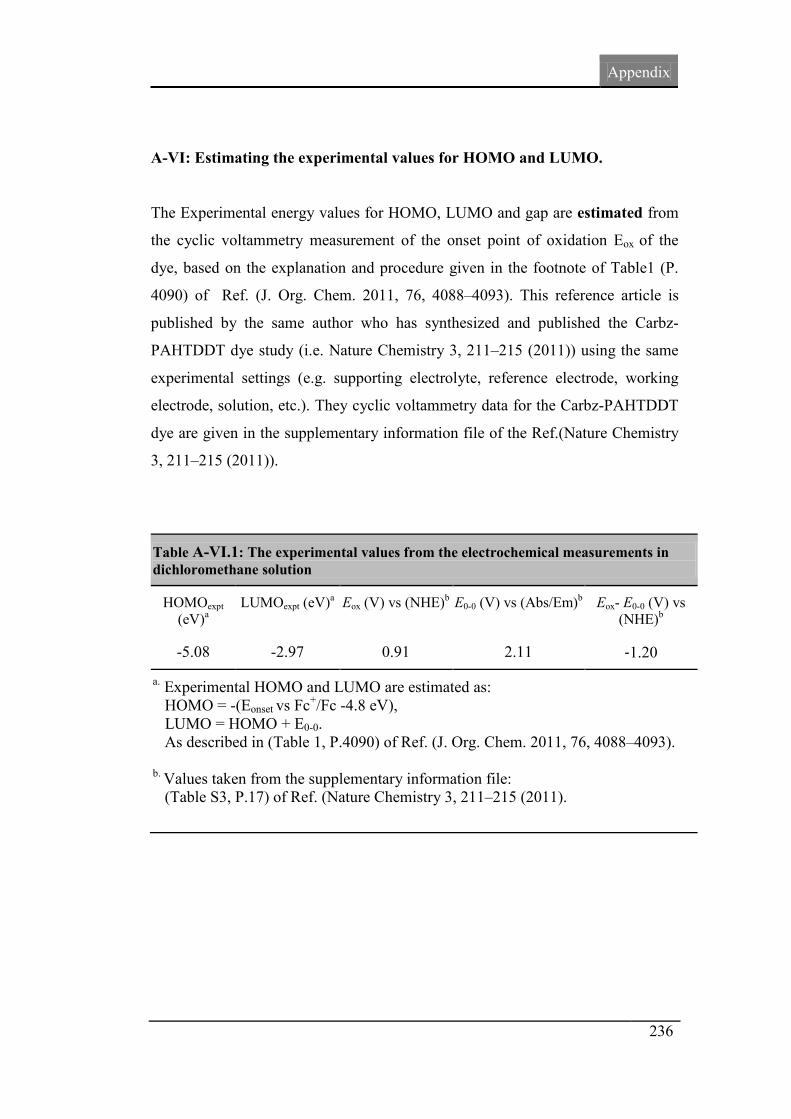
Appendix
236
A-VI: Estimating the experimental values for HOMO and LUMO. The Experimental energy values for HOMO, LUMO and gap are estimated from
the cyclic voltammetry measurement of the onset point of oxidation Eox of the
dye, based on the explanation and procedure given in the footnote of Table1 (P.
4090) of Ref. (J. Org. Chem. 2011, 76, 4088–4093). This reference article is
published by the same author who has synthesized and published the Carbz-
PAHTDDT dye study (i.e. Nature Chemistry 3, 211–215 (2011)) using the same
experimental settings (e.g. supporting electrolyte, reference electrode, working
electrode, solution, etc.). They cyclic voltammetry data for the Carbz-PAHTDDT
dye are given in the supplementary information file of the Ref.(Nature Chemistry
3, 211–215 (2011)).
Table A-VI.1: The experimental values from the electrochemical measurements in dichloromethane solution
HOMOexpt (eV)a
LUMOexpt (eV)a Eox (V) vs (NHE)b
E0-0 (V) vs (Abs/Em)b
Eox- E0-0 (V) vs (NHE)b
-5.08 -2.97 0.91 2.11 ‐1.20
a. Experimental HOMO and LUMO are estimated as: HOMO = -(Eonset vs Fc+/Fc -4.8 eV), LUMO = HOMO + E0-0. As described in (Table 1, P.4090) of Ref. (J. Org. Chem. 2011, 76, 4088–4093). b. Values taken from the supplementary information file: (Table S3, P.17) of Ref. (Nature Chemistry 3, 211–215 (2011).

Appendix
237
A-VII: Full tensor components for α and β.
Table A-VII.1: The polarizability and the first hyperpolarizability tensor components (in a.u) and total hyperpolarizability (in esu).
Structure αxx αxy αyy αxz αyz αzz βxxx βxxy βxyy βyyy βxxz βxyz βyyz βxzz βyzz βzzz βtot *10-30
(esu)(a)
S9(cis) 2087 -118 1157 -135 52 807 -89930 11813 -1907 1134 9127 -2829 695 -1302 506 465 804
S9-D1 2808 196 1078 -177 -126 845 252260 -8121 793 -590 -6977 178
-69 442 221 -315 2190
S9-D2 2068 93 1104 -155 -81 831 94044 17273 1781 818 -18572 -4008 -624 3242 773 -948 856
(a) βtot is converted from atomic unit (a.u) into electrostatic unit (1 a.u=8.6393 * 10-33 esu).

Appendix
238
Fig. A-VII.1: The optimized structure of S9 and the Cartesian axes.


