
Computer simulations of fast frequency sweeping mode in JT-60U and fishbone
instability
Y. Todo (NIFS) Y. Shiozaki (Graduate Univ. Advanced Studies)K. Shinohara, M. Takechi, M. Ishikawa (JAERI)
October 6-8, 2003
8th IAEA Technical Meeting on Energetic Particles in Magnetic Confinement Systems
General Atomics, San Diego
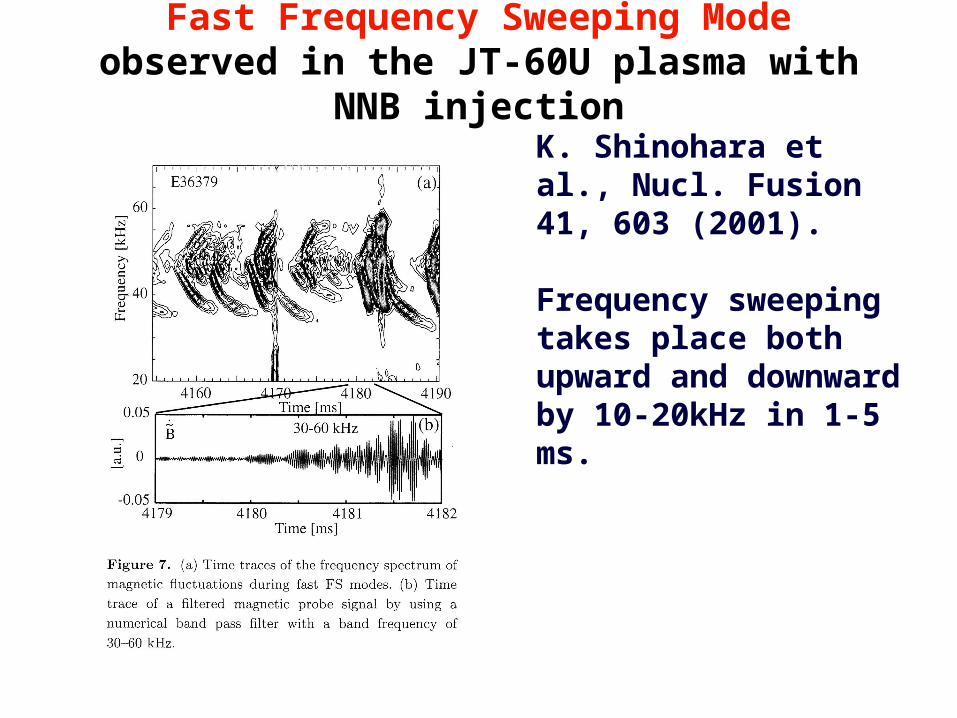
Fast Frequency Sweeping Mode observed in the JT-60U plasma with NNB injection
K. Shinohara et al., Nucl. Fusion 41, 603 (2001).
Frequency sweeping takes place both upward and downward by 10-20kHz in 1-5 ms.

Particle-MHD hybrid simulation[Y. Todo and T. Sato, Phys. Plasmas 5, 1321 (1998)]
1. Plasma is divided into “energetic ions” + “MHD fluid”.
2. Electromagnetic fields are given by MHD equations.
3. Energetic ions are described by the drift-kinetic equation.

MHD Equations: current coupling model
€
∂ρ∂t
= −∇ ⋅(ρv)
∂
∂tv + v ⋅∇v = −
1
ρ∇p+
1
μ0ρ(∇ × B − jh⊥) × B −
enh
ρE//
+ν [∇(∇ ⋅v) −∇ ×∇ × v]
∂B
∂t= −∇ × E
E = −v × B +η∇ × B
∂p
∂t= −∇ ⋅(pv) − (γ −1)p∇ ⋅v
−(γ −1)νρv ⋅[∇(∇ ⋅v) −∇ ×∇ × v]
+(γ −1)η
μ0
B ⋅[∇ ×∇ × B]

Equilibrium
An extended Grad-Shafranov equation for anisotropic energetic ion pressure is found (equivalent to Eq (9) in [Belova et al. Phys. Plasmas 10, 3240 (2003)]). We solve a stream function K in the zero orbit width limit.
€
R∂
∂R
1
R
∂ψ
∂R+∂ 2ψ
∂z2= −R2 ∂p
∂ψ− Rjh,ϕ −
I
(2π )2
∂M
∂ψ
I ≡ 2πRBϕ
M ≡I
2π−K
jh,R = −1
R
∂K
∂z
jh,z =1
R
∂K
∂R

Numerical method
MHD: finite difference with 4th order accuracy in space and time.Number of grid points: (101, 16-48, 101) for (R, , z) coordinatesTime steps: (2-7)105
The f particle simulation is applied to energetic ions.Number of particles N: 5105-4106
Retaining fluctuations with toroidal mode number n=1 to reduce numerical noise (N=5105). Numerical convergence is checked with a simulation where toroidal mode number n=0-6 is retained and N= 4106.

Condition (E36379, t=4.0s)
1. R0 = 3.4 m, a = 1.0 m
2. B = 1.2 T
3. DD plasma
4. ne at the plasma center 1.6 1019 m-3
5. Alfvén velocity at the plasma center 4.6 106 m/s
6. Injection energy 346 keV (5.75 106 m/s)
7. Only parallel velocity is considered.
8. Maximum velocity of the slowing down distribution is assumed to be 80% of the injection velocity.
9. Finite viscosity and resistivity (10-5 or 210-5 R0vA) are assumed for nonlinear simulation.

Investigation for different energetic ion pressure profiles
Red curve is a classical distribution based on the OFMC code calculation. The energetic ion beta value at the plasma center is 1.9% for the red curve. For the other curves central beta value is reduced. All the profiles are similar at r/a>0.6.
0.0 100
5.0 10-3
1.0 10-2
1.5 10-2
2.0 10-2
0 0.2 0.4 0.6 0.8 1
/r a
I
II
III
IV

q-profile and shear Alfvén continuous spectra
Toroidal mode
number n=1
q(0)=1.6
q=2.5 at r/a=0.8
0
0.1
0.2
0.3
0.4
0.5
0.6
0
1
2
3
4
5
6
0 0.2 0.4 0.6 0.8 1
/r a
EPM
Alfven continuum
q
I II III
Mode spatial profile depends on energetic ion pressure profile. They do not peak at the TAE gap at q=2.5.
------> Energetic Particle mode (EPM)
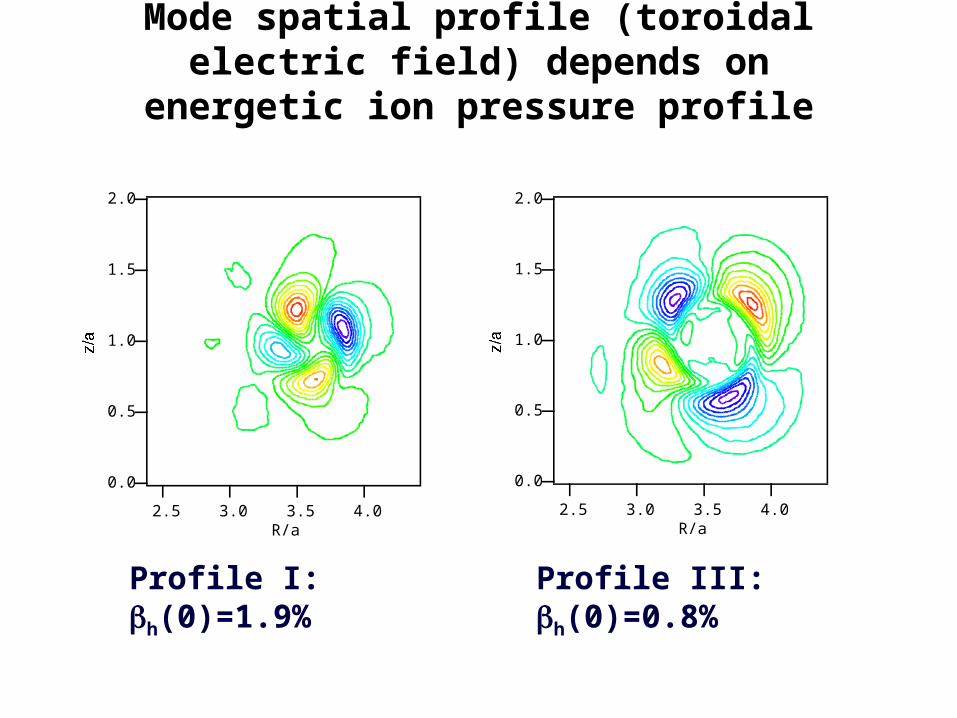
Mode spatial profile (toroidal electric field) depends on energetic ion pressure profile
2.0
1.5
1.0
0.5
0.0
z/a
4.03.53.02.5R/a
2.0
1.5
1.0
0.5
0.0
z/a
4.03.53.02.5R/a
Profile III: h(0)=0.8%Profile I: h(0)=1.9%

A new kind of EPM
1. The EPMs are not on the shear Alfvén continuum. They are different from the local (resonant) EPM [L. Chen (1994), C.Z. Cheng et al. (1995)].
2. Nonlocal EPM is studied for reversed shear plasma and trapped energetic ions [H.L. Berk (2001), F. Zonca (2002)].
3. The EPMs found in this work is similar to the nonlocal EPM but in monotonic shear plasma and with passing energetic ions.
4. Theoretical exploration is needed!
0
0.1
0.2
0.3
0.4
0.5
0.6
0
1
2
3
4
5
6
0 0.2 0.4 0.6 0.8 1
/r a
EPM
Alfven continuum
q
I II III
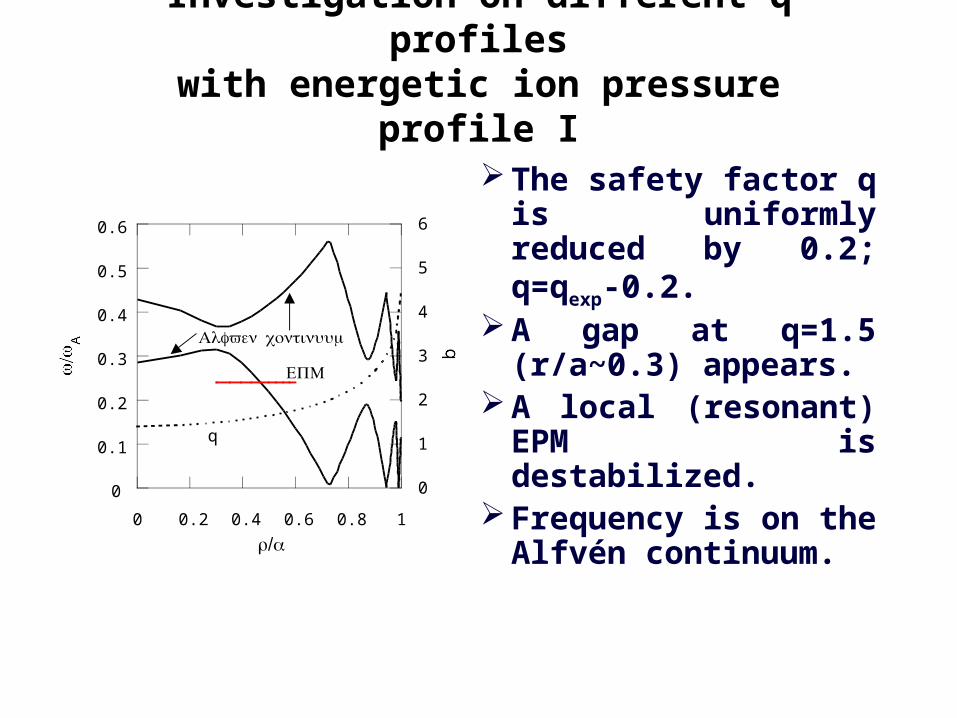
Investigation on different q profileswith energetic ion pressure profile I
The safety factor q is uniformly reduced by 0.2; q=qexp-0.2.
A gap at q=1.5 (r/a~0.3) appears.
A local (resonant) EPM is destabilized.
Frequency is on the Alfvén continuum.
0
0.1
0.2
0.3
0.4
0.5
0.6
0
1
2
3
4
5
6
0 0.2 0.4 0.6 0.8 1
/r a
EPM
Alfven continuum
q

Nonlocal EPM and local (resonant) EPM
2.0
1.5
1.0
0.5
0.0
z/a
4.03.53.02.5R/a
Test q profile (q=qexp-0.2)
Local (resonant) EPM
Spiral structure
q profile from experiment
Nonlocal EPM
2.0
1.5
1.0
0.5
0.0
z/a
4.03.53.02.5R/a

Nonlocal EPM and local (resonant) EPM (II)
-1.5 10-4
-1.0 10-4
-5.0 10-5
0.0 100
5.0 10-5
1.0 10-4
1.5 10-4
2.0 10-4
0 0.2 0.4 0.6 0.8 1
/r a
=1m
=2m
=3m
-1.5 10-4
-1.0 10-4
-5.0 10-5
0.0 100
5.0 10-5
1.0 10-4
1.5 10-4
2.0 10-4
0 0.2 0.4 0.6 0.8 1
/r a
=1m
=2m
=3m
Cosine part of n=1 electrostatic potential.
Sine part of n=1 electrostatic potential.
-5.0 10-6
0.0 100
5.0 10-6
1.0 10-5
1.5 10-5
2.0 10-5
2.5 10-5
0 0.2 0.4 0.6 0.8 1
/r a
=1m
=2m
=3m
-5.0 10-6
0.0 100
5.0 10-6
1.0 10-5
1.5 10-5
2.0 10-5
2.5 10-5
0 0.2 0.4 0.6 0.8 1
/r a
=1m
=2m =3m
Nonlocal EPM Local (resonant) EPM

Time evolution of the nonlocal EPM(energetic ion pressure profile I: classical)
Left: Time evolution of cosine part of the toroidal electric field. Bmax/B~10-2.
Right: Frequency shifts only downward by 33% (~17kHz) in 6 102 Alfvén time (~0.5ms).
-0.0008
-0.0006
-0.0004
-0.0002
0
0.0002
0.0004
0.0006
0.0008
0 200 400 600
ωAt
0.90
0.85
0.80
0.75
0.70
0.65
ω/ω
5004003002001000ωAt
0.7
0.5
0.5
0.3
0.3

Consider reduced energetic ion pressure profiles
In the experiments fast FS modes and abrupt large events take place with time intervals much shorter than the slowing down time.
These activities lead to redistribution and loss of energetic ions.
The classical distribution gives an
overestimate of energetic ion pressure profile.
We consider reduced pressure profiles whose shape is the same as the classical distribution.

Time evolution of the nonlocal EPM(classical distribution is reduced to 2/5)
Left: Time evolution of cosine part of the toroidal electric field. Bmax/B~210-3
Right: Frequency shifts upward by 14% (~7kHz) and downward by 23% (~12kHz) in 103 Alfvén time (~0.8ms). Close to the experiment.
-0.0002
-0.00015
-0.0001
-5 10-5
0
5 10-5
0.0001
0.00015
0.0002
0 400 800 1200
ωAt
1.1
1.0
0.9
0.8
ω/ω
800600400200ωAt
0.7 0.5
0.3 0.3

Radial beta profiles
0
0.005
0.01
0.015
0.02
0 0.2 0.4 0.6 0.8 1
t=0
t=586
/r a
0
0.001
0.002
0.003
0.004
0.005
0.006
0.007
0.008
0 0.2 0.4 0.6 0.8 1
t=0
t=1004
/r a
Initial: classical pressure profile. 40% reduction in central beta. Flattened at r/a<0.4.
Initial: reduced pressure profile.15% reduction in central beta. Flattened only at r/a<0.2.

Time evolution of mode spatial profile(toroidal electric field)
2.0
1.5
1.0
0.5
0.0
z/a
4.03.53.02.5R/a
2.0
1.5
1.0
0.5
0.0
z/a
4.03.53.02.5R/a
2.0
1.5
1.0
0.5
0.0
z/a
4.03.53.02.5R/a
2.0
1.5
1.0
0.5
0.0
z/a
4.03.53.02.5R/a
2.0
1.5
1.0
0.5
0.0
z/a
4.03.53.02.5R/a
Reducedpressureprofile
Change in mode profile
is small.
Classicalpressureprofile
ωAt=84 ωAt=252 ωAt=335
ωAt=252 ωAt=418 ωAt=924
2.0
1.5
1.0
0.5
0.0
z/a
4.03.53.02.5R/a

Comparison with hole-clump pair creation [H.L. Berk et al. Phys. Lett. A 234, 213 (1997); 238, 408(E) (1998).]
0
0.005
0.01
0.015
0.02
0.025
0.03
0.035
0.04
0 0.02 0.04 0.06 0.08 0.1
γL/ω
A
γd=0.4γ
L Blue circles: Frequency upshift and downshift.
Red triangles: Only downshift.
Consistent with the hole-clump pair creation.
For γd/ωA=0.025, γL/ωA=0.05, the theory predicts frequency shift ω=0.44 γL(γdt)1/2=0.11 ωA in 103 Alfvén time. This corresponds to 22kHz. Simulation result is 10kHz. In good agreement with a factor of 2.
Summary for fast FS mode
1. A new kind of nonlocal EPM is found near the plasma center with monotonic magnetic shear and passing energetic ions.
2. When a classical distribution is taken for the initial condition, frequency shifts only downward.
3. When a reduced distribution is taken, frequency shifts both upward and downward. The rate of frequency sweeping is close to the fast FS modes in the experiments.
4. Frequency shifts both upward and downward are consistent with the hole-clump pair creation.
5. A great redistribution of energetic ions takes place when the classical distribution is taken for the initial condition.

Computer Simulation of Fishbone oscillation (Y. Shiozaki)
GOAL
Clarify self-consistent nonlinear evolution of precessional fishbone oscillations; spatial profile, frquency evolution, saturation mechanism, energetic ion transport
Particle + MHD hybrid simulation (current coupling)
Bulk plasma : Ideal MHD equation Fast ion : kinetic equation using delta-f method
METHOD
BACKGROUND
Fishbone instabilities was first identified during near-perpendicular NBI injection in PDX tokamak.

Initial condition of simulation
1: Major radius 1.43 [m] Minor radius 0.43 [m]
2: Magnetic field at axis 1.5 [T]
3: Bulk plasma component Beam plasma component
4: Density 51019 [m-3]
5: Velocity distribution of NBI fast ion isotropic slowing down distribution, injection energy 50keV 6: Spatial profile of fast ion pressure
Gaussian distribution
Pressure gradient scale at q=1 surface 0.15 [m]
H+ plasmaD+ plasma

€
γ(1/τ A )
€
ω(1/τ A )
Frequency and growth rate at various energetic ion beta
€
energetic (%)
€
energetic (%)
When fast ion beta is 1.0%, the frequency is oscillating between 4kHz and –4kHz
For relatively high energetic ion beta values fishbone mode is destabilized
This result is similar to [W. Park et al., Phys. Plasmas 6, 1796 (1999)].
Case 1 Case 2

Mode Structure of fishbone
Mode Structure of kink mode
ar
ar
radialv
radialv
Case 1
Case 2
Radial velocity of (1,1) mode is well-known top-hat structure.
sin component of radial velocitycos component of radial velocity
sin component of radial velocitycos component of radial velocity
Around q=1 surface phase of the mode profile changes (spiral structure). Two step structure is slightly seen. Higher resolution is needed to clarify the two step structure.
q-profile
q
q
q-profile
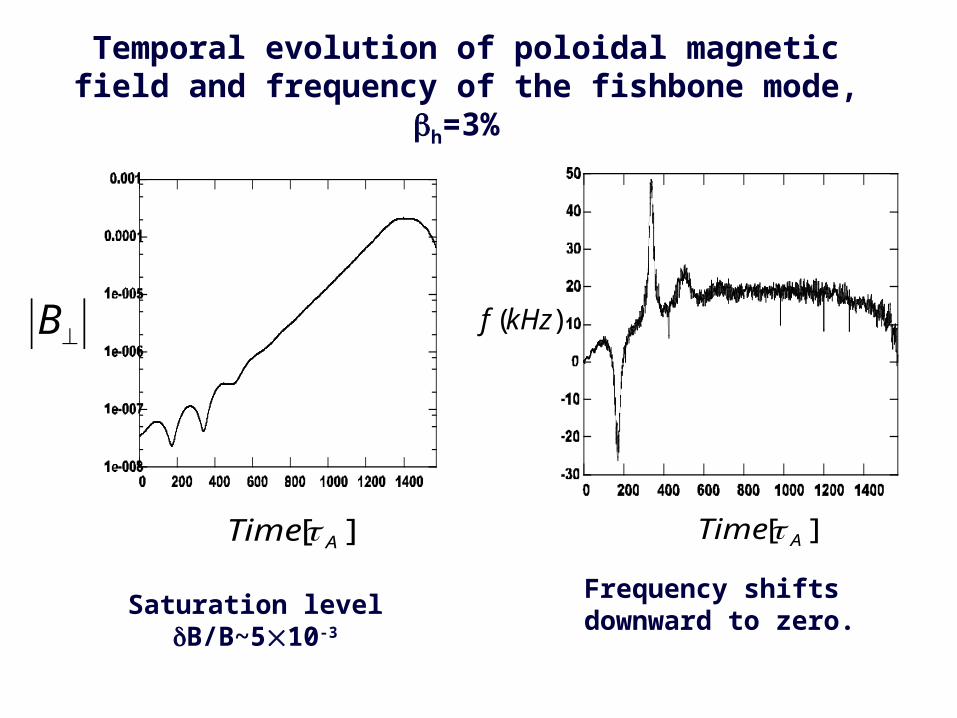
Temporal evolution of poloidal magnetic field and frequency of the fishbone mode, h=3%
][ ATime τ
⊥B
][ ATime τ
)(kHzf
Frequency shifts downward to zero.
Saturation level B/B~510-3

Time evolution in each toroidal mode number
][ ATime τ
MHD energy ( toroidal mode number N=1 )MHD energy ( toroidal mode number N=0 )
MHD energy ( toroidal mode number N=2 )
The n=1 mode saturates at 1400 Alfvén time. The n=0 and n=2 modes continues to grow after the n=1 mode saturation.
][ ATime τ
Transferred Energy (from energetic particles to MHD)MHD Energy
Total energy
Energy transfer from energetic ions to MHD continues even after the saturation of the n=1 mode growth.
Summary for fishbone mode
1. Linear stability and nonlinear evolution of fishbone mode is investigated. Frequency shifts downward at saturation. Saturation level is B/B~510-3.
2. After saturation of the n=1 mode, n=0 and n=2 modes continues to grow. Energy transfer from energetic ions to MHD fluid keeps a constant level.
3. Future work:
3.1 investigate energetic ion transport.
3.2 investigate generation of nonlinear MHD modes, interaction between energetic ions and the nonlinear MHD modes.


