
Permanent Mission of Switzerland
to the United Nations
Programme Schedule
Workbook Module 1: Funding for UN operational activities for development: key trends and issues
Preparations for the 2012 Quadrennial Comprehensive Policy Review of the General Assembly of UN operational
activities for development organized jointly with the Permanent Mission of Switzerland
and the UN Department of Economic and Social Affairs
United Nations Headquarters, New York Conference Room E
Wednesday, 1 February 2012

Permanent Mission of Switzerland
to the United Nations
Programme Schedule Module 1: Funding for UN operational activities for development: key trends and issues
TIME SESSION
09:30 a.m.
09:40 a.m.
Welcome remarks
Yvonne Lodico, Head, UNITAR New York Office
H.E. Paul Seger, Ambassador Extraordinary and Plenipotentiary and Permanent Representative of Switzerland to the United Nations
The QCPR process
Nadia Isler or Pio Wennubst, Permanent Mission of Switzerland to the UN
Navid Hanif, Acting Director, Office for ECOSOC Support and Coordination, UNDESA
10:00 a.m. UNICEF’s Funding Architecture: key trends and challenges
Afshan Khan, Director, Public-Sector Alliances and Resource Mobilization Office (PARMO), UNICEF
o Structure of funding contributions and expenditures
o Overview of key funding trends
Questions and answers/discussion
Preparations for the 2012 Quadrennial Comprehensive Policy Review of the General Assembly of UN operational
activities for development organized jointly with the Permanent Mission of Switzerland
and the UN Department of Economic and Social Affairs
United Nations Headquarters, New York Conference Room E
Wednesday, 1 February 2012

Permanent Mission of Switzerland
to the United Nations
10:45 a.m. UNDP’s Funding Architecture: key trends and challenges
Romesh Muttukumaru, Deputy Assistant Administrator and Deputy Director, Partnerships Bureau, UNDP
o Structure of funding contributions and expenditures
o Overview of key funding trends
Questions and answers/discussion
11:30 a.m. Coffee break
11:45 a.m. Overview of Funding Architecture of UN Operational Activities for Development
Kristinn Sv. Helgason, Deputy Chief, Development Cooperation Policy Branch, DESA
o Volume, sources and destination of funding
o Trends in contributions and predictability of resource flows
Questions and answers/ discussion
12:30 p.m. Closing remarks and evaluation
Yvonne Lodico, UNITAR
Six module course series organized jointly with
the Permanent Mission of Switzerland
and the UN Department of Economic and Social Affairs
1 February 2012
22 February 2012
13 March 2012
2 May 2012
22 June 2012
28 September 2012
Information Note
Operational activities for development of the UN system are defined as those activities of the funds,
programmes and specialized agencies which have the specific objective of promoting economic and social
development in programme countries. In 2010, nearly two-thirds of all UN system-wide activities were
operational activities for development.
The Quadrennial Comprehensive Policy Review (QCPR) is the mechanism through which the General
Assembly assesses the effectiveness, efficiency, coherence and impact of UN operational activities for
development and establishes system-wide policy orientations for the development cooperation and
country-level modalities of the UN system.
The 2012 QCPR process presents an important opportunity for Member States to engage in a dialogue on
how to adapt UN operational activities for development to the changing global development cooperation
context. To facilitate the QCPR process, the Secretary-General undertakes in-depth analytical work in a
number of areas including: funding, UN Development Assistance Framework (UNDAF) process, UN Resident
Coordinator system, harmonization of business practices, results-based strategic planning and
management, gender equality and women’s empowerment, support to countries in transition from relief to
development and emerging issues likely to affect the role of the UN development system in the near
future.
Background
Preparations for the 2012
Quadrennial Comprehensive Policy Review
of the General Assembly of UN operational
activities for development

The six-module course series, conducted in cooperation with UNDESA, is intended to provide delegates in
Permanent Missions of Member States in New York with an opportunity to examine in greater depth a
number of technical issues central to the QCPR, as part of the preparations for the upcoming
intergovernmental negotiation process.
At the end of the course series, participants will better understand:
• The key policy issues in the area of funding of UN operational activities for development;
• The role of coordination in enhancing country-level performance o f the UN development system;
• The emerging issues/global challenges likely to significantly impact the future role of the UN
development system in international cooperation for development;
• The perspectives of key stakeholders at the country-level on the relevance, effectiveness and
efficiency of UN operational activities for development.
The course will be organized into six half-day sessions, led by experts and practitioners in their respective
fields. Participants are encouraged to attend all the sessions.
Module 1 (1 February 2012): Funding for UN operational activities for development: key trends and
issues (UNDESA in cooperation with UNDP and UNICEF)
Module 2 (22 February 2012): Functioning of the UN development system: (a) UNDAF process, (b) UN
Resident Coordinator system and (c) harmonization of business practices:
challenges and opportunities
Module 3 (13 March 2012): Positioning of the UN system in a changing development landscape
Module 4 (27 April 2012): Perspectives from the field: findings of surveys of programme country
governments, UN Resident Coordinators and UN country teams and civil
society organizations working with the UN system at the country-level
Module 5 (22 June 2012): Briefing prior to the Operational Activities Segment of the Economic and
Social Council: Designed for diplomats coming to New York for the
substantive session of the Economic and Social Council, this intensive
module will explain the QCPR process and summarize the key messages
of the first four sessions.
Module 6 (28 September 2012): Briefing prior to General Assembly deliberations on QCPR: Designed for
diplomats who arrived during the summer and were unable to attend the
other briefings, this last module will present/explain the QCPR process
and all the materials produced in the previous sessions.
Participants: The Series is open to delegates of permanent missions to the United Nations in New York who
are involved or interested in UN operational activities for development, and other representatives of
international, intergovernmental, and non-governmental organizations.
Registration: If you wish to participate in the modules, please register online at
http://www.unitar.org/event/new-york.
Course objective
Organization
Logistics
Mr. Felix Haass
United Nations Institute for Training and Research (UNITAR)
One United Nations Plaza, DC1-603
New York, NY 10017
Email: [email protected]
Phone: (212) 963-3021
Fax: (212) 963-9686/ 0995
Six module course series organized jointly with the UN Department of Economic and Social Affairs
Sponsored by the Permanent Mission of Switzerland to the UN
Agency-specific thematic funds
These are funds which generally allow UN agencies to programme more responsively, based on
country and global priorities, without having to negotiate project agreements and conditions.
Thematic funds are pooled and designed to have fewer restrictions on their use than traditional
non-core resources. Examples include UNFPA’s Maternal Health Thematic Fund and UNICEF’s
Thematic Fund for Basic Education and Gender Equality.
Core and non-core resources
Operational activities for development are funded by a combination of so-called core and non-
core resources. Core resources are those that are commingled without restrictions and whose use
and application are directly linked to the strategic mandates, guidelines, priorities and goals
established by the respective intergovernmental governing bodies. Non-core resources are
resources that are generally restricted with regard to their use and application as determined by
the contributor. The degree to which the use and application of non-core resources are subject to
and aligned with the mandates, guidelines, priorities, and goals established by intergovernmental
governing bodies is at best indirect. Core resources are generally preferred by UN agencies since
they are required to preserve the UN’s multilateral, impartial and universal character. Core
resources also tend to provide more flexibility to spend on the priorities of programme countries.
Selected Funding Terms
Preparations for the 2012 Quadrennial Comprehensive Policy Review of the General Assembly of UN operational
activities for development

Multi-partner trust funds (MPTFs)
These funds are a type of joint programme which uses the pass-through fund management model.
Donors agree to channel the funds through one UN agency (the “Administrative Agent”) which
distributes the funds to multiple UN participating organizations. MPTFs are designed to enhance
coherence and provide more flexible funding than traditional non-core resources. One UN
Country Funds are a type of MPTF. For example, the Mozambique One UN Fund receives
contributions from 6 countries and engages 18 UN funds, programmes and agencies to deliver
results in support of the national development objectives and priorities.
Nominal versus real terms
Comparisons and trend analyses in “real terms” are based on nominal amounts expressed in
constant United States dollars which take into account the combined effect of inflation and
exchange rate movements. This is done to make data comparable across different time periods.
Operational activities for development
These are activities of UN funds, programmes and agencies which have the specific objective of
promoting development. Most United Nations entities have specific mandates in this regard.
Thirty-six UN entities received contributions for operational activities for development in 2009.
Operational activities for development cover both longer-term development-related activities as
well as activities with a humanitarian assistance focus. Humanitarian assistance refers to activities
that respond to an immediate crisis, such as the emergency operations put in place following the
2010 earthquake in Haiti.

31/01/2012
1
UNICEF’s Funding Architecture:
Key Trends and Challenges
Afshan Khan February 1, 2012
Director
Public Alliances and Resource Mobilization Office
(check against delivery)
Presentation Outline
2
A. Review of key funding trends
B. Predictability of core resources for UNICEF’s mandate
C. Multiplicity of funding sources for a broad donor base
D. Quality non-core resources: UNICEF thematic funds
E. Non-core emergency funding: underfunded crises
F. Programme expenditures
G. Narrowing the gaps in achieving MDGs with equity

31/01/2012
2
UNICEF Total Income: 2002 – 2011(USD millions)
*2011 figures are provisional
3
• UNICEF is 100% voluntarily funded
Total UNICEF Income by Funding Type: 2011*
(USD)
*2011 figures are preliminary
4
Regular Resources (RR) Un-earmarked, core resources that help sustain UNICEF assisted programmes and enable UNICEF to carry out its mission to improve the lives of children and women.
Other Resources (OR)Earmarked contributions for programmes that are supplementary to the contributions to Regular Resources and are restricted to a particular programme, geographic area, or strategic priority, or (ORE) an emergency response.

31/01/2012
3
Un-earmarked regular resources –highest quality funding to UNICEF
5
• Regular resources:
Provide the highest quality and flexibility of funding and help ensure the organization’s independence, neutrality and role as a trusted partner, with adequate highly-skilled capacity at country level, for country-driven, innovative, and efficient programme activities
Enable quick and flexible responses to changing circumstances –allowing the channeling of resources to programme areas where most needed and to new emerging challenges, exploration of innovative approaches, and new partnerships
Total regular resources expenditure, 2010
6
UNICEF allocates 90% of its regular resources to developing and implementing programmes

31/01/2012
4
Regular resources narrow the gaps in MDGs achievement by investing in the most vulnerable
7
2010: Core resource programmeassistance expenditure: Top 10 Countries
• UNICEF utilizes a formula approved by its Executive Board that ensures LDCs receive at least 60% of core resources and countries in Sub-Saharan Africa receive at least 50%.
• In 2010, UNICEF allocated 90% of core programme assistance to priority countries based on under-5 child mortality rates, GNI per capita, and size of the child population.
Income by Funding Type: 2007-2011
*2011 figures are preliminary
8
UNICEF’s share of core resources has followed an overall trend of decline
31/01/2012
5
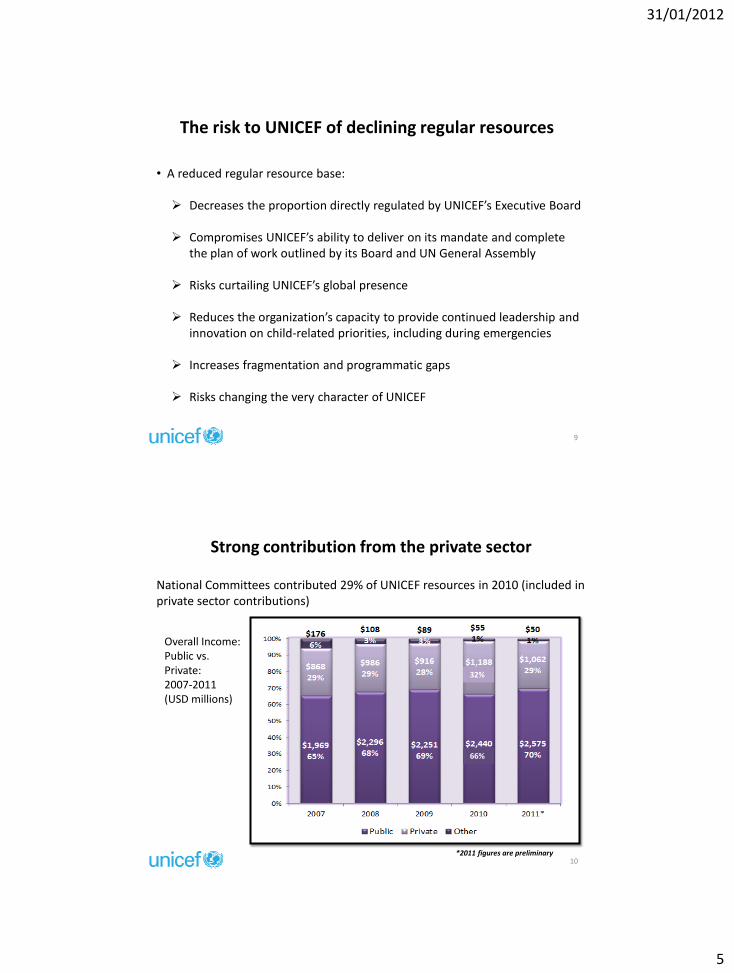
The risk to UNICEF of declining regular resources
9
• A reduced regular resource base:
Decreases the proportion directly regulated by UNICEF’s Executive Board
Compromises UNICEF’s ability to deliver on its mandate and complete the plan of work outlined by its Board and UN General Assembly
Risks curtailing UNICEF’s global presence
Reduces the organization’s capacity to provide continued leadership and innovation on child-related priorities, including during emergencies
Increases fragmentation and programmatic gaps
Risks changing the very character of UNICEF
Overall Income: Public vs. Private: 2007-2011 (USD millions)
*2011 figures are preliminary10
Strong contribution from the private sector
National Committees contributed 29% of UNICEF resources in 2010 (included in private sector contributions)
USD
mill
ion
s
32%
66%

31/01/2012
6
Regular resources: Public vs. Private, 2007-11(USD millions)
USD
mill
ion
s
*2011 figures are preliminary
11
Total Income: Public Sector, 2011*
(USD millions)
*2011 figures are preliminary
12
• UNICEF explores multiple funding modalities constituting the new aid architecture in order to secure adequate, predictable and quality funding to fulfil its mandate and achieve the targets of its Medium-Term Strategic Plan

31/01/2012
7
Overall Income - Public Sector, 2007-11(USD millions)
USD
mill
ion
s
*2011 figures are preliminary
13
DAC vs. Non-DAC donors, 2011*
*2011 figures are preliminary
14
• A broad donor base helps ensure impartial, neutral assistance, and decreases dependencies to implement UNICEF’s mandate
• UNICEF is committed to supporting South-South cooperation, through which developing countries are becoming supporters and contributors to other countries’ development, particularly in capacity building

31/01/2012
8
Top 10 Government Donors, 2011*
(USD millions)
*2011 figures are preliminary
15
Top 10 Non-DAC Donors, 2011*
(USD thousands)
*2011 figures are preliminary
16

31/01/2012
9
Quality other resource thematic funds
17
• UNICEF thematic funds are the best alternative to regular resources:
Pooled contributions from all donors
Earmarked only up to Medium-Term Strategic Programme focus area: Young Child Survival & Development; Basic Education and Gender Equality; HIV/AIDS; Child Protection; Policy & Practice; plus Humanitarian Action
Funding at either Global, Regional or Country level
Expenditure tracked for overall pooled contributions
Consolidated annual narrative report / financial statement per focus area
Lower recovery rate (5% vs. 7%) accounting for reduced transaction costs
Thematic Contributions, 2007-11
*2011 figures are preliminary
18
• Reversals in 2011 still showing the 2nd best annual performance overall. Thematic funding has a narrow funding base; one donor cut contributions in 2011 following the economic downturn. Humanitarian surge in 2010 is largely private sector income for the Haiti earthquake.

31/01/2012
10
Thematic Contributions, 2011by MTSP Focus Areas & Humanitarian
Thematic Contributions 2011*: US$373 million
*2011 figures are preliminary
19
Other Resources – Emergency, 2002-2011(USD millions)
*2011 figures are preliminary
20
• Highly volatile income trend dependent on major global emergencies, e.g. a) 2004/05: East Asia Tsunami; b) 2010: Haiti earthquake and Pakistan floods; c) 2011: Horn of Africa crisis
31/01/2012
11
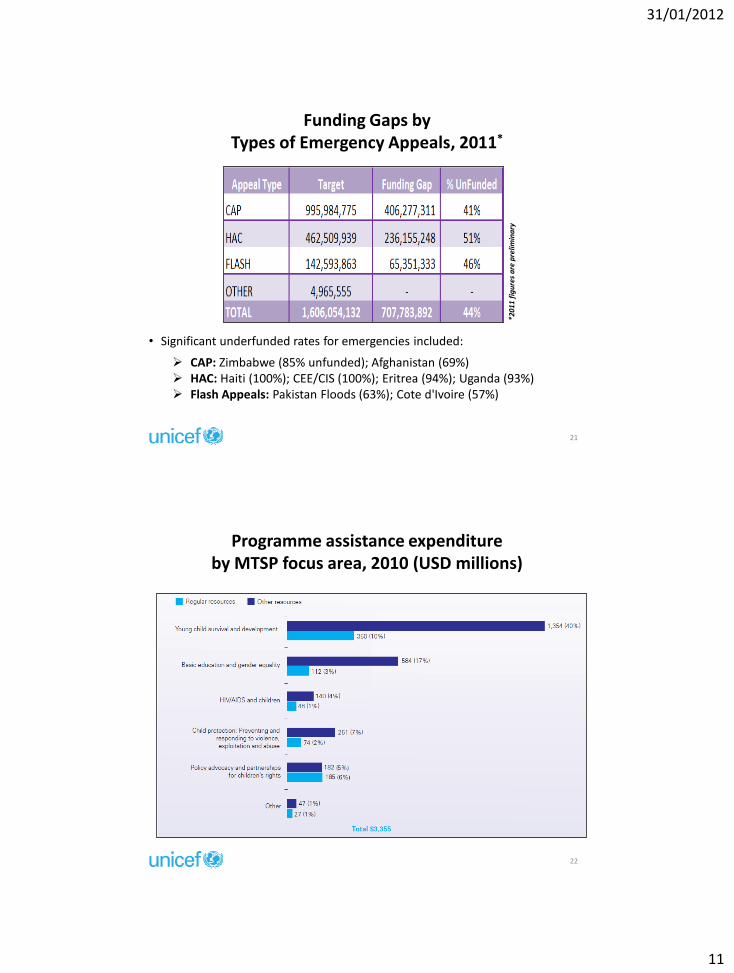
Funding Gaps by Types of Emergency Appeals, 2011*
CAP: Zimbabwe (85% unfunded); Afghanistan (69%) HAC: Haiti (100%); CEE/CIS (100%); Eritrea (94%); Uganda (93%) Flash Appeals: Pakistan Floods (63%); Cote d'Ivoire (57%)
*201
1 fi
gu
res
are
pre
limin
ary
21
• Significant underfunded rates for emergencies included:
22
Programme assistance expenditure by MTSP focus area, 2010 (USD millions)
31/01/2012
12
23
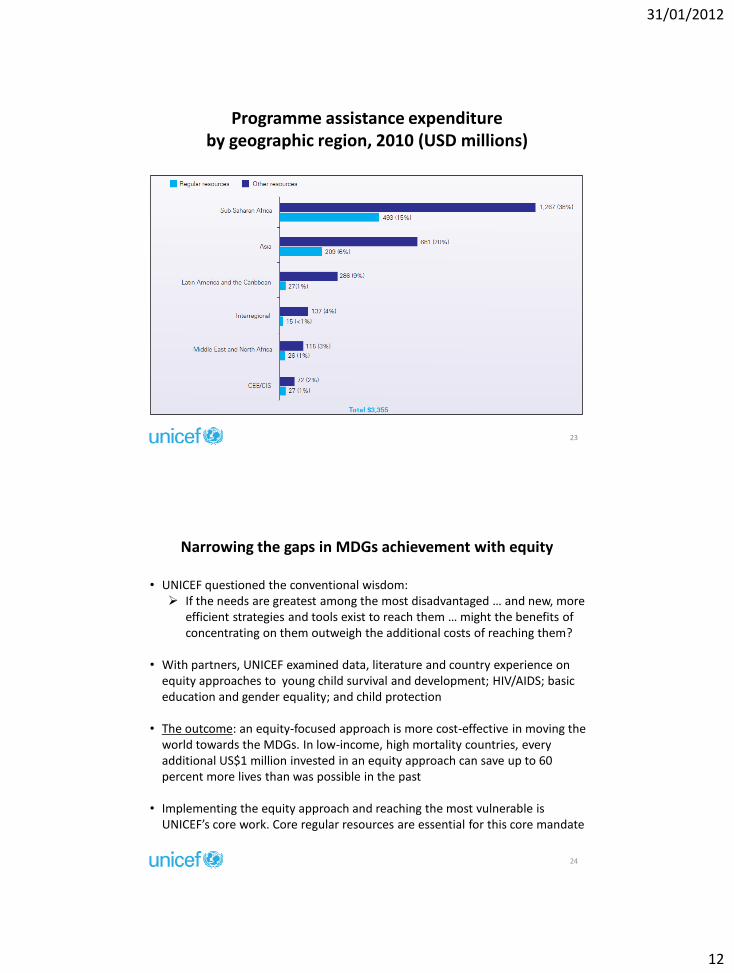
Programme assistance expenditure by geographic region, 2010 (USD millions)
Narrowing the gaps in MDGs achievement with equity
24
• UNICEF questioned the conventional wisdom: If the needs are greatest among the most disadvantaged … and new, more
efficient strategies and tools exist to reach them … might the benefits of concentrating on them outweigh the additional costs of reaching them?
• With partners, UNICEF examined data, literature and country experience on equity approaches to young child survival and development; HIV/AIDS; basic education and gender equality; and child protection
• The outcome: an equity-focused approach is more cost-effective in moving the world towards the MDGs. In low-income, high mortality countries, every additional US$1 million invested in an equity approach can save up to 60 percent more lives than was possible in the past
• Implementing the equity approach and reaching the most vulnerable is UNICEF’s core work. Core regular resources are essential for this core mandate
31/01/2012
13
Thank you!25

1
Regular Resources
OVERVIEW OF UNDP INCOME
REGULAR AND OTHER RESOURCES
Orientation session for Member States
Romesh Muttukumaru
Deputy Assistant Administrator
1 February 2012
Bureau for External Relations and Advocacy
SOME BASIC FACTS ABOUT UNDP
• UNDP is a voluntary funded organization
• UNDP is the United Nations' global development network and fulfills two roles: as manager of the UN resident coordinator system; and as a development agency working to achieve sustainable development
• UNDP has a universal presence working in 177 countries; with representational country offices in 127 countries in the world
2
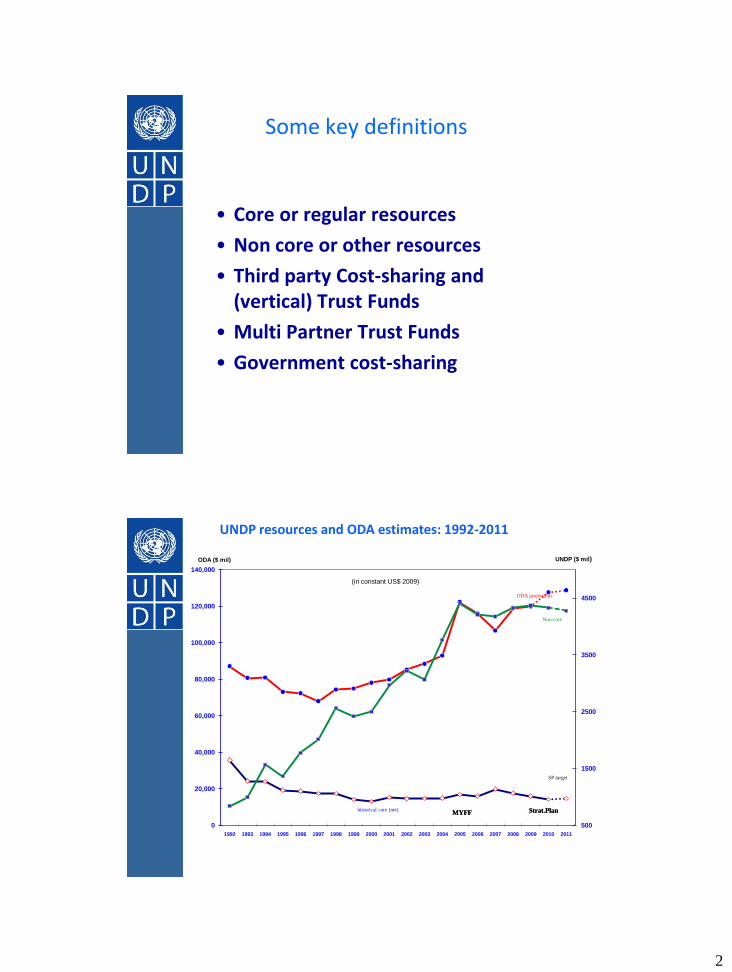
Some key definitions
• Core or regular resources
• Non core or other resources
• Third party Cost-sharing and (vertical) Trust Funds
• Multi Partner Trust Funds
• Government cost-sharing
UNDP resources and ODA estimates: 1992-2011
500
1500
2500
3500
4500
0
20,000
40,000
60,000
80,000
100,000
120,000
140,000
1992 1993 1994 1995 1996 1997 1998 1999 2000 2001 2002 2003 2004 2005 2006 2007 2008 2009 2010 2011
UNDP ($ mil)ODA ($ mil)
SP target
ODA projections
historical core (net)MYFF Strat.Plan
(in constant US$ 2009)
Non-core
MYFF Strat.Plan
3
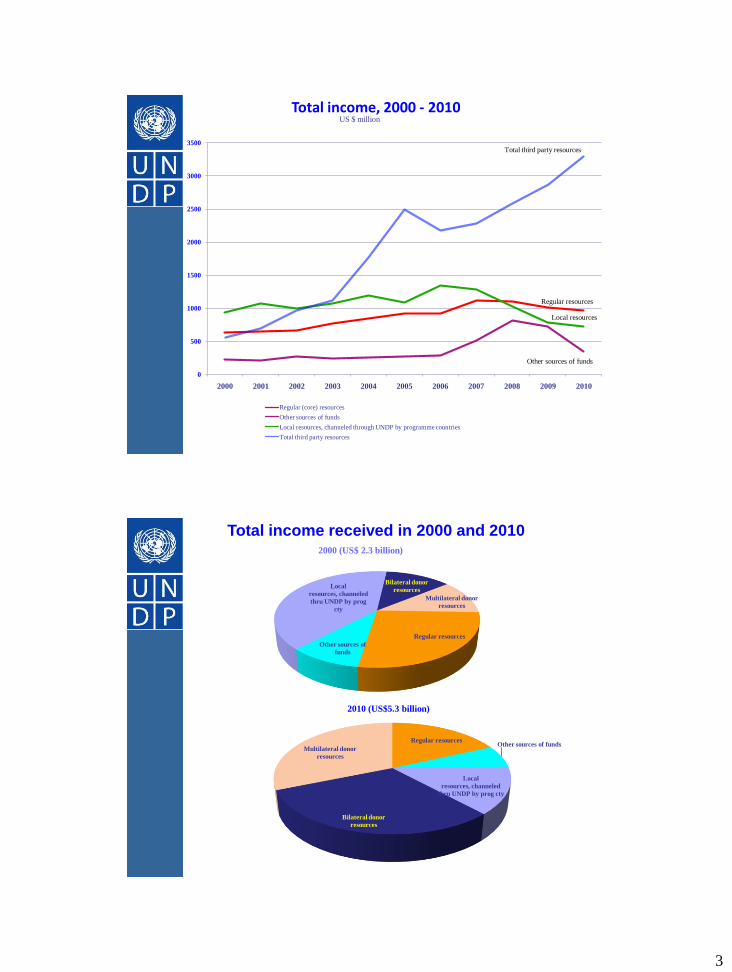
Total income, 2000 - 2010US $ million
0
500
1000
1500
2000
2500
3000
3500
2000 2001 2002 2003 2004 2005 2006 2007 2008 2009 2010
Regular (core) resources
Other sources of funds
Local resources, channeled through UNDP by programme countries
Total third party resources
Total third party resources
Regular resources
Local resources
Other sources of funds
Total income received in 2000 and 2010
Regular resources
Other sources of
funds
Local
resources, channeled
thru UNDP by prog
cty
Bilateral donor
resources
Multilateral donor
resources
2000 (US$ 2.3 billion)
Regular resourcesOther sources of funds
Local
resources, channeled
thru UNDP by prog cty
Bilateral donor
resources
Multilateral donor
resources
2010 (US$5.3 billion)

4
Top donors (contributing $1 million and more) to regular resources: 2011
Countries US$ % share Countries US$%
share
Norway 133,222,959 13.5% Australia 23,707,774 2.4%
Sweden 105,144,287 10.7% France 22,643,646 2.3%
Netherlands 93,829,607 9.5% Ireland 12,652,137 1.3%
United Kingdom 89,708,041 9.1% New Zealand 6,244,146 0.6%
United States 84,060,360 8.5% Austria 5,660,911 0.6%
Japan 82,144,552 8.3% Republic of Korea 5,000,000 0.5%
Denmark 61,924,298 6.3% China 4,600,000 0.5%
Switzerland 58,133,276 5.9% Luxembourg 4,174,922 0.4%
Canada 51,145,663 5.2% India 4,147,590 0.4%
Germany 38,211,152 3.9% Italy 2,122,842 0.2%
Belgium 29,719,785 3.0% Saudi Arabia 2,000,000 0.2%
Finland 28,304,557 2.9% Malaysia 1,155,000 0.1%
Spain 25,884,517 2.6%
Top OECD/DAC Donors Other Resources
In 2010 (US$ million)
0 50 100 150 200 250 300 350 400
Spain
Denmark
Sweden
Netherlands
Germany
Canada
Norway
UK
USA
Japan
5
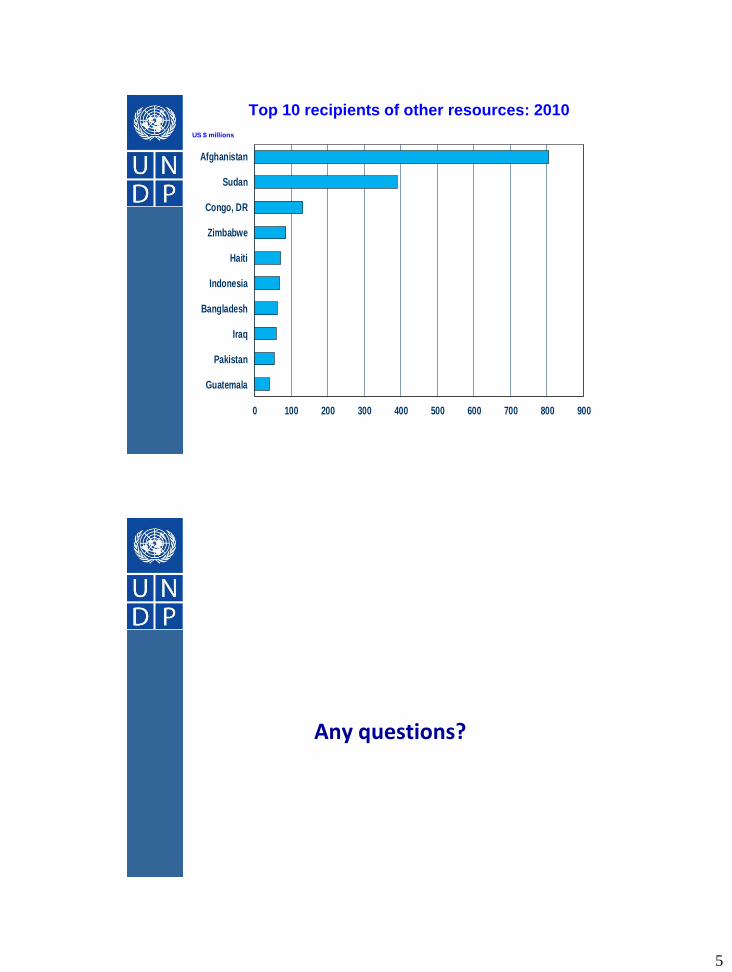
Top 10 recipients of other resources: 2010
0 100 200 300 400 500 600 700 800 900
Guatemala
Pakistan
Iraq
Bangladesh
Indonesia
Haiti
Zimbabwe
Congo, DR
Sudan
Afghanistan
US $ millions
Any questions?

1
1
Overview of the Funding
Architecture of UN Operational
Activities for Development
New York, 1 February 2012
UNITAR Seminar
Kristinn Sv. Helgason and Andrew MacPherson, OESC, UNDESA
2
A. Volume, sources and destination of funding
B. Key funding trends
C. Non-core funding modalities
D. Predictability of funding
E. Importance of UN operational activities
Presentation outline
Kristinn Sv. Helgason and Andrew MacPherson, OESC, UNDESA

2
3
A. UN system-wide activities (2009)
Humanitarian
Ass is tance
22%
(Based on 2009 contributions to UN system-wide activities ($34.3 billion)
Peacekeeping
21%
Norm-setting &
other
16%
Development-
related activi ties
41%
Operational
activi ties for
development
Kristinn Sv. Helgason and Andrew MacPherson, OESC, UNDESA
4
A. Operational activities for development
(DEV & HA, 2009)
Non-core (DEV)
43%
(Based on 2009 contributions which totalled $21.9 billion)
Core (HA) 5%
Non-core (HA)
30%
Development-
related activi ties
(DEV)
Humanitarian
Ass is tance
(HA)
Core (DEV)
22%
Kristinn Sv. Helgason and Andrew MacPherson, OESC, UNDESA

3
5
A. Largest UN entities (DEV & HA, 2009)
0
500
1 000
1 500
2 000
2 500
3 000
3 500
4 000
0 200 400 600 800 1 000 1 200 1 400
Core contributions
No
n-c
ore
co
ntr
ibu
tio
ns
(Millions of current United States dollars)
UNDP
FAO
UNHCR
UNFPA
WHO
UNRWA
UNICEF
WFP
50% core
share
Kristinn Sv. Helgason and Andrew MacPherson, OESC, UNDESA
6
A. Sources of funding
(DEV & HA, major groups, 2009)
European
Commiss ion 8%
Others
19%
(Total funding in 2009: $21.9 billion)
Non-OECD/DAC
Governments
9%
21%
OECD/DAC
Governments
63%
21%
Kristinn Sv. Helgason and Andrew MacPherson, OESC, UNDESA

4
7
A. Destination of funding (DEV & HA, 2009)
Africa
33%
(Total expenditures in 2009: $22.1 billion)
Americas
8%As ia/Paci fic
18%
Europe 2%
Western As ia
8%
Regional and
global 11%
Not attributed 7%
Programme support
and management
activi ties
13%
Kristinn Sv. Helgason and Andrew MacPherson, OESC, UNDESA
8
B. Trends in the sources of total funding
(DEV & HA, major groups, 1995-2009)
Kristinn Sv. Helgason and Andrew MacPherson, OESC, UNDESA
0
5
10
15
1994 1999 2004 2009
Co
ntr
ibu
tio
ns
(bill
ion
s o
f co
nst
ant
20
08
$U
S)
-50
0
50
100
150
200
250
300
350
400
Pe
rce
nta
ge c
han
ge
(bas
e y
ear
is 1
99
4)
Core Non-core
Core
Non-core
63%
76%
0
5
10
15
20
1995 2000 2005 2009
Cont
ribu
tion
s
(bi
llion
s of
con
stan
t 20
08 U
nite
d St
ates
dol
lars
)
DAC Governments Non-DAC Governments European Commiss ion Others
5
99
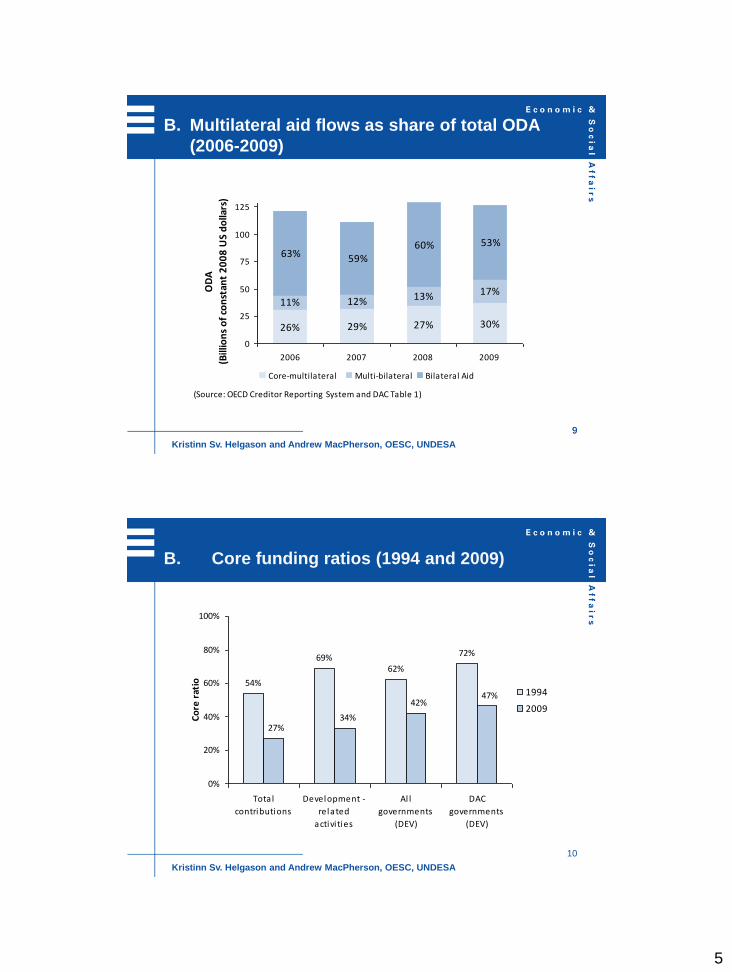
B. Multilateral aid flows as share of total ODA
(2006-2009)
30%27%29%26%
17%13%12%11%
53% 60% 59% 63%
0
25
50
75
100
125
2006 2007 2008 2009
OD
A
(Bill
ion
s o
f co
nst
ant
20
08
US
do
llars
)
Core-multilateral Multi-bilateral Bilateral Aid
(Source: OECD Creditor Reporting System and DAC Table 1)
Kristinn Sv. Helgason and Andrew MacPherson, OESC, UNDESA
10
B. Core funding ratios (1994 and 2009)
54%
69%62%
72%
47%42%
34%27%
0%
20%
40%
60%
80%
100%
Total
contributions
Development -
related
activi ties
Al l
governments
(DEV)
DAC
governments
(DEV)
Co
re r
atio
1994
2009
Kristinn Sv. Helgason and Andrew MacPherson, OESC, UNDESA

6
11
B. Trends in contributions (DEV, 1994-2009)
Kristinn Sv. Helgason and Andrew MacPherson, OESC, UNDESA
0
5
10
15
1994 1999 2004 2009
Co
ntr
ibu
tio
ns
(bill
ion
s o
f co
nst
ant
20
08
$U
S)
-50
0
50
100
150
200
250
300
350
400
Pe
rce
nta
ge c
han
ge
(bas
e y
ear
is 1
99
4)
Core Non-core
Core
Non-core
12
C. Non-core funding modalities (DEV only, 2009)
Thematic funds
5%
Local
resources
11%
Programme- and
project-speci fic
Other multi -donor trust
funds 6%
(Total non-core funding for development-related activities: $9.4 billion)
One UN funds 1%
Single-donor,
programme- and
project-speci fic
77%
Kristinn Sv. Helgason and Andrew MacPherson, OESC, UNDESA

7
1313
C. One UN Funds (2009)
Total ODATotal UN
expendituresOne UN Fund expenditure Share of Total ODA
Share of total UN expenditures
Recipient country (millions of United States dollars) (percentage)
Albania 358 19 3.6 1.0 18.5
Cape Verde 196 11 2.4 1.2 20.9
Malawi 772 123 1.1 0.1 0.9
Mozambique 2013 141 10.9 0.5 7.7
Pakistan 2781 586 1.7 0.1 0.3
Rwanda 934 96 5.8 0.6 6.1
United Rep. of Tanzania 2934 165 16.4 0.6 9.9
Uruguay 51 36 6.7 13.3 18.4
Viet Nam 3744 84 19.7 0.5 23.5
Total/Average 13784 1262 68.3 0.5 5.4
(Source of ODA data: OECD/DAC statistics, DAC Table 2a)
Kristinn Sv. Helgason and Andrew MacPherson, OESC, UNDESA
14
D. Currency exchange rate movements
(major currencies, 2005-2009)
-30%
-20%
-10%
0%
10%
20%
30%
Jan
-05
Ap
r-0
5
Jul-
05
Oct
-05
Jan
-06
Ap
r-0
6
Jul-
06
Oct
-06
Jan
-07
Ap
r-0
7
Jul-
07
Oct
-07
Jan
-08
Ap
r-0
8
Jul-
08
Oct
-08
Jan
-09
Ap
r-0
9
Jul-
09
Oct
-09
Jan
-10
Ap
r-1
0
Jul-
10
Oct
-10
Jan
-11
USD/EUR USD/GBP USD/JPYUSD/NOK USD/DKK USD/CHFUSD/CAD USD/SEK
Kristinn Sv. Helgason and Andrew MacPherson, OESC, UNDESA

8
15
D. Change in donor currency and US$ equivalent
(UNICEF, core contributions, 2008-2009)
0%
0%
17%
11%
0%
0%
13%
22%
2%
6%
-18%
-4%
-9%
-13%
-5%
1%
2%
-30% -20% -10% 0% 10% 20% 30%
BEL
CHE
DNK
ESP
FIN
GBR
NLD
NOR
SWE
USA
change donor currency change USD change total core contributions
Kristinn Sv. Helgason and Andrew MacPherson, OESC, UNDESA
16
E. United Nations share of ODA in programme
countries (2009)
Kristinn Sv. Helgason and Andrew MacPherson, OESC, UNDESA
21%
100%
85%
53%
22%
0
10
20
30
40
50
60
70
Over 40% 30% - 40% 20% - 30% 10% - 20% Under 10%
United Nations share of total ODA
Nu
mb
er
of
cou
ntr
ies
0%
10%
20%
30%
40%
50%
60%
70%
80%
90%
100%
Cu
mu
lati
ve s
har
e o
f
exp
en
dit
ure
s
United Nations data excludes local resources.
Information on ODA obtained from OECD DAC Statistics, DAC Table 2a
31%
8%
14%
3%
44%
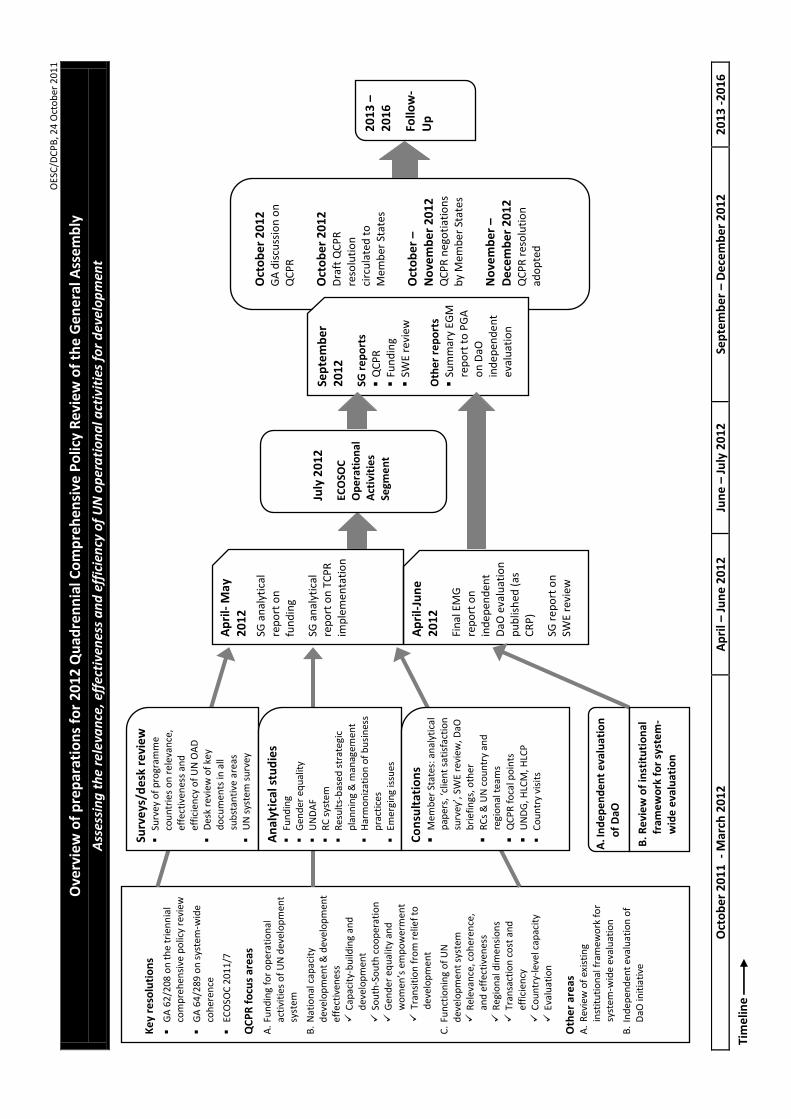
OES
C/D
CP
B, 2
4 O
cto
ber
20
11
Ove
rvie
w o
f p
rep
arat
ion
s fo
r 20
12
Qu
adre
nn
ial C
om
pre
hen
sive
Po
licy
Rev
iew
of
the
Ge
ne
ral A
sse
mb
ly
Ass
essi
ng
th
e re
leva
nce
, eff
ecti
ven
ess
an
d e
ffic
ien
cy o
f U
N o
per
ati
on
al a
ctiv
itie
s fo
r d
evel
op
men
t
Oct
ob
er
20
11
- M
arch
20
12
A
pri
l – J
un
e 2
01
2
Jun
e –
Ju
ly 2
01
2
Sep
tem
be
r –
De
cem
be
r 2
01
2
20
13
-2
01
6
20
13
–
20
16
Fo
llow
-U
p
Ap
ril-
Jun
e
20
12
Fin
al E
MG
re
po
rt o
n
ind
ep
end
en
t D
aO e
valu
atio
n
pu
blis
hed
(as
C
RP
)
SG r
ep
ort
on
SW
E re
view
Ap
ril-
Ma
y 2
01
2
SG a
nal
ytic
al
rep
ort
on
fu
nd
ing
SG a
nal
ytic
al
rep
ort
on
TC
PR
im
ple
me
nta
tio
n
Oct
ob
er
20
12
G
A d
iscu
ssio
n o
n
QC
PR
O
cto
be
r 2
01
2
Dra
ft Q
CP
R
reso
luti
on
ci
rcu
late
d t
o
Mem
ber
Sta
tes
O
cto
be
r –
No
vem
be
r 2
01
2
QC
PR
neg
oti
atio
ns
by
Mem
be
r St
ate
s
No
vem
be
r –
De
cem
be
r 2
01
2
QC
PR
res
olu
tio
n
ado
pte
d
Sep
tem
be
r 2
01
2
SG r
ep
ort
s Q
CP
R
F
un
din
g S
WE
revi
ew
Oth
er
rep
ort
s S
um
mar
y EG
M
rep
ort
to
PG
A
on
DaO
in
de
pen
de
nt
eval
uat
ion
July
20
12
ECO
SOC
O
pe
rati
on
al
Act
ivit
ies
Segm
en
t
Tim
elin
e
A. I
nd
ep
en
de
nt
eva
luat
ion
o
f D
aO
Ke
y re
solu
tio
ns
GA
62
/208
on
th
e tr
ien
nia
l co
mp
reh
ensi
ve p
olic
y re
view
GA
64
/289
on
sys
tem
-wid
e co
her
ence
ECO
SOC
20
11
/7
QC
PR
fo
cus
are
as
A.
Fun
din
g fo
r o
per
atio
nal
ac
tivi
ties
of
UN
dev
elo
pm
ent
syst
em
B.
Nat
ion
al c
apac
ity
dev
elo
pm
ent
& d
evel
op
men
t ef
fect
iven
ess
Cap
acit
y-b
uild
ing
and
d
evel
op
men
t
So
uth
-So
uth
co
op
erat
ion
Gen
der
eq
ual
ity
and
w
om
en’s
em
po
wer
men
t
Tra
nsi
tio
n f
rom
rel
ief
to
dev
elo
pm
ent
C.
Fun
ctio
nin
g o
f U
N
dev
elo
pm
ent
syst
em
R
elev
ance
, co
her
ence
, an
d e
ffec
tive
nes
s
R
egio
nal
dim
ensi
on
s
Tra
nsa
ctio
n c
ost
an
d
effi
cien
cy
C
ou
ntr
y-le
vel c
apac
ity
Eva
luat
ion
O
the
r ar
eas
A
. R
evie
w o
f ex
isti
ng
inst
itu
tio
nal
fra
mew
ork
fo
r sy
stem
-wid
e ev
alu
atio
n
B.
Ind
epen
den
t ev
alu
atio
n o
f D
aO in
itia
tive
Surv
eys
/de
sk r
evi
ew
Surv
ey o
f p
rogr
amm
e co
un
trie
s o
n r
ele
van
ce,
effe
ctiv
enes
s an
d
effi
cien
cy o
f U
N O
AD
Des
k re
view
of
key
do
cum
ents
in a
ll su
bst
anti
ve a
reas
UN
sys
tem
su
rvey
An
alyt
ical
stu
die
s
Fun
din
g
Gen
der
eq
ual
ity
UN
DA
F
RC
sys
tem
Res
ult
s-b
ased
str
ateg
ic
pla
nn
ing
& m
anag
emen
t
Har
mo
niz
atio
n o
f b
usi
nes
s p
ract
ices
Emer
gin
g is
sues
Co
nsu
ltat
ion
s
Mem
ber
Sta
tes:
an
alyt
ical
p
aper
s, ‘c
lien
t sa
tisf
acti
on
su
rvey
’, S
WE
revi
ew, D
aO
bri
efin
gs, o
the
r
RC
s &
UN
co
un
try
and
re
gio
nal
tea
ms
QC
PR
fo
cal p
oin
ts
UN
DG
, HLC
M, H
LCP
Co
un
try
visi
ts
B. R
evi
ew
of
inst
itu
tio
nal
fr
ame
wo
rk f
or
syst
em
-w
ide
eva
luat
ion


