
1Confidential
The Changing Canadian M&A MarketFEI Canada Breakfast Seminar
TRANSACTION ADVISORY SERVICES
March/April 2006

2Confidential
M&A Market Participants
DatePrivate and Confidential

3Confidential
M&A Market Participants
Market participants and their roles are changing in today’s transaction environment: Strategic Acquirers
Private Equity Groups
Public Markets

4Confidential
strategic acquirers
5Confidential
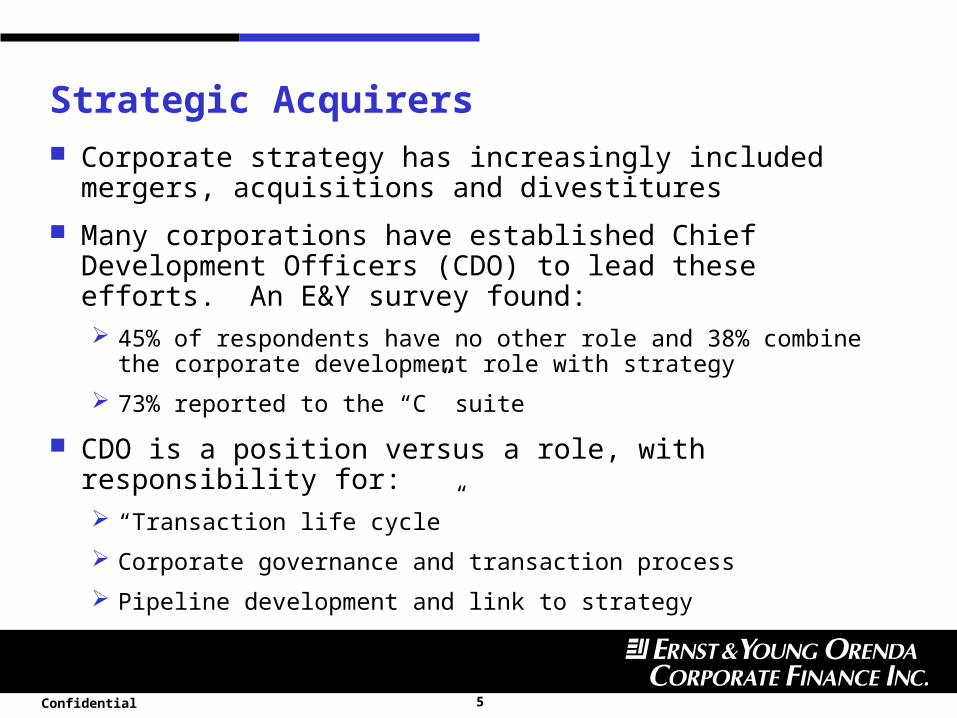
Strategic Acquirers Corporate strategy has increasingly included mergers, acquisitions and
divestitures Many corporations have established Chief Development Officers
(CDO) to lead these efforts. An E&Y survey found: 45% of respondents have no other role and 38% combine the corporate
development role with strategy
73% reported to the “C” suite
CDO is a position versus a role, with responsibility for: “Transaction life cycle”
Corporate governance and transaction process
Pipeline development and link to strategy

6Confidential
Strategic Acquirers (cont’d)
77%
70%
38%
31%
21%
18%
11%
10%
9%
6%
0 20 40 60 80 100
Human Resources
Risk Management
Information Technology
Tax
Sales and Marketing
Treasury
Legal
Operations
Strategic Planning
Finance/Accounting
Note: Percentage is of total population – 175 all Companies
CDO – Functional Skills

7Confidential
private equity groups (PEGs)

8Confidential
Private Equity Groups
PEGs represent a large and growing source of capital (funds raised 2001-2004):
1.51.8
2.4
3.6
0.6 0.7 0.71
0
0.5
1
1.5
2
2.5
3
3.5
4
2001 2002 2003 2004
Buyout
Mezzanine
Source: Thomson Macdonald

9Confidential
Private Equity Groups (cont’d)
PEG funds were invested in a diverse set of transaction types:
MBO 29%
Acquisitions 22%Refinancing 16%Other 1%
Restructuring16%
Expansion 17%
Source: Thomson Macdonald

10Confidential
Private Equity Groups (cont’d)
The growth in private equity groups also masks some important underlying changes: Buy out pools now represent nearly half of the private equity universe
Private-independent fund managers gain importance:— Account for close to 40% of capital under management— Gaining share as they draw commitments from institutional investors and reorganize
from corporate funds

11Confidential
Private Equity Groups (cont’d)
These fund managers generally have a diverse background (investment banking, legal and operational) and have a strong understanding of return/risk
Vendors may prefer to deal with PEGs:—Not a competitor and therefore less concerns with confidentiality—Clear financial metrics—May have greater structuring flexibility (e.g., vendor retains a minority stake)
12Confidential
income trusts

13Confidential
Income Trusts
57 64
98
134
165
233 240
$0
$50
$100
$150
$200
$250
$300
2000 2001 2002 2003 2004 2005 2006
0
50
100
150
200
250
300Market Capitalization
Number of Trusts
Ma
rke
t Ca
pita
liza
tion
(C$
bill
ion
s)
Nu
mb
er o
f Tru
sts
Source: Scotia Capital

14Confidential
Income Trusts (cont’d) – Total Issuance
Source: Scotia Capital

15Confidential
Income Trusts (cont’d) – IPO Size Distribution (2001-2006 YTD)
10
32
23
18
12
57
0
5
10
15
20
25
30
35
<$50 $50-$100 $100-$150 $150-$200 $200-$250 $250-$300 >$300
Nu
mb
er
of D
ea
ls
Average: $148.6
Offering Size (C$ Millions)

16Confidential
Income Trusts (cont’d) – Leverage and Yield
2325
36
6
16
0
5
10
15
20
25
30
35
40
<1.0x 1.0x - 1.5x 1.5x - 2.0x 2.0x - 2.5x >2.5x
Num
ber
of IP
O's
Average: $1.6x
IPO Leverage Income Trust IPO Yield
1
1013
22
28
21
75
0
5
10
15
20
25
30
35
40
<8.00% 8.00% -9.00%
9.00% -10.00%
10.00% -11.00%
11.00% -12.00%
12.00%-13.00%
13.00%-14.00%
> 14.00%N
um
be
r o
f IP
O's
Average: 11.00%
Source: Scotia Capital

17Confidential
Income Trusts (cont’d) – Retained Interest (2001-2006 YTD)
23
10
22
1113
10
17
0
5
10
15
20
25
<10% 10% - 20% 20% - 30% 30% - 40% 40% - 50% 50% - 60% >60%
Num
ber
of D
eals
Average: 32%
Source: Scotia Capital
18Confidential
implications for transactions

19Confidential
Implications for transactions
There is a robust market for Canadian companies: Significant interest from strategic purchasers, both within Canada and
internationally
Broad availability of capital:— Private market through PEGs— Public market, where Income Trusts provide attractive valuations

20Confidential
Implications for transactions (cont’d)
A recent Ernst & Young survey on mid-market companies revealed some interesting insight:
—Of companies which used an advisor, 37% were sold to purchasers outside Canada
—21% of vendors were acquired by a financial buyer.

21Confidential
Financing in Today’s M&A Market

22Confidential
Overview: State of the Capital Markets
As the economy firms and absolute interest rates remain relatively low, lenders and investors are becoming increasingly more comfortable with higher leverage levels

23Confidential
Overview: Leverage Has Increased in the Market
Source: S&P/Loan Pricing Corporation
5.3x 4.5
x 4.1x 3.7
x3.8x
4.0x
4.4x

24Confidential
Overview: Leverage Has Increased in the Market (cont’d)
Source: Bank of America/S&P/Loan Pricing Corporation
Includes 2nd lien debt which pushes up senior leverage

25Confidential
3.5
4
4.5
5
5.5
6
6.5M
ax. d
ebt t
o EBI
TDA
1997 1998 1999 2000 2001 2002 2003 2004 2005
Sponsored LBO
Overview: Leverage Has Increased in the Market (cont’d)
Source: Reuters Loan Pricing Corporation/Deal Scan
The oversupply of funds also resulted in lenders relaxing covenant levels
In particular, average debt to EBITDA covenants for LBO financings increased dramatically in 2005

26Confidential
Availability of Non-Traditional Financing
Target Return% p.a.
Risk
5 10 15 20 25 30 35
EQUITY
SUB DEBT
SCLs / High yield
notes
ABLs
Bank / Senior Notes
There has been an ongoing shift away from traditional bank structures to multi-tiered structures

27Confidential
Availability of Non-Traditional Financing (cont’d)
COMPANY SIZE:
Very Small Small Mid-Size Large
Typically has limited resources and no track record.
Possibly has high growth potential, but often with limited track record.
Typically has proven track record and continued growth potential. Substantial assets/stock available for collateral.
Known track record and risk. Strong financial flexibility.
LOW
HIGH
Ris
k
Commercial Paper
Private Placement Senior Notes and Senior Unsecured Debt
Asset Monetization
Senior Secured Debt
Subordinated Debt
High Yield Notes
Private Equity Public Equity
Second Lien Notes

28Confidential
Second Lien Loans Second lien and high yield markets continue to gain momentum
Second liens loans require on average 300 to 400 bps spread premium over traditional senior debt
Source: S&P/Loan Pricing Corporation

29Confidential
Second Lien Loans (cont’d) Often called “Secured Senior Notes” or “Second Lien Secured Notes,” they are similar to
other high yield bonds – except they are secured Second Lien Debt or Second Collateral Loans (SCL) are often viewed as a substitution for
more expensive private or public mezzanine debt Second lien lenders generally offer terms and pricing that are more flexible than an unsecured
mezzanine provider
Second lien loans carry less onerous prepayment penalties
Terms on the second lien loans are shorter than traditional mezzanine debt at 3 to 5 years, however the loans can be structured with a longer tenor
In a cash-flow based second lien loan, the amount of the loan is determined by using an EBITDA multiple, whereas the amount of asset based second lien loans are based on appraisal valuations
The second lien loan is behind the senior debt for repayment priority with respect to collateral proceeds, but ranks ahead of other unsecured senior debt such as trade payables

30Confidential
Second Lien Loans (cont’d)
Second lien loans can be more attractive than subordinated or mezzanine debt because often pricing does not require warrants thus the issuer may avoid giving up equity
Prepayments are also more flexible than mezzanine or high yield debt
Second lien debt can often achieve similar leverage to that of mezzanine debt
In general, pricing for subordinated debt has decreased significantly as a result of increased competition and as second lien debt gains greater market acceptance Second lien loans require a return of approximately 10% to 15%

31Confidential
M&Aimplications

32Confidential
Average Debt/EBITDA Ratio for Transactions with Second Lien Loans
Source: S&P/Leveraged Commentary & Data
4.2x
4.2x
5.1x

33Confidential
…and an Increase in Purchase Price Multiples
Source: S&P/Loan Pricing Corporation
7.8x
8.0x 7.4
x 6.1x
6.0x
6.4x
7.0x
7.4x
7.3x
7.1x
7.2x
6.8x
6.9x 5.4
x
6.4x
6.9x
7.2x
8.0x

34Confidential
summary

35Confidential
Financing Summary
Capital market conditions have improved dramatically over the last year and there is substantial liquidity in the market
There is a great deal of institutional money chasing very few quality opportunities
Accordingly, debt leverage has increased in all markets and pricing has declined
Mezzanine providers are being squeezed by both the Second Lien Loan (Junior Secured) and High Yield Debt markets
Second lien loans have provided access to high ratio/leveraged finance without typical equity dilution, filling the gap between senior and mezzanine debt and allowing purchase multiples to increase
36Confidential
© 2005 Ernst & Young Orenda Corporate Finance Inc.
A Member of Ernst & Young Global
ERNST & YOUNG ORENDA CORPORATE FINANCE INC.
eyorenda.com

Tickets now on sale for the CFO of the Year Gala
May 4th, 2006 (Fairmont Royal York)
Presented by


