1
Continuous Process Verification – Risk Based Monitoring
Sanjay Sharma.Sr. General Manager & Head Technology Transfer
2
• Variations and Process Robustness
• Risk Based Approach in Improving Process Robustness
• Process Analytical Technology in Manufacturing
Agenda

3
• Variations and Process Robustness
– Understand sources of variation
– Robustness Evaluation – Detect presence & degree of variation
– Understand Impact of variation on product quality
– Control variation
• Risk Based Approach in Improving Process Robustness
• Process Analytical Technology in Manufacturing
Agenda

4
Types of Variation
• Every process has variation. The sources of process variation can be divided into two categories: Natural or Common cause Unnatural or Special cause
Continuous Improvement
Variation
Process
Common cause of variation(natural or expected variation)
Special cause of variation(unexpected variation )
Common Causes are those that are inherent to the process and generally are not controllable by process operators
Special Causes of variation include unusual events that the operator, when properly alerted, can usually remove or adjust.
Baking a loaf of bread
The oven's thermostat allows the temperature to drift up and down slightly.
Changing the oven's temperature or opening the oven door during baking can cause the temperature to fluctuate needlessly.

5
Sources of Variation
6
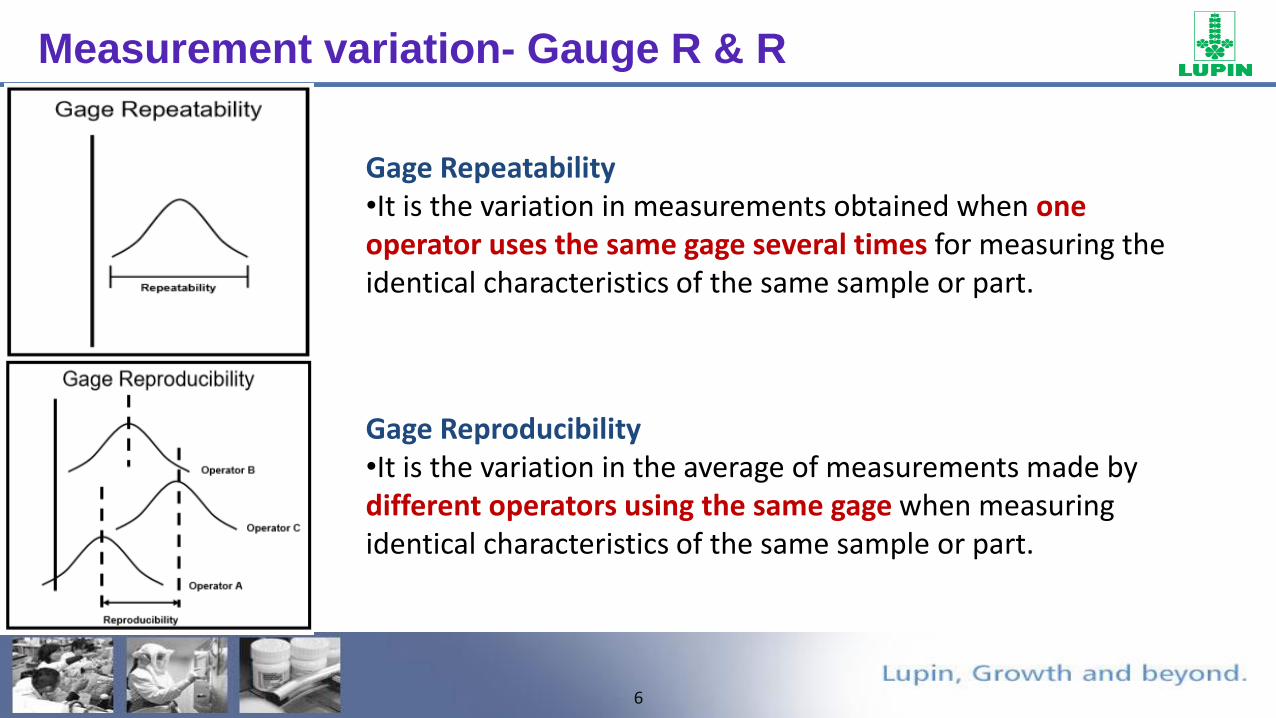
Measurement variation- Gauge R & R
Gage Repeatability•It is the variation in measurements obtained when one operator uses the same gage several times for measuring the identical characteristics of the same sample or part.
Gage Reproducibility•It is the variation in the average of measurements made by different operators using the same gage when measuring identical characteristics of the same sample or part.

7
What is a gage R&R study?
•A gage R&R study helps you investigate: Whether your measurement system variability is small compared with the process variability.
•How much variability in the measurement system is caused by differences between Analysts/operator.
•Whether your measurement system is capable of discriminating between different parts.
For example, several operators measure the thickness of tablets to ensure that they meet specifications. A gage R&R study indicates whether the inspectors are consistent in their measurements of the same part (repeatability) and whether the variation between inspectors is consistent (reproducibility).
Measurement variation- Gauge R & R

8
History of Control Charts
The control chart was invented by Walter Andrew Shewhart (Father of Statistical Quality Control) while working for Bell Labs in 1920s.
Control charts also known as Shewhart charts or process behavior charts.
Process/Product variation- Control Charts

9
Process/Product variation- Control Charts
Components-- Set of data (CQA, CMA, CPP)- A central line (mean) - CL- Two statistical process control limits (UCL &
LCL) : whether process is stable?- Upper & Lower specification limit (USL & LSL) :
whether process is capable?
Control Chart- It’s a graphical display of a product quality characteristic that has been measured or computed periodically from a process at a defined frequency.

10
Process/Product variation- Control Charts
Potential Applications-- To proactively monitor and trend a process- To detect the presence of special cause
variation- To identify continual improvement
opportunities- To maintain the process in the state of
statistical control
Control Chart- It’s a graphical display of a product quality characteristic that has been measured or computed periodically from a process at a defined frequency.

11
Process/Product variation- Control Charts
Types of Control charts:
Variable Control chart- Characteristics which can be measured (continuous numeric values) e.g- Assay, UOD, etc- The average and variability chart are usually prepared & analyzed in pairs
Average – Range chart (Xbar- R chart, subgroup size 2 – 10) Average – Standard Deviation chart (Xbar- S chart, subgroup size >10) Individual Moving Range chart (I-MR chart, n=1)
Attribute Control chart- Characteristics that have discrete values and can be counted, e.g- %defect tabs, #of failed batches/M, etc- P-chart, np chart, U-chart, C-chart belongs to this category
12
Process/Product variation- Control Charts
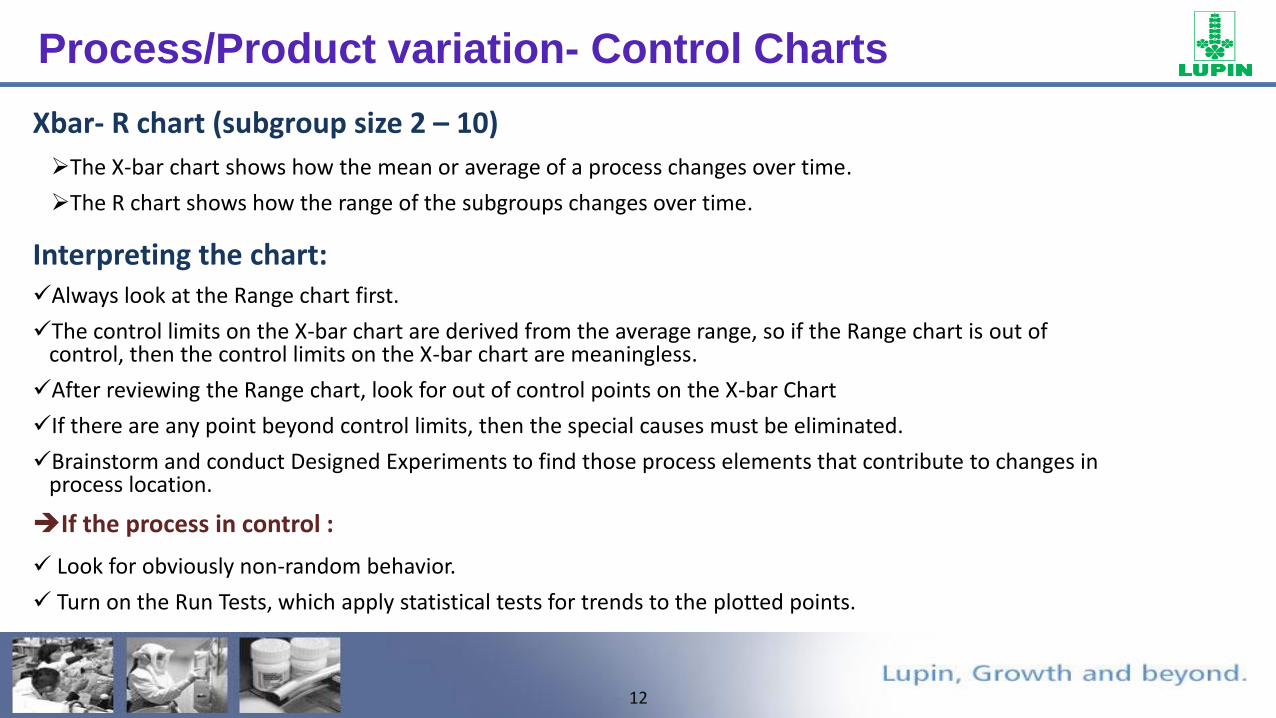
Xbar- R chart (subgroup size 2 – 10)
The X-bar chart shows how the mean or average of a process changes over time.
The R chart shows how the range of the subgroups changes over time.
Interpreting the chart:Always look at the Range chart first.
The control limits on the X-bar chart are derived from the average range, so if the Range chart is out of control, then the control limits on the X-bar chart are meaningless.
After reviewing the Range chart, look for out of control points on the X-bar Chart
If there are any point beyond control limits, then the special causes must be eliminated.
Brainstorm and conduct Designed Experiments to find those process elements that contribute to changes in process location.
If the process in control :
Look for obviously non-random behavior.
Turn on the Run Tests, which apply statistical tests for trends to the plotted points.

13
Process/Product variation- Control Charts
Xbar- R chart (subgroup size 2 – 10)

14
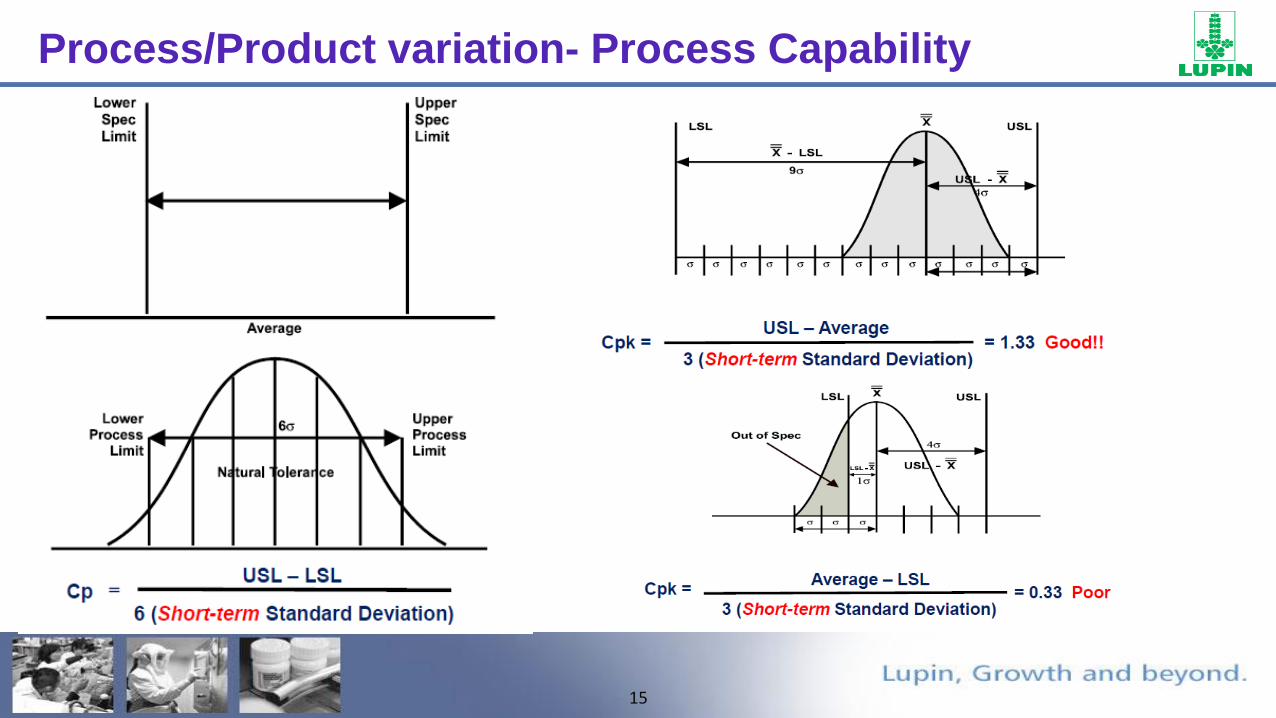
• Process capability is the ability of the process to meet the design specifications for a service or product.
• Nominal value is a target for design specifications.
• Tolerance is an allowance above or below the nominal value.
Process/Product variation- Process Capability
Centering –The Process Is On Target
Spread – Reduce The Variation
LSL USL
DefectsDefects
15
Process/Product variation- Process Capability
16
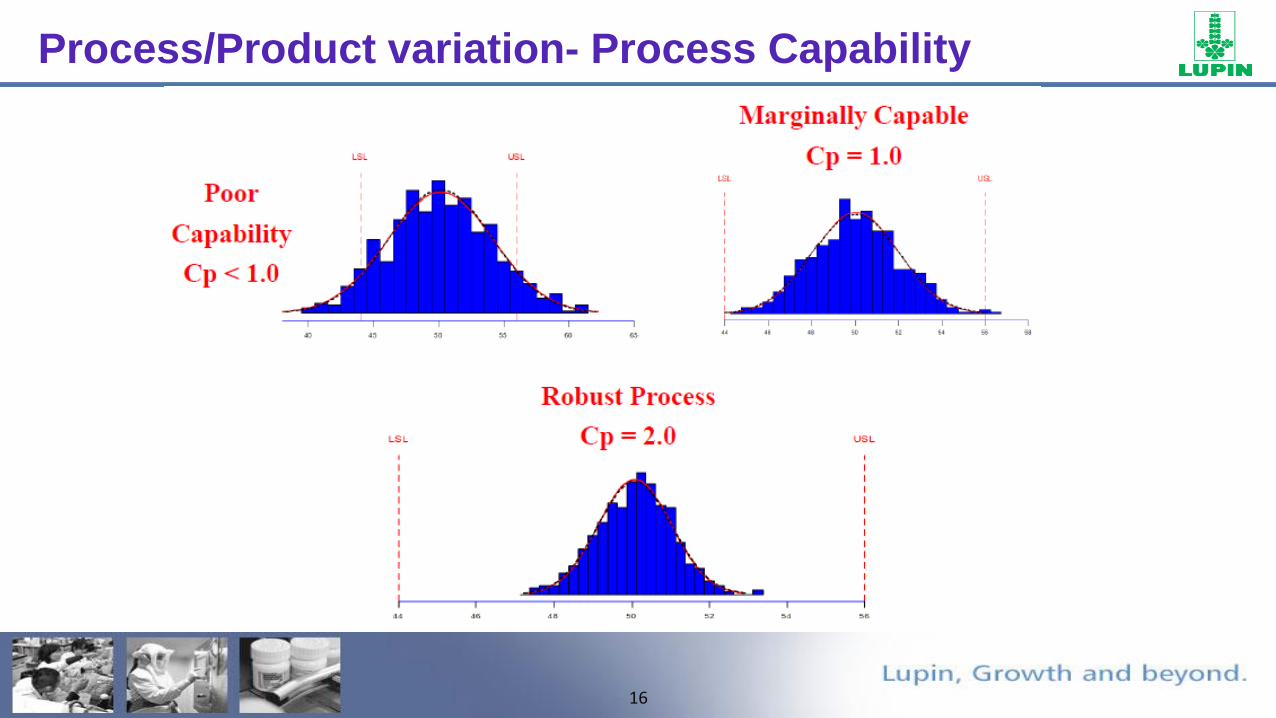
Process/Product variation- Process Capability
17
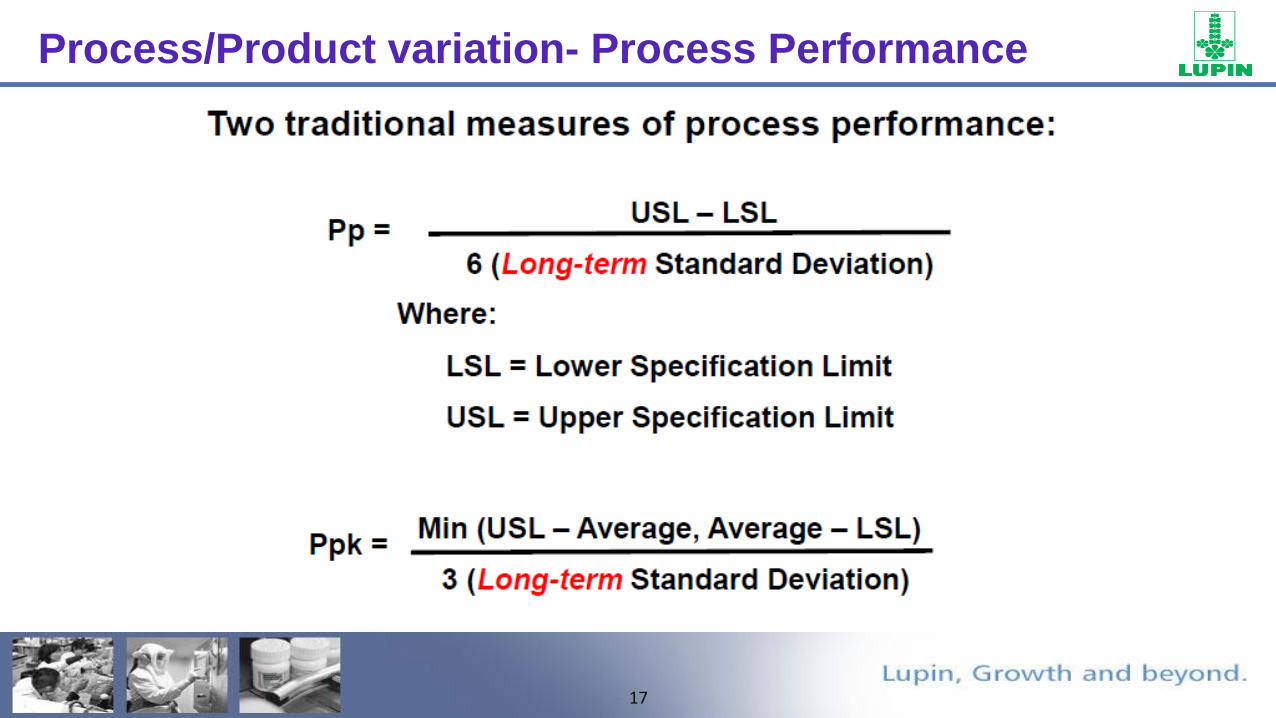
Process/Product variation- Process Performance

18
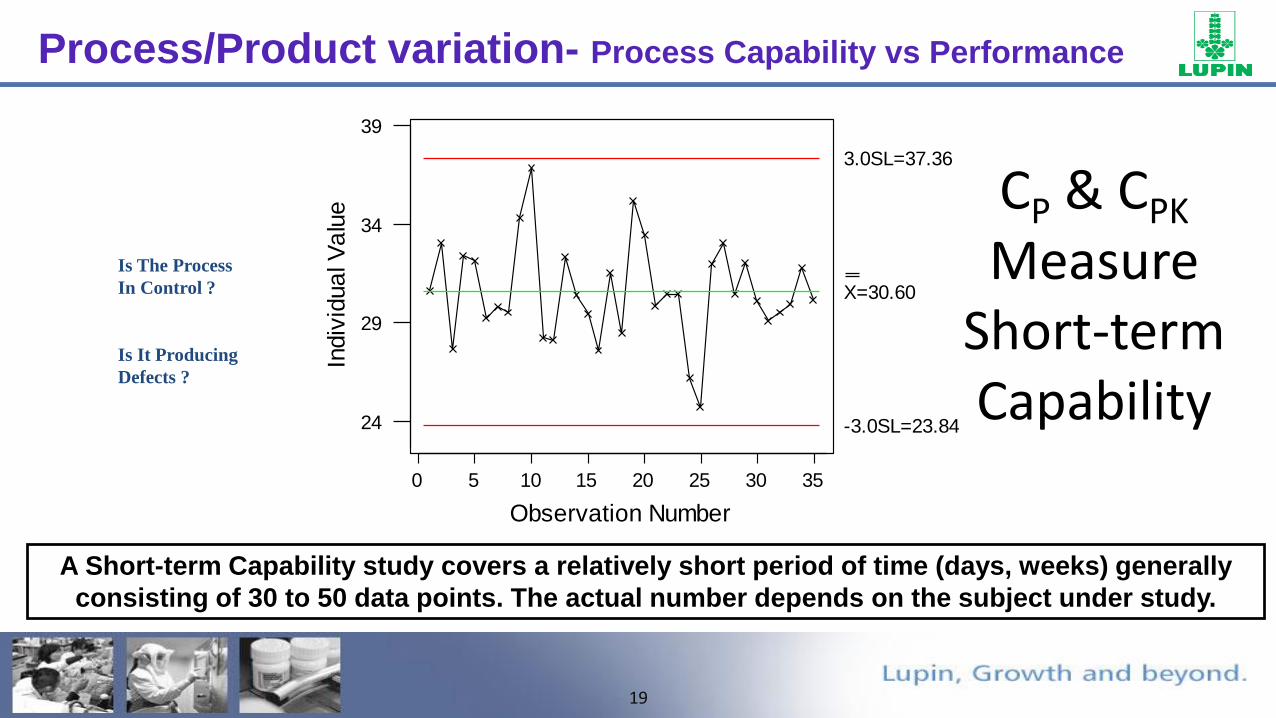
Process/Product variation- Process Capability vs Performance
•Process Capability is the variation the process would exhibit if only common cause variation were present:
•Process Performance is the total variation experienced by the customer; includes common cause, and special cause variation:
19
A Short-term Capability study covers a relatively short period of time (days, weeks) generally
consisting of 30 to 50 data points. The actual number depends on the subject under study.
Is The Process
In Control ?
Is It Producing
Defects ?
35302520151050
39
34
29
24
Observation Number
Indiv
idua
l V
alu
e
I Chart for C1
X=30.60
3.0SL=37.36
-3.0SL=23.84
CP & CPK
Measure Short-term Capability
Process/Product variation- Process Capability vs Performance

20
A long-term capability study covers a relatively long period of time (weeks, months) generally
consisting of 100-200 data points. Again, the actual amount depends on the subject under study.
Is The Process
In Control ?
Is It Producing
Defects ?
100500
50
40
30
20
Observation Number
Indiv
idua
l V
alu
e
I Chart for C3
X=33.80
3.0SL=47.12
-3.0SL=20.49
Short term Capability
PP & PPK
Measure Short-term Capability
Process/Product variation- Process Capability vs Performance
21
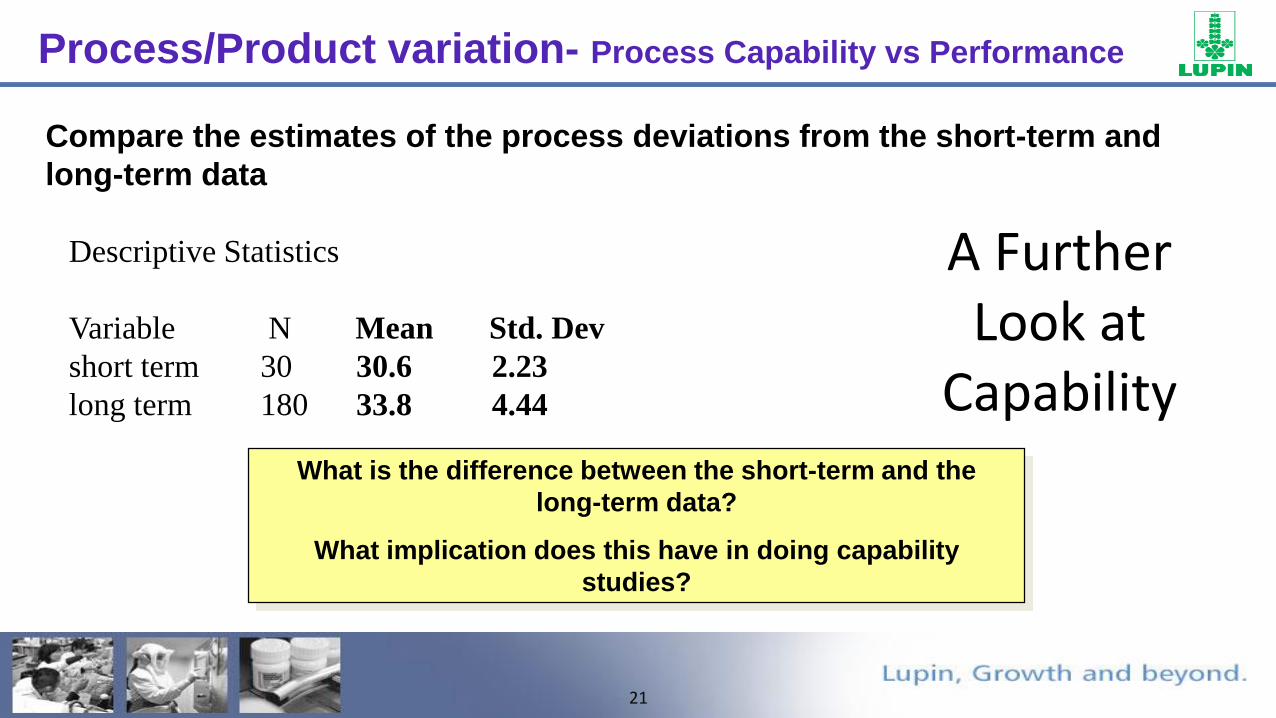
A Further Look at
Capability
Compare the estimates of the process deviations from the short-term and
long-term data
What is the difference between the short-term and the
long-term data?
What implication does this have in doing capability
studies?
Descriptive Statistics
Variable N Mean Std. Dev
short term 30 30.6 2.23
long term 180 33.8 4.44
Process/Product variation- Process Capability vs Performance
22
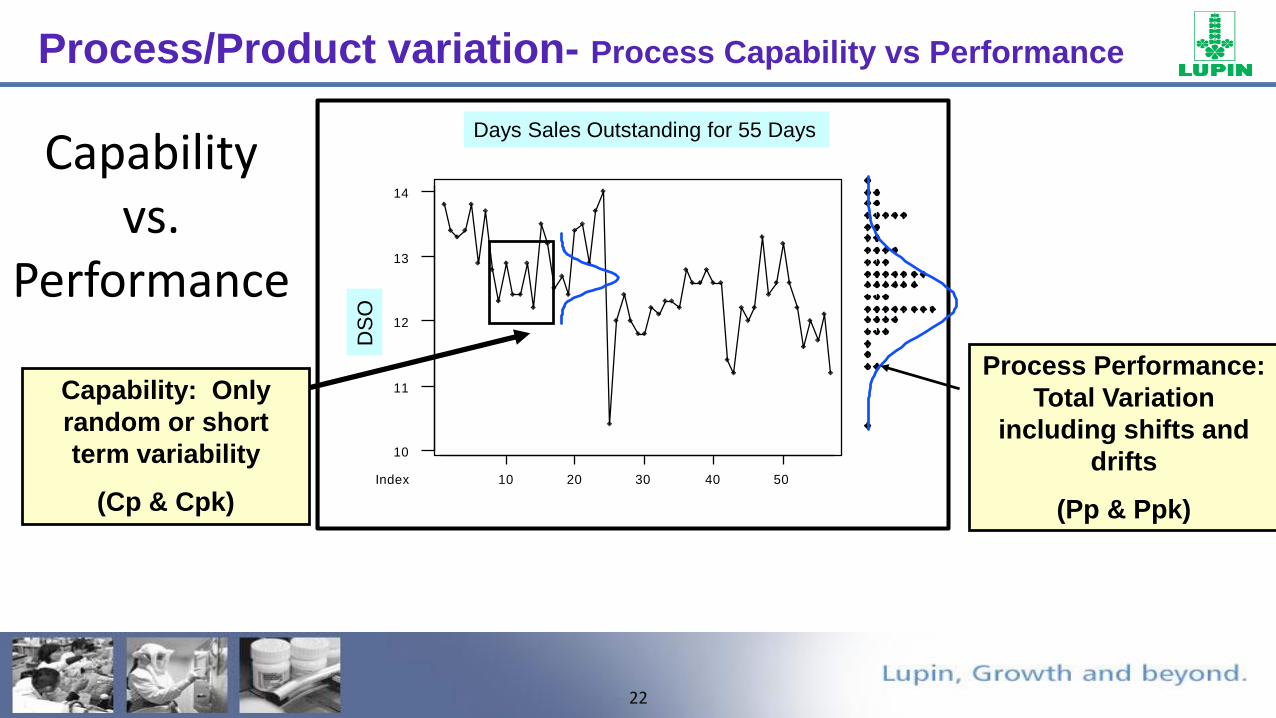
Capability vs.
Performance
5040302010
14
13
12
11
10
Index
CO
2-S
hrt
CO2 Levels for 55 Time PointsDays Sales Outstanding for 55 Days
DS
OProcess Performance:
Total Variation
including shifts and
drifts
(Pp & Ppk)
Capability: Only
random or short
term variability
(Cp & Cpk)
Process/Product variation- Process Capability vs Performance

23
Process/Product variation- Process Performance
An unstable process is characterized by change. Each time a set of samples is selected and histogram drawn, the average has shifted. The variation may also change. The process is unpredictable and difficult to control.
A stable process on the other hand, is one characterized by a lack of change hour after hour looks the same. It is not that all variation has been eliminated. The variation consistently falls within certain well-defined limits.
24
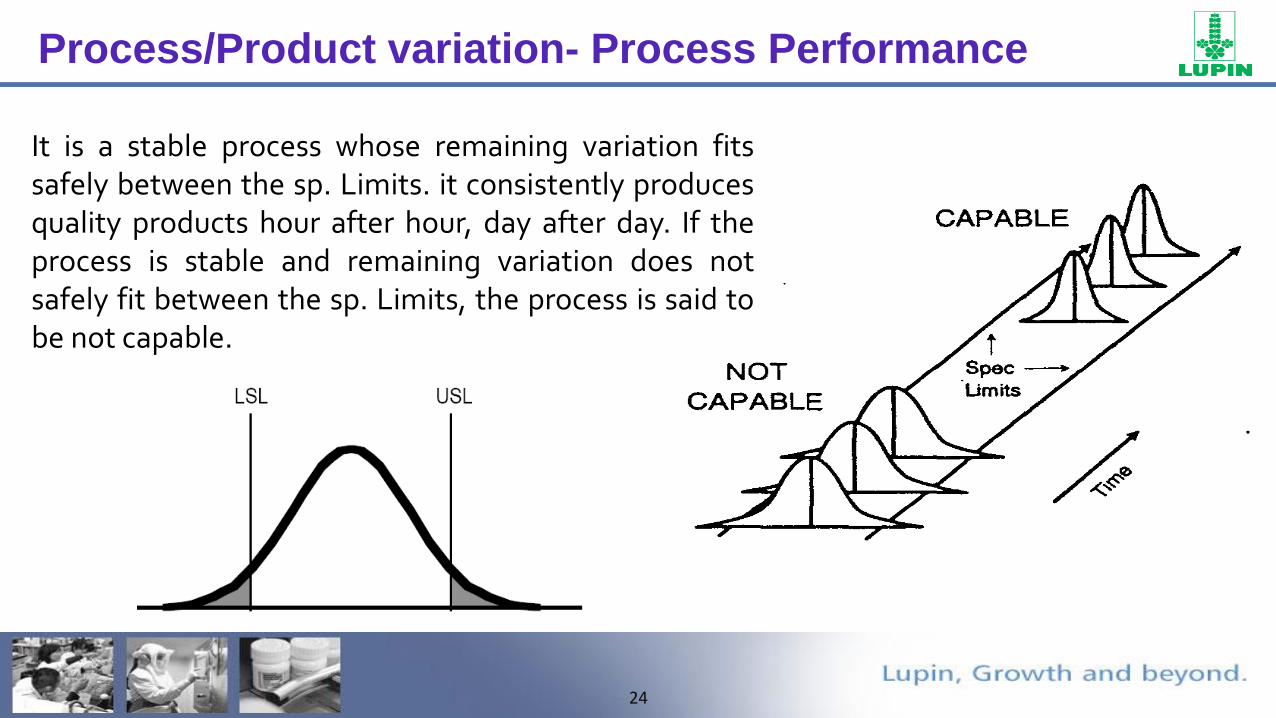
Process/Product variation- Process Performance
It is a stable process whose remaining variation fitssafely between the sp. Limits. it consistently producesquality products hour after hour, day after day. If theprocess is stable and remaining variation does notsafely fit between the sp. Limits, the process is said tobe not capable.
25
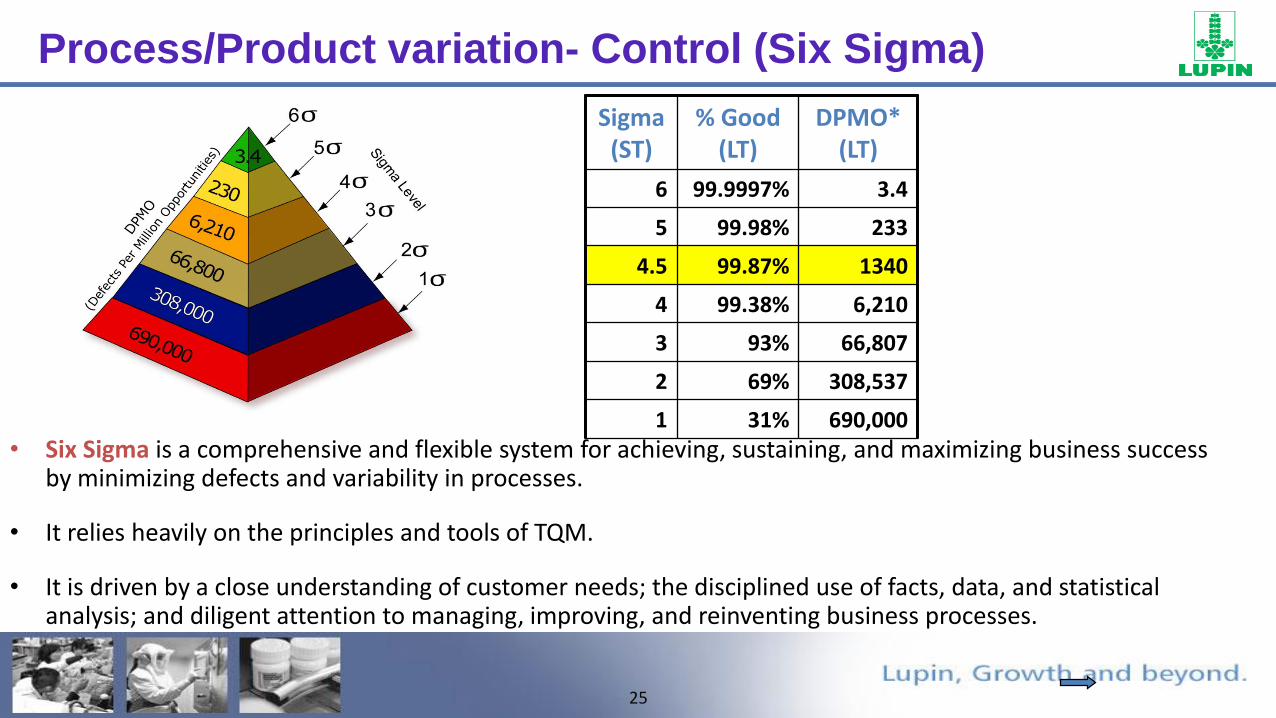
• Six Sigma is a comprehensive and flexible system for achieving, sustaining, and maximizing business success by minimizing defects and variability in processes.
• It relies heavily on the principles and tools of TQM.
• It is driven by a close understanding of customer needs; the disciplined use of facts, data, and statistical analysis; and diligent attention to managing, improving, and reinventing business processes.
Sigma (ST)
% Good (LT)
DPMO* (LT)
6 99.9997% 3.4
5 99.98% 233
4.5 99.87% 1340
4 99.38% 6,210
3 93% 66,807
2 69% 308,537
1 31% 690,000
Process/Product variation- Control (Six Sigma)
26
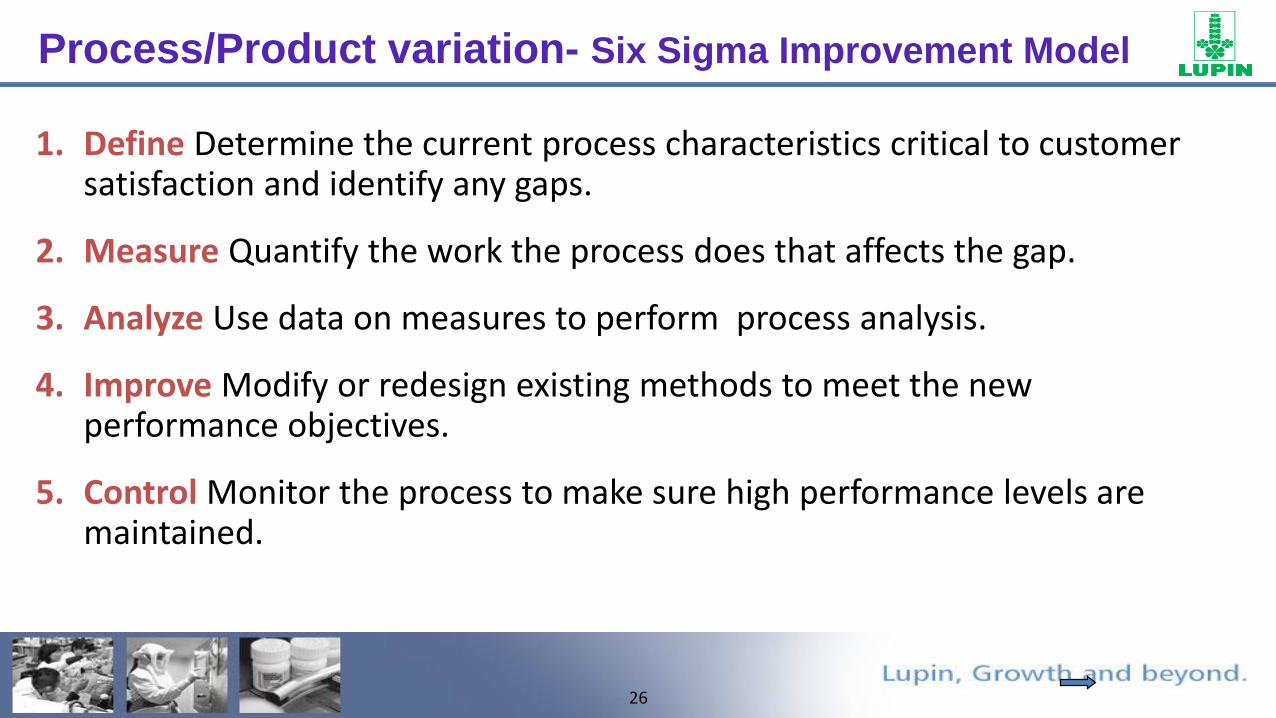
1. Define Determine the current process characteristics critical to customer satisfaction and identify any gaps.
2. Measure Quantify the work the process does that affects the gap.
3. Analyze Use data on measures to perform process analysis.
4. Improve Modify or redesign existing methods to meet the new performance objectives.
5. Control Monitor the process to make sure high performance levels are maintained.
Process/Product variation- Six Sigma Improvement Model

27
Use SPC to Maintain Current
Process
Collect & Interpret Data
Select Measures
Define Process
IsProcessCapable
?
Improve Process
Capability
IsProcessStable
?
Investigate & Fix Special
Causes
No
Yes
No
Yes
Is Process Capable?
Purpose: Determine the adequacy of the process with respect to customer /management needs.
Process/Product variation- Six Sigma Improvement Model

28
Effects of reducing variability on Process capability
Lowerspecification
Mean
Upperspecification
Nominal valueSix sigma
Four sigma
Two sigma
Process/Product variation- Six Sigma Improvement Model

29
• Variations and Process Robustness
• Risk Based Approach in Improving Process Robustness
– Update of FDA’s draft guidance on submission of Quality metrics data – Nov’16
– Establish criticality in product life cycle , Creation of CTQ document
– Product score card & use of quality trending in assisting continual improvement
– Quality Risk management
– Process for applying science & Risk based approach to an existing product (Legacy Products)
• Process Analytical Technology in Manufacturing
Agenda

30
Quality Metrics that FDA Intends to Calculate
• Lot Acceptance rate (LAR)– Indicator of manufacturing process performance
• Product Quality compliance rate(PQCR) – Indicator of Patient / customer feedback
• Invalidated Out of Specification (OOS) rate(IOOSR) – Indicator of Laboratory operations
• Annual Product Review (APR) or Product Quality Review (PQR) on Time rate – removed from the revised draft version
FDA intends to calculate the following quality metrics for each product and establishment, where applicable:

31
No. of Accepted Lots in a timeframeLAR = --------------------------------------------------------------------------------
No. of Lots started by the same firm in the same timeframe
e.g. There are 97 lots accepted out of 100 lots per Annum, then The Lot Acceptance rate would be
97 / 100 = 0.97.
Lot Acceptance Rate (LAR)

32
Product Quality Compliance Rate (PQCR)
Product Quality Complaint Rate = the number of product quality complaints received for the product divided by the total number of dosage units distributed in the current reporting timeframe
e.g. There are 5 lots having product complaints out of 100 dosage units distributed for the same product per Annum, then the Product Quality Compliance rate would be
5 / 100 = 0.05.
33
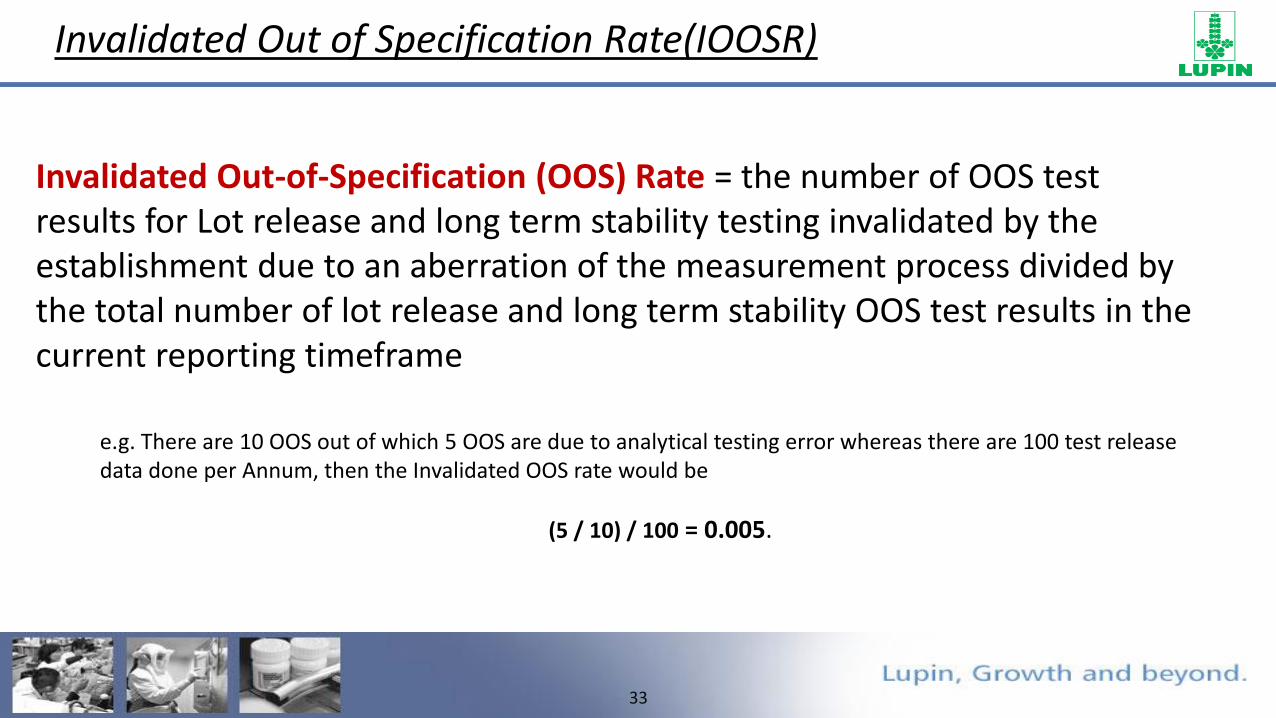
Invalidated Out of Specification Rate(IOOSR)
Invalidated Out-of-Specification (OOS) Rate = the number of OOS test results for Lot release and long term stability testing invalidated by the establishment due to an aberration of the measurement process divided by the total number of lot release and long term stability OOS test results in the current reporting timeframe
e.g. There are 10 OOS out of which 5 OOS are due to analytical testing error whereas there are 100 test release data done per Annum, then the Invalidated OOS rate would be
(5 / 10) / 100 = 0.005.
34
How to Report Quality Data to FDA
• Quality Metrics data to be submitted Annually (data segregated in the report on a quarterly basis)
• FDA expects to begin the data analysis when the portal is closed and then publish initial findings and the quality metric reporters list on the FDA Web site
35
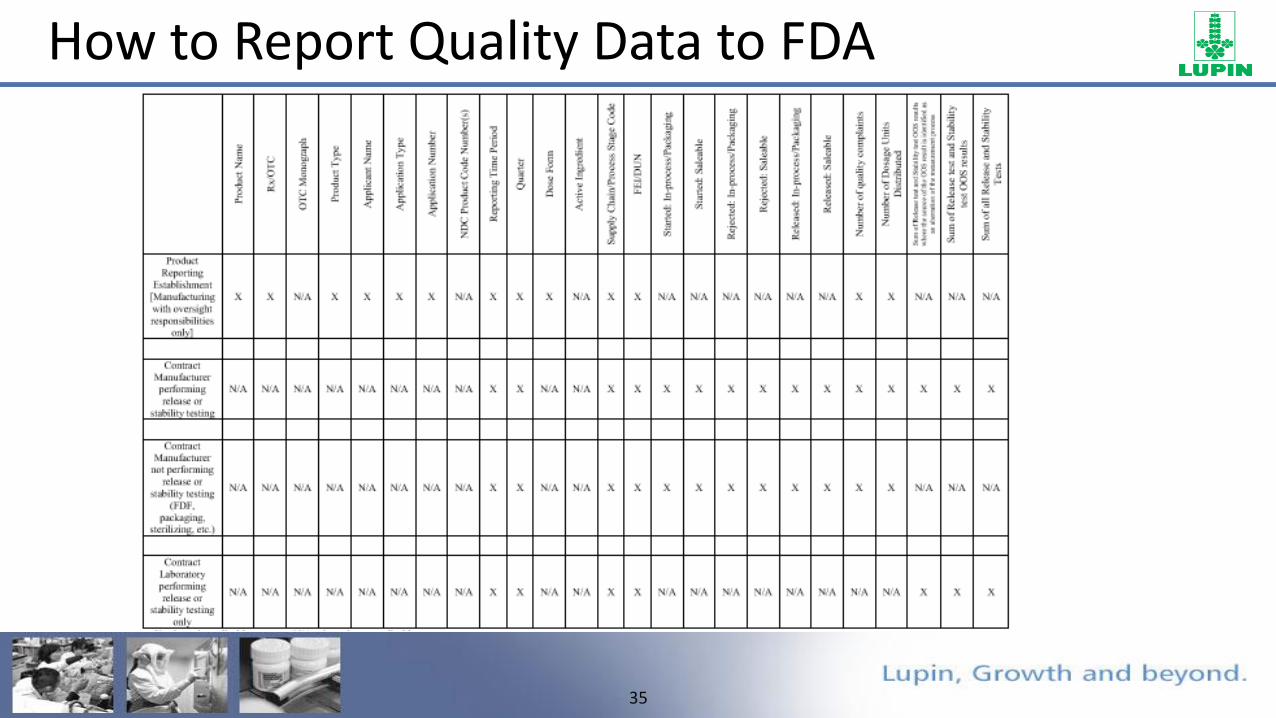
How to Report Quality Data to FDA

36
How FDA intends to use Quality Metrics
FDA intends to use data from the quality metrics reporting program to focus the use of FDA resources on the areas of highest risk to public health (e.g., risk-based inspection scheduling). Specifically,
• establish a signal detection program as one factor in identifying establishments and products that may pose significant risk to consumers;
• identify situations in which there may be a risk for drug supply disruption; • improve the effectiveness of establishment inspections; and • improve FDA’s evaluation of drug manufacturing and control operations.

37
Flow for the Critical to Quality (CTQ) template
List of CQA’s
• Provides a list of Critical Quality Attributes along with the type and criticality level for the attributes for both Finished Product and Intermediates
Impact of CPP/CMA on CQA
•Evaluates impact of CMA of API on CQAs (High/Medium/Low)
•Evaluates impact of CPP of both Intermediates and Finished Product on CQAs (High/Medium/Low)
Deep dive of impact of
CMA on CQA & CS
•Provides justification for criticality of CMA for CQA
CPP & Control Strategy
•Evaluates in detail impact of CPPs and their control strategy value
38
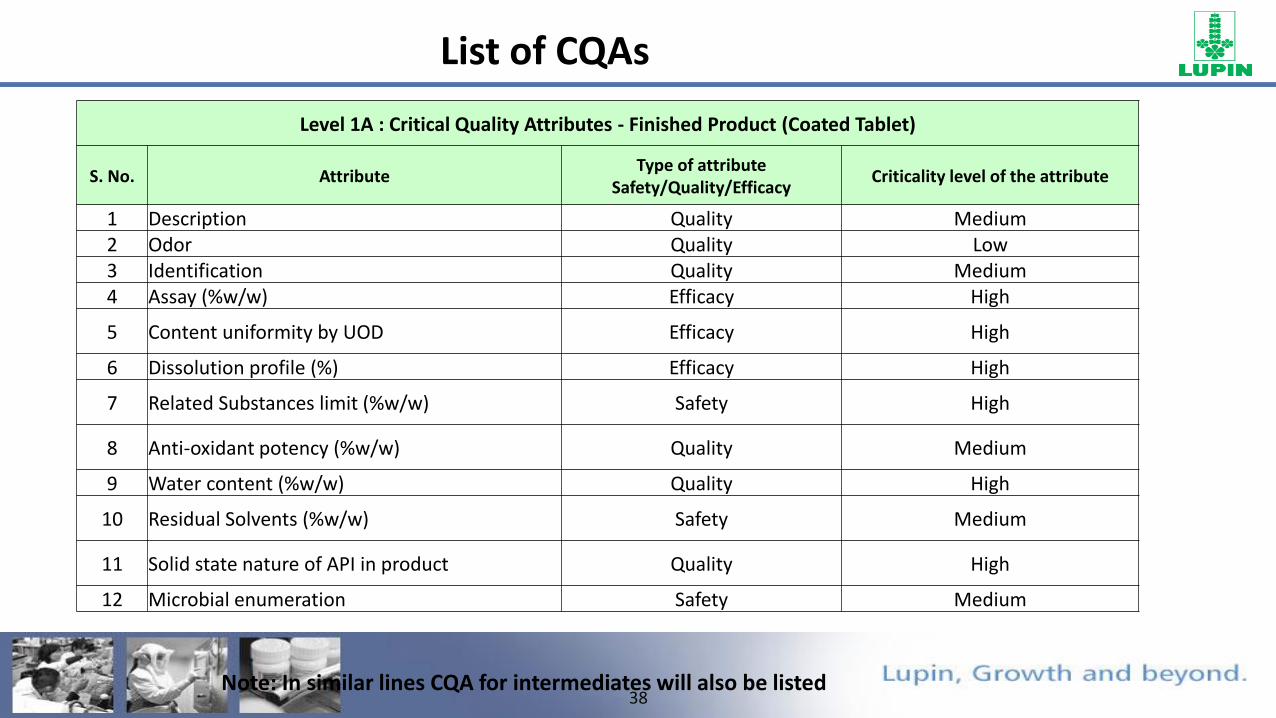
List of CQAs
Level 1A : Critical Quality Attributes - Finished Product (Coated Tablet)
S. No. AttributeType of attribute
Safety/Quality/EfficacyCriticality level of the attribute
1 Description Quality Medium2 Odor Quality Low3 Identification Quality Medium4 Assay (%w/w) Efficacy High
5 Content uniformity by UOD Efficacy High
6 Dissolution profile (%) Efficacy High
7 Related Substances limit (%w/w) Safety High
8 Anti-oxidant potency (%w/w) Quality Medium
9 Water content (%w/w) Quality High
10 Residual Solvents (%w/w) Safety Medium
11 Solid state nature of API in product Quality High
12 Microbial enumeration Safety Medium
Note: In similar lines CQA for intermediates will also be listed
39
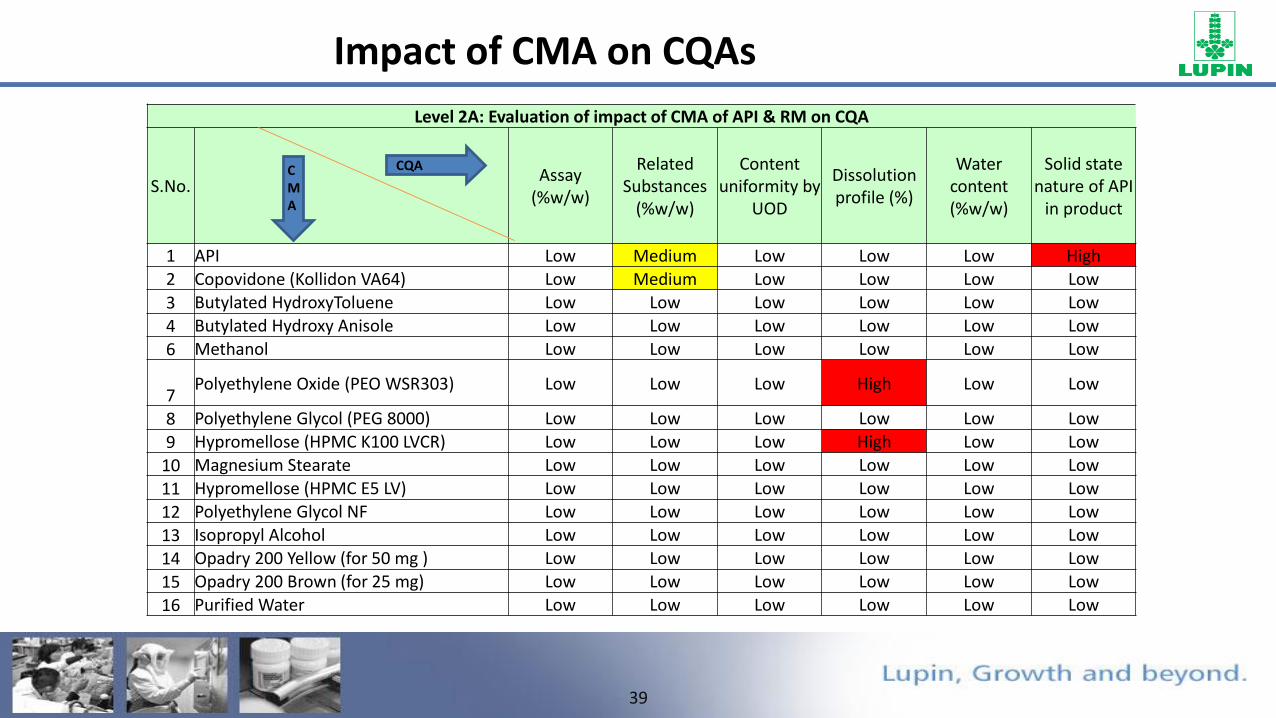
Impact of CMA on CQAs
Level 2A: Evaluation of impact of CMA of API & RM on CQA
S.No.Assay
(%w/w)
Related Substances
(%w/w)
Content uniformity by
UOD
Dissolution profile (%)
Water content (%w/w)
Solid state nature of API
in product
1 API Low Medium Low Low Low High2 Copovidone (Kollidon VA64) Low Medium Low Low Low Low
3 Butylated HydroxyToluene Low Low Low Low Low Low
4 Butylated Hydroxy Anisole Low Low Low Low Low Low
6 Methanol Low Low Low Low Low Low
7Polyethylene Oxide (PEO WSR303) Low Low Low High Low Low
8 Polyethylene Glycol (PEG 8000) Low Low Low Low Low Low
9 Hypromellose (HPMC K100 LVCR) Low Low Low High Low Low
10 Magnesium Stearate Low Low Low Low Low Low
11 Hypromellose (HPMC E5 LV) Low Low Low Low Low Low
12 Polyethylene Glycol NF Low Low Low Low Low Low
13 Isopropyl Alcohol Low Low Low Low Low Low
14 Opadry 200 Yellow (for 50 mg ) Low Low Low Low Low Low
15 Opadry 200 Brown (for 25 mg) Low Low Low Low Low Low
16 Purified Water Low Low Low Low Low Low
CQACMA

40
Impact of CPP on CQAsLevel 2B: Evaluation of impact of CPP on CQA
Finished Product CQA
S.No.Assay
(%w/w)
Related Substances
(%w/w)
Content uniformity
by UOD
Dissolution profile (%)
Water content (%w/w)
Solid state nature of
API in product
1 Sifting Low Low Low Low Low Low
2 Drug-binder solution preparation Low Low Low Low Low Low
3 Dry mixing Low Low Low Low Low Low4 Fluid bed granulation Low Low Low High Low High6 Granules drying Low Low Low Low Low Low7 Milling Low Low Low Low Low Low8 Blending (Pre-lubrication) Low Low Low Low Low Low9 Blending (Lubrication) Low Low Low Low Low Low
10 Compression Low Low Medium High Low Low
11Seal & Film Coating solution preparation
Low Low Low Low Low Low
12 Seal coating Low Low Low Low Low Medium13 Film coating Low Low Low Low Low High14 Seal & Film coating drying Low Low Low Low Low Low
CPP
CQA

41
Deep dive of impact of CMA on CQA & CSLevel 2A: Evaluation of impact of CMA on CQA
S.No.Specificat
ionAssay
(%w/w)
Related Substances (%w/w)
Content
uniformity by
UOD
Dissolution
profile (%)
Water content (%w/w)
Solid state
nature of API in
product
Justification for criticality (only for High/Medium)
1Water content (API)
NMT 4.0% w/w
Low Medium Low Low Low High
(I) API is hygroscopic in nature and is prone to hydrolytic degradtion as evident from the API forced degradation study and this may impact the related substance of the product. Hence the risk is rated as Medium.
(II) Impact of water content of active on retaining the input polymorphic form of API is considered as high, because API is hygroscopic in nature and polymorphic conversion may take place due to change in the water content of API. However API water content will be controlled through API specification. Hence the risk is High.
2
Limit of Peroxides (Copovidone)
NMT 0.40% w/w
Low Medium Low Low Low Low
The drug substance is prone to oxidation. Peroxide content may trigger oxidation of drug substance which expedite the impurity generation due to oxidation. The impurities likely have to impact on safety of product. Hence, the risk is medium.
3
Viscosity (HPMC K100 LVCR)
NLT 80 & NMT 120
mPas
Low Low Low High Low Low
The viscosity hypromellose depends on polymer parameters like molecular weight, hydrophilicy etc. Drug release through polymer matrix is inversely proportional to viscosity of hypromellose. The viscosity of selected grade of polymer is 80-120 mPas. The lot of hypromellose used for development trials had viscosity of 98 mPas and 102 mPas. The viscosity of hypromellose towards extremity of specification (towards lower side and higher side of the specification) will have impact on drug through polymer matrix. Hence, it is rated as High.
CQA
CMA

42
CPP and Control StrategyLevel 4: Detailed evaluation of impact of critical process parameter & its Control strategy value
Unit Operation Parameter Value (Lab scale) UOM
Fluid bed granulation
Spray rate 36 (15-60) g/min
Airflow 100 (80-140) CFM
% inlet RH 5 -55 %
Atomization pressure 1 (0.8-1.2) bar
Granules dryingInlet temperature 25-45 ˚C
EXhaust temperature 25-30 ˚C
Milling Milling speed 1200 (1200 -1700) RPM
Blending (Lubrication) Blending time 5 min.
Compression
Precompression force 10% of MCF kN
Main compression force (MCF) 20-Oct kN
Turret speed 20-40 RPM
Seal coatingSpray rate 2-15 g/min
Atomization pressure 1-2 bar
Film coating
Spray rate 1-5 g/min
Atomization pressure 2-3 bar
Inlet temperature 30-65 ˚C
EXhaust temperature 35-45 ˚C
43
• Capable of being deployed for all products and compare products• Same basis of evaluation• Capture all key patient centric parameters• Serve as a basis for taking preventive action – Lead indicator• Quantified and based on statistically appropriate concepts
Product Scorecard Concept & Key Attributes

44
For Qualitative data
Upper limit = 𝑈𝐿 =𝑣1∗𝐹
𝑣2+𝑣1∗𝐹
Wherev1 = 2(x+1)v2 = 2(n-x)x = number of nonconformancen = number of batchesF = lower α/2 point of F with v1 and v2 degrees of freedomNote: when x=0 or x=n, calculate the one-sided confidence interval.
Converted to individual score based on the 95% upper confidence limits on percent non-conformance using (1-UL)*100
For Quantitative data following robustness score is used for calculation
Ppk Range Score Range
Ppk <= 1 0 – 25
1 < Ppk <= 1.33 26 – 50
1.33 < Ppk <= 1.67 51 – 75
Ppk > 1.67 75 – 100
Product Scorecard Concept & Key Attributes
45
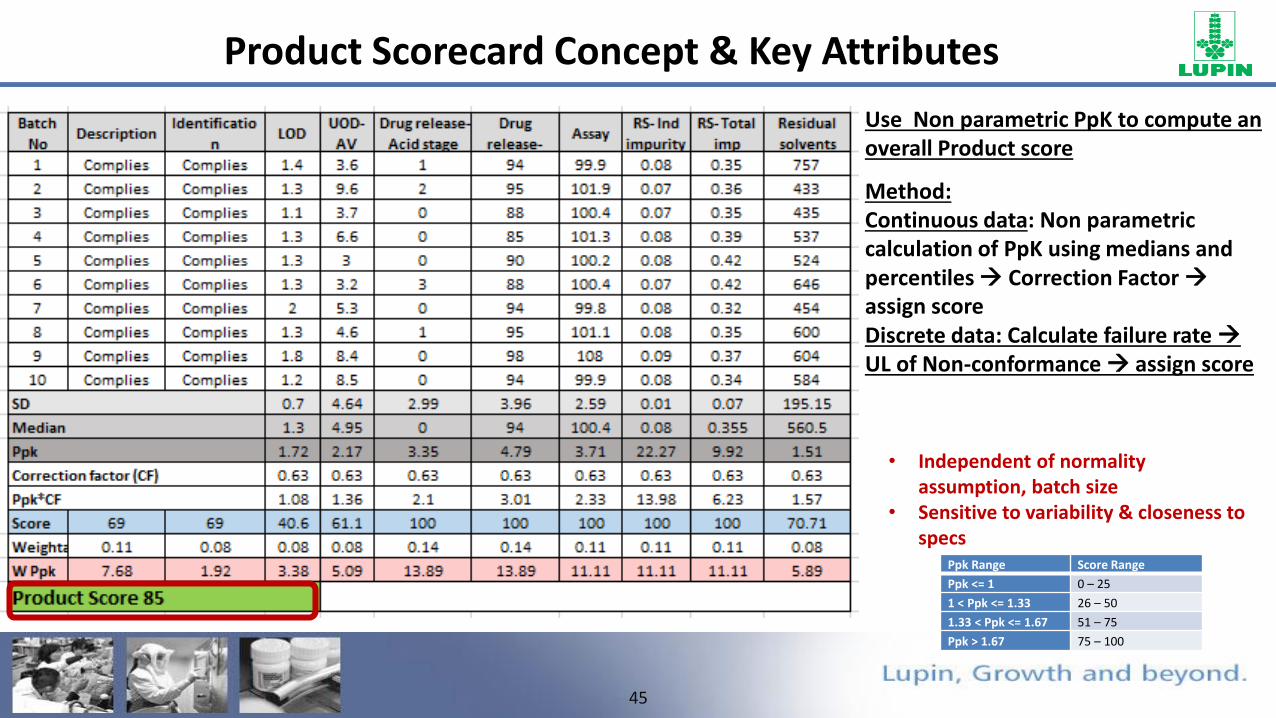
Process Engineering Update
Use Non parametric PpK to compute an overall Product score
Method:Continuous data: Non parametric calculation of PpK using medians and percentiles Correction Factor assign scoreDiscrete data: Calculate failure rate UL of Non-conformance assign score
• Independent of normality assumption, batch size
• Sensitive to variability & closeness to specs
Product Scorecard Concept & Key Attributes
Ppk Range Score Range
Ppk <= 1 0 – 25
1 < Ppk <= 1.33 26 – 50
1.33 < Ppk <= 1.67 51 – 75
Ppk > 1.67 75 – 100
46
Process Engineering Update
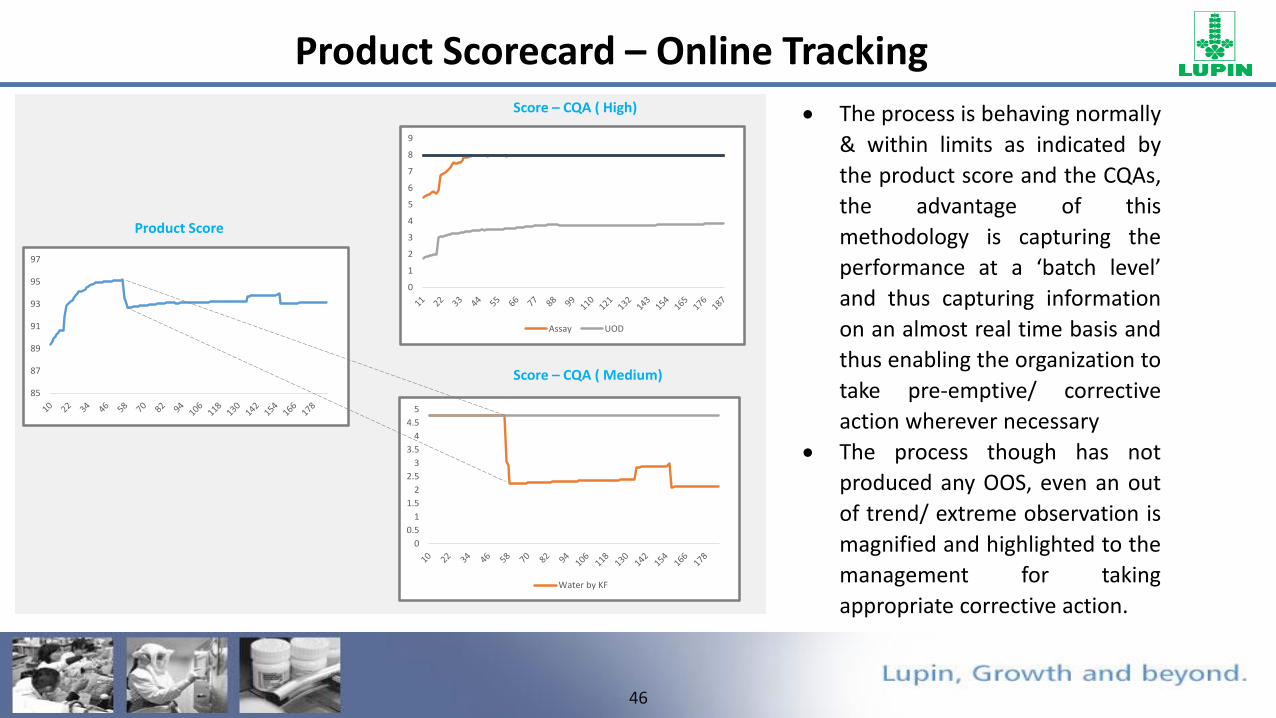
Product Scorecard – Online Tracking
85
87
89
91
93
95
97
0
0.5
1
1.5
2
2.5
3
3.5
4
4.5
5
Water by KF
0
1
2
3
4
5
6
7
8
9
Assay UOD
Product Score
Score – CQA ( High)
Score – CQA ( Medium)
The process is behaving normally
& within limits as indicated by
the product score and the CQAs,
the advantage of this
methodology is capturing the
performance at a ‘batch level’
and thus capturing information
on an almost real time basis and
thus enabling the organization to
take pre-emptive/ corrective
action wherever necessary
The process though has not
produced any OOS, even an out
of trend/ extreme observation is
magnified and highlighted to the
management for taking
appropriate corrective action.

47
ICH Q9’s Risk management Process
The study of risk management began after
World War II. Risk management has long been associated with the use of
market insurance to protect individuals and companies
from various losses associated with accidents.
Risk Management
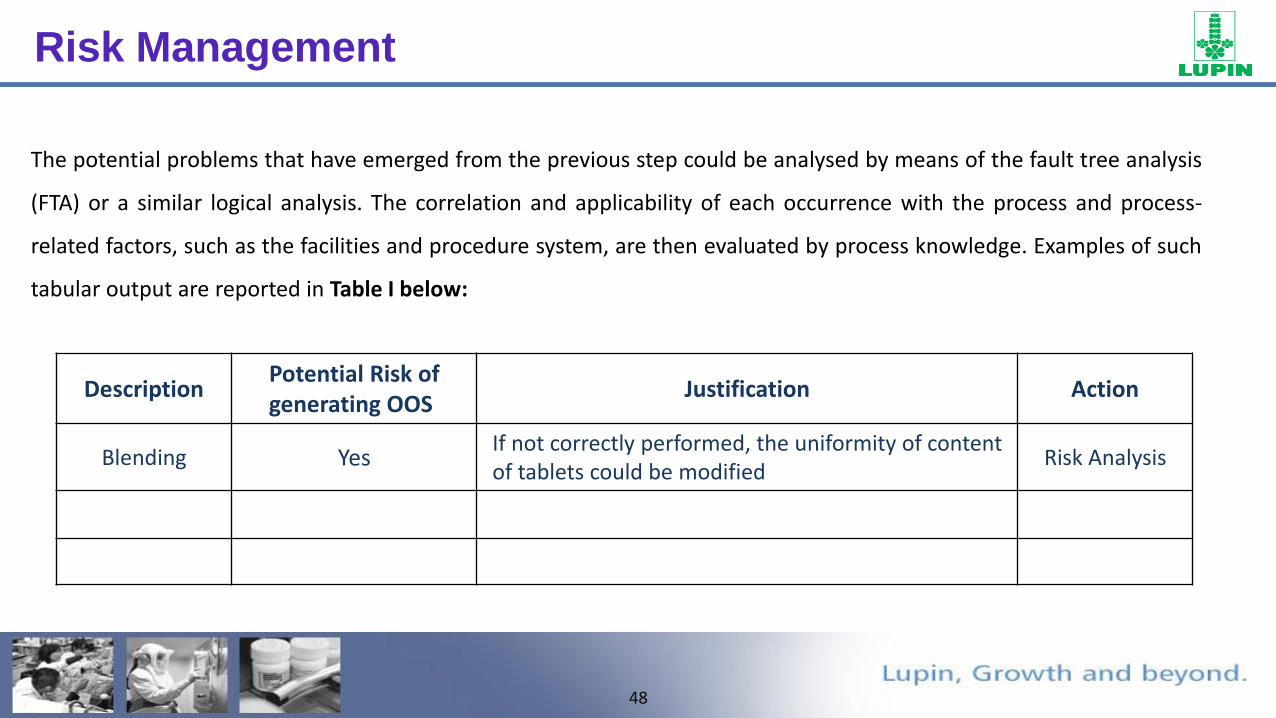
48
DescriptionPotential Risk of generating OOS
Justification Action
Blending YesIf not correctly performed, the uniformity of content of tablets could be modified
Risk Analysis
The potential problems that have emerged from the previous step could be analysed by means of the fault tree analysis
(FTA) or a similar logical analysis. The correlation and applicability of each occurrence with the process and process-
related factors, such as the facilities and procedure system, are then evaluated by process knowledge. Examples of such
tabular output are reported in Table I below:
Risk Management
49
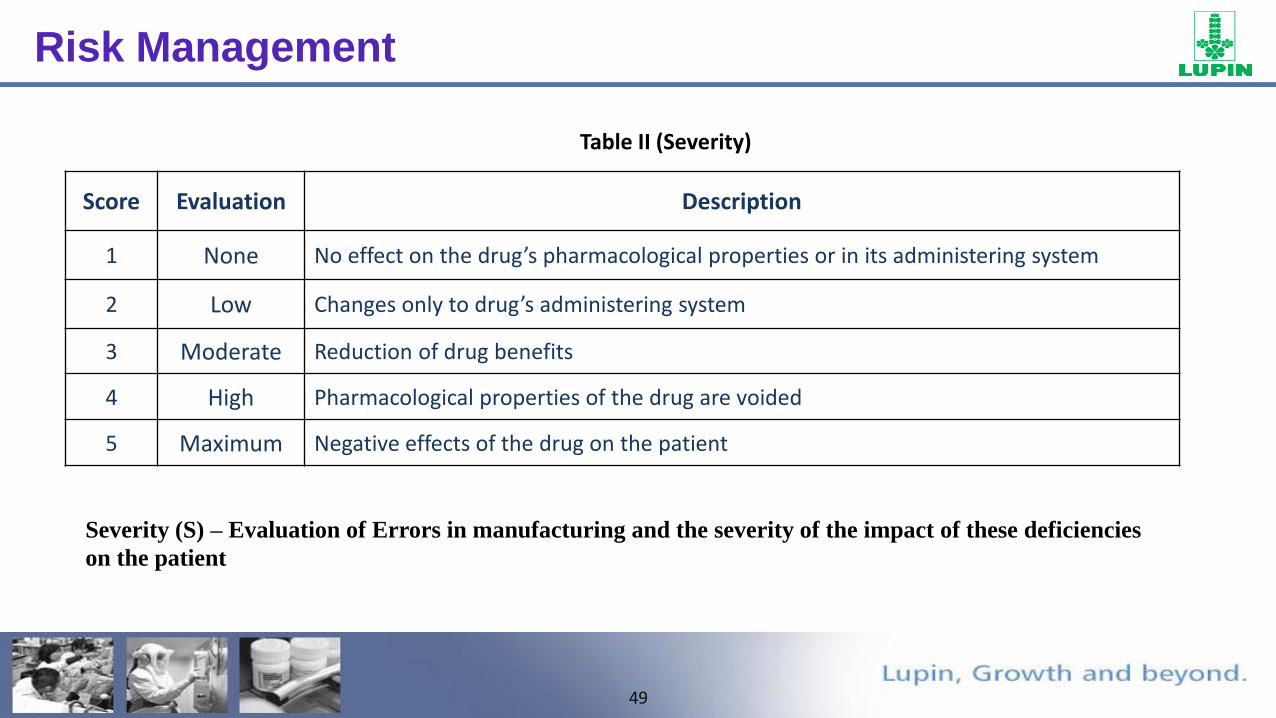
Score Evaluation Description
1 None No effect on the drug’s pharmacological properties or in its administering system
2 Low Changes only to drug’s administering system
3 Moderate Reduction of drug benefits
4 High Pharmacological properties of the drug are voided
5 Maximum Negative effects of the drug on the patient
Table II (Severity)
Severity (S) – Evaluation of Errors in manufacturing and the severity of the impact of these deficiencies
on the patient
Risk Management

50
Score Evaluation Description
1 CertainThese are double checks (activities performed by one operator & simultaneously verified by a second operator) and stop controls (technological &/or analytical).
2 HighThese are double checks (step performed by one operator and simultaneously verified by a second operator).
3 MediumThere is a verification at the end of the activities performed by a second operator and a release analysis
4 Low There are final release analysis
5 None No subsequent analysis.
Table III (Detectability)
Detectability (D) – Presence of double checks or analysis.
Risk Management
51
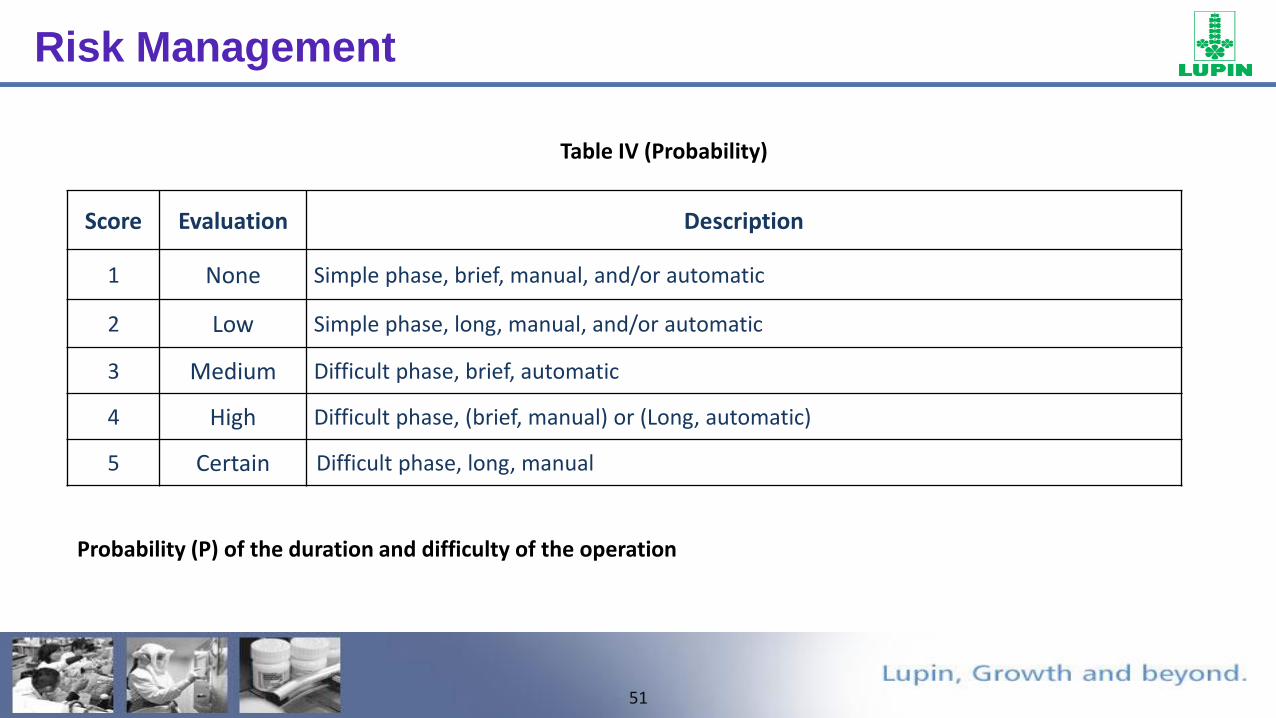
Score Evaluation Description
1 None Simple phase, brief, manual, and/or automatic
2 Low Simple phase, long, manual, and/or automatic
3 Medium Difficult phase, brief, automatic
4 High Difficult phase, (brief, manual) or (Long, automatic)
5 Certain Difficult phase, long, manual
Table IV (Probability)
Probability (P) of the duration and difficulty of the operation
Risk Management

52
Score Evaluation Description
1 None The phase impacts only external appearances.
2 Low The phase impacts qualitative & quantitative characteristics, with tested/ verified parameters.
3 MediumThe phase impacts qualitative & quantitative characteristics, with no tested/ verified parameters, but there are two subsequent steps that are able to compensate potential mistakes in that phase.
4 HighThe phase impacts qualitative & quantitative characteristics, with no tested/ verified parameters, but there is one subsequent step that is able to compensate potential mistakes in that phase.
5 CertainThe phase impacts qualitative & quantitative characteristics, with no tested/ verified parameters, and there are no subsequent steps that are able to compensate potential mistakes in that phase.
Table V (Impacted Phase)
Impacted Phase (F) - Each phase is analyzed for its own features and position during the manufacturing process.
Risk Management

53
Stage Extent of error S P Control D Impacted Phase F RPN
Blending
Blending (PreMix)
Mixing not Proper
3 1Double Check
2Phase impacts on qualitative & quantitative characteristics, with tested/ verified parameters.
3 18
Documentationerror
1 2Double Check
2 No Impact on finished product. 1 4
Table VI (Risk priority number (RPN) evaluation)
Risk Management
54
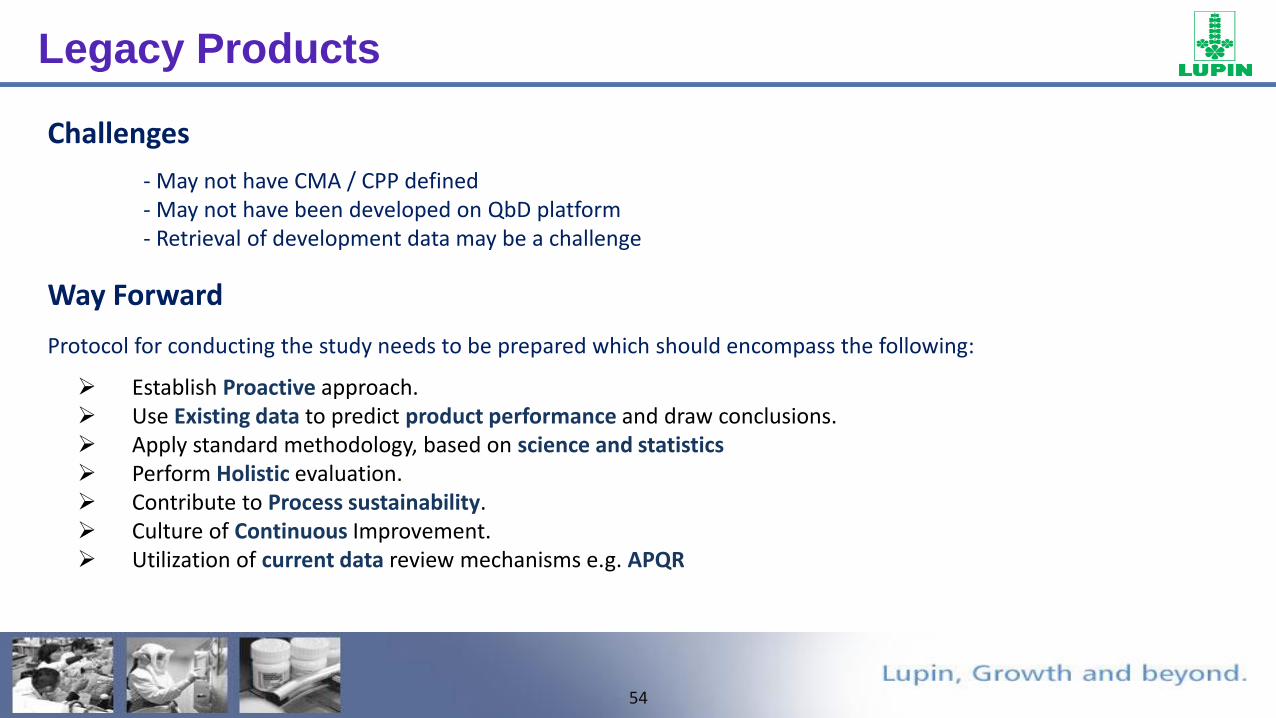
Legacy Products
Challenges
- May not have CMA / CPP defined - May not have been developed on QbD platform- Retrieval of development data may be a challenge
Way Forward
Protocol for conducting the study needs to be prepared which should encompass the following:
Establish Proactive approach. Use Existing data to predict product performance and draw conclusions. Apply standard methodology, based on science and statistics Perform Holistic evaluation. Contribute to Process sustainability. Culture of Continuous Improvement. Utilization of current data review mechanisms e.g. APQR

55
Legacy Products – Steps involved
1• Product Prioritization
2• CTQ Identification (CQA,CPP, CMA)
• Analysis Methodology (Protocol based)
3• Database creation
4 • Data collection
5• Statistical evaluation
6• Recommendation Implementation
56
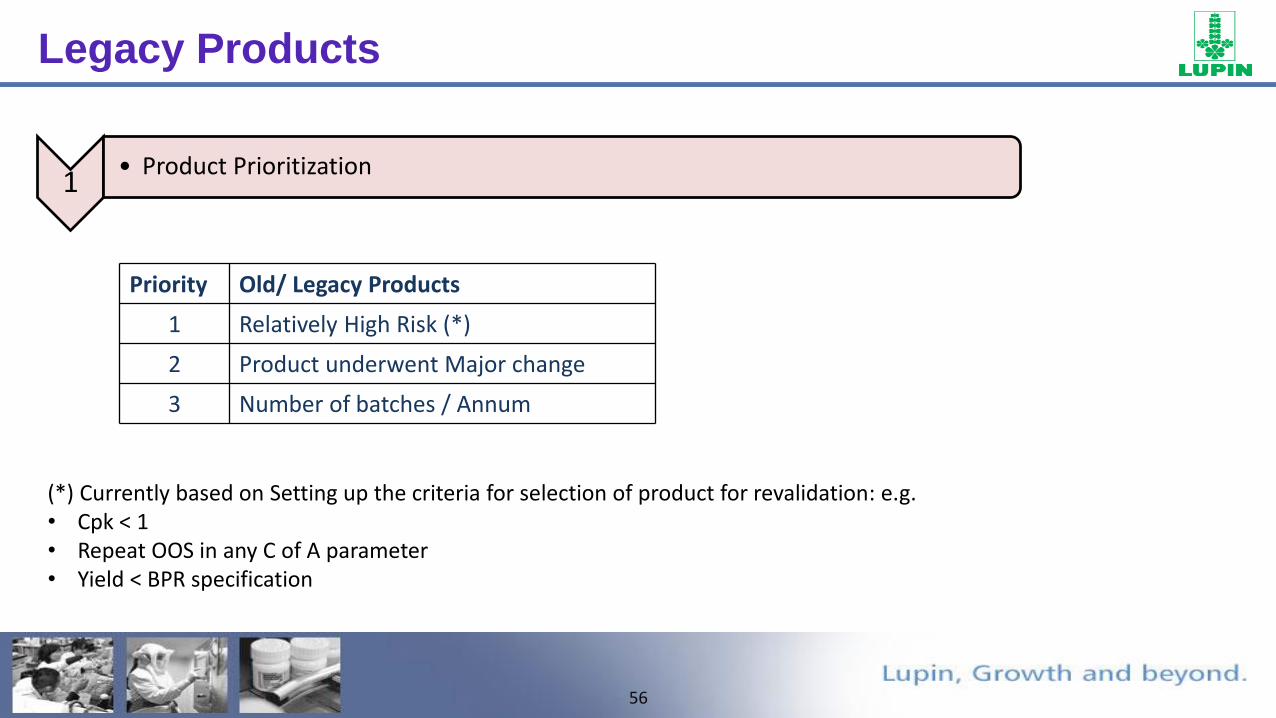
Legacy Products
(*) Currently based on Setting up the criteria for selection of product for revalidation: e.g.• Cpk < 1• Repeat OOS in any C of A parameter• Yield < BPR specification
1• Product Prioritization
Priority Old/ Legacy Products
1 Relatively High Risk (*)
2 Product underwent Major change
3 Number of batches / Annum
57
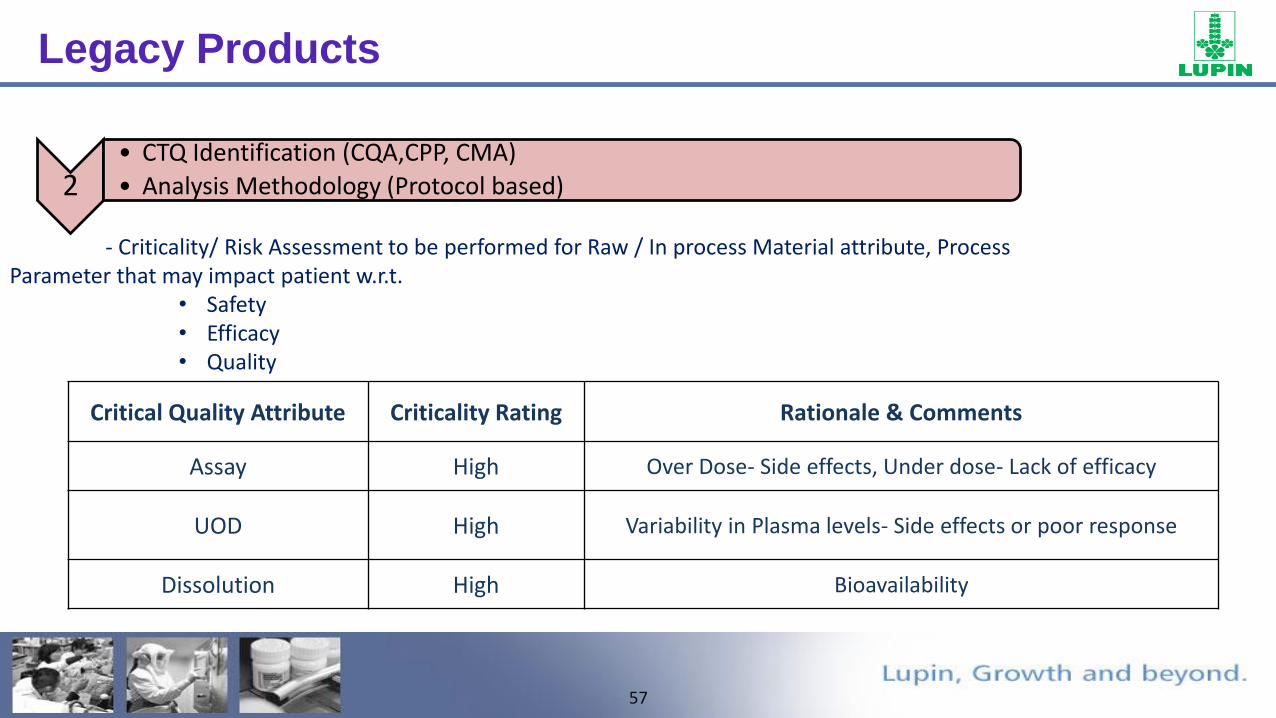
Legacy Products
Critical Quality Attribute Criticality Rating Rationale & Comments
Assay High Over Dose- Side effects, Under dose- Lack of efficacy
UOD High Variability in Plasma levels- Side effects or poor response
Dissolution High Bioavailability
2• CTQ Identification (CQA,CPP, CMA)
• Analysis Methodology (Protocol based)
- Criticality/ Risk Assessment to be performed for Raw / In process Material attribute, Process Parameter that may impact patient w.r.t.
• Safety• Efficacy• Quality
58
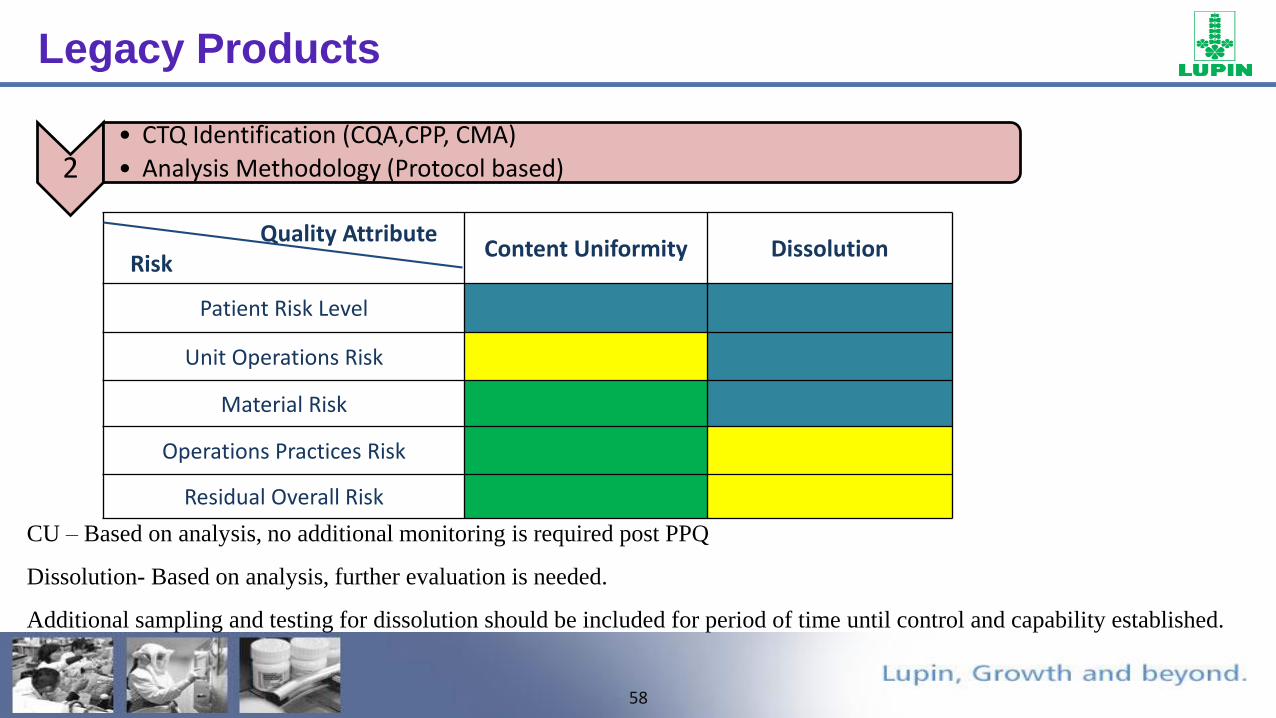
Legacy Products
Quality AttributeRisk
Content Uniformity Dissolution
Patient Risk Level
Unit Operations Risk
Material Risk
Operations Practices Risk
Residual Overall Risk
2• CTQ Identification (CQA,CPP, CMA)
• Analysis Methodology (Protocol based)
CU – Based on analysis, no additional monitoring is required post PPQ
Dissolution- Based on analysis, further evaluation is needed.
Additional sampling and testing for dissolution should be included for period of time until control and capability established.
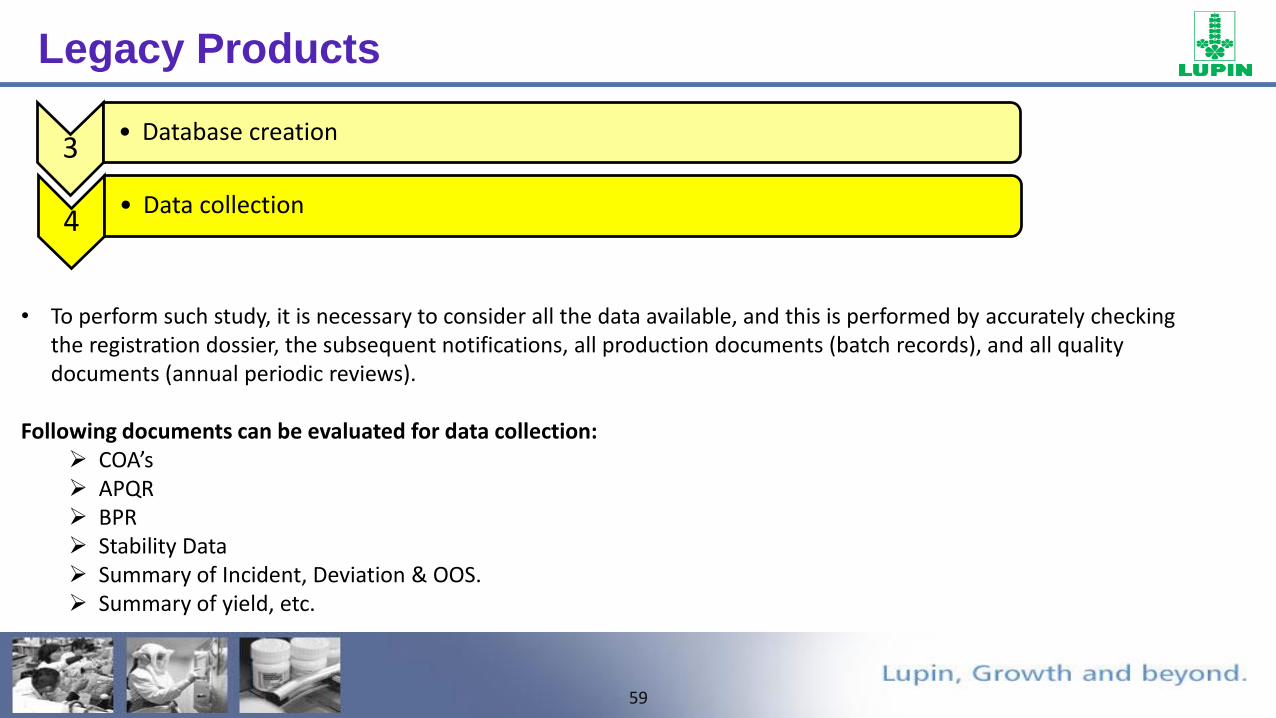
59
Legacy Products
• To perform such study, it is necessary to consider all the data available, and this is performed by accurately checking the registration dossier, the subsequent notifications, all production documents (batch records), and all quality documents (annual periodic reviews).
Following documents can be evaluated for data collection: COA’s APQR BPR Stability Data Summary of Incident, Deviation & OOS. Summary of yield, etc.
3• Database creation
4• Data collection

60
Legacy Products
5• Statistical evaluation
Thresholds for statistical assessment tools to be identified (e.g. Ppk < “x” or exceeding statistically derived control
limits) which may trigger enhanced monitoring of additional inputs (e.g. raw materials, storage conditions) which may
impact the attributes/ parameter.
Assay CU Disintegration Dissolution Impurities
0.9 2.66 2.16 2.34 5.09
In this example, assay data has a lower Ppk and the process has a statistical
control limit (+/- 3 sigma) which lies slightly below the product specification.
The lower Ppk index value indicates lower long term capability based on an
overall estimate of standard deviation (all variation estimates) and suggests a
need to reduce variability and center the process.

61
Legacy Products
Pre-determined criteria could be set, such as a defined confidence interval of process capability (e.g. Cpk > 1, with 90% confidence) which when achieved would drive a review to decide if and what testing could be reduced to the routine monitoring level, and which elements of the control strategy could be considered for change.
6• Recommendation Implementation
CQA HMP Rationale Sampling Acceptance CriteriaTarget min Cpk
# of batches
Rationale
Appearance NoRoutine sampling & inspection uses AQL acceptance sampling
Routine Meets release criteria NA NA NA
Dissolution Yes
Complex multivariate relationship requires more data to assess robustness
60 tabs/ batch using stratified sampling
Mean >85%; RSD 8.5 max MAs for API particle size, Mg stearate SA & crushing force & lubrication time monitored
> 1.0
As needed to assess/ achieve Cpk
*Material Attribute, *Control Strategy, *Process capability
Note – acceptance criteria follows ASTM E2709 [8] using 90% confidence interval.
AQL- Limiting quality level
HMP- Heightened Monitoring Plan
62
• Variations and Process Robustness
• Risk Based Approach in Improving Process Robustness
• Process Analytical Technology in Manufacturing
– Role of PAT in process understanding and process controls
– PAT as enabler in product robustness
– Real-life case studies
Agenda
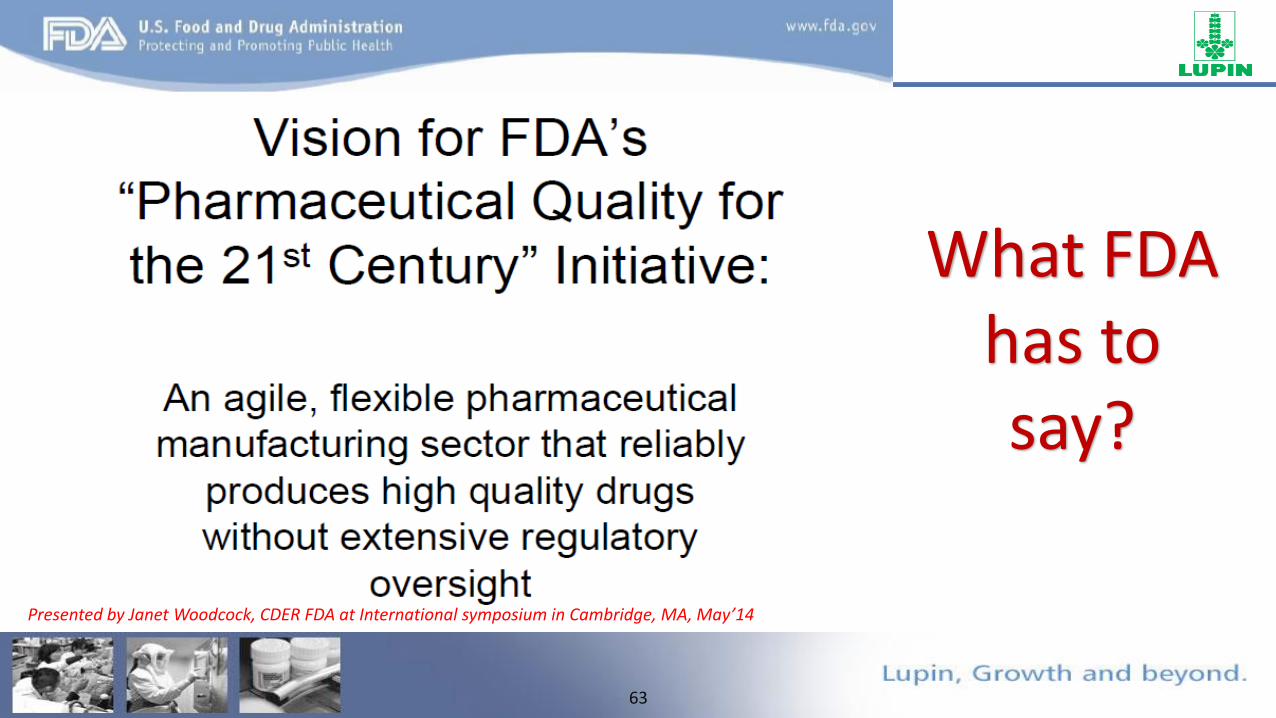
63
Presented by Janet Woodcock, CDER FDA at International symposium in Cambridge, MA, May’14
What FDA has to say?
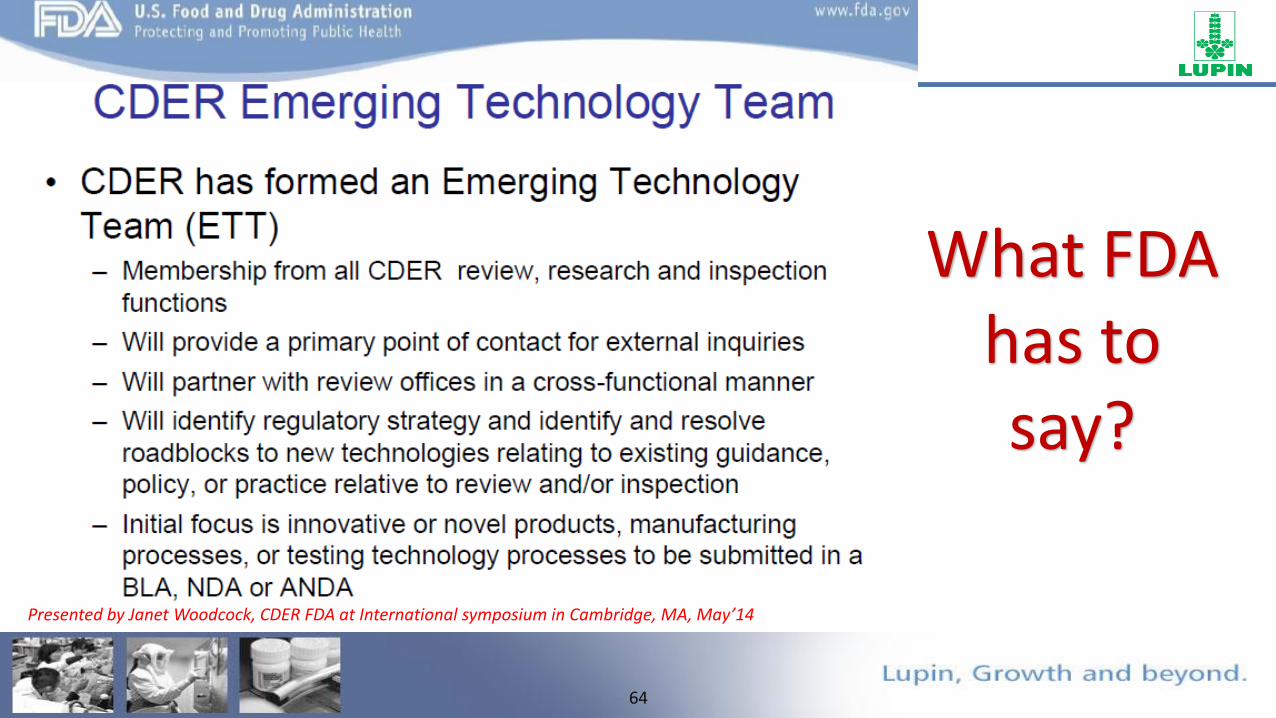
64
Presented by Janet Woodcock, CDER FDA at International symposium in Cambridge, MA, May’14
What FDA has to say?
65
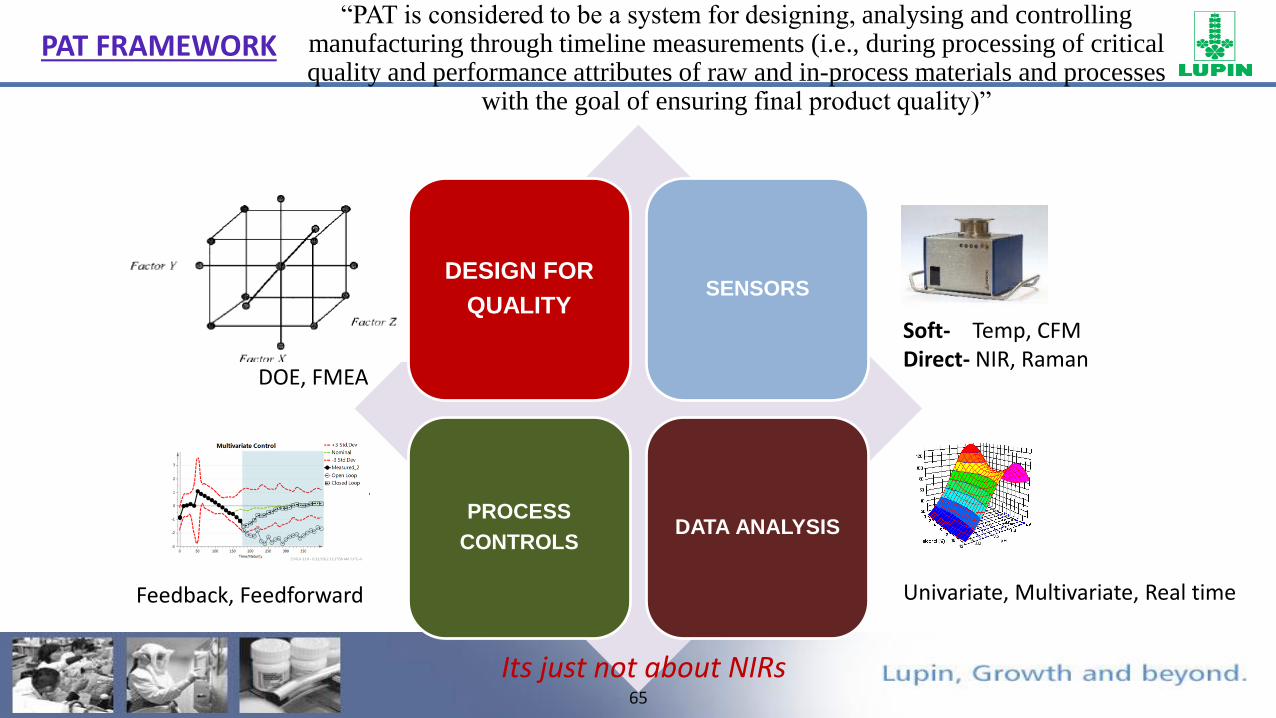
PAT FRAMEWORK
FTO
DESIGN FOR
QUALITYSENSORS
PROCESS
CONTROLSDATA ANALYSIS
DOE, FMEA
Univariate, Multivariate, Real time
Soft- Temp, CFMDirect- NIR, Raman
Feedback, Feedforward
Its just not about NIRs
“PAT is considered to be a system for designing, analysing and controlling manufacturing through timeline measurements (i.e., during processing of critical quality and performance attributes of raw and in-process materials and processes
with the goal of ensuring final product quality)”

66
PAT in Product Lifecycle Management
FTO
Process Qualificatio
n
Continuous Process
Verification
Product Design
PAT can be employed during the entire Product Life cycle for varying benefits

67
FTO
Process Qualificat
ion
Continuous Process
Verification
Product Design
New Products- PAT utilized throughout development & Scale up.
Better understanding of Impact of CPP,CMA on the CQA
PAT in Product Lifecycle Management

68
FTO
Process Qualificat
ion
Continuous Process
Verification
Product Design
Commercial Products- PAT utilized for Analyzing CQA’s & Monitoring CPP
Step wise approach, first improve quality & then efficiency
PAT in Product Lifecycle Management
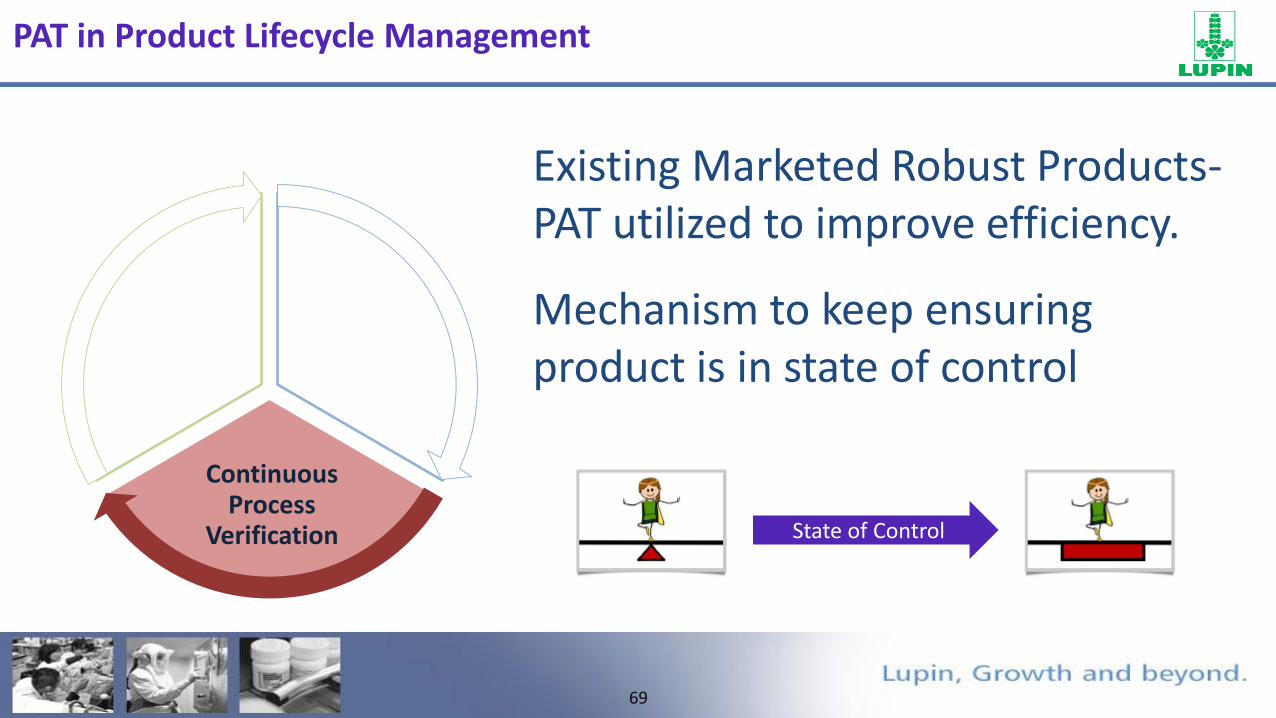
69
FTO
Process Qualificat
ion
Continuous Process
Verification
Product Design
Existing Marketed Robust Products-PAT utilized to improve efficiency.
Mechanism to keep ensuring product is in state of control
State of Control
PAT in Product Lifecycle Management

70
FTO
GRANULATION
GRAN
ULA
TIO
N M
ECH
AN
ISM
S
Granulating Mechanisms
71
FTO
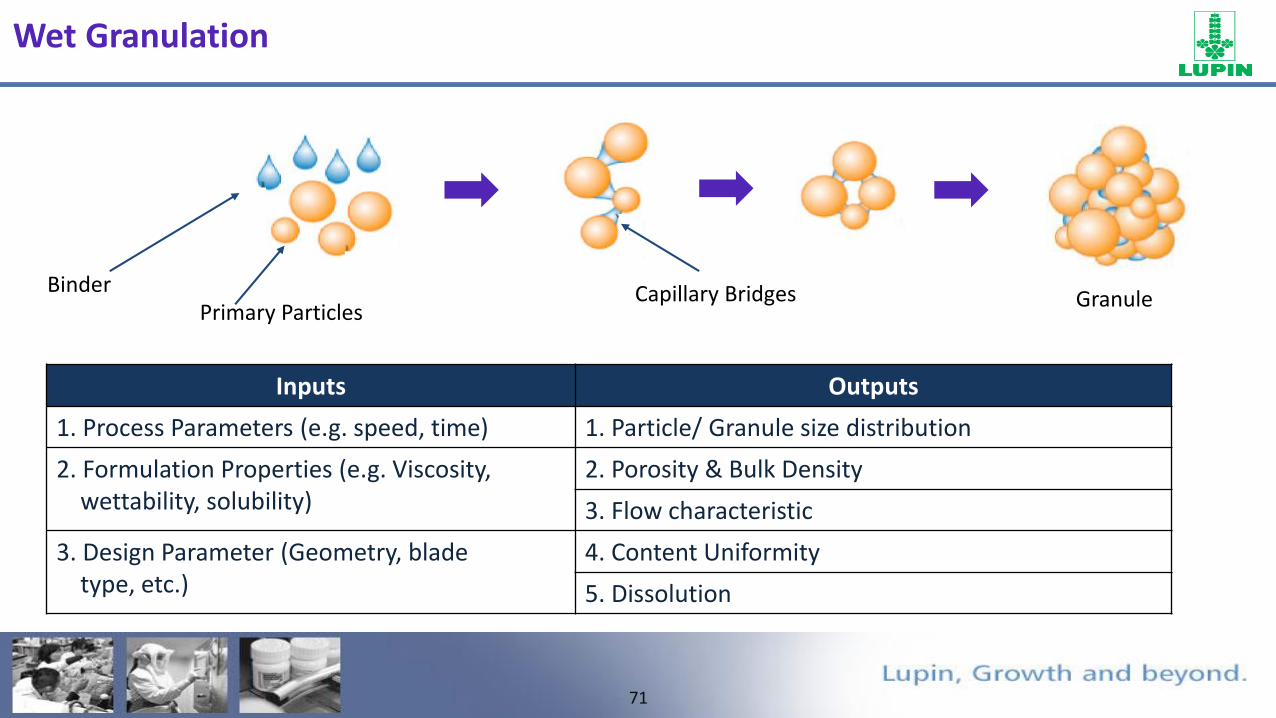
Primary ParticlesBinder Capillary Bridges Granule
Inputs Outputs
1. Process Parameters (e.g. speed, time) 1. Particle/ Granule size distribution
2. Formulation Properties (e.g. Viscosity, wettability, solubility)
2. Porosity & Bulk Density
3. Flow characteristic
3. Design Parameter (Geometry, blade type, etc.)
4. Content Uniformity
5. Dissolution
Wet Granulation
72
FTO
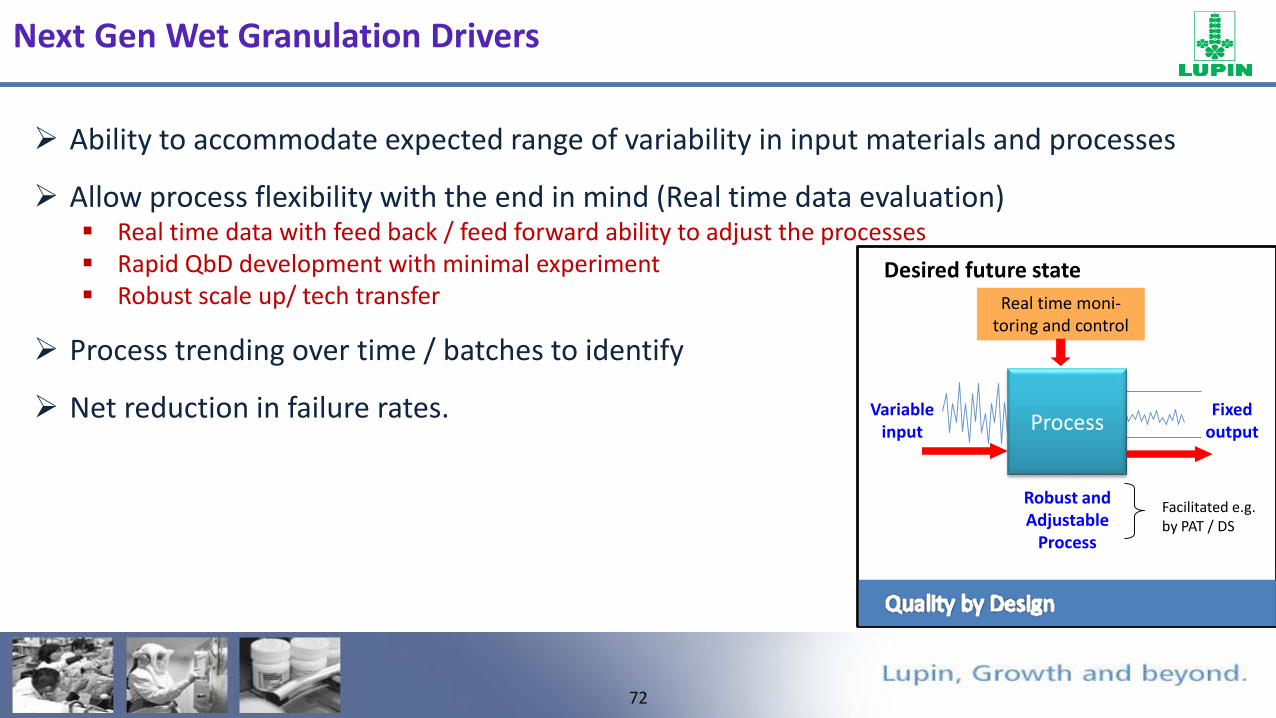
Ability to accommodate expected range of variability in input materials and processes
Allow process flexibility with the end in mind (Real time data evaluation) Real time data with feed back / feed forward ability to adjust the processes Rapid QbD development with minimal experiment Robust scale up/ tech transfer
Process trending over time / batches to identify subtle changes
Net reduction in failure rates.
Desired future state
ProcessVariable
input
Robust andAdjustable
Process
Fixedoutput
Real time moni-toring and control
Facilitated e.g.by PAT / DS
Next Gen Wet Granulation Drivers

73
FTO
Outputs INLINE ATLINE SIMULATION
1. Particle/ Granule size distribution Eyecon, FBRM
DEMPBM
2. Porosity & Bulk Density Torque, DFF FT4
3. Flow characteristic FT4
4. Content Uniformity NIR
5. Dissolution Torque, DFF FT4
Wet Granulation
74
FTO
Need to implement QbD paradigm through modelling
Extensive & Expensive laboratory testing leading to high costs & time during Product Design.
Powder / Granule flow is poorly understood due to lack of robust scientific tools
Need of Fundamental or Mechanistic understanding of process from the first principles.
Relating Process Parameters, equipment geometry and material properties to quality attributes.
Discrete Element Modelling – Need?

75
FTO
Newton’s 2nd law for each particle along with contact force model is solved explicitly with time.
Input Parameters:- Mechanical properties: Density, shear modulus, Poisson ratio. Interaction properties: Coefficient of restitution, Static friction and rolling friction.
Output Parameters:- The “position and velocity” of each individual particle, particle-particle and particle-
wall “contact forces” at any instant during the process can be obtained
mi g
Fij
gmFdt
dvm i
N
j
iji
i 1
Discrete Element Modelling – How?
76
FTO
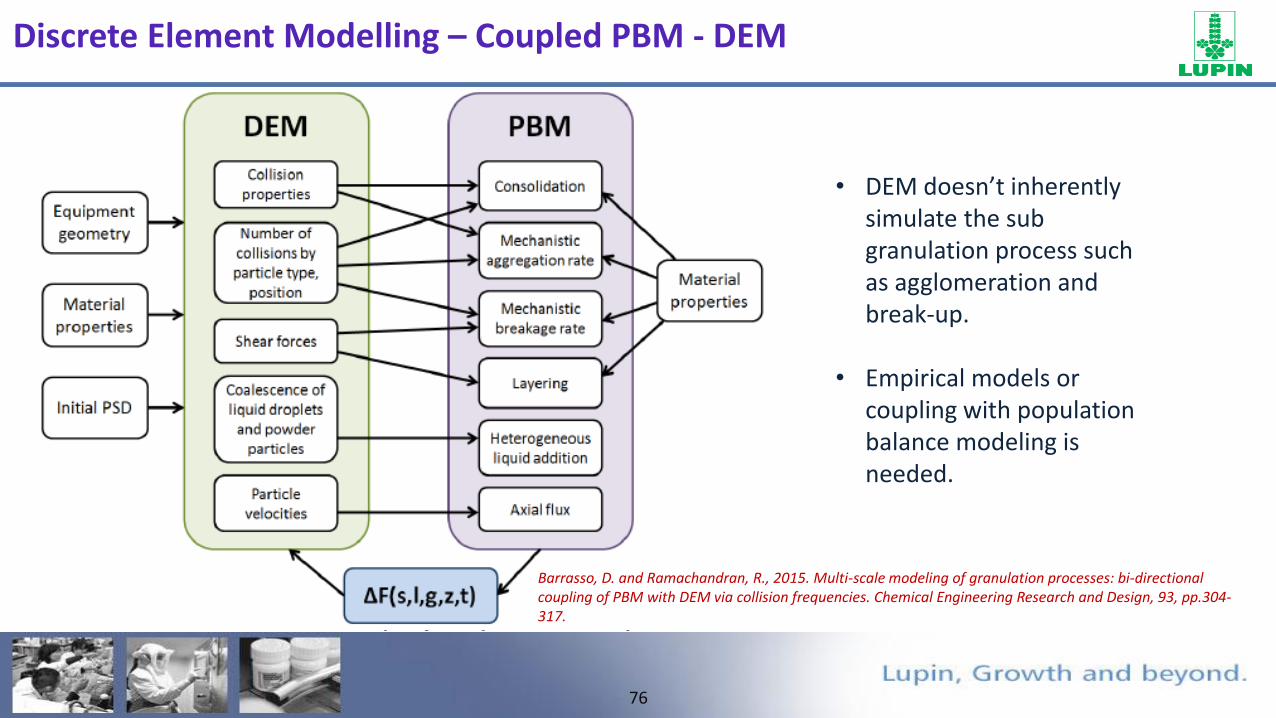
• DEM doesn’t inherently simulate the sub granulation process such as agglomeration and break-up.
• Empirical models or coupling with population balance modeling is needed.
Barrasso, D. and Ramachandran, R., 2015. Multi-scale modeling of granulation processes: bi-directional coupling of PBM with DEM via collision frequencies. Chemical Engineering Research and Design, 93, pp.304-317.
Discrete Element Modelling – Coupled PBM - DEM

77
FTO
• Images of particles colored by liquid fraction
Barrasso, D. and Ramachandran, R., 2015. Multi-scale modeling of granulation processes: bi-directional coupling of PBM with DEM via collision frequencies. Chemical Engineering Research and Design, 93, pp.304-317.
Discrete Element Modelling – Coupled PBM - DEM

78
FTO
Flow in screw feeder Milling
Granulation Die filling
Barrasso, D. and Ramachandran, R., 2016. Discrete Element Modeling of Solid Dosage Manufacturing Processes. Process Simulation and Data Modeling in Solid Oral Drug
Development and Manufacture, pp.105-131.
Discrete Element Modelling – Applications

79
FTO
Powder flow characterisation using FT4 rheometer and
angle of repose
Assessment of
processibility and
flowability from flow
properties
Developing material calibration
data for Discrete Element
Modelling
Avoiding caking
segregation in
hoppers, die fillingHopper Mixing Granulation
Tablet
coating
Achieve better process understanding and product quality,
identifying the relation between CPPs and CQAs
Measured parameters- Torque- Force- Height
FT4
Discrete Element Modelling – Work flow

80
Discrete Element Modelling – Case Study 1 (Hopper design using flow properties)
FTO
Objectives
– Understand flow properties of uniformly blended material
– Provide recommendations for better hopper designs, material flow type based
on the measured material properties to avoid segregation
Approach
– Mass flow hopper reduces the segregation tendency.
– Shear and bulk properties measured using FT4 powder rheometer.
– Jenike design procedure was followed to determine hopper angle and outlet
diameter.
Results
– Successfully predicted the important parameters like outlet diameter, maximum
cone angle, flow type, probability of arching.
81
FTO
Objectives
– To understand the mixing of different sized particles (material A and
material B) at different fill levels and rpms.
– To suggest optimum operating parameters.
Approach
– Angle of repose (AoR) of both the materials were measured.
– Material model for DEM was developed using the AoR measurements with
scaled particle sizes (factor of 80-90).
– Blender is filled with 1200 g of material A and 245 g of material B.
– Simulation is conducted at 30 rpm.
Discrete Element Modelling – Case Study 2 (Simulation of Bin blending)
82
FTO
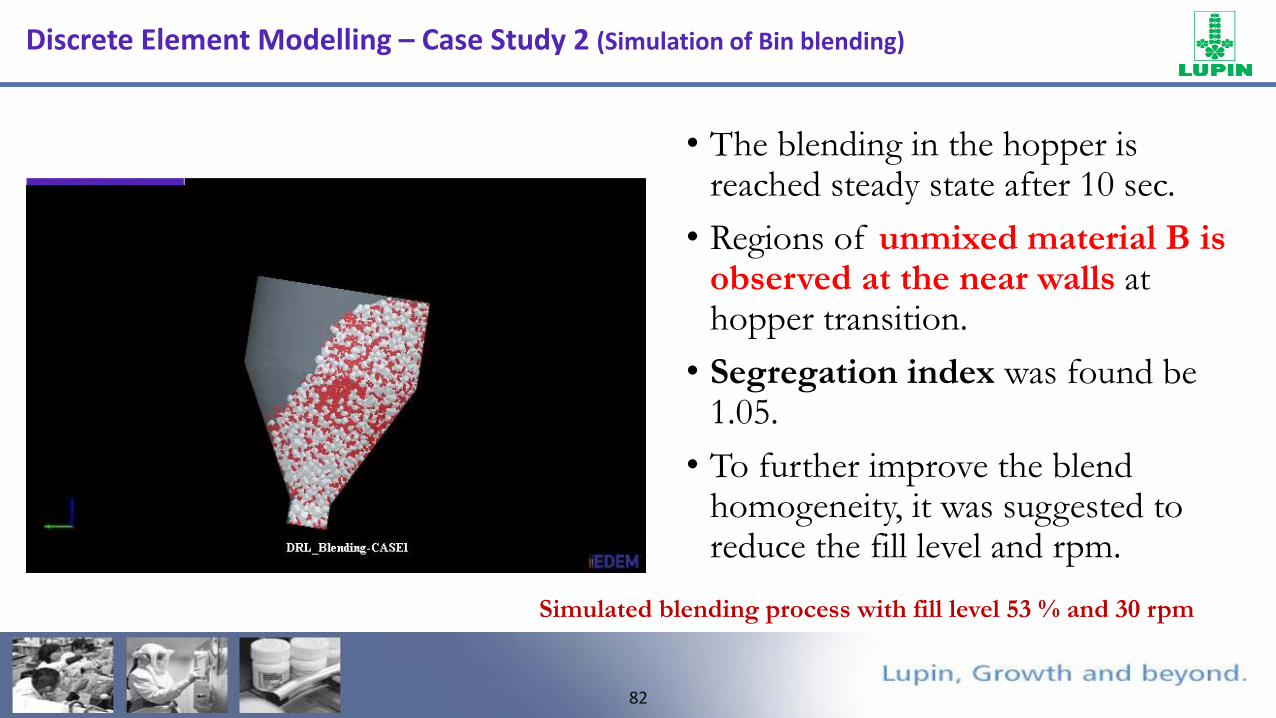
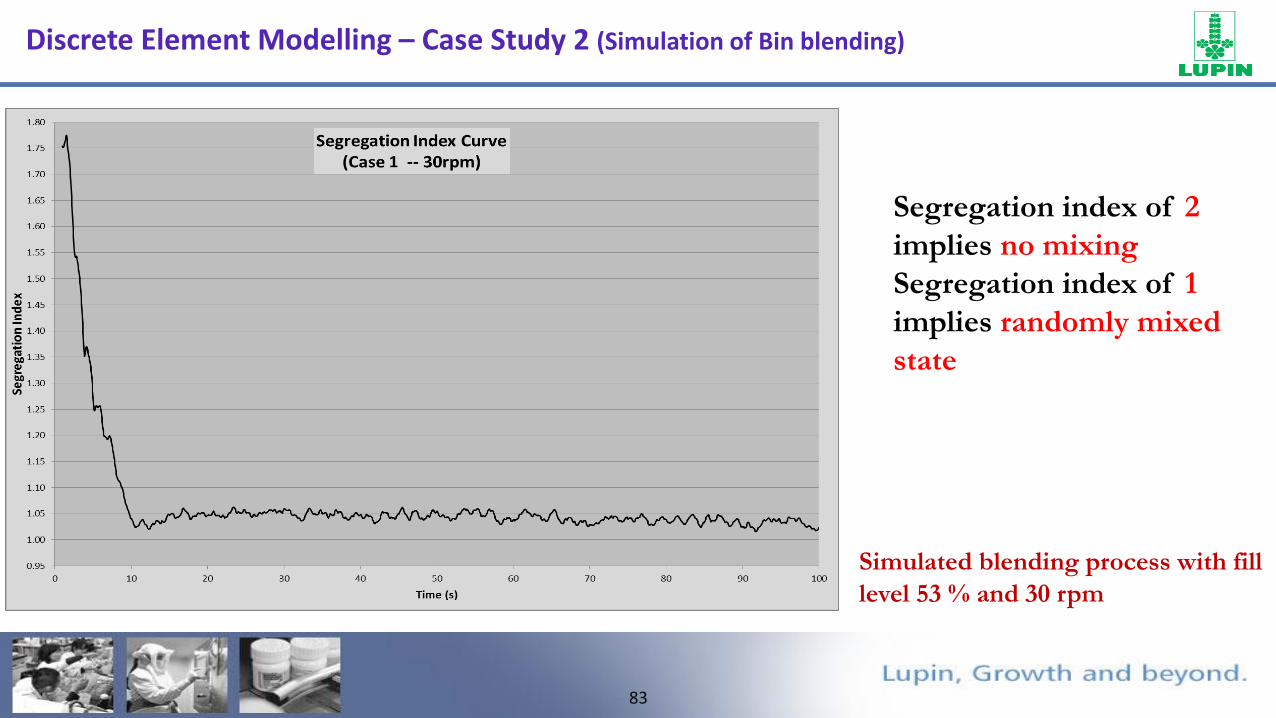
• The blending in the hopper is reached steady state after 10 sec.
• Regions of unmixed material B is observed at the near walls at hopper transition.
• Segregation index was found be 1.05.
• To further improve the blend homogeneity, it was suggested to reduce the fill level and rpm.
Simulated blending process with fill level 53 % and 30 rpm
Discrete Element Modelling – Case Study 2 (Simulation of Bin blending)
83
FTO
Simulated blending process with fill
level 53 % and 30 rpm
Segregation index of 2
implies no mixing
Segregation index of 1
implies randomly mixed
state
Discrete Element Modelling – Case Study 2 (Simulation of Bin blending)

84
Wet Granulation – end point
FTO
What is the end point?
• Target particle size mean
• Target particle size distribution
• Target granule viscosity
• Target granule density
Principle of equifinality
• Determining the end point, and then reproducibly arriving at that same end point as
equipment size and model changes are encountered, has been a continual challenge
85
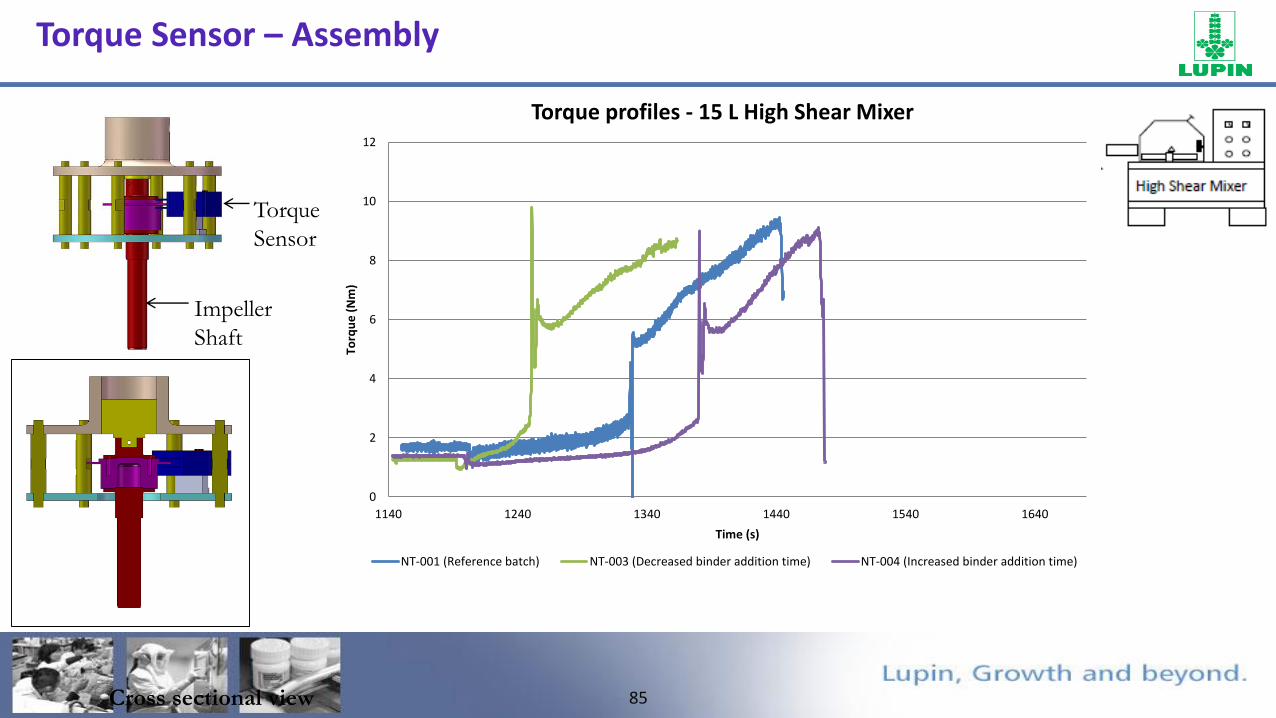
Torque Sensor – Assembly
FTO
Torque
Sensor
Impeller
Shaft
Cross sectional view
0
2
4
6
8
10
12
1140 1240 1340 1440 1540 1640
Torq
ue
(N
m)
Time (s)
Torque profiles - 15 L High Shear Mixer
NT-001 (Reference batch) NT-003 (Decreased binder addition time) NT-004 (Increased binder addition time)

86
FTO
• Can be used to find the minimum liquid volume required for granulation
• As an output parameter in the DOE and arrive at a torque value for the right end point
• Advantageous in case of change in raw material properties - reproduce torque value
• Can be used as a scale up tool – reproduce calculated torque during scale up
Torque Sensor – Applications

87
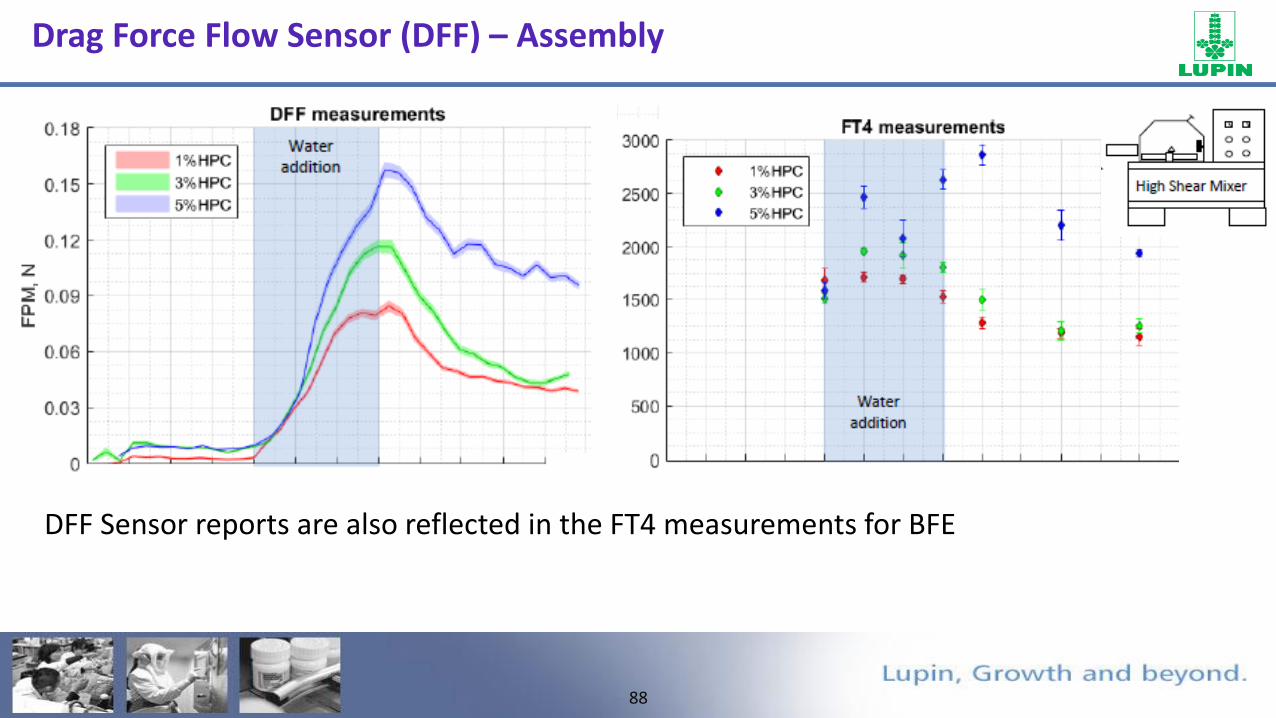
Drag Force Flow Sensor (DFF) – Assembly
FTO
• Hollow cylindrical pillar with two optical strain gauges
• Based on the linear movement of the hollow cylindrical pillar by a distance xo in the direction of wet mass
flowing with velocity, v, and mass, m
• Composite response for wet mass densification, tackiness, and particle growth
• Force profiles as a granule approaches, collides and breaks down near the sensor
Approach Collison Breakage
88
FTO
DFF Sensor reports are also reflected in the FT4 measurements for BFE
Drag Force Flow Sensor (DFF) – Assembly

89
Near Infra Red (NIR) – Case study 1 (Moisture content prediction in drying)
FTO
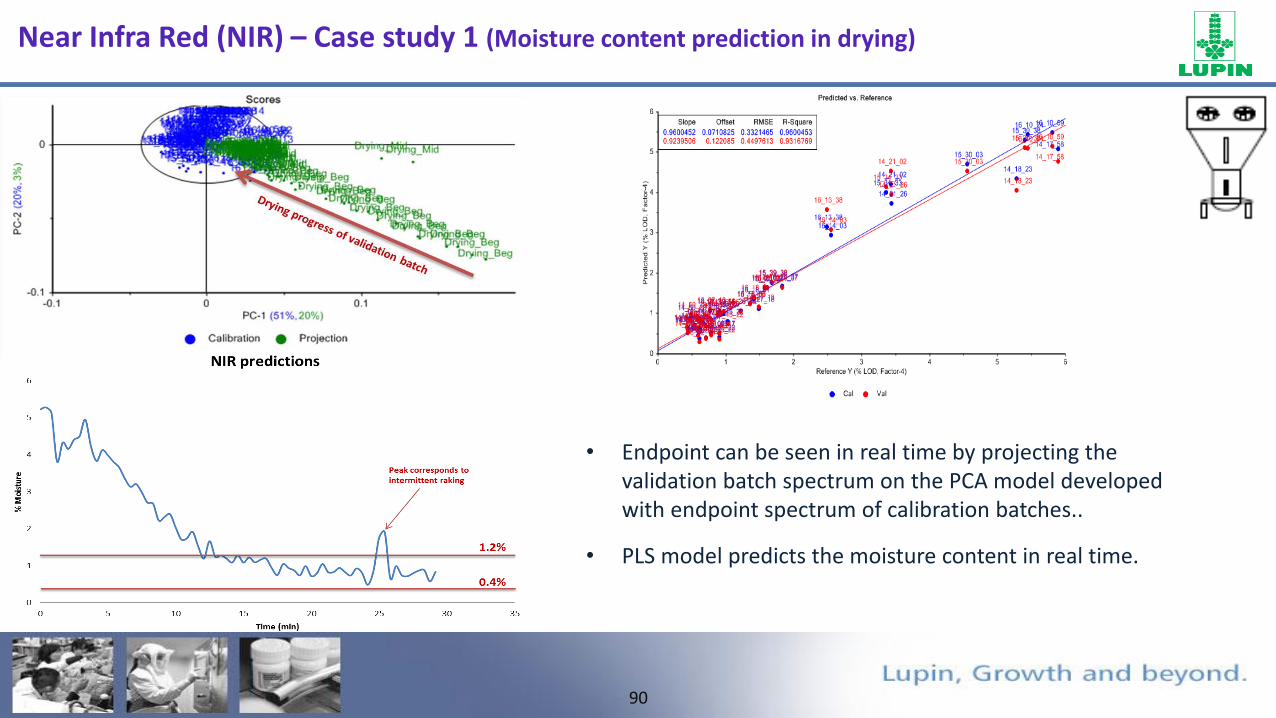
• Moisture content can be determined with in-line Near Infrared Spectrometer in fluid bed drying.
• Preparation of calibration set by varying moisture concentration.
• PLS model should be developed by correlating NIR spectral absorbance of calibration samples with
the reference values from laboratory.
• Chemometric knowledge required to build regression model.
Second derivative spectra shows the linearity for different moisture samples.
90
FTO
• Endpoint can be seen in real time by projecting the validation batch spectrum on the PCA model developed with endpoint spectrum of calibration batches..
• PLS model predicts the moisture content in real time.
Near Infra Red (NIR) – Case study 1 (Moisture content prediction in drying)
91
Mass Spectometry (MS) – Assembly
FTO
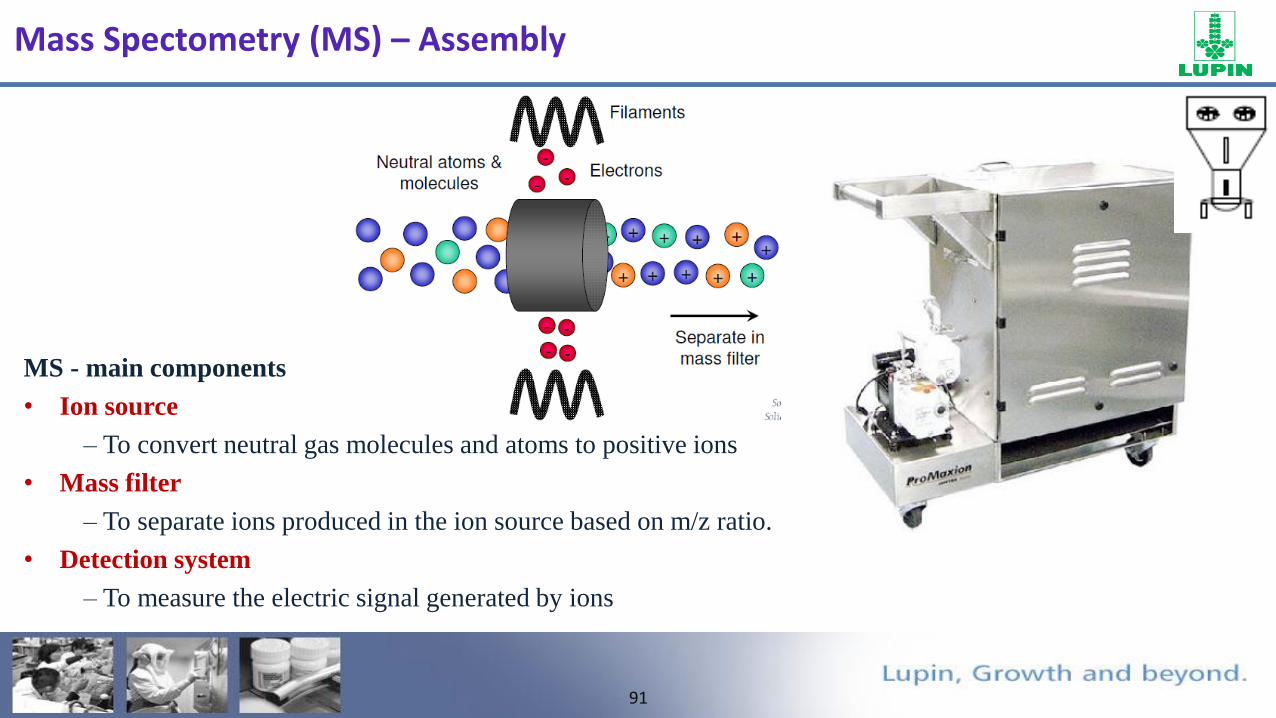
MS - main components
• Ion source
– To convert neutral gas molecules and atoms to positive ions
• Mass filter
– To separate ions produced in the ion source based on m/z ratio.
• Detection system
– To measure the electric signal generated by ions
92
FTO
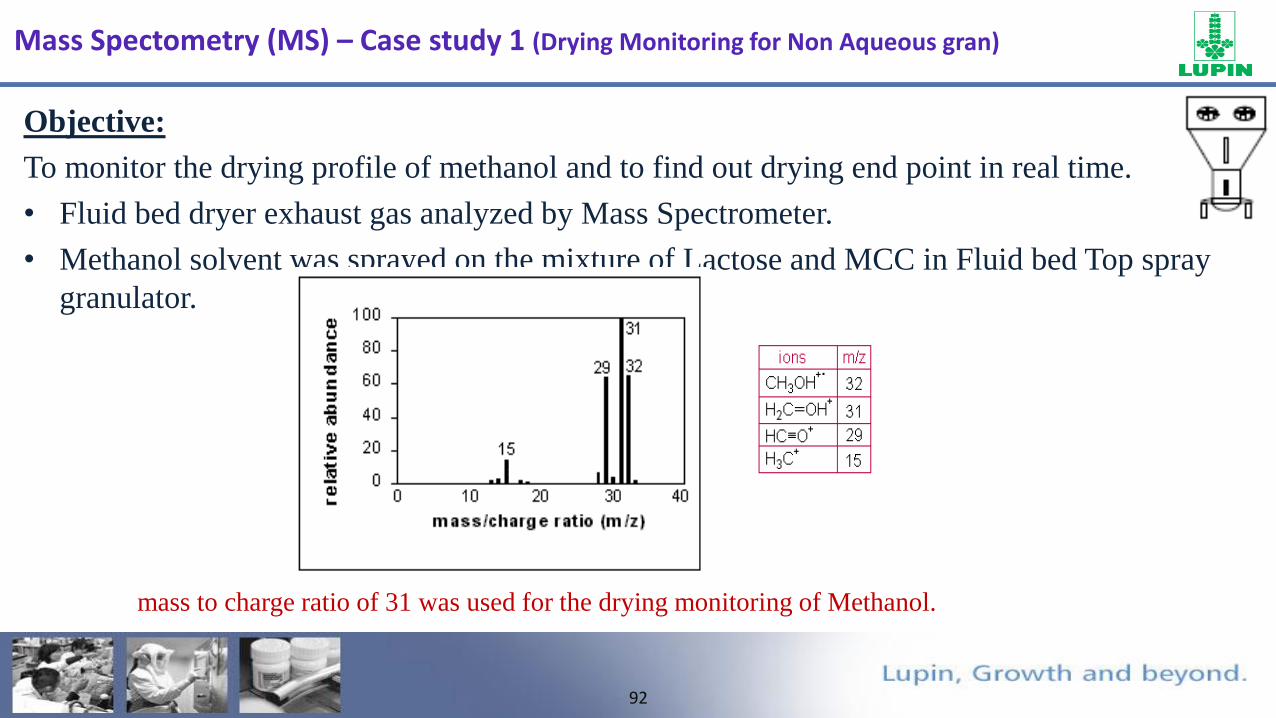
Objective:
To monitor the drying profile of methanol and to find out drying end point in real time.
• Fluid bed dryer exhaust gas analyzed by Mass Spectrometer.
• Methanol solvent was sprayed on the mixture of Lactose and MCC in Fluid bed Top spray
granulator.
mass to charge ratio of 31 was used for the drying monitoring of Methanol.
Mass Spectometry (MS) – Case study 1 (Drying Monitoring for Non Aqueous gran)

93
FTO
0
2
4
6
8
10
12
14
16
0 500 1000 1500 2000 2500 3000 3500 4000
(31
/40
)*1
00
0
Time, sec
31/40*1000
ATPMS-PBO-NT-003 ATPMS-PBO-NT-009 ATPMS-PBO-NT-010
0
100
200
300
400
500
600
700
800
900
0 10 20 30 40 50 60 70
Met
han
ol
con
ten
t, p
pm
Time, min
Methanol content by GC Analysis
ATPMS-PBO-NT-003
ATPMS-PBO-NT-009
ATPMS-PBO-NT-010
• Drying endpoint reached after the (31/40)*1000 ratio value
reaches below 3 which is happening after 2300 seconds of
drying.
• There is no variation in the ion current after 2300 seconds at
those particular process parameters and the same is confirmed
by the Methanol content by Head Space GC analysis.
Mass Spectometry (MS) – Case study 1 (Drying Monitoring for Non Aqueous gran)

94
FTO
0
5
10
15
20
25
0 500 1000 1500 2000 2500 3000 3500 4000
(31
/40
)*1
00
0
Time, sec
31/40*1000ATPMS-PBO-NT-011
The validation batch shows that drying endpoint was reached after 40
minutes. The same was confirmed by Methanol content analysis by GC.
Validation
Mass Spectometry (MS) – Case study 1 (Drying Monitoring for Non Aqueous gran)

95
Eyecon – Particle size analyzer using direct imaging
FTO
• Particle sizing and characterising system
• Non contact system based on direct imaging
• Size range of 50-3000 µm can be measured
• D10, D25, D50, D75, D90,Mean, Median and average aspect ratio can be determined
• Applications of the technology include FBP granulation and coating, extrusion and
spheronization, milling and twin screw granulation processes

96
Eyecon – Case study 1 (Granule growth in Top Spray granulation)
FTO
97
Near Infra Red (NIR) – Case study 1 (Blend uniformity to avoid sampling bias)
FTO
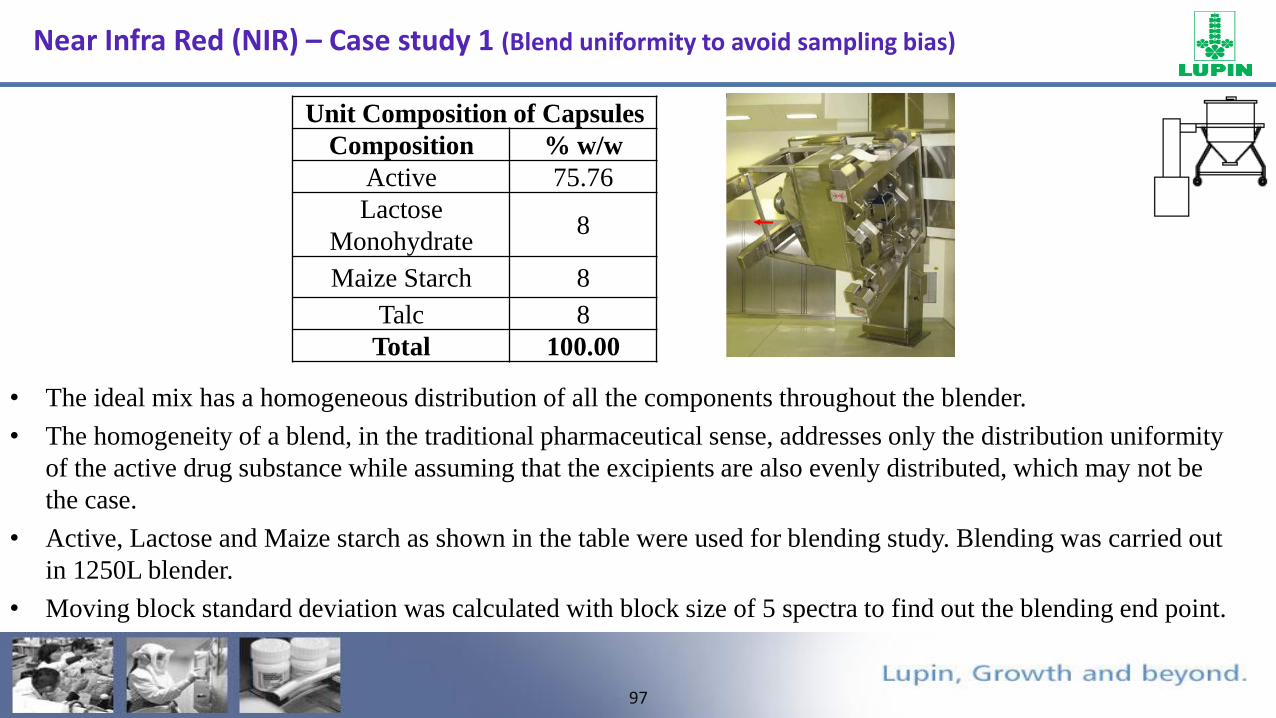
• The ideal mix has a homogeneous distribution of all the components throughout the blender.
• The homogeneity of a blend, in the traditional pharmaceutical sense, addresses only the distribution uniformity
of the active drug substance while assuming that the excipients are also evenly distributed, which may not be
the case.
• Active, Lactose and Maize starch as shown in the table were used for blending study. Blending was carried out
in 1250L blender.
• Moving block standard deviation was calculated with block size of 5 spectra to find out the blending end point.
Unit Composition of Capsules
Composition % w/w
Active 75.76
Lactose
Monohydrate8
Maize Starch 8
Talc 8
Total 100.00
98
FTO
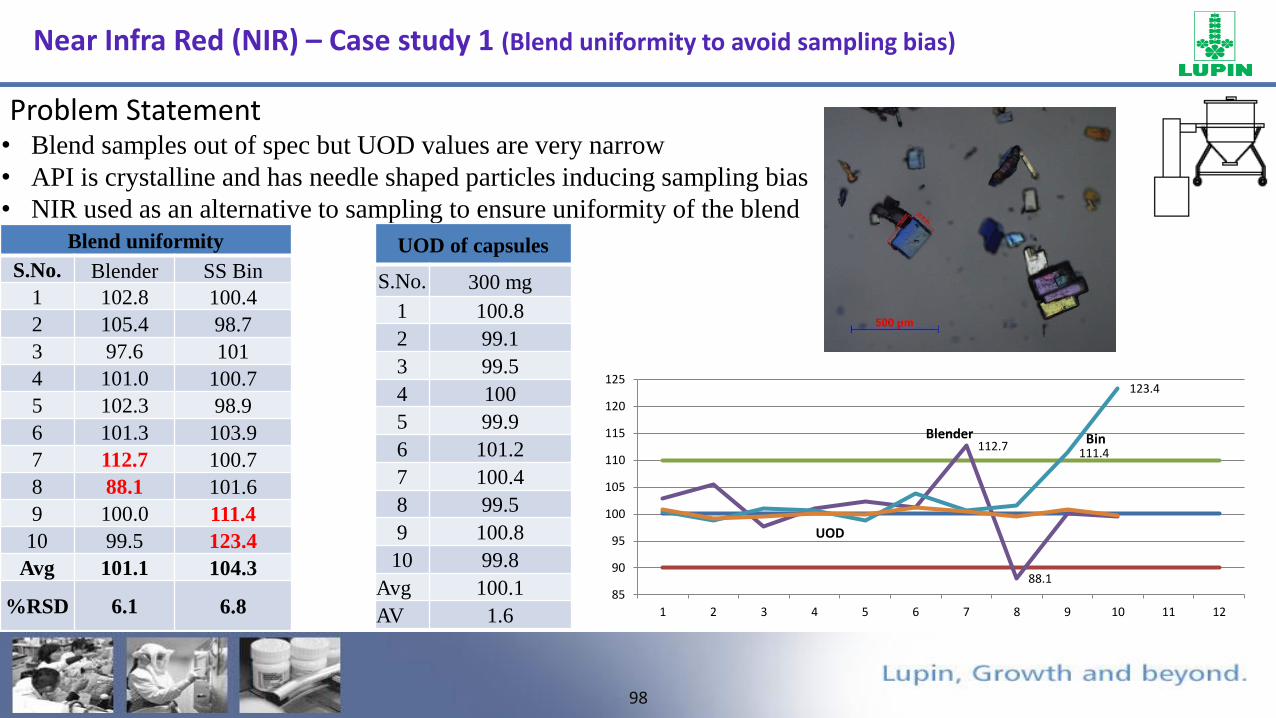
• Blend samples out of spec but UOD values are very narrow
• API is crystalline and has needle shaped particles inducing sampling bias
• NIR used as an alternative to sampling to ensure uniformity of the blend
Problem Statement
Blend uniformity
S.No. Blender SS Bin
1 102.8 100.4
2 105.4 98.7
3 97.6 101
4 101.0 100.7
5 102.3 98.9
6 101.3 103.9
7 112.7 100.7
8 88.1 101.6
9 100.0 111.4
10 99.5 123.4
Avg 101.1 104.3
%RSD 6.1 6.8
UOD of capsules
S.No. 300 mg
1 100.8
2 99.1
3 99.5
4 100
5 99.9
6 101.2
7 100.4
8 99.5
9 100.8
10 99.8
Avg 100.1
AV 1.6
112.7
88.1
111.4
123.4
85
90
95
100
105
110
115
120
125
1 2 3 4 5 6 7 8 9 10 11 12
Blender Bin
UOD
Near Infra Red (NIR) – Case study 1 (Blend uniformity to avoid sampling bias)

99
FTO
Bin
Blender Type OGB
Capaacity(L) 1250
Speed(RPM) 4
Prelubrication
Time(min)40
Lubrication Time(min) 9
Batch conditions
0
0.001
0.002
0.003
0.004
0.005
0.006
0.007
0.008
1 7
13
19
25
31
37
43
49
55
61
67
73
79
85
91
97
10
3
10
9
11
5
12
1
12
7
13
3
13
9
14
5
15
1
15
7
Po
ole
d M
BSD
No. of rotations
Pooled MBSD
0
0.002
0.004
0.006
0.008
0.01
0.012
0.014
0.016
1 5 9
13
17
21
25
29
33
37
41
45
49
53
57
61
65
69
73
77
81
85
89
93
97
10
1
10
5
10
9
11
3
11
7
12
1
12
5
12
9
13
3
13
7
14
1
14
5
14
9
15
3
15
7
Stan
dar
d d
evi
atio
n
No. rotations
API@1688nm
UOD results
Mean 99.4
min 104
max 102.3
AV 4.4
Near Infra Red (NIR) – Case study 1 (Blend uniformity to avoid sampling bias)
100
Where are we heading to – Continuous Manufacturing (Future state in Pharma)
FTO
Why Continuous Process?
• Exploring the design space of a production process will be in hours/ days not months
• There will be no scale up work between development and manufacturing
• Plants will produce “batches” of any size in order to meet market demand
• Quality Assurance of products is continuous, and in real time
• Quality is Assured without relying on end product testing, but process control
• There will less product quality

101


