
1
COOKING FUELS IN HAITI March 2017
Environmental, economic and social assessment of cooking fuels in Haiti for the Global Alliance for Clean Cookstoves.
This report has been prepared to support the Global Alliance for Clean Cookstoves in the development of a multi-year strategy for clean cooking fuels in Haiti for the Government of Canada. The authors’ views expressed in this publication do not necessarily reflect the views of the Global Alliance for Clean Cookstoves, the Government of Canada, the United Nations Foundation, or its partners.

2 COOKING FUELS IN HAITI
ENEA ADVISES AND SUPPORTS INDUSTRIAL AND INSTITUTIONAL ACTORS IN THE ENERGY SECTOR
Author(s): Jacques DE BUCY, Maeva FAURE| Approver: Fabiola GRAVEAUD
Since 2007, ENEA has been advising and supporting leading private sector companies and public authorities
around the world on the topic of energy transition sectors and markets. Through dedicated consulting services and pro bono support to NGOs and social entrepreneurs selected for their high potential impact, ENEA is also
committed to energy access.
Warning: All of the information within this document is the exclusive property of ENEA Consulting. As part of the service delivered, ENEA Consulting grants the client a license for exploitation of the document as defined in the contract for the provision of services. The client formally refrains from using the information provided in the document for purposes other than those defined in the contract for the provision of services and a strictly internal use. Unless explicitly mentioned otherwise, any reproduction, diffusion or use of the information, whether or not in return for payment, for commercial or non commercial use, is strictly forbidden.

ENEA ADVISES AND SUPPORTS INDUSTRIAL AND INSTITUTIONAL ACTORS IN THE ENERGY SECTOR
EXECUTIVE SUMMARY In partnership with the Government of Canada, the Global Alliance for Clean Cookstoves (Alliance) is developing a comprehensive strategy and national action plan for catalyzing the market for clean and efficient cookstoves in Haiti. Following a preliminary market study, the Alliance decided to extend the sector overview with six consultancies, including the present study. The study assesses 7 alternative fuels to charcoal and firewood: improved charcoal, charbriquettes, non-carbonized briquettes, pellets, ethanol, LPG and solar electricity. Comparison between fuels is carried out through an assessment of local biomass resources, a Life Cycle Assessment (LCA) of the environmental and health impacts, economics and social impacts.
Biofuels locally produced in Haiti are environmentally sound for a clean fuel strategy. However, local biomass resources suited to produce biofuels are limited compared to the cooking energy demand of the country.
The LCA of the biofuel options assessed demonstrate their high CO2 emission reduction potential if substituted for traditional charcoal (2.5 to 3 kgCO2/MJdelivered). However, the resource assessment shows a limited potential to scale with locally produced biofuels due to the low and variable production of biomass from agricultural activities in Haiti. The scenarios developed indicate that 27 to 51% of the urban households’ demand for cooking energy could be theoretically served with biofuels. Charbriquettes, ethanol and pellets are the most promising biofuels identified while non-carbonized briquettes can be produced in limited volumes and solar electricity is not cost competitive for cooking purposes.
The development of clean fuels in Haiti is expected to improve the social and economic wellbeing of end-users but may have a negative impact on jobs along the value chain.
The use of cleaner and more efficient fuels will benefit end-users thanks to time savings in cooking and thanks to a reduced exposure to smoke and particulates. However, charcoal-making is a significant source of jobs and income for farmers possibly threatened by the development of alternative fuels. Developing improved charcoal production techniques and biofuels locally produced are the best options to develop the clean fuels sector while creating local value partly oriented towards farmers.
ENEA recommends the Alliance build a strategy based on four pillars to be conducted in parallel:
reduce kiln emissions and wood withdrawal with improved charcoal production kilns, reduce the demand for charcoal with improved cooking stoves, reduce the demand for charcoal with alternative fuels already proven (charbriquettes and LPG), investigate the potential of innovative fuels (ethanol locally produced and pellets) for large scale
deployment.
Limitations in the availability of local biomass prevent a strategy based on local biofuels from having a significant impact on the cooking sector in Haiti. The improvement of charcoal production techniques is a key lever to reduce the demand for wood and the emission of greenhouse gases of the sector. The combined use of improved cookstoves is key to reduce the demand for charcoal.
In parallel, alternative fuels should be developed, starting with the most promising among those already proven: charbriquettes and LPG. LPG is an attractive option but still requires consumer finance services and political intervention to regulate the market. Ethanol and pellets have a high potential but should first be demonstrated at pilot scale to prove their competitiveness and market adoption. Moreover, in-depth surveys and analyses on land use and agricultural practices in Haiti are required to precisely assess the extent to which energy crops can be grown and existing agricultural residues can be recovered without damage on preexisting agricultural activities or on soil fertility.

4 COOKING FUELS IN HAITI
ENEA ADVISES AND SUPPORTS INDUSTRIAL AND INSTITUTIONAL ACTORS IN THE ENERGY SECTOR
TABLE OF CONTENTS Executive summary 3
Acronyms 6
1 Introduction 7
1.1 Context 7
1.2 Objectives 7
1.3 Scope and method 7
1.4 Description of fuels & value chains 8
2 Resource assessment 11
2.1 Method 11
2.1.1 Approach 11
2.1.2 Scenarios 12
2.2 Results 16
2.2.1 Potential 16
2.2.2 Seasonality 18
2.2.3 Geographical distribution 19
3 Environmental impacts 21
3.1 Method 21
3.2 Results 22
3.2.1 Global climate change potential 22
3.2.2 Black carbon and short lived climate pollutants 24
3.2.3 Total energy demand 25
3.2.4 Fossil fuel depletion 25
3.2.5 Water consumption 26
3.2.6 Particulate matter formation 27
4 Cost of fuels 28
4.1 Method 28
4.1.1 Scenarios 28
4.1.2 Cost breakdown 28
4.2 Results 30
5 Social impacts 32
5.1 Livelihoods along the value chain 32
5.2 Household social and economic wellbeing 34
5.3 Impact of fuel switch 36

ENEA ADVISES AND SUPPORTS INDUSTRIAL AND INSTITUTIONAL ACTORS IN THE ENERGY SECTOR
6 Conclusions and recommendations 38
7 Research gaps 41
8 Appendix 46
8.1 List of interviewees 46
8.2 Bloc flow diagrams of fuels value chain 48
8.3 Main assumptions in the LCA model 51
8.4 Input data of the LCA model 57
8.5 Definition of the Levelized Cost of Energy 66
8.6 Input data of fuel economics 67
8.7 Categories of social impact in the Monitoring & Evaluation frame of the Alliance 74
8.8 Feedback from the interviews and literature review on social aspects of the fuels value chains 76
8.9 Summary of information collected on LPG 78

6 COOKING FUELS IN HAITI
ENEA ADVISES AND SUPPORTS INDUSTRIAL AND INSTITUTIONAL ACTORS IN THE ENERGY SECTOR
ACRONYMS BC: Black carbon
CRI: Carbon Roots International
ENPA: Enquête Nationale sur la Production Agricole (National Survey on Agricultural Production)
fNRB: Fraction of non-renewable biomass
GHG: Greenhouse Gas
GSB: Green Social Bioethanol
LCA: Life Cycle Analysis
LCOE: Levelized Cost of Energy
M&E : Monitoring and Evaluation
PaP: Port-au-Prince
PM : Particulate matter
SLCP: Short-lived climate pollutants

ENEA ADVISES AND SUPPORTS INDUSTRIAL AND INSTITUTIONAL ACTORS IN THE ENERGY SECTOR
1 INTRODUCTION
1.1 Context
Haïti suffers from high levels of poverty and limited economic growth; its development has been strongly impacted by the recent natural disasters such as the 2010 earthquake or Hurricane Matthew in October 2016. Firewood and wood charcoal are still massively used for cooking in the country, which has a very detrimental effect on environment and household health. Clean cooking markets must be developed in order to offer alternatives to traditional charcoal. The Government of Canada partnered with the Global Alliance for Clean Cookstoves (also called "the Alliance") to develop clean cooking markets with a five-year clean cooking program launched in mid-2016.
The Alliance initiated this program with a preliminary market study, and decided to extend the market overview with six consultations, among which the present study was included. It provides an assessment of potential alternative cooking fuels in order to target the most relevant pathways in terms of environment and economic impacts for the Alliance clean cooking program.
1.2 Objectives
The objective of the study is to identify the most promising fuels in terms of potential environmental and social impacts. Comparison between fuels is carried out through an evaluation of:
Available feedstock in Haïti in order to assess the scalability of locally produced biofuels Environmental impacts for each fuel based on a Life Cycle Assessment The overall cost of cooking options (cost of fuel and stove), based on the Levelized Cost of Energy Social impacts, with a qualitative analysis based on the Alliance M&E framework
1.3 Scope and method
ENEA was the lead consultant for the study and partnered with Quantis and local Haitian partner, Palmis Enèji (Entrepreneur du Monde), to respectively provide the LCA model and conduct the field interviews. Input data for the analyses was collected through extensive literature review and field interviews (see Appendix §8.1).

8 COOKING FUELS IN HAITI
ENEA ADVISES AND SUPPORTS INDUSTRIAL AND INSTITUTIONAL ACTORS IN THE ENERGY SECTOR
The study focuses on fuels and does not analyze the impact of improved cooking stoves. However, each fuel had to be modeled in combination with a stove and a given efficiency. The fuel pathways assessed in the present study are:
Firewood used in three stone fire (stove efficiency: 14.3%) Charcoal produced from traditional kilns (kiln energy efficiency: 22% minimum, 44% maximum) and used
in conventional charcoal stoves (stove efficiency: 22.2%) Charcoal produced from improved kilns (kiln energy efficiency: 44% minimum, 59% maximum) and used
in conventional charcoal stoves (stove efficiency: 22.2%) Carbonized briquettes – from agricultural residues and bagasse, used in conventional charcoal stoves
(stove efficiency: 22.2%) Non carbonized briquettes – from waste paper and sawdust, used in forced draft gasifier stoves (stove
efficiency: 40.0%) Pellets – from sugarcane and sweet sorghum, used in conventional briquette stoves (stove efficiency:
40.0%) Liquefied Petroleum Gas (LPG) used in conventional LPG stoves (stove efficiency: 52.5%) Ethanol (1st generation) – from sugarcane and sweet sorghum, used in conventional ethanol stoves
(stove efficiency: 52.5%)
The resource assessment only reviews the potential for locally produced biofuels: ethanol, carbonized briquettes, pellets and non-carbonized briquettes.
Environmental impacts are evaluated with the Life Cycle Assessment methodology through six indicators:
Global climate change potential Black carbon and short lived climate pollutants Total energy demand Fossil fuel depletion Water withdrawal Particulate matter (PM2.5) formation
The economic analysis is also based on a life cycle approach including a calculation of the Levelized Cost of Energy for life cycle stages involving capital costs (raw material processing and stove).
The social impacts review qualitatively assesses the expected impacts of a switch from a traditional fuel (firewood or charcoal) to a alternative fuel (e.g. charbriquettes, LPG…), based on a qualitative ranking of each fuel for a series of categories of impacts listed in the Alliance's M&E framework.
1.4 Description of fuels & value chains
This section gives an overview of the value chain of traditional fuels used in Haïti and the possible alternative fuels covered in this study.
Traditional fuels are:
Firewood, mainly used by rural households. Wood is collected in nearby forests and used close to the collection site.
Traditional charcoal, mainly used by urban households. Wood is collected in forests and carbonized in poor-quality kilns (earth mound kilns typically). Charcoal is then transported to wholesalers and sold to consumers by retailer.

ENEA ADVISES AND SUPPORTS INDUSTRIAL AND INSTITUTIONAL ACTORS IN THE ENERGY SECTOR
Alternative fuels are:
Improved charcoal, similar to traditional charcoal except that wood is carbonized in improved kilns with higher mass yields and lower emissions of unburnt gases (kilns made of bricks and cement typically). This value chain does not exist in Haiti currently.
Carbonized briquettes or charbriquettes, made from carbonized agricultural residues (stems, leaves, cobs or straws) left on the fields, or bagasse, the by-product of sugar cane juice extraction. Only one company produces charbriquettes in Haiti currently (Carbon Roots International).
Non-carbonized briquettes, made from a mix of sawdust and compacted waste paper and cardboard. Only one company produces non-carbonized briquettes in Haiti currently (El Fuego del Sol).
Pellets, made from shredded and high-pressure compacted non-carbonized bagasse. This value chain does not exist in Haiti currently.
Ethanol, locally produced from sugarcane juice fermentation and distillation process. Sweet sorghum is also a possible feedstock for ethanol production. This value chain does not exist in Haiti currently, however, a market uptake phase has been launched with imported ethanol produced in the US (Novogaz in Haiti and POET in the US).
LPG, imported from the U.S. and sold by retailers in re-usable cylinders. This value chain has been emerging in Haiti for a decade with two authorized importers (TOTAL and Sodigaz) and with several formal retailers as well as informal retailers, mostly active in Port-au-Prince (PaP).
Electricity from a solar based microgrid equipped with solar panels and batteries. A pilot of a hybrid microgrid (solar and diesel genset) is currently operated by the company EarthSpark in Haiti but does not comprise cooking services.
Bloc diagrams of the different fuel value chains are provided in Appendix (see §8.2). Figure 1 presents the feedstock needed for the production of each fuel considered in the study.
Figure 1 – Fuels and feedstock covered in the study
Electricity
LPG
Ethanol
Pellets
Charbriquettes
Non-carbonized briquettes
Improved charcoal
Traditional charcoal
from importation
from solar microgrid
Wood
Waster paper and sawdust
Agricultural residues
Bagasse
Juice
SugarcaneSweet sorghum
Rice
Maïze
Feedstock Fuels
Crops

10 COOKING FUELS IN HAITI
ENEA ADVISES AND SUPPORTS INDUSTRIAL AND INSTITUTIONAL ACTORS IN THE ENERGY SECTOR
This study covers the full value chain of fuels (see Figure 2) and thus differentiates the following value chain segments:
Raw material supply: raw material is collected from production sites, such as crop fields where agricultural residues are collected, or the distilleries where bagasse is a by-product of alcohol production. Feedstock is then transported to processing sites.
Processing: the raw materials are transformed with dedicated equipment, with possible need for energy input and capital investments in equipments.
Distribution and sales: the fuel is packaged and transported to wholesalers, then transported and sold to retailers with a possible second packaging step and then sold to the end-user.
End-use: the fuel is consumed in a dedicated stove by a household1 for cooking purpose.
Figure 2 – Stages of fuels value chain
1 The market of restaurants and institutions (e.g. schools) is not the focus of this study but represents a non negligible share of cooking uses in Haiti.
Consumption by electric fire
Combustion in LPG stove
Combustion in ethanol stove
Combustion in gasifierstoves
Combustion in traditional charcoal stoves
LPG importation Electricity produced by solar microgrid
Saw mills, waste plants
Forest
Processing End useRaw material supply
Packaging and transport
Distribution and sales
Distilleries
Crop fields
Carbonization
Juice extraction, Distillation
Shredding and briquetting
Carbonization (optional), briquetting/pelleting
CharcoalCharbriquettes
Non carbonized briquettesPellets
Ethanol
LPG
Electricity
Wood
Saw dustWaste paper
Bagasse
Agricultural residues
Whole crop

ENEA ADVISES AND SUPPORTS INDUSTRIAL AND INSTITUTIONAL ACTORS IN THE ENERGY SECTOR
2 RESOURCE ASSESSMENT Among the alternative fuels described in §1.4, a number are based on local resources: charbriquettes are based on agricultural residues or byproducts, pellets and ethanol are based on sugarcane processing or sweet sorghum, and non-carbonized briquettes on waste paper. This section aims at assessing the available resources in Haïti to estimate the number of households that can be reached by alternative fuels if they are produced in Haïti.
2.1 Method
2.1.1 Approach
Charbriquettes, pellets and ethanol are based on maize, rice, sorghum and sugarcane productions. Agricultural production figures are from the National Survey on Agricultural Production (Enquête Nationale de la Production Agricole) or ENPA) 2014 [1], a national survey conducted by the Ministry of Agriculture that records production figures by type of crop and by season and in every of the 10 Haïtian departments(see Figure 3).
Figure 3 –2014 harvest of primary crops producing raw materials for the alternative fuels
Ideally, data from surveys conducted in other years should have been used for comparison with the ENPA 2014 but such data are not available. In the past decade, crop production fluctuated significantly from year to year because of weather variability, natural disasters, decreasing yields due to degradation of soil and irrigation infrastructure and variable access to fertilizers [2]. For instance, the year 2014 can be considered as a "low production" year, with cereals2 production reaching half of the production of the year 20133 [2]. For some
2 “Cereals” include rice, maize and sorghum.
3 2013 achieves a high crop yields thanks to favourable climatic conditions and availability of fertilizers [46].
0
50 000
100 000
150 000
200 000
250 000
Sugar cane Rice Maize Sorghum
Crop production (tons)
Seasonal repartition of 2014 crop production
Spring
Winter
Autumn

12 COOKING FUELS IN HAITI
ENEA ADVISES AND SUPPORTS INDUSTRIAL AND INSTITUTIONAL ACTORS IN THE ENERGY SECTOR
specific crops such as sugar cane, lands harvested also decreased since the 80's because of the higher competitiveness of imported products (i.e. sugar in the case of the sugar cane sector).
Waste paper resource is calculated based on the importations of cardboard and paper in Haiti (18.25 Mt in 2009) [3]. This figure does not take into account the additional resource from cardboard packaging, but takes into account the quantity of paper that cannot be recycled (toilet paper…). These quantities are assumed to balance each other [3].
The resource assessment for locally produced fuels is based on a historical scenario and three prospective scenarios designed to explore a theoretical evolution in crop production, taking into consideration the variability of agricultural production (see §2.1.2).
The quantity of agricultural residues produced in Haiti is calculated with the 2014 crop production at a national level and the mass ratio between crop and residue (e.g. mass of maize stem, leaves and stover produced for one ton of maize grain). Losses of feedstock during the fuel processing step are also taken into account. For each fuel, we calculated the chemical energy of combustion per mass unit (Lower Heating Value) and the final energy delivered to the cooking pot (cooking energy) based on the efficiency of the stove.
The average cooking energy demand by urban households is estimated based on the average charcoal consumption in PaP (2.3 kg/household/day) [4] and the urban population (1,218,242 households) [5]. Finally, the cooking energy potentially delivered by a fuel, given the raw material produced in a year, is compared to the annual cooking energy demand of urban households in order to estimate the number of urban households whose cooking energy demand could be fully covered by the fuel. The rural market is not considered for this analysis.
𝑃𝑜𝑡𝑒𝑛𝑡𝑖𝑎𝑙 𝑑𝑒𝑙𝑖𝑣𝑒𝑟𝑒𝑑 𝑒𝑛𝑒𝑟𝑔𝑦𝑓𝑒𝑒𝑑𝑠𝑡𝑜𝑐𝑘
= 𝐶𝑟𝑜𝑝 (𝑡) ∗ 𝑅𝑒𝑠𝑖𝑑𝑢𝑒 𝑟𝑎𝑡𝑖𝑜 (𝑘𝑔𝑟𝑒𝑠𝑖𝑑𝑢𝑒
𝑘𝑔𝑐𝑟𝑜𝑝 ) ∗ 𝑃𝑟𝑜𝑐𝑒𝑠𝑠𝑖𝑛𝑔 𝑦𝑖𝑒𝑙𝑑 (
𝑘𝑔𝑓𝑢𝑒𝑙
𝑘𝑔𝑟𝑒𝑠𝑖𝑑𝑢𝑒)
∗ 𝐿𝐻𝑉 (𝑀𝐽𝑝𝑜𝑡𝑒𝑛𝑡𝑖𝑎𝑙
𝑘𝑔𝑟𝑒𝑠𝑖𝑑𝑢𝑒) ∗ 𝑆𝑡𝑜𝑣𝑒 𝑒𝑓𝑓𝑖𝑐𝑖𝑒𝑛𝑐𝑦 (
𝑀𝐽𝑑𝑒𝑙𝑖𝑣𝑒𝑟𝑒𝑑
𝑀𝐽𝑝𝑜𝑡𝑒𝑛𝑡𝑖𝑎𝑙)
𝑁𝑢𝑚𝑏𝑒𝑟 𝑜𝑓 ℎ𝑜𝑢𝑠𝑒ℎ𝑜𝑙𝑑𝑠 𝑎𝑏𝑙𝑒 𝑡𝑜 𝑟𝑒𝑝𝑙𝑎𝑐𝑒 𝑐ℎ𝑎𝑟𝑐𝑜𝑎𝑙
=𝐻𝑜𝑢𝑠𝑒ℎ𝑜𝑙𝑑 𝑦𝑒𝑎𝑟𝑙𝑦 𝑐ℎ𝑎𝑟𝑐𝑜𝑎𝑙 𝑐𝑜𝑛𝑠𝑢𝑚𝑝𝑡𝑖𝑜𝑛 ∗ 𝐿𝐻𝑉𝑐ℎ𝑎𝑟𝑐𝑜𝑎𝑙 ∗ 𝑆𝑡𝑜𝑣𝑒 𝑒𝑓𝑓𝑖𝑐𝑖𝑒𝑛𝑐𝑦𝑐ℎ𝑎𝑟𝑐𝑜𝑎𝑙
𝑃𝑜𝑡𝑒𝑛𝑡𝑖𝑎𝑙 𝑑𝑒𝑙𝑖𝑣𝑒𝑟𝑒𝑑 𝑒𝑛𝑒𝑟𝑔𝑦𝑓𝑒𝑒𝑑𝑠𝑡𝑜𝑐𝑘
2.1.2 Scenarios
A “historical” scenario illustrates current situation of the agriculture sector using 2014 figures based on historically low productivity. Two scenarios called "Theoretical potential - conservative" and "Theoretical potential – middle" aim at representing a near term situation (i.e. in 3 to 5 years) with same areas harvested than the ones harvested in 2014 for all crops except sugar cane for which we assume a reasonable increase of the area harvested (enabling the production of ethanol on top of the current production of alcoholic beverage) and taking into account the high variability of crop production in Haiti. The third scenario called "Theoretical potential - aggressive" aims at representing a longer term and very ambitious ethanol-based scenario. For each scenario, the results in terms of production potential must be taken as a maximum theoretical value because calculations assume that all the raw materials produced are used for fuel production while this biomass is not necessarily available (there are competitive uses), nor accessible (biomass available in remote locations). Table 1 summarizes the assumptions used in the three scenarios and the numbers of households that can be reached accordingly.

ENEA ADVISES AND SUPPORTS INDUSTRIAL AND INSTITUTIONAL ACTORS IN THE ENERGY SECTOR
Assumptions
Scenarios
Maize and Rice
assumption
Sugarcane assumption Sweet Sorghum
Maximum households (HHs) reached
2014 (Historically Low Productivity”
Same as 2014 production
Same as 2014 production: entirely dedicated to alcoholic production; 100% of bagasse for solid fuel
None
Theoretical Potential – Conservative
Same as 2014 production
Twice 2014 production:
Same as 2014 production left for alcohol beverage market; 100% of bagasse for solid fuel
Same as 2014 production dedicated to ethanol cooking fuel; 37% of bagasse for solid fuel
Provides the same amount of grain than 2014 conventional sorghum grain production
2014 equivalent production dedicated to ethanol fuel4
37% of by-product bagasse dedicated to solid fuel
Fuel mix 1 (pellets) :497 509 HHs Fuel mix 2 (CB): 333 746 HHs
Theoretical Potential - Middle
Twice 2014 production
Four times 2014 production:
Twice 2014 production left for alcohol beverage market; 100% of bagasse for solid fuel
Twice 2014 production dedicated to ethanol cooking fuel; 37% of bagasse for solid fuel
Fuel mix 1 (pellets) : 618 138 HHs Fuel mix 2 (CB): 436 012 HHs
Theoretical Potential - Aggressive
Twice 2014 production
10.6 times 2014 production:
Twice 2014 production left for alcohol beverage market; 100% of bagasse for solid fuel
8.6 times 2014 production dedicated to ethanol cooking fuel; 37% of bagasse for solid fuel
Fuel mix 1 (pellets) : 1 089 887 HHs Fuel mix 2 (CB): 785 339 HHs
Common Assumptions
Stems, cobs and leaves are collected from maize fields
Rice straws are collected from rice fields
Stems and leaves are collected from sugarcane and sweet sorghum fields
Ethanol is produced from dedicated sugarcane and sweet sorghum cane
100% of by-product bagasse is collected from sugarcane alcoholic beverage production
37% of bagasse is collected from sweet sorghum and sugarcane ethanol fuel production
Fuel Mix Assumptions
CB scenario: all bagasse from sugarcane and sweet sorghum is used in charbriquettes Pellets scenario: all bagasse from sugarcane and sweet sorghum is used in pellets
Table 1 – Assumptions for resource assessment scenarios
4 Sweet sorghum whole crop provides simultaneously the equivalent of conventional sorghum grain and the sweet sorghum cane that can be used to produce ethanol

14 COOKING FUELS IN HAITI
ENEA ADVISES AND SUPPORTS INDUSTRIAL AND INSTITUTIONAL ACTORS IN THE ENERGY SECTOR
Common assumptions across all three scenarios
In all scenarios, sweet sorghum is assumed to fully replace conventional sorghum5 and is harvested in order to provide the equivalent of 2014 levels of sorghum grain production6. This is an optimistic assumption regarding ethanol and bagasse resource assessments because sweet sorghum is still in an experimental pilot status in Haiti and its development in the coming years is not guaranteed. However, the benefit of sweet sorghum is that it produces additional by-products: sweet sorghum juice that can be transformed in ethanol or sugar similarly to sugarcane, and sweet sorghum bagasse that can be transformed into ethanol or charbriquettes. Sweet sorghum stems and leaves are deemed not abundant enough to be used for charbriquettes, as it is a crop selected to maximize grain yield and minimize residue.
National sugarcane is currently processed to produce “clairin”, a local alcoholic beverage. If the sugarcane were used to produce ethanol, it would compete with sugar cane use for clairin. Economics and current demand for clairin tend to play in favor of this market compared to ethanol. Therefore, for the purposes of this modeling, it was assumed that current production of sugar cane for the clairin market would remain steady and that additional lands for sugar cane must be harvested to give a chance for the ethanol market to develop.
Sugarcane processing in distilleries dedicated to alcoholic beverage production generates surplus bagasse after juice extraction. Even though the distilleries need fuel to operate, they cannot use the surplus bagasse because of technical limitations. The totality of by-product bagasse from alcoholic beverage sector is assumed to be used in pellets or charbriquettes.
Sugarcane and sweet sorghum processing in distilleries dedicated to ethanol fuel production also generates surplus bagasse. These potential distilleries are more technologically advanced than alcoholic beverage distilleries: they can burn a part of the by-product bagasse to supply their energy needs. 3.6 tons of bagasse are consumed per ton of ethanol in distilleries [6], which leaves 37% of bagasse surplus to be used in charbriquettes or pellets.
Scenario “2014 (Historically low productivity)” assumptions
Yields and areas harvested are the same than those observed in 2014, for maize, rice and sugarcane. Farmers only grow conventional sorghum; sweet sorghum is still at the pilot project stage. There is no ethanol production as harvested sugarcane is entirely dedicated to the alcoholic beverage
sector, but bagasse by-product from this sector is available for alternative fuel production.
Scenario “Theoretical Potential - Conservative” assumptions
For maize and rice, crop production is assumed to be identical to 2014 production [1] For sugar cane, lands harvested are assumed to be doubled compared to 2014: 30,000 ha instead of
15,000 ha [7], which is deemed realistic if the ethanol market is economically attractive for farmers. Sugarcane farming would then produce the same quantity of alcoholic beverage as 2014 production levels and would produce ethanol cooking fuel from the 15,000 additional hectares. The yield for sugar cane harvesting is considered similar to that of the year 2014 (15 t/ha) [7, 1].
5 Sweet sorghum is very close to conventional sorghum: it provides the same type of grain. However, the cane of sweet sorghum is different from conventional sorghum cane as it is high in sugar and provide juice that can distillated into ethanol fuel.
6 Sorghum production is decreasing sharply because of aphids infestation. A solution to maintain current production levels would be to replace sorghum by sweet sorghum, a crop selected for robustness and higher grain yield.[23]
ENEA ADVISES AND SUPPORTS INDUSTRIAL AND INSTITUTIONAL ACTORS IN THE ENERGY SECTOR
Scenario “Theoretical Potential - Middle” assumptions
The yields of all crops except sweet sorghum7 are doubled compared to the “Theoretical Potential - conservative” scenario. This assumption represents the variability of production observed in the cereal sector [2].
As in the “Theoretical – conservative” scenario, land harvested for sugarcane is double that of 2014, half for alcohol production, half for ethanol cooking fuel production.
Scenario “Theoretical Potential - Aggressive” assumptions
Yields and areas harvested are equivalent to that of the “Theoretical potential - middle” scenario except for areas of sugar cane harvested.
Sugar cane is assumed to be harvested on the same amount of land area as the historical peak of the sector in the 1980's: 80,000 ha [7] which is an optimistic assumption. 65,000 ha of that quantity is assumed to be dedicated to ethanol in order to maintain 15,000 dedicated to the current alcoholic beverage market.
The feasibility of such scenarios remains uncertain due to competitive uses of arable lands. A large scale use of sugar cane (65,000 ha) would represent a non negligible share (12%) of the total arable land in Haiti (560,000 ha) [8]. Farming plots in Haiti represent approximately 1 million hectares and more than 95% of them were used for agriculture in 2012 [9]. No clear statement can be made on the feasibility of growing additional lands of sugar cane in Haiti without jeopardizing other crops, with the public data currently available. Doubling the areas of sugarcane harvested in the "Theoretical potential - conservative" and "Theoretical potential - middle" scenarios is deemed more feasible but this still requires to be confirmed with in-depth analysis of the agricultural sector and land use in Haiti.
7 Sweet sorghum yield is already optimized with adapted agricultural practices and crop selection.
16 COOKING FUELS IN HAITI
ENEA ADVISES AND SUPPORTS INDUSTRIAL AND INSTITUTIONAL ACTORS IN THE ENERGY SECTOR
Fuel mix assumptions
Alternative fuels based on agricultural feedstock can be developed simultaneously8, with the exception of pellets and charbriquettes both using bagasse from sugarcane and sweet sorghum9. Two pathways are illustrated in the calculations:
1. The bagasse in the scenarios is entirely dedicated to pellet production. Charbriquettes are made from rice husks, maize stems, cobs and leaves and sugarcane stems and leaves.
2. The bagasse is entirely dedicated to producing charbriquettes. Charbriquettes are made from rice husks, maize stems, cobs, leaves and sugarcane stems and leaves, as well as bagasse from sugarcane and sweet sorghum. There is no production of pellets.
2.2 Results
2.2.1 Potential
Figure 4 shows the share of the total number of urban households in Haiti10 that can fully substitute traditional charcoal with an alternative fuel, based on 2014 annual crop productions and yields [1] and the scenarios described in §2.1.2.
8 Maize, rice, sugarcane and sorghum can be harvested simultaneously in the three scen arios described. Stems and leaves, bagasse and ethanol from sugarcane can also be exploited simultaneously.
9 If produced simultaneously, pellets and charbriquettes from bagasse will compete for the feedstock supply. The two pathways presented illustrate two extreme scenarios: bagasse is entirely used for pellets or entirely used for charbriquettes. In practice, both could be developed simultaneously, depending on the market demand.
10 Urban households mainly cook with charcoal whereas rural households would rather use firewood. As charcoals is more expensive than firewood, urban consumers should be the privileged target of a fuel switching campaign.

ENEA ADVISES AND SUPPORTS INDUSTRIAL AND INSTITUTIONAL ACTORS IN THE ENERGY SECTOR
Figure 4 – Share of urban households whose cooking energy demand can be fully covered by alternative fuels according to three scenarios and two paths of fuel mix
In the “2014 (Historically low productivity)” scenario, 8 to 12% of urban households – about 100 000 to 150 000 – could replace charcoal with locally produced fuels. In the “theoretical potential - conservative” and “theoretical potential - middle” scenarios, 27% to 51% of the urban households – between 333 746 and 618 138 households – could be served on a cooking energy basis if all the raw material produced in the current situation were collected and converted into cooking fuels. These results must be considered as a maximum theoretical potential for biomass-based fuels locally produced in Haiti. The actual potential is necessarily lower than estimated in Figure 4 when taking into consideration the actual availability and accessibility of raw materials in the country.
0%
10%
20%
30%
40%
50%
60%
70%
80%
90%
100%
2014
(historically low
production)
Theoretical
potential -conservative
Theoretical
potential -middle
Theoretical
potential -aggressive
2014
(historically low
production)
Theoretical
potential -conservative
Theoretical
potential -middle
Theoretical
potential -aggressive
Bagasse surpluses are used in charbriquettes Bagasse surpluses are used in pellets
Shar
e o
f urb
an h
ou
seh
old
s w
ho
se c
oo
kin
g en
ergy
dem
and
can
be
fully
co
vere
d b
y
alte
rnat
ive
fuel
s
Share of urban households whose cooking energy can be fully covered by alternative fuels
Waste paper briquettes Charbriquettes - maize
Charbriquettes - rice Charbriquettes - sugar cane stems
Charbriquettes - sugar cane bagasse Charbriquettes - sweet sorghum bagasse
Pellets - sugar cane bagasse Pellets - sweet sorghum bagasse
Ethanol - sugar cane Ethanol - sweet sorghum

18 COOKING FUELS IN HAITI
ENEA ADVISES AND SUPPORTS INDUSTRIAL AND INSTITUTIONAL ACTORS IN THE ENERGY SECTOR
Charbriquettes is the local biofuel most exposed to the risk in terms of raw materials. Agricultural residues contribute the most potential for charbriquettes but their collection in field is challenging compared to collection of centralized bagasse in distilleries:
Feedstock is dispersed over several small and remote farming sites Transport of feedstock is costly as non-processed feedstock has little energy density On-site processing requires qualified workforce A part of agricultural residues is already used for compost or animal feeding. However, the share of raw
agricultural residues with competitive uses cannot be estimated at this stage11.
Bagasse resources for charbriquettes or pellet production is available at processing mills and thus more easily accessible than agricultural residues left on the field. Figures provided on the potential of bagasse in this study account for the self-consumption of the bagasse as a fuel in ethanol distilleries. However, the surpluses of bagasse could also be used for other energy purposes such as fuel in bakeries or industrial kilns. Even though there is currently very little local production of ethanol for cooking uses, the value chain of ethanol as a fuel should not be difficult to implement, as it very similar to the value chain of alcoholic beverage production.
Overall, the potential for biomass-based fuels locally produced in Haiti in the “2014”, or even the "theoretical - conservative” and "theoretical - middle" scenarios is relatively low. A combination of fuels including at least charbriquettes and ethanol is required to cover a significant share of the cooking energy demand of urban households. Bagasse conversion into pellets instead of charbriquettes is a possible path to increase12 the cooking energy delivered by the overall fuel mix, thanks to the higher energy efficiency of pellets compared to charbriquettes13 on a raw biomass to final energy basis.
The “Theoretical potential - aggressive” scenario offers a significant increase in the share of urban households reached thanks to the combined increase of ethanol and solid fuels produced from bagasse. The cooking energy possibly delivered by the fuel mixes in this scenario reaches the equivalent of 64% to 89% of the urban households needs – 785 339 to 1 089 887 households. The development of an extensive sugar cane sector dedicated to energy could thus enable local fuels to play a significant role in the cooking sector.
2.2.2 Seasonality
Figure 5 and Figure 6 display the fuel production by season for the "theoretical - conservative" scenario in order to represent seasonal variations due to agricultural seasonality. The national survey on agriculture (ENPA) reports data on three seasons of different duration: autumn (4 months, August-November), winter (3 months, December-February) and spring (5 months, March-July).
Whatever the fuel, about a half of the production takes place during spring and the remaining production is relatively balanced between winter and autumn. This seasonal variability must be balanced with the longer duration of the spring season and is not deemed to be a significant challenge for the steady supply of customers, if is anticipated by the value chain stakeholders with sufficient storage capacities.
11 This estimation would require a significant work of survey to observe agricultural practices in Haiti and uses of agricultural residues.
12 With bagasse processed into pellets instead of charbriquettes, the number of households covered is increased by 34% to 40% in the "Theoretical - conservative" and "Theoretical - middle" scenarios respectively.
13 In the model used, the cooking to biomass energy ratio of bagasse pellets is 3.4 time higher than for bagasse charbriquettes. This is the result of the energy losses during the carbonization process and the lower efficiency of the stove used for charbriquettes (charcoal stove with 22% efficiency) compared to the pellet stove (40% efficiency)

ENEA ADVISES AND SUPPORTS INDUSTRIAL AND INSTITUTIONAL ACTORS IN THE ENERGY SECTOR
Figure 5 – Distribution of feedstock production (on an energy delivered basis) by fuels and by season in the “theoretical potential - conservative” scenario
Figure 6 - Distribution of feedstock production (on an energy delivered basis) by season and by fuel in the “theoretical potential - conservative” scenario
2.2.3 Geographical distribution
Transport does not represent a major issue to the development of fuels from agricultural production. According to resource assessment per Haitian department with “Theoretical potential – conservative” scenario, feedstock production is close to main urban areas. Figure 7 shows that fuel production would be mainly concentrated in the central western part of Haiti, close to the three main cities of the country, Port-au-Prince (2.3 million inhabitants), Cap-Haïtien and Gonaïves (both between 200,000 and 350,000 inhabitants) [5]. Transport of fuels locally produced would still be required to address the most paramount urban market of the country: Port-au-Prince.
20%
29%51%
Carb. briquettes
22%
38%
40%
Ethanol
Autumn
Winter
Spring
17%
34%
49%
Pellets
0
10 000
20 000
30 000
40 000
50 000
60 000
70 000
Carb. briquettes
Pellets Ethanol Wastepaper
Carb. briquettes
Pellets Ethanol Wastepaper
Carb. briquettes
Pellets Ethanol Wastepaper
Autumn Winter Spring
Nu
mb
er
of h
ou
seh
old
s re
ach
ed
Maize stems, leaves & stovers Rice straws Sugarcane stems & leaves
Sugarcane bagasse Sweet sorghum bagasse Sugarcane ethanol
Sweet sorghum ethanol Waste paper

20 COOKING FUELS IN HAITI
ENEA ADVISES AND SUPPORTS INDUSTRIAL AND INSTITUTIONAL ACTORS IN THE ENERGY SECTOR
Figure 7 - Distribution of feedstock production (on an energy delivered basis) by department and by fuel in the “theoretical - conservative” scenario
736k
22k
108k
41k
162k
33k
36k
23k
41k
15k
1743
11
4 4 1
13 219
2 2 1
95
28
1230
10
8 14 4
4 4 2
3 3 1
5 9 3
Charbriquettes
Pellets
Ethanol
Legend
Number of HH reached (low scenario)
Number of urban HH in the department
41k
44

ENEA ADVISES AND SUPPORTS INDUSTRIAL AND INSTITUTIONAL ACTORS IN THE ENERGY SECTOR
3 ENVIRONMENTAL IMPACTS This section compares the environmental impacts of the different fuels pathways, based on a Life Cycle Analysis (LCA). LCA takes into account environmental impacts over the entire life cycle of a fuel: in addition to the fuel combustion phase, it screens all the upstream phases such as fuel sourcing, production and distribution. Thus the different fuels can be compared on an equal basis. LCA methodology is based on a framework with worldwide shared standards, and should be undertaken by experts – such as Quantis in the present study – to ensure reliable and relevant information. LCA results offer a comparison between the reviewed fuels based on a set of indicators: it can be a tool to exclude or favor a fuel in order to limit a specific type of environmental impact. It also gives insight on which life cycle stage is the most harmful to the environment and should be addressed in priority to limit environmental impacts.
3.1 Method
The functional unit for the comparison of the various fuel pathways is 1MJ of heat delivered for cooking in Haiti.
The indicators used for the assessment are the following:
Global Climate change Potential: emission factors are from IPCC 2013. This indicator evaluates the global warming potential due to greenhouse gases emissions released during the life cycle of the reviewed fuel.
Black carbon (BC) and Short-Lives Climate Pollutants (SLCP): calculated from emission factors provided by The Gold Standard. This indicator takes into account particulate matter and gases with a short term impact on climate change.
Total energy demand: all the energy (renewable and non-renewable) required during the life cycle Fossil fuel depletion: only the fossil energy required during the life cycle, which points out if a non-fossil
fuel use fossil fuel during its life cycle. Water consumption: direct and indirect water consumed (excludes sustainable water withdrawal), an
important indicator in regions that can be affected by drought, or have difficult access to drinking water. Particulate matter: emissions of PM2.5, air pollutants detrimental to human health
The life cycle stages considered are the following:
Land transformation: impacts from land conversion from forest to non-forest. It takes into account the carbon release from the soil and the roots of cut trees but not the release from the above ground part of the trees.
Sourcing and processing: impacts from raw material sourcing (harvesting, fossil fuel withdrawal, materials and manufacturing of solar panels and batteries) and impacts from raw material processing into fuel (carbonization, fermentation and distillation).
Packaging: impacts from the bottles or bags used to transport and retail fuels. Transport: impacts from transport (before processing and after processing). Cooking device: impacts of materials and processes used to manufacture the cookstoves. Combustion: impacts of fuel combustion based on average stove efficiencies. For LPG, CO2 emissions
from combustion are accounted in the "sourcing and processing" phase14).
Data used to build the model and input parameters were collected from interviews in Haiti, literature, GACC
FACIT tool [10], Ecoinvent database and ENEA internal data. The main assumptions used to build the LCA model
are described in Appendix §8.3 and input data are listed in Appendix §8.5.
14 In LCA methodology, fossil fuel CO2 emissions are accounted for as soon as fuel is extracted from underground fossil reserves.

22 COOKING FUELS IN HAITI
ENEA ADVISES AND SUPPORTS INDUSTRIAL AND INSTITUTIONAL ACTORS IN THE ENERGY SECTOR
3.2 Results
3.2.1 Global climate change potential
Figure 8 represents the impacts of each life cycle stage on the fuel’s potential to impact climate change potential. The indicator is given in kgCO2-eq on a 100 year lifetime basis15.
Figure 8 – LCA results on the global climate change potential of fuels
Charcoal is the traditional fuel with the highest climate change potential by far. For charcoal, most of the emissions are related to the carbonization stage. Switching to less-emitting carbonization kilns allows reducing this potential by 0.9 to 1.25 kg CO2/MJdelivered. Switching to an alternative fuel entails a sharper decrease of 1.3 to 1.9 kg CO2/MJdelivered (see Figure 9), which is fifty percent more than the reduction potential with improvements on kilns. Improved kilns with high efficiency have about the same potential for climate change emissions abatement than charbriquettes.
15 Greenhouse gases – such as CO2, CH4, N2O and others – are all responsible for climate change, but they have different global warming potentials. For example, fossil CH4 is 30 times more harmful than CO2 in terms of global warming over a 100-year horizon. In order to have a consistent climate change indicator, all amount of greenhouse gases are expressed in equivalent amount of CO2. The conversion factors used are the ones published in the 2013 report of the Intergovernmental Panel on Climate Change (IPCC).
0,0
0,5
1,0
1,5
2,0
2,5
Firewood Charcoal - trad
kiln, min
Charcoal - trad
kiln, max
Charcoal - impr
kiln, min
Charcoal - impr
kiln, max
Charbriquettes Pellets Non-carb
briquettes
Ethanol LPG Solar electricity
kgC
O2
eq
/ M
J h
eat
Climate change
Legend
Combustion
Cooking device
Transport
Packaging
Sourcing and processing
Land transformation

ENEA ADVISES AND SUPPORTS INDUSTRIAL AND INSTITUTIONAL ACTORS IN THE ENERGY SECTOR
Figure 9 – Climate change reduction potential with two different strategies : switching to less-emitting charcoal pathways or switching to alternative fuels
Figure 10 focuses on non-traditional fuels with low climate change potential compared to charcoal. For fuels based on fully renewable biomass (charbriquettes, pellets and ethanol), emissions are significantly lower because the CO2 emitted is biogenic16. However, other GHG gases also have an impact on climate, which materialize significantly in the carbonization stage for charbriquettes and in the combustion stage of non-carbonized briquettes.
Emissions from agricultural practices (fertilizers and pesticides) used whengrowing sugar cane for ethanol are low despite a conservative scenario17. LPG emissions result from the combustion of a fossil fuel. Even though LPG is an imported fuel, greenhouse gases emitted during importation in the country have little weight in total LPG impact because of LPG high energy density. Climate change emissions of the solar electricity path are mostly due to the manufacturing processes of the solar panels and batteries.
16 CO2 emissions are considered biogenic when emitted by combustion or decomposition of biologic material. As the CO2 released to the atmosphere has been previously captured during plant growth, biogenic CO2 has a neutral impact in environmental assessment. Conversely, CO2 released from fossil sources was formed over millions of years and is not part of a short-term biological cycle. It thus has a negative impact on global warming.
17 The LCA model for ethanol considers agricultural practices observed in Brazil supposed to be more intensive on fertilizers and pesticides than in Haiti.
0,0
0,5
1,0
1,5
2,0
2,5
Firewood Charcoal - trad
kiln, min
Charcoal - trad
kiln, max
Charcoal - impr
kiln, min
Charcoal - impr
kiln, max
Charbriquettes Pellets Non-carb
briquettes
Ethanol LPG Solar electricity
kgC
O2
eq
/ M
J h
eat
Climate change
Baseline emissions from charcoal
0.9 to 1.25 kgCO2-eq / MJ-heatEmissions reduction potential from improvements on charcoal kilns
1.3 to 1.9 kgCO2-eq / MJ-heatEmissions reduction potential from fuel switch
Legend
Combustion
Cooking device
Transport
Packaging
Sourcing and processing
Land transformation

24 COOKING FUELS IN HAITI
ENEA ADVISES AND SUPPORTS INDUSTRIAL AND INSTITUTIONAL ACTORS IN THE ENERGY SECTOR
Figure 10 – LCA results on the global climate change potential of non-traditional fuels
3.2.2 Black carbon and short lived climate pollutants
Figure 11 represents the impacts of each life cycle stage on black carbon (BC) and the short-lived climate pollutants (SLCPs) emitted by the different fuels. The indicator is given in kgCO2-eq on a 20 year lifetime basis. Similarly to climate change potential results, switching from traditional charcoal practices to improved kilns results in a decrease of BC and SLCP emissions. The decrease is even more significant when switching to an alternative fuel. Pellets and non-carbonized briquettes show reduced emissions thanks to the absence of a carbonization step. However, these two fuels differ on the combustion emissions, with very low emissions for pellets and high emissions for non-carbonized briquettes due to the difference in fuel combustion quality.
Figure 11 – LCA results on the black carbon and the SLCP emissions of fuels
0,0
0,1
0,2
0,3
0,4
0,5
0,6
0,7
Charbriquettes Pellets Non-carb briquettes
Ethanol LPG Solar electricity
kgC
O2e
q /
MJ h
eat
Climate change
Focus on non-traditional fuels
Legend
Combustion
Cooking device
Transport
Packaging
Sourcing and processing
Land transformation
-2
0
2
4
6
8
10
12
14
16
18
Firewood Charcoal - trad kiln, min
Charcoal - trad kiln, max
Charcoal - impr kiln, min
Charcoal - impr kiln, max
Charbriquettes Pellets Non-carb briquettes
Ethanol LPG Solar electricity
kgC
O2
eq
/ M
J h
eat
Black carbon & SLCP
Legend
Combustion
Cooking device
Transport
Packaging
Sourcing and processing
Land transformation

ENEA ADVISES AND SUPPORTS INDUSTRIAL AND INSTITUTIONAL ACTORS IN THE ENERGY SECTOR
3.2.3 Total energy demand
Figure 12 represents the impacts of each life cycle stage on total energy required by the different fuels to fulfill the functional unit. Fuels based on primary biomass products, such as firewood, charcoal and ethanol, have a higher demand in energy than fuels based on residues: charbriquettes, pellets and non-carbonized briquettes whose energy content is virtually reduced by the allocation factor18 applied on the residues. Solar electricity demand in energy is relatively high (equivalent to improved charcoal pathways), due to the energy demand in solar panel and battery manufacturing processes19.
Figure 12 – LCA results on the total energy demand required by fuels
3.2.4 Fossil fuel depletion
Figure 13 represents the impacts of each life cycle stage on fossil fuel depletion entailed by the life cycles of the different fuels. Even though most reviewed fuels are not fossil, they indirectly consume fossil fuels through upstream life cycle stages (e.g. transport). Alternative fuels tend to require more fossil energy than conventional fuels. Fuels based on agricultural residues and by-products consume fossil energy at the processing factory and for packaging. Solar electricity uses fossil energy to manufacture solar panels and batteries. LPG is responsible for the highest fossil fuel depletion, almost entirely due to fossil fuel extraction directly transformed into LPG.
18 The harvested crop can be broken down into high added-value products, such as the grain or the juice, and low value by-products, such as the residues: stems, leaves, bagasse… In the LCA methodology, the impacts due to plant cultivation should be broken down similarly. As the primary purpose of plant growing is to produce high value parts, a higher share of the impacts should be attributed to the grain. The remaining share of the impacts is allocated to the residues. This latter ratio is named the “allocation factor” of the residues, and is based on an economic ratio between high value product and residues pricing.
19 Note than the renewable solar energy captured by solar panel during their lifetime is not included in the indicator.
0
5
10
15
20
25
Firewood Charcoal - trad
kiln, min
Charcoal - trad
kiln, max
Charcoal - impr
kiln, min
Charcoal - impr
kiln, max
Charbriquettes Pellets Non-carb
briquettes
Ethanol LPG Solar electricity
MJ
/ M
J h
eat
Total energy demand
Legend
Combustion
Cooking device
Transport
Packaging
Sourcing and processing
Land transformation

26 COOKING FUELS IN HAITI
ENEA ADVISES AND SUPPORTS INDUSTRIAL AND INSTITUTIONAL ACTORS IN THE ENERGY SECTOR
Figure 13 – LCA results on the fossil fuel depletion entailed by each fuel
3.2.5 Water consumption
Figure 14 represents the impacts of each life cycle stage on the water consumed by the different fuels. Except for ethanol, charbriquettes and electricity, water consumption is negligible. Charbriquettes and ethanol are impacted by the water requirements during farming. Ethanol is the most sensitive to water consumption from farming because its economic ratio for impact allocation is higher than charbriquettes produced from agricultural residues or byproducts. Water consumption in the solar electricity path is due to equipment manufacturing.
Figure 14 – LCA results on the water consumed by each fuel
0,0
0,5
1,0
1,5
2,0
2,5
3,0
Firewood Charcoal - trad kiln, min
Charcoal - trad kiln, max
Charcoal - impr kiln, min
Charcoal - impr kiln, max
Charbriquettes Pellets Non-carb briquettes
Ethanol LPG Solar electricity
MJ
/ M
J h
eat
Fossil fuel depletion
Legend
Combustion
Cooking device
Transport
Packaging
Sourcing and processing
Land transformation
0,00
0,01
0,01
0,02
0,02
0,03
Firewood Charcoal - trad
kiln, min
Charcoal - trad
kiln, max
Charcoal - impr
kiln, min
Charcoal - impr
kiln, max
Charbriquettes Pellets Non-carb
briquettes
Ethanol LPG Solar electricity
m3
/ M
J h
eat
Water consumption
Legend
Combustion
Cooking device
Transport
Packaging
Sourcing and processing
Land transformation
ENEA ADVISES AND SUPPORTS INDUSTRIAL AND INSTITUTIONAL ACTORS IN THE ENERGY SECTOR
3.2.6 Particulate matter formation
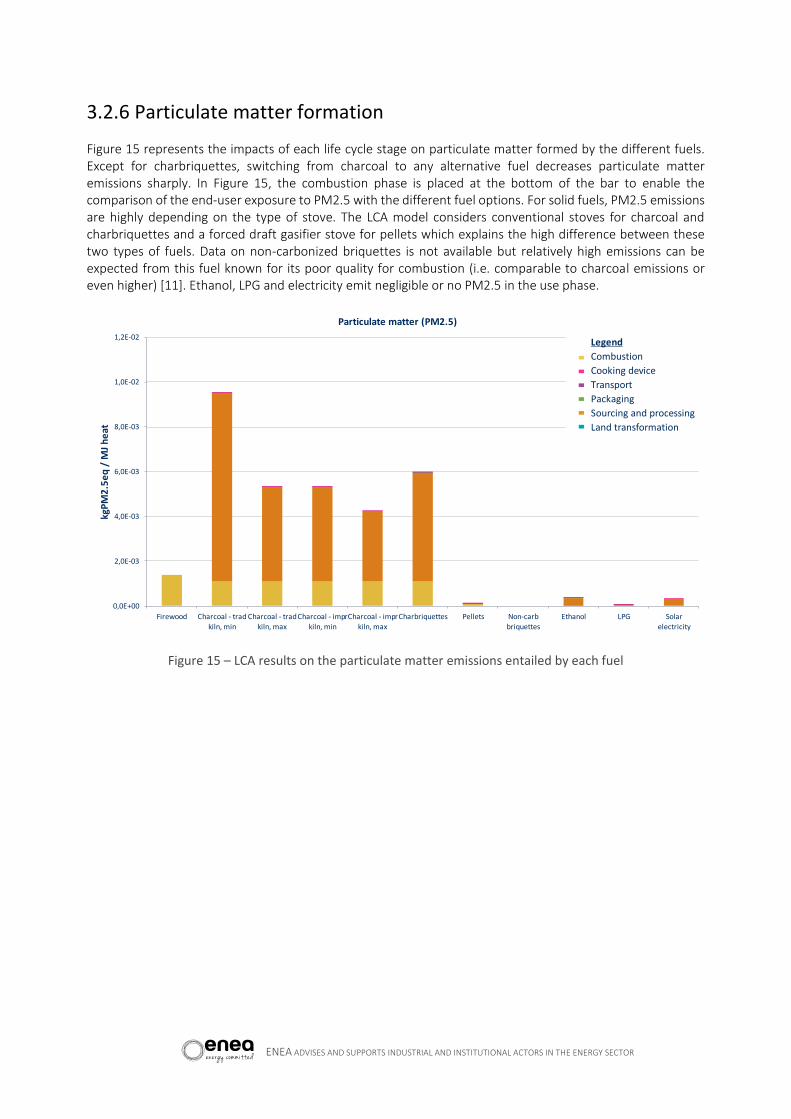
Figure 15 represents the impacts of each life cycle stage on particulate matter formed by the different fuels. Except for charbriquettes, switching from charcoal to any alternative fuel decreases particulate matter emissions sharply. In Figure 15, the combustion phase is placed at the bottom of the bar to enable the comparison of the end-user exposure to PM2.5 with the different fuel options. For solid fuels, PM2.5 emissions are highly depending on the type of stove. The LCA model considers conventional stoves for charcoal and charbriquettes and a forced draft gasifier stove for pellets which explains the high difference between these two types of fuels. Data on non-carbonized briquettes is not available but relatively high emissions can be expected from this fuel known for its poor quality for combustion (i.e. comparable to charcoal emissions or even higher) [11]. Ethanol, LPG and electricity emit negligible or no PM2.5 in the use phase.
Figure 15 – LCA results on the particulate matter emissions entailed by each fuel
0,0E+00
2,0E-03
4,0E-03
6,0E-03
8,0E-03
1,0E-02
1,2E-02
Firewood Charcoal - trad kiln, min
Charcoal - trad kiln, max
Charcoal - impr kiln, min
Charcoal - impr kiln, max
Charbriquettes Pellets Non-carb briquettes
Ethanol LPG Solar electricity
kgP
M2
.5e
q /
MJ
he
at
Particulate matter (PM2.5)
Legend
Combustion
Cooking device
Transport
Packaging
Sourcing and processing
Land transformation

28 COOKING FUELS IN HAITI
ENEA ADVISES AND SUPPORTS INDUSTRIAL AND INSTITUTIONAL ACTORS IN THE ENERGY SECTOR
4 COST OF FUELS The present section aims at comparing the cost of production and delivery of the different fuels to end-users, including the cooking device, based on a life cycle approach. The final cost of cooking is calculated as the sum of the cost of each stage of the value chain (raw material, transport, processing, retail, cooking device) and used the metric of the Levelized Cost of Energy for stages involving significant capital (i.e. processing and cooking device). This cost does not include margins and taxes along the value chain except for the retail margin used as a proxy of the retail cost. Data available in Haiti on the economics of fuels covered in this study are often associated with significant uncertainties or even not accessible. The model used to calculate the costs thus comprise assumptions and input parameters with values associated with significant uncertainties. It should therefore be used as a preliminary analysis of trends rather than an accurate and detailed analysis. Market values of fuels currently sold in Haiti are used as a reference in the analysis, in order to be compared with the calculated cost. Input data and calculations can be found in Figure 51, Figure 52 and Figure 53 in Appendix §Error! Reference source not found.
4.1 Method
4.1.1 Scenarios
Market values are derived from stove and fuel market prices observed or taken from the literature. They are given within a range with minimum and maximum values collected from the fuel producers or retailers [12][13][14][15][16][11]. Calculated costs are based on data collected in the field or compiled from the literature. It builds the cost breakdown along the value chain. Market prices and costs are given in USD/MJ-delivered: it represents the cost of useful energy and includes the cost of the fuel and the stove, taking into account the energy efficiency of the stove (see values of stove efficiency used in the study in §7).
The target market is Port-au-Prince and costs calculated are intended to be representative of the final breakeven cost to address the domestic market in PaP.
There is no local production of ethanol in Haiti yet. The assessment of the economics related to the processing step is highly uncertain with no feedback available on CAPEX and load factor mainly. The cost analysis on ethanol is thus based on two scenarios aimed at representing the range of cost variability due to uncertainties on the processing step. The minimum scenario is relatively optimistic on the CAPEX and load factor20 while the maximum scenario is pessimistic21 on these two parameters.
4.1.2 Cost breakdown
Firewood is assumed to be collected free of charge. The breakdown of LPG costs is not available because the cost of LPG at importation is not disclosed by stakehold; uiers. No data is available in Haiti on the cost of electricity from microgrid. However, the breakeven cost of benchmark microgrids in Africa can be used as a proxy. For the other fuels the cost breakdown is carried out on the following components of the value chain:
20 CAPEX estimates of Green Social Bioethanol (GSB): 690,000 USD for a 3,500 L/day distillery; Load factor of 240 days/year (8 months full time).
21 CAPEX doubled compared to GSB estimates: 1,380,000 USD for a 3,500 L/day distillery; Load factor of 120 days/year (4 months full time).

ENEA ADVISES AND SUPPORTS INDUSTRIAL AND INSTITUTIONAL ACTORS IN THE ENERGY SECTOR
raw materials, binder, processing, transport, retailer margin (as a proxy of the retail cost), and final price of stove.
Raw materials cost
The purchasing cost of the different raw materials is based on the following data and assumptions:
Firewood: the price of a woody land area in Haiti for charcoal [12] Bagasse: The current purchasing price of bagasse to farmers for charbriquettes production [16] Sugarcane: Income increase observed for farmers in Haiti thanks to bagasse sales in addition to sugarcane
[16] Waste paper, rice and maize residues: assumed free of charge [11]
Binder
Binder is needed for charbriquettes processing only. In Haiti, the least expensive binder is imported starch, but its cost is still high compared to the remaining of raw materials [16]. Binder cost could have been included in the “raw materials” category but it is shown separately to highlight its higher cost compared to the other stages of the value chain.
Processing
The Levelized Cost of Energy (LCOE) gathers the sum of discounted cash flows over the lifetime of the processing factory: capital cost of equipments, operational costs of labor, maintenance and energy (see definition of the LCOE in Appendix §8.6).
These costs were calculated based on the information collected with
Factories currently operated in Haiti to produce carbonized briquettes [16] and non-carbonized briquettes [11]
Techno-economic data on wood pellet production plants in East Africa for pellets [17] Cost estimates from Green Social Bioethanol on a small scale distillery for ethanol [6] CAPEX and workforce needed for improved carbonization kilns for improved charcoal [18]
Transport
The low homogeneity and reliability of data available on transport of products in Haiti prevent from building a model able to calculate the cost of transport per distance traveled. Therefore, the cost model considers a cost per kg transported based on the feedback of CRI and thus representative of a travel from Cap-Haitien to Port-au-Prince [16].
Cost of transport from wholesale to retail is not taken into account.
Retailer margin
Retailers buy fuel at wholesale and add an extra cost to the fuel sold to customers. It is assumed to be the same for all alternative fuels, based on CRI's experience [16]. Retailer margin is highly variable for charcoal because of the large and unregulated market. In our model a fixed margin is used for charcoal in and outside of Port-au-Prince based on bulk and retail differences in prices observed [12][13][14]. Eventually, retailer margins for charcoal and alternative fuels are similar independently from the adopted calculation method.

30 COOKING FUELS IN HAITI
ENEA ADVISES AND SUPPORTS INDUSTRIAL AND INSTITUTIONAL ACTORS IN THE ENERGY SECTOR
Cooking device
The cooking device may be capital intensive and has a specific lifetime; it is therefore modeled with the calculation of a levelized cost per MJ delivered based on its lifetime and the amount of energy delivered per year.
The lifetime and share of the household energy demand covered by the stove vary depending on the type of stove and fuel [19] [20] [15] [14]:
Charcoal and charbriquettes: lifetime of 0.75 months, 100% of energy need of the household covered by the fuel
Non-carbonized briquettes and pellets: lifetime of 2 years, 100% of energy need of the household covered by the fuel
LPG and ethanol: lifetime of 2 years; 50% of energy need of the household covered by the fuel
4.2 Results
Figure 16 displays the cost breakdown of each cooking path as calculated in the cost model as well as the market values observed in Haiti. Market values are shown for PaP and outside PaP for charcoal. For the other fuels, market values are applicable to PaP only. The calculated costs (bars breakdown) are applicable to PaP only, with a fuel transportation representative of the distance between Cap-Haitien and PaP.
Figure 16 – Overall cooking costs of fuels based on the cost of each stage of the value chain versus minimum and maximum market values
In the results shown in Figure 16, market prices are systematically higher than calculated costs, except for LPG for which the retail price has been directly used and for pellets not yet sold in Haiti. The gap between the calculated cost of fuel and the market values represents the margins on sourcing and production as well as possible taxes along the value chain. Uncertainties on the data collected and assumptions used in the model could also underestimate the calculated cost. Costs of transport in particular may be underestimated in the
0,00
0,02
0,04
0,06
0,08
0,10
0,12
0,14
In P
aP
Ou
tsid
e P
aP
In P
aP
Ou
tsid
e P
aP
CR
I c-b
riq
ue
tte
s
FDS
nc-
bri
qu
ett
es
Pe
llets
Min
Max
In P
ap
Trad. Charcoal Impr. Charcoal Alternative solid fuels Ethanol LPG
Tota
l co
st o
f co
oki
ng
en
erg
y (U
SD/M
J-d
eliv
ere
d)
Cooking device
Minimum retail price
Retailer margin
Transport
Processing
Binder
Raw materials
Market value - min
Market value - max

ENEA ADVISES AND SUPPORTS INDUSTRIAL AND INSTITUTIONAL ACTORS IN THE ENERGY SECTOR
model. For ethanol, market prices are those of imported ethanol22 which explains the difference with calculated costs and also shows an economic benefit to develop local production instead of importation. This preliminary analysis thus must be used to define trends and key learnings but would require further work to precisely assess the cost of fuels.
Despite the relatively high uncertainty on the results of cost calculations, several trends or learning can be stated. Improved charcoal23 cost is in the same range as traditional charcoal. This is the consequence of a balance in cost savings with lower consumption of wood and additional cost expenditures due to wood transport to the improved kiln24. CRI charbriquettes seem to compete with charcoal despite a high cost of binder (significant consumption of imported starch). If the binder issue were solved for charbriquettes, this fuel could likely outcompete charcoal. Non-carbonized solid fuels (briquettes, pellets) tend to be more expensive mostly due to the capital investments in the processing factory. Ethanol tends to be more expensive than charcoal but still positions in the same order of magnitude with possible areas of competitiveness if the CAPEX and load factor of the microdistillery are optimum (Min scenario).
The cost of cooking device is negligible for charcoal and has a very low contribution to the total cost of cooking for other fuels, even for pellets, ethanol or LPG requiring expensive stoves. Nevertheless, the high upfront capital cost of stove for these latter fuels might be an obstacle to fuel switch for end-users. This financial entry barrier may be one of the causes of the low penetration of LPG in Haiti despite its affordability when considering the total cost of cooking.
Cooking from electricity is not displayed in the graph due to dramatically higher costs (0.8 USD/MJ-delivered), and have therefore be excluded of the range of fuels screened in the economic analysis.
22 Prices of imported ethanol are particularly high due to the low quantities imported currently.
23 "Improved charcoal" refers to improved carbonization techniques but not to the use of improved cooking stove.
24 Estimates on the cost of wood transport to improved kilns are conservative: the same cost per mass unit has been used for wood transport and for charcoal transport between Cap-Haitien and PaP while distances for wood are expected to be much lower.

32 COOKING FUELS IN HAITI
ENEA ADVISES AND SUPPORTS INDUSTRIAL AND INSTITUTIONAL ACTORS IN THE ENERGY SECTOR
5 SOCIAL IMPACTS Social impacts of a cooking fuel can materialize along the entire value chain, from raw material sourcing to final use of the fuel. The present study does not aim at measuring actual impacts of fuels already used in Haiti but at assessing qualitatively the expected impacts of a switch from a traditional fuel (firewood or charcoal) to a modern fuel (e.g. charbriquettes, LPG…). This section thus provides a theoretical analysis based on facts and figures known a priori rather than an evaluation of impacts that have already materialized.
The Alliance developed a Monitoring & Evaluation (M&E) frame for social and economic impacts of cooking options (stoves and fuels) covering the whole value chain with two main domains of impacts applicable to the theoretical analysis proposed in this report: "Livelihoods" and "Household social and economic wellbeing". The categories of impacts comprised in these domains are listed in appendix (see §0). The M&E of the Alliance includes a third domain called "Social & Economic Empowerment" excluded from the scope of this study.
This section elaborates a qualitative ranking of the different fuel options on Livelihoods (see §5.1) and on Social & Economic Empowerment (see §5.2), for the categories of impact that can be covered with data available currently in Haiti. A preliminary assessment of the impact of fuel switch is then assessed for the different alternative fuel options.
5.1 Livelihoods along the value chain
Impacts of cooking fuels in the domain of livelihoods are related to jobs and income for the stakeholders involved in the value chain except end-users, with a particular attention to gender (see detailed list of categories of impact in appendix in §0). The analysis of the social impacts of livelihoods in the value chain is based on the information collected from field interviews and the literature on the fuels values chains. A synthesis of this information is provided in appendix (see §0).
Figure 17 displays the qualitative ranking of fuel value chains by segment (raw material sourcing, fuel processing, and fuel sales) for three main categories of impacts on livelihoods (jobs and income). A reference is also made to the geographic location of economic activities and to the distribution of roles between women and men. The rationale used to rank the indicators is detailed at the bottom of the figure.

ENEA ADVISES AND SUPPORTS INDUSTRIAL AND INSTITUTIONAL ACTORS IN THE ENERGY SECTOR
Figure 17 - Qualitative ranking of the impacts of fuels value chains on livelihoods
Employment
Firewood implies a very simple value chain with no economic trade and is thus not really suited to a comparison with other fuels on employment.
Traditional charcoal is the baseline and is likely to be the most impacting value chain in terms of employment because it is the less efficient paths on a mass and energy basis, and thus requires higher workforce than the other fuels for the sourcing and processing segments. Improved charcoal will require lower volumes of wood and is thus likely to reduce the need of labor on the sourcing segment. Improved carbonization techniques require labor to build the kilns and operate it. Even though improved kilns are more efficient, it could require the same amount of labor than traditional kilns overall.
Ethanol production from sugar cane or sweet sorghum harvesting is the only path with a level of job intensity equivalent to traditional charcoal because it is a dedicated activity. Other biomass-based fuels (i.e. charbriquettes, pellets) and non-carbonized briquettes valorize wastes or byproduct and thus create jobs for collection but not for its production25. Processing technologies for ethanol, briquettes and pellets would be operated locally but with a lower need for workforce compared to charcoal due to more efficient technologies and production organization.
25 Nevertheless, these fuels can increase the incomes of farmers producing the residues even though it does not materialize as an employment.
Sourcing Processing Sales Sourcing Processing Sales Sourcing Processing Sales Sourcing Processing Sales
Improved charcoal High High High Low Low Medium Rural Rural Urban Male Mixed Female
Carbonized
briquettesMedium Medium High Medium High Medium Rural Urban Urban Mixed Male Female
Non carbonized
briquettesMedium Medium High Medium High Medium Urban Urban Urban Male Male Female
Pellets Medium Medium High Medium High Medium Rural Urban Urban Male Male Female
Ethanol High Medium High Medium High Medium Rural Rural Urban Mixed Mixed Female
LPG Low Low High N/A N/A Medium N/A N/A Urban N/A N/A Mixed
Electricity Low Low Low N/A N/A High N/A N/A N/A N/A N/A N/A
Wage & Skills
High: the wage is higher than the national minimum wage, the
tasks required trained workforce and management
Medium: incomes are increased compared to the baseline and the
activity requires no particular skills but possible management
Low: incomes correspond to the minimum salary or basic economic
activities (farming, charcoal making)
Geographic location
Rural: operations are mainly located in rural areas
Urban: operations are mainly located in urban areas
Gender
Female: tasks generally handled by women
Male: tasks generally handled by men
Mixed: no specific differentiation of gender in the tasks
Employment - Sourcing
High: raw material production is a dedicated activity
Medium: the raw material is a waste or a byproduct
Low: the raw material is not produced locally
Employment - Processing
High: the processing step is job intensive (the baseline is traditional charcoal)
Medium: the processing phase requires manwork but offers higher productivity than
traditional charocal
Low: there is no processing phase
Employment - Sales
High: the fuel is sold in small units to consumers
Medium: the fuel is sold in bulk or wholesales to consumers
Low: the fuel is sold with a grid or is not sold
Rationale for ranking
GenderJob Income Geographic location

34 COOKING FUELS IN HAITI
ENEA ADVISES AND SUPPORTS INDUSTRIAL AND INSTITUTIONAL ACTORS IN THE ENERGY SECTOR
LPG and electricity are not based on raw materials or equipments locally sourced or processed locally and thus have a low impact on employment on these two segments of the value chain.
Sales of solid, liquid and gaseous fuels rely on a network of small retailers with a significant impact on employment independently from the type of fuel. Electricity is sold with a grid and is thus less labor intensive.
Income
Firewood collection does not generate incomes. For alternative fuels, local sourcing of raw materials and local processing of the fuels are expected to generate higher incomes than for charcoal because it valorizes wastes or byproducts for the benefit of farmers and the processing steps are operated in factories with wages up to twice higher than the minimum salary (see §0). Incomes from fuel sales are expected to be equivalent from a fuel to another, with similar retail margins. For electricity, most of the activity lies in the distribution and sales of electricity through a grid which could imply higher revenues from this specific segment of the value chain.
Geographic location
Alternative fuels tend to localize the processing step, and its jobs and incomes associated, in urban areas while for charcoal it is located in rural areas. Ethanol would be the only biofuel with a processing step in rural areas, if based on a decentralized model with microdistilleries operated by farmers. Alternative fuels are most likely to be consumed in urban markets where charcoal is prevailing.
Gender
Women are involved in agricultural activities but not in raw material sourcing, except for firewood. Alternative fuels to charcoal tend to exclude women from the processing phase but sales are achieved by women as they systematically operate small shops.
5.2 Household social and economic wellbeing
Impacts of cooking fuels in the domain of Household social and economic wellbeing are related to fuel adoption, household finances, time use, status, safety and protection, and drudgery (see detailed list of categories of impact in appendix in §0). The analysis of social and economic impacts on end-users generally requires field survey. Therefore, the assessment of most of these impacts is not feasible in the frame of this theoretical analysis:
Adoption: There is no comprehensive study available on the time of use of the different fuels in Haiti. However, it is known that households using modern and fast cooking fuels such as ethanol, LPG and electricity keep using solid fuels such as charcoal for certain meals (e.g. beans that require long periods of cooking).
Household finances: The cost analysis provided in §4 shows that uncertainties on economics of fuels are still too high to enable a ranking of the fuels, except for electricity that is one order of magnitude more expensive than other fuels.
Status: The change in status within the family or community due to fuel switch cannot be anticipated before in-field observations.
Safety and protection: Risks related to burns is often cited by Haitians but should be more precisely assessed on ethanol end-users. Similarly, for other fuels and for the risks related to fuel collection or fuel purchase a field survey on end-users would be required.
However, a preliminary assessment can be done on the categories of time use and drudgery, based on the features of the fuels, known a priori thanks to the Tier classification shown in Figure 18.

ENEA ADVISES AND SUPPORTS INDUSTRIAL AND INSTITUTIONAL ACTORS IN THE ENERGY SECTOR
Figure 18 - Tier classification of cooking fuels
Time use & Drudgery
The time spent on fuel collection (or fuel purchase) is not expected to change for urban households who buy their fuels in small retail shops in town (generally called Madame Sara). LPG can be sold in larger shops and could thus be less accessible but the energy content of an LPG bottle is higher than volumes of charcoal generally bought by households, thus balancing the time spent on fuel purchase. Finally, urban end-users would not likely benefit from time savings on fuel purchase if switching from charcoal to an alternative fuel. Rural household may save time if switching from firewood collected to an alternative fuel purchased but such a switch is not likely due to economic reasons (i.e. ability and willingness to pay of rural end-users).
Time spent on cooking can be derived from the high thermal efficiency of the fuel (see Figure 18). For solid fuels, this feature depends strongly on the type of stove used. Charcoal, charbriquettes and non-carbonized briquettes have poor performances if used in traditional stoves and can have improved performances as long as a more sophisticated stove is used. A fuel switch from charcoal to charbriquettes or non carbonized briquettes is thus not expected to have an impact on the time spent on cooking.
In the context of Haiti where improved stoves are currently not a common practice, the fuels performances can be assessed assuming that these three fuels are used in traditional stoves (Tier 1) or in low-level or mid-level improved stoves (Tier 2). This enables pellets (Tier 3), ethanol, LPG and electricity (Tier 4) to have a positive impact on time spent on cooking compared to charcoal.
The cooking drudgery mostly lies in smoke and particulate emissions and in cooking speed. The Tier performance can thus be used as a preliminary proxy to assess cooking drudgery, with PM2.5 emissions as an indicator of cooking emissions and with high power thermal efficiency as an indicator of cooking speed. Finally, a common ranking of fuels can be proposed to assess the time spent on cooking and cooking drudgery in Haiti:
High: Firewood in three stone fire (Tier 0) Medium: Charocoal, charbriquettes or non-carbonized briquettes used in traditional stove or low-level
to mid-level improved stoves (Tier 1 to Tier 2) Low: Pellets used in forced draft gasifier stoves, ethanol, LPG or electricity
PM
2.5
em
issi
ons
High power thermal efficiency
Tier 0
Tier 1
Tier 2
Tier 3
Tier 4
Tier 0 Tier 1 Tier 2 Tier 3 Tier 4
Ethanol, LPG & electricity
Firewood
Pel letsCharcoal, charbriquettes and non-carbonized briquettes
Pictures: sites.google.com/a/elfuegodelsol.com; novogaz.com; carbonrootsinternational.com;
Figure derived from cookstovesclassification in Preliminary Haiti Market Assessment, GACC, 2016.
Stoves considered for the different fuels:• Firewood – Three stone fire; • Charcoal, charbriquettes and non-carbonized briquettes – traditional, low-level, mid-level and high-level improved stove; • Pellets – Forced draft gasifier stove; • Ethanol & LPG – Conventional liquid & gaseous fuel stove.
From traditional to high-level
improved stove

36 COOKING FUELS IN HAITI
ENEA ADVISES AND SUPPORTS INDUSTRIAL AND INSTITUTIONAL ACTORS IN THE ENERGY SECTOR
5.3 Impact of fuel switch
The impact of alternative fuels will be the change resulting from the switch from a traditional fuel. Urban households using charcoal are the most likely to operate this switch26. Therefore, the assessment of the impact of fuel switch proposed below is built on a baseline with charcoal used as a traditional fuel in cities.
The assessment of the impact of fuel switch is based on the qualitative ranking (low, medium, high) for the three main categories that can be covered in this study: employment, income, time spent, drudgery. The impact is calculated as the spread of the ranking level of the alternative fuel and the baseline fuel (i.e. traditional charcoal).
Finally, the impact is qualified as:
"Very positive" if the ranking of the alternative fuel is two levels above the baseline (i.e. high vs low) "Positive" if the ranking of the alternative fuel is one level above the baseline (i.e. high vs medium or
medium vs low) "Null"if the ranking of the the two fuels are similar "Negative" if the ranking of the alternative fuel is one level below the baseline (i.e. medium vs high or low
vs medium) "Very negative" if the ranking of the alternative fuel is two levels below the baseline (i.e. low vs high) "N/A" if one of ranking of at least one of the fuel was not feasible
Figure 19 displays the qualitative assessment of the social impacts of a fuel switch from traditional charcoal to alternative fuel.
Figure 19 - Qualitative assessment of the impacts of a fuel switch from traditional charcoal to an alternative fuel
Switching from traditional charcoal to improved charcoal (with the same cooking stove) is not expected to generate a significant change in social impacts, neither on the value chain (job, income) nor on end-users (time spent, drudgery).
26 Past experiences in context similar to that of Haiti (sub-Saharan Africa) show that households cooking on free collected firewood are reluctant to switch to a paying fuel.
Time spent Drudgery
Sourcing Processing Sales Sourcing Processing Sales End-user End-user
Improved charcoal Null Null Null Null Null Null Null Null
Carbonized
briquettesNegative Negative Null Positive
Very
positiveNull Null Null
Non carbonized
briquettesNegative Negative Null Positive
Very
positiveNull Null Null
Pellets Negative Negative Null PositiveVery
positiveNull Positive Positive
Ethanol Null Negative Null PositiveVery
positiveNull Positive Positive
LPGVery
negative
Very
negativeNull N/A N/A Null Positive Positive
ElectricityVery
negative
Very
negative
Very
negativeN/A N/A Positive Positive Positive
Job Income

ENEA ADVISES AND SUPPORTS INDUSTRIAL AND INSTITUTIONAL ACTORS IN THE ENERGY SECTOR
The fuel switch to an alternative solid fuel (carbonized briquettes, non-carbonized briquettes, pellets), is likely to have a negative impact on jobs, due to the lower need for labor on sourcing and processing steps but should increase the incomes of stakeholders of the value chain. Pellets are the only solid fuel able to procure a significant change in the time spent on cooking and the cooking drudgery, if used in a proper stove (forced draft gasifier) while other solid fuels are used in less efficient stoves.
The impacts of ethanol on job could be slightly negative on the processing step with distilleries operated more efficiently than current traditional charcoal making. However, this fuel can increase incomes thanks to the creation of a demand for a cash crop and the operation of distilleries. End-users should also benefit from the switch to ethanol with savings on time spent on cooking and a reduced exposure to smoke (drudgery).
Finally, the two most modern fuels, LPG and electricity, have a very negative impact on job with no local employment on the sourcing and processing segments of the value chain. Electricity is also likely to destroy jobs on sales due to the low requirement for sales agents when distributing electricity with a microgrid. However, the jobs required to manage the microgrid an electricity sales are likely to be better paid than conventional retail jobs. On the end-user side, both LPG and electricity are expected to generate a positive impact with savings in time spent on cooking and reductions in smoke exposure.

38 COOKING FUELS IN HAITI
ENEA ADVISES AND SUPPORTS INDUSTRIAL AND INSTITUTIONAL ACTORS IN THE ENERGY SECTOR
6 CONCLUSIONS AND RECOMMENDATIONS Biofuels locally produced in Haiti are environmentally sound for a clean fuel strategy.
The Life Cycle Analysis of charbriquettes, non-carbonized briquettes, pellets and ethanol demonstrate their significant CO2 emission reduction potential if substituted for traditional charcoal (1.3 to 1.9 kgCO2/MJdelivered). Among these clean fuels, charbriquettes are the most emitting (based on CO2, BC & SLCPs and PM2.5). Along their lifecycle, biofuels tend to consume more water and fossil energy than charcoal due to harvesting practices and fuel processing input. Overall, switching from charcoal to biofuels offer a great potential of positive impact on the environment and on end-user exposure to PM2.5.
However local biomass resources suited to produce biofuels in Haiti are limited compared to the cooking energy demand of the country: it could theoretically cover up to 50% of the urban household demand.
The resource assessment shows a limited potential in Haiti for biomass based fuels due to the low production of this biomass from agricultural activities. Moreover volumes produced each year are highly variable and not necessarily available (competition in uses) nor accessible (remote areas). The scenarios developed in this study indicate that based on the current national production of biomass suited to cooking fuels (maize, rice, sorghum, sugar cane) and with realistic efforts dedicated to the development of ethanol crops (i.e. sugar cane and sweet sorghum), 27% to 51% of the urban households demand for cooking energy could be theoretically served.
The development of a biofuel sector at larger scale would mean developing pellets and ethanol and is expected to face various challenges that must be investigated before building a more ambitious strategy on local biofuels.
In-depth surveys and analyses on land use, land availability and agricultural practices in Haiti are required to precisely assess the extent to which energy crops can be grown and existing agricultural residues can be recovered without damage to preexisting agricultural activities or on soil fertility.
A large scale development of biofuels in Haiti for cooking purposes would imply a high penetration of ethanol and pellets in urban markets. However, the competitiveness and the market adoption of these two fuels is still to be proven. The preliminary analysis of production cost of fuels highlights higher costs for pellets and ethanol compared to charbriquettes and charcoal due to CAPEX intensive processing equipments. No experience has yet been identified on pellets in Haiti (neither on wood nor bagasse pellets). Despite the high energy efficiency of this fuel and its very low emission of smoke and particulate, market adoption of pellets is known to be challenging in other developing countries, notably due to the high upfront cost of the required stove. Novogaz is currently working on the market uptake of ethanol but social and political acceptance of ethanol is still challenging in Haiti. Distrust on ethanol is observed at several levels of the value chain: farmers and politicians can fear the ethanol sector as it is not related to a food market and may jeopardize the food security of the country, while end-users and politicians are sensitive to rumors on the risks related to the use of ethanol (fire and adulterated alcohol beverage).
Non-carbonized briquettes and electricity have a low potential and should be excluded from further considerations on fuels.
Local resource to produce non-carbonized briquettes (saw dust, waste paper) are too limited to make it a candidate for a fuel strategy aiming to reach more than 1% of the household urban demand. The production cost of clean electricity is too high to make cooking on electricity an affordable option for households in Haiti.
LPG is an attractive option to develop clean fuels in Haiti but requires the development of consumer finance services and political intervention to regulate the market.

ENEA ADVISES AND SUPPORTS INDUSTRIAL AND INSTITUTIONAL ACTORS IN THE ENERGY SECTOR
LPG offers good performances in terms of environmental and health impacts despite its fossil origin and is cost competitive with charcoal on a cost of energy basis. However its market uptake in Haiti is still limited due to the high upfront cost of LPG cylinders and stoves due to a lack of regulation of LPG retail activities in Haiti.
To overcome these barriers, it is recommended on one hand to enforce safety standards and the protection of cylinder ownership as well as supporting marketer investment in new LPG cylinders through the creation of an organization in charge of the management of cylinders and the removal of damaged cylinders from the market. On the second hand, developing consumer finance to provide credits or leasing solutions for cylinders and stoves acquisition for end-users would help reducing the upfront cost and make LPG an affordable cooking option for most urban households.
The development of clean fuels in Haiti is expected to improve the social and economic wellbeing of end-users but may have a negative impact on jobs along the value chain.
The use of cleaner and more efficient fuels will benefit to end-users thanks to time savings in cooking and thanks to a reduced exposure to smoke and particulate. Nevertheless, charcoal making is a significant source of job an income for farmers possibly threatened by the development of alternative fuels. Developing improved charcoal production techniques and biofuels locally produced are the best options to develop the clean fuels sector while creating local value partly oriented towards farmers.
ENEA recommends the Alliance to build a strategy based on four pillars to be conducted in parallel:
reduce kiln emissions and wood withdrawal with improved charcoal production kilns, reduce the consumption of charcoal with improved cooking stoves, reduce the consumption of charchoal with alternative fuels already proven (charbriquettes and LPG), investigate the potential of innovative fuels (ethanol locally produced and pellets) for large scale
deployment.
Limitations in the availability of local biomass prevent a strategy based on local biofuels from having a significant impact on the cooking sector in Haiti. The improvement of charcoal production techniques is a key lever to reduce the demand for wood and the emission of greenhouse gases of the sector. The adoption of fixed kilns by charcoal makers may be a challenge due to the requirement for wood transport. Nevertheless, improvement margins should exist on charcoal production with mud kilns and should be identified and targeted. The combined used of improved cooking stoves will reduce the demand for charcoal.
In parallel, alternative fuels should be developed, starting with the most promising among those already proven: charbriquettes and LPG. Ethanol and pellets have a high potential but should first be demonstrated at pilot scale to prove their competitiveness and market adoption.
Figure 20 illustrates the impact on climate change of a fuel strategy with an example of objectives deemed realistic in Haiti and based on the pillars above-mentioned.

40 COOKING FUELS IN HAITI
ENEA ADVISES AND SUPPORTS INDUSTRIAL AND INSTITUTIONAL ACTORS IN THE ENERGY SECTOR
Figure 20 - Example of a multi objectives strategy on climate change (based on charcoal consumption of urban households) with three objectives to be achieved concurrently
12,9
10,1
8,6
6,4
0
2
4
6
8
10
12
14
CO
2 e
mis
sio
ns
of t
he
urb
an h
oush
old
s(M
t-C
O2-
eq
/ y
ear
)Objective 1: Doubling the efficiency of carbonization kilns for 50% of the
charcoal production Objective 2: Deployment of improved charcoal stoves (30% reduction on fuel consumption) to 50% of urban households
Objective 3: Fuel switch to an alternative fuel (charbriquettes, pellets, ethanol, LPG) for 20% of the urban households

ENEA ADVISES AND SUPPORTS INDUSTRIAL AND INSTITUTIONAL ACTORS IN THE ENERGY SECTOR
7 RESEARCH GAPS Findings that have emerged from the assessments carried out in the present study are challenged by the various uncertainties regarding input data. Further work should refine data collected within fieldwork or in literature through in-depth field analysis and effective pilot projects. This section presents the most important areas that should be investigated in order to reduce uncertainties and provide more accurate results.
Prospective pathways
In the present study, data related to prospective pathways contains more uncertainty that existing pathways investigated during fieldwork. There is no pilot project in Haïti on charcoal from in improved kilns, pellets, or ethanol fuels. Data on technical aspects, economics, social impacts and customer adoption is thus limited and was extrapolated from literature or existing projects from other countries. The implementation and follow-up of pilot projects on these new fuel pathways would produce more reliable data.
Technical data on sourcing and processing
Available resource and environmental impact assessments are based on technical data collected from different sources, such as field interviews or literature. Key parameters should be carefully assessed as they strongly impact end results:
Residue to whole crop mass ratio Carbonization kiln efficiency Heating value of prospective fuels Inputs and yield for sugarcane farming (LCA inputs only) Black carbon and PM emissions for the reviewed fuels
On-site measurements would provide improved accuracy on the assessment of these parameters for the Haïtian context.
The present study only presents the maximum potential feedstock that can be produced in Haïti. The estimation of feedstock really available for collection should be carried out. It would take into account the amount of agricultural residues and bagasse dedicated to competitive uses, the amount that cannot be collected because of scattered production sites or lack of transportation, and possible opportunities such as onsite carbonization by farmers. A detailed survey on a large sample of farms would provide insights on these aspects.
Prospective scenarios for the resource assessment
The resource assessment include a realistic scenario, and three prospective scenarios. A review of crop production and harvested land data over the last decades and an in-depth analysis of the agricultural sector should estimate:
The available land for extension of the sugarcane currently harvested land area The possible variations of crop yield over the next few years with minimum and maximum range
This would provide insights on whether the adopted scenarios are likely to occur, and in which time frame. The occurrence of these scenarios may also be limited by farmers’ adoption of new agricultural practices, especially for large scale replacement of conventional sorghum by sweet sorghum.

42 COOKING FUELS IN HAITI
ENEA ADVISES AND SUPPORTS INDUSTRIAL AND INSTITUTIONAL ACTORS IN THE ENERGY SECTOR
Economics
As specified earlier, cost of non-existing fuels in Haïti should be based on existing Haïtian projects to limit uncertainty. Cost of infrastructure and associated business plan, such as improved carbonization kilns and briquette factories, have a major impact on final cost of fuel. Stoves dedicated to pellets and non-carbonized briquettes are not commercialized for households yet and their price is still uncertain.
Apart from high uncertainties for prospective fuels (charcoal with improved kilns, pellets, ethanol), cost of transport is difficult to estimate. It highly depends on the distance covered, on the type of transportation, and the type of roads.
Social impacts and market assessment for customer adoption
A customer survey should be carried out on fuel end-users in order to assess their cooking practices, the objective and the perceived qualities of each fuel. This is especially true for fuels that are not yet offered on the Haïtian market.

ENEA ADVISES AND SUPPORTS INDUSTRIAL AND INSTITUTIONAL ACTORS IN THE ENERGY SECTOR
BIBLIOGRAPHY
[1] Ministère de l’Agriculture, des Ressources Naturelles et du Développement Rural (MARNDR), «Enquête Nationale de la Production Agricole (ENPA),» 2014.
[2] Food and Agriculture Organization of the United Nations, «Special report - FAO/GIEWS food availability and market assessment mission to Haïti,» 2016.
[3] Entrepreneurs du Monde, «Etude de faisaibilité de la consolidation d'une filière "Briquettes de papier recyclé" en Haïti - Rapport final,» 2009.
[4] Entrepreneurs du Monde, Baseline quantitative survey on Haitian housholds for a Gold Standard project registration, 2013.
[5] Institut Haïtien de Statistique, «Recensement Général de la Population et de l'Habitat,» 2009.
[6] Green Social Bioethanol, 2016.
[7] Project Gaïa, «Haïti sustainability brief,» 2010.
[8] FAO, «The State of Food and Agriculture,» 2001. [En ligne]. Available: http://www.fao.org/docrep/003/X9800e/x9800e10.htm#P209_28159.
[9] Ministry of Agriculture, Natural Resources and Rural Development, «Agricultural census in Haiti,» 2012. [En ligne]. Available: http://www.fao.org/fileadmin/templates/ess/documents/meetings_and_workshops/IICA_2013/Linkages_TT_10-12June2013/Presentations/Haiti_10-12_June_2013_Integrated_Censuses.pdf.
[10] Global Alliance for Clean Cookstoves, «GACC FACIT tool,» 2016.
[11] K. Adair, Interviewee, Fuego del Sol. [Interview]. 2016.
[12] E. Rakotomalala et A. &. CAFSA, «Enjeux et perspectives de la filière charbon de bois en Haïti : un cas d’étude dans le département du Nord-Est,» 2012.
[13] Unep, Carbon Roots, «Vetiver Briquettes, Feasibility report,» 2015.
[14] N. David, Interviewee, Palmis Enèji. [Interview]. 2016.

44 COOKING FUELS IN HAITI
ENEA ADVISES AND SUPPORTS INDUSTRIAL AND INSTITUTIONAL ACTORS IN THE ENERGY SECTOR
[15] Novogaz, «Liste de Prix Novogaz 1er juin 2016,» 2016.
[16] R. Delanay, Interviewee, Carbon Roots International. [Interview]. 2016.
[17] Enea, «Enea internal data from projects in Africa».
[18] Geres, «NAMA on sustainable charcoal,» 2015.
[19] Lawrence Berkeley National Laboratory, «Performance of Charcoal Cookstoves for Haiti,Part 1: Results from the Water Boiling Test,» 2011.
[20] Global Alliance for Clean Cookstoves, «Cookstoves catalog,» [En ligne]. Available: http://catalog.cleancookstoves.org/stoves. [Accès le 2016].
[21] IPCC, «Guidelines for National Greenhouse Gas Inventories - Chapter 4,» 2006.
[22] P. Buringh, «The Role of Terrestrial Vegetation in the Global Cycle: Measurement by Remote Sensing - Chapter 3 Organic Carbon in Soils of the World,» John Wilhey & Sons Ltd, 1984.
[23] David M. Pennise et al., «Emissions of greenhouse gases and other airborne pollutants from charcoal making in Kenya and Brazil,» Journal of geophysical research, vol. 106, n° %1D20, pp. 24143-24155, 2001.
[24] IEA, 2011.
[25] Ecoinvent, «Ecoinvent database».
[26] L.-J. Flambert, Interviewee, Total. [Interview]. 2016.
[27] Enea, «Internal data».
[28] Total Haïti, «Prix des carburants,» [En ligne]. Available: http://www.totalhaiti.com/nos-carburants/prix-des-carburants.html. [Accès le 2016].
[29] Haiti Libre, «Tous les détails sur les nouveaux salaires minimum,» 2016, [En ligne]. Available: http://www.haitilibre.com/article-17541-haiti-flash-tous-les-details-sur-le-nouveau-salaire-minimum.html";"http://www.haitilibre.com/article-17541-haiti-flash-tous-les-details-sur-le-nouveau-salaire-minimum.html.
[30] Entrepreneurs du Monde, «Gold Standard Baseline measurement on PaP HH and street restaurants,» 2014.
[31] A. Tarter, Interviewee, Interview. [Interview]. October 2016.

ENEA ADVISES AND SUPPORTS INDUSTRIAL AND INSTITUTIONAL ACTORS IN THE ENERGY SECTOR
[32] Lawrence Berkeley National Laboratory, «Performance of Charcoal Cookstoves for Haiti,Part 1: Results from the Water Boiling Test,» 2011.
[33] AEBIOM, «The Handbook of wood fuel,» 2010.
[34] Clean Cookstoves, «Clean Cookstoves catalog,» [En ligne]. Available: http://catalog.cleancookstoves.org/stoves. [Accès le 2016].
[35] Aprovecho Research Center, «Performance of the CleanCook Stove with Alcohol Fuels Compared with Traditional and Improved Solid Fuel Stoves, Kerosene and LPG Stoves,» 2010.
[36] Nexant, «Annexes USAID final report - Assesment and design of Haiti Alternative Cooking Technologies Program - Final Report,» 2010.
[37] Entrepreneurs du Monde, «Internal data».
[38] European Biofuels Technology Platform, «Ethanol - Biofuel fact sheet».
[39] Electricité d'Haïti, «Grille tarifaire - Electricité d'Haïti,» 2009. [En ligne]. Available: http://www.edh.ht/tarif.php.
[40] Comité Français du Butane et du Propane, «Caractéristiques générales et physico-chimiques».
[41] A. Stork, «Haiti - South Department Forest Energy Supply Chains,» 2016.
[42] D. Lindor, «Projet de renforcement des capacités adaptatives des communautrés côtières aux changements climatiques en Haiti (ACC - PNUD/FEM/MDE),» 2016.
[43] C. Joseph, Interviewee, AVSF Haiti. [Interview]. 2016.
[44] J.-F. Hibert, Interviewee, Novogaz. [Interview]. 2016.
[45] G. Pressoir, Interviewee, Chibas Haïti. [Interview]. 2016.
[46] Haïti Libre, «Haïti - Agriculture : L’année agricole 2013-2014 promet d’être bonne,» 2013.
[47] SEI, «SEI internal data».

46 COOKING FUELS IN HAITI
ENEA ADVISES AND SUPPORTS INDUSTRIAL AND INSTITUTIONAL ACTORS IN THE ENERGY SECTOR
8 APPENDIX
8.1 List of interviewees
In person interviews conducted by Entrepreneur du Monde in Haiti
Interviewee Position Organization Date
Pierre Kenol Thys Manager - Energy BID - Haiti 05/09/16
Marie Bonnard Country Coordinator AVSF Haiti 06/10/16
Patrice Dion Professor Université de Laval -
Faculty of Science,
Agriculture and Food
26/09/16
Rachèle Lexidort Project coordinator Akosaa - Haiti 26/09/16
Gael Pressoir Executive Director Chibas Energie - Haiti 10/10/16
Jean-François Hibbert Executive Director Novogaz 29/09/16
Jean-François Lambert Stock Unit Manager Total Haiti 07/10/16
Victor Munet Sustainable Development
Manager
Total Haiti 07/10/16
Andrew Tarter PhD Antropologist - Haiti 29/09/16
René Jean Jumeau Founder and Executive
Director
Former Ministry of Energy
- Haitian Energy Institute
30/09/16
Jean-Robert Altidor Energy Ressources
Director
Bureau des Mines et de
l'Energie
10/10/16
Claude Preptit Executive Director Bureau des Mines et de
l'Energie
10/10/16
Yann François Monitoring and
Evaluation Manager
GERES - Cambodia 18/10/16
Yves André
Wainwright
Energy and Environment
specialist
UNDP 07/10/16

ENEA ADVISES AND SUPPORTS INDUSTRIAL AND INSTITUTIONAL ACTORS IN THE ENERGY SECTOR
Eric Sorensen
Ryan Delanay
CEO
COO
Carbon Roots
International - Chabon
boul Haiti 28/09/16
Philipp Villedrouin Executive Director Chabon Ticadaie 27/09/16
Kevin Adair Executive Director Fuego del Sol 05/10/16
Joaneson Lacour Executive Director Wastek
Haitian Energy Institute
30/09/16
Phone and mail interviews/contacts by Entrepreneur du Monde
Interviewee Position Organization
Jean Tisserat Technical Assistant AVSF Haiti
Carmille Joseph Pwofipann Coordinator AVSF Haiti
Wiggens Petiton ENPA Manager MARNDR
Phone and mail interviews/contacts by ENEA
Interviewee Position Organization
Allison Archambault President Earth Spark
Gaston Kramer, Bruno
Mallman
N.C Green Social Bioethanol
Nick Moses R&D Engineer InStove
Dan Sweeney Lead researcher for the D-Lab
Biomass Fuel & Cookstoves Group
MIT
Megan Rapp Africa Team Leader USAID
Development Credit Authority
USAID
Luceno Brady Director, POET Clean Cooking POET
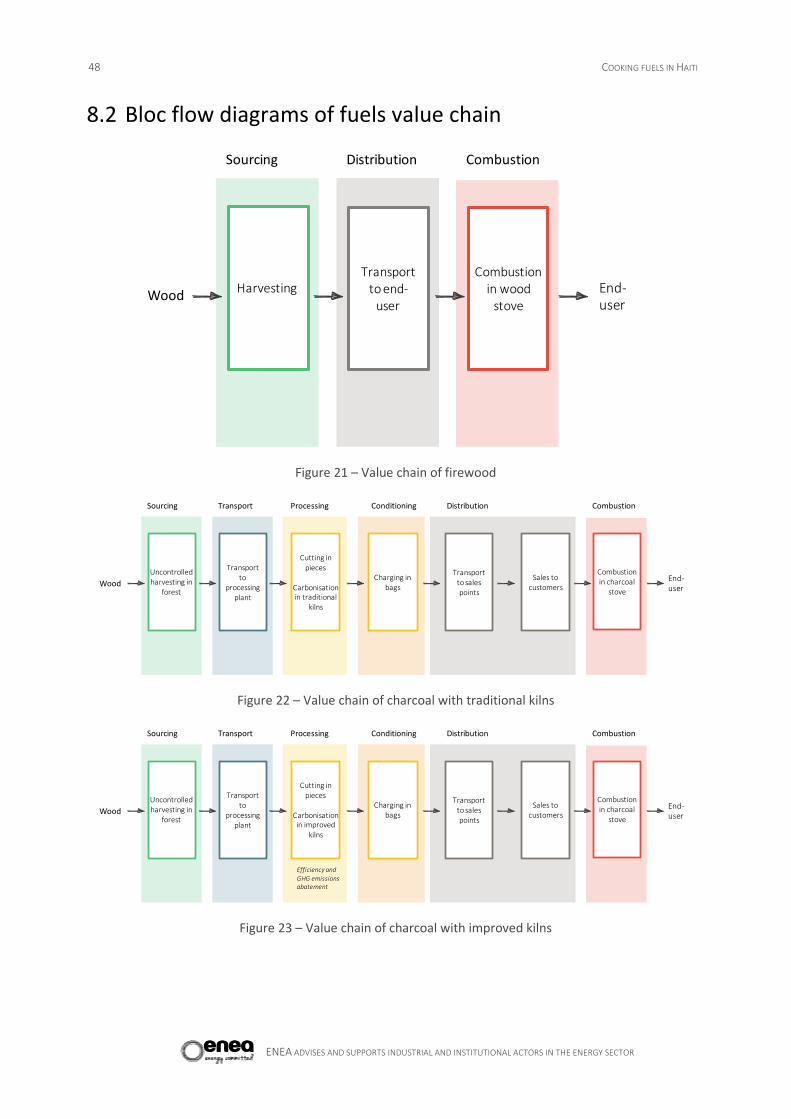
48 COOKING FUELS IN HAITI
ENEA ADVISES AND SUPPORTS INDUSTRIAL AND INSTITUTIONAL ACTORS IN THE ENERGY SECTOR
8.2 Bloc flow diagrams of fuels value chain
Figure 21 – Value chain of firewood
Figure 22 – Value chain of charcoal with traditional kilns
Figure 23 – Value chain of charcoal with improved kilns
Sourcing Distribution
WoodHarvesting
Transport to end-
user
End-user
Combustion in wood
stove
Combustion
Sourcing Transport Processing
Wood
Uncontrolledharvesting in
forest
Transport to
processingplant
Cutting in pieces
Carbonisation in traditional
kilns
Conditioning
Charging in bags
Distribution
End-user
Transport to sales points
Sales to customers
Combustion in charcoal
stove
Combustion
Sourcing Transport Processing
Wood
Uncontrolledharvesting in
forest
Transport to
processingplant
Cutting in pieces
Carbonisation in improved
kilns
Conditioning
Charging in bags
Distribution
End-user
Transport to sales points
Sales to customers
Combustion in charcoal
stove
Combustion
Efficiency and GHG emissionsabatement

ENEA ADVISES AND SUPPORTS INDUSTRIAL AND INSTITUTIONAL ACTORS IN THE ENERGY SECTOR
Figure 24 – Value chain of LPG
Figure 25 – Value chain of ethanol
Figure 26 – Value chain of charbriquettes
Sourcing Distribution
LPG from US
LPG importation
End-user
Conditioning
Storage in tanks
Storage
Cylinder importation
Cookstove importation
Combustion in LPGstove
Combustion
Transport of cylindersFilling cylinder bottles
Transport
Sourcing Transport Processing
Sugarcane
Harvesting
Transport to
processingplant
Fermentation and
distillation
Conditioning
Fillingbottles
Distribution
End-user
To bedefined
Extraction of juice
Sugar refining
Juice
Molasses(optional)
Yeast(optional)
Juice
Bottle importation
Combustion in ethanol
stove
Cookstove importation
Combustion
Sourcing Transport Processing
Sugar cane residues
Ricehusks
Maizeresidues
Collection from the
field
Collection from
distilleries
Transport to
processingplant
Carbonisation Briquetting
Conditioning
Packaging
Distribution
End-userTo be
defined
Agricultural waste
Bagasse
Agro-processingwaste
Energy Binder,water
Combustion in charcoal
stove
Combustion
Plastic bag importation

50 COOKING FUELS IN HAITI
ENEA ADVISES AND SUPPORTS INDUSTRIAL AND INSTITUTIONAL ACTORS IN THE ENERGY SECTOR
Figure 27 – Value chain of non-carbonized briquettes
Figure 28 – Value chain of pellets
Figure 29 – Value chain of electricity from solar microgrid
Sourcing Transport Processing
Transport to
processingplant
Crushing
Briquetting
Conditioning
Packaging
Distribution
End-userTo be
defined
Energy Water(optional)
Municipal waste
Paper
Sawdust
Collection
Importation
Combustion
To bedefined
Plastic bag importation
Sourcing Transport Processing
Collection from
distilleries
Transport to
processingplant
FineCrushingPelletting
Conditioning
Packaging
Distribution
End-user
To bedefined
Energy ? Water ?(optional)
Bagasse
Combustion
To bedefined
Plastic bag importation
Sourcing
Importation of solar panels
Manufacturing
Importation of batteries
Importation of grid cables and instrumentation
Importation of electric cooking device
Use
Transport & installation
Use Recycling
To be defined

ENEA ADVISES AND SUPPORTS INDUSTRIAL AND INSTITUTIONAL ACTORS IN THE ENERGY SECTOR
8.3 Resource assessment results
Figure 30 – Number of households able to replace charcoal by an alternative fuel in the four resource assessment scenarios if bagasse is entirely used for charbriquettes production
Figure 31 –Number of households able to replace charcoal by an alternative fuel in the four resource assessment scenarios if bagasse is entirely used for pellets production
Conservative Middle Aggressive
Waste paper briquettes 16 138 16 138 16 138 16 138
Charbriquettes - maize 28 343 28 343 56 686 56 686
Charbriquettes - rice 6 228 6 228 12 456 12 456
Charbriquettes - sugar cane stems 30 591 30 591 61 181 163 150
Charbriquettes - sugar cane bagasse 20 190 27 785 35 380 86 015
Charbriquettes - sweet sorghum bagasse 0 39 948 39 948 39 948
Pellets - sugar cane bagasse 0 0 0 0
Pellets - sweet sorghum bagasse 0 0 0 0
Ethanol - sugar cane 0 29 508 59 017 255 740
Ethanol - sweet sorghum 0 155 205 155 205 155 205
Total number of households able to
replace charcoal by alternative fuel101 489 333 746 436 012 785 339
Total number of urban households 1 218 242
Theoretical potential
Bagasse surpluses are used in charbriquettes
2014
(historically low
productivity)
Conservative Middle Aggressive
Waste paper briquettes 16 138 16 138 16 138 16 138
Charbriquettes - maize 28 343 28 343 56 686 56 686
Charbriquettes - rice 6 228 6 228 12 456 12 456
Charbriquettes - sugar cane stems 30 591 30 591 61 181 163 150
Charbriquettes - sugar cane bagasse 0 0 0 0
Charbriquettes - sweet sorghum bagasse 0 0 0 0
Pellets - sugar cane bagasse 69 004 94 962 120 921 293 978
Pellets - sweet sorghum bagasse 0 136 534 136 534 136 534
Ethanol - sugar cane 0 29 508 59 017 255 740
Ethanol - sweet sorghum 0 155 205 155 205 155 205
Total number of households able to
replace charcoal by alternative fuel150 303 497 509 618 138 1 089 887
Total number of urban households 1 218 242
Theoretical potential
Bagasse surpluses are used in charbriquettes
2014
(historically low
productivity)

52 COOKING FUELS IN HAITI
ENEA ADVISES AND SUPPORTS INDUSTRIAL AND INSTITUTIONAL ACTORS IN THE ENERGY SECTOR
8.4 Main assumptions in the LCA model
General assumptions
The nominal value on the fraction of non-renewable biomass (fNRB) used in models is 30%, in accordance to the results of the Stockholm Environmental Institute (SEI) conducted in parallel with the present study.
Impact from land transformation on Climate Change are the result of carbon release from the soil and roots in areas deforested (i.e. for applicable to the fNRB fraction of wood only). The following assumptions were made for the calculation of the carbon release due to land transformation:
Carbon dioxide release due to roots degradation:
The carbon content of roots is similar to the carbon content of above-ground biomass ( 49% of dry mass share)
The mass ratio of below-ground biomass to above-ground biomass is 0.37 tonne of dry root/tonne of dry shoot ([21] table 4.4)
Carbon dioxide release due to soil degradation: it has to be estimated from the difference in soil organic carbon content. The following default values are suggested:
Soil organic carbon content before deforestation = 19.4 kg/m² (mean value for a secondary forest in alfisols, inceptisols, oxisols, ultisols and vertisols that are the types of soils relevant for energy access project areas in the world [22])
Soil organic carbon loss due to deforestation = 36% (corresponding to the change from secondary forest to grass land [22]
Transport is modeled using Ecoinvent data with vehicles compliant with the EURO3 norms which entail little restriction on transport emissions in order to be as close as possible to Haiti standards for trucks.
The three-stone fire used for firewood is the only stove that is not modeled: it has no impact as it does not require directly any processed material such as metal. All the other cooking devices are made with steel. The ethanol stoves and the rice cooker for electric cooking are the only ones that also contain another material than steel, respectively aluminum or polypropylene (PP). Steel, aluminum and PP are modeled with generic world data from the Ecoinvent database. The model accounts for lifetime and annual consumption of a family.
Combustion emissions, as well as black carbon (BC) and short-lived climate pollutants (SLCP) are taken from data related to similar processes in the GACC FACIT tool [10]. If several countries are considered, the country the closest geographically to Haiti (often Guatemala) is selected.
Firewood
The energy content corresponds to the energy contained in the wood. It does not take into account the photosynthetic efficiency. It is hence related to the cooking efficiency.
No packaging is needed for the scenario.
No transport is considered, since the firewood is considered harvested close to the place of use.
Except for CO2 the combustion emissions are related to the combustion of firewood in a traditional mud stove in Ghana [10]. The emissions of Black carbon and SLCP at combustion are Guatemala data [10]. Since no emissions of PM2.5 were given by this source, emissions of PM2.5 were taken from the emissions related to the combustion of brushwood in brick stove with flue in China [10].

ENEA ADVISES AND SUPPORTS INDUSTRIAL AND INSTITUTIONAL ACTORS IN THE ENERGY SECTOR
Charcoal
Data for carbonization emissions is based on carbonization data in an earth mound kilns in Kenya [23], while data for BC & SLCP emissions are taken from charcoal production data in Guatemala [10]. They are both combined with charcoal yield, directly related to the efficiency of the carbonization kiln. Four scenarios are modeled to take into consideration the variability of the carbonization impact that depends on the kiln characteristics. The parameters listed in Table 2 are the only inputs that differ between the four charcoal scenarios.
Scenario Traditional kiln, minimum efficiency
Traditional kiln, maximum efficiency
Improved kiln, minimum efficiency
Improved kiln, maximum efficiency
Energy efficiency 2227% 4428% 4429% 5930%
Charring emissions (g/per kg of carbonized wood)
CO2, PM2.5
Similar to carbonization in Kenya (earth mound kilns [23])
Similar to carbonization in Kenya (earth mound kilns [23])
Same than traditional kiln, weighted by efficiency
Same than traditional kiln, weighted by efficiency
BC & SLP Similar to carbonization in Guatemala[10]
Similar to carbonization in Guatemala[10]
Same than traditional kiln, weighted by efficiency
Same than traditional kiln, weighted by efficiency
CO, CH4, NMHC, N2O and NOx
Charring emissions similar to carbonization in Kenya (earth mound kilns [23])
Charring missions similar to carbonization in Kenya (earth mound kilns [23])
50% reduction compared to traditional kiln, weighted by efficiency
50% reduction compared to traditional kiln, weighted by efficiency
Table 2 – Variable parameters related to the environmental impacts of carbonization for the four scenarios on charcoal
No packaging is needed for the scenario.
Transport by truck31 is considered for distribution, modeled with Ecoinvent data.
Except CO2 emissions, the emissions of combustion are related to the combustion of charcoal in metal stoves in India (and also considered valid for China, Bangladesh and Guatemala) [10]. The combustion emissions of
27 Earth mound kiln with 15% dry mass yield and 50% moisture content in wood
28 Earth mound kiln with 30% dry mass yield and 50% moisture content in wood
29 Adam retort kiln with 30% dry mass yield [17] and 50% moisture content in wood
30 Adam retort kiln with 40% dry mass yield [17] and 50% moisture content in wood
31 Transport, freight, lorry 7.5-16 metric ton, EURO3 {RoW}[9]

54 COOKING FUELS IN HAITI
ENEA ADVISES AND SUPPORTS INDUSTRIAL AND INSTITUTIONAL ACTORS IN THE ENERGY SECTOR
Black Carbon and SLCP are from Guatemala [10]. Emissions of PM2.5 for charcoal combustion were communicated by the Alliance directly.
Charbriquettes
The feedstock mix in charbriquettes is based on the quantity of available residues estimated in the “Theoretical potential - conservation” resource assessment scenario (see §2). Environmental impacts of the different raw materials are modeled using Ecoinvent data. Economic allocation factors are used to scale the impacts to the specific part of the crop that is used in the charbriquette.
Maize32 and rice33 input data represents world average cropping practices Sugarcane34, input data represent cropping practices in Brazil. Sugarcane cropping practices in Haiti use
fewer inputs, but give a lower yield as compared to Brazil. All in all, since no other information could be collected, it is considered that the same ratio of inputs per hectare is needed for sugarcane cultivation in Haiti as compared to Brazil.
Since no specific charring emissions are available for charbriquettes, BC, SLCP and all the other charring emissions are the same than the ones used for charcoal, weighted with the charring yield. The binder (corn starch imported from the US) is modeled with world average coefficients from Ecoinvent database35. Electricity for briquetting is modeled using Haiti’s electricity mix (80% diesel, 20% hydro [24]).
Packaging is a plastic bag, considered to be made out of Low Density Polyethylene (Ecoinvent data for LDPE world average [25]). The model accounts for bag capacity and number of uses. End of life in landfill is considered (Ecoinvent data for landfilling of PE in Switzerland, the only country with available emissions data [25]).
Transport by minibus (4t) is considered for distribution, modeled with Ecoinvent data36.
Since no specific combustion emissions and no specific BC & SLCP emissions are available for charbriquettes, combustion emissions and BC & SLCP emissions for charcoal are used. 100% of CO2 emissions are considered biogenic.
Non-carbonized briquettes
Raw materials considered in the scenario are sawdust, cardboard and paper: the feedstock mix is based on existing Fuego del Sol non-carbonized briquettes business [11].
Sawdust is modeled using a world average Ecoinvent data37. Waste paper and cardboard are considered with no impact.
32 Maize grain {GLO}| market for | Alloc Rec, U from Ecoinvent data base [9]
33 Rice {GLO}| market for | Alloc Rec, U from Ecoinvent data base [9]
34 Sugarcane {BR}| market for | Alloc Rec, U from Ecoinvent data base [9]
35 Maize starch {GLO}| market for | Alloc Rec, U from Ecoinvent data base [9]
36 Transport, freight, lorry 3.5-7.5 metric ton, EURO3 {RoW} from Ecoinvent data base [9]
37 Saw dust, wet, measured as dry mass {GLO}| market for | Alloc Rec, U from Ecoinvent data base [9]
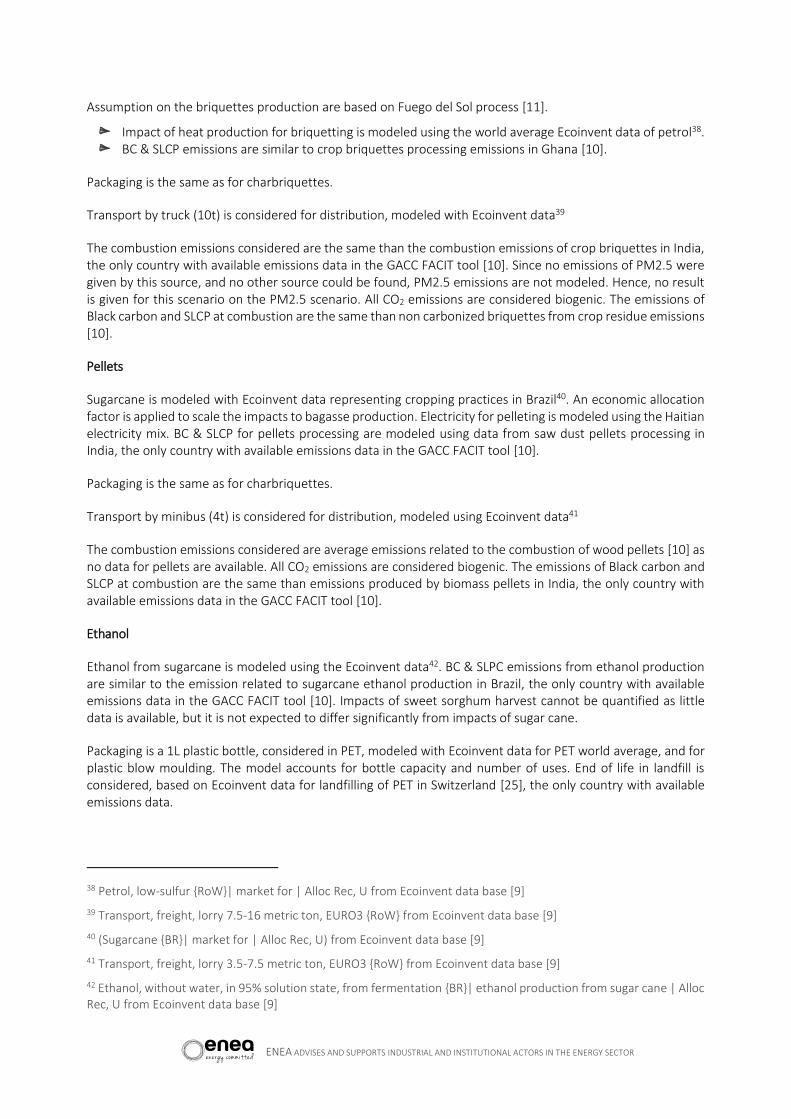
ENEA ADVISES AND SUPPORTS INDUSTRIAL AND INSTITUTIONAL ACTORS IN THE ENERGY SECTOR
Assumption on the briquettes production are based on Fuego del Sol process [11].
Impact of heat production for briquetting is modeled using the world average Ecoinvent data of petrol38. BC & SLCP emissions are similar to crop briquettes processing emissions in Ghana [10].
Packaging is the same as for charbriquettes.
Transport by truck (10t) is considered for distribution, modeled with Ecoinvent data39
The combustion emissions considered are the same than the combustion emissions of crop briquettes in India, the only country with available emissions data in the GACC FACIT tool [10]. Since no emissions of PM2.5 were given by this source, and no other source could be found, PM2.5 emissions are not modeled. Hence, no result is given for this scenario on the PM2.5 scenario. All CO2 emissions are considered biogenic. The emissions of Black carbon and SLCP at combustion are the same than non carbonized briquettes from crop residue emissions [10].
Pellets
Sugarcane is modeled with Ecoinvent data representing cropping practices in Brazil40. An economic allocation factor is applied to scale the impacts to bagasse production. Electricity for pelleting is modeled using the Haitian electricity mix. BC & SLCP for pellets processing are modeled using data from saw dust pellets processing in India, the only country with available emissions data in the GACC FACIT tool [10].
Packaging is the same as for charbriquettes.
Transport by minibus (4t) is considered for distribution, modeled using Ecoinvent data41
The combustion emissions considered are average emissions related to the combustion of wood pellets [10] as no data for pellets are available. All CO2 emissions are considered biogenic. The emissions of Black carbon and SLCP at combustion are the same than emissions produced by biomass pellets in India, the only country with available emissions data in the GACC FACIT tool [10].
Ethanol
Ethanol from sugarcane is modeled using the Ecoinvent data42. BC & SLPC emissions from ethanol production are similar to the emission related to sugarcane ethanol production in Brazil, the only country with available emissions data in the GACC FACIT tool [10]. Impacts of sweet sorghum harvest cannot be quantified as little data is available, but it is not expected to differ significantly from impacts of sugar cane.
Packaging is a 1L plastic bottle, considered in PET, modeled with Ecoinvent data for PET world average, and for plastic blow moulding. The model accounts for bottle capacity and number of uses. End of life in landfill is considered, based on Ecoinvent data for landfilling of PET in Switzerland [25], the only country with available emissions data.
38 Petrol, low-sulfur {RoW}| market for | Alloc Rec, U from Ecoinvent data base [9]
39 Transport, freight, lorry 7.5-16 metric ton, EURO3 {RoW} from Ecoinvent data base [9]
40 (Sugarcane {BR}| market for | Alloc Rec, U) from Ecoinvent data base [9]
41 Transport, freight, lorry 3.5-7.5 metric ton, EURO3 {RoW} from Ecoinvent data base [9]
42 Ethanol, without water, in 95% solution state, from fermentation {BR}| ethanol production from sugar cane | Alloc Rec, U from Ecoinvent data base [9]

56 COOKING FUELS IN HAITI
ENEA ADVISES AND SUPPORTS INDUSTRIAL AND INSTITUTIONAL ACTORS IN THE ENERGY SECTOR
Transport by minibus (4t) is considered for distribution, modeled using Ecoinvent data43.
The combustion emissions considered are average emissions related to the combustion of sugarcane ethanol in alcohol stove [25]. All CO2 emissions are considered biogenic. The emissions of Black carbon and SLCP at combustion are the same than emissions related to the heat from ethanol and wood (average for all countries) [10].
LPG
LPG commercialized in Haiti is conventional propane [26]. Production of LPG is modeled using the world average data from Ecoinvent44. BC & SLCP emissions for LPG production are the same than emissions in Guatemala [10].
Packaging of LPG is added to the model, using Ecoinvent data for steel and processing of steel. The model accounts for bottle capacity and number of refills. Impacts of the bottling stage are the same than bottling of LPG in India [10]. BC & SLCP emissions associated with the bottling stage are modeled using assumptions from LPG processing in Guatemala [10], chosen for geographic proximity.
Transport by truck (5t) is considered for distribution, and for return trip for refill, modeled using Ecoinvent data45
The combustion emissions considered are the emissions related to the combustion of LPG in LPG stove in India [10], the only country with available emissions data. Since no emissions of PM2.5 were given by this source, emissions of PM2.5 were added using GACC online fuels catalog. All CO2 emissions are considered fossil. The emissions of Black carbon and SLCP at combustion are the same than the ones emitted by the heat from LPG in Guatemala [10].
Solar electricity from mini-grid
The devices for solar electricity production and mini-grid are estimates, and they are modeled using the best proxies possible from the Ecoinvent database. Solar panels and batteries are modeled using Ecoinvent data for PV solar rooftop panels46 and NaCl batteries47. Cables for the mini-grid are modeled using Ecoinvent generic data48. The end of life of those devices is not taken into account because of lack of data in available databases.
43 Transport, freight, lorry 3.5-7.5 metric ton, EURO3 {RoW} from Ecoinvent data base [9]
44 Liquefied petroleum gas {RoW}| market for | Alloc Rec, U from Ecoinvent data base [9]
45 Transport, freight, lorry 3.5-7.5 metric ton, EURO3 {RoW} from Ecoinvent data base [9]
46 Photovoltaic flat-roof installation, 3kWp, single-Si, on roof {GLO}| market for | Alloc Rec, U from Ecoinvent data base [9]
47 Battery, NaCl {GLO}| market for | Alloc Rec, U from Ecoinvent data base [9]
48 Cable, unspecified {GLO}| market for | Alloc Rec, U from Ecoinvent data base [9]

ENEA ADVISES AND SUPPORTS INDUSTRIAL AND INSTITUTIONAL ACTORS IN THE ENERGY SECTOR
8.5 Input data of the LCA model
Firewood
Figure 32 – LCA assumptions for firewood
Charcoal
Figure 33 – LCA assumptions for charcoal with traditional kiln and minimum efficiency, sourcing to packaging
Element Value Unit
Sourcing and production
LHV wood anhydrous 19 MJ/kg
LHV wood wet (50% moisture) 8,3 MJ/kg
Deforestation
fNRB 0,66
Packaging
N/A
Transport
Average distance (one way) 0 km
Cooking device
3 stone stove -
Combustion
Cooking efficiency 0,143 MJ(out)/MJ(LHV)
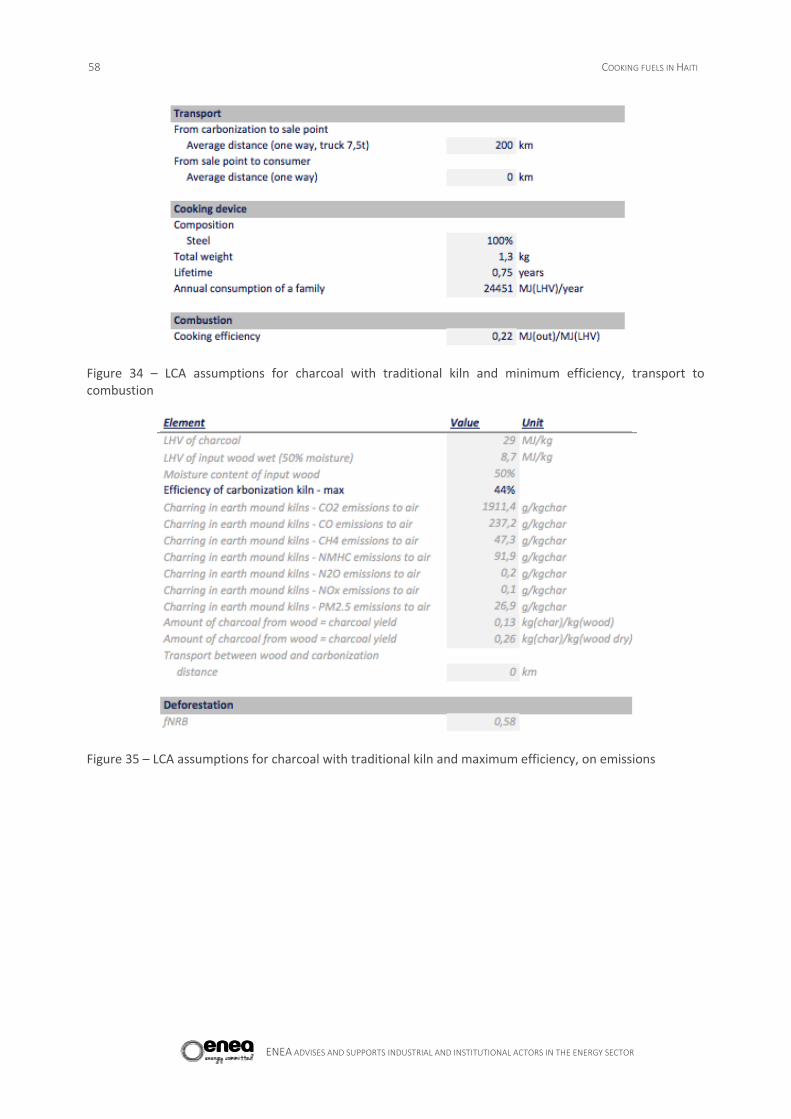
58 COOKING FUELS IN HAITI
ENEA ADVISES AND SUPPORTS INDUSTRIAL AND INSTITUTIONAL ACTORS IN THE ENERGY SECTOR
Figure 34 – LCA assumptions for charcoal with traditional kiln and minimum efficiency, transport to combustion
Figure 35 – LCA assumptions for charcoal with traditional kiln and maximum efficiency, on emissions

ENEA ADVISES AND SUPPORTS INDUSTRIAL AND INSTITUTIONAL ACTORS IN THE ENERGY SECTOR
Figure 36 - LCA assumptions for charcoal with traditional kiln and maximum efficiency, from packaging to combustion
Figure 37 – LCA assumptions for charcoal with improved kiln and minimum efficiency, sourcing and production

60 COOKING FUELS IN HAITI
ENEA ADVISES AND SUPPORTS INDUSTRIAL AND INSTITUTIONAL ACTORS IN THE ENERGY SECTOR
Figure 38 – LCA assumptions for charcoal with improved kiln and minimum efficiency, from deforestation to combustion
Figure 39 – LCA assumptions for charcoal with improved kiln and maximum efficiency on sourcing and production
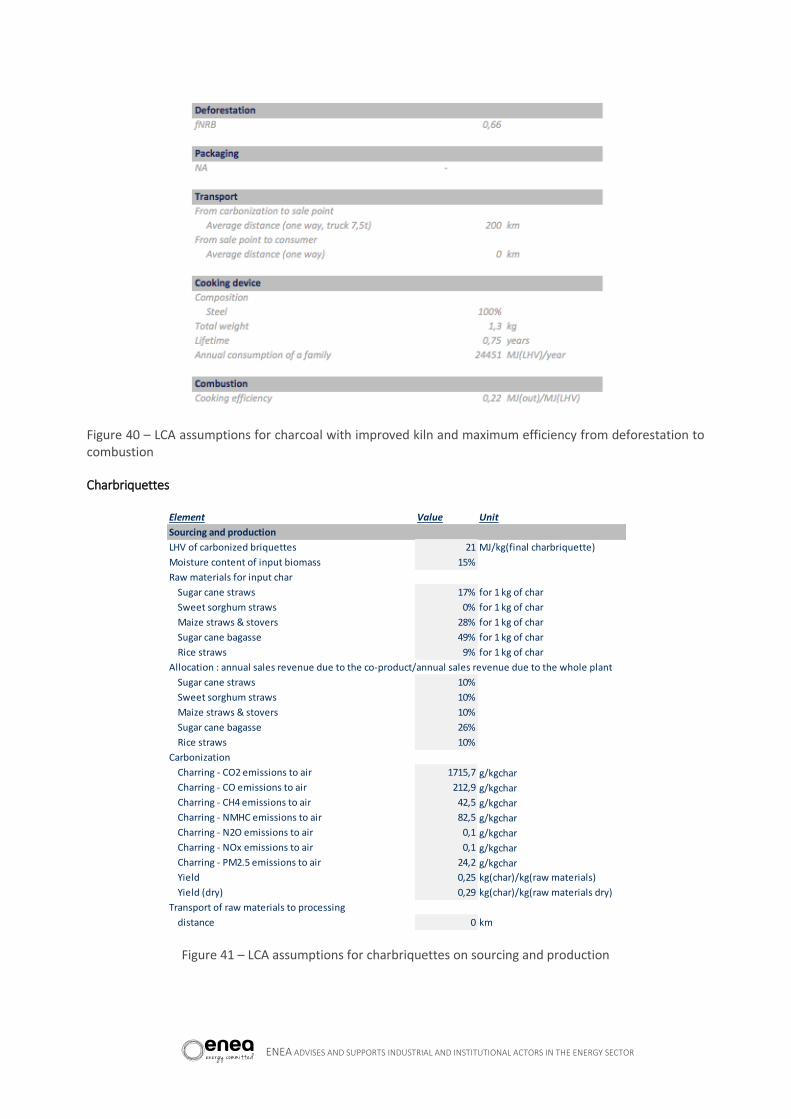
ENEA ADVISES AND SUPPORTS INDUSTRIAL AND INSTITUTIONAL ACTORS IN THE ENERGY SECTOR
Figure 40 – LCA assumptions for charcoal with improved kiln and maximum efficiency from deforestation to combustion
Charbriquettes
Figure 41 – LCA assumptions for charbriquettes on sourcing and production
Element Value Unit
Sourcing and production
LHV of carbonized briquettes 21 MJ/kg(final charbriquette)
Moisture content of input biomass 15%
Raw materials for input char
Sugar cane straws 17% for 1 kg of char
Sweet sorghum straws 0% for 1 kg of char
Maize straws & stovers 28% for 1 kg of char
Sugar cane bagasse 49% for 1 kg of char
Rice straws 9% for 1 kg of char
Allocation : annual sales revenue due to the co-product/annual sales revenue due to the whole plant
Sugar cane straws 10%
Sweet sorghum straws 10%
Maize straws & stovers 10%
Sugar cane bagasse 26%
Rice straws 10%
Carbonization
Charring - CO2 emissions to air 1715,7 g/kgchar
Charring - CO emissions to air 212,9 g/kgchar
Charring - CH4 emissions to air 42,5 g/kgchar
Charring - NMHC emissions to air 82,5 g/kgchar
Charring - N2O emissions to air 0,1 g/kgchar
Charring - NOx emissions to air 0,1 g/kgchar
Charring - PM2.5 emissions to air 24,2 g/kgchar
Yield 0,25 kg(char)/kg(raw materials)
Yield (dry) 0,29 kg(char)/kg(raw materials dry)
Transport of raw materials to processing
distance 0 km
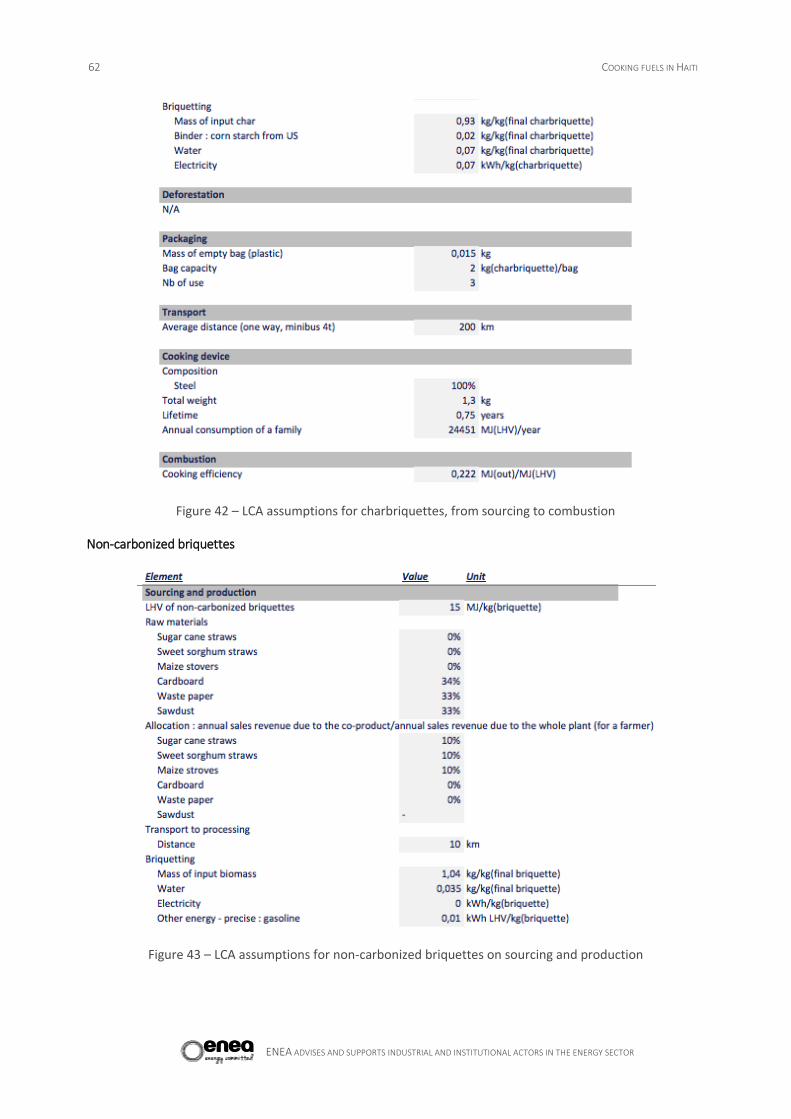
62 COOKING FUELS IN HAITI
ENEA ADVISES AND SUPPORTS INDUSTRIAL AND INSTITUTIONAL ACTORS IN THE ENERGY SECTOR
Figure 42 – LCA assumptions for charbriquettes, from sourcing to combustion
Non-carbonized briquettes
Figure 43 – LCA assumptions for non-carbonized briquettes on sourcing and production

ENEA ADVISES AND SUPPORTS INDUSTRIAL AND INSTITUTIONAL ACTORS IN THE ENERGY SECTOR
Figure 44 – LCA assumptions for non-carbonized briquettes, from deforestation to combustion
Pellets
Figure 45 – LCA assumptions for pellets, from sourcing to packaging
Figure 46 – LCA assumptions for pellets, from transport to combustion

64 COOKING FUELS IN HAITI
ENEA ADVISES AND SUPPORTS INDUSTRIAL AND INSTITUTIONAL ACTORS IN THE ENERGY SECTOR
Ethanol
Figure 47 – LCA assumptions for ethanol
LPG
Figure 48 – LCA assumptions for LPG
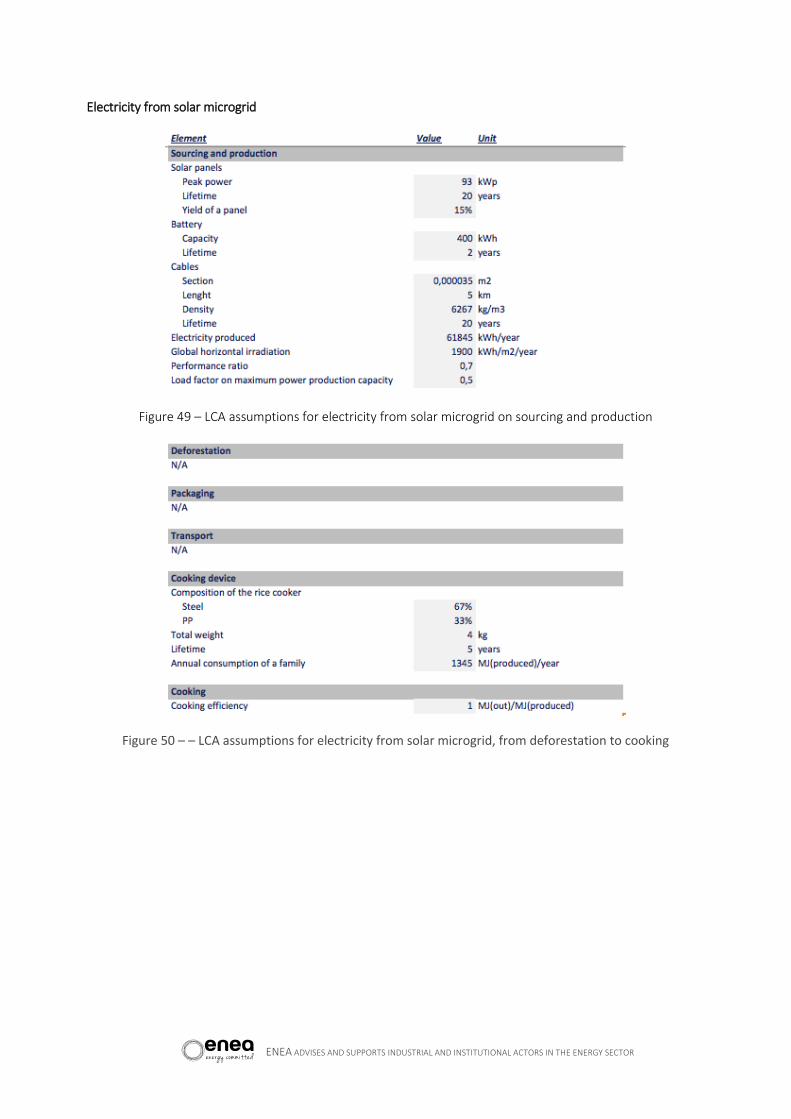
ENEA ADVISES AND SUPPORTS INDUSTRIAL AND INSTITUTIONAL ACTORS IN THE ENERGY SECTOR
Electricity from solar microgrid
Figure 49 – LCA assumptions for electricity from solar microgrid on sourcing and production
Figure 50 – – LCA assumptions for electricity from solar microgrid, from deforestation to cooking
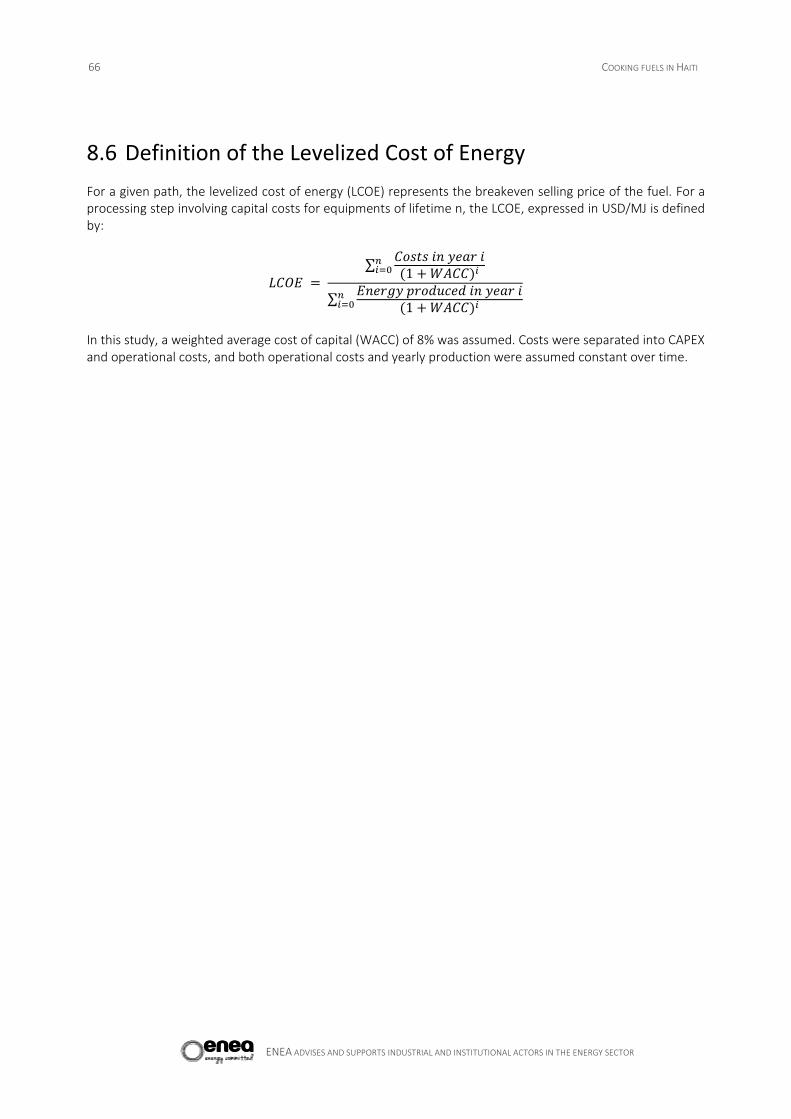
66 COOKING FUELS IN HAITI
ENEA ADVISES AND SUPPORTS INDUSTRIAL AND INSTITUTIONAL ACTORS IN THE ENERGY SECTOR
8.6 Definition of the Levelized Cost of Energy
For a given path, the levelized cost of energy (LCOE) represents the breakeven selling price of the fuel. For a processing step involving capital costs for equipments of lifetime n, the LCOE, expressed in USD/MJ is defined by:
𝐿𝐶𝑂𝐸 =
∑𝐶𝑜𝑠𝑡𝑠 𝑖𝑛 𝑦𝑒𝑎𝑟 𝑖(1 + 𝑊𝐴𝐶𝐶)𝑖
𝑛𝑖=0
∑𝐸𝑛𝑒𝑟𝑔𝑦 𝑝𝑟𝑜𝑑𝑢𝑐𝑒𝑑 𝑖𝑛 𝑦𝑒𝑎𝑟 𝑖
(1 + 𝑊𝐴𝐶𝐶)𝑖𝑛𝑖=0
In this study, a weighted average cost of capital (WACC) of 8% was assumed. Costs were separated into CAPEX and operational costs, and both operational costs and yearly production were assumed constant over time.

67
8.7 Input data of fuel economics
LPG
Outside In PaP Outside PaP In PaP CRI c-briquettes
FDS nc-
briquettes
Bagasse
pellets Min Max In Pap
C-briquettes
raw material
cost / kgtoMJ
-
Mass of input
biomass for
pellets
processing *
Price of 1 kg
bagasse /
kgtoMJ
- - - - C-briquettes
binder cost - - - -
Cost of acquisition operation of
a woody land/(Wood available
in a woody land*Charcoal
carbonisation massic yield -
improved * kgtoMJ)
Price of 1 kg bagasse * (1
+ Revenue increase from
bagasse sales) / (Ethanol
yield per ton of sugarcane
* Ethanol density *
kgtoMJ)
Trad. Charcoal Impr. Charcoal Alternative solid fuels
Electricity
Ethanol
Raw material
Binder
Cost of
acquisition
operation of a
woody
land/(Wood
available in a
woody
land*Charcoal
carbonisation
massic yield -
traditional *
kgtoMJ)
Costs ($/MJ
delivered)

68 COOKING FUELS IN HAITI
ENEA ADVISES AND SUPPORTS INDUSTRIAL AND INSTITUTIONAL ACTORS IN THE ENERGY SECTOR
OPEX
fixed
($/an)
- -
10% * CAPEX
of improved
carbonisation
kiln
10% * CAPEX
of improved
carbonisation
kiln
Number of full
time equivalent
employees in c-
briquette factory
*Qualified
employee salary
in PaP * Working
days per year
Number of full
time
equivalent
employees in c-
briquette
factory
*Qualified
employee
salary in PaP *
Working days
per year
Number of
full time
equivalent
employees in
pellets factory
* Qualified
employee
salary in PaP *
Working days
per year
Costs
Processing
OPEX
variable
($/MJ
delivered)
Electricity
consumption for
c briquettes
processing*Grid
electricty
purchasing cost
for industries /
kgtoMJ
Number of
gasoline
gallons for nc
briquette
processing *
Gasoline price
/ (Average
weight of
briquettes *
kgtoMJ)
Electricity
consumption
for pellets
processing *
Grid electricty
purchasing
cost for
industries /
kgtoMJ
Quantity
of MJ
delivered
(MJ/yr)
12 * Monthly
production of c-
briquettes
factory * kgtoMJ
Annual
production of
the nc-
briquettes
factory *
kgtoMJ
Annual
production of
the pellet
factory *
kgtoMJ
Working
days per
year * Daily
production
of the
distillery
plant
*Density
ethanol *
kgtoMJ
Working
days per
year - 4
months *
Daily
production
of the
distillery
plant
*Density
ethanol *
kgtoMJ
Manwork required to produce
charcoal - improved * Minimum
salary in PaP / kgtoMJ
Volume of the kiln * Bulk
density of a tree log * Charcoal
carbonisation massic yield
improved * 365 * kgtoMJ
Taken into account in
variable OPEX
EtOH Fuel OPEX of a
distillery plant / (Density
ethanol * kgtoMJ)
Manwork
required to
produce charcoal
- traditional *
Minimum salary
in PaP
-

ENEA ADVISES AND SUPPORTS INDUSTRIAL AND INSTITUTIONAL ACTORS IN THE ENERGY SECTOR
Figure 51 – Fuel economics calculations
LCOE
($/MJ
delivered)
Maximum fuel retail price + Stove price
Packaging
kgtoMJ is the coefficient specific to each fuel used to convert (kg fuel) to (MJ delivered to end-user)
kgtoMJ = LHV fuel x Combustion efficiency fuel
Total retail cost + stove price
LCOE ( Purchasing cost of the stove adapted to fuel ; No fixed OPEX ; No variable OPEX ;Annual cooking energy demand per household ;
Stove lifetime ; WACC)
LCOE( CAPEX ; fixed OPEX; variable OPEX; MJ delivered ; Installation lifetime ; WACC )
Cost of transport of CRI bags/ (Weight of CRI bags * kgtoMJ)
Negligible
(Charcoal bulk cost + Charcoal retailer margin
(HTG)) / kgtoMJ Fuel bulk cost * (1 + CRI retailer margin (%) ) / kgtoMJ
Minimum fuel retail price + Stove price Minimum total price
Maximum total price Prices
Transport
Retailer margin
Stove
Total cost

70

ENEA ADVISES AND SUPPORTS INDUSTRIAL AND INSTITUTIONAL ACTORS IN THE ENERGY SECTOR
Figure 52 – Input data on fuel costs and retail prices for fuel economics
CAPEX of NC-briquette factory 299000 $ FDS
Number of full time equivalent employees in
NC-briquette factory 15 employees FDS
Purchasing price of NC briquettes raw materials 0 HTG/kg FDS
Gasoline consumption for nc briquette
processing 1
gal for 150 000
briquettes FDS
Gasoline price 189 HTG/L TotalHaïti
Average weight of nc briquettes 160 g FDS
Electricity for nc briquette production 0
kWh/kg-
briquette FDS
Annual production of the nc briquettes factory 296,4 ton/year FDS
Retail selling price of briquettes 9
$ for a bag of 100
briquettes FDS
Mass of input biomass for pellets processing 1,04
kg-biomass/kg-
briquette FDS
Price of 1 kg bagasse =
C-briquettes raw material cost for 1kg c-
briquettes * (Mass yield of bagasse
carbonization / Mass of input char for c-
briquettes processing)0,007 $/kg bagasse Calculation
CAPEX of bagasse pellets factory 5000000 $ Enea project
Electricity consumption for pellets processing 0,10
kWhelec/kg-
briquette Enea project
Number of full time equivalent employees in
pellet factory
8 workers, 2
management HTG Enea project
Annual production of the pellet factory 1420 ton/year Enea project
LPG Selling price of LPG in PaP 52 HTG/kg PalmisEneji
Ethanol yield per ton of sugarcane 66 L/ton sugarcane
Novogaz, Green
Social
Bioethanol
CAPEX of a distillery plant 690000 USD
Green Social
Bioethanol
Manwork to operate the distillery plant 12
man for 3500 L
ethanol
Green Social
Bioethanol
Consumables costs of the distillery plant 106,05
$ for 3500 L
ethanol
Green Social
Bioethanol
Electricity consumption for ethanol processing 1074
kWh for 3500 L
ethanol
Green Social
Bioethanol
Ethanol
OPEX of a distillery plant =
(Consumables costs of the distillery plant +
Electricity consumption for ethanol processing *
Grid electricity purchasing cost for industries +
Manwork to operate the distillery plant
*Qualified employee salary in PaP)/ Daily 0,13 $/L ethanol Calculation
Daily production of the distillery plant 3500 L ethanol/day
Green Social
Bioethanol
Ethanol
Working days per year - 4 months - Ethanol max
scenario 120 days/yr Enea
Ethanol Retail price imported ethanol max 140 HTG for 1,5 L Novogaz
Ethanol Retail price imported ethanol min 450 HTG for 5 L Novogaz
Electricity Minigrid solar system size 3,6 kWh/day Enea
Electricity Electricity price from solar minigrid 3 $/kWh Enea
Ethanol
NC-
briquettes
Pellets

72 COOKING FUELS IN HAITI
ENEA ADVISES AND SUPPORTS INDUSTRIAL AND INSTITUTIONAL ACTORS IN THE ENERGY SECTOR
Figure 53 – Input data on stove costs and technical data for fuel economics

ENEA ADVISES AND SUPPORTS INDUSTRIAL AND INSTITUTIONAL ACTORS IN THE ENERGY SECTOR
Sources used in the economic analysis are listed in Table 3.
Code name Source Code name Source
Enea [27] FDS [11]
Enea project [17] TotalHaïti [28]
HaïtiLibre [29] Novogaz [15]
CRI [16] Green Social Bioethanol [6]
AFDI2012 [12] EdMGS2014 [30]
Tarter [31] Berkeley [32]
HBWood [33] CleanStoves [34]
GERES [18] EthaApro10 [35]
Nexant2010 [36] EdM [37]
Vetiver [13] EdMBriq2009 [3]
Palmis Enèji [14] EBTP [38]
EDHElec [39] CFBP [40]
Table 3 – Code names of the sources used in the economic analysis

74 COOKING FUELS IN HAITI
ENEA ADVISES AND SUPPORTS INDUSTRIAL AND INSTITUTIONAL ACTORS IN THE ENERGY SECTOR
8.8 Categories of social impact in the Monitoring & Evaluation frame of the Alliance
The categories of social impacts comprised in the two domains of the Monitoring & Evaluation (M&E) of the Alliance and applicable to the scope of the present study are listed below.
Livelihoods
Jobs
Number of paid employees at the organization/enterprise Quality of jobs created
Full-time/part-time - Number of paid full-time employees at the organization/enterprise - Number of paid part-time employees at the organization/ enterprise
Temporary/ seasonal - Number of temporary/seasonal employees at the organization/enterprise
Management level - Number of paid full-time management employees at the organization /enterprise
Area within the value chain - Number & percentage (m/f) of employees in product design - Number & percentage (m/f) of employees in production/manufacturing - Number & percentage (m/f) of employees in wholesale distribution - Number & percentage (m/f) of employees in retail distribution/sales - Number & percentage (m/f) of employees in after-sales service
Geographic location (urban/rural) - Number & percentage (m/f) of employees located in urban settings - Number & percentage (m/f) of employees located in rural settings
Income full-time/part-time
Wages of all employees
Wages of full-time employees
Wages of part-time employees Income management
Wages of management staff Women-owned
Female ownership
Household Social & Economic Well-being
Adoption
Use - Frequency of use of various cooking methods - Minutes spent cooking with each cooking method
Households finances
Economic - Children in school
Money spent on fuel - Expenditure on specific fuel - Overall fuel expenditure
Income through productive use of cookstove - Business in which the customer uses the clean cooking product/device - Change in earnings from using the clean cooking product/device - Changes in business from using the clean cooking product/device
Time use

ENEA ADVISES AND SUPPORTS INDUSTRIAL AND INSTITUTIONAL ACTORS IN THE ENERGY SECTOR
Time spent on fuel collection - Time spent on fuel collection - Household members involved in fuel collection - Perception of reduction in time spent on fuel collection - Use of time saved on fuel collection
Time spent on cooking - Time spent on cooking - Household members involved in cooking - Multi-tasking while cooking - Perception of reduction in time spent on cooking - Use of time saved on cooking
Status
Status within the family/community - Perception of change in status
Safety/protection
Fuel collection safety/ protection - Perception of changes in cooking safety
Cooking safety/ protection - Experience of risks to respondent safety - Experience of risks to safety of other household members
Drudgery
Fuel purchase drudgery - Drudgery associated with fuel purchase (# of trips/month, time spent, distance traveled,
weight carried)
Fuel collection drudgery - Drudgery associated with fuel collection (# of trips/month, time spent, distance traveled,
weight carried)
Cooking drudgery
Perception of change in cooking drudgery

76 COOKING FUELS IN HAITI
ENEA ADVISES AND SUPPORTS INDUSTRIAL AND INSTITUTIONAL ACTORS IN THE ENERGY SECTOR
8.9 Feedback from the interviews and literature review on social aspects of the fuels value chains
Firewood
Most of firewood is collected by women and children for direct use without formal or informal job creation.
Traditional charcoal
Charcoal production, transport and distribution is a significant source of employment and creation of local economic value in Haiti. Charcoal production is predominantly achieved by farmers as a complementary source of incomes. Farmers can produce charcoal alone or in groups with up to 5 persons [31]. In the South Department, a farmer produces 11 bags49 of charcoal per week in average as a complementary activity to farming [41].
Men are in charge of wood cutting and carbonization while women take care of the charcoal packaging before transport. Charcoal transport to urban areas by truck is done by men while sales (wholesale and retail) are predominantly managed by women (Madame Sara).
Improved charcoal
The use of improved kilns to produced charcoal would require to transport the wood with additional work and burden on this step compared to traditional charcoal. The production of improved charcoal implies fixed kilns typically made of bricks and cement. The high capital cost of this type of kiln (in the order of magnitude of USD 1,000 per kiln [18]) may exclude smallholder farmers of the activity of charcoal production with the wealthiest farmers being owners of the kilns. The downstream steps of the value chain (i.e. those involving women) should not be impacted by the “improved” vs “traditional” feature of the charcoal.
Carbonized briquettes
Carbonized briquettes can be made from agricultural residues usually left on the field (stems, leaves, straws) or from by-products available at food processing units (bagasse). Women are active in almost all agricultural value chains [42]. The distribution of waged work for farming is balanced between women and men [42]. Men still tend to manage farms (in the South department only a quarter of farms are managed by women) [42]. The collection of agricultural wastes traditionally falls to women. Developing of a fuel value chain of charbriquettes based on agricultural residues may thus increase the burden of tasks achieved by women in rural areas. Charbriquettes made of bagasse are however not expected to impact women particularly because roles between women and men in the sugar cane value chain are balanced [43].
The only current example of charbriquette production in Haiti lies in the activity of Carbon Roots International (CRI). The company employs about 50 people with 40 for operational jobs and 10 for management jobs. Men weight for 60% of the employees, mostly in raw material sourcing (collection of bagasse) and fuel production, including operational and management jobs [16]. Women weight for the remaining 40% of jobs, mostly in sales, including operational and management jobs [16]. Kilns operators are equipped with safety boots, masks and gloves [16]. Operational jobs for supply and production are waged about 10-11 USD/day which is twice the minimum daily wage in PaP (approximately 5 USD/day) [16]. If CRI invests in a new generation technology for carbonization, a lower number of employees will be required [16].
49 The weight or volume of this unit is not specified in the source but the bag mentioned should likely be a 30 kg bag.

ENEA ADVISES AND SUPPORTS INDUSTRIAL AND INSTITUTIONAL ACTORS IN THE ENERGY SECTOR
Non-carbonized briquettes
The only current example of non-carbonized briquette value chain in Haiti lies in the activity of Fuego del Sol (FDS). The company accounts for 8 full time employees and 14 part time employees. Among this staff, 5 women are trainers and 1 is part of the management and own 5% of the company. The operational staff earns 8.5-10 USD/day and food for working days. The management/owner staff earns 450-500 USD/month.
Pellets
There is no production of pellets currently in Haiti. However, we can expect roles to be distributed similarly to carbonized briquettes produced from bagasse. In this case, the roles between men and women would be balanced for sugar cane production and transformation, mostly assigned to men for collection of bagasse and production of the fuel, and exclusively assigned to women for sales.
Ethanol
Ethanol is currently not produced locally in Haiti but we can expect the activities of production and transformation of sugar cane into ethanol to be balanced between men and women, as it is for the current production of alcoholic beverage from sugar cane [43]. Similarly to other fuels, sales would be under the responsibility of women.
Novogaz is the sole company active in Haiti in the ethanol sector. They package and sell imported ethanol and account for 5 employees including 1 manager, 2 operators on the packaging step and 2 vendors [44]. Among this staff, only 1 person is a male, working on the packaging step.
LPG
The LPG value chain relies on an imported fuel and should thus be expected to create a low number of jobs compared to value chains based of fuels locally produced and sourced. Because the LPG value chain is mostly oriented towards sales, its jobs should traditionally be assigned to women. However, LPG tend to be sold in large shops not necessarily owned and managed by women. Within Palmis Enèji shops selling LPG, one third of employees are women.
Electricity
Cooking on electricity from a solar microgrid in Haiti is expected to create a relatively low number of local jobs because it implies the local activity of a microgrid operator only while most of the value is located in imported equipments (i.e. solar panels, batteries). Gender issues for the operation of a microgrid in Haiti cannot be presumed at this stage given the low maturity and feedback available so far.

78 COOKING FUELS IN HAITI
ENEA ADVISES AND SUPPORTS INDUSTRIAL AND INSTITUTIONAL ACTORS IN THE ENERGY SECTOR
8.10 Summary of information collected on LPG
Information collected from interviews with P. DION, R. JEAN-JUMEAU, J.F. LAMBERT, N. DAVID.
Current Market Trend:
The Haitian LPG market is significantly underdeveloped with an annual consumption of 15,000 tons or less than 2 kg per inhabitant when other developing countries in the sub-region have a consumption of 5 to 10 kg per inhabitant (up to 25 kg in El Salvador). It has been stagnating for many years.
Most past attempts at developing LPG on a larger scale have failed due to two main factors:
The high cost of purchasing the cylinder and LPG stove for middle and low income households.
The lack of a robust regulatory framework for the LPG sector and the opening of hundreds of independent microfilling centers which fail to abide by the minimum safety standards of the sector. Crossfilling of cylinders by these actors in particular has led the two largest LPG marketers, Dinasa and Total, to postpone their investments in this activity.
Nevertheless the existing storage capacity is sufficient to enable a significant growth of the sector: the combined storage capacity of Dinasa and Total could serve a market of 50,000 tons per year (USAID, 2010: 7).
Overview of the LPG value chain:
There is no LPG production in Haiti and the fuel is imported from abroad. Total and Dinasa are the only two companies to own the port facilities needed to land LPG from the sea,
and as such the only two importers of LPG. Some LPG also comes overland from the Dominican Republic, both legally and through black market channels. Dinasa markets its LPG under the Sodigaz brand.
In 2010 Dinasa had 850 tons in storage capacity while Total had 1,000 with the foundations already built to expand to 1,400 tons. Dinasa accounted for 60% of LPG imports while Total accounted for 40%. Dinasa is thought to import 750 tons of LPG every 2-3 weeks while Total imports 900 tons a month (USAID, 2010: 8).
Dinasa and Total supply the two other large size distributors of the country: Ecogaz and Canez Distribution who in turn supply the small size distributors (eg: owners of one or two microfilling centers). The latter cannot purchase LPG directly from Dinasa and Total because they lack the vehicles needed to transport bulk LPG.
The price structure of LPG is unregulated and is heavily skewed toward the top of the value chain. The two LPG importers retain a disproportionate share of margins.
In October 2016, the retail price of LPG purchased from a Total reseller was 310 HTG (4.75 USD) for a 12 Lbs refill and 640 HTG (9.85 USD) for a 25 Lbs refill.
Development path:
A concept note developed by the LPG working group convened by the line ministry (MTPTC) in 2010 advocated for the following actions in support of LPG development:
Adoption of a law regulating the LPG sector, enabling an independent body to enforce safety standards and the protection of cylinder ownership.
Creation of a system of controlled prices to protect consumers against international market volatility. Support of marketer investment in new LPG cylinders through the creation of a sector organization in
charge of managing the cylinders and removing damaged cylinders from the market. The report recommended that the price of the cylinder be largely subsidized to boost the development of the market.
Set up of partnerships with MFIs to offer credit facilities to new LPG users.

ENEA ADVISES AND SUPPORTS INDUSTRIAL AND INSTITUTIONAL ACTORS IN THE ENERGY SECTOR
Strategy ● Innovation and technology ● Project Structuring and Development
ENEA advises and supports industrial and institutional actors in the energy sector
Energy companies | Industrial companies | Start-ups | Investors | Engineering firms | OEMs and Research Centres | Public Authorities
89, rue Réaumur, 75002 Paris +33 (0) 1 82 83 83 83
www.enea-consulting.com


