
Cooled Gas Turbine ModelA Thermodynamic Model to Quantify the Impact of Cooling Improvements on Gas Turbine Efficiency
Can UysalMentor(s): Dr. James Black, Eric LieseWVU Advisor: Dr. Andrew C. NixNovember 1, 2016
2
• Introduction• Theory and Development• Cooled Turbine Model (CTM)• Cooled Gas Turbine Model (CGTM)• Sensitivity Analysis with CGTM• Conclusions and Future Work
Schedule
3
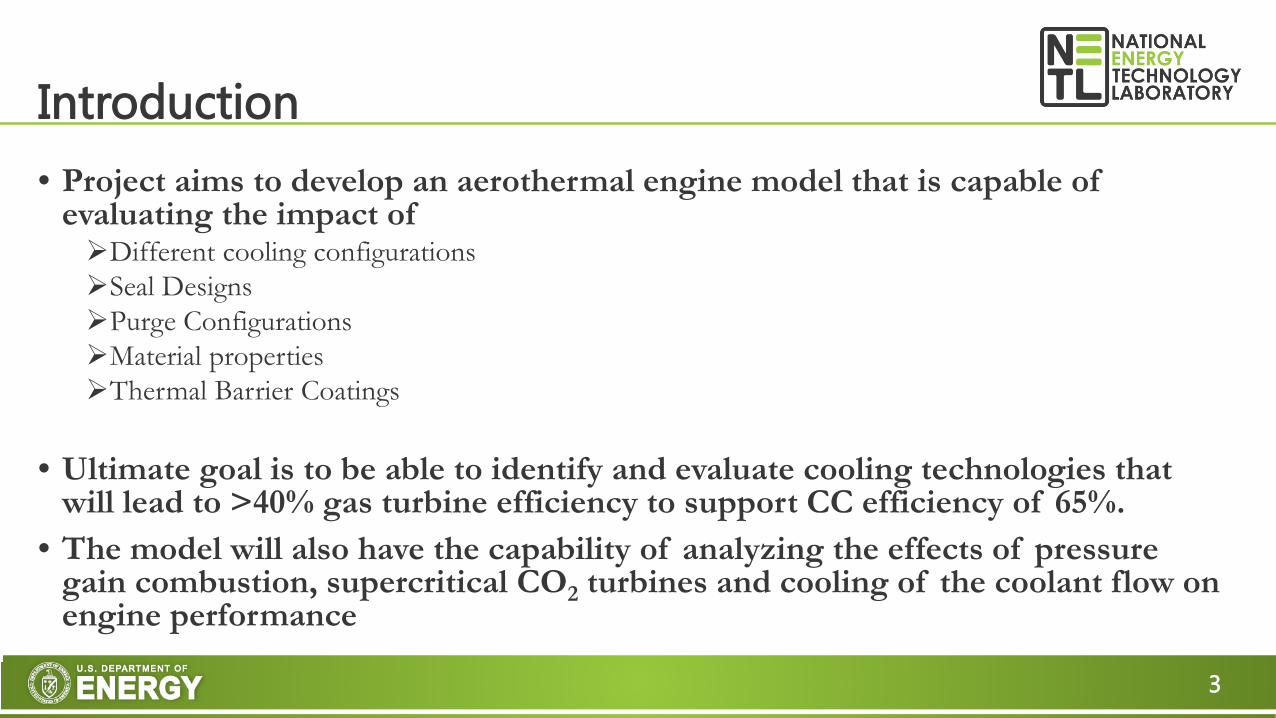
• Project aims to develop an aerothermal engine model that is capable of evaluating the impact ofDifferent cooling configurationsSeal DesignsPurge ConfigurationsMaterial propertiesThermal Barrier Coatings
• Ultimate goal is to be able to identify and evaluate cooling technologies that will lead to >40% gas turbine efficiency to support CC efficiency of 65%.
• The model will also have the capability of analyzing the effects of pressure gain combustion, supercritical CO2 turbines and cooling of the coolant flow on engine performance
Introduction

4
IntroductionThe location of Cooled Gas Turbine Model in Combined Cycle Performance Calculations
Cooled Gas Turbine Model
Cooled Turbine Model
Cooling Correlations

5
Project phases and completion dates are as follows:1. Literature Review & Determining the Model Flowcharts (02/19/2016)2. Cooled Turbine Model Development & Validations (04/24/2016)3. CGTM Development (06/30/2016) 4. CGTM Validations (08/31/2016)5. General Sensitivity Analysis on Cooling Parameters (10/04/2016)6. Adding Correlation Models to use Experimental/CFD Data in CGTM
(Internal/External Cooling methods) (11/15/2016) 7. Detailed Sensitivity Analysis (12/16/2016)
Introduction
6
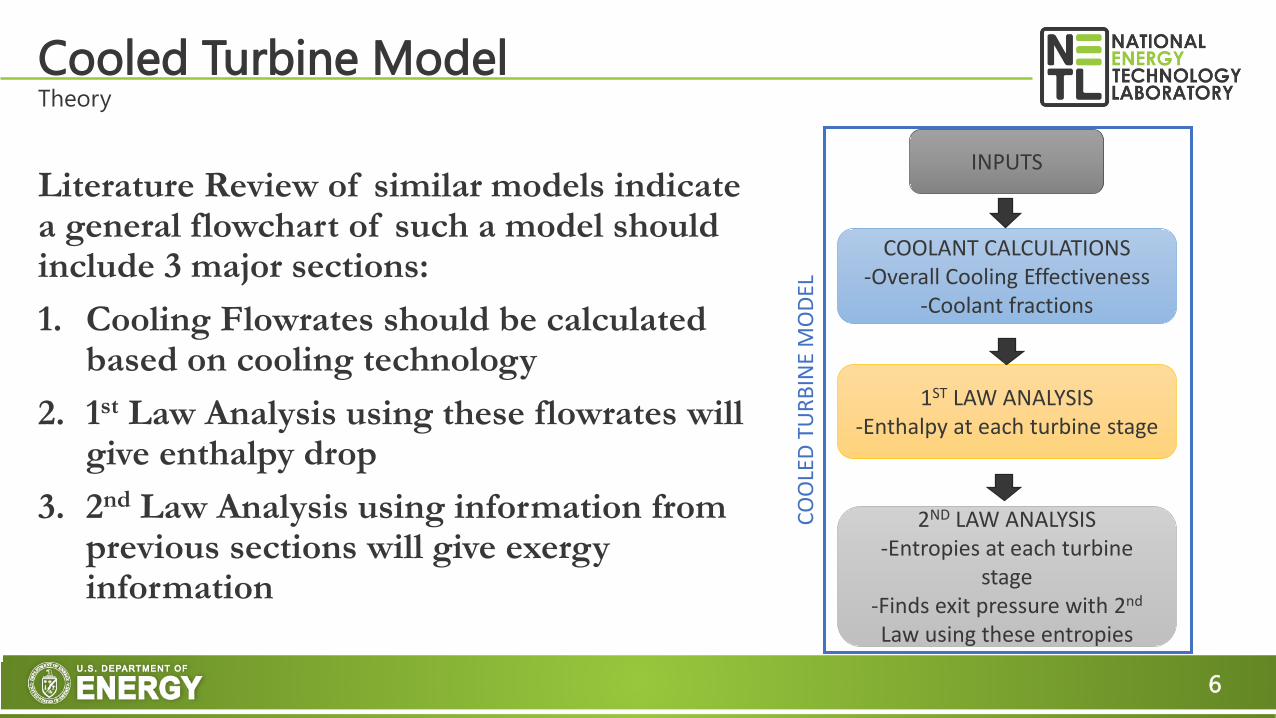
Literature Review of similar models indicate a general flowchart of such a model should include 3 major sections:1. Cooling Flowrates should be calculated
based on cooling technology2. 1st Law Analysis using these flowrates will
give enthalpy drop3. 2nd Law Analysis using information from
previous sections will give exergy information
Cooled Turbine ModelTheory
1ST LAW ANALYSIS-Enthalpy at each turbine stage
INPUTS
COOLANT CALCULATIONS-Overall Cooling Effectiveness
-Coolant fractions
2ND LAW ANALYSIS-Entropies at each turbine
stage-Finds exit pressure with 2nd
Law using these entropies
COO
LED
TURB
INE
MO
DEL
7
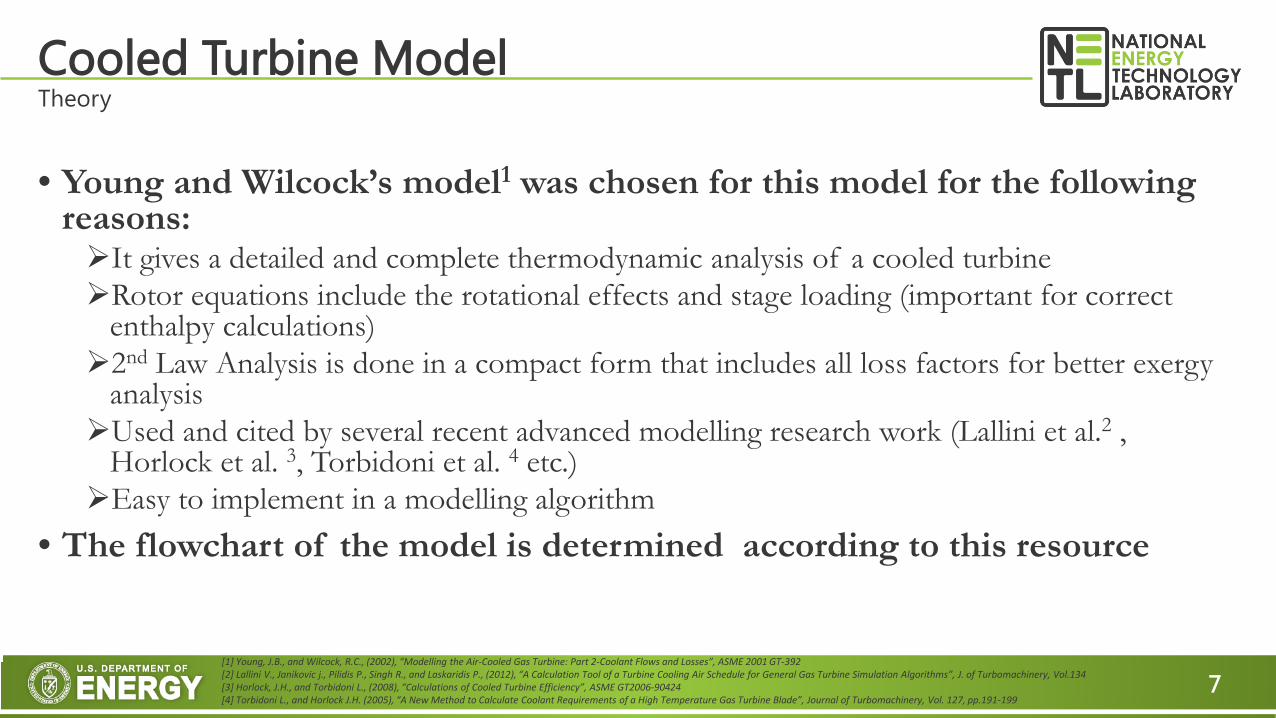
• Young and Wilcock’s model1 was chosen for this model for the following reasons:It gives a detailed and complete thermodynamic analysis of a cooled turbineRotor equations include the rotational effects and stage loading (important for correct
enthalpy calculations)2nd Law Analysis is done in a compact form that includes all loss factors for better exergy
analysisUsed and cited by several recent advanced modelling research work (Lallini et al.2 ,
Horlock et al. 3, Torbidoni et al. 4 etc.)Easy to implement in a modelling algorithm
• The flowchart of the model is determined according to this resource
Cooled Turbine ModelTheory
[1] Young, J.B., and Wilcock, R.C., (2002), “Modelling the Air-Cooled Gas Turbine: Part 2-Coolant Flows and Losses”, ASME 2001 GT-392[2] Lallini V., Janikovic j., Pilidis P., Singh R., and Laskaridis P., (2012), “A Calculation Tool of a Turbine Cooling Air Schedule for General Gas Turbine Simulation Algorithms”, J. of Turbomachinery, Vol.134[3] Horlock, J.H., and Torbidoni L., (2008), “Calculations of Cooled Turbine Efficiency”, ASME GT2006-90424[4] Torbidoni L., and Horlock J.H. (2005), “A New Method to Calculate Coolant Requirements of a High Temperature Gas Turbine Blade”, Journal of Turbomachinery, Vol. 127, pp.191-199

8
Cooled Turbine ModelDevelopment
INPUTS
COOLANT FRACTION CALCULATIONS
ε1, ε2
STATOR COOLING
Internal +Film+TBC
Internal +Film
Cooling
Internal Cooling
Only
ROTOR COOLING
Internal Cooling
Only
Internal +Film
Cooling
Internal +Film+TBC
Appropriate correlationformulas are selected for each component type
Internal +TBC
Internal +TBC
9
Cooled Turbine ModelDevelopment
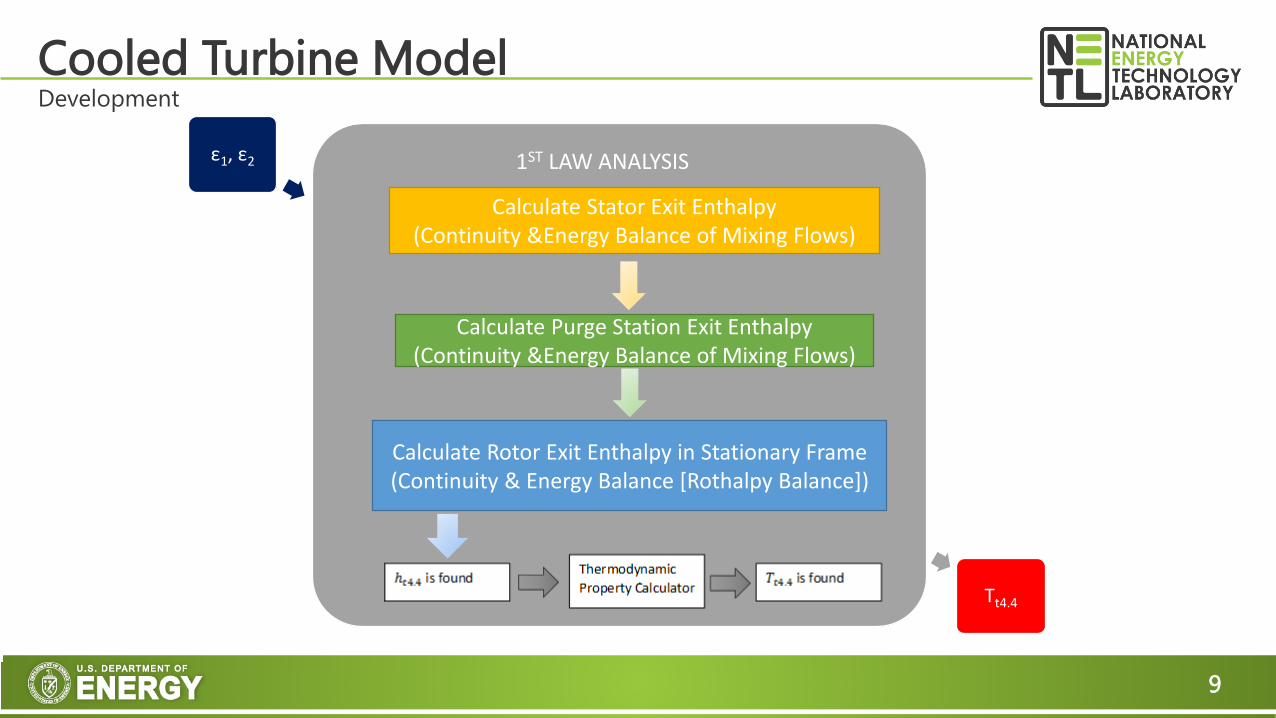
ε1, ε2
Tt4.4
1ST LAW ANALYSIS
Calculate Stator Exit Enthalpy (Continuity &Energy Balance of Mixing Flows)
Calculate Rotor Exit Enthalpy in Stationary Frame (Continuity & Energy Balance [Rothalpy Balance])
Calculate Purge Station Exit Enthalpy (Continuity &Energy Balance of Mixing Flows)
10
Cooled Turbine ModelDevelopment
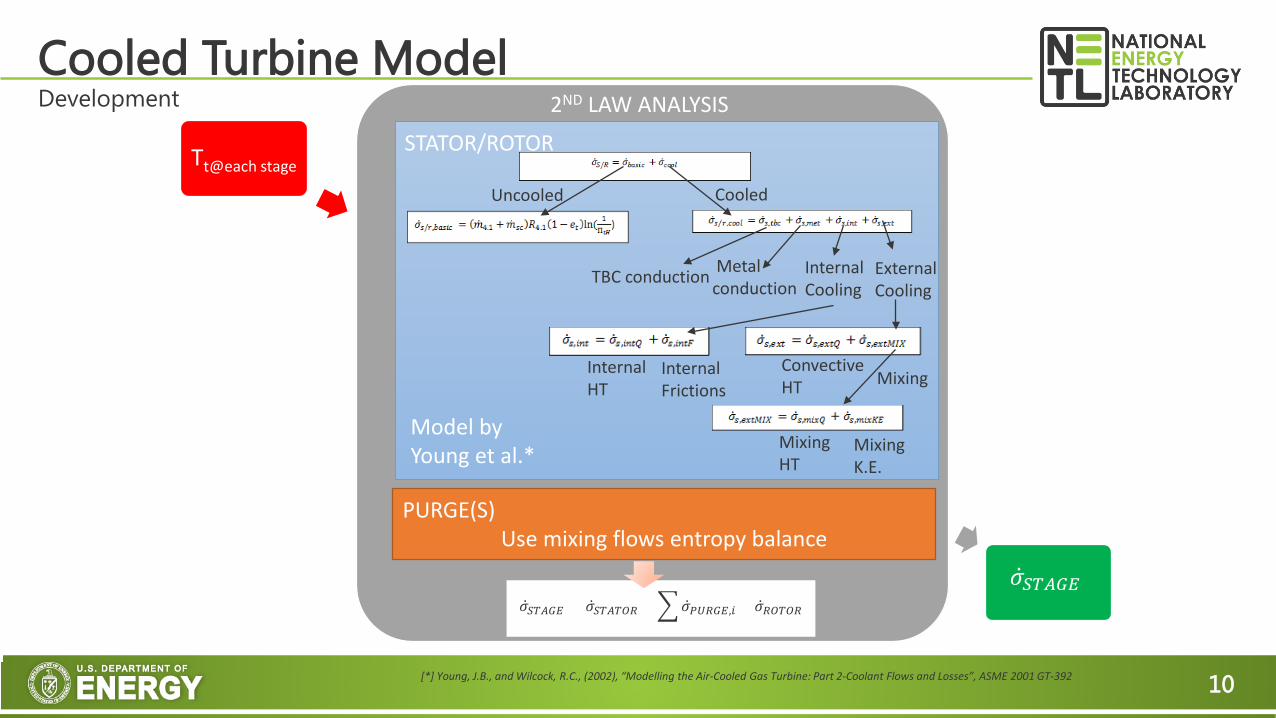
Tt@each stage
�̇�𝜎𝑆𝑆𝑆𝑆𝑆𝑆𝑆𝑆𝑆𝑆
STATOR/ROTOR
2ND LAW ANALYSIS
Model by Young et al.*
PURGE(S)Use mixing flows entropy balance
[*] Young, J.B., and Wilcock, R.C., (2002), “Modelling the Air-Cooled Gas Turbine: Part 2-Coolant Flows and Losses”, ASME 2001 GT-392
Uncooled Cooled
TBC conduction Metal conduction
InternalCooling
ExternalCooling
InternalHT
InternalFrictions
Convective HT Mixing
MixingHT
MixingK.E.
�̇�𝜎𝑆𝑆𝑆𝑆𝑆𝑆𝑆𝑆𝑆𝑆 = �̇�𝜎𝑆𝑆𝑆𝑆𝑆𝑆𝑆𝑆𝑆𝑆𝑆𝑆 + ��̇�𝜎𝑃𝑃𝑃𝑃𝑆𝑆𝑆𝑆𝑆𝑆,𝑖𝑖 + �̇�𝜎𝑆𝑆𝑆𝑆𝑆𝑆𝑆𝑆𝑆𝑆
11
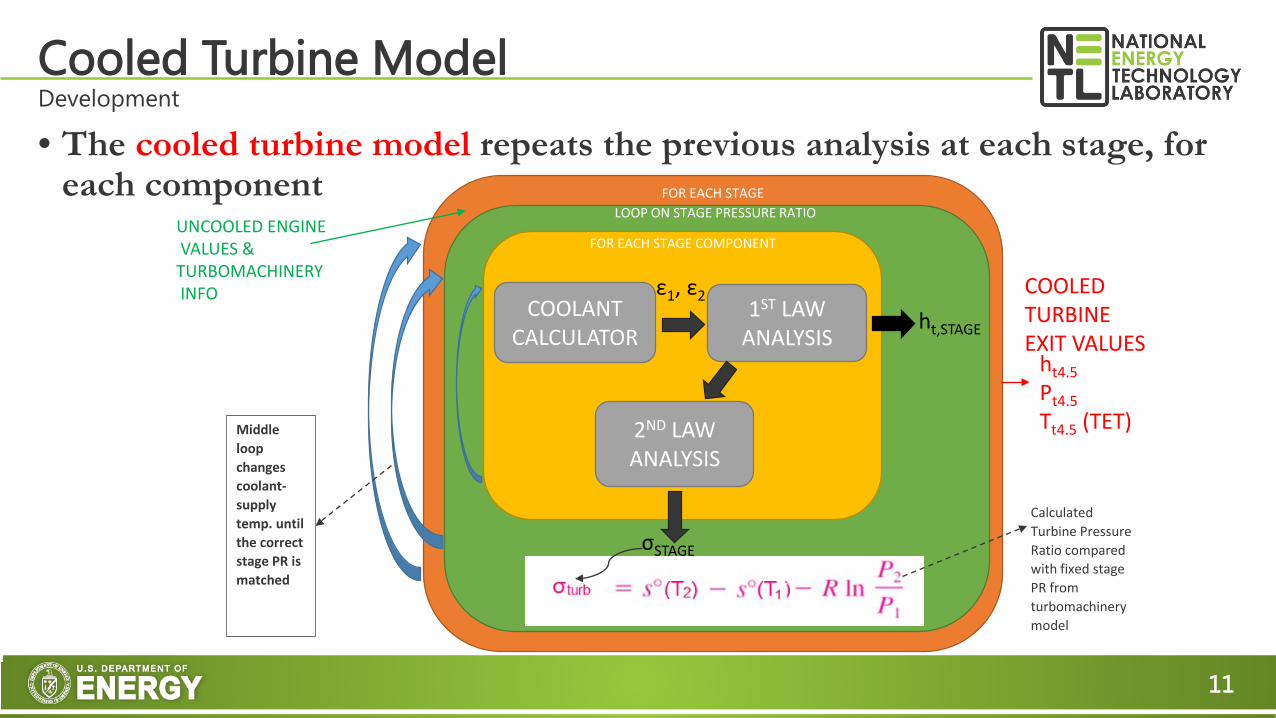
• The cooled turbine model repeats the previous analysis at each stage, for each component
Cooled Turbine ModelDevelopment
FOR EACH STAGELOOP ON STAGE PRESSURE RATIO
HING
FOR EACH STAGE COMPONENT
COOLANT CALCULATOR
1ST LAW ANALYSIS
2ND LAW ANALYSIS
σSTAGE
ε1, ε2
ht,STAGE
Calculated Turbine Pressure Ratio compared with fixed stage PR from turbomachinery model
Middle loop changes coolant-supply temp. until the correct stage PR is matched
UNCOOLED ENGINEVALUES &TURBOMACHINERYINFO
ht4.5Pt4.5Tt4.5 (TET)
COOLED TURBINE EXIT VALUES
12
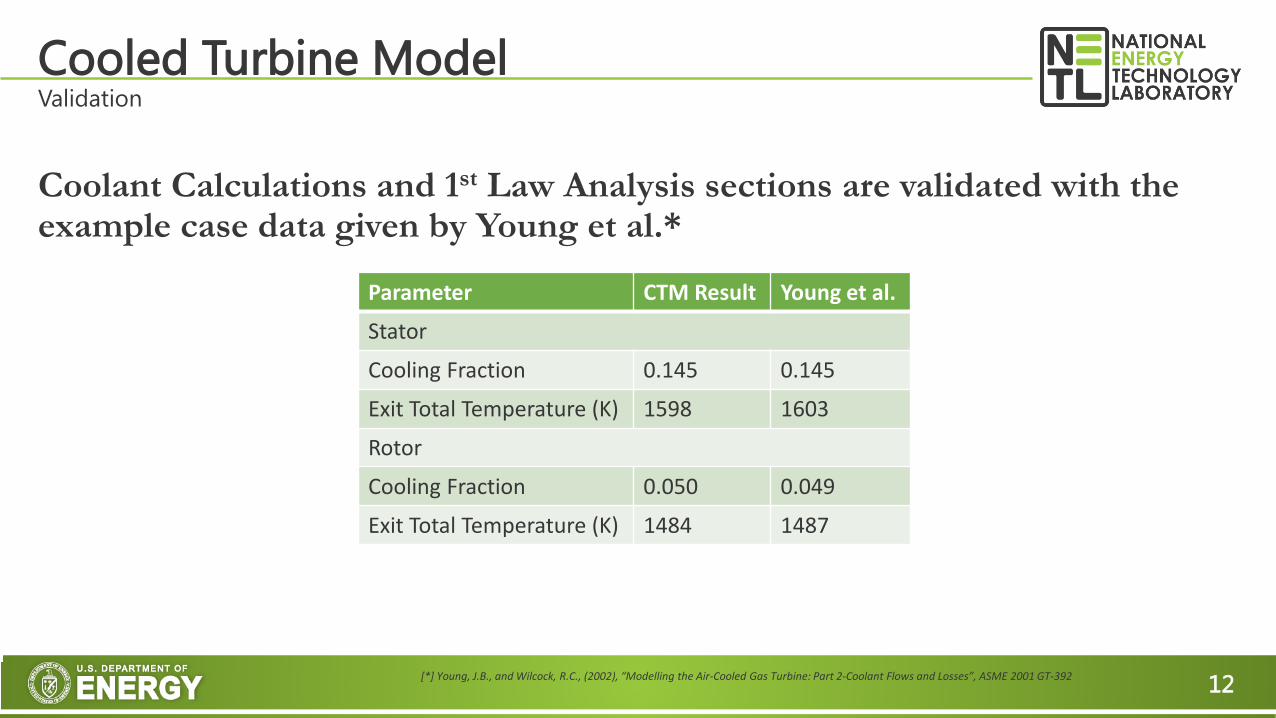
Coolant Calculations and 1st Law Analysis sections are validated with the example case data given by Young et al.*
Cooled Turbine ModelValidation
Parameter CTM Result Young et al.
Stator
Cooling Fraction 0.145 0.145
Exit Total Temperature (K) 1598 1603
Rotor
Cooling Fraction 0.050 0.049
Exit Total Temperature (K) 1484 1487
[*] Young, J.B., and Wilcock, R.C., (2002), “Modelling the Air-Cooled Gas Turbine: Part 2-Coolant Flows and Losses”, ASME 2001 GT-392

13
Entropy terms from Young et al.* example case is used for 2nd Law Analysis algorithm validation
Cooled Turbine ModelValidation
(Mixing HT > Internal Friction & BL Friction > Mixing KE > External HT > Internal HT > Conduction HT)
0
0.001
0.002
0.003
0.004
0.005
met ext,Q int,Q int,F mix,Q mix,KE
entr
opy
(Btu
/lbm
.R)
Entropy Generation-Stator
Young&Wilcock CTM
0
0.0002
0.0004
0.0006
0.0008
0.001
0.0012
met ext,Q int,Q int,F mix,Q mix,KE
entr
opy
(Btu
/lbm
.R)
Entropy Generation-Rotor
Young&Wilcock CTM
[*] Young, J.B., and Wilcock, R.C., (2002), “Modelling the Air-Cooled Gas Turbine: Part 2-Coolant Flows and Losses”, ASME 2001 GT-392
Higher Entropy Rate Higher Exergy More deviation from max. theoretical turbine work Less Turbine Efficiency(�̇�𝜎) (Φ=T0�̇�𝜎) (Wactual =Wisentropic-Φ) (ηturb,actual < ηturb, isentropic)
14
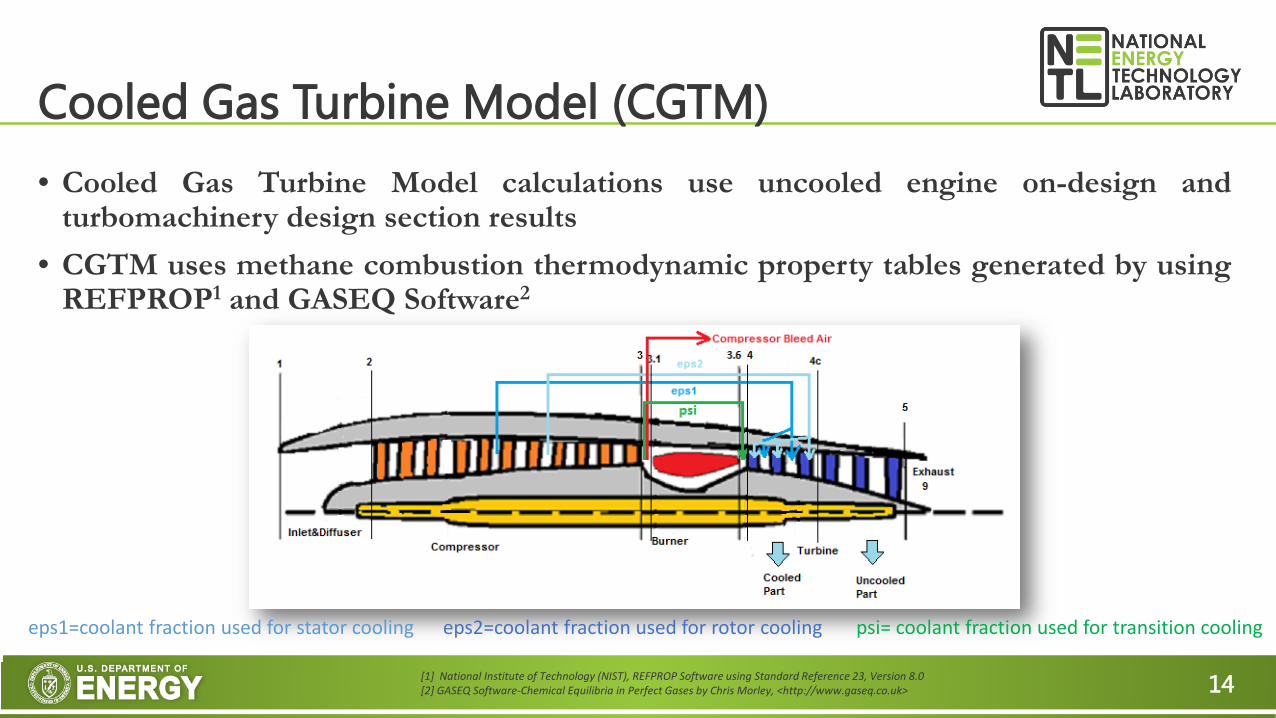
• Cooled Gas Turbine Model calculations use uncooled engine on-design andturbomachinery design section results
• CGTM uses methane combustion thermodynamic property tables generated by usingREFPROP1 and GASEQ Software2
Cooled Gas Turbine Model (CGTM)
eps1=coolant fraction used for stator cooling eps2=coolant fraction used for rotor cooling psi= coolant fraction used for transition cooling
[1] National Institute of Technology (NIST), REFPROP Software using Standard Reference 23, Version 8.0[2] GASEQ Software-Chemical Equilibria in Perfect Gases by Chris Morley, <http://www.gaseq.co.uk>

15
• Inputs related to cooling analysis are listed as follows:
Cooled Gas Turbine ModelInput List
Parameter Definition
Bim Biot Number (metal) [hot side based]
Bitbc Biot Number (TBC) [hot side based]
Tb,max Maximum Blade Metal Temperature
ηfc Adiabatic Film Cooling Effectiveness
ηc Internal Cooling Effectiveness
purge1 Pre-stage purge fraction
purge2 Intermediate stage purge fraction
[Schedule]4xn* Cooling Schedule matrix indicating which cooling technology applied to each cooled component
*n= #of cooled stages

16
CGTM calculates some of the essential turbomachinery information for cooling analysis such as stage velocity triangles, stage entry/exit flow angles, number of stages, stage pressures and temperatures
Cooled Gas Turbine ModelGenerating Turbomachinery Data
17
• Validations carried out with three H-class gas turbines: Siemens SGT6-8000H, General Electric GE7HA.02, and Mitsubishi Heavy IndustriesM501J
• Cycle calculations and component performance results were validatedwith GasTurb12 Software
• Number of stages, blade heights and disk dimensions were used inturbomachinery design section validation with available public data forthe selected gas turbines
• Power, Heat Rate, Exhaust Temperature, and number of stages wereused with engine parameters to match the real engine data
Cooled Gas Turbine ModelValidations
18
Cooled Gas Turbine ModelValidations
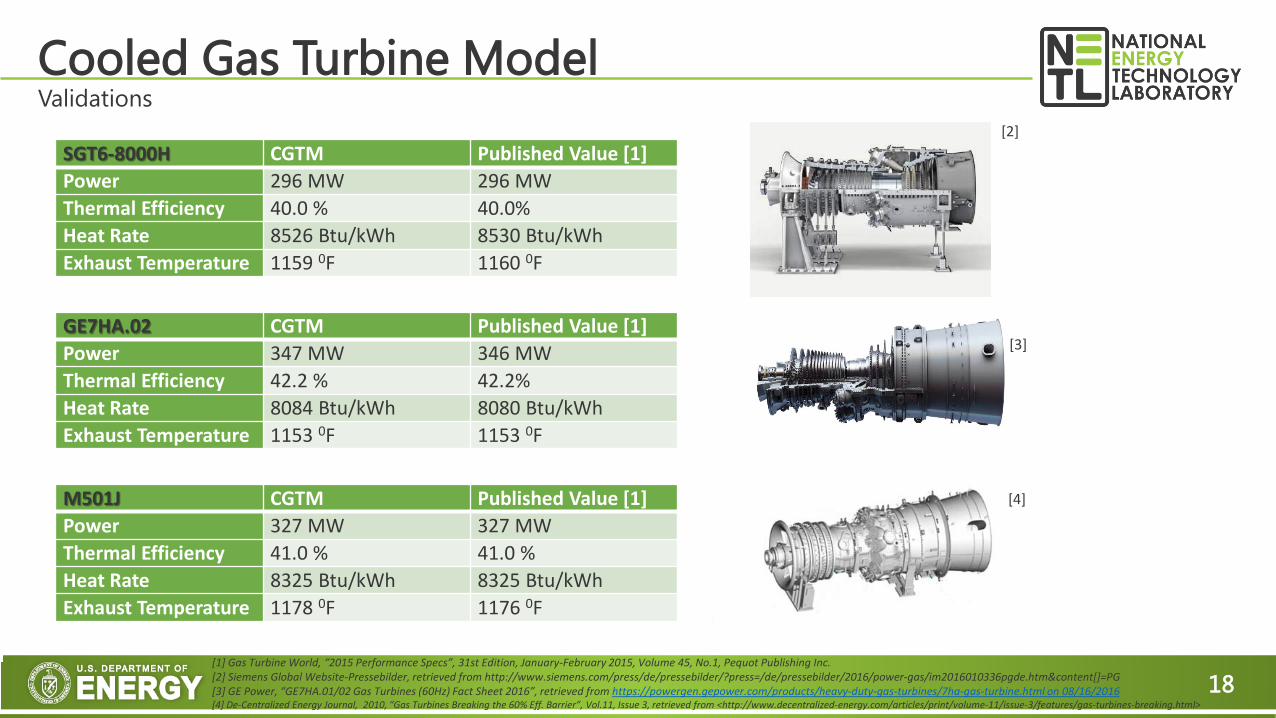
SGT6-8000H CGTM Published Value [1]Power 296 MW 296 MWThermal Efficiency 40.0 % 40.0%Heat Rate 8526 Btu/kWh 8530 Btu/kWhExhaust Temperature 1159 0F 1160 0F
GE7HA.02 CGTM Published Value [1]Power 347 MW 346 MWThermal Efficiency 42.2 % 42.2%Heat Rate 8084 Btu/kWh 8080 Btu/kWhExhaust Temperature 1153 0F 1153 0F
[1] Gas Turbine World, “2015 Performance Specs”, 31st Edition, January-February 2015, Volume 45, No.1, Pequot Publishing Inc. [2] Siemens Global Website-Pressebilder, retrieved from http://www.siemens.com/press/de/pressebilder/?press=/de/pressebilder/2016/power-gas/im2016010336pgde.htm&content[]=PG [3] GE Power, “GE7HA.01/02 Gas Turbines (60Hz) Fact Sheet 2016”, retrieved from https://powergen.gepower.com/products/heavy-duty-gas-turbines/7ha-gas-turbine.html on 08/16/2016[4] De-Centralized Energy Journal, 2010, “Gas Turbines Breaking the 60% Eff. Barrier”, Vol.11, Issue 3, retrieved from <http://www.decentralized-energy.com/articles/print/volume-11/issue-3/features/gas-turbines-breaking.html>
[2]
[3]
M501J CGTM Published Value [1]Power 327 MW 327 MWThermal Efficiency 41.0 % 41.0 %Heat Rate 8325 Btu/kWh 8325 Btu/kWhExhaust Temperature 1178 0F 1176 0F
[4]
19
• Cycle calculations were validated with GasTurb12 via case specific tests and continuity tests.
• Case specific tests compares the outputs of two programs side-by-side for specified engine parameters
• Continuity test aims to compare the response of two programs to the same input parameter varied in a predetermined range
• GasTurb12 uses a different cooling analysis model (a pressure loss model) but two programs are made comparable by entering the cooling fractions calculated by CGTM into GasTurb12.
Cooled Gas Turbine ModelValidations

20
Cooled Gas Turbine ModelValidations
0
100000
200000
300000
400000
500000
600000
2600 2800 3000 3200 3400 3600
Pow
er (h
p)
Tt4 (R)
Shaft Power Delivered
0.20.220.240.260.28
0.30.320.340.360.38
0.4
2600 2800 3000 3200 3400 3600
PSFC
(lbm
/(hp
-h)
Tt4 (R)
Power Specific Fuel Consumption
0.2
0.25
0.3
0.35
0.4
0.45
0.5
2600 2800 3000 3200 3400 3600
n_th
Tt4 (R)
Thermal Efficiency
GasTurb12
CGTM
Parameter Definition GasTurb12* CGTM Unit %Difference
mc Total Coolant Flow Fraction (charged) 14.0 14.0 % -ηcH Compressor Isentropic Eff. 0.840 0.827 - 1.57f Burner fuel-to air ratio 0.02796 0.02813 - 0.61ηtH Turbine Isentropic Eff. 0.928 0.921 - 0.75πtH Turbine Pressure Ratio 0.0567 0.0563 - 0.71Pt9/P0 Exhaust Pressure Ratio 1.03 1.04 - 0.97PWSD Shaft Power Delivered 417266 421998 hp 1.13PSFC Power Specific Fuel Consumption 0.296 0.298 lbm/(hp.hr) 0.68ηth Thermal Efficiency 40.2 40.0 % 0.50HR Heat Rate 8508 8537 Btu/kWh 0.34
Sample Test Results for a generic H-Class engine scenario
[*] GasTurb12 Software by GasTurb GmbH c/o Institute of Jet Propulsion and Turbomachinery Templergraben 55, 52062 Aachen, Deutschland
21
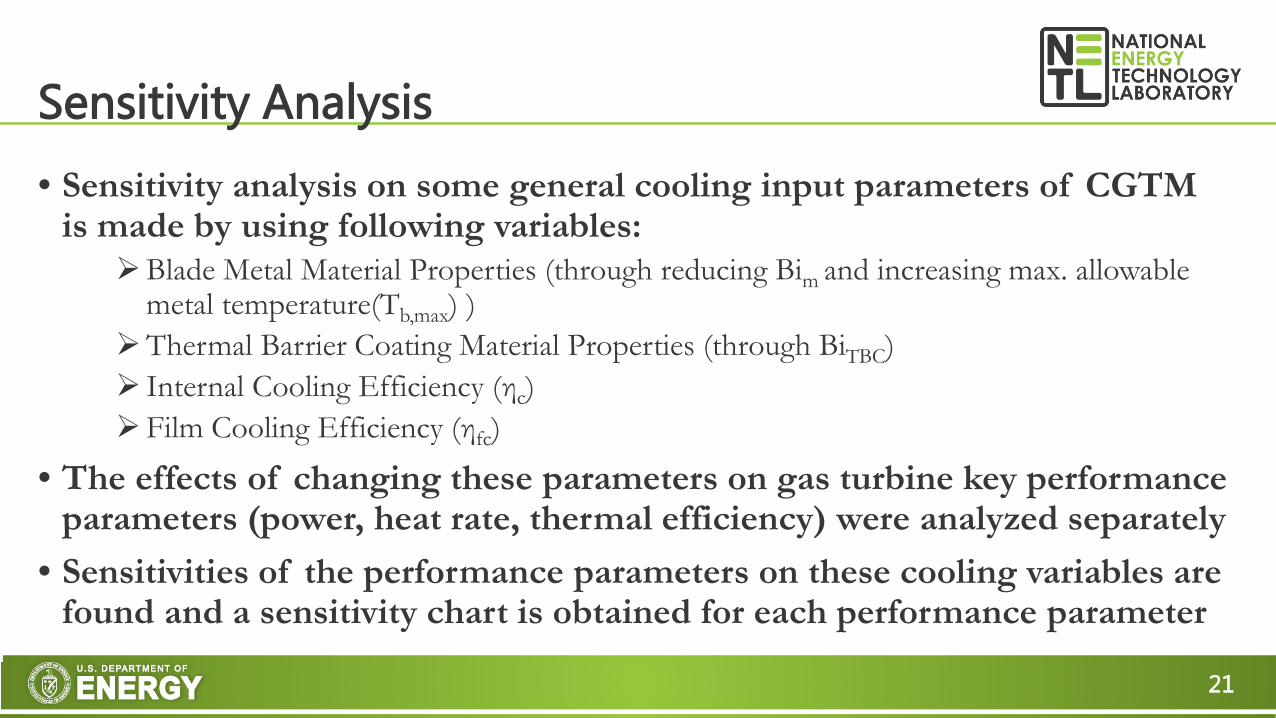
• Sensitivity analysis on some general cooling input parameters of CGTM is made by using following variables:Blade Metal Material Properties (through reducing Bim and increasing max. allowable
metal temperature(Tb,max) )Thermal Barrier Coating Material Properties (through BiTBC) Internal Cooling Efficiency (ηc)Film Cooling Efficiency (ηfc)
• The effects of changing these parameters on gas turbine key performance parameters (power, heat rate, thermal efficiency) were analyzed separately
• Sensitivities of the performance parameters on these cooling variables are found and a sensitivity chart is obtained for each performance parameter
Sensitivity Analysis

22
Sensitivity AnalysisThermal Efficiency
-30
-25
-20
-15
-10
-5
0
5
10
15
20
-60 -40 -20 0 20 40 60
%ch
ange
in th
erm
al e
ffici
ency
% change in parameter
Sensitivity for Thermal Efficiency
Advancement in technology (except Bim)
Advancement in technology (for Bim)
Higher Slope=Higher Dependency
23
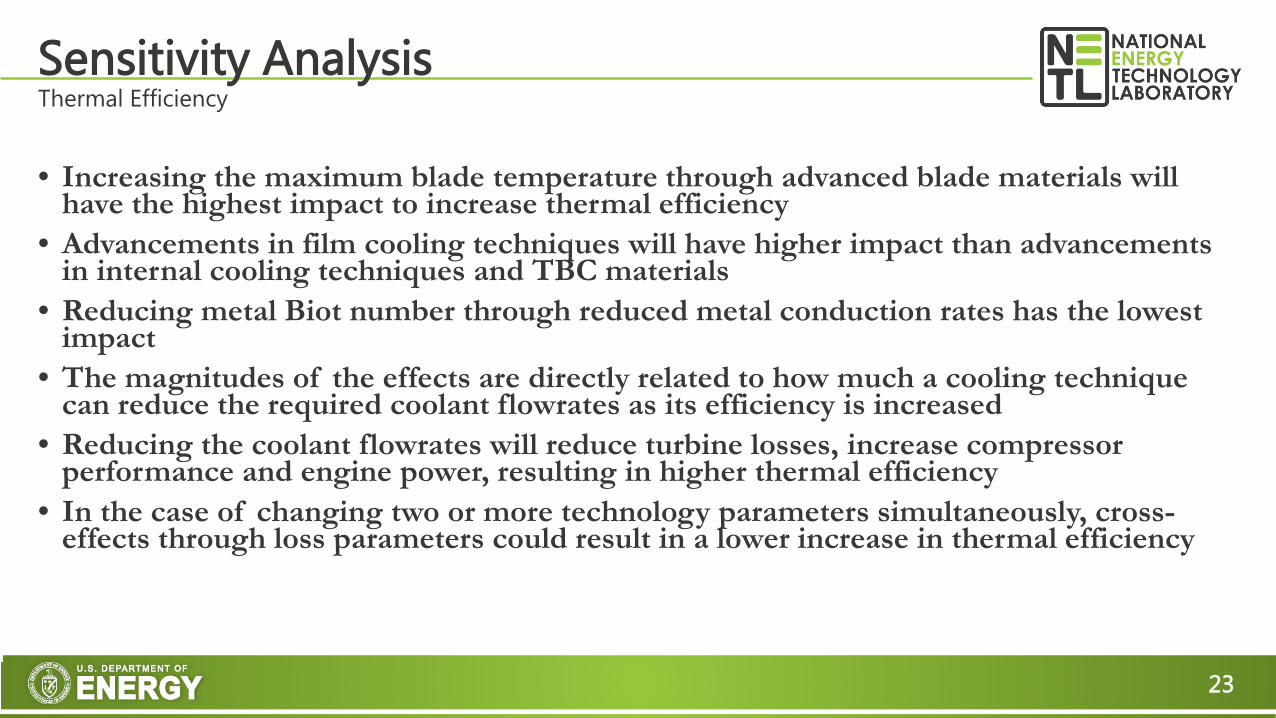
• Increasing the maximum blade temperature through advanced blade materials will have the highest impact to increase thermal efficiency
• Advancements in film cooling techniques will have higher impact than advancements in internal cooling techniques and TBC materials
• Reducing metal Biot number through reduced metal conduction rates has the lowest impact
• The magnitudes of the effects are directly related to how much a cooling technique can reduce the required coolant flowrates as its efficiency is increased
• Reducing the coolant flowrates will reduce turbine losses, increase compressor performance and engine power, resulting in higher thermal efficiency
• In the case of changing two or more technology parameters simultaneously, cross-effects through loss parameters could result in a lower increase in thermal efficiency
Sensitivity AnalysisThermal Efficiency
24
• A cooled turbine model is developed that also calculates losses coming from cooling techniques
• The cooled turbine model is integrated into the Cooled Gas Turbine Model that calculates gas turbine performance parameters
• Models were validated with published data and commercial software • CGTM is used in a parameter sensitivity analysis to understand which
cooling technology has the highest potential to reach >40% GT efficiency• For a fixed blade material, improving film cooling technologies has the
highest impact on increasing GT efficiency
Conclusions

25
• With the addition of cooling technology specific correlations to the model, CGTM will be able to be used in comparisons for different internal and external cooling techniques
• The model can be used in optimization algorithms to determine what a cooling parameter should be to satisfy a desired engine performance
• Additional sensitivity studies and optimization studies will give more specific information on what advancements should be done in a certain cooling technique to attain higher performance
Future Work

Cooled Gas Turbine Model
A Thermodynamic Model to Quantify the Impact of Cooling Improvements on Gas
Turbine Efficiency


