
Copyright © 2006 Thomson Learning
55Elasticity and Its Applications

Figure 1 The Price Elasticity of Demand
Copyright©2003 Southwestern/Thomson Learning
(a) Perfectly Inelastic Demand: Elasticity Equals 0
€ 5
4
Quantity
Demand
1000
1. Anincreasein price . . .
2. . . . leaves the quantity demanded unchanged.
Price
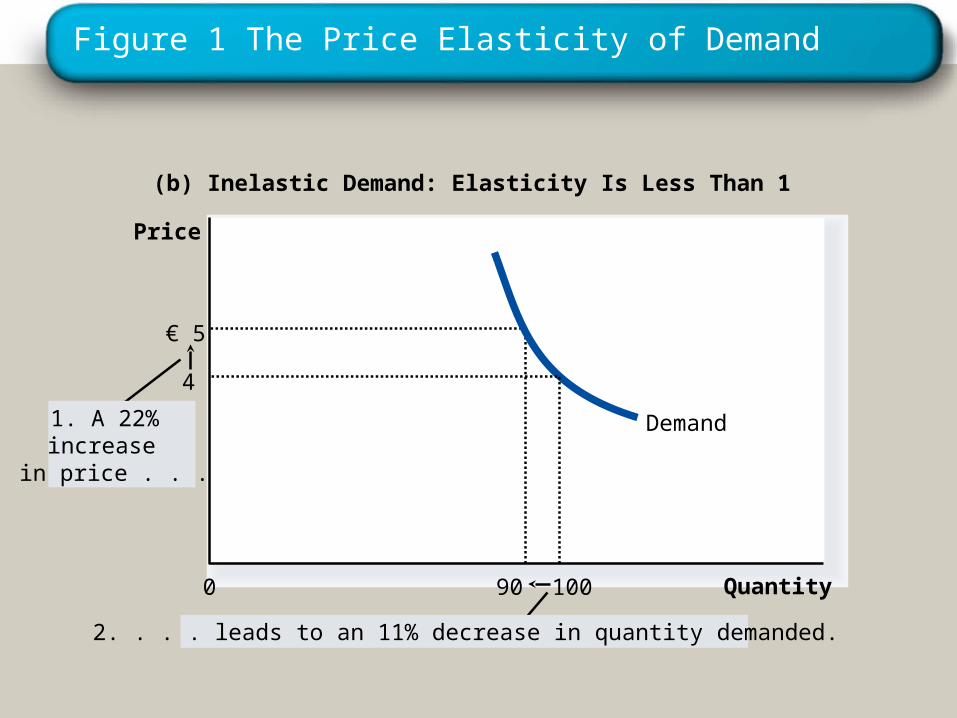
Figure 1 The Price Elasticity of Demand
(b) Inelastic Demand: Elasticity Is Less Than 1
Quantity0
€ 5
90
Demand1. A 22%increasein price . . .
Price
2. . . . leads to an 11% decrease in quantity demanded.
4
100

Figure 1 The Price Elasticity of Demand
Copyright©2003 Southwestern/Thomson Learning
2. . . . leads to a 22% decrease in quantity demanded.
(c) Unit Elastic Demand: Elasticity Equals 1
Quantity
4
1000
Price
€ 5
80
1. A 22%increasein price . . .
Demand

Figure 1 The Price Elasticity of Demand
(d) Elastic Demand: Elasticity Is Greater Than 1
Demand
Quantity
4
1000
Price
€ 5
50
1. A 22%increasein price . . .
2. . . . leads to a 67% decrease in quantity demanded.
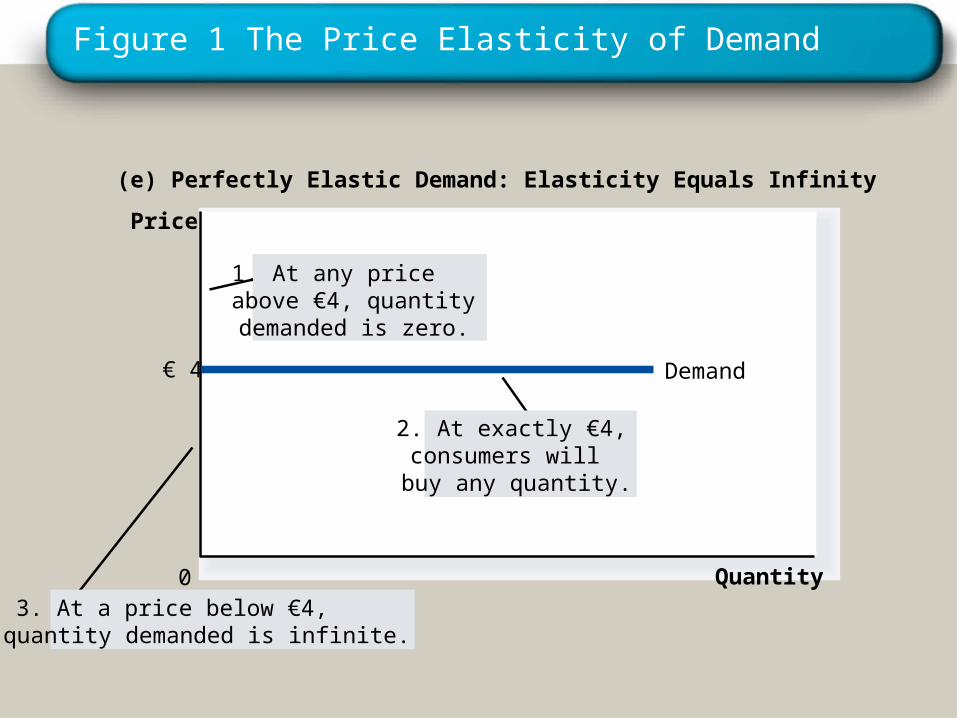
Figure 1 The Price Elasticity of Demand
(e) Perfectly Elastic Demand: Elasticity Equals Infinity
Quantity0
Price
€ 4 Demand
2. At exactly €4,consumers willbuy any quantity.
1. At any priceabove €4, quantitydemanded is zero.
3. At a price below €4,quantity demanded is infinite.

Copyright © 2006 Thomson Learning
Figure 2 Total Revenue
Copyright©2003 Southwestern/Thomson Learning
Demand
Quantity
Q
P
0
Price
P × Q = €400(revenue)
€4
100

Figure 3 How Total Revenue Changes When Price Changes: Inelastic Demand
Copyright©2003 Southwestern/Thomson Learning
Demand
Quantity0
Price
Revenue = €100
Quantity0
Price
Revenue = €240
Demand€1
100
€3
80
An Increase in price from €1 to €3 …
… leads to an Increase in total revenue from €100 to €240
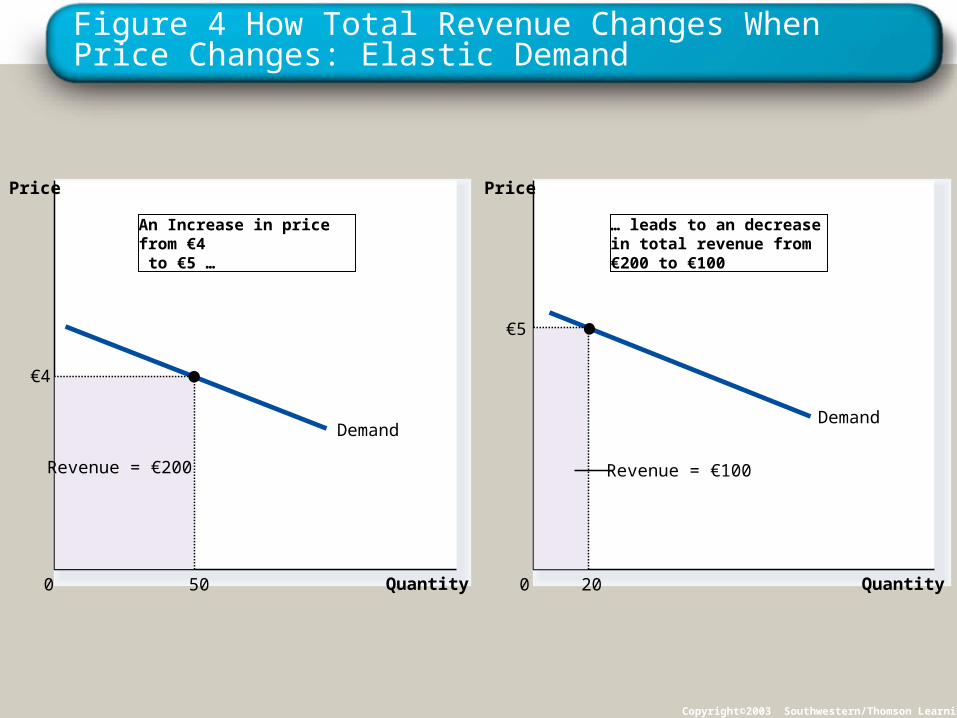
Figure 4 How Total Revenue Changes When Price Changes: Elastic Demand
Copyright©2003 Southwestern/Thomson Learning
Demand
Quantity0
Price
Revenue = €200
€4
50
Demand
Quantity0
Price
Revenue = €100
€5
20
An Increase in price from €4 to €5 …
… leads to an decrease in total revenue from €200 to €100
Copyright © 2006 Thomson Learning
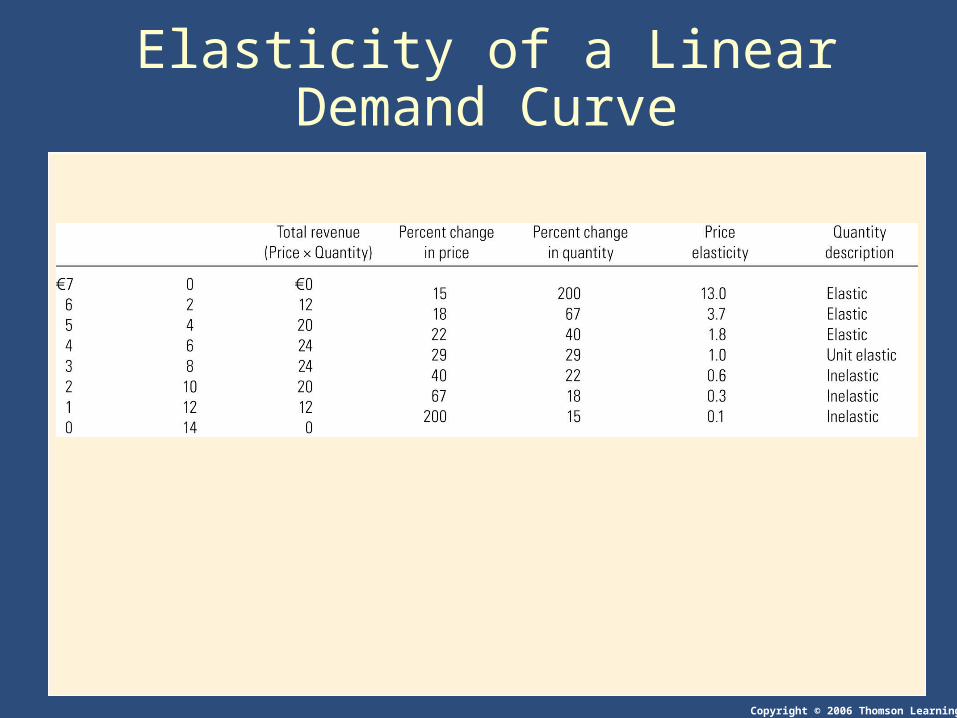
Elasticity of a Linear Demand Curve
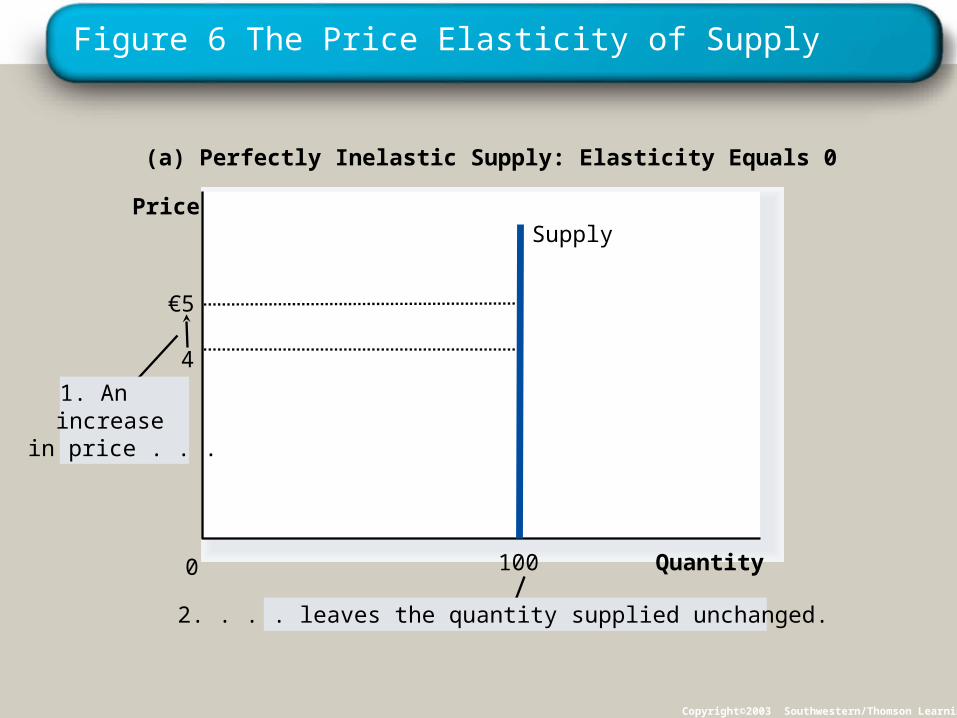
Figure 6 The Price Elasticity of Supply
Copyright©2003 Southwestern/Thomson Learning
(a) Perfectly Inelastic Supply: Elasticity Equals 0
€5
4
Supply
Quantity1000
1. Anincreasein price . . .
2. . . . leaves the quantity supplied unchanged.
Price

Figure 6 The Price Elasticity of Supply
Copyright©2003 Southwestern/Thomson Learning
(b) Inelastic Supply: Elasticity Is Less Than 1
110
€5
100
4
Quantity0
1. A 22%increasein price . . .
Price
2. . . . leads to a 10% increase in quantity supplied.
Supply
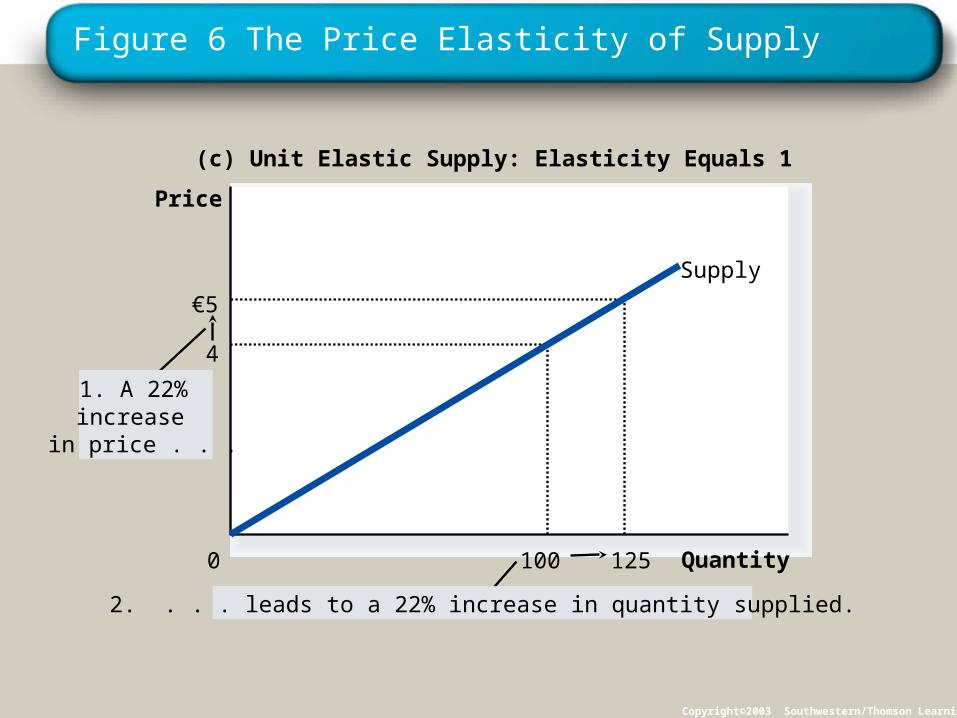
Figure 6 The Price Elasticity of Supply
Copyright©2003 Southwestern/Thomson Learning
(c) Unit Elastic Supply: Elasticity Equals 1
125
€5
100
4
Quantity0
Price
2. . . . leads to a 22% increase in quantity supplied.
1. A 22%increasein price . . .
Supply

Figure 6 The Price Elasticity of Supply
Copyright©2003 Southwestern/Thomson Learning
(d) Elastic Supply: Elasticity Is Greater Than 1
Quantity0
Price
1. A 22%increasein price . . .
2. . . . leads to a 67% increase in quantity supplied.
4
100
€5
200
Supply

Figure 6 The Price Elasticity of Supply
Copyright©2003 Southwestern/Thomson Learning
(e) Perfectly Elastic Supply: Elasticity Equals Infinity
Quantity0
Price
€4 Supply
3. At a price below €4,quantity supplied is zero.
2. At exactly €4,producers willsupply any quantity.
1. At any priceabove €4, quantitysupplied is infinite.

Figure 8 An Increase in Supply in the Market for Wheat
Copyright©2003 Southwestern/Thomson Learning
Quantity ofWheat
0
Price ofWheat
3. . . . and a proportionately smallerincrease in quantity sold. As a result,
revenue falls from €300 to €220.
Demand
S1 S2
2. . . . leadsto a large fallin price . . .
1. When demand is inelastic,an increase in supply . . .
2
110
€3
100


