
Current Trends in
Reliability Engineering
Research
Lunch & Learn Talk
at
Chevron Company
Houston, TX
July 12, 2017
Mohammad Modarres
Center for Risk and Reliability
Department of Mechanical Engineering
COPYRIGHT © 2017, M. Modarres
Outline of this Talk
– Reliability Engineering Timeline
– Frontiers in Reliability Engineering
– Prognosis and Health Management (PHM)
– Reliability Science
– Conclusions
COPYRIGHT © 2017, M. Modarres
Timeline of Reliability
Engineering
– Initiatives in 1950’s• Weakest link
• Advisory Group on the Reliability of Electronic Equipment (AGREE) DoD
1956-1958
• Exponential life model
• Reliability Block Diagrams
– Exponential Distribution Retreat in 1960’s• Birth of Physics of Failure
• Uses of other distributions
• Reliability growth
• Life testing
• Failure Mode and Effect Analysis
– Logic Models: Fault Tree Analysis in 1970’S• Probabilistic Risk Assessment
• Common Cause Failures
• Uncertainty Analysis
COPYRIGHT © 2017, M. Modarres

Timeline (Cont.)
– Accelerated Life and Degradation Testing in1980’s
– Rebirth of Physics-of-Failure in 1990’s• Probabilistic Physics-of-Failure
• Time Varying Accelerated Tests
• Highly Accelerated Life Testing (HALT)
– Hybrid Reliability and Prognosis Models in 2000’s• Combined Logic Models, Physical Models and Probabilistic Models (e.g. BBN)
• Prognosis and Health Management (PHM) methods
• Powerful simulation tools (MCMC, Recursive Bayes and Particle Filtering)
– Exploring Fundamental Sciences of Reliability in 2010’s• Thermodynamics and Entropy
• Data science and predictive Analytics (treating Big Data in reliability)
• Autonomous systems and robots
• Infrastructure and cyber-physical systems
COPYRIGHT © 2017, M. Modarres

• Probabilistic Physics-of-Failure (PPoF)– More than 50-Years of History in PoF (More Recently PPoF)
– Accelerated Reliability Testing for PPoF Model Development
– Empirical Model for Unit-Specific Reliability Assessment
– Simulation-Based Reliability
• Hybrid Reliability– Combined System Analysis Techniques: BBN, DBN, DFT, DET,
Markov and Semi-Markov, FEM and FDM, FM, RBD, etc.
• Sensor-Based (Precursors) / Big Data Reliability Analysis– Data Fusion, Predictive Analytics, Deep Learning, Natural
Language, Detection Probability, Measurement Models
• Fundamental Sciences of Reliability Engineering
Our Current Areas of
Research in Reliability
COPYRIGHT © 2017, M. Modarres

• Infrastructure Safety-Security-Resilience (SSR)– Integrity of Complex Systems and Networks: Cyber-Human-Software-
Physical (CHSP) Systems
– Highly Connected Infrastructure Networks: Electricity, Gas, and Water
Pose Major Societal Risks of Cyberspace Attacks
– Risk Management and Resilience
– Societal Disruption, Health, Safety and Resilience
• Life-Cycle Risks of Advanced Energy Systems– Pipeline and Conventional Fossil-Based Energy System integrity
– Renewable Energy Systems
– Nuclear Energy (Fission and Fusion)
Our Current Areas of
Research in Integrity / Risk
Assessment
COPYRIGHT © 2017, M. Modarres

Integrity of Energy
Systems: Corrosion
• Corrosion a major contributor to
failure and damage in metals
• Annual direct cost of corrosion
in U.S. oil and petrochemical
industry= $6.8 billion1
• Mechanistic loads increase
damage in the presence of
Corrosion
• Pipelines are subject to
mechanical stresses and
corrosive environments
1. NAS, 2014
COPYRIGHT © 2017, M. Modarres

Integrity of Energy
Systems: Corrosion (Cont.)
• The 2010 Enbridge Spill in Michigan-U.S. was due to
Corrosion-Fatigue (~$1B cost of clean up so far!).
• Why Mechanistic Failures are Important?
– Preexisting cracks (pits, dents, weld flaws, cracks due to SCC,
etc.)
– Mechanical loads (tensile and cyclic)
– Fluctuating loadings and stresses
– Failure due to Corrosion Fatigue and Stress Enbridge pipeline
COPYRIGHT © 2017, M. Modarres

UMD Approach to a
Petroleum Industry PHM
Application • Define Conditions:
– Understand needs of facility integrity management
– Define accelerated test conditions that match operations
• Perform Experiments and Data Gathering:– Accelerate damage on
representative materials
– Analyze data and associated uncertainties
– Supplement with field data
• Develop Models:– Physics of failure Model
– Model Validation
– Simulate Models
Step 1
• Problem Definition
• Test Conditions Determination
Step 2
• Conduct the Experiments
• Field Data Gathering
Step 3
• Modeling & Validation
• Simulate the Model
• Assess Health and Integrity
COPYRIGHT © 2017, M. Modarres

PHM in Oil Industry with NDT
Assessment of True Damage
Evidence-Based (NDT-Based Defect/Damage size and density)
Damage Density DistributionDamage Size Distribution
Response
signal
amplitudes
Analysis
&
processingDefect size
measurements
Nondestructive
equipment
Component
Precision
&
accuracy
Incomplete and Uncertain Evidence of Damage
COPYRIGHT © 2017, M. Modarres
11
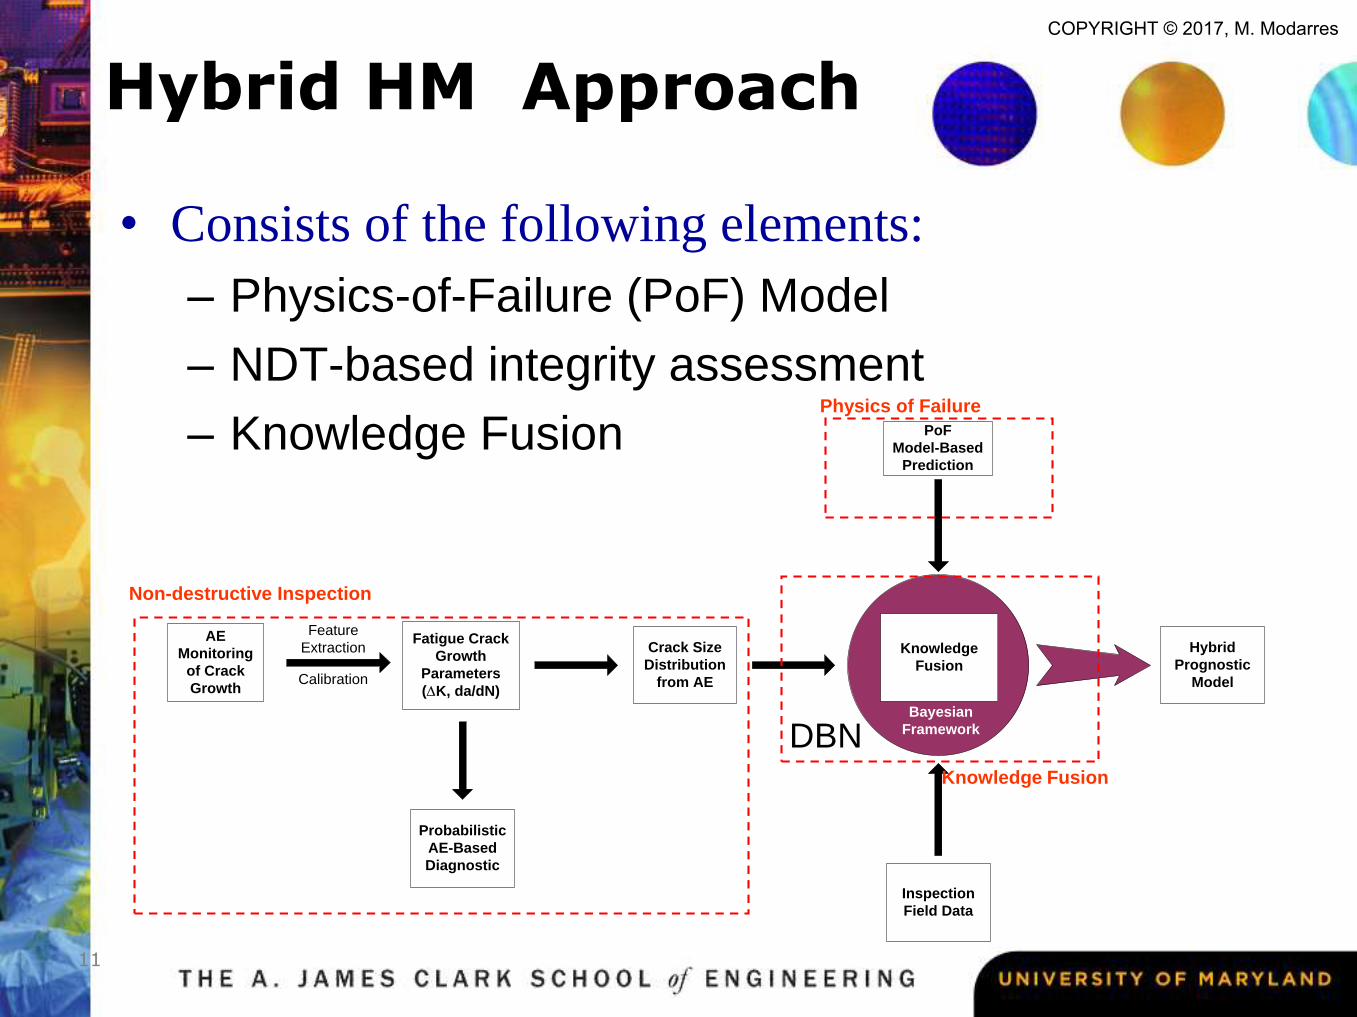
Hybrid HM Approach
AE
Monitoring
of Crack
Growth
Fatigue Crack
Growth
Parameters
(K, da/dN)
Feature
Extraction
Calibration
Crack Size
Distribution
from AE
Inspection
Field Data
Probabilistic
AE-Based
Diagnostic
Hybrid
Prognostic
Model
PoF
Model-Based
Prediction
Knowledge
Fusion
Bayesian
Framework
Non-destructive Inspection
Physics of Failure
Knowledge Fusion
• Consists of the following elements:
– Physics-of-Failure (PoF) Model
– NDT-based integrity assessment
– Knowledge Fusion
DBN
COPYRIGHT © 2017, M. Modarres

12
Hybrid PHM Approach (Cont.)
Damage Growth PoF Model
Field NDT
Field Inspection
)Evidence(
)(|EvidenceLEvidence|
p
p
a = f RUL |q( )
Index of
Lifet1
0.01"
t2
acrit
Day One
Damage
size
(a)
Prediction
Prediction for T
Pr( a > acritical )
***
Meta model
Simulation of the Physics of Failure Model
Fused Inspection/sensor data
COPYRIGHT © 2017, M. Modarres
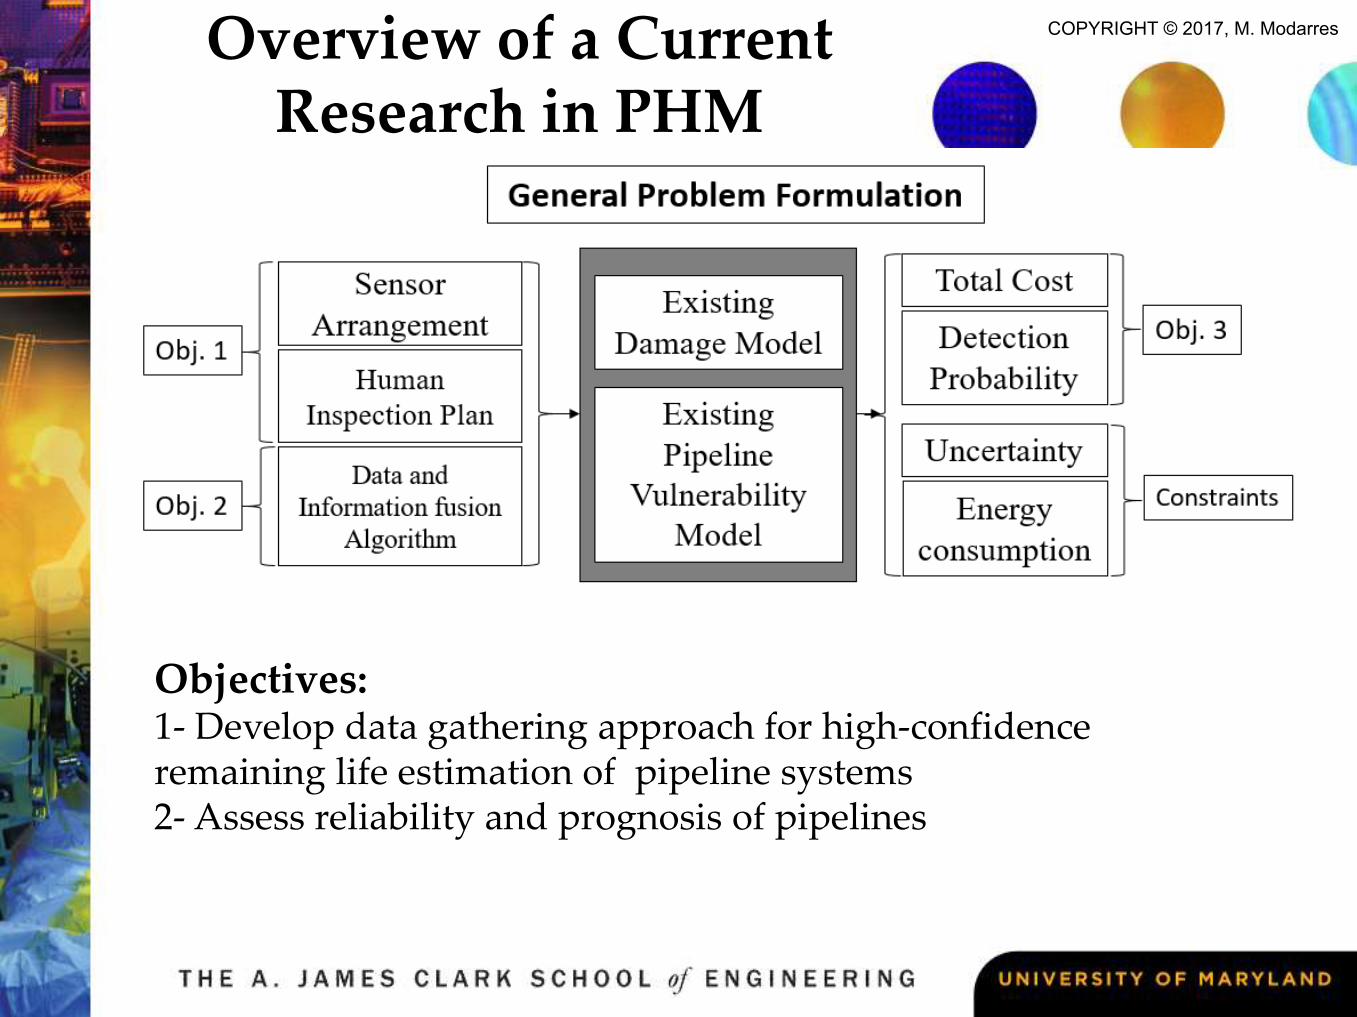
Overview of a Current Research in PHM
Objectives:1- Develop data gathering approach for high-confidence remaining life estimation of pipeline systems2- Assess reliability and prognosis of pipelines
COPYRIGHT © 2017, M. Modarres
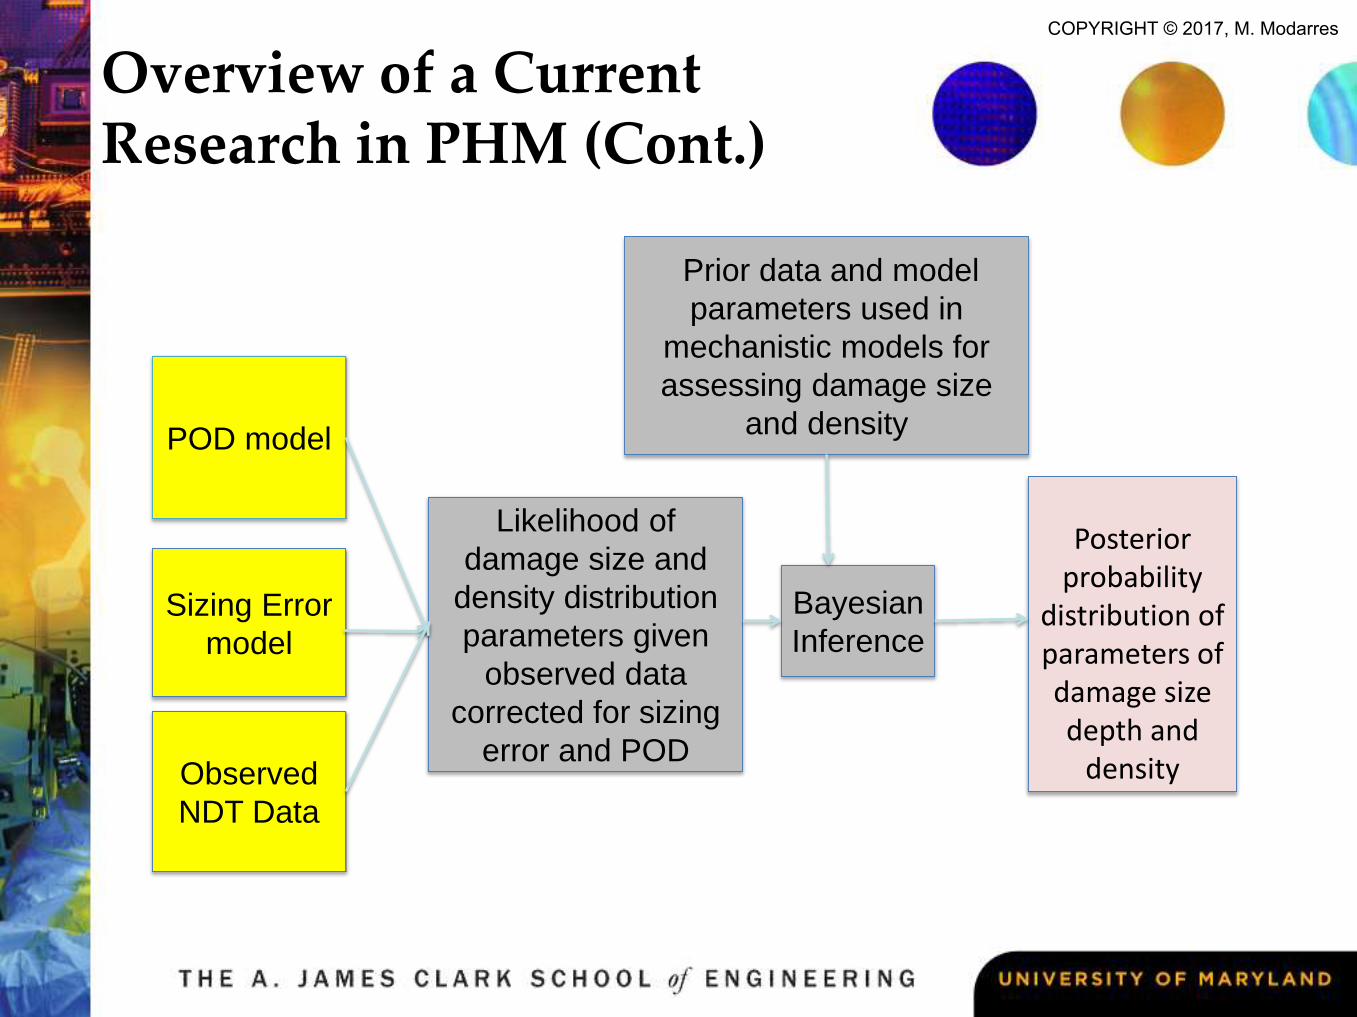
POD model
Sizing Error
model
Prior data and model
parameters used in
mechanistic models for
assessing damage size
and density
Observed
NDT Data
Likelihood of
damage size and
density distribution
parameters given
observed data
corrected for sizing
error and POD
Posterior probability
distribution of parameters of damage size depth and
density
Bayesian
Inference
Overview of a Current Research in PHM (Cont.)
COPYRIGHT © 2017, M. Modarres

Example of a Sensor-Based
Monitoring PHM
• Describe damage using the surrogate indicator:
acoustic emission (AE)
• Process raw AE features to prediction fatigue
damage
• Define damage and its endurance in the context of
AE features
• Applications to Prognosis and Health Management
(PHM) of structures
COPYRIGHT © 2017, M. Modarres

[1]
Crack growth
correlation with an AE
feature: AE count
[1] A. Kshtgar and M. Modarres, Acoustic Emission-Based Fatigue Crack Growth Prediction, Reliability and Maintainability
Symposium (RAMS), 2013 Proceedings-Annual, p.1-5
Example of a Sensor-Based
Monitoring PHM (Cont.)
COPYRIGHT © 2017, M. Modarres

17
Signal at Source(Pulse)
Received AE Signal(Complex Waveform)
Medium(Aluminum)
Sensor
-100 0 100 200 300 400 500-60
-40
-20
0
20
40
60
Sec
mV
Deconvolution of the measured voltage signal from the sensor to evaluate the properties of the source event is extremely difficult.
AE Features• Amplitude
• Energy
• Rise time
• Counts (Threshold crossing)
• Frequency content
• Waveform shape
Example of a Sensor-Based
Monitoring PHM (Cont.)
COPYRIGHT © 2017, M. Modarres

18
AmplitudeEnergyRise timeCountsFrequency Waveform
Crack Growth Rate
K=f(stress, crack size)
[1] Bassim, M.N., St Lawrence, S. & Liu, C.D., 1994. Detection of the onset of fatigue crack growth in rail steels using acoustic emission. ENG FRACT MECH, 47(2), 207-214.
One can estimate da/dN,
given b1, b2 and AE count
rate
da/dN
AE Count Rate
Log-log Scale
21 loglog bb
dN
dc
dN
da
Acoustic Emission
Fatigue
correlation
Example of a Sensor-Based
Monitoring PHM (Cont.)
COPYRIGHT © 2017, M. Modarres

Periodic
Inspection Bayesian Fusion
Updated Crack and Defect Size
Updated Crack Growth Rate
Updated PPoF Model Parameters
Corrosion and
other Mechanistic
PPoF Models
• Formal framework
• Recursive (online fusion)
• Computationally feasible
• Multiple source
• Quantitative
• Probabilistic
Current
time
zk-2
Observations
Inspection times
zk-1 zk
rk-2 rk-1 rk
p(zk|rk)
rk+1 rk+2
Prognosis
Example of a Sensor-Based
Monitoring PHM (Cont.)
Recursive Bayesian
COPYRIGHT © 2017, M. Modarres
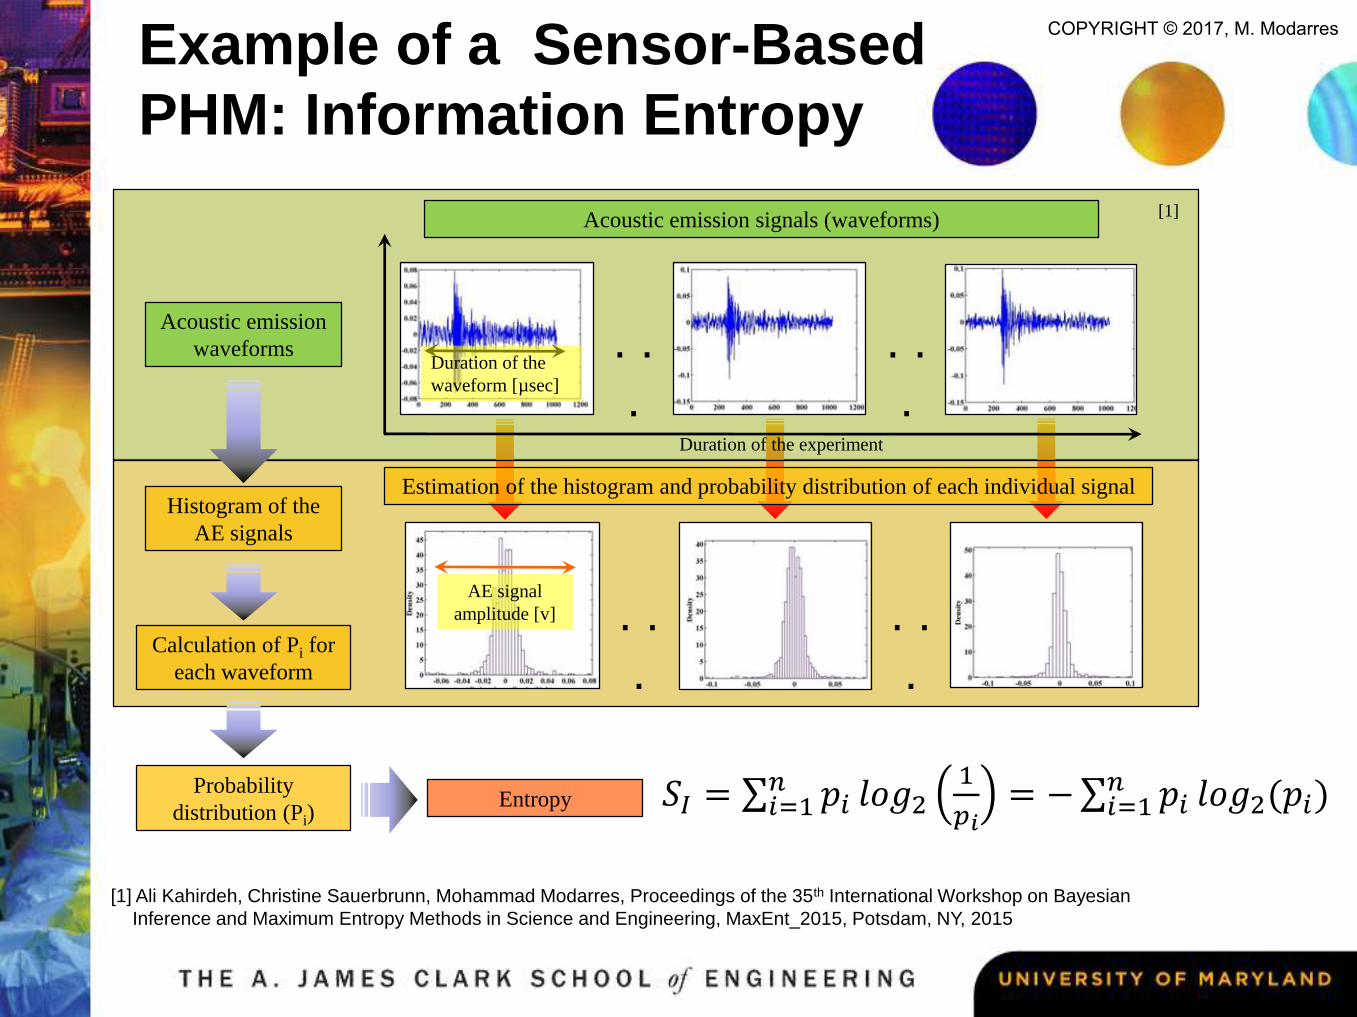
Acoustic emission signals (waveforms)
. .
.
. .
.
. .
.
. .
.
Duration of the
waveform [µsec]
Duration of the experiment
Estimation of the histogram and probability distribution of each individual signal
AE signal
amplitude [v]
Acoustic emission
waveforms
Histogram of the
AE signals
Calculation of Pi for
each waveform
𝑆𝐼 = 𝑖=1𝑛 𝑝𝑖 𝑙𝑜𝑔2
1
𝑝𝑖= − 𝑖=1
𝑛 𝑝𝑖 𝑙𝑜𝑔2(𝑝𝑖)Probability
distribution (Pi)Entropy
[1] Ali Kahirdeh, Christine Sauerbrunn, Mohammad Modarres, Proceedings of the 35th International Workshop on Bayesian
Inference and Maximum Entropy Methods in Science and Engineering, MaxEnt_2015, Potsdam, NY, 2015
[1]
Example of a Sensor-Based
PHM: Information Entropy
COPYRIGHT © 2017, M. Modarres

• Material / Specimen: Al alloy 7075-T6 / Dogbone ASTM E466
[1] Sauerbrunn, Christine M., et al. "Damage Assessment Using Information Entropy of Individual Acoustic Emission
Waveforms during Cyclic Fatigue Loading." Applied Sciences 7.6 (2017): 562
[1]
- Dogbone specimen with
round notch (1 mm
radius)
- Kt=2.61
- Eraser and neoprene
rubber bands were used
for mechanical damper
for AE signal noise
reduction
Example of a Sensor-Based
PHM: Information Entropy
COPYRIGHT © 2017, M. Modarres

• Reference damage is computed by using modulus
degradation
𝑀𝐷𝐷∗=
𝐸𝑖 − 𝐸0𝐸𝑓 − 𝐸0
• MDD: Modulus Degradation Damage
[1] Christine M. Sauerbrunn, Evaluation of Information Entropy from Acoustic Emission Waveforms as a Fatigue Damage
Metric for Al7075-T6, 2016, University of Maryland, Master of Science Thesis
[1]
Example of a Sensor-Based
PHM: Information Entropy
COPYRIGHT © 2017, M. Modarres

[1] Sauerbrunn, Christine M., et al. "Damage Assessment Using Information Entropy of Individual Acoustic Emission
Waveforms during Cyclic Fatigue Loading." Applied Sciences 7.6 (2017): 562
[1]
- The correlation results were evaluated
with deviation factor
- The information entropy is closer than
raw AE features
Example of a Sensor-Based
PHM: Information Entropy
COPYRIGHT © 2017, M. Modarres
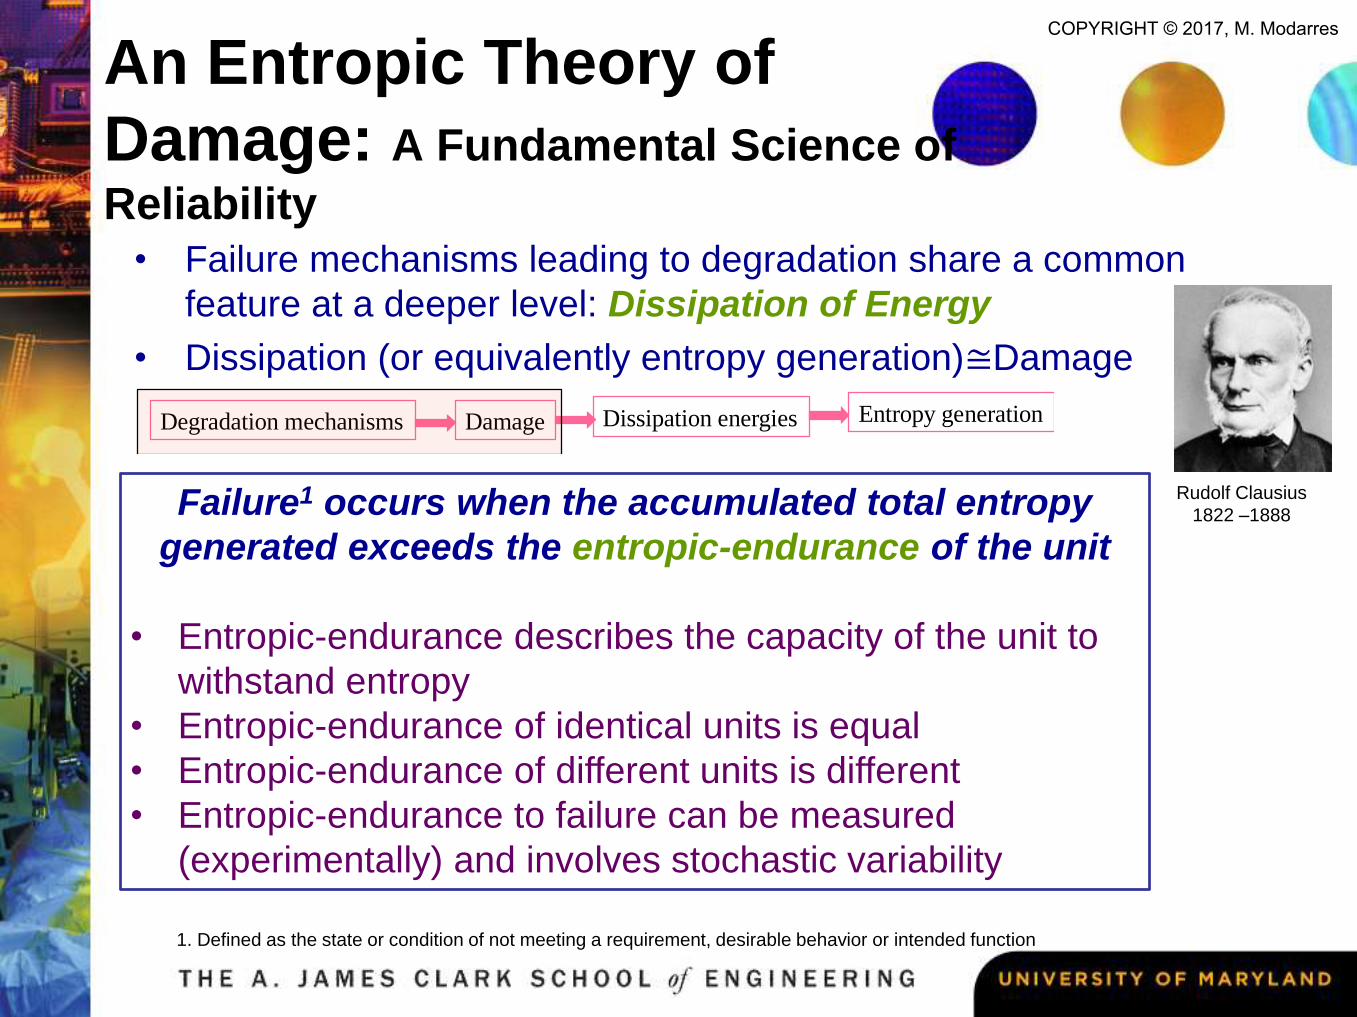
An Entropic Theory of
Damage: A Fundamental Science of
Reliability• Failure mechanisms leading to degradation share a common
feature at a deeper level: Dissipation of Energy
• Dissipation (or equivalently entropy generation)≅Damage
Dissipation energies Damage Entropy generation Degradation mechanisms
Failure1 occurs when the accumulated total entropy
generated exceeds the entropic-endurance of the unit
• Entropic-endurance describes the capacity of the unit to
withstand entropy
• Entropic-endurance of identical units is equal
• Entropic-endurance of different units is different
• Entropic-endurance to failure can be measured
(experimentally) and involves stochastic variability
1. Defined as the state or condition of not meeting a requirement, desirable behavior or intended function
Rudolf Clausius
1822 –1888
COPYRIGHT © 2017, M. Modarres

Thermodynamics as aScience of Reliability
Pa
st
Fu
ture
Pre
se
nt
Why Entropy?
Entropy can model
multiple competing
degradation processes
leading to damage
Entropy is independent
of the path to failure
ending at similar total
entropy at failure
Entropy accounts for
complex synergistic
effects of interacting
degradation processes
Entropy is scale
independent
Ludwig Boltzmann
1844-1906
Statistical Mechanics Entropy
COPYRIGHT © 2017, M. Modarres
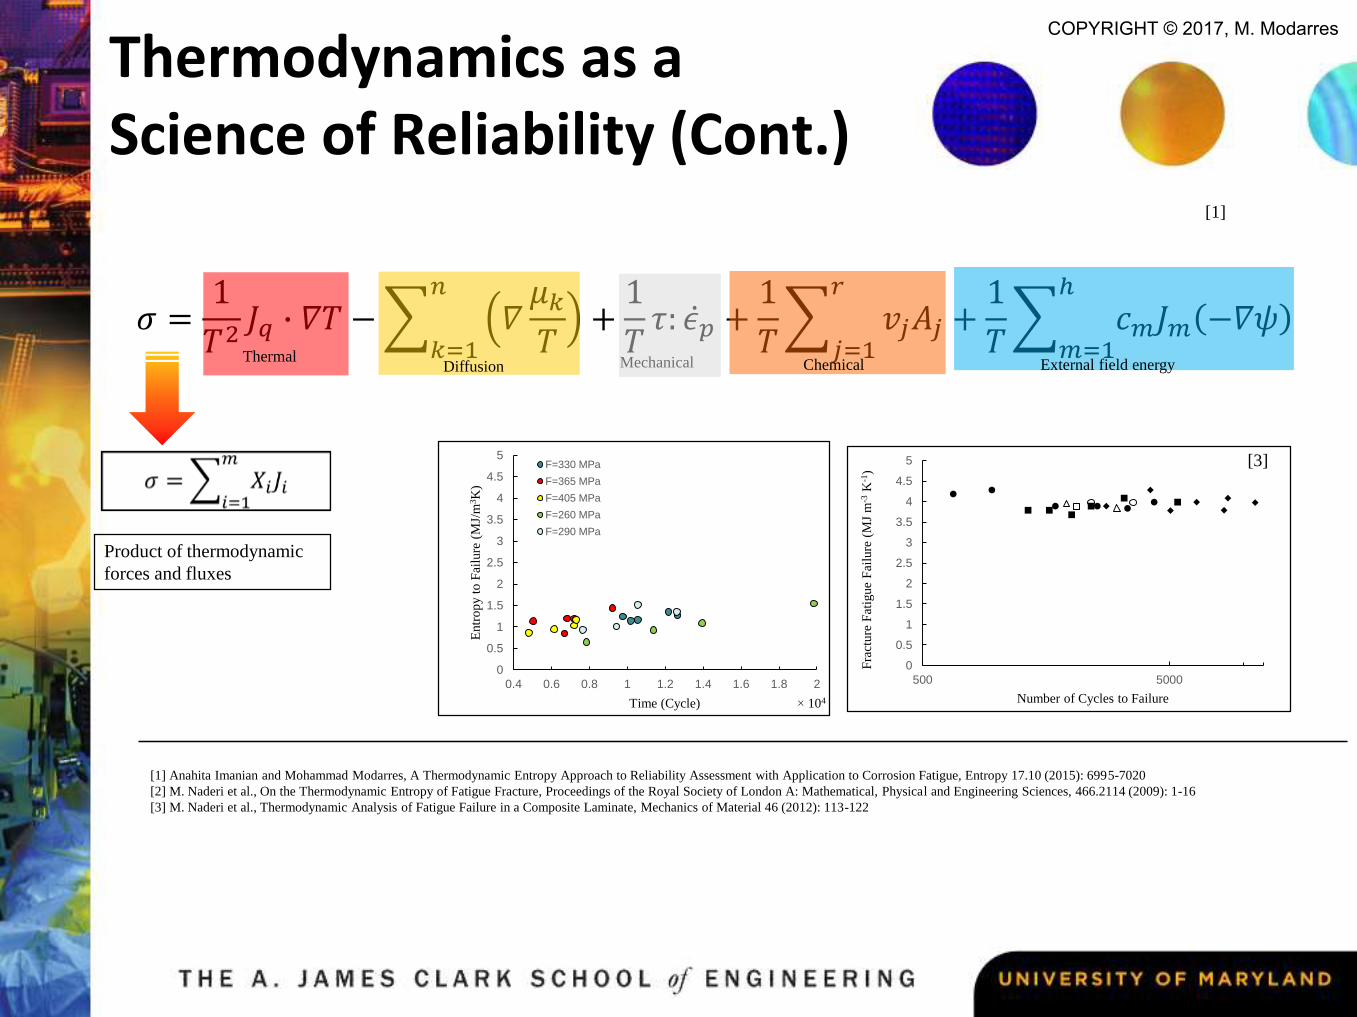
Thermodynamics as aScience of Reliability (Cont.)
[1] Anahita Imanian and Mohammad Modarres, A Thermodynamic Entropy Approach to Reliability Assessment with Application to Corrosion Fatigue, Entropy 17.10 (2015): 6995-7020
[2] M. Naderi et al., On the Thermodynamic Entropy of Fatigue Fracture, Proceedings of the Royal Society of London A: Mathematical, Physical and Engineering Sciences, 466.2114 (2009): 1-16
[3] M. Naderi et al., Thermodynamic Analysis of Fatigue Failure in a Composite Laminate, Mechanics of Material 46 (2012): 113-122
[1]
Product of thermodynamic
forces and fluxes
0
0.5
1
1.5
2
2.5
3
3.5
4
4.5
5
0.4 0.6 0.8 1 1.2 1.4 1.6 1.8 2
Entr
op
y t
o F
ailu
re (
MJ/
m3K
)
Time (Cycle) × 104
F=330 MPa
F=365 MPa
F=405 MPa
F=260 MPa
F=290 MPa
0
0.5
1
1.5
2
2.5
3
3.5
4
4.5
5
500 5000
Fra
cture
Fat
igue
Fai
lure
(M
J m
-3K
-1)
Number of Cycles to Failure
[3]
𝜎 =1
𝑇2𝐽𝑞 ∙ 𝛻𝑇 −
𝑘=1
𝑛
𝛻𝜇𝑘𝑇
+1
𝑇𝜏: 𝜖𝑝 +
1
𝑇
𝑗=1
𝑟
𝑣𝑗𝐴𝑗 +1
𝑇
𝑚=1
ℎ
𝑐𝑚𝐽𝑚 −𝛻𝜓Thermal
Diffusion Chemical External field energyMechanical
COPYRIGHT © 2017, M. Modarres

Conclusions
• Reliability and Risk Analysis Now Forms an
Integral Part of Modern Products, Systems
and Infrastructures Design and Operation
• Exciting and Abundant Activities in
Reliability: Number of Conferences,
Educational Programs, Scholarly Journals,
Human Resource Demands
• PHM and Integrity Assessment a fast
growing area coupled with computational
capabilities and big data analytics
COPYRIGHT © 2017, M. Modarres

Thank you for your
attention!
COPYRIGHT © 2017, M. Modarres


