Download - Copyright by David Franklin Williams 2005

Copyright
by
David Franklin Williams
2005

The Dissertation Committee for David Franklin Williams Certifies that this is the
approved version of the following dissertation:
Manufacturing System Testing Measurement and Management Process
Committee:
Anthony Ambler, Supervisor
Nur Touba
Kathleen M. Wilburn
Margarida Jacome
Baxter F. Womack

Manufacturing System Testing Measurement and Management Process
by
David Franklin Williams, B.S.; M.S.
Dissertation
Presented to the Faculty of the Graduate School of
The University of Texas at Austin
in Partial Fulfillment
of the Requirements
for the Degree of
Doctor of Philosophy
The University of Texas at Austin
May, 2005
Dedication
This dissertation is dedicated to my wife Peggy and my son James. Without Peggy’s
understanding, help, and support this effort would not have been possible. James has
provided inspiration and motivation, which has helped me, complete this dissertation.
v
Acknowledgements
I would like to acknowledge the role of Dr. Ambler, David Elizondo, and Mark
Burgett. Without their help and support this dissertation would not have materialized.

vi
Manufacturing System Testing Measurement and Management Process
Publication No._____________
David Franklin Williams Ph.D.
The University of Texas at Austin, 2005
Supervisor: Anthony Ambler
This dissertation will address the key question of how a test engineer measures,
manages, and improves the quality of a system level manufacturing test process. The
question is complicated due to the lack of clear metrics to drive improvements to the test
process. It is an interesting question because of the way it blends test engineering and
process management techniques. This dissertation will examine the question using a
combination of several process management tools and test engineering techniques. The
management processes include Total Quality Management, the Balanced Scorecard, and
the Theory of Constraints.
The methodology used to address the issues identified, follows the standard Total
Quality Management six-sigma process of Define, Measure, Analyze, Improve, and
Control. The define phase will answer the question “How do you know if you have a
good test process?” This is achieved by defining the stakeholder requirements for the test
process. A balanced scorecard for the test process will be the result of the define phase.
The measurement phase will outline how these requirements are measured. This includes
defining test coverage at the system level, and creating models that calculate the quality,

vii
capacity, and cost impact of the test process. The cost models showed that a significant
cost is related to test development and support. The analysis phase combines the
Balanced Scorecard and the Theory of Constraints to identify the core conflict leading to
the low efficiency of the test process. The core conflict identified is a cost versus quality
tradeoff.
The improve phase seeks to eliminate this core conflict by proposing that the test
process be designed as tool for quality improvement, not just a quality screen. This
approach has several implications on how systems are tested and requires a more
communicative process. In combination with the need to reduce the cost of test
development, these implications lead the author to propose a new Built in Self Test
standard for system testing. The control phase will therefore, discuss the projected
results including a test time saving of 50% and a cost saving of a similar proportion.

viii
Table of Contents
List of Tables ....................................................................................................... xvi
List of Figures ..................................................................................................... xvii
INTRODUCTION 1
Chapter 1: System Manufacturing Test ..................................................................3 Manufacturing Environment...........................................................................3 Test Development Process..............................................................................7 Sources of Variation .......................................................................................9 Decisions in Manufacturing System Test .....................................................10
To Test or Not to Test..........................................................................10 Design Verification Testing........................................................11 Testing Software .........................................................................11 Burn in Testing ...........................................................................12
How to Test..........................................................................................13 Functional or Structural Testing .................................................14 Component or System Testing....................................................15 Implicit or Explicit System Testing ............................................16
Where to Test.......................................................................................17 Where to Direct Process Improvement Resources...............................18
Chapter 2: Problems with the Current State .........................................................19 Lack of Effective Metrics .............................................................................19
Test or Fault Coverage.........................................................................20 Subjective attributes.............................................................................21
Relationship Between Priorities....................................................................21
REVIEW OF LITERUATURE 23
Chapter 3: System Management Techniques........................................................24 Total Quality Management ...........................................................................24 The Balanced Scorecard ...............................................................................26

ix
The Theory of Constraints ............................................................................27
Chapter 4: System Manufacturing Test Literature................................................29 System Test Literature ..................................................................................29
System-Level Testing: Characterization and Improvement ................29 Integrating Manufacturing Test Strategy with Manufacturing Production
Strategy .......................................................................................30 A new Fault Model for System Level Descriptions.............................30 Engineering-to-Manufacturing-to-Field Test Strategies Status Report 1992
.....................................................................................................31 Test Related Cost Model Literature..............................................................32
Cost Effective System Level Test Strategies .......................................32 System Test Cost Modeling Based Event Rate Analysis.....................32 A New Test/Diagnostic/Rework Model for use in Technical Cost
Modeling of Electronic Systems Assembly................................33 Process-Based Cost Modeling .............................................................34 Tackling Test Trade-offs from Design, Manufacturing to Marketing using
economic Modeling ....................................................................34 Summary of current state of the research .....................................................35
METHODOLOGY 36
DEFINE PHASE 37
Chapter 5: Stakeholders Requirements.................................................................37 Final Customer..............................................................................................38
Requirements .......................................................................................38 Metrics .................................................................................................39
Highly Reliable System ..............................................................39 Delivered on Time ......................................................................39 Required Product feature set.......................................................39 Reasonable Cost..........................................................................40 Quick Problem Resolution..........................................................40
Test Development .........................................................................................40 Requirements .......................................................................................40

x
Metrics .................................................................................................41 Flexibility and Standardization...................................................41 Not delay New Products .............................................................41 Easy to Maintain .........................................................................41
Manufacturing...............................................................................................41 Requirements .......................................................................................42 Metrics .................................................................................................43
Minimizes impact on capacity ....................................................43 Minimizes issues in manufacturing ............................................43 Improve Manufacturing Processes..............................................43 Quick Troubleshooting ...............................................................43
Quality Department.......................................................................................44 Requirements .......................................................................................44 Metrics .................................................................................................44
Catches bad systems ...................................................................44 Does not fail for good systems ...................................................45 Provides feedback necessary to drive process improvements ....45
New Product Development ...........................................................................45 Requirements .......................................................................................46 Metrics .................................................................................................46
Requirements defined early in development cycle .....................46 Test Issue late in the Development Process................................46
Development Engineering ............................................................................46 Requirements .......................................................................................47 Metrics .................................................................................................47
Cost and Benefit of DFT.............................................................47 Suppliers .......................................................................................................47
Requirements .......................................................................................47 Metrics .................................................................................................48
Supplier Diagnostics Effectiveness.............................................48 Test Result Correlation ...............................................................48

xi
Failure Analysis ............................................................................................48 Requirements .......................................................................................48 Metrics .................................................................................................49
Getting the Required Information...............................................49 Issue Identification and Resolution.............................................49
Field Service .................................................................................................49 Requirements .......................................................................................49 Metrics .................................................................................................50
First Time Fix .............................................................................50 Time to Resolution......................................................................50 Data on Failures ..........................................................................50
Test Requirements Summary........................................................................50
Chapter 6: Balanced Scorecard and Test ..............................................................53 Financial Perspective ....................................................................................54 Customer Perspective....................................................................................55 Internal Process Perspectives........................................................................55
Flexibility.............................................................................................56 Accuracy ..............................................................................................56 Reliability.............................................................................................56
Learning and Growth Perspective.................................................................57
MEASURE PHASE 58
Chapter 7: Quality Model .....................................................................................60 Model Overview ...........................................................................................60
Model Inputs ........................................................................................60 Model Calculations ..............................................................................61 Model Outputs .....................................................................................61
Risk Model....................................................................................................61 Defining Risk .......................................................................................61 Sources of Risk ....................................................................................62 Steady State Risk .................................................................................64

xii
Excursion Risks ...................................................................................64 Risk Model Output...............................................................................66 Failure Impact ......................................................................................66
Test Coverage ...............................................................................................67 Overall Test Coverage .........................................................................68 Measurement of Risk and Test Coverage ............................................68
Measured Data ............................................................................68 Factory Failure Analysis: ............................................................70
Field Data:............................................................................................71 New Products .......................................................................................72 Test Resources .....................................................................................72
Chapter 8: Capacity Model ...................................................................................73 Excel Model .........................................................................................73 Event Driven Model.............................................................................74 Excel and Event driven Simulation Comparison .................................75
Quick Test Model .........................................................................................75 Model Inputs ........................................................................................75 Model Calculations ..............................................................................76 Model Output .......................................................................................76
Extended Test Model ....................................................................................76 Model Inputs ........................................................................................76 Model Calculations ..............................................................................77 Model Output .......................................................................................77
Chapter 9: Overall Cost Model .............................................................................79 Use of the Cost Model: .................................................................................79 Model Inputs: ................................................................................................79 Model Structure: ...........................................................................................80 Manufacturing Cost Model:..........................................................................80
Cost of a Test Development:................................................................83 Cost of a Test Escape:..........................................................................84

xiii
Manufacturing Costs.....................................................................................85 Capacity costs ......................................................................................87 Cost of Test Labor ...............................................................................88 Cost of Repairing Failures ...................................................................88 Cost of Sustaining Issues .....................................................................89 Other Costs...........................................................................................89
Limitations of the Cost Model: .....................................................................91
Chapter 10: Measurement Results ........................................................................92
ANALYZE PHASE 96
Chapter 11: Analysis of Process ...........................................................................96 Relationship of Variables..............................................................................96 Conflict Analysis ..........................................................................................98
Testing Longer vs. Capacity ................................................................98 Underling Assumptions ..............................................................98 Decision impacts.........................................................................99
Simplicity and Complexity ..................................................................99 Underling Assumptions ..............................................................99 Decision impacts.......................................................................100
Core Conflict...............................................................................................100 Impact of the core conflict ..........................................................................101
IMPROVE PHASE 104
Chapter 12: Proposed Solution ...........................................................................104 Why Test? ...................................................................................................104 Strategy: Focus on Improving Quality.......................................................105
Chapter 13: System Level Built in Self Test ......................................................109 Complexity Assumptions............................................................................111 The Built in Self Test Vision ......................................................................111 Advantages To Suppliers ............................................................................113 Built in Self Test Requirements..................................................................113

xiv
Commands .........................................................................................113 Quick Test.................................................................................113 Maximum Reliability Test ........................................................114 Programmable Test coverage....................................................114
Interface Test .....................................................................................114 Driver Based Test ..............................................................................114
Data Collection Requirements ....................................................................115 Initialization Failures .........................................................................115
Built in Self Test Failures .........................................................116 Operational Failures..................................................................116
Current Status..............................................................................................116 Hard Drive BIST................................................................................117 Motherboard BIST.............................................................................117 Transaction BIST...............................................................................117
INTERFACE BIST ......................................................................118 Memory BIST ....................................................................................118 Storage Buses (SATA, SAS) .............................................................118 Add in Cards ......................................................................................119 Software .............................................................................................119 Expanding Boundary Scan.................................................................120
Risks in this Strategy ..................................................................................120 Cost of BIST ......................................................................................120 Inadequate Coverage..........................................................................121
CONTROL PHASE 122
Chapter 14: Results ..............................................................................................122 Projected Improvements .............................................................................122
Financial.............................................................................................123 Internal ...............................................................................................124 Customer ............................................................................................124 Learning .............................................................................................125

xv
Management Process ..................................................................................125
CONCLUSION 128
Areas of Further Investigation .............................................................................130
Appendix: How to Read Logic Diagrams...........................................................131
Bibliography ........................................................................................................132
Vita…...................................................................................................................135

xvi
List of Tables
Table 1: Test Requirements ............................................................................................ 52 Table 2: Balanced Scorecard .......................................................................................... 54 Table 3: Risk Model........................................................................................................ 66 Table 4: Test Coverage ................................................................................................... 67

xvii
List of Figures
Figure 1: Test Continuum........................................................................................ 3 Figure 2: Manufacturing Environment.................................................................... 5 Figure 3: Test Environment..................................................................................... 8 Figure 4: Bathtub Curve ........................................................................................ 13 Figure 5: Stakeholder Map .................................................................................... 37 Figure 6: Model Relationship................................................................................ 59 Figure 7: Sources of Risk ...................................................................................... 63 Figure 8: Test Coverage Bridge Chart................................................................... 65 Figure 9: Factory Failure Data Flow ..................................................................... 70 Figure 10: Field Failure Analysis Process............................................................... 71 Figure 11: Event Driven simulation output ............................................................. 74 Figure 12: Excel Capacity model output ................................................................. 78 Figure 13: Cost of test model .................................................................................. 81 Figure 14: Cost of Manufacturing Test ................................................................... 83 Figure 15: Fixed Costs per System.......................................................................... 86 Figure 16: Capacity model output with no change.................................................. 92 Figure 17: Capacity with one Process Change ........................................................ 93 Figure 18: Capacity with two Process Changes ...................................................... 94 Figure 19: Simplified cost output. ........................................................................... 95 Figure 20: Balanced Scorecard Relationship .......................................................... 97 Figure 21: Total Cost of Test graph ...................................................................... 101 Figure 22: Quality vs. Capacity Current Reality Tree........................................... 103 Figure 23: Impact of Improving Quality ............................................................... 106 Figure 24: Strategy for Improving Quality............................................................ 108 Figure 25: Built in Self Test for Improving Quality.............................................. 110 Figure 26: Built in Self Test Vision ...................................................................... 112 Figure 27: Long term trends in test time and field failure rates. ........................... 123 Figure 28: Management Model ............................................................................. 127 Figure 29: Logic Diagram Description.................................................................. 131

1
INTRODUCTION
Work on this dissertation began with the question “How do you know if you have
a good manufacturing test process at the system level?” Being able to answer this
question is fundamental to improving any test process. This dissertation contains a
solution to the question. The solution involves defining a new test coverage metric, and
creating models for cost, quality, and capacity. The next question is “How do you
improve the test process?” To address this issue one must realize that the issues facing
the test process are similar to those being faced by other business processes. By
examining how other processes are managed one can leverage well-established business
process management techniques to drive dramatic improvements in the test process. This
approach involves treating the test process as a part of a much larger system. Using these
techniques, one is able to create a management system that in turn, creates a more
manageable and effective process than what exists today. These techniques will indicate
the need for a new system level built in self-test standard.
This introduction provides a broad outline of the system test process and related
issues. It is followed by a review of literature that will lay the groundwork for the rest of
the dissertation. The methodology used after the review of literature is divided into
Define, Measure, Analyze, Improve, and Control (DMAIC) phases. It begins with
defining what a good test process is, from a stakeholder’s perspective. The stakeholder’s
requirements reflect how the test process impacts other processes in the overall system.
A technique called the Balanced Scorecard is used to track the metrics that are important
to the stakeholders. The measurement phase measures how well the test process interacts
with other processes as defined in the balanced scorecard. Models need to be created to
understand the reasonably complex interactions. These models include a quality model, a

2
capacity model, and a cost model. The analyze phase focuses on developing a strategy
for improving the system. The goal is to design projects that improve all the interactions
of the test process, with the larger system. This analysis uses the models discussed
above. It also identifies the core conflicts in the process, based on the Theory of
Constraints methodology. The improve phase seeks to improve the current situation by
eliminating the core conflicts. The underling assumptions are targeted for this purpose.
This analysis will lead to the need to develop a system level Built in Self-Test standard
for all components in the system. This requirement is driven by the need to turn the
system level test process into a quality improvement tool, from a quality screen, while
reducing the test development and sustaining costs. The control phase identifies the
actual and projected improvements based on these recommendations.

3
Chapter 1: System Manufacturing Test
This dissertation is an analysis of the test process in a high volume electronic
system manufacturing environment. The system manufacturing test process is located at
a critical spot in the testing continuum, stretching from component testing through field
testing, as shown in Figure 1. This phase is critical because it is the last test line of
defense between quality defects and the end user of the system. The objective of this
dissertation is to understand the test challenges that exist at the system manufacturing
stage and propose strategies to meet these challenges.
Figure 1: Test Continuum
MANUFACTURING ENVIRONMENT
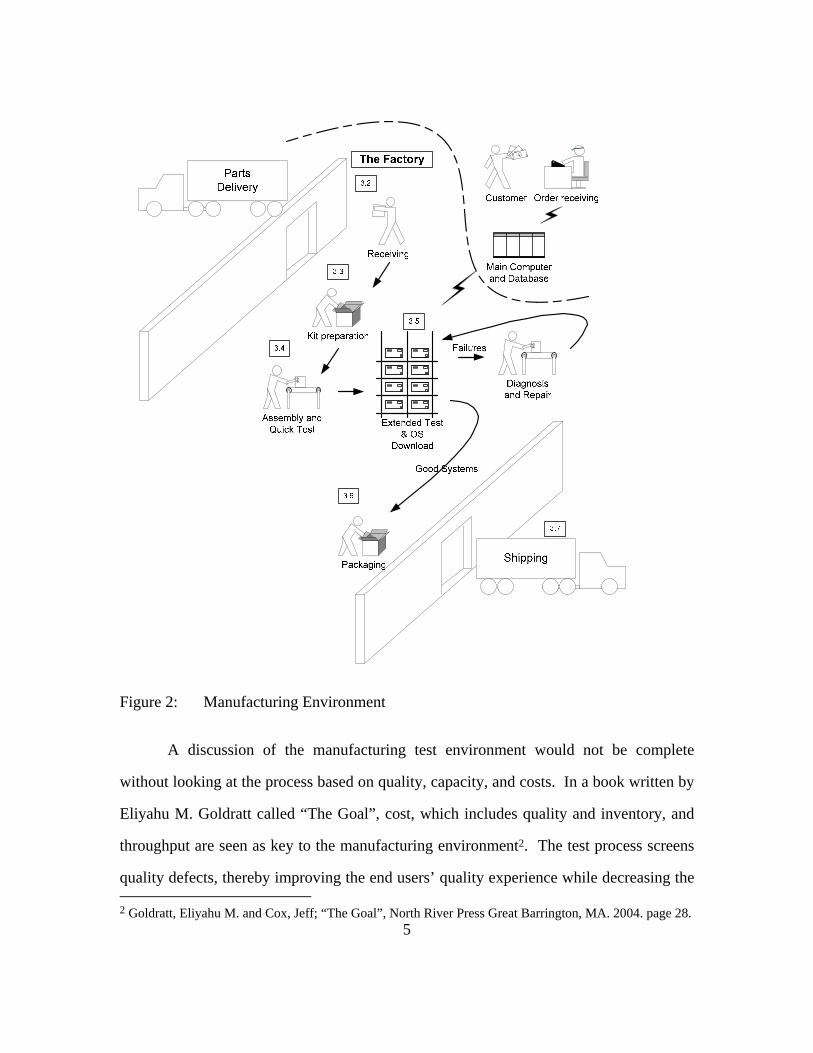
The manufacturing environment, on which this dissertation is based, is a high
volume, tens of thousands of systems a day, “build to order” computer assembly facility.
The physical layout of the manufacturing environment is shown in Figure 2.1 The 1 Orton, Rex; “A System Test Cost Model as Influenced by Business Plan” University of Texas, Masters Thesis, May 1999
4
process begins when a customer places an order. The order is transmitted to the factory so
that a system can be built. The components of the order are sent to a build cell, where
they are assembled into a system. The components of the system are purchased from a
variety of suppliers, who must ensure that the components are of good quality. The
components are assembled into a system, which is then configured and tested. Customer
software is installed in it. There are two test phases, quick test and extended test. The
quick test phase is used to verify whether the system is built correctly, and to perform
operator interaction. In the extended test phase, longer functional testing is performed
before software is installed in the system. Failed parts are replaced and retested. The
data resulting from the manufacturing test process is fed back either to the supplier or the
assembly process, to drive corrective action.
5
$
Figure 2: Manufacturing Environment
A discussion of the manufacturing test environment would not be complete
without looking at the process based on quality, capacity, and costs. In a book written by
Eliyahu M. Goldratt called “The Goal”, cost, which includes quality and inventory, and
throughput are seen as key to the manufacturing environment2. The test process screens
quality defects, thereby improving the end users’ quality experience while decreasing the 2 Goldratt, Eliyahu M. and Cox, Jeff; “The Goal”, North River Press Great Barrington, MA. 2004. page 28.

6
capacity of manufacturing, and increasing the costs in development and manufacturing.
The way the test process impacts these three variables will be important in determining
the correct test strategy.
Quality defects can arise from one of three general categories, component quality,
design problems, and system manufacturing induced defects. To design a test process
that can effectively screen quality defects, visibility of the level of incoming component
quality, visibility of any potential design issues, and visibility of any risks induced by the
manufacturing process, is required. In principle, the quality risks that system test should
focus on are the system manufacturing issues, as other issues should have been resolved
before the system was assembled. The design of the system should be verified in
advance, and the parts that arrive in manufacturing should be of the highest quality.
Unfortunately, this is not always the case. If significant risks exist in a system, the test
process can be required to verify whether the components or design interactions meet
their specifications, despite the fact that they have already been verified.
The capacity impact of the test process depends upon the resources required by
the test process and the amount of resources available in manufacturing. It can range
from no impact on capacity to some level of negative impact on capacity. The question
would be how many more systems we would ship, if we had no test process.
The cost of the test process includes the costs of testing and test escapes. This
topic will be dealt with in depth, later in the dissertation. It includes the costs of test
development and deployment, capacity impact, and test failures both in the factory and in
the field.
There are other factors that need to be considered when designing a test process.
These factors center on internal processes including test development time for new

7
products, the ability to quickly troubleshoot failures, and the feedback necessary to drive
process improvement.
TEST DEVELOPMENT PROCESS
Figure 3 shows the general process flow of the test development process. The
process begins with marketing, creating a product requirements document. The new
products organization uses the document to communicate the requirements to the various
stakeholders. These stakeholders include the quality department, hardware design,
software design, and test strategy teams. The design teams create the product
architecture to satisfy the marketing requirements. The test strategist works with the
stakeholders of the test process including quality, design, new product introduction, and
the factories, to design the test requirements based on the product requirements and the
design architecture. Once the test requirements are signed off, they are fed to the test
development group for implementation.
When the test development group finishes coding the new test process, it is sent to
the various factories to test the new product. Members of the quality group are involved
in ensuring that supplier, factory, and field quality levels are achieved. Supplier quality
ensures that the supplier tests the parts adequately before they are shipped to the factory,
assembled into systems and tested. Failures are repaired, and the systems that pass, are
shipped.
For each test in the process there needs to be a feedback loop to drive process
improvements. These feedback loops are run by the appropriate quality group and driven
by failure analysis and data collection. The feedback information will be routed to the
source of the defect and the test strategist, to drive continuous improvement in both
product quality and the test process.

8
Figure 3: Test Environment
9
SOURCES OF VARIATION
Certain sources define quality, “as inversely proportional to variability”3. When
looking at a process, it is important to identify the inherent sources and impacts of
variation. In the build to order manufacturing system test environment, a primary source
of variation is the continually shifting product mix, based on the orders received from the
customers. Another primary source of variation is supplier quality, both across suppliers,
and changes within a supplier. This variation’s impact on the test process will be
examined from the quality, capacity, and cost perspectives.
Quality can vary for a number of reasons. A primary source of variation involves
different supplier quality levels. As components of a system come from two or more
suppliers, their quality levels may differ significantly. This can lead to different testing
requirements. To keep the test process standard, it becomes necessary to test the parts
from all the suppliers, at the level required by the supplier with the worst quality level.
The quality of a part can also shift in ways not obvious to the test strategist, because of
changes in a single supplier’s quality level.
Variations in capacity can be impacted by test resource requirements and the
failure rate. If the amount of resources required to test a system varies with the system’s
configuration, then the shifting of the product mix, due to the build to order model, can
cause shifts in the resources required in manufacturing. If certain system configurations
take longer to test than others, the amount of capacity available must be able to handle
the test time variations without causing a bottleneck in manufacturing. This variation can
dramatically impact capacity requirements that the test process has to meet. Variations in
failure rates can cause capacity impacts by using up resources needed to repair the system
3 Montgomery, Douglas C.; “Introduction to Statistical Quality Control” Third edition; John Wiley & Sons Inc. New York; 1997, page 4

10
and by delaying large orders. For example, if one system in an order of 50 fails, then 49
systems must wait until the failure is repaired. Storing these systems can create capacity
constraints in manufacturing.
Variations in cost tend to be driven by the variations in quality and capacity,
discussed above. For example, the potentially wide variation required in test resources
means that you need enough buffer to handle the variation without causing capacity
issues. The test resources that make up the buffer lead to an increase in the cost of
testing. The build to order manufacturing process can also impact the cost of testing,
because of the complexities inherent in the build to order model. Extra cost and
complexity come into play when different test sequences are required for different
systems, depending upon the specific system configuration.
DECISIONS IN MANUFACTURING SYSTEM TEST
To get a better understanding of what is required to manage the test process, it is
useful to discuss the types of decisions that need to be made. Conflicting stakeholder
priorities complicate these decisions. This section will briefly discuss these decisions and
provide rationales as to when one option or the other may be appropriate. The answers to
these issues often depend on the quality, capacity, and cost impacts associated with the
issue in question.
To Test or Not to Test
The first decision that needs to be made is whether or not to test a function in
manufacturing. The answer to this question depends upon the level of risk in the function
and the cost of mitigating that risk through the test process. To determine the level of
risk in a part or process, the history of that part or process needs to be understood. If a
part has already been adequately tested before it arrives in system manufacturing, why

11
should the factory have to spend time and energy retesting the device? Reasons to test
can include poor supplier quality, a possibility of manufacturing induced damage, or
other integration issues. To measure risk, it is necessary to analyze the probability of a
defect that would cause the function to fail and the impact of the failure on the end user.
Understanding the cost and capacity impact of testing the function in manufacturing, also
plays a role in the decision making process as do other options to mitigate the risks.
Three interesting examples of whether or not to test involve design verification testing,
software testing, and burn in testing.
Design Verification Testing
The design is verified before a system enters production, and the test process
should not need to worry about any risks generated by the design. However, the constant
change in hardware and software, combined with the rapid product cycle may cause some
design issues to slip through the design verification testing that occurs before the system
is ready for production. Design verification testing involves testing either the component
interactions with the system or testing the system as a whole. The question is, “What role
should manufacturing system test play in testing for design defects?” This leads to the
question, “What are the design risks present and how do they need to be verified?”
Cooperation of the design teams is necessary to identify these risks. Any design risks
that are present tend to be corrected as the lifecycle of the system progresses. If design
verification testing is necessary, it is most valuable when the system is just released to
production.
Testing Software
There are two aspects to testing software. The first, “Did the software get to the
machine and get installed correctly?” The second, “Is the software functional on the

12
system under test?” It is necessary to verify whether the software is loaded correctly on
to the system. This reduces the risks that a manufacturing process issue caused the
software to be installed incorrectly. Verifying the software functionality brings us into a
design verification arena. The answer to this issue depends on the risks associated with
the software functionality.
If a decision is taken to perform design verification testing then, testing under the
customer’s software can be a good solution. This could range from just booting the
customer’s operating system and ensuring that each component is communicating
successfully, to running a system exerciser to verify performance metrics. The
disadvantage of using the customer’s operating system for testing can be seen if there are
multiple types of operating systems that the customer can order. A system exerciser that
supports multiple operating systems would need to be created. This support could greatly
complicate the development efforts and cause manufacturing issues due to the increased
complexity. It is also difficult to determine the exact level of test coverage gained from a
system exerciser.
Burn in Testing
Burn in testing refers to testing the system for an extended period of time to
identify failures in the infant mortality phase of the lifecycle. The lifecycle is typically
shown as a bathtub curve in Figure 4.4 The infant mortality failures are at the far left side
of the chart, and are generally caused by weak components that work for a brief period of
time before failing.
4 Klutke, G.A.; Kiessler, P.C.; Wortman, M.A. “A critical look at the bathtub curve” IEEE Transactions on Reliability, Volume 52, Issue 1, March 2003 Page 126

13
Failu
re R
ate
Figure 4: Bathtub Curve
The issue is, “How does the manufacturing system test, cover this risk?”
Requiring burn in on all the components before they arrive for assembly is one option.
Requiring the suppliers to do burn in before they ship the parts for assembly is clearly the
best option, because they can identify the failures early in the process. If the data shows
that running burn in testing at the system level will significantly mitigate the risk to the
customer, we can run our diagnostics for the required period of time until we get to the
flat portion of the curve. The required time would be determined by monitoring the
failure rate to find the minimum time where the targeted infant mortality failures are still
caught. Questions have been raised over the assumptions underlying the bathtub curve
and the need to rely on failure data to determine the values of burn in testing, has been
emphasized.5
How to Test
While deciding whether or not to test, it is necessary to note the cost of the test
and the impact the test will have on the manufacturing capacity. When deciding how to
5 Klutke, G.A.; Kiessler, P.C.; Wortman, M.A. “A critical look at the bathtub curve” IEEE Transactions on Reliability, Volume 52, Issue 1, March 2003 Page 128
14
test a given function, several parameters need to be considered including where the test is
to be conducted, how to conduct it, how much time it is going to take, if any external test
equipment and operator interactions are required. Each of these parameters may impact
manufacturing capacity and the cost of testing. This section will discuss some of the
issues associated with how you can test the system.
Functional or Structural Testing
Functional testing involves defining a set of functions that a device can perform,
and verifying whether the device can perform the functions, as specified. Structural
testing is where the test runs specific patterns that target defects based on the internal
structure of the device. Initially chip testing involved functional testing, but as chip
complexity increased a more structured approach was adopted. Defining functional test
vectors for non-trivial chips is not even remotely feasible.6 Functional testing has been
the primary method for verifying correct system operation.
The advantage of functional testing at the system level is that it mimics the end
user environment and it depends less on the internal architecture of the component. The
internal architecture can vary significantly between various suppliers of a given
component, but the functions tend not to vary. By not depending on the internal
architecture of the component it makes it easier to cover a wide range of suppliers with a
single test. Functional testing is especially useful when the tasks that a component or
system has to perform, are limited to a small set of functions. The main disadvantage
arises from the difficulty in determining test coverage, and targeting untested defects.7
6 Grochowski, A.; Bhattacharya, D.; Viswanathan, T.R.; Laker, K.; “Integrated circuit testing for quality assurance in manufacturing: history, current status, and future trends” IEEE Transactions on Circuits and Systems II: Analog and Digital Signal Processing, Volume 44, Issue 8, Aug. 1997 Page 620 7 Grochowski, A.; Bhattacharya, D.; Viswanathan, T.R.; Laker, K.; “Integrated circuit testing for quality assurance in manufacturing: history, current status, and future trends” IEEE Transactions on Circuits and Systems II: Analog and Digital Signal Processing, Volume 44, Issue 8, Aug. 1997 Page 620

15
Structural testing has an advantage when the component has a significant
possibility of defects at locations that can cause failures that are hard to define
functionally. Structural testing has an advantage in that it gives you more defined test
coverage. With structural testing you can define the fault model and estimate test
coverage through a much more rigorous method.8 Structural testing tends to work well
when the internal structure of the component has a consistent architecture across
suppliers. The components need to have a large distribution of potential failure locations
with a similar probability of failure that cannot easily be collapsed into a small number of
functions to test.
The choice between functional and structural testing depends on the costs,
complexity of functions, and the associated risk distribution of the given component in
the system under test. The CD-Rom drive is where functional testing may have an
advantage. If the CD-Rom drive can perform the required functions including opening
the tray, closing the tray, and reading media, the drive is probably working. Memory is
an example where structural testing may have an advantage, as it has many memory
locations that could fail.
Component or System Testing
A common issue in the system test arena is whether the test process should be
designed to test the components of the system, or whether it should test the system as a
whole. Testing components involves running a diagnostic, targeting a specific
component, while testing the system involves running diagnostics or other utilities that
target the component interaction.
8 Grochowski, A.; Bhattacharya, D.; Viswanathan, T.R.; Laker, K.; “Integrated circuit testing for quality assurance in manufacturing: history, current status, and future trends” IEEE Transactions on Circuits and Systems II: Analog and Digital Signal Processing, Volume 44, Issue 8, Aug. 1997 Page 620

16
The advantages of testing components, compared to testing the system include:
easier troubleshooting, less likelihood of false failures, and less expensive development.
Troubleshooting is easier because one component or a small subset of components is
being tested in relative isolation. If the test fails it is generally easy to find the failed
component. The less likelihood of a false failure arises from the fact that testing a
component is simpler than testing system interaction, and simpler processes tend to be
more robust. If you have only one vendor for a component then the possibility of
leveraging vendor diagnostics exists, to minimize development costs. For components
with multiple vendors, a single functional test can generally cover all the vendors.
Diagnostics to test the entire system may need to be developed specifically, for the each
type of system under test.
The advantages of testing the system over testing the components, center on more
relevant test coverage. If the suppliers have tested the components, there is no need to
retest them. Testing components in the system, as a system will be more like what the
end user of the system will experience. Therefore, the coverage will be more relevant to
protecting the end user, and it will also help find system design issues that often appear as
system interaction issues.
The decision as between testing components vs. the system focuses on the level of
risk associated with system interactions. Is this risk that can only be captured with the
system level diagnostics, high enough to warrant the added complexity and cost of a
system targeted test process?
Implicit or Explicit System Testing
Implicit tests test the system as a system, instead of the individual components.
This involves running the system, as a customer will, and verifying the performance.

17
Explicit tests are run to verify whether a specific function is operating correctly9.
Implicit testing is usually functional, while explicit testing can be either functional or
structural. Other value added steps in the production process that by their nature test part
of the system infer implicit test coverage. For example, booting a system to the
customer’s operating system to set up some of the software for the customer would verify
a significant portion of the computer. It means that the system is healthy enough to boot
windows and run some scripts. The advantage of this is that the test coverage from
setting up the software is free since the steps would have to run again anyway. The major
disadvantages in relying on implicit testing are that it can be difficult to define the level
of coverage achieved, to troubleshoot the failures, and collect data on the error that
caused the failure. This is due to the fact that customer applications and not diagnostics
are used to find failures. If a decision is taken to use implicit testing, then there may be a
need for explicit diagnostics in the repair facility.
Where to Test
If you have decided to test a function in manufacturing, you need to decide early
on, where in the process to test it. Usually, it is cheaper to find defects as early in the
process as possible, to reduce the time investment in bad parts. Therefore, if you have a
series of tests, putting the tests with the highest failure rate in the front, is a reasonable
plan. This is reasonable as long as there are no conflicting priorities. These conflicting
priorities will most likely show up in the impact to the manufacturing capacity. In a
multi-stage test process, you would not want to put a long test at a testing stage where
capacity requirements dictate a short test time.
9 Farren, D.; Ambler, A. P. “System test cost modeling based on event rate analysis” Proceedings of International Test Conference, 1994, Pages: 84

18
Where to Direct Process Improvement Resources
When directing test process improvement efforts, the question is, on which area
should we focus our efforts to get the biggest return on investment? Which stakeholder
requirement takes priority over the others? How do we allocate the limited test
improvement resources? This is generally achieved by creating business cases for the
various projects that are competing for the limited resources. The stakeholder who wants
his priority met creates these business cases. Therefore, the business cases may be overly
optimistic. If no systematic approach to improving the test process is adopted the
changes would depend on which stakeholder is the best salesman in asking for changes to
the test process. It can also result in changes that optimize one part of the system at the
expense of the other parts of the system.
As can be seen from the discussion above, the optimal test process depends upon
the interplay of various factors. These factors include the type of risks posed by the
production of the system, the impact of failures on the customer, the capacity
requirements of manufacturing, and the cost of various factors of production and
development. This dissertation will systematically discuss these issues, so that the impact
of test changes on the overall system can be analyzed.

19
Chapter 2: Problems with the Current State
The two main drawbacks of the current method of managing the manufacturing
test process are the lack of clear and effective metrics that point to the quality level of the
test process and the a lack of understanding of the relationships between the metrics. The
lack of standardized metrics means that it is very difficult to measure the effectiveness of
different test process alternatives. Managing any process without good measurements
tends to limit the decision making process to engineering judgment and subjective or
questionable measures, which are mainly financially driven. Without understanding the
relationship between the metrics it is difficult to weigh various stakeholder priorities to
resolve conflicting priorities. With these two problems, it is very difficult to formulate an
effective strategy for test improvement or demonstrate improvement. This dissertation
will resolve both these difficulties.
LACK OF EFFECTIVE METRICS
To make effective decisions relating to the test issues discussed in the previous
section, one need to understand the impact of the decisions on the effectiveness of the test
process. The effectiveness of the test process has been measured. One example of an
important metric is the test coverage. There is no standardized test coverage metric at the
system level. There is also no metric to measure more subjective attributes of the test
process, such as the flexibility of the test process or the quality of the feedback the test
process generates to improve processes.

20
Test or Fault Coverage
Test or fault coverage is defined as the percentage of faults or defects covered by
a test process in relation to the universe of faults.10 There are problems in defining the
universe of faults at the system level. The first issue is the very large number of potential
faults, making any effort to define them all, difficult. The issue is also complicated by
the wide variation in the probability of faults at the system level. This makes a percentage
of faults covered misleading, if it does not take into account the probability of a fault.
Typically, test engineers try to achieve the highest level of test coverage they can, but at
the system level a high level of test coverage is not necessarily the optimum solution.
The optimum level of test coverage depends upon two main factors, the probability of
faults that the test is actually covering and the cost of achieving that level of test
coverage.
To determine test coverage at the chip level, fault models based on stuck at faults
and other well-defined fault models are created. These models can be used across a vast
range of chips, as a standard metric to compare different potential solutions. Board level
testing involves In-Circuit Testing (ICT), usually looks for soldering issues and measures
the test coverage in terms of coverage of correct components placements, shorts, and
opens. Board testing also includes some level of functional testing. At the system level,
the testing process identifies failures that were test escapes from the previous testing
process, process induced damage, or system interaction issues. The possible spectrum of
failures is very large and includes faults generated by software, mechanical, or electrical
defects. This fault spectrum can vary significantly from one type of system to another.
10 Ambramovicic, Miron, Breuer, Melvin A., Friedman, Authur D.; “Digital Systems Testing and Testable Design”, IEEE Press New York, 1999 page 3

21
Without a standard fault spectrum to judge test coverage on, there can be no meaningful
test coverage metric at the system level.
Subjective attributes
An example of the subjective attributes of the test process includes issues like the
quality of the data collection. The issue is how we measure the effectiveness of the
feedback loop from the test process to drive quality improvements. Measuring the
effectiveness of this critical element of the system test process has been often ignored.
Improving feedback should reduce process variations and thereby improve first pass
yield, but there are many other factors impacting process variations and the first pass
yield of the test process. Therefore, measuring the quality of feedback based on
improvements to first pass yield can be a questionable metric.
RELATIONSHIP BETWEEN PRIORITIES
If a process change improves a test process priority at the expense of another,
have we improved the overall system? The objective of managing the test process is to
improve all aspects of the impact of the test process, on stakeholder priorities. If this is
not practical then one needs to understand which ones are the most important, and what
must be done if one or more stakeholder requirements conflict.
If requirements conflict then a business case is often developed, to arrive at a
decision. The business case implies an understanding of how costs vary with different
decision parameters. As discussed in the last chapter, without an agreed upon cost model
there is a risk that the business case may be biased or incomplete. While there is general
agreement that cost models are required, as one will see in the review of literature, it is
not clear what the cost model needs to look like and what scope it needs to encompass.

22
The cost model is a useful tool, but focusing exclusively on the cost model can
cause several potential problems. The first is the accuracy of the financial models
applied. Several of the stakeholder’s priorities for the test process are difficult to weigh
in terms of dollars. Examples include the impact a failure has on the customer
experience, the quality of a data collection system, and the flexibility of the test process.
The focus on costs can lead to a focus on short-term situations that are easy to assign a
dollar value to and ignore system level improvement that may be more difficult to cost
justify.
To accurately deal with the relationships between different priorities in the test
process we need to understand how the test process behaves as a system. A system can
be described as, “A network of many variables in causal relationships to one another.
Within a system a variable may even have a causal relationship to itself.”11 Then, the real
question is how you manage the test process as a system. This dissertation will
demonstrate a systematic solution to this problem.
11 Dorner, Dietrich; “The logic of Failure”, Perseus Books Cambridge Massachusetts, 1996. pg 73

23
REVIEW OF LITERUATURE
The first goal of this dissertation is to define a management process to determine
the correct test strategy for a given system. This management process needs to include
effective metrics and processes to understand the relationship between the metrics. The
second goal is to propose dramatic improvements to the system test process. Upon
reflection it is clear that the problems relating to managing the test process are not unique
to the test process, they apply to managing most systems. This review of literature is
divided into two parts, the first focuses on system management techniques in general and
the second on system test literature.

24
Chapter 3: System Management Techniques
If part of the goal of this dissertation is to better manage the test process, and the
test process is a system, then we need to understand how to manage a system. Therefore,
this review begins with a look at how to manage systems in general with an eye towards
how this can apply to managing the manufacturing system test environment. There are
many different theories about managing systems. The author chose to investigate three of
them for the purpose of this dissertation. They are, Total Quality Management, the
Balanced Scorecard approach, and the Theory of Constraints. While many books have
been written about these ideas, what follows is a brief analysis each of these ideas.
TOTAL QUALITY MANAGEMENT
Total Quality Management is one of the movements that started based on Deming
and other quality thinkers. As the name implies, it focuses the management of the
process on improving quality with the idea that by improving quality we will improve the
business. Total Quality Management is defined by J.M Juran as follows:
Total Quality Management (TQM) is the set of management processes that
create delighted customers through empowered employees, leading to
higher revenue and lower costs.12
Total Quality Management is focused on improving the quality of the parts that
are produced. This will lead to higher customer satisfaction, and higher revenue. Total
Quality Management will also improve quality of the parts coming into the factory,
which will result in reduced failures in manufacturing. This will mean that fewer
12 Ross, Joel E. “Total Quality Management Text, Cases, and Reading” Third Edition, St. Lucie Press, Boca Raton, London, New York, Washington D.C.1999 page 1.
25
resources will be spent on systems that need rework. Fewer resources then translate into
a reduced cost structure.
The basis for improving processes in the Total Quality Management Model is
described by the acronym DMAICR. As discussed earlier, this acronym stands for
Define, Measure, Analysis, Improve, Control, and Report. This approach is the basis for
several six-sigma processes existing in companies today. In the define phase, the
problem and scope of the issue are defined. The measure phase is where metrics are
assigned and measured to understand the size of the problem. The measurement phase
may or may not include financial measurements. In the analyze phase, tools are used to
find the root cause of the problem. These tools can include cause and effect diagrams,
the five whys technique, and design of experiment. The improve phase is where the
analysis results are put into action to improve the system. The control phase involves
measurements that verify the level of improvement achieved and putting processes in
place to ensure that the problems do not reappear. These processes can include control
charts and checklists. A report phase is sometimes used to communicate the project and
the tools used, to the rest of the company, so that other people with similar problems can
review what was done.
Total Quality Management has several useful ideas related to manufacturing
system test. It emphasizes the need to continually drive quality improvements into the
process. This means that one of the main goals of the test process is to achieve quality
improvements. The only reservation with the Total Quality Management process is that
some of the tools used in it are better focused on improving process rather than
systematic and strategic issues. The DMIACR process discussed above is a useful
framework for tackling the challenges faced by the test process, but the tools used in the
phases may need to be modified.
26
THE BALANCED SCORECARD
The balanced scorecard approach is outlined in a book written of the same name
written by Robert S. Kaplan and David P. Norton. It is a management philosophy that
outlines several variables that need to be tracked when managing a system. It outlines
four perspectives: the financial perspective, customer perspective, internal business
process perspective, and learning and growth perspective.13 The authors of the balanced
scorecard believe that while important financial measures cannot accurately capture the
importance of the other perspectives. They compare using solely financial metrics to
flying a plan with just one instrument.14 The customer perspective includes customer
experience and customer loyalty. The internal business perspective includes how the
process impacts other internal business processes. The learning and growth perspective
includes feedback processes and employee information.
The next step in the balanced scorecard is linking the variables in each of the four
perspectives through a cause and effect relationship diagram. This relationship creates
the management strategy, and shows how the strategy will improve each of the four key
perspectives. Key process drivers are also identified to ensure that the strategy is on
track. The balanced scorecard has been applied to engineering processes with good
results.15
The balanced scorecard approach to managing the test process has a lot of value
in terms of setting up a balanced strategy and dealing with the significant limitations of
the financial measurements. It correctly points out those financial measurements are
13 Kaplan, Robert S. and Norton, David P. “The Balanced Scorecard”, Harvard Business school Press Boston, Massachusetts copyright date 1996 Page 9 14 Kaplan, Robert S. and Norton, David P. “The Balanced Scorecard”, Harvard Business school Press Boston, Massachusetts copyright date 1996 Page 2 15 Durraui, T.S.; Forbes, S.M.; Carrie, A.S. “Extending the balanced scorecard for technology strategy development” Proceedings of the 2000 IEEE Engineering Management Society, 2000. Page(s):120 - 125
27
incomplete. The problem with the balanced scorecard is that it does not deal with the
problems that arise when the requirements from the different perspectives conflict. How
is the conflict resolved?
THE THEORY OF CONSTRAINTS
Dr. Goldratt who had a PhD in physics, to add some scientific methods to
business management, developed the Theory of Constraints. His basic process was
outlined in his book “The Goal”. While The Goal was focused on manufacturing
throughput issues, the Theory of Constraints also has a “thinking process” that outlines
system level thinking for system management.
The supposition is that most of the problems in an organization are the result of
conflicts within the organization.16 It uses cause and effect reality trees to other tools to
determine if the various undesired effects that a business is trying to resolve are tied to
the same root cause conflict. This is done, by creating conflict clouds that help clarify
why the undesirable effects exist. In addition, a current reality tree that maps the various
undesired effects to the same root cause is also used. It then focuses on outlining the
assumptions that make up the conflict and breaking one of the assumptions in the hope
that this will point to a way to clear up the root cause of multiple undesired effects. It
then follows with a cause and effect diagram called a Future Reality Tree, to the proposed
solution that will address the various problems impacting the process.
The current and future reality trees are useful methods of analyzing ideas in a
cause and effect relationship. The most powerful idea of the theory of constraints is the
way it identifies the core conflict causing the undesirable effects and seeks to eliminate
sources of the conflict from the process. The main concern with the theory of constraints
16 Burton-Houle, Tracy; “Field Guide to the Theory of Constraints Thinking Process”; Avraham Y. Goldratt Institute; 2000;Page 1.26

28
is that it seems to assume a very high level knowledge of the way the system works,
when creating the current and future reality trees. A more interactive model of the
system, to capture the impact of the interactions of different variables on the system, may
be preferred.

29
Chapter 4: System Manufacturing Test Literature
The literature that is available for system manufacturing test is very limited. It
falls into two broad categories, papers describing system test issues, and those describing
managing test tradeoffs. The papers available on managing test tradeoffs tend to focus on
the use of cost models. Therefore, this review of literature will focus first on the papers
that address system test issues and then on the papers about test cost models.
SYSTEM TEST LITERATURE
The first series of papers we will look at are papers about the system
manufacturing test process in general. This has received little attention in the academia
primarily because, without standard metrics it is difficult to compare the different
approaches to manufacturing system test.
System-Level Testing: Characterization and Improvement17
This paper discusses the efforts to model the failure profile at the system level.
This is a key question in understanding what the proper test strategy needs to be. The
method described uses event driven models that are fine, if the failure profile fits those
models. In the author’s experience the failure profile that exists in the manufacturing
system test environment does not fit what is modeled in this paper.
It also provides two definitions of optimum test time. They are based on the event
rate of the failures. Assuming your data tracks with the event rate model presented in this
analysis, it can be critical in determining the quality improvements of each minute of test
time. This paper created an interesting model, but the decisions taken in manufacturing
about optimal time needs to be related to the actual data, not modeled data.
17 Farren, D.; Ambler, A. P. Chan, Wia, “System-Level Testing: Characterization and Improvement”, http://www.ece.utexas.edu/%7Eambler/system.htm ,1996
30
Integrating Manufacturing Test Strategy with Manufacturing Production Strategy18
This paper discusses the need to harmonize the test strategy with the
manufacturing strategy. It points out that the long-range strategic plan of a business
needs to be in sync with the test strategy. The test strategy in a low volume high mix
manufacturing environment may be different from that in a high volume standard product
environment. The paper discussed the need to model operations and the impacts of
various test strategies to find the most cost effective solution. This paper deviates from
the typical paper, in its discussion of complexity and flexibility. It points out the need to
reduce complexity and increase flexibility of the test process. While the paper focused
on chip technologies the issues of complexity and flexibility are relevant at the
manufacturing system test level.
A new Fault Model for System Level Descriptions19
This paper used process algebra to describe a fault model for a system. It defined
a process as, ”A process is a black box offering to the external environment pots on
which events or actions take place.”20 And so a system is defined as a collection of
processes with signals between them. It claims that the four items required to fully
specify the testing procedure are the fault model, observation procedure, test pattern
generation algorithms, and fault simulation algorithms. The fault model is the most
pertinent section of the paper. The fault model is based on assigning faults to one or
more ports, and modeling the interactions. The paper points out that the complexity of
18 Mahoney, R.M. “Integrating manufacturing test strategy with manufacturing production strategy”, AUTOTESTCON '97. 1997 IEEE Autotestcon Proceedings Page(s): 394 -397 19 Camurati, P.; Corno, F.; Meo, M.; Prinetto, P. “A new functional fault model for system-level descriptions”, Proceedings of VLSI Test Symposium, 1994., 12th IEEE Page(s): 214 -219 20 Camurati, P.; Corno, F.; Meo, M.; Prinetto, P. “A new functional fault model for system-level descriptions”, Proceedings of VLSI Test Symposium, 1994., 12th IEEE Page(s): 215

31
the fault model varies with the number of faulty channels and the nature of the faults,
which include transient faults, intermittent faults, and permanent faults.
While the ideas expressed in this paper are useful, they are also rather difficult to
implement. There are significant problems in modeling fault interactions in a complex
system. A fault on the interface may have a wide variety of potential impacts and
interactions. Modeling this could be a difficult task. In the environment used for this
dissertation, a simpler fault model based on actual data seems preferable.
Engineering-to-Manufacturing-to-Field Test Strategies Status Report 199221
While this paper was written for defense electronics, it was interesting for its
attempt to address the full lifecycle of the test process. It raises some important issues
around standardization of testing and viewing the entire lifecycle of the product from a
testing standpoint. It attempts to create a common test strategy with common test
hardware and software. It is hoped that this would dramatically reduce the costs
associated with maintaining these test processes. This approach is beneficial, however,
the paper would have been stronger with more information on how the different
assumptions and requirements at each stage of a product’s test life impact the overall test
strategy. For example, we may assume that the product we are testing is good in
manufacturing, but faulty in field service. This difference in requirements by different
users of the test process may require different strategies. If we can link the same test
strategies, money can be saved. This is an idea that will be used later in the dissertation.
21 Williams, R.L. “Engineering-to-manufacturing-to-field test strategies status report 1992”AUTOTESTCON '92. IEEE Systems Readiness Technology Conference, Conference Record Page(s): 313 -318

32
TEST RELATED COST MODEL LITERATURE
Cost Effective System Level Test Strategies22
This paper does a good job of describing the issues around choosing the most cost
effective system level test strategy. It includes a discussion of quality and how
expectations vary with the use of the device. The paper focuses on cost as the driver for
test strategy templates, to help identify “goals, inhibitors, and strategies” for different
testing scenarios. It uses cost models to justify different testing strategies. The
templates described are useful communication devices, but a lot of the information in the
templates is driven by high-level assumptions that may be very questionable. For
example, the paper used a Quality Weighting Factor (QWF) 23 to act as a multiplier to
assign a cost to the customer dissatisfaction with a field defect. This is a reasonable
approach to the problem, but the numbers seem to lack rigorous support and may be
significantly inaccurate.
While this paper is generally well written, there is one problem with the paper.
The paper ignores some difficult to quantify requirements of the test process. One
example is the role the test process plays in driving improvements earlier in the process.
It also could use more discussion on the accuracies of the financial assumptions.
System Test Cost Modeling Based Event Rate Analysis24
This paper starts with a description of the mission of the test process. The quote
states, “The manufacturing test strategy objective is to minimise at an acceptable cost, the
number of defects in the customer environment by maximising DVT and product test
22 Farren and A. Ambler, “Cost Effective System Level Test Strategies.”, IEEE Proceedings of the International Test Conference, 1995. Page 807-813 23 Farren and A. Ambler, “Cost Effective System Level Test Strategies.”, IEEE Proceedings of the International Test Conference, 1995. page 810 24 Farren, D.; Ambler, A. P. “System test cost modeling based on event rate analysis” Economics of Design, Test, and Manufacturing, Proceedings 1994.

33
effectiveness”25. DVT stands for Design Verification Testing. This definition would be
stronger if it expressed the role of the test process in providing feedback to other
processes to ensure that the defects are not caused. The most effective way to minimize
the cost of a defect is not to cause one.
After a discussion of the differences between explicit and implicit diagnostics,
which is useful, the paper turns its attention to an “Event Rate Model” that it uses to
model the faults at the system level. The event rate model is very good at modeling
reliability, and finding the right test time to reach a steady level of testing. This can be
very useful when evaluating a “burn in” testing strategy. This way of measuring fault
risk is limiting for the other risks to the systems.
The paper then discusses the cost model. It lays out the case for the model and
discusses the cost drivers very effectively. It assumes the ability of the model to
accurately assign dollar values to the entire test process. This puts too much faith in
financial models.
A New Test/Diagnostic/Rework Model for use in Technical Cost Modeling of Electronic Systems Assembly26
This paper presents a good cost model, of a limited scope. It expresses a good
understanding of where the costs are, in a rework environment. This paper takes the test
yields and adds in the cost of repairing the failures, into the model, and takes into account
scrap and newly induced damage during the repair process. The fact that it adds
variability to the data and does not just deal with averages is a major advantage.
25 Farren, D. Ambler, A. P. ; “System test cost modeling based on event rate analysis” Economics of Design, Test, and Manufacturing, Proceedings 1994. 26 Thiagarajan Trichy, Peter Andborn, Ravi Raghavan, and Shubhada Sahasrabudhe. “A New Test/Diagnosis/Rework Model for Use in Technical Cost Modeling of Electronic Systems Assembly.” IEEE Proceedings of the International Test Conference, 2001. Page 1108-1113.

34
To use the model presented, you need to know the cost of testing, cost of rework,
yield, and several other factors. My main issue with the model is that it does not take
capacity into account directly. One would have to use it to calculate the cost of testing.
It also does not link the costs to each other. For example, the cost of testing good
components may go up if the yield goes down, as the failures due to the lower yield may
cause capacity problems, which increase the costs of testing all parts.
Process-Based Cost Modeling27
This paper has several useful points. First, it breaks out the model into two
sections, process and cost. This is useful because the process flow is an important driver
to the costs. It then applies a cost to each process step. It lays out the process as a Finite
State Automata (FSA) with input and output clearly defined. While the model presented
seems reasonable, one may question whether the interactions between the various states
are as independent as they seem in the paper.
Tackling Test Trade-offs from Design, Manufacturing to Marketing using economic Modeling28
This paper presented an economic model for chip level testing. The model uses a
modular approach that has different levels. The levels include the state of technology,
circuit packaging, manufacturing and test step, wafer manufacturing and test step, and
marketing. The paper also provides a useful case study and advice on how to set up a
cost model. The more modular any program or model is, the better it is for use and
support. There were some statements that would be questionable about any economic
model like, “Moreover, it insures that no hidden trade-offs are made.” This assumes that
27 Bloch, C.; Ranganathan, R. “Process-based cost modeling” IEEE Transactions on Components, Hybrids, and Manufacturing Technology, Volume 15, Issue 3, June 1992 Page(s): 288 -294 28 Volkerink, Eric H., Khoche Ajay, Kamas, Linda A., Rivoir, Jochen, Kerkhoff, Hans G. “Tackling Test Tradeoffs from Design, Manufacturing to Market Using Economic Modeling”. IEEE Proceedings of the International Test Conference, 2001. Page 1098-1107.

35
the model is a complete representation of all the system interactions, and that there are no
hidden errors in the model.
SUMMARY OF CURRENT STATE OF THE RESEARCH
The System Manufacturing test process has not been adequately addressed by
academic research. Apart from the exceptional work of Dr. Ambler and Dr. Farren, most
of the available research does not address the lack of effective metrics. Without effective
metrics the relationship between them is of limited value. What they do address is the
relationship between metrics using cost models. Forcing all of the parameters of the test
process into a cost model creates numerous assumptions like the Quality Weighting
Factor, which are difficult to define accurately.
Engineers seem to believe that the accounting department can accurately
determine the cost of the test process. In the author’s experience such confidence in the
accounting department is very naïve. If engineers have difficulty understanding the
system interactions, how can accounting? If accounting does not understand the system
interactions how can they accurately apply dollars to it? What dollar value do you assign
to a more flexible process? What is the dollar value assigned to a better data collection
process? We need to use cost models, but also go beyond them in our analysis of the test
process. We do so by using the system management tools including Total Quality
Management, the Balanced Scorecard, and the Theory of Constraints.

36
METHODOLOGY
Each of the three approaches to system management, Total Quality Management,
Balanced Scorecard, and the Theory of Constraints includes useful ideas. The
methodology chosen for the rest of the dissertation will be a mix of these approaches.
The overall approach for the rest of this dissertation is based on the Define, Measure,
Analyze, Improve, and Control steps of Total Quality Management methodology. The
define phase will utilize stakeholder requirements to determine what the test process
needs to accomplish. This will be done by analyzing the stakeholder requirements and
applying measurements to it. Then, we will use a Balanced Scorecard approach to apply
the stakeholder requirements of the test process. The balanced scorecard is chosen
because of the inability of accounting to accurately apply dollars to the impact of some
stakeholder requirements. The measurement phase solves the problem of how to measure
some of the more difficult to quantify metrics in the balanced scorecard and their
interactions with one another. For example, a new and useful method of measuring test
coverage at the system level is determined. The ability to measure the requirements of
the balanced scorecard requires knowledge of what impacts these requirements. Cost,
quality, and capacity models are used to measure the relationship between them. These
models allow for what if scenarios and point to areas for improvement. The analysis
phase looks more systematically at the interactions of the variables. The analysis turns
to the Theory of Constraints to determine the core conflicts inherent in the test process.
Strategies will then be defined to eliminate the core conflicts using the tools of the
Theory of Constraints. These strategies will be discussed in the improve phase and will
rely heavily on modeling the impact of the test process in the measure phase. Actual and
projected results will be presented, and the control phase will be discussed.

37
DEFINE PHASE
Chapter 5: Stakeholders Requirements
When approaching the issue of how we should ensure that we have a quality test
process, the first difficulty is in defining quality. There are many possible definitions of
quality. The definition used here is, “Quality is defined by the users of a process.”29 The
stakeholders of a process are the users. They define the requirements and thus assess the
quality level of a process. Figure 5 shows a stakeholders’ map for the test process.
Figure 5: Stakeholder Map
29 Ross, Joel E.; “Total Quality Management Text, Cases, and Reading”. Third Edition, St. Lucie Press, Boca Raton, London, New York, Washington D.C.1999 page 108
Manufacturing
Failure Analysis
Engineering
Quality
Field Service
New product development
Suppliers
Test Development
Final customer
Test Strategy

38
To manage any process one needs to understand the requirements of the
stakeholders in the process. This helps ensure that the solution derived will satisfy all the
stakeholders’ requirements, and prevent unintended consequences. Each of the
stakeholders has requirements of the test process that need to be identified. Some of
these requirements will overlap and others may appear to conflict. How well the test
process meets these requirements is a measure of the quality of the test process.
After defining the requirements of a process, the next problem is how to measure
the quality level of the test process? In keeping with the old saying, “if you cannot
measure it you cannot manage it”, we need to be able to apply metrics to the stakeholder
requirements of the test process. For each stakeholder requirement we will discuss
potential measurements for to see how well the test process is complying with the
requirements.
FINAL CUSTOMER
The analysis of stakeholders begins with the final customer or end user of the
system. This is a very important stakeholder, but is in some ways the least concerned
with the test process. As long as the end users have a positive experience with their
system, they generally do not care how the system was tested. If they have a problem
they want it identified and resolved quickly.
Requirements
The typical customer is interested in getting a highly reliable system, with a set of
required product features, delivered on time, with quick resolution of any problems, and
at a reasonable price. If these five requirements are met, then the customers are satisfied
with the experience.

39
Metrics
The key metric from a final customer point of view is customer satisfaction,
which can be assed via surveys. The five elements need to be understood and measured
individually and related to the test process.
Highly Reliable System
To measure the quality level of the system, the customer received, we can
measure how often the customers have issues with the system. The field incident rate can
be measured accurately by looking at the rate of calls from the customer and the rate of
part dispatched. The source of this rate will be from test escapes, and part of the field
incident rate will be from ongoing reliability issues. Identifying the contribution level
and causes of the different field incidents is critical to improving the test process to better
ensure the quality level of the system.
Delivered on Time
The measure of whether the customer gets the system on time is the ship to
commit metric that measures if the system ships to the customer from the factory, on
time. The test process metrics can affect the ship to commit metric by impacting
capacity, or causing test related issues that impact when an order can ship.
Required Product feature set
From a test process point of view the issue is related to ensuring that the features
that the customer wants are available when the customer wants it. In other words, we
need to ensure that the test process does not hold up a new feature release. These can be
tracked as the rate and severity of individual issues during product transitions and the
time it takes to develop tests on new products.

40
Reasonable Cost
The cost that the test process adds to the overall process must not be out of line
with the market. Many of the requirements from other stakeholders will also include the
requirement to minimize the costs of testing as much as possible. The test process costs
must be measured to ensure that the added costs are minimized.
Quick Problem Resolution
When the customer has a problem with a system, getting a quick and accurate fix
is critical to reducing the level of dissatisfaction with the original problem. Tracking the
number of customer calls related to resolving an issue can provide tracking on quick
problem resolution. This can relate to the test process in terms of the quality level of the
diagnostic used in the field and the troubleshooting techniques used by the technical
support group.
TEST DEVELOPMENT
Test development groups are responsible for developing the actual tests, and
scripting the tests into the manufacturing process, and for field service. The test
development group will be involved in supporting the test process, if issues are found. In
order to reduce costs, the test development organization needs to be kept at the correct
size to adequately perform the tasks.
Requirements
A test process with flexibility and standardization should help minimize the work
of the test developer. The test developer cannot delay a new product release, so the
developer would like to understand the test requirements on new products as early in the
product development cycle as possible. This early documentation reduces the risk that
the test development will cause a bottleneck in the product development cycle and delay

41
shipping new technology to the customer. The test developers would also like a process
that is easy to maintain. This reduces the number of resources required to fix problems
that develop.
Metrics
Flexibility and Standardization
The flexibility and standardization of the test process can be measured by the
amount of resources required to update the process for new products. The resources
include people, time, and equipment. As these resources are easily measured in terms of
dollars, the cost metric seems appropriate.
Not delay New Products
A related issue is how often test development causes delays in new product
releases. This can prove to be very expensive in terms of lost sales and should never
occur. If it does, then the test development cycle needs to be examined and the issue
resolved. How close test development comes to causing a delay can be measured, and
tracked.
Easy to Maintain
Ease of maintenance can be measured by the amount of resources required to
maintain the process, the number of issues that a lack of maintenance caused in
manufacturing, and the time taken to resolve the issues. The second issue is directly
related to the requirement of not creating issues in manufacturing. The easier the process
is to maintain, the less likely there will be issues in manufacturing.
MANUFACTURING
The manufacturing facilities have the responsibility to build and ship the
customers’ systems while keeping costs at a minimum. These systems may be built on

42
different lines with different line designs. Manufacturing facilities can be located in
different regions of the world. Manufacturing is focused on continually improving the
process in terms of quality, capacity, and costs. The test sustaining department works on
the problems related to the test process.
Requirements
The manufacturing facilities want a test process that minimizes the impact or cost
of the test process on manufacturing. Capacity is the most important potential impact
from the test process. If the test process starts negatively impacting capacity, then the
manufacturing facility has to start increasing overtime to accommodate the drop in
capacity. Extra test equipment or operator interactions can also significantly increase the
cost of testing in manufacturing.
The other key concerns center on issues caused by the test process. These test
issues can include causing good systems to fail, causing engineering holds, or causing
significant delays in the manufacturing process. The requirement is for a test process that
is robust enough to not cause issues in manufacturing. Issues, generally occur, when
something changes, so managing change in manufacturing is critical to reducing the
probability of a manufacturing issue. If an issue does occur, engineers in manufacturing
would like to have the ability to make the changes themselves to keep the factory
running. Shutting down manufacturing, while a test issue is being worked out, is very
expensive.
Manufacturing also needs the data generated from the test process to drive
continuous improvement in the manufacturing processes. If manufacturing is inducing
failures in the systems that lowers their first pass yield or increases the failure rate in the
field, then manufacturing needs to know about it, measure the occurrence rate, and
resolve the problem.
43
Metrics
Minimizes impact on capacity
To measure the impact on capacity we need to understand the likelihood of the
test process interrupting the required manufacturing velocity. The test process needs to
be flexible enough to run on different line layouts that may be implemented to improve
throughput. The capacity impact requires a capacity model that will reflect the impact of
the test process, to be set up for each factory. This model needs to show the minimum
buffer that enables smooth manufacturing operations. If this minimum buffer is violated,
dollar costs in terms of overtime can be allocated to the test process.
Minimizes issues in manufacturing
These issues can be measured in terms of frequency, time to resolution, and
impact to the manufacturing process. In factories that build tens of thousands of systems
a day, giving the factories a quick way to modify the test process is important to reduce
the downtime in manufacturing. If we can measure these three variables then we can
assign a dollar cost to the issues in manufacturing.
Improve Manufacturing Processes
Manufacturing has targets, to continue to improve its processes. This applies both
to the test process and the manufacturing process. The data from the test process must
timely and accurately point to opportunities for process improvements. This can be
measured by comparing the actual data provided with the requested data from
manufacturing.
Quick Troubleshooting
Any failure in manufacturing needs to be repaired quickly. Long repair times can
cause delays in shipping orders, capacity problems, and an increase in repair labor

44
required. Each of these can significantly increase the cost of testing in manufacturing.
The time required to repair a failure needs to be tracked.
QUALITY DEPARTMENT
The quality department is concerned with eliminating process anomalies that will
negatively impact the customer experience or the manufacturing process. The quality
department may be divided between field, manufacturing, and supplier quality groups.
Their metrics are tied to improving first pass yield in manufacturing, and the customer
experience. Doing so involves working with the failure analysis group to understand the
root cause of the failure, and drive corrective action.
Requirements
Minimizing test escapes and failures unrelated to the customer experience are key
measures. Failures unrelated to the customer experience can include failures that cannot
be duplicated, or failures related to the test process or equipment. The quality department
wants the test process to help identify issues including design problems, supplier
problems, and manufacturing process issues. It also wants the test process to help isolate
field issues. Typically, the quality department will want as high a level of test coverage
as possible.
Metrics
Catches bad systems
This can be expressed in terms of the probability of bad systems passing the test
process. These are captured in a metric called test escapes. These can be thought of as a
Type 2 error that is also called consumer’s risk.30 The issue then is how you measure test
30 Montgomery, Douglas C.; “Introduction to Statistical Quality Control” Third edition; John Wiley & Sons Inc. New York;1997 Page 97

45
escapes. There needs to be a method of separating failures induced after the test process
runs from test escapes in the manufacturing process.
Does not fail for good systems
The failures may be the result of poorly written test software or test infrastructure
problems causing failures on good systems. These are called Type 1 errors or producer’s
risks31. The metric for this requirement is the difference between the line failure rate, and
rate of verified failures. It includes false failures that cannot be duplicated, and failures
caused by defective test equipment or test processes.
Provides feedback necessary to drive process improvements
The data collected from the test process provides key feedback for driving process
improvements. But how do you measure the effectiveness of this feedback? We can
look at changes to the first pass yield rate as a primary indication of how much the
underling quality of the process has improved. The effectiveness of this metric can be
questioned when a different group is using the data to drive the improvements. The
change to first pass yield data will be influenced by other variables besides the data
collected from the test process.
Another potential method is using survey forms with the stakeholders who use the
data. This may be a more direct method, to measure stakeholder satisfaction with the test
process data collection capabilities.
NEW PRODUCT DEVELOPMENT
The new product development department is concerned with coordinating the
release of new products. They want a test process that does not interfere with the time to
market new products, meets customer requirements, and provides adequate test coverage. 31 Montgomery, Douglas C.; “Introduction to Statistical Quality Control” Third edition; John Wiley & Sons Inc. New York;1997 Page 97
46
Requirements
The new product development team wants a test process that is flexible and easily
ported to new products. The test process needs to document its requirements early in the
development cycle. The new product development team also wants to be assured that test
issues will not appear late in the development cycle. This implies that early in the
development cycle, the test requirements must be documented and agreed to by the
various stakeholders in the test process.
Metrics
Requirements defined early in development cycle
Test requirements need to be documented early in the development cycle. The
new product development department can verify whether the design for test requirements
are given to the development engineering team early, and whether the test requirement
documents get approved early in the process.
Test Issue late in the Development Process
Any issues discovered late in the development of a new product can jeopardize
the timely release of the product. Fortunately, these issues can be easily measured and
their impact known.
DEVELOPMENT ENGINEERING
Engineering requirements (Design for Test features) for the test process need to
be communicated to the engineering team, at the beginning of the product development
cycle. These requirements may need to be cost justified. Engineering, will want to
ensure that any design they implement for test features, is cost effective. Therefore, the
cost savings of these requirements need to be tracked.

47
Requirements
It is cheaper to make design changes earlier in the development cycle than later.
Changes late in the development cycle can drive rework and retesting. Therefore, the test
strategist must be aware of new features and any new testing that may be required. This
generally means the early creation of a design for the test document that can outline any
design changes needed to adequately test a part at the system level.
Metrics
Cost and Benefit of DFT
If the owners of the test process are going to ask for design changes to improve
the ability to test different functions, then understanding the cost savings generated by the
changes can be crucial in getting the changes approved.
SUPPLIERS
Suppliers want a test process that is easy to correlate with their testing process.
They also want detailed failure information to quickly isolate problems. Suppliers may
also be called upon to deliver diagnostics for their parts, which means that they will need
a standard interface with the diagnostic development groups.
Requirements
If the suppliers are providing a diagnostic for the parts they are supplying, then
they need a clear specification that outlines how the diagnostic will work in the test
environment. The suppliers will be called upon to improve their quality as measured by
the failure rate in the system manufacturing environment and in the field. To
successfully reduce the failure rate in manufacturing the supplier needs to understand and
be able to repeat our test process.
48
Metrics
Supplier Diagnostics Effectiveness
The test coverage of the suppliers diagnostics need to be measured. This can be
done by evaluating the real failures caught, the false failures caught, and the number of
test escapes found in the field.
Test Result Correlation
As the supplier testing and the testing in system manufacturing are done in
different environments, being able to quickly correlate test results is necessary to
determine if a failure is real. If the failure is real, it must be determined whether it was an
infant mortality failure, process induced damage failure, or the result of a test escape at
the vendor. The metric to track this is a ratio of the correlated failures (duplicated
failures) to the total failures.
FAILURE ANALYSIS
The failure analysis process needs to work hand in hand with the test process. To
get accurate and quick results from failure analysis, the failure analysis technician needs
to understand the failure environment, and obtain as much detail about the failure, as
possible. For test failures, this information needs to be captured by the test process.
Failure analysis is critical in establishing a proper feedback process for the test process.
Requirements
The failure analysis process requires information on the test environment, the
failure, and the ability to quickly duplicate the previous phase testing process. This
information includes facts, such as what test failed, what exact error the test saw that
caused the failure, the complete manufacturing environment, the revisions of diagnostics,
and the time it took to fail.

49
Metrics
Getting the Required Information
Measuring whether or not the failure analysis group is getting the information it
needs from the test process, is not an easy task. The simplest means seems to be to ask
the group members, if they need more information.
Issue Identification and Resolution
The effectiveness of the failure analysis process depends on the ability to drive
issue identification and resolution. These issues will include factory and field failures. If
the failure analysis process is effective then it will help improve first pass yield by
identifying among other things test escapes in the supplier’s test process and
manufacturing process issues. This will enable us to better understand the risks
associated with the system under test.
Understanding the causes of field failures is of significance in understanding the
ability of the test process to prevent the failures. The effectiveness of getting the
understanding of field failures from a factory test perspective can be measured by how
many issues are addressed.
FIELD SERVICE
Field service personnel correct customer problems in the field. Their
responsibility is to quickly fix the customer’s system and mitigate the negative impact of
the issue on the customer.
Requirements
Field service engineers need diagnostics that will quickly and accurately point to
the defect. They need the diagnostic to provide feedback data to the quality teams. This
feedback data is used to drive process improvement.

50
Metrics
First Time Fix
The key metric for field service is the ability to fix a failure the first time a
customer contacts them with the problem. This can be tracked and a rate assigned to it.
A dollar value can be assigned to the repeat dispatches to fix the same problem, but the
impact on the customer experience can be harder to measure.
Time to Resolution
To minimize the cost of field service, the time required to diagnose the problem
with the system, must be kept to a minimum. The time to resolution includes the time for
running diagnostics, determining the failed component, repairing the system, and
verifying whether the repaired system is fully operational.
Data on Failures
The field service technician must be able to easily understand all the failure
information available, to help the quality group analyze the cause of the failure. The
easiest measure for this metric is by surveying the interested parties to determine if the
correct information is being captured in a form that is usable.
TEST REQUIREMENTS SUMMARY
These requirements are summarize in Table 1. Note that some items on this list
refer to the same requirement while other items may at times be in conflict. For example,
a test to protect the customer from a minor field issue may cause severe problems in
manufacturing capacity, or a design change may make the system easier to test at the
expense of increasing the cost of the product slightly. To manage these concerns, metrics
are required to measure and prioritize, based on the impact on the overall system.
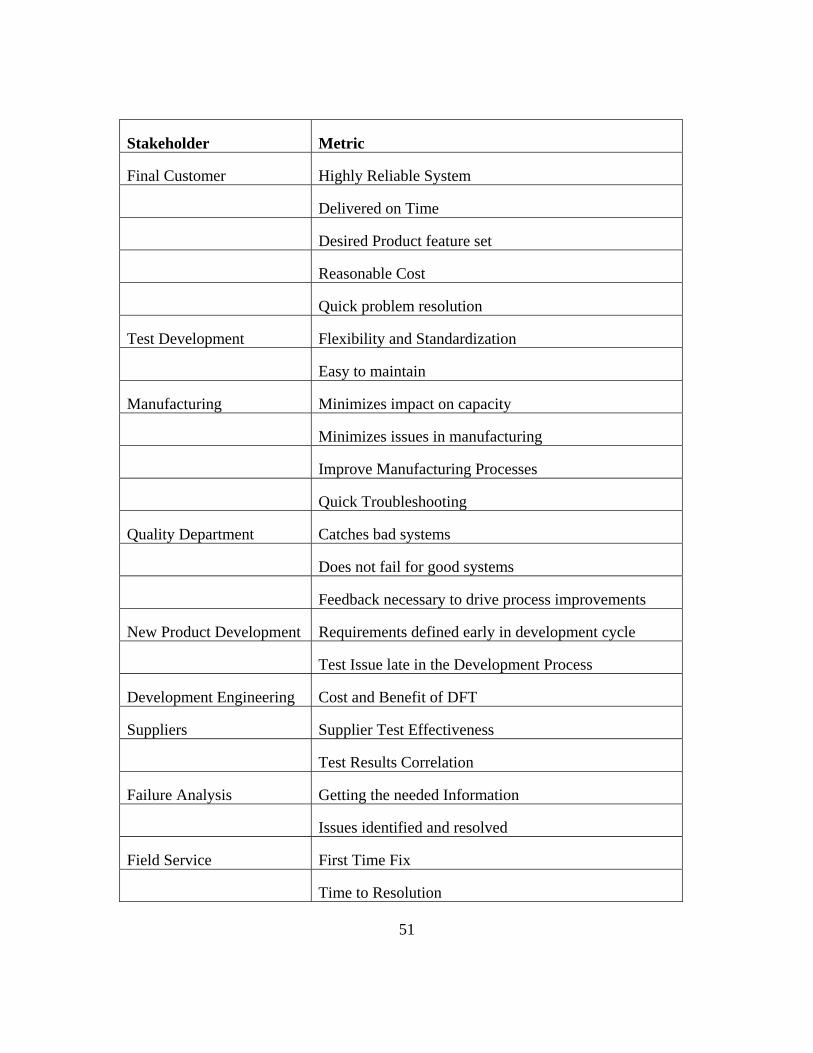
51
Stakeholder Metric
Final Customer Highly Reliable System
Delivered on Time
Desired Product feature set
Reasonable Cost
Quick problem resolution
Test Development Flexibility and Standardization
Easy to maintain
Manufacturing Minimizes impact on capacity
Minimizes issues in manufacturing
Improve Manufacturing Processes
Quick Troubleshooting
Quality Department Catches bad systems
Does not fail for good systems
Feedback necessary to drive process improvements
New Product Development Requirements defined early in development cycle
Test Issue late in the Development Process
Development Engineering Cost and Benefit of DFT
Suppliers Supplier Test Effectiveness
Test Results Correlation
Failure Analysis Getting the needed Information
Issues identified and resolved
Field Service First Time Fix
Time to Resolution

52
Data on Failures
Table 1: Test Requirements

53
Chapter 6: Balanced Scorecard and Test
We will now turn our attention to the balanced scorecard as used in the
management of the test process. This approach takes the stakeholder requirements and
groups them in one of the four categories. This is shown in Table 2. The balanced
scorecard is designed to give visibility to the different priorities of the various
stakeholders. The balanced scorecard helps ensure that the test process decisions are
made looking at the entire business environment, not just some questionable financial
metrics. The metrics on the balanced scorecard are the most important stakeholder
requirements. Note that many of the metrics will feed the impact on other metrics. The
relationship between metrics will be discussed in more detail later.
Test Balanced Scorecard
Financial Metrics
Cost of manufacturing test
Cost of test development
Cost of test escapes in the field
Cost and benefit of Design for Test
Internal Process Metrics
Flexibility
New product development cycle.
Capacity
Accuracy
Test Coverage
False Failure Rate
Bad Part identification
Test Correlation
Reliability
Test Issues
New Product Issues

54
Customer Metrics
Customer Satisfaction
Field Failure Rate
First Time Fix
Time to resolve
Purchase and repurchase decisions
Learning activities
Data Collection
Factory Failure
Field failure
Failure analysis
Issues identified and resolved
Table 2: Balanced Scorecard
FINANCIAL PERSPECTIVE
Other perspectives feed the financial perspective. If you have poor internal
processes or bad customer experiences these will affect the financial metrics. Financial
analysis of the test process is a complicated operation, and it has limitations. Improving
the data collection capabilities of a process can be difficult to accurately assess from a
financial perspective. This is why we use the balanced scorecard instead of only a cost
model. The reason for including the financial perspective in the balanced score card is to
tie the system interactions to the dollar impact on the company. The financial perspective
of the balanced scorecard described above is driven by the costs of testing and the cost of
test escapes. The cost of testing in manufacturing includes a variety of stakeholder
priorities including:
1) Cost of test development for manufacturing.
2) The cost of test time in manufacturing.
3) The cost of test issues in manufacturing.
4) The cost of repair failures in manufacturing.
5) The cost of Design for Test changes in manufacturing.

55
The cost of test escapes involves the hard costs of test escapes. Hard costs refer
to costs that can accurately have dollars assigned to them. This cost is driven by the rate
of test escapes and the cost of fixing the fault in the field. The cost of the customer
experience is not included because of the difficulty in assigning an accurate dollar value
to the negative impact of the test escape on the customer experience. The customer
experience issue will be tracked in the customer perspective of the balanced scorecard.
CUSTOMER PERSPECTIVE
The customer perspective is largely discussed in the customer section of the
chapter on stakeholder requirements. Customer satisfaction with the experience can be
measured through surveys and by noting purchase and repurchase decisions. Indicators
that need to be tracked for the test process include the right features, the right price,
timely delivery, reliability, and quick fixing, if there is an issue. The internal process and
financial perspectives drive these indicators. The bottom line metrics on the customer
perspective is the level of customer satisfaction, which drives the customer’s repeat order
rate. From a test process perspective we want to ensure that we ship the customer a
quality product. If there is a failure we want to fix it quickly and correctly in the first
attempt. The test process needs to be measured on how well we achieve these goals.
INTERNAL PROCESS PERSPECTIVES
The internal process perspective can be categorized into three components,
flexibility, accuracy, and reliability. While we can apply dollar value impact to the
components with varying degrees of difficulty, these issues can be critical to having a
successful test strategy.
56
Flexibility
By process flexibility we mean the ability to run the test process across various
manufacturing lines and products. Flexibility should help ensure that the cost of test
development is kept at a minimum and that new products get to the market on time. One
area, where flexibility is especially important, is the test time. If you do not have a
capacity constraint then reducing test time in manufacturing will not directly reduce the
cost of producing the system. It will, however, give the test process greater flexibility
that can be utilized on new lines designed in the future. The importance of flexibility
depends on the level of change that the process is going through.
Accuracy
The accuracy of the test process relates to its ability to catch bad systems and not
fail good systems. In statistics these are often considered as Type 1 or Type 2 failures of
a process. It also includes how well targeted the test process is at the risks that are
present. Inaccurate testing can result in test correlation issues with earlier test phases.
This is usually signaled by a high rate of failures that cannot be duplicated. Test
correlation issues can exist between the field and the factory, and between the factory and
the supplier.
Reliability
The reliability of the test process includes issues around test issue generation and
the reliability of the test infrastructure. This reliability is centered on how likely the test
process is to generate issues. These issues can be caused by any test parameter that does
not perform consistently. An example is a test that does not fail gracefully on some
failures. The test just locks up the system on a specific error and may not reliably give

57
data on what is causing the failure. These issues can generate engineering holds and
inconsistent results.
LEARNING AND GROWTH PERSPECTIVE
In the learning and growth perspective we need to outline how the test process
learns. While the balanced scorecard process defined by Kaplan and Norton focuses on
human growth and learning, the balanced scorecard represented here, in the learning and
growth section, is concerned with the learning required to improve the test process. This
is achieved through data collection and feedback processes. The primary feedback
process is through failure analysis of factory and field failures. All tests must have a
process for identifying failures and driving corrective action.
The balanced score card gives us a solid picture of what we want the test process
to accomplish. While some of the metrics are easy to measure, others are more difficult.
In the next section we will discuss how we can measure these items and understand their
impact on the overall system.

58
MEASURE PHASE
By referring to the balanced scorecard we need to judge the system at how well
these criteria in the balanced scorecard are met. Some of the variables can easily be
measured while others incorporate some significant complexities. Referring to the
balanced scorecard we have metrics for some of the content. In the financial section of
the scorecard we have some limited metrics on cost. The cost of test escapes cannot be
calculated without understanding the level of test escapes. With the exception of test
coverage and capacity, the metrics on the internal process are reasonably straightforward.
The customer impact metrics chosen are straightforward, as are the surveys used for the
learning process related to data collection and failure analysis.
The focus in the measurement phase turns to the metrics that relate to quality,
cost, and capacity. These metrics are difficult to define and track because they are
impacted by a wide variety of factors including each other. For example, the incoming
quality and test coverage combine to determine the failure rate. The failure rate impacts
capacity and cost. One needs to understand this interaction if one is to optimize the test
process.
The measurement section of this dissertation will start with the measurement of
incoming quality in the form of a risk model, and the measurement of test coverage based
on that risk model. The next phase of this will be measured by the impact on capacity by
the test resources required by the test coverage of the test process. These will be rolled
up into a cost model along with the cost of field service. This is shown in Figure 6.

59
Test Process
Test Coverage
Risk Model
Test Resources
Cost model Capacity Model
Factory Information
Quality Model
Figure 6: Model Relationship

60
Chapter 7: Quality Model
MODEL OVERVIEW
The Quality model is used to help one understand the relationship between the
inherent quality of the product and the test process. It contains two sections, the risk
model and the test coverage model. The first is designed to answer the question, what do
we need to test for at the system level? The second states how well we test for the risk.
By documenting what risks one is testing for, the amount of risks covered by the test
process can be determined. This model also enables one to understand exactly which test
covers what risks. If some tests create greater capacity problems than others, the risks
that necessitate the test can be targeted for quality improvement. This gives us a valuable
tool in focusing quality improvement efforts.
The risk model is relatively simple in principle. It will take the identified risks for
each failure mode of a component and put them in a matrix with the sources of risk, and
take rates of the components that have the risk. It enables one to estimate the risk of a
failure mode and the potential impact of the failure. One feature of this model is that it is
primarily based on actual data. This solves the problem of how you count the risks at the
system level. You count them by measuring the failure rate in the factory and in the field.
That is the steady state risk for that failure mode of a component. The failures in the
factory are a measure of how well the tests are covering these risks, while field failures
indicate potential test escapes.
Model Inputs
The inputs to the Quality model are the components and their take rates, the
number of functions associated with each component, the level of risk associated with

61
each function, and the source of the risk. The sources of risks are divided into supplier,
process, and interaction risks associated with each component function. Risks on
components with a history in production are determined with the help of measurements
from actual data collected in the factory and in the field. The real failure rate in the
factory is a measure of the test coverage of the factory process. Risk and test coverage
can also be estimated using tools like Failure Mode Effect Analysis, statistical process
control techniques, and by using engineering judgment of the technology in question.
Model Calculations
The model calculates the risks for each function of each component in the system,
as they should exist in the absence of a manufacturing test process. These risks are ties to
both systems and components. Using take rate information on systems and components
one can get an estimate of what the field incidents rate would be in the absence of testing
in manufacturing. By looking at how well the test process keeps these risks from getting
to the field, we can get a metric for test coverage that is relevant at the system
manufacturing level.
Model Outputs
The model outputs the test coverage of the system and the projected factory and
field failure rates. The field failure rate will also include the severity of the failure.
RISK MODEL
Defining Risk
The first issue in creating a risk model is how we define risk in this environment.
The risk that we are trying to define is that some part of the system shipped to the
customer may fail. So how do we define the failure spectrum of interest? The author
recommends using a combination of functional and structural faults. The types of faults

62
are determined by the nature of the commodity. One may chose functional faults for a
CD-Rom drive and structural faults for memory testing. As the risks are tied to the
components and interfaces we can chose the type of risk that best fits the device. Most of
the risks will be defined functionally. Functional failure modeling requires outlining the
functional subsystems for each component in the system. This high-level functional fault
model has several advantages over the lower-level structural fault models (i.e. stuck at
models). The advantages of focusing on functional fault are discussed in Chapter 1. The
main advantages in using the functional faults in the model are that it has proven simpler
to implement in this environment, and is consistent with what the customer reports.
Sources of Risk
The next issue in defining the risks is identifying the sources of the risks. It is
important to identify the sources of the risks you are targeting, as this helps to direct the
quality improvement efforts. Figure 7 lists some of the common types of process
variations that can pose a risk to the customer experience. In general, for a bad system to
leave the factory either a bad part came into the factory, the factory process induced a
defect, or there was a problem with the design of the system leading to interaction issues.
These variations, and any other that can be identified, need to be studied for each
functional subsystem.

63
Figure 7: Sources of Risk
Manufacturing process issues can put the customer experience at risk. People,
equipment, and the overall quality of the manufacturing process can cause these process
variations. The builder of the system can make a mistake in building the system, or
damage the product by handling it incorrectly. If the test equipment is broken or poorly
maintained it could cause false failures. The manufacturing process includes installing
software and other items in the system. The need to verify the manufacturing process
with the test process depends on the risks associated with the manufacturing process.
This leads us to the bad component branch of Figure 7. Here, variations can come
from the quality of the parts coming in or the susceptibility of the parts to damage
between the time they were tested at the supplier and the time they were installed in the
Causes ofFactoryFailures
BadComponent
SystemInteraction
Process
Vendor Testescapes
Bad TestEquipment
DesignIssues
Weakcomponents
Bad Media
Network Issues
Interconnectissues
Component Damage
Physical Shock
Electical Shock
Build verification
ToleranceIssues
Human error
Handling problems

64
system. If your process dictates that you have more than one supplier for a given
component, then differences between the two suppliers can add variations to the process.
System interaction issues arise when otherwise functional parts are inserted into a
system and the system fails. These issues can come from design problems and
interconnect issues. These problems are often tolerance related. These tolerance
problems may be mechanical as well as electrical. For example, the chassis and the CD-
Rom door may have a tolerance issue where the tray jams and will not function.
Once you have determined the risks that are posed to the quality of each function
in a subsystem, you need to look at how to quantify these risks and make them
measurable. In quantifying the risks two factors are most important, the probability of a
failure and the impact the failure would have on the customer. The probability of a
failure can be broken into two elements, the steady state risk and the excursion risk.
Steady State Risk
Steady state risk applies to processes that are in statistical control. Steady state
risk can be estimated statistically by studying the process variations and comparing them
with the specification limits. If there is production history of the components in question
then the risks can be estimated by adding the factory failure rate and the test escape rate
for the given function. This failure rate can be tracked and put into statistical control
charts. By tying the risk model to actual updated data we ensure that the model remains
accurate.
Excursion Risks
The other risk that needs to be analyzed is what happens if an out of control
process occurs. For example, if the steady state risk as described above is very low and it
is decided not to test a function, but a supplier process has an excursion and goes out of

65
control then, the failure could go directly to the customers. Estimating the risk of a
process excursion is more difficult than the steady state risk, but is often based on the
maturity and quality of the processes in question. You can estimate the risk of a process
excursion by analyzing the quality control techniques of the suppliers and the history of
the commodities in question.
Excursions are most likely to occur if a risk is introduced and not tested at any
point in the process. As system test will not cover every possible defect in every
component, it is important to understand what was tested at previous stages of
production. This can be achieved by creating a test coverage bridge as shown in Figure
8. At each stage in production some risks are covered and other risks can be added to the
component or system.
B
oa rd a ssem
b ly R
is ks
Bo ard Te st
Co ve rag e
Com
po ne nt A
s sembl ed
on b oa rds
Inte grat i on R
i sk s
In teg rat io n Te st
Cov erag e
In teg rate i n to s ys tem
Com
ponent R
isksC
ompo ne nt
Te st C
ov erag e
Other component
Risk
Other component
Risk
Figure 8: Test Coverage Bridge Chart
Understanding excursion risk is very important when deciding between testing the
entire population, sample testing, and not testing a given function of a component. If the
system test process tests the entire population, the excursion risks can easily contained

66
and can be measured by looking at control charts over time. Anything less than complete
testing involves risks that may be costly to contain.
Table 3: Risk Model
Risk Model Output
The output of the risk model is included in table 3. It shows the failure rate of
each of the failure modes along with the impact of the failure. The acronym dppm stands
for defective parts per million. The impact of the failure is important in some cases.
Failures that result in a part being dispatched may cost more to repair than failures that
can be resolved with a call to a service center.
Failure Impact
After identifying the failure spectrum and the failure probability one should find
that some failures are very unlikely while others are likely. There is another variable that
we need to consider to create the risk model. That is the impact of a failure. The impact
of a failure on a customer can range from no impact, to a customer call and part
replacement, to a safety issue. With the exception of the safety issues the customer
impacts can then have dollars assigned to them to help prioritize the failures. Table 3
At risk Function.
Supplier Risk
Process Risk
System
Interaction risk
Excursion Risk
Impact
Failure Mode 1 50 dppm 50 dppm 50 dppm 5 dppm Part Replace
Failure Mode 2 90 dppm 300 dppm 47 dppm 30 dppm Part Replace
Failure Mode 3 10 dppm 0 dppm 30 dppm 80 dppm Call

67
shows what the risk model will look like. It will enable the test strategist to determine the
most important risks to cover.
TEST COVERAGE
After having defined the fault spectrum of interest one can discuss test coverage
in a meaningful way. Test coverage can now be defined as the percentage reduction of
the total risk of a system as measured in the risk model, because of the test process. This
is calculated by linking each test to the risks that it covers. Two pieces of information are
important in test coverage, the sample rate of the testing, and the effectiveness of the
testing at covering the assigned risks.
Table 4: Test Coverage
Test coverage needs to be defined in terms of test coverage of the steady state
failures, and the test coverage for excursions. This is shown in Table 4. In Table 4, you
can see that we test 10% of the systems for failure mode 1 in the factory. In this
example, the testing is targeted at detecting test excursions. The sample rate that is
required to have a 95% chance to detect an excursion depends on the size of excursion
At risk Function.
Tested by
Test Sample R
ate
Test coverage
Steady State Test
coverage
Excursion Test
Coverage
Failure Mode 1 Test 1 10% 100% 10% 95%
Failure Mode 2 Test 4 100% 100% 100% 100%
Failure Mode 3 Test 37 100% 98% 98% 98%

68
you need to measure, and can be determined statistically. By combining the coverage
and the risk model we can calculate the amount of risk removed by the test process.
Overall Test Coverage
The overall test coverage is the ratio of the total risk eliminated by the test process
to the risks that would be present in the system if there were no manufacturing test
process. For example, if the risk model comes up with a total risk of 5% and the test
process reduces the risk to 0.2%, then the test coverage is (5%-0.2%)/5% = 96%. These
numbers will be passed on to the capacity and cost models.
Measurement of Risk and Test Coverage
Measured Data
When looking at measured data for risk, it is important to set up the data
collection process to accurately measure the risk and test coverage values. This begins
with measuring failures in the factory and in the field with the ability to measure the
amount of risk present when these systems were built. The risk present when the system
is built is equal to the number of failures in manufacturing that would have otherwise
negatively impacted the customer plus the number of test escapes from the manufacturing
process that did negatively impact the customer. The data collection process needs to be
organized around the quality model. This is achieved by assigning each risk in the
model, its own unique failure code, and tracking the number of real failures in the factory
and in the field.
It is also important to recognize the limitations of the data collection process.
Collecting failure information is complicated if the failure reporting mechanism relies on
information from the system under test. If a system locks up during a test, obtaining

69
good failure information becomes difficult. There are also problems with test correlation
and obtaining information on field failures.
Manufacturing Failure Information:
Manufacturing failure information that is caught by the test process is used to help
determine the level of risks to the customer experience. There needs to be clarity on
whether or not the failure would have impacted the customer experience. For example, if
a test failed because a test technician put in the wrong test media, then that failure would
not count towards the risk profile in the quality model. It would be counted as a process
failure. Ideally the test would output a failure code, which will map to one of the risks in
the risk model when it fails.
Manufacturing Repair Information:
Repair information is important to the quality model, as it should signal which
part or process caused the function to fail and what test caught it. As repair information
for the most part must be entered manually, the data entry process must be clear and
simple. Standard repair codes must exist for all the common repairs encountered. When
evaluating the repair actions from a quality model perspective it is important to
understand the failure rate that would have impacted the customer experience, and the
causes of this failure rate. Failures that would not impact the customer experience
include process related failures discussed in the previous section and false failures. False
failures are considered Type 2 errors in statistics. False failures can be estimated as
failures that are not repeatable and which do not reappear in the factory or in the field.
Information on the causes of the failures is limited at the repair station. Understanding
what caused the failure requires failure analysis.
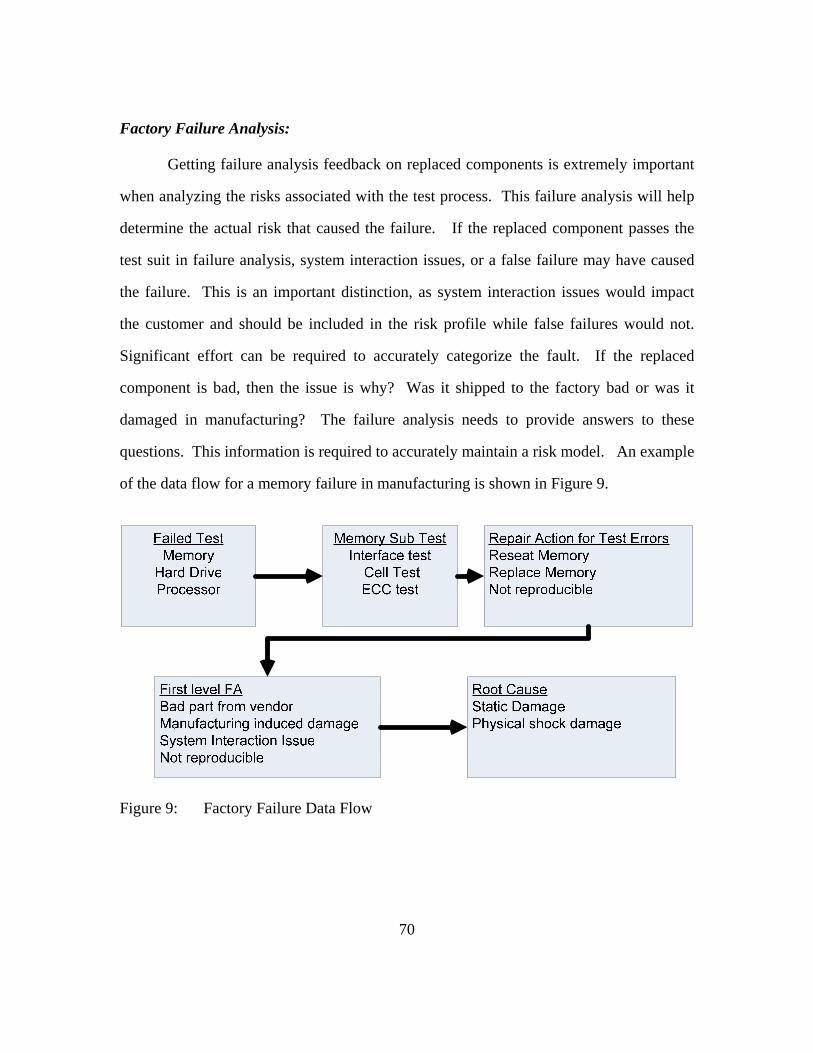
70
Factory Failure Analysis:
Getting failure analysis feedback on replaced components is extremely important
when analyzing the risks associated with the test process. This failure analysis will help
determine the actual risk that caused the failure. If the replaced component passes the
test suit in failure analysis, system interaction issues, or a false failure may have caused
the failure. This is an important distinction, as system interaction issues would impact
the customer and should be included in the risk profile while false failures would not.
Significant effort can be required to accurately categorize the fault. If the replaced
component is bad, then the issue is why? Was it shipped to the factory bad or was it
damaged in manufacturing? The failure analysis needs to provide answers to these
questions. This information is required to accurately maintain a risk model. An example
of the data flow for a memory failure in manufacturing is shown in Figure 9.
Figure 9: Factory Failure Data Flow

71
Field Data:
With the factory and failure analysis data, one can get a good estimate of the risks
caught in manufacturing. To understand the total risk present in manufacturing one needs
to know the amount of failure missed by the factory test process. To estimate this risk,
data needs to be collected from the field and analyzed to identify manufacturing test
escapes. Figure 10 shows a process for providing this feedback. It involves running the
manufacturing test process as the first part of the failure validation process on parts that
failed in the field. Any failures here are failures that the test process should catch;
therefore they are failures that occurred after manufacturing. Anything that passes the
manufacturing test process, but then fails one of the additional tests indicates a potential
risk not covered by the manufacturing test process. If the analysis validates that the risk
is real then data should be collected on it, and the risk added to the risk in the risk model.
Figure 10: Field Failure Analysis Process

72
New Products
There is a problem in assigning risks and test coverage to new products that are
not leveraged off a similar existing product, as you have no measured data upon which to
base the analysis. Risk and test coverage estimations can still be made by using Failure
Mode Effect Analysis, engineering judgment, and the data from similar products. These
estimates can be updated once the new product has shipped and historical data becomes
available.
Test Resources
Each step in the test process requires some level of resources. These need to be
spelled out so that the impact on the system can be determined. These resource
requirements include development, support, and process requirements. The process
requirements include the equipment, operator, and time required for each system. These
requirements have two impacts, the first is the cost impact of acquiring the test resources,
and the second impact is on capacity, which depends on how much test resources are
available. For any test removal or addition of test resources one need to understand the
cost impacts of the test resource requirements and the impact of the capacity model.

73
Chapter 8: Capacity Model
The mission of the test capacity model is to accurately assess the ability of the
manufacturing test process to accommodate the level of capacity required by the
business. The level of detail of the capacity model will depend on the level of variability
that impacts the capacity. The capacity model provides the basis for assessing the impact
of requiring more testing resources in manufacturing. The primary resource in this
analysis is test time. The additional test time can negatively impact manufacturing
velocity if the time increase causes a constraint on the process. If this is the case, then the
cost of additional test time can be large. On the other hand, if the additional test time
does not cause a constraint then the cost of the additional test time is minimal.
This section discusses the possible ways to model capacity. There are several
possible methods of modeling capacity. For the purposes of the dissertation two models
were created. The first is a simple excel spreadsheet, and the second is an event driven
simulation using AUTOMOD software. After a discussion of the methods the model
itself will be discussed. The capacity models need to be aligned and tuned to the factory
layout for a given test phase. As two test phases were discussed in chapter 1, two
separate capacity models are discussed in this chapter.
Excel Model
The excel model is a relatively simple model based on the number of systems
required, the number of test stations available, and the amount of time required by the
system in each station. The numbers in the model are based on averages of the systems
built on the lines. Failure rates and repair time were included. A buffer capacity was
then added to handle the variation in the process. The value of the required buffer
capacity was selected by studying the history of the system. The advantage of this

74
model is that it is simple, and easy to maintain. The risk is that by using averages and not
distributions we may not estimate the capacity impact correctly. Another problem with
this model is that it does not give much insight into the relationships between the
variables being inserted into the mode.
Event Driven Model
The event driven simulation was achieved with a program called AUTOMOD.
The simulation used test time on each configuration produced with failure probabilities
and take rates. It generated a system based on the take rates of systems built in
manufacturing and moved it into a test cell. The time required for a system in a test cell
is determined by finding the best fit of the actual distribution of test times to the
distributions available in AUTOMOD, then choosing a random value from the
distribution. This enabled us to run simulation experiments that involved changing
different parameters and determining what is most important to maintain factory velocity.
A sample output is shown in Figure 11.
Figure 11: Event Driven simulation output

75
Excel and Event driven Simulation Comparison
Both models provided similar pictures of the overall capacity situation. The
Excel model provided a useful picture of where the capacity situation stood, using a
simple spreadsheet. This is adequate for feeding the cost model. The Event driven
simulation pointed to some constraints and drivers that were not obvious from the excel
spreadsheet. This new information changed the priorities of some projects and pointed to
some resources that needed to be monitored more closely than had previously been done.
To summarize, the excel cost model was accurate enough to feed the cost model,
and will be used in the rest of this dissertation. The event driven simulation was useful in
validating the required buffer capacity and for running more detailed sensitivity analysis.
QUICK TEST MODEL
The quick test model is based on a cell build concept where a builder assembles
the computer and moves it to a test phase where it tests while the builder builds the next
system. The model is based on one build cell with the results multiplied by the number
of cells.
With this line layout, a builder can build one system and test one system at a time.
If the builder completes building a system while the next system is still testing then the
builder has to wait until the system testing is complete before starting to build the next
system. It follows then that the longest test time in quick test needs to be less than the
fastest system’s build time to ensure that the builder is never idle. If the test time is
longer than the build time, the throughput capacity of the cell is reduced.
Model Inputs
The model inputs are the build time distribution, the test time distributions, the
failure rates, and the time impact of failures. Test times are reported as averages by
76
family. This combined with the family take rates provide a reasonably accurate test time
distribution.
Model Calculations
The model then estimates when the test time combined with the time required to
deal with failures is more than the fastest build time, and assesses capacity penalty for
that cell. This penalty is represented as a percent of operator time they are not building
because they are waiting on the test process to complete.
Model Output
The output of the model is the percent of operator time spent not building systems
because the test time is too long. It also creates a capacity metric that says how many
systems the cell can produce. The operator time will be used in the cost model as part of
the cost of test labor and the capacity metric will be used in the capacity cost section of
the cost model.
EXTENDED TEST MODEL
In extended test the situation is a little different, in the sense that there is no
operator interaction in the extended test process and the people who work in this area
perform functions that are required for the software install process. In other words, they
would be there doing the same work with or without any test process. Thus, the issue is
limited to the question of extended test capacity.
Model Inputs
The capacity model receives its input from the quality model, which includes the
required resources to test and the level of test coverage to expect from the test coverage
model. It combines this information with factory and manufacturing line specific
information, and product information to determine the capacity impact on the factory.
77
The factory and line specific information includes the capacity requirements and the
amount of required resources available on the line. The product information includes
volume and configuration information.
Model Calculations
The capacity calculations involve setting up two values, the required buffer
capacity for the system, and the calculated actual capacity buffer in the system. The
model uses engineering experience to set the required buffer capacity. The estimation of
the actual capacity requires looking at the test times, number of test stations, and required
throughput. For example, if the total test station occupancy time is 1.5 hours per system,
there are 2000 test stations, and you need to produce 1000 systems an hour then the
buffer is equal to (2000/1.5-1000)/1000= .33 or a 33% actual buffer capacity.
Model Output
The output of the model centers on the difference between the required buffer
capacity and the calculated buffer capacity. If the capacity model shows that the required
buffer is less than the calculated buffer then the difference between the two adds a level
of flexibility to the balanced scorecard. This flexibility means that additional testing
capacity could be added without adding significant costs to the overall cost model. If the
required buffer is equal to the calculated buffer capacity then no cost is added to the
model, and no extra flexibility is added to the balanced scorecard. This is done for
several time periods so that one may know that a capacity problem is approaching.
If the required buffer is greater than the calculated buffer then we have to
understand the impact of the lack of required buffer capacity. The easiest method of
overcoming the lack of required buffer capacity is by working the current resources in
overtime. The overtime required would depend on the overtime required to drive the

78
calculated capacity buffer to the required capacity buffer. If the available overtime is
insufficient to restore the required buffer, then capacity needs to be increased by
increasing the amount of test resources available. An example of the output of the
capacity model is shown in Figure 12. This example shows the capacity requirements
causing the capacity required bars to vary around the 20% required buffer capacity.
Figure 12: Excel Capacity model output
-20%
-10%
0%
10%
20%
30%
40%
50%
60%

79
Chapter 9: Overall Cost Model
USE OF THE COST MODEL:
To understand the cost portion of the balanced scorecard one must understand the
cost impact of the test on the overall system. This involves assigning dollars only to the
metrics that have direct financial impacts. Limiting the scope of the financial model
helps to ensure the accuracy of the model by eliminating the more subjective measures of
test costs. An example of a subjective measure, is assigning costs to system flexibility.
The model will help us evaluate the direct financial impacts of various values in
the balanced scorecard, for the test processes. Using these models we will be able to
evaluate the relative effectiveness of two different test processes. We need to calculate
the total cost of each test process and compare them. The model will not tell you which
the best test process is, but it will tell you what the short term financial implications are
for each decision.
MODEL INPUTS:
The cost model takes inputs from the capacity model, the quality model, test
resources, and factory information. It combines the models with other more fixed costs,
and actual measured values to create an accurate picture of how costs vary in relation to
the test process. The input from the capacity model is the required and actual capacity,
and the added labor inefficiency. The input of the quality model is the factory failure rate
and the test escape rate. The more fixed costs include the costs of the floor space, test
equipment, and test development. Other inputs include the cost of labor and the cost of
field failures.

80
MODEL STRUCTURE:
The cost model at the highest level is divided into four cost categories described
in equation 1. This shows that the cost of testing is divided into four main components.
The overall structure is shown in Figure 13. The cost of testing is equal to the cost of
developing, and running the test process plus the cost of dealing with failures from the
field. Note that field failures can come from test escapes or other reasons. Breaking out
which field failures are test escapes is critical to understanding the cost impact of the test
process.
Equation 1: Overall Cost of Test Equation.
fftestdmtot CCCCC +++=
Cot = The overall Cost of Test.
Cmt = The cost of the testing in manufacturing.
Ctd= The cost of test development.
Ctes = The cost of the test escapes.
Cff = The cost of other field failures.
MANUFACTURING COST MODEL:
If one wants a cost model targeting the quality of the test process itself, then we
can slightly modify the equation 1, and remove the cost of field failures that are not the
result of faults that are detectable in manufacturing. This leaves you with equation 2.
This is the model, which is used for the rest of the dissertation.
Equation 2: Overall Manufacturing Cost of Test Equation
tdtesmtomt CCCC ++=
Comt = The cost of the overall manufacturing test.

81
Cmt = The cost of the testing in manufacturing.
Ctd= The cost of test development.
Ctes = The cost of the test escapes.
Figure 13: Cost of test model
The overall cost of the manufacturing test process is equal to the cost of testing
the device plus the cost of the test escapes. The costs are defined this way so that we
recognize the cost of testing for failures and the cost of missing potential failures in the
test process. In any test process there is a cost of testing and a cost that can be assigned
to test escapes, unless there is 100% test coverage. Manufacturing test escapes are
O vera ll C o s t o f T es t
C o s t o f F ie ld T e s t E sca p e s
M a nu fa cu trin g C o s t o f T e s t
H ard C o s t o f a F ie ld In c ide n t
L ike liho o d o f a T e s t
E sca pe
S u m m atio n F o r ea ch
T e s t E sca p e
C o s t o f F a c to ry
F lo o r S pa ce
C o s t o f C a p a c ity
Issu e s
C o s t o f T es t La b o r
C os t o f R ep a iring F a ilu re s
C os t o f S us ta in in g
Issue s
C o s t o f T e s t D e ve lo p m en t
C o s t o f T e s t E q u ip m e n t
L ike liho o d o f a n on te s t
e sca p e fie ld in c id e n t
C o s t o f o th e r fie ld in c id e n ts
S u m m a tio n o th e r fie ld in c id e n ts
V o lu m e
O th e r C o s ts

82
failures that in principle can be caught in the manufacturing environment. The other
sources of field incidents add to the number and cost of field failures, but as the
manufacturing test process cannot catch them, they should not be included in the
manufacturing test cost model. The finance department of the organization should
approve all equations used in any cost model.
Figure 14 shows a graph of the costs of testing. At the left side of the graph there
is no testing in manufacturing, and the cost of testing is equal to the cost of the test
escapes. As soon as we begin testing, the cost of manufacturing tests increase rapidly for
some time as there is some overhead required in developing and running the test process.
After the initial spike, the cost of testing will drop sharply as the relatively easy to detect
failures are found, and prevented from reaching the field. As the level of testing
increases the overall cost of testing will be reduced until it reaches some minimum value
where the incremental decrease in test escape costs equals the incremental increase in
factory costs. The factory costs increase due to the development of capacity constraints.
Additional testing beyond this point may lead to an increased overall cost to the
company. A lot of effort is expended trying to reach the minimum cost point. This
shows the tradeoff between field quality and manufacturing capacity. To do so one must
understand what drives the cost of test development, cost of manufacturing, and the cost
of test escapes.

83
Figure 14: Cost of Manufacturing Test
Cost of a Test Development:
The cost of test development can generally be regarded as fixed, after the testing
has been developed, and it can be amortized across the volume of the systems the test
was written for. In many companies the test development organization exists the year
round and resources are relatively stable, so this assumption works reasonably well and
there is little need to model this variable. The costs of design for test features are
included in the test development cost as are the cost of development of labor and
equipment. Equation 3 gives one method of calculating the cost of test development.
The cost of test development is dominated by the cost of test labor, which is the number
0
1000
2000
3000
4000
5000
6000
7000
00.0
2 1 2 3 4 5 6 7 8 9
Test
Cos
t
Cost of Test EscapesCost of Testing in Manufacturing Overall Cost of Manufacturing TestCost of Test Development
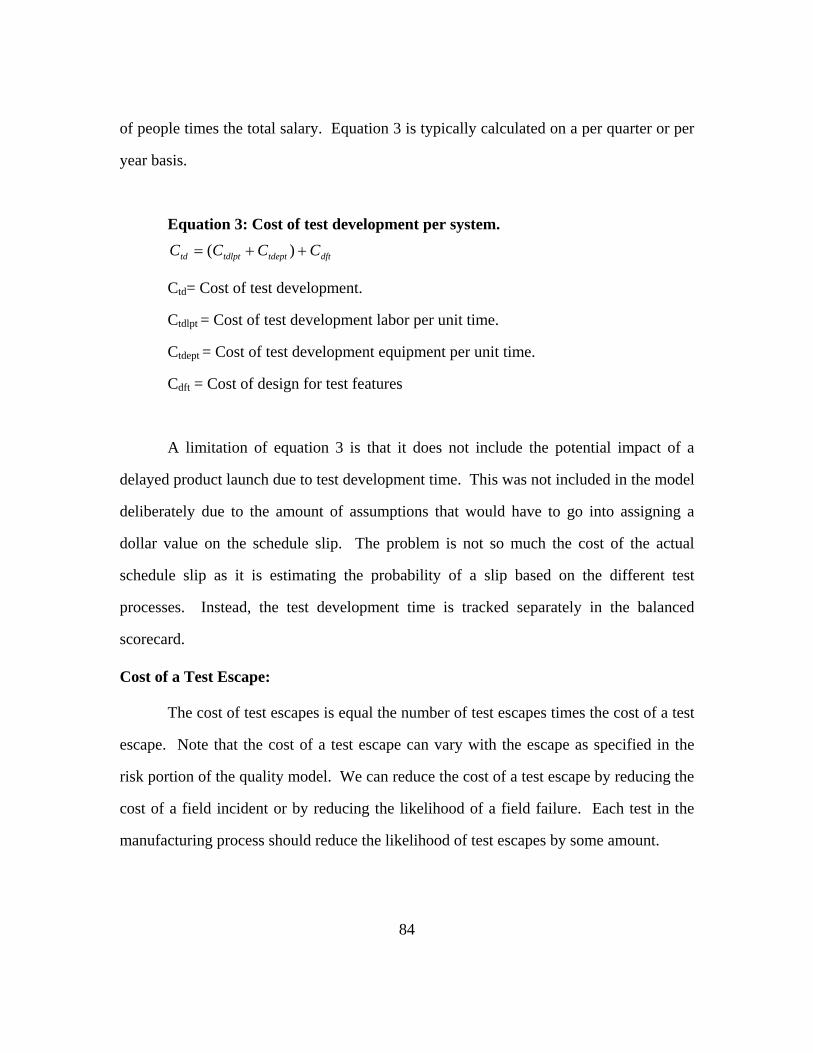
84
of people times the total salary. Equation 3 is typically calculated on a per quarter or per
year basis.
Equation 3: Cost of test development per system.
dfttdepttdlpttd CCCC ++= )(
Ctd= Cost of test development.
Ctdlpt = Cost of test development labor per unit time.
Ctdept = Cost of test development equipment per unit time.
Cdft = Cost of design for test features
A limitation of equation 3 is that it does not include the potential impact of a
delayed product launch due to test development time. This was not included in the model
deliberately due to the amount of assumptions that would have to go into assigning a
dollar value on the schedule slip. The problem is not so much the cost of the actual
schedule slip as it is estimating the probability of a slip based on the different test
processes. Instead, the test development time is tracked separately in the balanced
scorecard.
Cost of a Test Escape:
The cost of test escapes is equal the number of test escapes times the cost of a test
escape. Note that the cost of a test escape can vary with the escape as specified in the
risk portion of the quality model. We can reduce the cost of a test escape by reducing the
cost of a field incident or by reducing the likelihood of a field failure. Each test in the
manufacturing process should reduce the likelihood of test escapes by some amount.
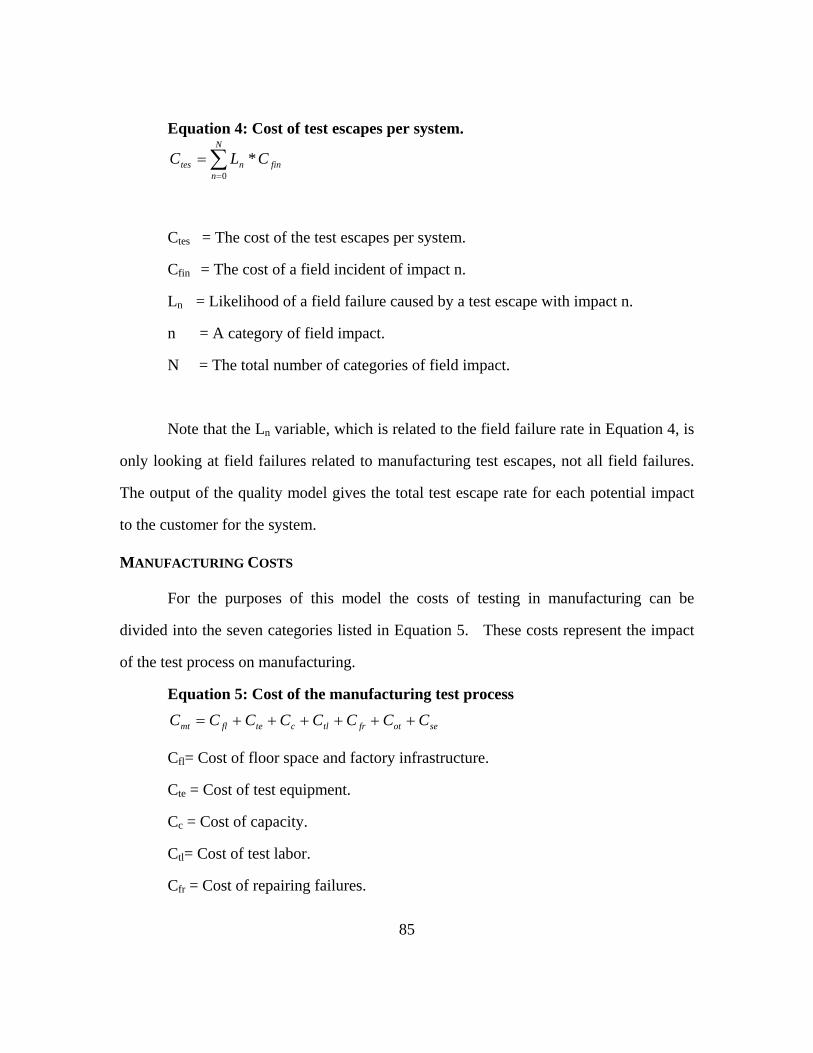
85
Equation 4: Cost of test escapes per system.
∑=
=N
nfinntes CLC
0
*
Ctes = The cost of the test escapes per system.
Cfin = The cost of a field incident of impact n.
Ln = Likelihood of a field failure caused by a test escape with impact n.
n = A category of field impact.
N = The total number of categories of field impact.
Note that the Ln variable, which is related to the field failure rate in Equation 4, is
only looking at field failures related to manufacturing test escapes, not all field failures.
The output of the quality model gives the total test escape rate for each potential impact
to the customer for the system.
MANUFACTURING COSTS
For the purposes of this model the costs of testing in manufacturing can be
divided into the seven categories listed in Equation 5. These costs represent the impact
of the test process on manufacturing.
Equation 5: Cost of the manufacturing test process
seotfrtlcteflmt CCCCCCCC ++++++=
Cfl= Cost of floor space and factory infrastructure.
Cte = Cost of test equipment.
Cc = Cost of capacity.
Ctl= Cost of test labor.
Cfr = Cost of repairing failures.

86
Cot = Other costs of test.
Cse = Cost of sustaining issues.
The cost of floor space (Cfl) and the cost of test equipment (Cte) are relatively
fixed in the short term. Note that while the total fixed costs tend to vary slowly with
changes in volumes, the fixed costs per system will change with the number of systems
produced. So as volumes increase the fixed costs per system drop dramatically. This is
shown in Figure 15. This assumes that the increase in volumes do not drive other fixed
cost increases. The cost of floor space and factory infrastructure is calculated by taking
the costs for the unit time divided by the volume of systems produced times a percent
utilization if other value added processes are preformed in that space. For example,
software download occurs in the same spot as the extended test so the cost of that
infrastructure will be divided between those functions.
01020304050607080
1000 2000 3000 4000
Volume
Cos
ts
Figure 15: Fixed Costs per System
The cost of test equipment per system equals the summation of the cost of the test
equipment required for all tests on the system divided by the number of systems that can
use the test equipment. This assumes that the test equipment performs no other value

87
added function. If it does, then the utilization percentage for the test process needs to be
factored in.
Capacity costs
The capacity cost section of the model takes the information from the capacity
models and assigns a dollar value to it. The capacity cost is the sum of the cost of
capacity impacts on each test phase. Therefore, before understanding the costs of test
time we need to understand the capacity requirements, and the manufacturing constraints.
As the factory described in chapter 1 had two phases, quick test and extended test we
need to account for both the costs. Both these costs are passed via the capacity model to
the cost model. The capacity cost is the cost of overtime associated with moving from
the actual buffer up to the buffer required by the model. If the actual buffer is already
larger than the required buffer, increasing the buffer by reducing test time is of relatively
little value. There is a reduction in inventory carrying costs, but this is very small.
Assuming that the actual capacity buffer is less than the required capacity buffer we can
calculate the cost of Capacity in Equation 6.
Equation 6: The cost of test time per system
ovrararca CTVVCCC *)/)*)((( ∗−=
Cca = Cost of Capacity.
Cr = Capacity buffer required.
Ca= Capacity buffer available.
Vr = Volume Required.
Tr = Time required to run.
Va = Volume Achievable.
Cov = Cost of overtime.
88
Equation 6 may be clear with an example. If you have a 20% buffer requirement
a 10 % actual buffer, 100 systems per hour of volume required, and an achievable volume
of 88 systems per hour, then you would have to work 0.1136 (10/88) hours of overtime
for each hour one wants to run at the required volume. If one needs to run at this rate for
80 hours then the overtime required is approximately 9 hours. This multiplied by the cost
for one hour of overtime would give the overall cost of capacity. The capacity model is
broken out by weeks in the quarter, with significant volume swings over the quarter.
Cost of Test Labor
The cost of labor to run the test process is an important factor in the variable cost
of the test. This does not include labor that would be required by other manufacturing
processes. It also does not include repair or sustaining labor, those are captured in other
costs. The test labor in the model comes from the capacity model, in this case the labor
requirements come from the quick test phase. The output of the quick test capacity
model gives an operator utilization rate for the test. This rate multiplied by the salary and
the number of operators gives the cost of test labor.
Cost of Repairing Failures
The factory needs to know the failure rate and the costs associated with repairing
each failure. A good analysis of the rework process was done by Thiagarajan32. The
variables affecting the cost of repairing the failures should be collected and measured for
each failed system. These variables include the cost of repair labor, the time required to
repair the system, the sensitivity of the process to the repair time, reprocessing time, and
the cost of the part replaced in the repair activity, if applicable. For the overall model all
32 Thiagarajan Trichy, Peter Andborn, Ravi Raghavan, and Shubhada Sahasrabudhe. “A New Test/Diagnosis/Rework Model for Use in Technical Cost Modeling of Electronic Systems Assembly.” IEEE Proceedings of the International Test Conference, 2001. Page 1108-1113.
89
we need to know is the number of repairs done per hour, and the cost per hour of the
repair technician.
Cost of Sustaining Issues
We also need to measure the occurrence and cost of sustaining a manufacturing
test process. This involves measuring the impact and frequency of issues caused by
problems with the test process. The cost of sustaining the test process should be
relatively small, depending on the complexity and maturity of the test process and the
product being tested. These issues usually take the form of engineering holds of false
failures in manufacturing.
These issues will impact factory throughput. The impact of the issues must be
measured. The time required to contain and resolve an issue is directly proportional to
the cost of the issue, so early notification of the problem is critical to reducing the cost of
an issue. The sustaining costs include the cost of sustaining engineers and the cost of the
issue. The costs of the issues are tracked on an incident-by-incident basis and estimated
for future time impacts.
Other Costs
Another set of costs sometimes comes into play. These costs are technically
called “other costs”. These costs can include a wide variety of costs. Here, we are going
to discuss the benefits driven by being able to delay capital expenditures and the cash
conversion cycle. These costs while rare, can substantially affect the actual cost of
testing.
When the test process affects a capital expenditure, the cost of testing can vary
greatly. For example, if by removing or changing a couple of tests you do not need to
build another factory for some time period, then the cost of running that test should

90
include the cost of not delaying the factory for that time period. In this case the actual
savings would be having the money that could be used freely. It would otherwise be used
in building the factory. Equation 7 shows the cost of a test if it means the company must
build another factory sooner than they otherwise would have. The present value of the
cost of a future factory is shown in Equation 8.
Equation 7: Cost of a test that requires a factory to be built earlier.
coffofotff PVCC −=
Cotff = Cost of testing which requires a new factory.
Cof = Cost of factory
PVcoff = Present value of the cost of the future factory.
Equation 8: The present value of future factory expenditures.
noffn
coff kC
PV)1( +
=
Coffn = The cost of the factory after n time periods.
K = The cost of capital per period n.
n = The number of time periods.
The cash conversion cycle refers to the time between when the company has to
pay the suppliers, and the time when the company collects from the customer. If the test
process significantly increases the time between when the order is built and shipped, then
it will induce a cost to the cash conversion cycle as the company will have more
inventories in house, and it will lose the interest that it would gain by getting the
customer’s money sooner. Calculations for cash conversion savings are dependant on the
business model and accounting practices of the particular company.

91
Typically, these other costs are included in equations when they are relevant. For
most test tradeoff decisions, these costs can be ignored. Where they cannot be ignored,
they must be factored into the equation.
LIMITATIONS OF THE COST MODEL:
With any model there is always the issue of accuracy and of completeness. When
using a cost model to justify changes you need to be aware of the level of accuracy of the
model. The models as described do not cover the entire spectrum of test related issues.
The main limitations relate to the ability to apply cost accounting to flexibility and
customer experience, and data collection. These limitations have already been discussed
in some depth.
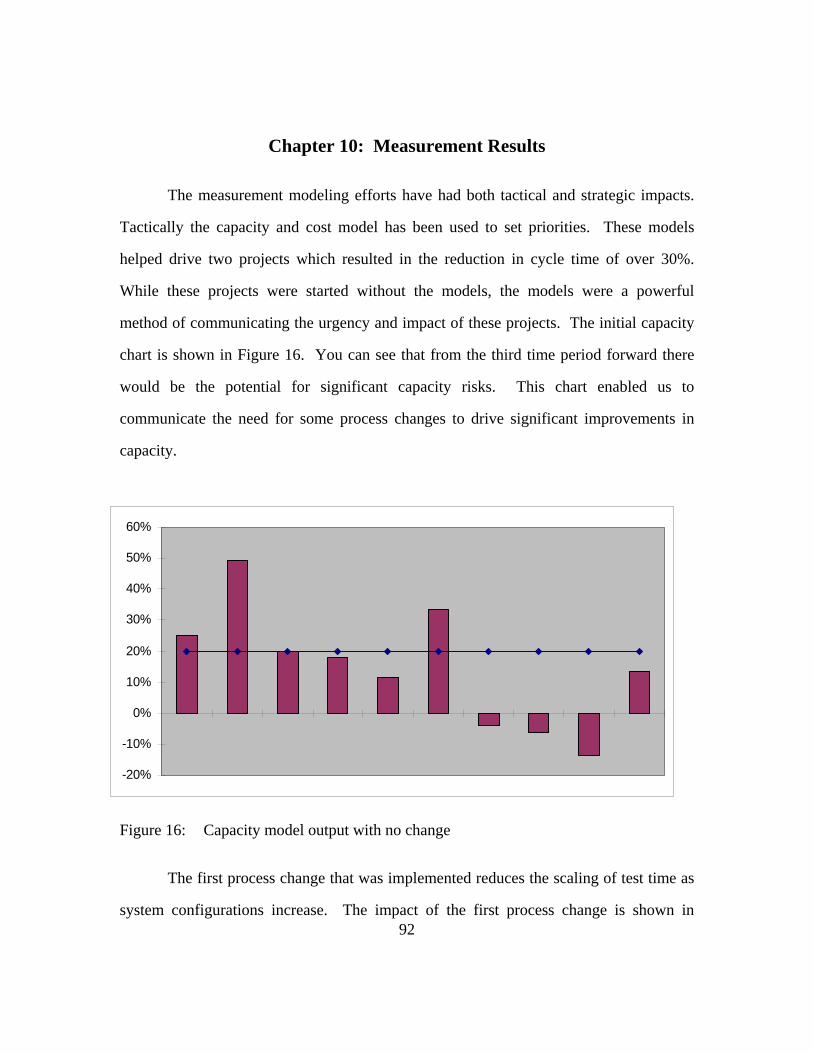
92
Chapter 10: Measurement Results
The measurement modeling efforts have had both tactical and strategic impacts.
Tactically the capacity and cost model has been used to set priorities. These models
helped drive two projects which resulted in the reduction in cycle time of over 30%.
While these projects were started without the models, the models were a powerful
method of communicating the urgency and impact of these projects. The initial capacity
chart is shown in Figure 16. You can see that from the third time period forward there
would be the potential for significant capacity risks. This chart enabled us to
communicate the need for some process changes to drive significant improvements in
capacity.
Figure 16: Capacity model output with no change
The first process change that was implemented reduces the scaling of test time as
system configurations increase. The impact of the first process change is shown in
-20%
-10%
0%
10%
20%
30%
40%
50%
60%
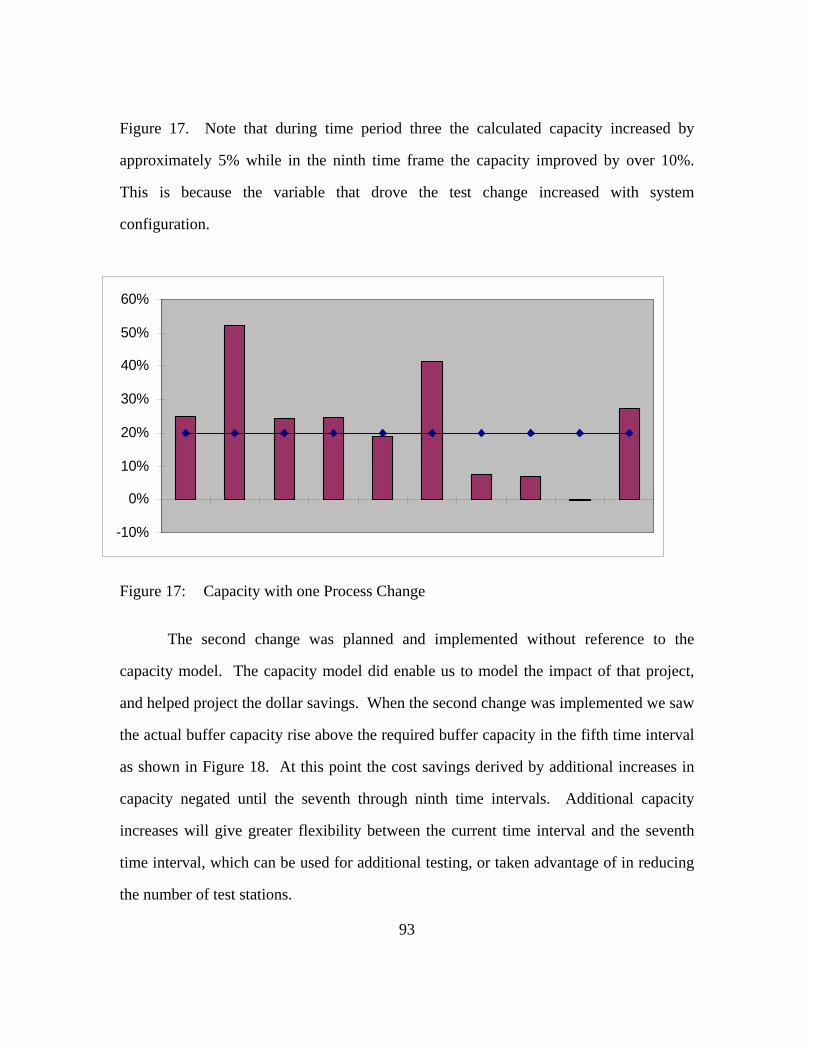
93
Figure 17. Note that during time period three the calculated capacity increased by
approximately 5% while in the ninth time frame the capacity improved by over 10%.
This is because the variable that drove the test change increased with system
configuration.
Figure 17: Capacity with one Process Change
The second change was planned and implemented without reference to the
capacity model. The capacity model did enable us to model the impact of that project,
and helped project the dollar savings. When the second change was implemented we saw
the actual buffer capacity rise above the required buffer capacity in the fifth time interval
as shown in Figure 18. At this point the cost savings derived by additional increases in
capacity negated until the seventh through ninth time intervals. Additional capacity
increases will give greater flexibility between the current time interval and the seventh
time interval, which can be used for additional testing, or taken advantage of in reducing
the number of test stations.
-10%
0%
10%
20%
30%
40%
50%
60%

94
Figure 18: Capacity with two Process Changes
With the changes implemented, the capacity portion of the cost model shows that
we should be satisfied from a capacity perspective until the seventh time unit out. The
dominant costs in the cost model are development and sustaining costs, and the costs of
dealing with failures in the factory and in the field.
From a strategic point of view, the cost model helped set the priorities of the test
group. As stated previously the cost model output showed that the cost of development
and the cost of quality defects are the two big cost drivers in the cost model. A simplified
output is shown in Figure 19. It is obvious that reducing development and sustaining
costs, and reducing the cost of failure in the factory and in the field are critical to
improving the overall system. Reducing these while simultaneously improving all the
other stakeholder requirements are the goals of the rest of this dissertation.
0%
10%
20%
30%
40%
50%
60%

95
Simplified Costs Model output
60%
30%
10%
Test Development andSustaining CostsFailure Rates Costs
Capacity, fixed, andother costs
Figure 19: Simplified cost output.
By linking risks to cost in this way, another benefit is achieved in targeting the
most expensive risk for reductions. Traditionally the quality department has been
concerned with reducing the level of defects entering the factory. While this is a noble
goal the benefits of improving quality can be magnified by using a combination of the
quality, capacity, and cost models to prioritize the risk reduction, and by targeting the
quality improvement effort at defects that add the most cost to the manufacturing process.
Some defects are easy and cheap to find while others are much more costly to locate. If
quality focuses on improving a small number of defects that are difficult or expensive to
test for, then more money can be saved than by trying to reduce the overall level of
defects.

96
ANALYZE PHASE
Chapter 11: Analysis of Process
To develop a new test strategy for manufacturing system level testing one needs
to understand the relationship between the variables, the sources of conflict between
them, and the impact of that conflict. This is the goal of the analyze phase. The
measurement phase successfully addresses the first issues discussed in Chapter 2 and
gives us a useful metrics that link the test process to the rest of the system via the
stakeholder’s priorities. It has a useful test coverage measurement for the manufacturing
system test based on a risk model created with actual failure data. It also provides an
accurate cost assessment of the impact of the test process. It only partially addresses how
the metrics relate and interact with one another. This relationship and the implications of
the relationship between the variables will be where we start the analyze phase.
RELATIONSHIP OF VARIABLES
Analyzing system interactions fits with the next step in the balanced scorecard
process, which is to arrange the metrics to show which metrics drive which other
metrics.33 The relationships between the metrics in the balanced scorecard are shown in
Figure 20. The idea is that one should target improving metrics that will help to improve
the other metrics. Figure 20 is not meant to be a complete description of the interactions,
but it does give the general relationship between the most of the fields of the balanced
scorecard.
33 Kaplan, Robert S. and Norton, David P. “The Balanced Scorecard”, Harvard Business school Press Boston, Massachusetts copyright date 1996 Page 30

97
Test Escape
Cost
Factory Failures
Test Process
Test Issues
False Failures
Test Coverage
Incoming Quality
Capacity impact
Manufacturing Specific Costs
Development costs
Data From Test process
Failure Analysis
Cost to repair failure
Impact to Customer
Experience
First time Fix
Speed of fix
Field Failure Rate
Overall Cost of Manufacturing
Test
Development Time for new
products
Figure 20: Balanced Scorecard Relationship
From the figure one can see that the incoming quality level influences most of the
other metrics related to the test process. If we can get better at improving the incoming
quality levels we can improve the entire system. This is consistent with the ideas
expressed by the Total Quality Management experts. The incoming quality level is

98
influenced by failure analysis, and data collection. Improving data collection and failure
analysis will be discussed in the next section.
CONFLICT ANALYSIS
This does not solve the problem of what to do when priorities conflict. In keeping
with the Theory of Constraints, which says that systematic problems stem from
conflicting priorities, we turn our attention to understanding the conflicts in the test
process. These conflicts will map back to the manufacturing test decisions discussed in
chapter 1. These conflicts are generally driven by several underling assumptions. If we
can find a flaw in the underling assumptions perhaps we can eliminate the conflict. What
follows is a brief analysis of two potential conflicts that both point directly at the core
conflict.
Testing Longer vs. Capacity
It is generally believed that if you apply greater resources to testing, you will get
better test coverage in manufacturing. These greater resources can, however cause
capacity issues in manufacturing. This may require balancing test coverage with
capacity. Without a good measure of the test coverage, which we did not have, prior to
the measurement phase, the conflict between test time and capacity can cause oscillations
in the test process between adding and removing tests.
Underling Assumptions
In trying to understand the conflicts between capacity and quality we make some
underling assumptions. The key assumptions here are that more testing improves quality,
that we have a capacity constraint, and that the job of the testing process is to screen
defects. If capacity is not constrained in the manufacturing test process then we can do
significantly more testing at a lower quality improvement payback. If more testing does

99
not improve quality then there is no need to do additional testing, and if the quality level
improves we can improve quality without doing more testing.
Decision impacts
The quality and capacity conflict appears in several of the decisions that need to
be taken in the test process. An example is the decision to test a feature or not. It
generally comes down to an issue of the capacity impact of testing versus the quality
impact of not testing. Another example is the question of whether or not to run a burn-in
test after assembling the system. Burn in testing can require a significant amount of time,
which translates into a significant capacity impact to achieve quality improvement.
Simplicity and Complexity
In an effort to improve test coverage, we may add more and more complexity to
the test process, which increases the cost to maintain the test process. Complex testing
processes would tend to involve testing the entire system while simple testing processes
may target testing the parts of a system. A complex test process may be able to find more
defects and better protect the customer. This might includes testing the software and
hardware together to ensure that the system works, as the customer would use it. A
simpler test process may be more reliable, easier to troubleshoot, and easier to fix if
something goes wrong.
Underling Assumptions
Assumptions for the simple test process are that it provides easier troubleshooting
and maintenance than the complex test process. The assumption for a more complex test
solution is that you will have better test coverage as you can test the system interactions
more completely. The job of testing is to screen the defects. There is also an assumption
that we understand the level of risks that need to be covered in the various testing

100
decisions, and that a simpler process is better at providing feedback to the supplier. The
final assumption is that the complexity required to get the desired test coverage needs to
be contained in the system manufacturing test process.
Decision impacts
The simple versus complicated conflict appears in several of the decisions that
need to be made in the test process. A process based on testing systems as a whole is
generally more complicated than a process based on testing components individually,
testing software is more complicated than just verifying hardware, and testing for design
related defects is much more complicated than just verifying that no hardware quality
errors exist.
CORE CONFLICT
Upon examination one can see that both these conflicts stated above can be
considered a quality vs. cost conflict. Increasing both the time requirements and the
complexity of the test process should, if the assumptions are correct, improve the quality
of the product shipped to the customer. The objections to these are primarily centered on
cost in terms of capacity impact and issue generation from more complex processes.
The tools developed to measure the effectiveness of the test process make most of
these decisions either obvious or irrelevant. If the impact of the optimization effort
between cost and quality is large then the answer is obvious, if the decision between cost
and quality is close, then the savings either way is going to be small. It is like moving
from point A to Point B in Figure 21. While you may find the minimum overall cost of
the manufacturing test, you are not saving much money overall. What is needed is a way
to shift the entire curve down.

101
0
1000
2000
3000
4000
5000
6000
7000
00.0
2 1 2 3 4 5 6 7 8 9
Test
Cos
t
Cost of Test EscapesCost of Testing in Manufacturing Overall Cost of Manufacturing TestCost of Test Development
Figure 21: Total Cost of Test graph
IMPACT OF THE CORE CONFLICT
The method for analyzing the impacts of the conflicts is to look at how these
conflicts could prevent us from meeting the stakeholder requirements. In the standard
Theory of Constraints analysis one needs to define our undesired effects (UDE). For the
purposes of this dissertation the undesired effects will be not meeting some or all of the
stakeholder requirements. The tool we will use to map the relationship is called a current
reality tree. These logic trees are designed to show the cause and effect relationships of
these conflicts. These are read from the bottom up. A description of how to read these
trees is included in the Appendix.
BA

102
What is the impact of the conflict between quality and cost? This type of
optimization effort can result in oscillations between removing tests to reduce costs and
adding tests to improve quality. The rational for this is shown in Figure 22, which is part
of a current reality tree, with the basic conflict being between cost and quality. By
continuing to try and optimize the test process we use up a lot of resources in adding and
removing tests that could be better employed in improving the overall system. This
continued tension can be a large distraction for anyone trying to drive fundamental
system level improvements. The tension could lead to antagonism between people
responsible for quality and people responsible for capacity.
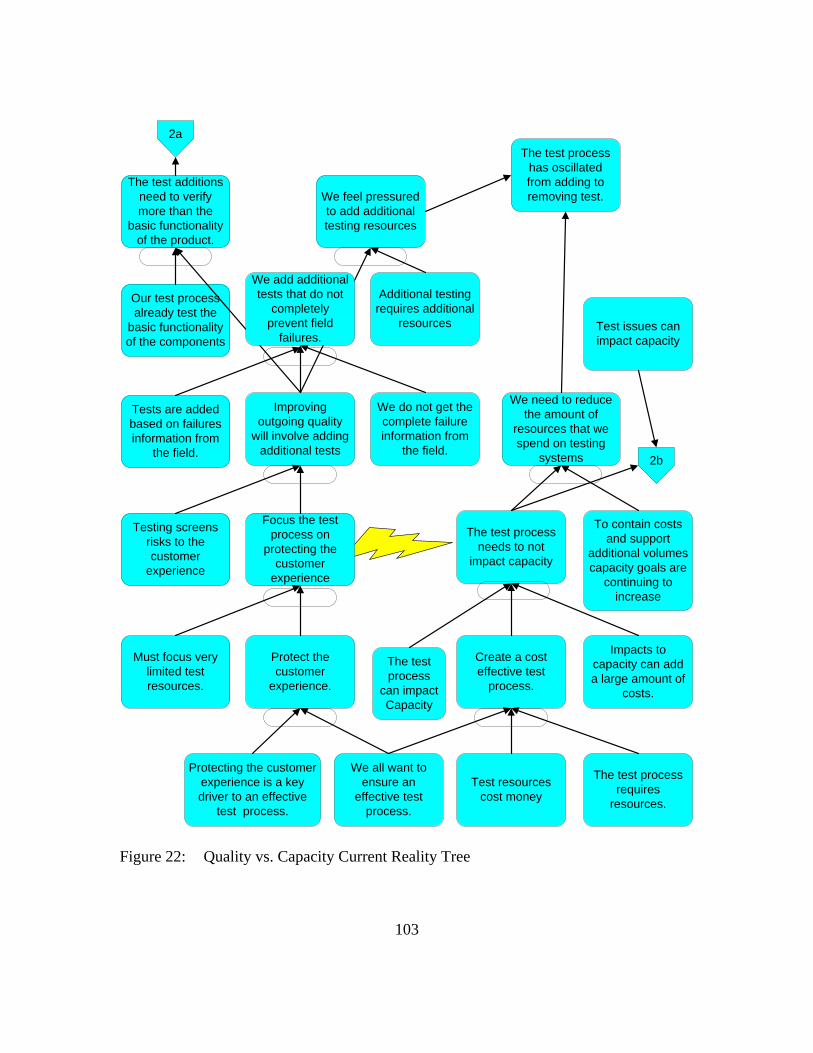
103
We all want to ensure an
effective test process.
Create a cost effective test
process.
Protect the customer
experience.
Impacts to capacity can add a large amount of
costs.
Protecting the customer experience is a key driver to an effective
test process.
Must focus very limited test resources.
Focus the test process on
protecting the customer
experience
The test process needs to not
impact capacity
Test resources cost money
Improving outgoing quality
will involve adding additional tests
We do not get the complete failure information from
the field.
Our test process already test the
basic functionality of the components
The test additions need to verify more than the
basic functionality of the product.
We need to reduce the amount of
resources that we spend on testing
systems
To contain costs and support
additional volumes capacity goals are
continuing to increase
The test process requires
resources.
The test process
can impact Capacity
2a
Additional testing requires additional
resources
We feel pressured to add additional testing resources
We add additional tests that do not
completely prevent field
failures.
The test process has oscillated from adding to removing test.
2b
Test issues can impact capacity
Testing screens risks to the customer
experience
Tests are added based on failures information from
the field.
Figure 22: Quality vs. Capacity Current Reality Tree
104
IMPROVE PHASE
Chapter 12: Proposed Solution
To resolve the conflict between cost and quality one needs to take a look at the
assumptions upon which they are based and break one of the key assumptions which will
enable us to drive a resolution to the conflict. The proposed solution involves removing
the conflict between cost and quality, by focusing on improving quality and thereby
improving costs. The discussion will then turn to what a test process focused on
improving quality, looks like. The requirements for creating a test process as a quality
improvement tool will lead to a new built in Self test proposal for system test.
WHY TEST?
The assumption that needs to be done away with is that the job of the test process
is to screen defects. While this is important, the primary job of the test process should be
to provide feedback to improve the quality of earlier processes. If testing is used by a
business to minimize the cost impact of poor quality then the most efficient way to do
that is to prevent the poor quality in the first place. If the quality levels of the other
processes are perfect then testing is unnecessary. Deming, the father of the modern
quality movement says in the third of his 14 points that we should not depend on mass
inspection to ensure a quality product. The following is a summary of the point:
3) Do not rely on mass inspection to “control” quality. All inspections can
do is sort out defectives, and at that point it is too late because we have
already paid to produce these defectives. Inspection typically occurs too
late in the process, it is too expensive, and it is often ineffective. Quality

105
results from prevention of defectives through process improvement, not
inspection.34
Testing is not a value added activity; it is a cost avoidance activity and a tool to
provide process improvement. Sun Tzu said something along these lines about winning
battles in the Art of War:
“For to win one hundred victories in one hundred battles is not the acme of
skill. To subdue the enemy without fighting is the acme of skill.”35
What Sun Tzu was saying is that fighting battles is not a value added activity, subduing
enemies is what adds value to a kingdom. Fighting battles is a costly process to try and
subdue the enemies, and it is more cost effective if you can subdue the enemy without
fighting. Along the same lines, a test can be an expensive way to ensure quality, and it
can be more cost effective to improve the quality of the product. Does this mean that we
do not have to test? No, it means that the ultimate goal of the test process should be to
improve the upstream processes to the point that test becomes unnecessary. The
intermediate goal is to minimize the cost of quality defects that still exist.
STRATEGY: FOCUS ON IMPROVING QUALITY
As can be seen in Figure 20 incoming quality level is the fundamental driver to
the whole process. If we can reduce the level of risk (improve incoming quality) the
entire process can improve. Instead of focusing exclusively on protecting the customer
and reducing costs look at what happens when we focus on improving quality. We can
eliminate the conflict between quality and capacity, if we continuously improve the
34 Montgomery, Douglas C.; “Introduction to Statistical Quality Control” Third edition; John Wiley & Sons Inc. New York; 1997 page 18. 35 Tzu Sun, “The Art of War” Translated by Samuel B. Griffith, Oxford University Press, London, Oxford, New York, 1963 page 77.
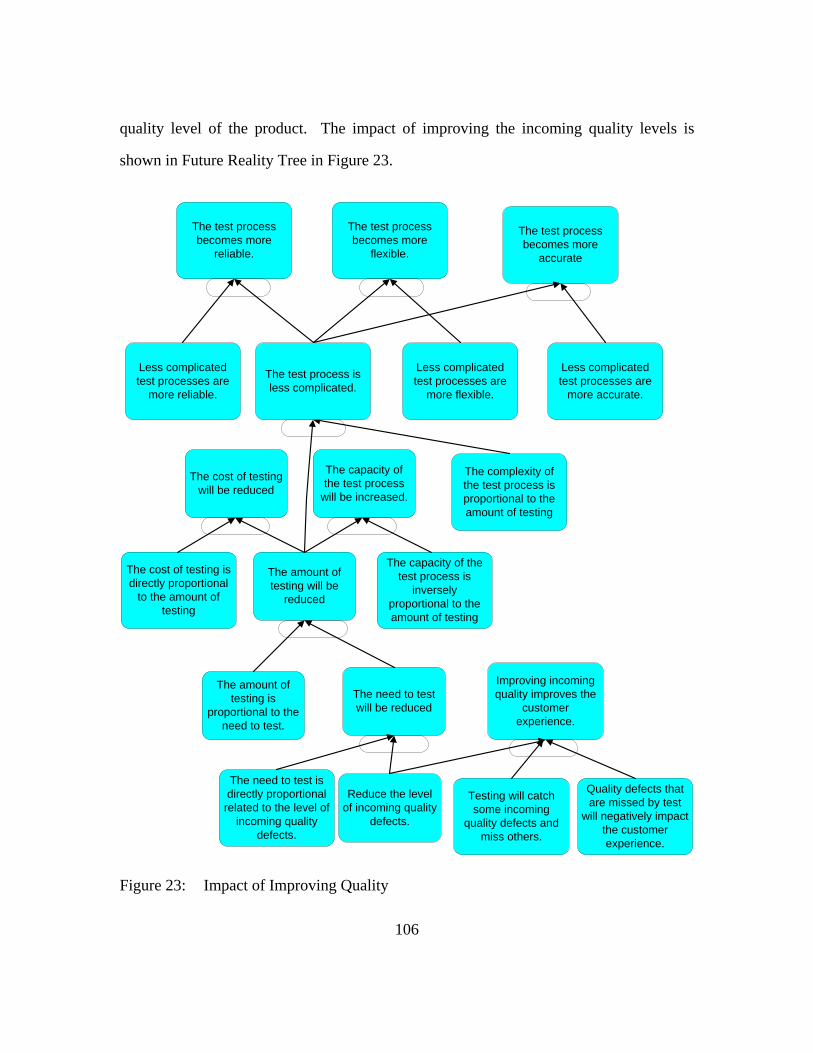
106
quality level of the product. The impact of improving the incoming quality levels is
shown in Future Reality Tree in Figure 23.
The need to test is directly proportional
related to the level of incoming quality
defects.
Reduce the level of incoming quality
defects.
The need to test will be reduced
The cost of testing is directly proportional
to the amount of testing
The amount of testing is
proportional to the need to test.
The amount of testing will be
reduced
The complexity of the test process is proportional to the amount of testing
The capacity of the test process
will be increased.
The cost of testing will be reduced
The capacity of the test process is
inversely proportional to the amount of testing
The test process is less complicated.
Less complicated test processes are
more flexible.
Less complicated test processes are
more reliable.
Less complicated test processes are
more accurate.
The test process becomes more
flexible.
The test process becomes more
reliable.
The test process becomes more
accurate
Testing will catch some incoming
quality defects and miss others.
Quality defects that are missed by test
will negatively impact the customer experience.
Improving incoming quality improves the
customer experience.
Figure 23: Impact of Improving Quality

107
By improving quality and reducing risk, we reduce the need to test. If less testing
is required, less testing resources are required. If less testing resources are required, we
will have more testing capacity. Focusing on identifying and eliminating the risks to the
customer experience can make many of the conflicts disappear. If we can reduce the
level of risk in the product, we can decrease the level of testing, which will make the
process much more efficient. Reducing the need to test should result in a process that
cost less to support, develop, gives more capacity, and cause fewer issues in
manufacturing. Assuming test coverage is less than 100% we should also see fewer field
failures because of the improvement in incoming quality.
If there is agreement that the test process should be optimized in terms of how it
can help the quality department improve quality, the next question is how one can change
the test process help to improve the quality of the process? This need is to create a
feedback loop that will continually drive quality improvements. This feedback loop
needs to be as efficient as possible. Figure 24 lays out the rational for the requirements of
a test process that is targeting quality improvement. According to the analysis the test
process needs to log failure information, especially field failures. It must be a simple
process, identify the failing component, and minimize false failures. The need to drive
quality improvements will dictate the level of detailed data the test process is required to
log. Where applicable the test process needs to provide both attribute and parametric
data. The requirement for a simple test process brings up the conflict between a simple
process and a complex process. From a quality improvement perspective, one would
prefer a simple test process, as it would be easier to get to the root cause of failures.
Unfortunately, the simple test process may result in less test coverage than a more
complicated test process. More details on how we deal with the complexity will be
discussed in the next chapter.

108
We need a test process that helps to improve quality.
We have limited resources to
improve quality
Test must make quality improvement as easy as possible.
Information is key to improving
quality.
The test process must provide information
necessary to improve quality.
Dealing with false failures can making
quality improvements
difficult.
Failure information is critical to improving
quality.
Test process must minimize false failures.
The test process must log failures.
The test process must identify the
failed component.
False Failures can be generated
by technicians replacing the
wrong component
The test process must be as simple as possible.
Understanding the test process is important to driving quality improvements.
Simple processes are easier
to understand
Field data is difficult
to get.
The test process must log field failure
data.
Figure 24: Strategy for Improving Quality

109
Chapter 13: System Level Built in Self Test
To meet the quality improvement requirements while dramatically reducing the
development cost one solution is to shift the complexity of testing onto the suppliers.
This is accomplished by using Built in Self Test (BIST) and by logging historical data
directly to the system under test. We will see that this is complementary with the strategy
of improving quality, in that it meets the requirements laid out in the last section. If we
can shift the test complexity to the supplier we should be able to reduce the test
development costs, improve test coverage, and a better feedback process than we can
achieve with our current test process.
Figure 25 shows how a built in self test scheme properly designed should be able
to meet the requirements discussed earlier. The use of built in self test should reduce the
number of false failures, by minimizing test correlation issues and by providing a single
point of accountability for the failures. It should provide much better data collection
from the field as it can log the failure information on the device itself. Assuming that the
built in self test is set up to also test interfaces, one can significantly reduce the need to
test the system as a whole. This complexity issue will be discussed in more detail in the
next section.

110
The suppliers are responsible for all
tests.
Implement built in self test
Reduce the test correlation
issues.
Self Test log results on the
component under test.
Failure data will be logged to the
component under test.
Test correlation issues can cause false
failures.
Built in Self test is used in the field.
Reduce the number of false
failures.
Field failure information will be logged on
the component.
The test process must identify the
failed component.
Built in self test should verify each
component.
The need for a complex
process is removed.
Complexity is driven by the need to test
system interaction.
Interface testing is
included in the Built in Self Test.
Test correlation issues are driven by different test
groups.
System interactions occur at the interfaces.
When there is no need for a complex
process, then a simple one is
preferred.
The need for a complex
process is removed.
Figure 25: Built in Self Test for Improving Quality

111
COMPLEXITY ASSUMPTIONS
More complicated testing is usually rationalized by the need to test the system
rather than the components, perform some level of design verification, and the idea that
we should test it like the customer is going to use it. The argument that one should test
the system rather than the components comes from the general perception that “as
systems become increasingly complex the combined efforts of lower level testing are not
enough to guarantee the overall functionality of the system”.36 However, Jay J. Nejedlo
of Intel argues persuasively that the exact opposite is true when he states: “Current OS
based functional testing methods are inadequate for meeting platform testing needs going
forward”.37 He says this because at the very low level one can control the system in ways
that allow for testing worst case conditions. In other words, testing with specific patterns
to detect crosstalk and other specific problems is possible using BIST. When running a
high level OS test it is impossible to target worst case conditions due to the limited
control of the bus and associate hardware.
THE BUILT IN SELF TEST VISION
The vision is that in manufacturing and in the field one could boot the system and
it could automatically test itself. It would start on the main system board components,
then test the bus controllers, test the buses themselves, and finally initiate self tests on the
peripherals. Each component would have to be able to test itself and if it controls a bus
in the system, it would have to be able to test the bus. If a component is on the bus but
does not control the bus, then it would have to have loop back capabilities that would
allow for the bus controller to send commands and read them back over the bus. If there
36 Ambler, Farren, “The economics of System level testing”, Design and Test of Computers, July-September 1997 page 57. 37 Nejedlo, Jay J. “Functional Test coverage on the Decline”, Proceeding of the International Test Conference 2004 page 1424.
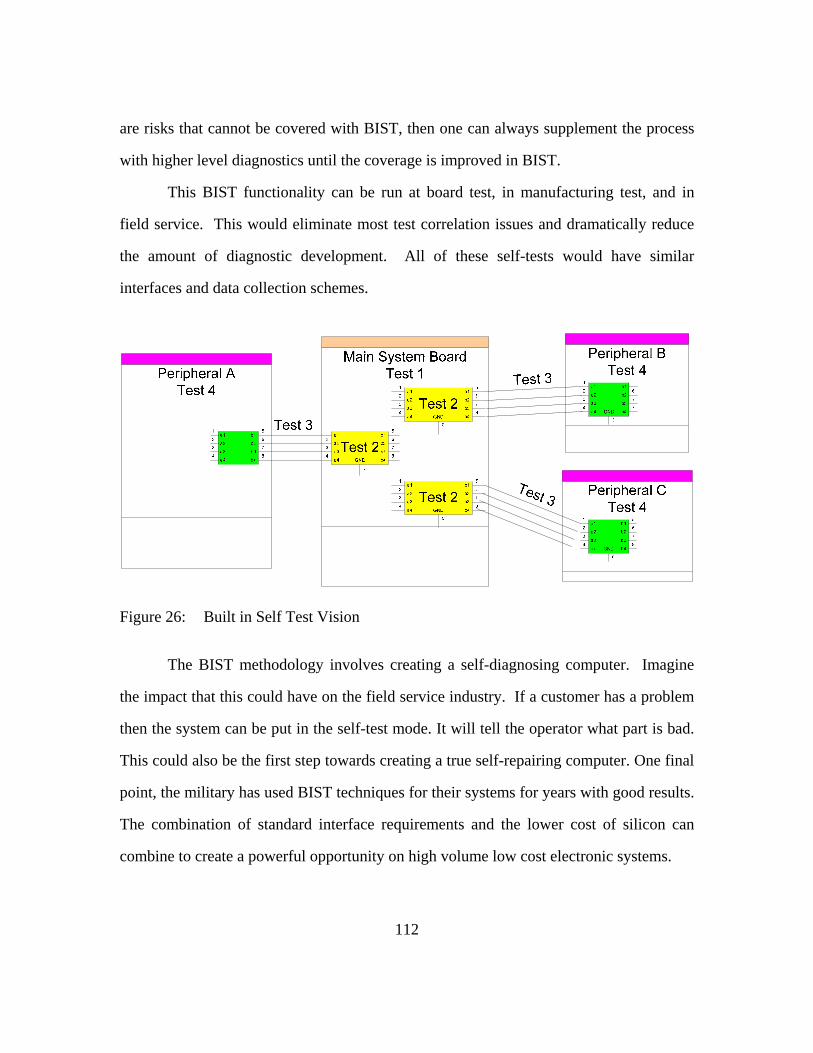
112
are risks that cannot be covered with BIST, then one can always supplement the process
with higher level diagnostics until the coverage is improved in BIST.
This BIST functionality can be run at board test, in manufacturing test, and in
field service. This would eliminate most test correlation issues and dramatically reduce
the amount of diagnostic development. All of these self-tests would have similar
interfaces and data collection schemes.
Figure 26: Built in Self Test Vision
The BIST methodology involves creating a self-diagnosing computer. Imagine
the impact that this could have on the field service industry. If a customer has a problem
then the system can be put in the self-test mode. It will tell the operator what part is bad.
This could also be the first step towards creating a true self-repairing computer. One final
point, the military has used BIST techniques for their systems for years with good results.
The combination of standard interface requirements and the lower cost of silicon can
combine to create a powerful opportunity on high volume low cost electronic systems.

113
ADVANTAGES TO SUPPLIERS
This sounds good, but does shifting the development to the supplier just shift the
costs from test development to the cost of the component? What are the advantages for
the component suppliers? There are several advantages for the component supplier.
These include better data collection, more control of the testing of the components, and a
closer relationship with the system manufacturer. Many of these component suppliers
already use BIST in their manufacturing process. Modifying it to meet the new
specification should not be too expensive.
BUILT IN SELF TEST REQUIREMENTS
To make self diagnosing computers a reality one needs to create a standard that
can be applied across all components. To enable the most effective use of BIST at the
system level, each component would have the similar interfaces and data collection
standards. This section will discuss the interface requirements of BIST, and the next
section will discuss the data collection requirements.
Commands
The Built in Self Test needs to include several modes: a boot up quick test mode,
a maximum reliability check, and a command line driven test. The quick test mode needs
to be fast enough to run at system power on self test.
Quick Test
This test would be required if a full test requires a significant amount of time to
test the component. The quick test is designed to check for internal errors and provide a
basic functionality check. This test is designed for use by field service to quickly isolate
the cause of a failure that the customer is experiencing and by manufacturing in the quick
test phase. The timing of this should be such that it can be run while the technician is

114
still on the phone with the customer. The quick test should catch a high percentage of the
parts that fail in the factory and the field.
Maximum Reliability Test
This test is designed to verify the component based on the architecture of the
device. This test will be used by the supplier, potentially in system manufacturing,
potentially in field service, and used to test field returns. If the maximum reliability test
for a component is fast enough a quick test command may not be required.
Programmable Test coverage
Some tests that cover a lot of features and take a significant amount of time will
need to have the ability to accept commands to only run a subset of the tests. This subtest
can be chosen dynamically by the utility that calls the self test. There needs to be a way
to turn on and off certain tests when it becomes necessary. Each commodity needs to
accept commands to run a set of tests defined by the calling utility.
Interface Test
The interface test can be a mechanical interface, or an electrical interface. An
example of mechanical interface verification would be to ensure that bracket holding the
CD-Rom drive does not interfere with the CD-Rom tray opening and closing. Each
device that controls a bus needs to be able to test the bus it controls for any tolerance
issues. Any device on a bus that does not control it needs to be able to have a loop back
mode that works with the bus controller to test the interface.
Driver Based Test
When systems are running in at a higher level OS, the driver needs to be able to
not only run the self test, it needs to be able to log both test errors and any process errors
it detects to both the system motherboard and the component itself. The driver should be

115
able to run a quick self test on a device without significant interference with the operation
of the system. This information is used by failure analysis to drive corrective action.
DATA COLLECTION REQUIREMENTS
The data collection is critical to improving quality. For each class of components,
the data logging needs to be standardized. There are three situations to consider when
discussing data collection. These three are, power initialization failures, BIST failures,
and operational failures. Ensuring proper data logging in these cases will be important
for failure analysis engineers to drive corrective action.
Initialization Failures
Some percentage of systems will not complete the power up sequence to get to the
point when self tests can be executed. These systems will be repaired and often a part
will be replaced and the failed part will be sent for failure analysis. The problem is that a
large percentage of these parts will be tested and certified as good parts. Today there is
no data relating to what caused the original system to not complete the power up
sequence. This lack of data is a critical issue in getting effective corrective action
implemented to reduce the number of systems that failed to initialize. The initialization
process needs to be designed to make it as easy as possible to drive quality
improvements.
During the initialization process information needs to log after each step is
completed. If the initialization process locks up then at least the failure analysis engineer
will know how far the system got in the process. If the error does not result in a lock up
condition it still needs to log with the relevant failure information. The system must be
able to store enough initialization failure results to identify intermittent failures.

116
Built in Self Test Failures
Failures in built in self test need to have a standard reporting mechanism.
Information needs to include; the test or sub-test that detected, part number and serial
number of the component, the version of that test, time to failure information, the upper
and lower tolerance readings, and the actual reading. This information needs to be
logged on the component itself and reported back to the system under test.
Operational Failures
Each component in the system needs to log any and all errors it detects. It needs
to log the details to the relevant component and the system under test. This information
also requires a standardized template. Information needs to include; what command it
was executing when the error was detected, part number and serial number of the
component, time to failure information, the expected reading, and the actual reading.
CURRENT STATUS
There has been movement toward using Built in Self Test at the system level.
Most components run some kind of Built in Self Test when they boot up. Built in Self
test has been implemented on specific components on an as needed basis for system
testing. It has not been implemented as a standard with similar requirements across
multiple components. The components of the system we are going to focus on are the
hard drives, motherboard, memory, add-in cards, processors, software drivers, and the
associated interfaces.

117
Hard Drive BIST
The hard drive Built in Self test called drive self test38 has been used for some
time and consists of two types, a short self test and a long self test. Theses have resulted
in significant savings due to the multitasking ability of being able to test the surface of
the all the hard drive in the system while running other functions. This multitasking is
especially important on system with multiple large hard drives.
Motherboard BIST
The Intel Tribute39 initiative was outlined in two papers presented in the
International Test Conference in 2003. Tribute has three parts, Transaction, Interface,
and Memory BIST. These represent Intel’s strategy for testing high-speed platforms and
systems. The success of this strategy is critical to the BIST proposal presented here.
While knowledge about the quality of the tests may need to wait until the full
implementation is running in a couple of years, it should provide the capability to
perform a wide range of testing on the motherboard at no cost to the system
manufacturing companies.
Transaction BIST40
Transaction BIST is designed to emulate the booting to the motherboard to a
multitasking OS. It will run and test what the interface BIST does not cover on the
motherboard. Unfortunately, there is very limited information about it, at this point.
38 Seagate white paper; “Enhanced Drive Self Test-Winning the War against Unnecessary Drive Returns” http://www.seagate.com/docs/pdf/whitepaper/Enhanced_DST_Tech_Paper.pdf , TP-302.1 June 2000. 39 Nejedlo, J.J.; “TRIBuTE/sup TM/ board and platform test methodology” Test Conference, 2003. Proceedings. ITC 2003. International , Volume: 2 , Sept. 30,-Oct. 2, 2003 Pages:106 - 113 40 Nejedlo, J.J.; “TRIBuTE/sup TM/ board and platform test methodology” Test Conference, 2003. Proceedings. ITC 2003. International , Volume: 2 , Sept. 30,-Oct. 2, 2003 Pages:106 - 113

118
INTERFACE BIST41
The Interface BIST proposed by Intel is designed to verify the functionality of the
interfaces between the major system components. This is designed to test all of Intel’s
controlled buses in the computer. Unfortunately, it is only now being released on some
Intel chips. It needs to be the standard on all Intel chipsets. Something similar needs to
be developed for non-Intel chipsets. Intel gave an example of how interface BIST will
work on the PCI express bus. It sounds like exactly what is required to verify the
interfaces between the components at the system level. Unfortunately it does not cover
the SAS and SATA buses.
Memory BIST
The Memory BIST is going to be a real test for Intel’s Tribute process. It is due
out in late 2005 or early 2006. It will be a significant test to see if BIST can achieve the
aggressive coverage and test time targets they have set. The Interface BIST will test the
bus to the memory and the Memory BIST will test the memory modules themselves.
This separation of the interface and functional testing of the module will speed up
troubleshooting and repair activity.
Storage Buses (SATA, SAS)
Built in Self Test for SATA and SAS buses should allow for a bus controller to
send a command that puts all the devices attached to the bus except the controller in a
loop back mode. The controller then needs to send test patterns that stress the bus in
worst case conditions. There is some work getting a BIST proposal to standardize the
way BIST and the Bit Error Rate Test (BERT) are implemented.42 The author has not
41 Nejedlo, J.J. “IBIST/sup TM/ (Interconnect built in self-test) architecture and methodology for PCI express”, Proceedings of International Test Conference 2003. Page(s): 114 - 122 42Stevens, Curtis C. “BIST SCT Command Proposal” T13.org, T13/e04148r01, December 7, 2004 http://www.t13.org/docs2004/e04148r1_BIST_Proposal.pdf

119
found any device manufacturers discussing how the BIST is being utilized to test the SAS
or SATA buses. The BIST feature seems to be rarely used.43
Add in Cards
PCI cards that are PCI Express compliant will support a loop back test for the
verifying the interface via the IBIST implementation.44 This needs to be added to all
busses that connect to add-in cards. Most add in cards have some type of BIST that runs
when power is applied, but this does not appear to be standardized across different card
suppliers. A common interface standard needs to be created for accessing BIST and
receiving the results.
Software
The software that is mostly commonly used in computers is some version of
Microsoft’s Windows. The discussion will focus on this operating system, but the
requirements are general enough to apply to any software in the system manufacturing
environment. These do have built in self test to a degree, when the system boots and the
driver loads for a device it will come up with a “yellow bang” error message if the device
does not initialize. This software testing needs to be expanded and integrated with the
hardware testing. Error message needs to be logged to the device that failed, if possible,
so that if it is replaced the failure analysis technician can know precisely what failed.
Another issue with software occurs when the software unsuccessfully tries to
boot. It should come up with an option to run the hardware built in self test. If this option
is selected and a test fails the fact that it initially failed for a windows boot with an error
43 Smith, Date “The challenges of testing SATA and SAS; Part 2: primitives and frames”, Computer Technology Review, Feb. 2004. http://www.findarticles.com/p/articles/mi_m0BRZ/is_2_24/ai_115310090 44 Nejedlo, J.J. “IBIST/sup TM/ (Interconnect built in self-test) architecture and methodology for PCI express”, Proceedings of International Test Conference 2003. Page(s): 114 - 122

120
code should be logged to the device in question. This would allow failure analysis and
enable quality engineers to track the impact of hardware failures on windows booting.
Expanding Boundary Scan
Several papers have been written about expanding boundary scan to the system
level.45 This involves adding controller chips and extra lines to the system under test.
This idea may or may not be applicable to a high volume low cost system like the
personal computer. On initial inspection this option seems unnecessarily expensive to
implement given what Intel is currently developing for motherboards. The most cost
effective solution that meets the requirements is the one that needs to be implemented.
RISKS IN THIS STRATEGY
This section will review the risks to this strategy. These risks center on the cost
of implementing the described BIST process, and the potential lack of coverage with
BIST. These risks seem easy to mitigate due to the fact that one can still run existing
diagnostics until the risks are removed from the system, or solutions to the cost or
coverage issue is resolved in BIST.
Cost of BIST
The cost may vary widely across commodities, but history has shown that the
kinds of BIST implementations described here can be done cost effectively. Many
products already have a BIST implementation, so a lot of this is standardizing these
implementations. Intel for example is developing a motherboard BIST at no direct
charge to the system manufacturer. If the costs are out of line for testing a specific defect
risk with BIST, then a stand-alone diagnostic for that risk will be used until the costs
come down or the risk is eliminated. 45 Clark, C.; Ricchetti, M.; “Infrastructure IP for configuration and test of boards and systems” Design & Test of Computers, IEEE , Volume: 20 , Issue: 3 , May-June 2003 Pages:78 - 87
121
Inadequate Coverage
There are two questions on the coverage issue. Are the defects found in a BIST
scenario relevant at the system level? Can we trust the suppliers to adequately test the
devices? The first question is tied to knowing the risk profile described earlier in the
dissertation. The test coverage requirements need to be given to the component supplier.
The second issue is related, since we are running what amounts to supplier diagnostics, if
it were discovered that the diagnostics did not meet the agreed upon specification, then
that supplier would face the loss of a significant contract. This risk can be mitigated by
running stand alone diagnostics on components with inadequate coverage until either the
coverage is added or the risk is removed.

122
CONTROL PHASE
Chapter 14: Results
The goal of the Built in self Test methodology described in the previous chapter is
to drive improvement in all the elements of the balanced scorecard. We can leave the
current diagnostic in place while these BIST changes are being implemented. This will
enable one to verify the coverage of the BIST process before it becomes the standard.
PROJECTED IMPROVEMENTS
This section will discuss the impacts on the balanced scorecard. The impacts are
two fold. First, the improvement in quality, and second the improvements in efficiency
driven from the BIST process described in the last chapter.
If we are successful in significantly improving the incoming quality level, we will
have less need to test and have better quality. The question is, does this actually happen?
The fact is that it has happened in the last few years. Figure 27 shows the test time and
field incident trends over several years. Note that while test time has been reduced
system configurations have increased which would tend to increase required test time.
The percentage of systems with field problems has also been reduced. This offers
compelling proof that general quality improvements can result in a reduced need to test
and result in a more efficient process. This was done without a test process that targeted
quality feedback improvement as its main goal. The implementation of BIST and better
failure analysis should speed up the trend. What follows is a more detailed projected
result of the BIST implementation strategy.

123
Test time and Field failure Rate
Test TimeField Failure rate
Figure 27: Long term trends in test time and field failure rates.
Financial
Based on the financial model a successful implementation of BIST could result in
savings of approximately 50% in our test support and development costs because of the
shifting of the diagnostic work to the supplier and reducing the need for separate
diagnostic development for different stages of production and the field. Simplification
should result in amore reliable process that requires fewer resources to support. If there
are any issues the part can be put on hold, and the factory can shift to another supplier.
The cost of manufacturing test should decrease due to the increase in capacity driven by
the ability of the various BIST executions to run in parallel, target faults more quickly,
and the improvement in component quality. If the information that Intel reported about
the benefits of BIST in terms of test coverage is correct, we should also see a reduction in
the cost of test escapes.46 There may be some added costs for designing the system to
46 Nejedlo, J.J.; “TRIBuTE/sup TM/ board and platform test methodology”, Proceedings of International Test Conference, 2003, Volume: 2, Sept. 30,-Oct. 2, 2003 Pages: 106 - 113

124
accommodate the BIST testing, but that is believed to be marginal when compared to the
benefits.
Internal
Flexibility should improve as test development time is reduced in the new product
development cycle. The reduction in test time due to the ability to run most of the
diagnostics in parallel should result in an increase in capacity. Test coverage should
increase because of some of the added abilities of the BIST process. False failures should
be reduced because the supplier owns the commodity and the diagnostic. This allows for
one point of accountability. The diagnostics should be better at identifying the bad parts
because of the process of verifying the core components then branching out verifying
each piece as the test proceed.
The reliability of the process should be improved by holding suppliers
accountable for test issues, and switching to different suppliers if there are too many
issues. There is also the advantage of having the maker of the product write the test.
New product development time should be reduced, as the suppliers of the part will have
the tests ready when the part is ready, hence very little system test development would be
required. New product issues should also be reduced because the testing should be
available very early in the development cycle, giving plenty of time to find test related
new product issues before the systems enter manufacturing.
Customer
Improving quality should mean fewer customer failures. The time to resolve an
issue should be reduced by using the BIST test ability to verify the components in
parallel. This method should also reduce the number of parts dispatched on account of a
failure as the BIST architecture testing should be able to identify the failing part much

125
more accurately than the current process. Fewer failures and more effective resolution of
issues should improve the customer’s perception of the quality of the computer, which
should lead to more repurchases by the customer.
Learning
This scenario provides better data logging from factory and field failures for more
effective failure analysis. This is accomplished by logging information directly onto the
device that failed. It removes distractions that would slow failure analysis, by limiting
the number of false failures and test correlation issues. The scenario should result in a
faster trend of quality improvement driven by improved failure analysis feedback.
MANAGEMENT PROCESS
The last question to address in the dissertation is how one manages the test
process going forward. Having established the stakeholder requirements and modeled the
interactions, how do we manage the process? Both the balanced scorecard and the
relationship model will need to be fed with the actual test and failure analysis data
measured in the process. The balanced scorecard will also be fed by the information
derived by the relationship model. The balanced scorecard is used to track progress and
communicate that progress with the stakeholders. The balanced scorecard gives an
overall view the performance of the test process in relation to the system and this gives us
the ability to prioritize the issues that need improvement. However, it does not address
how you manage the improvement process.
The key to managing a complex system is determining how the system
interactions are impacted by changing a characteristic of the system. Looking at Figure
28 you can see that the data feeds the test coverage model, which determines the values
of the relationship model and the balanced scorecard. The relationship model and the
126
balanced scorecard are used by the test strategist and the stakeholders to set process
improvement goals.
On the left side of Figure 28 you see the process for organizing actions in a
complex system.47 Plans are then developed to achieve the desired goals. The impact on
the process of the plans that were developed needs to be analyzed and predicted to ensure
that there are no unforeseen consequences and that the goals are achieved. If they are not
then a new plan is required and we move back to the planning stage. Once we have a
plan that has been validated by the model, we move to the implementation phase. This is
followed by measuring the actual impact of the plan and comparing it with what the
model predicts. This gives a feedback process for the models so that they can be
improved over time.
47 Dorner, Dietrich “The logic of Failure”, Perseus Books Cambridge Massachusetts, 1996 Page 43

127
Relationship model
Test Strategy Stakeholders
Failure analysis
DataTest Data
Set Priorities for Test and Quality Improvements
Balanced Scorecard
Develop Plan of action
Implement Improvements
Predict Improvement
Measure results
Figure 28: Management Model

128
CONCLUSION
The two main issues that are preventing significant progress in the area of system
test are the lack of clear metrics, and the limited understanding of the relationship
between metrics. These issues led to the questions: how can one know how good a test
process is, and how to drive improvements? To address the issue of a lack of clear
metrics the dissertation defined the requirements of a quality test process based on
stakeholder requirements. These requirements were put into a balanced scorecard format
to ensure visibility of the requirements. These collectively will be used to manage the
quality of the test process. The problem of measuring issues like test coverage and the
cost of test remained. In the measure phase a relevant solution to the test coverage
question is proposed in the quality model. This solution based on real data is far more
relevant than mathematical models based on questionable assumptions. The capacity
impact of the test process is modeled and the results are fed to a cost model. The quality
model and the capacity model flow into a simplified cost model. The output of the cost
model is used in the financial section of the balanced scorecard. At the end of the
measurement phase powerful tools have been created to optimize the test process
between some of the different parameters. The two biggest costs in the test process were
the cost of test development and the cost of quality issues, both in the factory and in the
field.
Optimization between stakeholder priorities only goes so far in improving a
system. What is needed is a strategy to improve all the requirements of the system. This
is the goal of the analysis and the improve phases. The analysis starts with mapping the
relationship between the variables in the balanced scorecard. It then tries to identify the
core conflict of the process. It is identified as cost versus quality. To end the conflict one

129
needs to realize that instead of trying to balance quality and cost, the goal is to improve
quality and thereby lower the costs. The requirements for a test process designed to
improve quality is laid out. These include making failure analysis as easy as possible so
that issues can be driven back as quickly as possible, and getting precise error
information from both the factory and the field to drive corrective action.
The solution that best fits these requirements and reduces the cost of test
development involves creating a new built in self test standard for system test. By
implementing a system level BIST architecture that can test the system components and
system interaction, one can develop a test suit that can meet the requirements necessary
to improve quality and dramatically reduce test development and support costs. This is
due to the ability to reuse diagnostics throughout the entire product life cycle from board
test through system test, and into the field. Implementing a standard to create self
diagnosing computers if applied to all product lines should result in saving in the multi-
million dollars annually.
As you can see, in the previous sections we have presented a comprehensive view
of the issues and potential solutions. The focus is on getting a better understanding of the
risks, test coverage, and cost impacts of the manufacturing test process. As Sun Tzu said
“Therefore I say: ‘Know the enemy and know yourself; in a hundred battles you will
never be in peril.”48 In this case the quality risks and costs are the enemy, knowing
yourself relates to understanding how the test process impacts the overall system, and
winning battles relates to improving the system. If these factors are well understood then
there will be success in the battles to reduce cost and improve quality.
48 Tzu Sun, “The Art of War” Translated by Samuel B. Griffith, Oxford University Press, London, Oxford, New York, 1963

130
Areas of Further Investigation
Further investigation into applying the Built in Self Test plan presented here, is
needed. Does the testing of core components followed by test bus controller, testing the
interface buses, and finally testing the peripherals all through BIST, work on other
systems? Should this be the system BIST industry standard? More detail is needed on
what the standard needs to look like.
The modeling techniques could use more refinement. What level of detail is
required to drive improvement? The methodology used was based on the accuracy of the
data. This is a little arbitrary, what if a more accurate model may or may not improve the
ability to make decisions. How accurate does the model need to be? There is reason to
be skeptical of the financial ability to accurately assign dollars to these systems in the
absence of proper modeling of the entire system. The accuracy of financial models in
general would be interesting to investigate.
Process documentation is another area that needs investigation. Current methods
of documenting processes often rely on word documents that have limited capabilities to
accurately capture system interactions, especially non-linear interactions based on
changing parameters. The accuracy of the models relies on accurate documentation, or
engineering judgment. A more dynamic method of documenting processes is required.

131
Appendix: How to Read Logic Diagrams
The logic diagrams are cause and effect trees. These are read from the bottom to
the top as if then statements. The figure below would be read as follows. If poorly
understood processes tend to be poorly communicated and (signified by the oval) if the
test process is poorly understood then the test process tends to be poorly communicated.
This technique is designed to demonstrate the logic behind a position clearly for review.
If the top block feeds another block then it would be an “if statement” for the high block.
Figure 29: Logic Diagram Description

132
Bibliography
Ambramovicic, Miron, Breuer, Melvin A., Friedman, Authur D.; “Digital Systems Testing and Testable Design”, IEEE Press New York, 1990
Bloch, C.; Ranganathan, R. “Process-based cost modeling” IEEE Transactions on Components, Hybrids, and Manufacturing Technology, Volume 15, Issue 3, June 1992 Page(s): 288 -294
Burton-Houle, Tracy; “Field Guide to the Theory of Constraints Thinking Process”; Avraham Y. Goldratt Institute; 2000;
Camurati, P.; Corno, F.; Meo, M.; Prinetto, P. “A new functional fault model for system-level descriptions” Proceedings of VLSI Test Symposium, 1994, 12th IEEE Page(s): 214 -219
Clark, C.; Ricchetti, M.; “Infrastructure IP for configuration and test of boards and systems” Design & Test of Computers, IEEE , Volume: 20 , Issue: 3 , May-June 2003 Pages:78 – 87
Dorner, Dietrich “The logic of Failure”, Perseus Books Cambridge Massachusetts, 1996.
Durraui, T.S.; Forbes, S.M.; Carrie, A.S. “Extending the balanced scorecard for technology strategy development” Proceedings of the 2000 IEEE Engineering Management Society, 2000. Page(s): 120 -125
Farren, D.; Ambler, A. P. Chan, Wia, “System-Level Testing: Characterization and Improvement”, http://www.ece.utexas.edu/%7Eambler/system.htm ,1996
Farren, D.; Ambler, A. P. “System test cost modeling based on event rate analysis” Proceedings International Test Conference, 1994, Pages: 84 - 92
Farren D., Ambler A.; “System Based Cost Modeling Based on Event Rate Analysis”. IEEE proceedings of the International Test Conference, 1994. Page 84-96.
Farren D. and Ambler A.; “Cost Effective System Level Test Strategies.”, IEEE Proceedings of the International Test Conference, 1995. Page 807-813
Goldratt, Eliyahu M. and Cox, Jeff; “The Goal”, North River Press Great Barrington, MA. 2004
Goldratt, Eliyahu M. “It’s Not LUCK”, North River Press Great Barrington, MA. 1994.

133
Grochowski, A.; Bhattacharya, D.; Viswanathan, T.R.; Laker, K.; “Integrated circuit testing for quality assurance in manufacturing: history, current status, and future trends” IEEE Transactions on Circuits and Systems II: Analog and Digital Signal Processing, Volume 44, Issue 8, Aug. 1997 Page(s): 610 -633
Kaplan, Robert S. and Norton, David P. “The Balanced Scorecard”, Harvard Business school Press Boston, Massachusetts copyright date 1996
Klutke, G.A.; Kiessler, P.C.; Wortman, M.A. “A critical look at the bathtub curve” IEEE Transactions on Reliability, Volume 52, Issue 1, March 2003 Page(s): 125 – 129
Mahoney, R.M. “Integrating manufacturing test strategy with manufacturing production strategy”AUTOTESTCON '97. 1997 IEEE Autotestcon Proceedings Page(s): 394 -397
Montgomery, Douglas C.; “Introduction to Statistical Quality Control” Third edition; John Wiley & Sons Inc. New York; 1997
Nejedlo, Jay J. “Functional Test coverage on the Decline” Proceeding of the International Test Conference 2004 page 1424
Nejedlo, J.J. “IBIST/sup TM/ (Interconnect built in self-test) architecture and methodology for PCI express”, Proceedings of International Test Conference 2003. Page(s): 114 - 122
Nejedlo, J.J.; “TRIBuTE/sup TM/ board and platform test methodology”, Proceedings of International Test Conference, 2003, Volume: 2, Sept. 30,-Oct. 2, 2003 Pages: 106 - 113
Nejedlo, J.J.; “Tribute board and platform test methodology: intel's next generation test and validation methodology for platforms” Proceedings of International Test Conference, 2003, Volume: 1 , Sept. 30-Oct. 2, 2003 Pages:783 – 783
Orton, Rex; “A System Test Cost Model as Influenced by Business Plan” University of Texas, Masters Thesis, May 1999
Ross, Joel E. “Total Quality Management Text, Cases, and Reading” Third Edition, St. Lucie Press, Boca Raton, London, New York, Washington D.C.1999
Seagate white paper; “Enhanced Drive Self Test-Winning the War against Unnecessary Drive Returns” http://www.seagate.com/docs/pdf/whitepaper/Enhanced DST_Tech_Paper.pdf , TP-302.1 June 2000
Smith, Date “The challenges of testing SATA and SAS; Part 2: primitives and frames”, Computer Technology Review, Feb. 2004

134
Stevens, Curtis C. “BIST SCT Command Proposal” T13.org, T13/e04148r01, December 7, 2004 http://www.t13.org/docs2004/e04148r1_BIST_Proposal.pdf
Thiagarajan Trichy, Peter Andborn, Ravi Raghavan, and Shubhada Sahasrabudhe. “A New Test/Diagnosis/Rework Model for Use in Technical Cost Modeling of Electronic Systems Assembly.” IEEE Proceedings of the International Test Conference, 2001. Page 1108-1113.
Tzu Sun, “The Art of War” Translated by Samuel B. Griffith, Oxford University Press, London, Oxford, New York, 1963
Volkerink, Eric H., Khoche Ajay, Kamas, Linda A., Rivoir, Jochen, Kerkhoff, Hans G. “Tackling Test Tradeoffs from Design, Manufacturing to Market Using Economic Modeling”. IEEE Proceedings of the International Test Conference, 2001. Page 1098-1107.
Williams, D.; “PC manufacturing test in a high volume environment”; Proceedings of International Test Conference, 1999, 28-30 Sept. 1999 Pages:698 - 704
Williams, D.; Ambler, A.P “Test Coverage for System Test?”; Proceedings of International Test Conference, 2002. Pages: 1185
Williams, D.; Ambler, A.P. “System manufacturing test cost model”; Proceedings of International Test Conference, 7-10 Oct. 2002 Pages: 482 – 490
Williams, R.L. “Engineering-to-manufacturing-to-field test strategies status report 1992”AUTOTESTCON '92. IEEE Systems Readiness Technology Conference, Conference Record Page(s): 313 -318

135
Vita
David Franklin Williams was born in Portsmouth Virginia on September 25, 1967
to Rita and Egbert Williams. He graduated from the University of North Florida in
Jacksonville in 1995 with a Bachelors of Science degree in Electrical Engineering. He
got a Masters of Science in Electrical Engineering from the University of Texas at Austin
in December 1998. The Author worked from 1986 to 1995 as an Electronic
Measurement Equipment Mechanic at the Naval Aviation Depot in Jacksonville Florida.
He has worked at Dell Incorporated from 1996 to the present. His publications include:
Giuma, T.A.; Holt, P.; Williams, D.; Multimedia tools in electrical engineering
laboratories, Proceedings of the IEEE Southeastcon '96. 11-14 April 1996 Pages: 529
– 532
Williams, D.; PC manufacturing test in a high volume environment; Proceedings
of International Test Conference 1999, 28-30 Sept. 1999. Pages: 698 - 704
Williams, D.; Ambler, A.P Test Coverage for System Test?; Proceedings of
International Test Conference, 2002. Pages: 1185
Williams, D.; Ambler, A.P.; System manufacturing test cost model; Proceedings
of International Test Conference 2002, 7-10 Oct. 2002. Pages: 482 - 490
Williams, David; Ambler, A.P.; Data Collection in a System Manufacturing
Environment; 1st IEEE International Workshop on System Test and Diagnosis; October
2000
Permanent address: 1704 Brandon Keller Ct.
Pflugerville, Texas 78660
This dissertation was typed by the Author.


