Coupled Flip-Flop Model for REM Sleep Regulation in theRatJustin R. Dunmyre1,4, George A. Mashour2,3, Victoria Booth1,2,3*
1 Department of Mathematics, University of Michigan, Ann Arbor, Michigan, United States of America, 2 Department of Anesthesiology, University of Michigan Medical
School, Ann Arbor, Michigan, United States of America, 3 Neuroscience Graduate Program, University of Michigan, Ann Arbor, Michigan, United States of America,
4 Department of Mathematics, Frostburg State University, Frostburg, Maryland, United States of America
Abstract
Recent experimental studies investigating the neuronal regulation of rapid eye movement (REM) sleep have identifiedmutually inhibitory synaptic projections among REM sleep-promoting (REM-on) and REM sleep-inhibiting (REM-off)neuronal populations that act to maintain the REM sleep state and control its onset and offset. The control mechanism ofmutually inhibitory synaptic interactions mirrors the proposed flip-flop switch for sleep-wake regulation consisting ofmutually inhibitory synaptic projections between wake- and sleep-promoting neuronal populations. While a number ofsynaptic projections have been identified between these REM-on/REM-off populations and wake/sleep-promotingpopulations, the specific interactions that govern behavioral state transitions have not been completely determined. Usinga minimal mathematical model, we investigated behavioral state transition dynamics dictated by a system of coupled flip-flops, one to control transitions between wake and sleep states, and another to control transitions into and out of REMsleep. The model describes the neurotransmitter-mediated inhibitory interactions between a wake- and sleep-promotingpopulation, and between a REM-on and REM-off population. We proposed interactions between the wake/sleep and REM-on/REM-off flip-flops to replicate the behavioral state statistics and probabilities of behavioral state transitions measuredfrom experimental recordings of rat sleep under ad libitum conditions and after 24 h of REM sleep deprivation. Reliabletransitions from REM sleep to wake, as dictated by the data, indicated the necessity of an excitatory projection from theREM-on population to the wake-promoting population. To replicate the increase in REM-wake-REM transitions observedafter 24 h REM sleep deprivation required that this excitatory projection promote transient activation of the wake-promoting population. Obtaining the reliable wake-nonREM sleep transitions observed in the data required that activity ofthe wake-promoting population modulated the interaction between the REM-on and REM-off populations. This analysissuggests neuronal processes to be targeted in further experimental studies of the regulatory mechanisms of REM sleep.
Citation: Dunmyre JR, Mashour GA, Booth V (2014) Coupled Flip-Flop Model for REM Sleep Regulation in the Rat. PLoS ONE 9(4): e94481. doi:10.1371/journal.pone.0094481
Editor: Gennady Cymbalyuk, Georgia State University, United States of America
Received November 1, 2013; Accepted March 17, 2014; Published April 10, 2014
Copyright: � 2014 Dunmyre et al. This is an open-access article distributed under the terms of the Creative Commons Attribution License, which permitsunrestricted use, distribution, and reproduction in any medium, provided the original author and source are credited.
Funding: This work was supported by NSF DMS-1121361 (JRD, VB), NIH RO1GM098578 (GAM) and the James S. McDonnell Foundation (GAM). The funders hadno role in study design, data collection and analysis, decision to publish, or preparation of the manuscript.
Competing Interests: The authors have declared that no competing interests exist.
* E-mail: [email protected]
Introduction
Theories on the neuronal control for rapid eye movement
(REM) sleep have been dominated by the cholinergic hypothesis
(see [1] for review). Based on a wealth of experimental evidence
collected since the identification of REM sleep in the 1950s [2],
the cholinergic hypothesis posits that the REM sleep state is
initiated and maintained by the activity of cholinergic neurons in
areas of the pons, including the laterodorsal and pedunculopontine
tegmental nuclei (LDT/PPT). This hypothesis is synthesized in the
reciprocal interaction model [3,4] for REM sleep in which regular
transitions between REM and nonREM (NREM) sleep are
generated by excitatory and inhibitory synaptic projections
between the cholinergic REM-promoting (REM-on) LDT/PPT
and monoaminergic, REM-suppressing (REM-off) neuronal pop-
ulations including the locus coeruleus (LC) and the dorsal raphe
(DR).
Recent experimental results have challenged the cholinergic
hypothesis for REM sleep control with the identification of several
additional neuronal groups with REM-on and REM-off activity
profiles [5–7]. In the rat, REM-on groups include the sublater-
odorsal tegmental nucleus (SLD), portions of the ventrolateral
periaqueductal gray matter (vlPAG), areas of the lateral hypothal-
amus (LH) and the dorsal paragigantocellular nucleus (DPGi).
Neuronal groups with REM-off activity profiles include other
portions of the vlPAG and the dorsal part of the deep
mesencephalic nucleus (dDPME). Based on the identification of
these REM-associated neuronal groups and their synaptic
interactions, alternative theories for the neuronal control of
REM sleep have been proposed wherein GABA is the primary
neurotransmitter and mutually inhibitory synaptic interactions
govern activity of these groups and thus transitions of REM sleep
[5,7]. However, debate continues as to which of these GABAergic
populations are integrally responsible for generating transitions
into and out of REM sleep. For example, Lu and colleagues [5]
propose that REM regulation is controlled by a core REM-on/
REM-off flip-flop switch composed of mutually inhibitory
(GABAergic) synaptic projections between REM-off neurons in
the vlPAG and adjacent lateral pontine tegmentum (LPT), and
REM-on neurons in the SLD. On the other hand, Luppi and
PLOS ONE | www.plosone.org 1 April 2014 | Volume 9 | Issue 4 | e94481

colleagues [8] propose that REM sleep transitions are controlled
by a more distributed network of inhibitory projections among
REM-off neurons in the vlPAG and dDPME, and REM-on
neurons in the vlPAG, LH and DPGi.
Another factor influencing REM sleep generation is the REM
sleep homeostatic drive. Multiple studies have provided evidence
that REM sleep is homeostatically regulated independently from
NREM sleep [9,10]. For example, increases in attempts to
transition into REM sleep have been observed during REM sleep
deprivation studies in which these transitions are prevented, and
REM sleep rebound reliably occurs during recovery sleep from
periods of REM sleep deprivation as short as 2 hours [10].
Additionally, anesthetics have differential effects in terms of
satisfying the needs of NREM and REM sleep following sleep
deprivation, suggesting separate mechanisms for NREM and
REM sleep homeostasis. In particular, anesthesia induced by the
inhaled anesthetic sevoflurane following total sleep deprivation
eliminated homeostatic increases in NREM sleep but not in REM
sleep [11]. The physiological substrate dictating REM sleep
homeostasis has not been identified. Recent studies have suggested
that melanin-concentrating hormone (MCH) [12] or the satiety
molecule Nesfatin-1 [13] may be involved. Additionally, metabolic
activation of neurons in preoptic areas of the hypothalamus has
been found to be strongly related to homeostatic pressure for REM
sleep in REM sleep deprivation studies [14]. Analysis of sleep
patterns during REM rebound and recovery following sleep
deprivation have suggested that REM sleep may be regulated on
both short-term and long-term time scales [15,16]. The longer
time-scale regulates the daily amount of REM sleep and the short-
term process dictates transitions between NREM and REM sleep
during sleep episodes [15].
Taken together, the proposed mutually inhibitory network of
neuronal populations governing transitions of REM sleep, coupled
with a REM sleep homeostatic drive, mirrors the proposed flip-
flop switch for sleep regulation composed of mutually inhibitory
synaptic projections between the wake-promoting monoaminergic
populations locus coeruleus (LC) and dorsal raphe (DR) and the
sleep-promoting GABAergic ventral lateral preoptic nucleus
(VLPO), under the influence of the putative adenosine-mediated
homeostatic sleep drive [17]. How these two flip-flops may be
coupled to produce transitions between wake, NREM and REM
sleep observed in the majority of mammalian species is not
completely determined. Synaptic projections from the wake-
promoting LC and DR targeting REM-on and REM-off neuronal
groups have been identified that act to suppress REM sleep
[8,18,19]. However, limitations in recording simultaneously from
these multiple areas at spatial and temporal resolutions to
determine causal patterns of activity and interaction for transitions
into and out of sleep and wake states hamper the ability to confirm
or refute this and competing hypotheses of the sleep-wake
regulatory network.
Recently, physiologically-based mathematical models have been
introduced as a means to test the different and competing
hypotheses for the sleep-wake regulatory network [20–25]. In
previous work, we used a modeling formalism for the neurotrans-
mitter-mediated interactions among wake-, sleep- and REM-sleep
neuronal populations to investigate the cholinergic hypothesis for
REM sleep generation in rats [24]. Here, we apply the same
modeling formalism and develop a coupled flip-flop model to
investigate how a wake/sleep flip-flop and a REM-on/REM-off
flip-flop can interact to produce accurate behavioral state
transition dynamics for the rat. We use experimental recordings
of rat sleep behavior under ad libitum (baseline) conditions and
during REM sleep rebound after 24 h of REM sleep deprivation
to motivate a minimal set of projections between the flip-flops to
account for sleep-wake patterns in both conditions.
The dynamics of a single mutually inhibitory flip-flop model
have been well studied in the context of governing the transitions
between wake and sleep states under control of a homeostatic sleep
drive [21,26,27]. As we and others have shown previously, the
dynamics are those of movement around a hysteresis loop with the
homeostatic drive increasing and decreasing through bifurcation
points to induce transitions between low and high population
activity levels. As we discuss below, hysteresis loop dynamics have
an inherent symmetry and regularity that may seem incompatible
with the highly variable sleep-wake activity patterns of the rat. As
in our previous modeling study of rat sleep-wake patterns [24], we
include in our coupled flip-flop model several physiologically
motivated stochastic components that introduce noise in our
model solutions. To understand the implications of underlying
hysteresis loop dynamics, we present a detailed analysis of the
effects of the stochastic components on simulated bout durations
for a single flip-flop model.
Results
Dynamics of a single flip-flopIn this section we briefly review the hysteresis loop dynamics of
a single flip-flop and analyze the effects on these dynamics of
physiologically motivated sources of noise. The goal of this analysis
is to understand how the inherent symmetric and regular
dynamics of a hysteresis loop can be modulated to simulate the
variability of rat sleep-wake behavior, including the reported
qualitative differences in the distributions of wake and sleep bout
durations [28].
Hysteresis loop dynamics of a single flip-flop. We
consider the wake/sleep flip-flop consisting of wake-promoting
and sleep-promoting populations with reciprocal inhibitory
neurotransmitter-mediated projections between them (Fig. 1A).
The dynamics of the REM-on/REM-off flip-flop are analogous.
In the figure, rectangles represent neuronal groups and are labeled
with their firing rate variables, fW (t) and fS(t), while circles
represent neurotransmitter concentrations expressed by the
neuronal groups and are labeled with their variable names,
cW (t) and cS(t). The wake/sleep flip-flop represents the mutually
inhibitory synaptic interactions between the wake-promoting locus
coeruleus (LC), dorsal raphe (DR) and the tuberomammilary
nucleus (TMN) (jointly represented by fW ) with the sleep-
promoting ventrolateral preoptic nucleus (VLPO, fS) [17]. The
model VLPO population expresses the inhibitory neurotransmitter
GABA (cS) while the neurotransmitter expressed by the model
wake population represents the joint effects of the transmitters
expressed by LC, DR and TMN, namely norepinephrine,
serotonin and histamine, respectively (cW ). We constructed the
model using our previously developed neuronal population firing
rate and neurotransmitter formalism [24] (see Methods and Model
section). Briefly, in this formalism, the firing rate of a pre-synaptic
population, fX (t) (in Hz), induces expression of neurotransmitter
concentration, cX (t), which, in turn, acts as input to post-synaptic
populations (see Eqs. (1), (2) with X ,Y = W ,S).
In the flip-flop, transitions between sleep and wake states are
governed by the homeostatic sleep drive, h(t), that describes the
universally recognized propensity for sleep that increases during
time awake and decreases during sleep, and is thought to involve
the neuromodulator adenosine (reviewed in [29]). As such, hincreases when fW is at a high level (fWwhW ) simulating the
wake state (Fig. 1B, see Eq. (5)). Increasing values of h cause the
sleep-promoting population to activate and force a transition to
Coupled Flip-Flop Model for REM Sleep Regulation
PLOS ONE | www.plosone.org 2 April 2014 | Volume 9 | Issue 4 | e94481

the state in which fS is at a high level and fW is at a low level,
simulating sleep. As fW drops to a low level (fWƒhW ), hdecreases until it deactivates fS causing a transition back to the
fW dominant state or simulated waking.
Relative to the time scale of transitions between the simulated
waking and sleep states, the homeostat h(t) is slowly varying. For
this analysis, we consider a separation of timescales, in which the
variables fW , fS, cW and cS vary on a timescale faster than that
of h. We call Eqs. (1) and (2) governing variables (fW ,fS,cW ,cS)the fast subsystem, and Eq. (5) governing h the slow subsystem.
Here, we briefly summarize the intuition behind this fast-slow
decomposition; for a rigorous review see [30–32] and for a
previous analysis on a related model see [33].
We treat h as a slowly varying parameter of the fast subsystem.
For a fixed value of h, solutions to the fast subsystem approach a
stable fixed point, the value of which may depend on the initial
condition. The value of fW at this fixed point dictates if h will
increase or decrease in the full model. Slow variations in h are
instantly reflected by the convergence of the fast subsystem to a
new stable fixed point. Thus, we may track the trajectory of the full
model as a slow evolution through stable fixed point solutions of
the fast subsystem.
The fixed point solutions, for fW , of the fast subsystem as a
function of h form a Z-shaped curve, as plotted in the bifurcation
diagram in Fig. 1C. The upper (red) and lower (blue) branches are
stable solutions. They are joined by an unstable branch of
solutions (dashed) at saddle-node bifurcations occurring at a high
value of h, h~RKW referred to as the ‘‘right knee’’, and at a low
value of h, h~LKW referred to as the ‘‘left knee’’. Plotted on top
of these fixed point solutions of the fast subsystem is the trajectory
of the full model when h is allowed to evolve according to the slow
subsystem (light blue curve). The Z-shaped curve of fast subsystem
solutions forms the basis for hysteresis loop dynamics of the full
model. When fW is at a high level (fWwhW , dotted line), h slowly
increases and the fast subsystem variables remain attracted to the
upper branch of fixed points. As h increases beyond the right knee
of the curve at h~RKW , the only stable solution of the fast
subsystem corresponds to low values of fW and the trajectory
quickly approaches the lower branch of fixed points. On this
branch fWƒhW , so h decreases and the full model trajectory
tracks the lower branch of fixed points until the saddle-node
bifurcation at h~LKW . As h decreases below the left knee, the
only stable solutions for the fast subsystem are on the upper branch
and the trajectory jumps up, thus completing one cycle of the
hysteresis loop, or one sleep-wake cycle.
Bout durations and the influence of variability. In the
flip-flop model during one sleep-wake cycle, or one cycle around
the hysteresis loop, wake and sleep bout durations are determined
Figure 1. A: Schematic for the single wake/sleep flip-flop model. Rectangles represent neuronal groups and are labeled with their firing ratevariables: fW for wake-promoting and fS for sleep-promoting. Circles represent neurotransmitter concentrations expressed by the neuronal groupsand are labeled with the variable names: cW for the monoaminergic transmitters of the wake-promoting populations and cS for GABA expressed bythe sleep-promoting population. The triangle represents the homeostatic sleep drive (h). Solid lines ending in filled circles represent inhibitorysynaptic projections. Large open arrow (d(t)) represents random excitatory stimuli to the wake-promoting population from sources external to thenetwork. B: Time traces for fW , fS, cW , cS (upper panel) and h (lower panel). C: Bifurcation diagram of fixed point solutions of the fast subsystem(Eqs. (1), (2) with h treated as a fixed parameter. The upper (red) and lower (blue) branches indicate stable solutions which are joined through abranch of unstable solutions (gray dashed) at saddle-node bifurcations occurring at h~RKW (right knee) and h~LKW (left knee). The orange curveis the trajectory of the full model projected onto the h{fW plane. Horizontal dashed line indicates hW , the fW threshold defining the wake state.doi:10.1371/journal.pone.0094481.g001
Coupled Flip-Flop Model for REM Sleep Regulation
PLOS ONE | www.plosone.org 3 April 2014 | Volume 9 | Issue 4 | e94481

by the time the trajectory takes to traverse the upper and lower
branches, respectively, of the Z-shaped curve of fixed point
solutions of the fast subsystem (Fig. 1C). Thus, bout durations are
governed by the distance jRKW {LKW j and the time dynamics of
h. Asymmetry in wake and sleep bout durations can be introduced
by different values of h time constants during its increasing and
decreasing phases, dictated by th,up and th,down in our model. The
time evolution of h, and thus bout durations, are further influenced
by the values of RKW and LKW relative to the maximum and
minimum limits on values of h, hmax and hmin, respectively. Since h
follows exponential dynamics, the evolution of h is slower when h
approaches either hmax or hmin, and is faster if h is near hmin but
increasing or h is near hmax but decreasing. Thus, asymmetry in
bout durations is also introduced due to the location of the Z-
shaped curve within the interval (hmin,hmax).
As an example of how these two factors can compete in
introducing asymmetry of bout durations, the longer wake bouts
(460s) compared to sleep bouts (280s) shown in Fig. 1B were
obtained with a faster h time constant during simulated wake
(th,up~600s) than during simulated sleep (th,down~700s), but with
a shorter distance between RKW and hmax than the distance
between LKW and hmin. Hence, despite a faster time constant for h
while the trajectory is on the upper branch of the Z-shaped fixed
point curve, the evolution of h is slower than on the lower branch
because of the proximity of h values to hmax.
A physiological flip-flop switch would be subject to different
sources of variability. Here, we summarize our analysis of how
physiologically motivated sources of noise, which we include in our
models [24], perturb hysteresis loop dynamics; see Appendix S1
for complete details. First, we consider the effects of variability in
neurotransmitter expression, modeled by multiplicatively scaling
the steady state neurotransmitter expression functions cX?
(X~W ,S) in Eq. (4) by the randomly varying term jX (t). The
amplitude of jX randomly varied (with uniform distribution and
unit mean) at discrete times dictated by a Poisson process. In the
single wake/sleep flip-flop model, jW (jS ) affects the steady state
expression levels of monoamines (GABA) by the wake-promoting
(sleep-promoting) population and thus modulates the level of
synaptic inhibition between populations. As jW , jS take on
different values, in an interval around 1, they affect the Z-shaped
fixed point curve, and thus the hysteresis loop, by changing the
values of RKW and LKW . The distance between RKW and LKW
Figure 2. Effects of model variability on hysteresis loop dynamics of a single flip-flop. A, B: Variable neurotransmitter expression levelsmodulate position of the knees of the Z-shaped curve of fixed point solutions of the deterministic model (shown for reference with the deterministictrajectory (orange curve) in A). The projection of the noisy model trajectory (A: black curve) onto the bifurcation diagram illustrates the perturbationsto the underlying hysteresis loop that result in variable wake and sleep bout durations illustrated in the time traces for fW , fS, cW , cS (B: upperpanel) and h (B: lower panel). C,D: Random excitatory inputs to the wake-promoting population perturb the model trajectory (C: black curve) as itevolves around the deterministic hysteresis loop (Z-shaped curve of fixed point solutions and deterministic trajectory (orange curve) shown forreference in C), resulting in wake bouts with brief and longer durations, and sleep bouts with variable durations, as illustrated in the time traces forfW , fS, cW , cS (D: upper panel) and h (D: lower panel).doi:10.1371/journal.pone.0094481.g002
Coupled Flip-Flop Model for REM Sleep Regulation
PLOS ONE | www.plosone.org 4 April 2014 | Volume 9 | Issue 4 | e94481
decreases for jW and jS values less than 1 and increases for values
greater than 1 (Fig. S1). This effect on the width of the hysteresis
loop is a direct result of decreases and increases in inhibition
between populations.
As jW and jS independently vary randomly around 1, the
hysteresis loop randomly changes shape and position leading to
variations in wake and sleep bout durations (Fig. 2A,B). Given that
variations in jW and jS induce both lengthening and shortening of
the hysteresis loop, one might expect that the variable bout
durations would be symmetrically distributed about the bout
durations dictated by the deterministic model. Our analysis
indicates, however, that the distributions of bout durations depend
sensitively on the relative time scales of the variability (i.e. the
average frequency of jW and jS random variations) and the
deterministic bout durations. In the noisy flip-flop model, the
majority of bout durations are shorter than the durations of the
deterministic model and they are distributed with a tail of longer
durations (Fig. S2). Differences in the location of the Z-shaped
fixed point curve in the (hmin,hmax) interval can introduce
significant differences in the extent of the positive tail for wake
or sleep bouts.
The second source of physiologically motivated variability we
include in our model is brief, random excitatory stimuli input to
the wake-promoting population, d(t), representing external inputs
from brain areas not included in the model such as sensory or
cortical areas. The inputs have random amplitude, decay with a
fixed time constant and occur at discrete times dictated by a
Poisson process. They do not modulate the hysteresis loop, but
instead perturb the trajectory as it evolves around the deterministic
hysteresis loop (Fig. 2C,D). If a stimulus occurs during a wake
bout, the trajectory is perturbed to higher fW values which may
extend the wake bout if the trajectory is close to RKW . If the
stimulus occurs during a sleep bout, it may result in a brief
activation of fW with a return to the sleep state, which we define
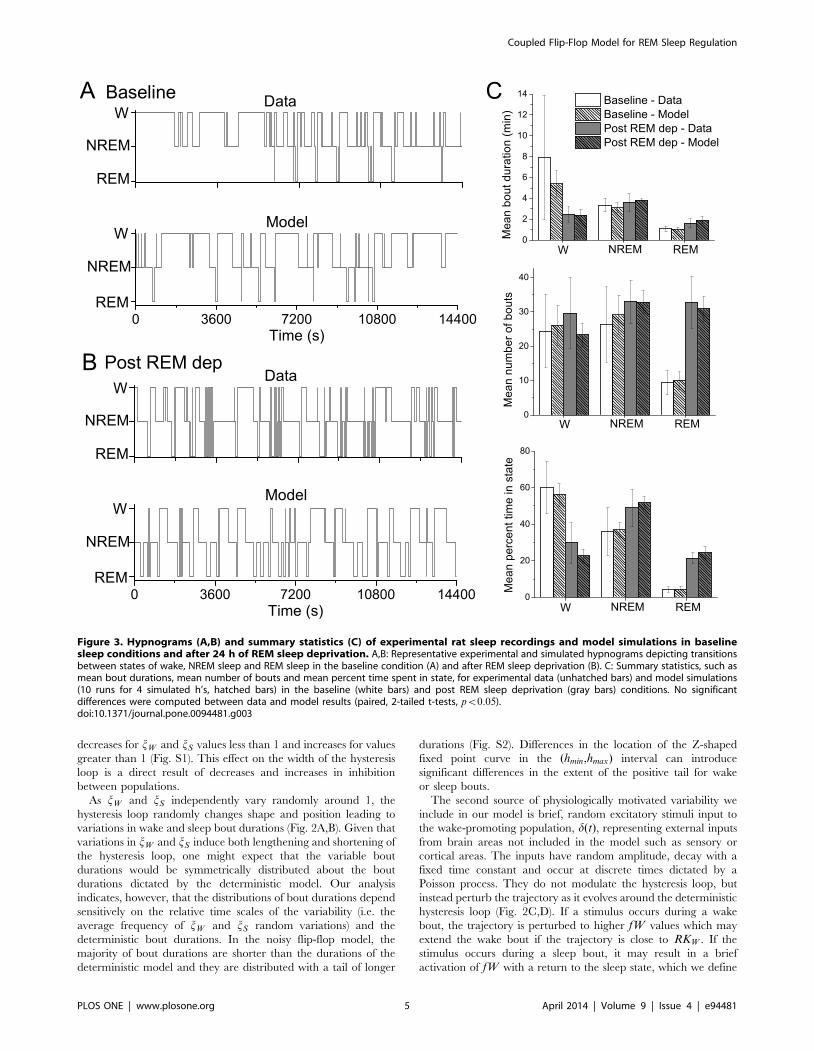
Figure 3. Hypnograms (A,B) and summary statistics (C) of experimental rat sleep recordings and model simulations in baselinesleep conditions and after 24 h of REM sleep deprivation. A,B: Representative experimental and simulated hypnograms depicting transitionsbetween states of wake, NREM sleep and REM sleep in the baseline condition (A) and after REM sleep deprivation (B). C: Summary statistics, such asmean bout durations, mean number of bouts and mean percent time spent in state, for experimental data (unhatched bars) and model simulations(10 runs for 4 simulated h’s, hatched bars) in the baseline (white bars) and post REM sleep deprivation (gray bars) conditions. No significantdifferences were computed between data and model results (paired, 2-tailed t-tests, pv0:05).doi:10.1371/journal.pone.0094481.g003
Coupled Flip-Flop Model for REM Sleep Regulation
PLOS ONE | www.plosone.org 5 April 2014 | Volume 9 | Issue 4 | e94481

as a brief wake bout, or result in a full transition to the wake state.
Which result occurs is influenced by the position of the trajectory
on the lower branch of the Z-shaped fixed point curve when the
stimulus arrives. Stimuli occurring when the trajectory is closer to
LKW usually result in a transition to wake and stimuli occurring
when the trajectory is closer to RKW usually result in a brief wake
bout. This dependence is due to whether the stimulus pushes fW
above the middle branch of unstable fixed point solutions which
generally acts as a separatrix between the basins of attraction of
the upper and lower branches of stable fixed point solutions.
The random excitatory stimuli to the wake-promoting popula-
tion have different effects on the wake and sleep bout duration
distributions (Fig. S2). The wake bout distribution is bimodal with
a peak at very short durations indicating the brief wake bouts
induced by the stimuli and a peak at longer durations for the bouts
generated through hysteresis loop dynamics. The distribution of
sleep bout durations takes on a more exponential-shape because
sleep bouts are interrupted at random times by either brief wake
bouts or early transitions to wake. Thus, an external input that
preferentially targets one of the flip-flop populations can yield
sleep-wake patterns with qualitative differences in wake and sleep
bout durations.
Coupled flip-flop model for rat sleep-wake regulationAs the above analysis suggests, a single flip-flop with multiple
sources of variability and appropriately tuned parameters would
be able to generate transition dynamics between states of wake and
sleep, or between states of NREM and REM sleep, similar to those
observed in the rat. The goal of this study was to investigate how a
wake/sleep flip-flop and a REM-on/REM-off flip-flop can be
coupled to reproduce transition dynamics among the three states
of wake, NREM sleep and REM sleep in rat. To constrain model
parameter settings and network structure, we analyze experimen-
tal recordings of rat sleep behavior under ad libitum (baseline)
conditions and during REM sleep rebound after 24 h of REM
sleep deprivation. Specifically, we consider data collected during a
4 h window in the light period (rest phase) at the same circadian
phase for both conditions. We assume minimal modulation of
sleep-wake behavior by the 24 h circadian rhythm during this 4 h
window and, thus, do not include the influence of the circadian
rhythm in the model. As we describe below, analysis of the data
motivated a minimal set of projections between the flip-flops to
account for sleep-wake patterns in both conditions. These
projections include an effect of activity of the wake population
on the REM sleep homeostat and an excitatory effect of activation
of the REM-on population to the wake-promoting population.
As shown in Fig. 3, simulation results of our coupled flip-flop
model were able to reproduce sleep-wake dynamics that were
statistically similar to the experimentally recorded rat behavior
under both conditions. Specifically, mean bout durations, number
of bouts and percent time spent in each state for wake, NREM
sleep and REM sleep, as well as probabilities (Table 1) were similar
to the experimental data (paired, 2-tailed t-tests, pv0:05). In this
section, we first describe the key features of the experimental data
that informed the model network structure and parameter settings.
We then describe how the model was constructed to account for
these key features, resulting in model dynamics similar to the data.
Rat sleep-wake behavior in baseline conditions and after
24 h REM sleep deprivation. As previously reported for these
experiments [34], rats showed a statistically significant increase in
the percent time spent in REM sleep after 24 h of REM sleep
deprivation compared to baseline conditions (Fig. 3C). Additional
analysis revealed that the REM sleep increase was due to a large
increase in the number of REM bouts as well as an increase in
mean REM bout durations. The percent time spent awake also
significantly decreased in the post-REM deprivation condition due
to a trend towards shorter wake bouts. In particular, in baseline
sleep conditions each rat had at least 1 wake bout of duration
around 30 minutes, and 2 of the 5 rats had maximum wake bout
durations of an hour or longer, accounting for the large variability
in mean wake bout durations. In contrast, after REM sleep
deprivation the longest wake bout any of the 5 rats exhibited was
just over 30 minutes and the variability in durations was much
reduced. This higher pressure for sleep in general and REM sleep
particularly suggests that the REM sleep deprivation did not
exclusively affect REM sleep homeostasis, but also influenced
NREM sleep homeostasis.
Analyzing the probabilities of behavioral state transitions from
the experimental recordings under baseline and post-REM sleep
deprivation identified some key features of state transition
dynamics that we used to construct the interactions between the
wake/sleep and REM-on/REM-off flip-flops in our model
(Table 1). As is characteristic of normal rodent sleep patterning,
the probability was higher for the termination of a REM sleep
bout by a transition into the wake state than by a transition to
NREM sleep. The data suggests that the responsible mechanisms
must be fairly robust as the probabilities were very similar in the
two conditions. In the baseline condition, the data exhibited the
normal sleep pattern in which sleep initiates in NREM sleep with
the transition to REM sleep occurring after a latency period.
Specifically, 4 out of 5 rats always transitioned from wake to
NREM sleep. For the 1 rat that showed several wake-REM
Table 1. Probabilities of behavioral state transitions.
Data Model
Baseline Post REM-dep Baseline Post REM-dep
From Wake To NREM 0:9742+0:0577 0:7358+0:1405 0:9816+0:0311 0:7950+0:0877
To REM 0:0258+0:0577 0:2642+0:1405 0:0184+0:0311 0:2050+0:0877
From NREM To Wake 0:6449+0:0821 0:2331+0:0561 0:6705+0:0985 0:2154+0:0679
To REM 0:3551+0:0821 0:7669+0:0561 0:3295+0:0985 0:7846+0:0679
From REM To Wake 0:5962+0:1927 0:6236+0:1894 0:6246+0:1543 0:5190+0:0802
To NREM 0:4038+0:1927 0:3764+0:1894 0:3754+0:1543 0:4810+0:0802
Probabilities of behavioral state transitions computed from the experimental sleep recordings under baseline and post-REM sleep deprivation conditions, andcomputed from 10 simulation runs of the coupled flip-flop model under each simulated condition.doi:10.1371/journal.pone.0094481.t001
Coupled Flip-Flop Model for REM Sleep Regulation
PLOS ONE | www.plosone.org 6 April 2014 | Volume 9 | Issue 4 | e94481

transitions, these transitions occurred exclusively as an interrup-
tion of REM sleep by a brief wake bout of duration 10–30 s, thus
occurring as a REM-wake-REM transition. In the post-REM sleep
deprivation condition, all 5 rats exhibited wake-REM transitions
with the mean transition probability increasing to just over 25%.
Again, these transitions occurred exclusively, in all rats, as REM-
wake-REM transitions where the intervening wake bout was of
brief duration (10–30 s). These findings suggest that the mecha-
nisms by which REM sleep is terminated promote initiation of
activity in wake-promoting populations but do not participate in
the maintenance of that activity.
Replicating stereotypical wake-NREM-REM transition
dynamics. In this section we describe how obtaining the
stereotypical state transition pattern of wake to NREM sleep to
REM sleep motivated the inclusion of an effect of activity of the
wake population on the REM sleep homeostat in our coupled flip-
flop model. As a starting point, we describe the dynamics of the
coupled model using fast-slow decomposition. The coupled flip-
flop model (Fig. 4A) consists of two pairs of neuronal populations,
each pair reciprocally coupled by neurotransmitter-mediated
inhibition, representing a wake/sleep flip-flop, with population
firing rates and neurotransmitter levels modeled by Eqs. (1) and (2)
with X ,Y~W ,S, and a REM-on/REM-off flip-flop, with
population firing rates and neurotransmitter levels modeled with
Eqs. (1) and (2) with X ,Y~Ron,Roff . The REM-on population
(fRon) represents the joint activity of identified REM sleep-
promoting populations and its neurotransmitter (cRon) represents
their joint GABAergic signaling. The REM-off population (fRoff )
and its neurotransmitter (cRoff ) represent the GABAergic signal-
ling of the identified areas with REM-off activity. Transitions in
Figure 4. Schematic of the coupled flip-flop sleep-wake regulatory network model. Rectangles represent neuronal groups and are labeledwith their firing rate variables: fW for wake-promoting, fS for sleep-promoting, fRon for REM-promoting (REM-on), fRoff for REM-suppressing (REM-off). Circles represent neurotransmitter concentrations expressed by the neuronal groups and are labeled with the variable names: cW for themonoaminergic transmitters of the wake-promoting populations, cS, cRon and cRoff for GABA expressed by the sleep-promoting, REM-promotingand REM-suppressing groups, respectively. Triangles represent the homeostatic drives for sleep (h) and REM sleep (stp). Solid lines ending in filledcircles represent inhibitory synaptic projections; dashed lines indicate our proposed interactions between the flip-flops (filled circle indicates activity-suppressing, arrow indicates activity-promoting). Large open arrow (d(t)) represents random excitatory stimuli to the wake-promoting population
from sources external to the network. B,C: Time traces for fW , fS (B, upper panel), h (B, lower panel), fRon, fRoff (C, upper panel) and stp (C, lowerpanel) for the simulated baseline sleep shown in Fig. 3A.doi:10.1371/journal.pone.0094481.g004
Coupled Flip-Flop Model for REM Sleep Regulation
PLOS ONE | www.plosone.org 7 April 2014 | Volume 9 | Issue 4 | e94481

the sleep-wake flip-flop are governed by the homeostatic sleep
drive, h(t), modeled by Eq. (5). As described above, h increases
during waking (fWwhW ) to promote activation of the sleep-
promoting population and the transition into sleep, and decreases
during sleep (fWƒhW ) to promote deactivation of the sleep-
promoting population. In the REM-on/REM-off flip-flop, tran-
sitions are governed by the REM sleep homeostatic drive modeled
by the variable stp, as a reference to the hypothesized short-term
process involved in REM sleep homeostasis [15], using Eq. (6). To
replicate the reported phenomena of REM sleep homeostasis, we
model stp as increasing during NREM sleep (fRonƒhRon ) to
promote deactivation of the REM-off population and the
transition into REM sleep, and decreasing during REM sleep
(fRonwhRon ) to promote activation of the REM-off population.
This implementation of the REM sleep homeostatic drive is
consistent with the concept that NREM-REM cycling is a sleep-
dependent process [9,15] and it generates cycling solutions that
are robust to variations in parameter values, such as strength of
inhibition between the REM-on and REM-off populations, as
shown in previous analysis [27]. Additionally, we include
variability in all neurotransmitter expression and brief random
excitatory stimuli to the wake-promoting population (d(t) in
Fig. 4A).
Qualitatively we can understand the dynamics of these two flip-
flops during normal sleep behavior as follows (Fig. 4B,C): during
the wake state, the wake-promoting population is activated and h
increases. To mimic the activity of identified physiological REM-
off neuronal areas [8], the REM-off population is activated and
the REM-on/REM-off flip-flop does not exhibit any transitions.
When increasing h forces activation of the sleep-promoting
population, a sleep episode is initiated, h starts to decrease and
stp starts to increase. A sleep episode may be terminated at any
time by deactivation of the sleep-promoting population as
governed by h and a return to the wake state, or may be
interrupted by a brief wake bout generated by the random
excitatory stimuli to the wake-promoting population, d(t). As a
sleep episode continues, however, increasing stp will deactivate the
REM-off population, allowing the REM-on population to activate
and a REM bout to occur. During a REM bout, stp decreases and
the REM bout can terminate due to activation of the REM-off
population which returns the model to the NREM sleep state.
Alternatively, the REM bout can be terminated by a brief wake
bout. Eventually, the sleep episode ends when h reaches a
sufficiently low level resulting in deactivation of the sleep-
promoting population and reactivation of the wake-promoting
population.
Figure 5. Coupled flip-flop model dynamics replicating wake-NREM-REM transition pattern. Hypnogram depicting state transitiondynamics (A), homeostatic sleep drive h(t) (B) and REM sleep homeostatic drive stp(t) (C) in the deterministic model (all sources of variabilityremoved) during REM/NREM cycling (red portion of curves) followed by a prolonged wake bout (light blue portion) and a subsequent return to REM/NREM cycling (orange and dark blue portion). D: Z-shaped curve of fW fixed point solutions (Z) of the fast subsystem of the wake/sleep flip-flop withh as a bifurcation parameter, with the projection of the trajectory of the full model onto the h-fW plane. The dashed line corresponds to thethreshold hW determining the wake state E: S-shaped curve of fixed point solutions (S) of the fast subsystem of the REM/NREM flip-flop, with stp as abifurcation parameter, with the projection of the trajectory of the full model onto stp-fRon space.doi:10.1371/journal.pone.0094481.g005
Coupled Flip-Flop Model for REM Sleep Regulation
PLOS ONE | www.plosone.org 8 April 2014 | Volume 9 | Issue 4 | e94481

To quantitatively understand transition dynamics in the coupled
flip-flop model, we extend the fast-slow decomposition analysis to
define two hysteresis loops that dictate trajectory dynamics, one
defined by the wake/sleep flip-flop and the other by the REM-on/
REM-off flip-flop. Informally, we consider both homeostatic drives
as slow variables in the coupled flip-flop model with the
homeostatic sleep drive h acting on a slower time scale than the
REM sleep homeostatic drive stp. The firing rate and neuro-
transmitter level variables for the wake- and sleep-promoting,
REM-on and REM-off populations (fW , cW , fS, cS, fRon, cRon,
fRoff , cRoff ) compose the fast subsystem. Since wake/sleep and
REM-on/REM-off transitions occur during distinct phases of the
trajectory and since each homeostatic drive only affects the fast
variables of one of the flip-flops, we can separately apply fast-slow
decomposition to each flip-flop to define two hysteresis loops. For
the wake/sleep flip-flop, the fast-slow decomposition is identical to
that described for the single flip-flop model, namely by considering
h a fixed parameter in Eqs. (1) and (2) with X ,Y~W ,S, we obtain
a Z-shaped curve of fW fixed point solutions. We refer to this
curve as Z. For the REM-on/REM-off flip-flop, we consider stp a
fixed parameter in Eqs. (1) and (2) with X ,Y~Ron,Roff and obtain
an S-shaped curve of fixed point solutions of fRon, which we refer
to as S. The reversal in the shape of the curve of fixed point
solutions occurs because stp increases when fRon is deactivated
(during NREM sleep). Solution trajectories of the model can be
tracked in relation to these two fixed point curves, Z and S, such
that wake and sleep behavior corresponds to the trajectory
evolving along the upper and lower branches, respectively, of Zand, during sleep, REM and NREM episodes occur as the
trajectory evolves along the upper and lower branches, respec-
tively, of S.
To achieve activation of the REM-off population during wake
and to robustly generate the stereotypical sleep pattern of wake-
NREM-REM transitions that occurs after an extended period of
waking, we need to include in the model a mechanism that forces
the trajectory to remain on the lower branch of S during wake and
ensures that when the transition to sleep occurs, stp is at a value
less than the right knee of S. To determine these constraints on the
model, we consider the physiological hypotheses for the action of
the wake state on the REM sleep homeostatic drive. As discussed
in [35,36], there is debate whether the REM homeostatic drive
increases during wake, decreases during wake or is unaffected by
the wake state. In the context of our coupled flip-flop model, we
can implement these hypotheses through the effect on stp of
activation of the wake population. If stp increases during wake,
this may lead to an immediate (or almost immediate) transition
from wake to REM, since stp may reach values close to or above
the right knee of S during an extended wake bout. Similarly, stpremaining constant during wake could also lead to immediate (or
almost immediate) transitions from wake to REM. For example, as
the data show, the majority of REM bouts end in a transition to
wake. Thus, at the transition to wake stp is at a level between the
two knees of S, and could be at a value close to the right knee.
Even if the trajectory is forced down to the lower branch of Sduring wake in order to activate the REM-off population, when
the next sleep episode occurs there could be a very short transition
to REM as stp could quickly evolve to the right knee of S. To
guarantee a finite REM latency, as is stereotypical, we model that
stp decreases during wake to a reset value stpr. This mechanism
corresponds to a saturating inhibitory effect of the wake state on
the REM sleep homeostatic drive and insures that the REM-off
population is activated during wake. We model this mechanism as
an additional condition on stp dynamics that when fWwhW
(wake), stp decays to stpr with a time constant tstpW, and when
fWƒhW (sleep) stp dynamics is given by Eq. 6 (see Eq. S15 in
Appendix S1).
To illustrate how this condition on stp due to the wake state
creates the stereotypical pattern of wake-NREM-REM transitions,
we consider the trajectory of the deterministic model shown in
Fig. 5 as a hypnogram (parameter values differ slightly than those
in Table S1). At the beginning of the simulation, the model is in
the sleep state exhibiting regular transitions between NREM and
REM sleep (A, red portion of the curve). The trajectory is slowly
evolving leftwards on the lower branch of Z (D, red) as h decreases
(B, red), and stp (C, red) is alternating between values associated
with the left and right knees of S as the trajectory traverses the
hysteresis loop defined by S (E, red). When h decreases below the
left knee of Z, the wake/sleep flip-flop transitions to the wake
state, interrupting the current REM or NREM bout (all panels,
light blue). The trajectory jumps to the upper branch of Z, hbegins to increase and stp is driven down to stpr (stpr~0 in this
simulation), forcing the trajectory on the lower branch of S. At the
end of the wake bout as h increases beyond the right knee of Z, the
trajectory jumps down to the lower branch of Z, h starts of
decrease, stp is released from its reset value stpr and begins to
increase (all panels, orange). This portion of the trajectory
represents the REM latency period. The first REM bout occurs
when stp reaches the right knee of S and the trajectory begins
traversing the hysteresis loop defined by S (all panels, dark blue).
For values of stpr less than the left knee of S, the REM latency
period can be of longer duration than the interval between NREM
and REM bouts determined by the hysteresis loop dynamics of S.
In the full model with variability sources included, this
inhibitory effect of the wake state on the REM sleep homeostatic
drive remains a robust mechanism promoting the wake-NREM-
REM sleep transition pattern. In particular, we set stpr sufficiently
low (stpr~0) so that it remains less than the right knee of S despite
the modulation of the knees of S induced by the neurotransmitter
variability.
There are other possible ways to robustly generate the Wake-
NREM-REM transitions achieved here, such as including
projections from the sleep-promoting population to the REM-on
or REM-off populations with a decaying inhibitory effect or a
decaying excitatory effect, respectively, that would prevent
activation of the REM-on population at the onset of a sleep
episode regardless of the influence of stp. However, the inclusion
of such additional projections would increase the complexity of the
model and introduce new timescales and other parameters. In the
absence of experimental hypotheses supporting such additional
mechanisms, we focused on the effect of the waking state on the
REM sleep homeostatic drive to generate the appropriate state
transition dynamics.
Generating REM-wake transitions. Behavioral state tran-
sition probabilities computed from the experimental sleep
recordings suggest a robust mechanism that terminates REM
bouts with a transition to waking instead of NREM sleep. In the
model, two mechanisms can generate transitions to the wake state
from either the NREM or REM sleep state: either h decays below
the left knee of Z forcing the activation of fW or an input to the
wake-promoting population perturbs fW off the lower branch of
Z causing its activation and disruption of the sleep state. If these
mechanisms are independent of the activity of the REM-on and
REM-off populations, we expect that most sleep-wake transitions
would occur from the NREM state because the model spends
much more time in NREM compared to REM sleep. To generate
REM-wake transitions, then, there could be an excitatory effect of
activation of the REM-on population to the wake-promoting
population, or an inhibitory effect to the sleep-promoting
Coupled Flip-Flop Model for REM Sleep Regulation
PLOS ONE | www.plosone.org 9 April 2014 | Volume 9 | Issue 4 | e94481

population. Within the context of our coupled flip-flop model,
these excitatory and inhibitory effects could be direct synaptic
projections from the REM-on population to the wake- or sleep-
promoting population, REM-dependent actions on the homeo-
static sleep drive or REM-dependent actions that indirectly
influence transient or sustained external inputs to the wake- or
sleep-promoting populations.
Investigation of these different effects in the model indicated
that direct synaptic projections from the REM-on population to
either the wake- or sleep-promoting population, or actions on the
homeostatic sleep drive promoted the occurrence of wake
transitions by modulating the hysteresis loop Z or h dynamics
such that h decreased below the left knee of Z, thereby causing the
trajectory to jump to the upper branch of Z. Such transitions from
sleep to wake almost always led to an extended wake bout.
Including a REM-dependent external input to either the wake- or
sleep-promoting populations whose activity was sustained during
REM bouts similarly affected model dynamics to cause transitions
to extended wake bouts. While these mechanisms did not affect the
ability of the model to replicate the experimental data in the
baseline condition, it prevented replication of the post-REM sleep
deprivation condition where REM-wake-REM transitions with
brief intervening wake bouts were prevalent.
To investigate the effects of transient REM-dependent external
inputs, we modulated the random excitatory stimuli to the wake-
promoting population, d(t), dependent on activation of the REM-
on population. We found that model solutions fit the statistics of
the experimental sleep-wake patterns in both baseline and post-
REM sleep deprivation conditions when the frequency of d(t)stimuli increased during the REM sleep state. Hence, the high
REM-wake transition probability and the occurrence of REM-
wake-REM transitions in the data indicated an indirect effect of
REM-on activity on the wake/sleep flip-flop that initiated
activation of the wake-promoting population but not maintenance
of its activity. To implement this mechanism, we could include an
additional source of transient excitatory stimuli to the wake
promoting population that is only active during REM sleep.
However, in the interest of keeping the model compact, we
modeled the interaction through our existing mechanism d(t). See
the Discussion for possible physiological motivations for such
stimuli. Alternatively, including a source of REM-dependent
transient inhibitory inputs to the sleep-promoting population
similarly resulted in high probabilities of REM-wake transitions
and the occurrence of REM-wake-REM transitions but the
mechanism was less robust as it depended on sufficient inactivation
of the sleep-promoting population that could result in sufficient
activation of the wake-promoting population.
We modeled the effect of REM-on activation on the random
excitatory stimuli to the wake-promoting population, d(t), with an
increase in the frequency of occurrence of the stimuli during REM
sleep. In this way, although the model spends less time in REM
sleep, more frequent stimuli to fW during REM induce more
REM-wake transitions without introducing excessive brief wake
bouts during NREM. When an excitatory stimulus to the wake-
promoting population occurs during a REM bout, fW is
perturbed off the lower branch of Z. If h is sufficiently low, fWcan transition to the upper branch of Z, which forces stp down to
stpr terminating REM-on activity and the wake bout will be
maintained as h evolves along the upper branch of Z. If h is closer
to the right knee of Z when the stimulus arrives during the REM
bout, fW may be briefly perturbed off the lower branch of Z but it
will return to the lower branch, thus generating only a brief wake
bout. The sleep state that the model returns to depends on the rate
of decrease of stp to stpr induced by the brief fW activation. If the
rate of stp reset is fast, the model would return to the NREM sleep
state because the trajectory would be forced below the left knee of
S and fRon would deactivate during the brief wake. If the rate of
stp reset is slower, a REM-wake-REM transition can occur since
stp would have remained above the left knee of S with perhaps
only a transient reduction in REM-on activity.
Accounting for high variability of wake bout
durations. In our experimental sleep recordings, especially
under baseline conditions, some animals exhibited very long wake
bouts. As described for the single flip-flop model, long wake bout
durations can be obtained by adjusting time constants of h or
providing the appropriate relationship between the saturation level
of h and the knees of the Z. With variability of neurotransmitter
expression included in the coupled flip-flop model, we can
introduce very long wake bouts by setting the maximum saturation
level of h, hmax, below the h value of the right knee of Z. Without
the neurotransmitter expression variability, these parameter
settings would result in the model getting stuck in the wake state,
because the model solution with h~hmax would be a stable fixed
point of the full model. The neurotransmitter expression variability
modulates the h value of the right knee of Z and can move it below
hmax to induce a transition to the sleep state. Thus, in this
parameter regime, wake bout durations are overall longer than
sleep bouts, they have higher variability and very long wake bouts
are possible. In the Discussion we provide possible physiological
mechanisms that could support these model dynamics.
Differences between baseline and post-REM sleep
deprivation sleep patterning. As shown in Fig. 3, the coupled
flip-flop model is able to replicate sleep-wake patterning under
both baseline and post-REM sleep deprivation conditions. The
significant differences in patterning between the two conditions
include increases in percent time spent in REM sleep, the number
and duration of REM sleep bouts and a decrease in the percent
time spent in waking (2-tailed paired t-test, pv0:05). We captured
these differences in the model by adjusting parameters governing
three model components. First, we increased the number and
duration of REM bouts by adjusting the maximum and minimum
saturation levels of stp. The maximum saturation level, stpmax, was
increased to promote shorter latencies to REM-on activation and
the minimum level, stpmin, was increased to slow down the
trajectory’s evolution on the upper branch of S during a REM
bout. To further affect REM bout durations, we lengthened the
REM-NREM hysteresis loop by increasing the distance between
the knees of S. In our model formalism, the distance between the
knees of S can be modified in different ways, including the
addition of external inputs to either the REM-on or REM-off
populations. Alternatively, we adjusted the influence of stp on
fRoff activity (see Appendix S1 for details). An additional
consequence of a longer REM-NREM hysteresis loop is an
increase in REM-wake-REM transitions, which also was a feature
of post-REM sleep deprivation sleep patterning. As described
above, REM-wake-REM transitions occur in the model when a
random excitatory stimulus arrives to the wake-promoting
population during a REM bout. As a result of brief fW activation,
stp is forced to decrease towards the reset value stpr. However,
when the knees of S are further apart, the decrease in stp is less
likely to push stp below the left knee of S during the brief wake
bout. When the brief wake bout ends, the REM-on/REM-off flip-
flop remains in the REM state and REM bouts are more robust to
this kind of interruption.
Secondly, we obtained the decrease in percent time spent in
waking as a result of REM sleep deprivation through a decrease in
wake bout durations. Specifically, we increased the maximum
saturation level of h, hmax, to a value above the right knee of Z. As
Coupled Flip-Flop Model for REM Sleep Regulation
PLOS ONE | www.plosone.org 10 April 2014 | Volume 9 | Issue 4 | e94481

described above, this shortened wake bouts by allowing h to freely
evolve past the right knee of Z to induce the deactivation of fWand end the wake bout. The third model component we adjusted
to capture post-REM sleep deprivation patterning was to reduce
the frequency of the random excitatory stimuli to the wake-
promoting population. A large reduction in stimulus frequency
during the wake and NREM states resulted in far fewer brief wake
bouts during NREM sleep that fragmented NREM and prevented
the increase of the REM sleep homeostatic drive stp. Therefore,
we obtained the large increase in the NREM to REM transition
probability exhibited in the sleep recordings (Table 1). The
reduction in stimulus frequency during REM sleep, while not as
great, reduced the interruption of REM bouts by terminating
stimuli. In the Discussion, we provide possible neural mechanisms
that could account for these parameter changes.
Discussion
The proposed conceptual models for the control of REM sleep
by mutually inhibitory networks of REM-on and REM-off
populations leave a number of questions unanswered, particularly
regarding the interactions between the populations controlling
REM sleep and those controlling wake and NREM sleep [5,8,19].
In an attempt to shed some light on these questions, we
constructed a simplified, yet cohesive, mathematical model based
on mutually inhibitory flip-flop networks for the control of state
transitions between wake, NREM and REM sleep states. We
utilized a modeling formalism that correlates with the physiolog-
ical network structure of neurotransmitter-mediated interactions
among state-promoting neuronal populations. The network
structure, in particular the interactions between the wake/sleep
flip-flop and the REM-on/REM-off flip-flop, was motivated by the
behavioral state transitions observed in experimental rat sleep
recordings. A minimal set of interactions was identified by
constraining the network model to accurately replicate experi-
mental state transition dynamics in both baseline sleep and post-
REM sleep deprivation recovery sleep in a consistent manner. As
discussed below, these modeled interactions predict physiological
mechanisms that can be targeted in future experimental studies to
more definitively address some of the unanswered questions of
REM sleep regulation.
A strength of this study was the use of experimental rat sleep
recordings to motivate the construction of the network model. We
relied on replication of summary bout statistics and probabilities of
behavioral state transitions to constrain the model. Recently,
higher order statistical approaches, such as survival-based analysis
of wake and sleep bout durations, have been applied to sleep
recordings to identify effects of disease states and experimental
manipulations [37–40]. To compare survival analyses of bout
durations of the data and model results requires a sufficient
number of bouts [41]. Since our data sets contained only five 4 h
recordings in each condition, baseline and post-REM sleep
deprivation, there were insufficient numbers of bouts, particularly
REM sleep bouts, for a bout duration survival analysis to be
meaningful. We note, though, that the standard summary statistics
and state transition probabilities were sufficient to rule out possible
interactions between the wake/sleep and REM-on/REM-off flip-
flops. Specifically, to robustly generate transitions from REM sleep
to wake, an alternative interaction between flip-flops is a direct
excitatory projection from the REM-on population to the wake
population. However, simulations with this alternative model
structure were not able to replicate all summary statistics and
behavioral state transition probabilities. In particular, this alter-
native model could not simultaneously replicate the correct REM-
wake transition probability and number of REM bouts in either
the baseline or post-REM sleep deprivation condition. In this
alternative model, REM-wake transitions most often resulted in an
extended wake bout instead of a brief wake bout as part of a REM-
wake-REM transition that occurred more often in the data. Thus,
we believe that summary statistics and transition probabilities were
adequate to constrain our simplified model.
Mathematically, a mutually inhibitory flip-flop network pos-
sesses the dynamics of a hysteresis loop. The inherent symmetry of
a hysteresis loop and the regularity of its dynamics may call into
question its suitability for replicating the highly variable state
transitions of rat sleep-wake behavior. For example, survival
analysis of wake and sleep (NREM and REM sleep combined)
bout durations of rodent sleep revealed an asymmetry between
wake and sleep bouts such that wake bout durations displayed
power-law like distributions while sleep bout durations exhibited
exponential distributions [28]. Such a qualitative difference in
bout duration distributions suggests that wake and sleep state
transitions are influenced by different mechanisms. Our analysis of
the dynamics of a single flip-flop network with physiologically
motivated sources of variability included suggests that it can
generate sufficient variability and asymmetry in wake and sleep
bout duration distributions. In particular, an extended tail in wake
bout distributions reflecting low numbers of very long wake bouts
could be introduced by the appropriate relationship between the
underlying hysteresis loop and the saturation level of the
homeostatic sleep drive. Additionally, brief excitatory inputs to
the wake population generated a bimodal wake bout distribution
and an exponential-like sleep bout distribution. Recent work has
suggested that wake distributions may follow a multi-exponential
distribution rather than a strict power-law distribution [42]. One
can imagine that in the proper parameter regime, a bimodal wake
bout distribution with an appropriate tail, as we have shown a
single flip-flop with noise sources can generate, may result in a
multi-exponential-like distribution. Further work fitting flip-flop
models to survival analysis of experimental sleep data is clearly
needed to assess the capability of this network structure to account
for all aspects of sleep state transition dynamics.
Comparison to previous flip-flop models of the sleep-wake regulatory network
Previous modeling studies have investigated a coupled flip-flop
network for sleep-wake regulation in humans [23,25]. Our study
differs in that we focus on accounting for the variable and
polyphasic sleep-wake activity typical of rats rather than a
caricature of stereotypical human sleep-wake activity. A more
important difference involves the modeling formalism. The
previous studies modeled the mean activity or firing rate of each
neuronal population with the Morris-Lecar model, a generic
model for single cell neuronal membrane potential [31,43]. When
parameters are tuned appropriately, the Morris-Lecar model can
generate fast transitions between states of low and high activity
that is appropriate for modeling the activation and deactivation
transitions of mean activity in neuronal populations. As a model
for neuronal action potential generation, the Morris-Lecar model
has the additional capability of generating oscillatory solutions. In
the translation of using the model for population activity, this
means that the model can generate spontaneous, regular
transitions between low and high activity levels, without any
external stimulation. Both the Rempe et al [23] and Kumar et al
[25] studies exploit the model’s capability of intrinsic population
oscillatory dynamics to account for NREM-REM transitions. In
the modeling formalism that we use, on the other hand, individual
cell groups do not have the capability of intrinsic oscillatory
Coupled Flip-Flop Model for REM Sleep Regulation
PLOS ONE | www.plosone.org 11 April 2014 | Volume 9 | Issue 4 | e94481

behavior. Transitions between low and high activity levels depend
on changes in external inputs, specifically homeostatic drives for
NREM or REM sleep. Thus, in our model results, NREM-REM
transitions occur in response to changes in explicitly defined model
components, instead of assumed population properties. As the aim
of our study is to propose potential physiological interactions
among behavioral state-promoting neuronal groups, we believe
that it is important to avoid incorporating extraneous assumptions
into our modeling formalism.
In these previous models, the coupling projections between the
wake/sleep and REM-on/REM-off flip-flops were similarly
motivated by generating appropriate state transition dynamics,
particularly the stereotypical transition pattern of wake to NREM
sleep to REM sleep. The Kumar et al [25] model primarily
achieves this pattern by the action of a REM sleep homeostatic
drive whose dynamics were sensitive to wake and sleep states. This
drive increased excitation to the REM-on population during sleep
to promote its activation and decreased excitation during wake,
which allowed the REM-off population to dominate at wake to
sleep transitions. The Rempe et al [23] model included an indirect
projection from the wake/sleep to the REM-on/REM-off flip-flop
through an intermediary population, the extended VLPO
(eVLPO). Wake and sleep dependent activity of the eVLPO gated
activity of the REM-off population during wake and sleep states in
order to promote its initial activation at the wake to sleep
transition. Both models include additional feedforward connec-
tions between flip-flops, such as direct inhibitory projections from
the wake-promoting population to the REM-on population, that
are suggested by anatomical studies and work to suppress REM-on
activity during wake. We note that inclusion of similar additional
feedforward projections from the wake/sleep flip-flop to the REM-
on/REM-off flip-flop in our model would have similar effects and
not qualitatively change our results. In both the Rempe et al and
Kumar et al models, replicating human sleep-wake patterns did
not constrain the form of feedback projections from the REM-on/
REM-off flip-flop to the wake/sleep flip-flop. While an indirect
feedback projection originating in the REM-off population was
included in the Kumar et al model, it was not necessary to obtain
appropriate model behavior, and the Rempe et al model did not
include any feedback projections.
Since the Rempe et al [23] and Kumar et al [25] models
simulated human sleep, they both included input from a circadian
oscillator to contribute to the 24 h modulation of sleep-wake
behavior. In this study, we focused on replicating variable and
polyphasic rat sleep-wake behavior during a 4 h window in the
rest phase, assuming minimal modulation by the circadian
rhythm. Our modeling formalism, however, can readily include
a neuronal population representing the suprachiasmatic nucleus
(SCN) whose activity is driven by a circadian oscillator and which
is coupled to the sleep- and wake-promoting populations within
the network. Indeed, our previous work modeling rat sleep-wake
behavior, in which REM sleep is generated by a reciprocal
interaction network, suggested that multiple signaling pathways
between the SCN and sleep-wake centers may be necessary to
account for circadian modulation of rat sleep [44]. As a direction
for future work, incorporation of the SCN circadian signal in the
coupled flip-flop model to account for the 24 h variation of rat
sleep-wake behavior would test the minimal interactions between
the wake/sleep and REM-on/REM-off flip-flops proposed here
and perhaps identify additional constraints on the network
structure.
Model predictionsTo obtain robust wake-NREM-REM transition dynamics, our
simplified coupled flip-flop network model predicts that during
waking, the REM sleep homeostatic drive resets to a level
corresponding to low REM sleep pressure. This prediction is
similar to that of Benington and Heller [35] that REM sleep need
is homeostatically related to NREM sleep rather than waking,
such that in normal conditions it accrues during NREM and not
waking. While Benington and Heller do not offer a mechanism
defining the behavior of the REM sleep homeostat during the
transition from sleep to wake, we found that providing a decay of
the REM sleep homeostat to the reset level during wake best
replicated rat sleep patterning. In the context of the coupled flip-
flop model, this mechanism most parsimoniously provides the
appropriate dynamics to ensure that after an extended wake bout,
the NREM sleep state is entered first before REM sleep occurs. A
physiological correlate of such a mechanism could be provided by
the expression during sleep states of a substance mediating REM
sleep need and its cessation during waking. The absence of
expression during wake would lead to the degradation or uptake of
the substance, decreasing its presence to low levels. Recent
experimental results indicate that expression of MCH and
Nesfatin-1, which are co-expressed by neurons in the tuberal
hypothalamic area, exhibit sleep-dependent increases and wake-
dependent decreases and have REM sleep-inducing effects
[12,13,45]. Interestingly, while these substances are co-expressed,
pharmacological experiments indicate that MCH promotes REM
sleep [45] while Nesfatin-1 suppresses REM sleep [13]; however,
recent optogenetic experiments report that acute activation of
MCH neurons promotes maintenance of REM sleep [46]. An
alternative physiological mechanism could be provided by sleep-
dependent increases in activity of neurons that promote a
transition into REM sleep. Neural activity in the median preoptic
nucleus (MnPN) and the ventral lateral preoptic area (vlPOA)
strongly correlates with REM sleep pressure [14]. These neural
groups show higher activity during sleep than during waking
which could mediate a wake-dependent decrease in REM sleep
homeostatic drive. It is most likely that the physiological
mechanism for a REM sleep homeostatic drive is more
complicated than the simple, single drive variable included in
the model. For example, experiments in cats have suggested that
REM sleep pressure during REM deprivation and REM sleep
rebound during the recovery from REM deprivation may be
governed by mechanisms in separate brain areas [47]. Further
experimental investigation can provide insight for a more accurate
model.
The robust propensity for REM bouts to terminate in a
transition to wake exhibited in the data suggests the existence of an
effect on wake-promoting populations by the activation of REM-
on populations. However, while the anatomy has not been
completely determined, there is little evidence of direct synaptic
projections from the key identified REM-on populations to wake-
promoting areas. For example, the efferent pathways of the SLD
descend to areas that govern motoneuron activity to control
muscle atonia during REM, and ascend to thalamic areas that
induce REM cortical activation (reviewed in [8]). Thus, an indirect
mechanism whereby wake-promoting populations are activated to
terminate REM may be likely. We arrived at this conclusion by
constraining the model to replicate transition dynamics of the
data. As described above, model dynamics accurately replicated all
summary statistics and probabilities of behavioral state transitions
when activation of the REM-on population increased the external
excitatory stimuli to the wake-promoting population, but not when
it had a direct excitatory effect on the wake-promoting population.
Coupled Flip-Flop Model for REM Sleep Regulation
PLOS ONE | www.plosone.org 12 April 2014 | Volume 9 | Issue 4 | e94481

A physiological correlate for the model mechanism could be
provided by top-down projections to wake-promoting populations
from cortical regions that are activated during REM sleep, but not
NREM sleep. An alternative interpretation is that the wake-
promoting population is more sensitive to external inputs during
the REM sleep state, leading to a higher probability that wake-
promoting populations will be briefly activated during REM sleep.
Dynamically, increasing the rate of external excitatory stimuli
during REM sleep is essentially equivalent.
In the model, the occurrence of very long wake bouts and high
variability of wake bout durations were achieved by allowing the
homeostatic sleep drive h to reach its saturating limit hmax and
relying on neurotransmitter expression variability to modulate the
hysteresis loop to induce the transition out of the wake state. While
this may not be a physiologically robust mechanism, it is, however,
dynamically similar to the presence of a wake-promoting factor,
such as orexin (see [48] for a review), that could disrupt or delay
homeostatically governed transitions to sleep. The time-depen-
dence or variability in the expression of such a wake-promoting
factor would then determine the transition out of sleep and thus
the duration of the wake bout in a manner similar to random
variations of neurotransmitter levels included in the model.
The effects of 24 h REM sleep deprivation on rat sleep behavior
were replicated in the model by modulating both the sleep and
REM sleep homeostatic drives. Dynamics of the sleep homeostatic
drive were modulated to promote transitions into sleep from
waking. The need for this modulation may reflect a direct effect on
sleep homeostasis by the REM deprivation protocol due to
disturbances or slight losses of total sleep. For the effect on the
REM sleep homeostatic drive, REM bouts were lengthened and,
consequently, resistance to REM interruption was strengthened by
modulating the influence of the REM homeostat on activation of
the REM-off population. Such modulation could be a mechanism
for the proposed long-term process that regulates the daily amount
of REM sleep [15]. Physiologically, it might reflect modulation of
receptors for substances mediating short term REM homeostasis,
such as MCH and Nesfatin-1, as a result of REM deprivation.
This type of modulation may also be a mechanism to account for
the resistance to REM interruption achieved by the reduction in
the frequency of excitatory stimuli to the wake-promoting
population that was implemented to account for the effects of
REM sleep deprivation.
ConclusionsIn this study, we proposed a minimal model of an inhibition
based network for the regulation of transition dynamics between
the states of wake, NREM and REM sleep. We readily concede
that the model may be too simple. Our intent, however, was to
provide a cohesive inhibitory network structure, based on known
physiology, and constrain the structure to account for experimen-
tally measured sleep patterning in baseline conditions and after an
experimental challenge, namely REM sleep deprivation. Key
model results are predictions of the interactions between the
subnetworks controlling sleep-wake transitions and REM-NREM
transitions: feedforward effects from the wake/sleep subnetwork to
the REM/NREM subnetwork that act to suppress REM
propensity during waking, and feedback effects that indirectly
promote the initiation, but not maintenance, of waking as a result
of REM sleep. The aim of this modeling study, similar to other
recent physiologically-based modeling work on sleep-wake regu-
latory networks [20–25], is to participate in the investigation of
neuronal regulation of sleep and play the same role of providing a
framework for understanding and interpreting experimental
observations as the phenomenological two-process model [49]
and the reciprocal interaction model [3] have done for the past 40
years, but in the context of our increased knowledge of the
underlying physiology of sleep-wake regulation.
Methods and Model
Experimental sleep recordings and sleep scoringEthics statement. Experimental procedures were approved
by the University of Michigan Committee for the Care and Use of
Animals (permit #08194) and were in accordance with the
National Institutes of Health Guide for the Care and Use of
Laboratory Animals. All surgery was performed aseptically under
sodium pentobarbital anesthesia, and every effort was made to
minimize suffering.
Recordings of rat sleep under baseline conditions and after 24 h
of REM sleep deprivation were conducted as previously described
[34]. Briefly, six male Fischer 344 rats (Simonsen Laboratories,
Gilroy, CA) were used in the study. Under sodium pentobarbital
anesthesia, the following electrodes were implanted by aseptic
surgery for the purpose of electroencephalography (EEG) record-
ing and analysis of behavioral state: 2 superficial cortical electrodes
(relative to bregma AP: +0.3 and ML: +1.0 for left frontal; AP: -3.0
and ML: 22.0 for right parietal), 1 deep electrode targeted to the
left dorsal hippocampus (AP: 23.0, ML: +2.0 and DV: 22.9), 1
sinus ground and 1 recording wire into each dorsal neck muscle to
record nuchal electromyography (EMG). After recovery from
surgery and habituation to the recording apparatus, each rat was
recorded under the following conditions: (1) 8 h of natural sleep-
wake behavior, and (2) 8 h of natural sleep-wake behavior,
preceded by 24 h of REM sleep deprivation. Animals were
deprived of REM sleep using the multiple platforms-over-water
method [50]. Recordings commenced 2 hours into the light phase
of the 12-hour light:12-hour dark cycle (lights on at 6:00am) to
which the animals were habituated.
EEG and EMG recordings were analyzed to determine
behavioral state. Each 8 h recording session was analyzed in
10 s epochs. Three trained experimenters were blinded to the
condition of each rat and scored each record for REM sleep,
NREM sleep and waking [51]. The average pair-wise agreement
for the three scorers was w0:8 for total sleep, NREM sleep and
REM sleep. REM sleep was identified by low amplitude and
desynchronized cortical EEG, synchronized hippocampal EEG in
the h band (4–9 Hz) and quiescent EMG. Sleep-scored data from
5 animals were used in this study as the sleep patterning statistics
(such as mean bout duration, number of bouts and percent time
spent in each state) of the 6th animal differed by more than 2
standard deviations from the average sleep patterning statistics of
the other 5 animals.
To avoid effects due to recording initiation and circadian
modulation, sleep-scored data for hours 2–5 of the 8 h recording
for each rat (n = 5) were used for model development.
Model formalismWe constructed the single flip-flop and coupled flip-flop models
using our previously developed neuronal population firing rate and
neurotransmitter formalism [24]. In this formalism, the firing rate
of a pre-synaptic population, fX (t) (in Hz), induces expression of
neurotransmitter concentration, cX (t), which, in turn, acts as
input to post-synaptic populations. For a single flip-flop pair of
populations, the firing rate and neurotransmitter equations are
fX0~(X?(gY ,X
:cY ){fX )=tX , cX0~(cX?(fX ){cX )=tcX ð1Þ
Coupled Flip-Flop Model for REM Sleep Regulation
PLOS ONE | www.plosone.org 13 April 2014 | Volume 9 | Issue 4 | e94481

fY0~(Y?(gX ,Y
:cX ){fY )=tY , cY0~(cY?(fY ){cY )=tcY ð2Þ
where X ,Y~W ,S for the wake/sleep flip-flop or X ,Y~Ron,Roff
for the REM-on/REM-off flip-flop. Since we consider only
inhibitory influences of all neurotransmitters, the weighting
parameters for the post-synaptic influence of all neurotransmitter
gi,j are negative. The time constants tX ,tY ,tcX ,and tcY reflect the
time dynamics associated with firing rate response and neuro-
transmitter expression, respectively, at the population level.
Because different experimental techniques lead to differences in
absolute reported neurotransmitter concentrations, we normalize
each neurotransmitter concentration between 0 and 1. The
functions X?(:) represent the steady state activation functions
for population firing rates and are given by the standard sigmoidal
form of neuronal firing rate models [52,53]
X?(c)~1
2Xmax(1z tanh ((c{bX )=aX )), ð3Þ
where aX and bX govern the slope and half-activation level of the
activation function, respectively. The functions cX?(:) represent
the steady state expression functions for neurotransmitter concen-
trations and follow a saturating profile
cX?(f )~ tanh (f =cX ), ð4Þ
with slope dictated by cX . In simulations of the model networks,
states of wake, NREM sleep, and REM sleep were interpreted
based on firing rates of neuronal populations and concentration
levels of their associated neurotransmitters.
In each flip-flop, transitions between states are governed by a
homeostatic drive that promotes sleep in the wake/sleep flip-flop
and promotes REM sleep in the REM-on/REM-off flip-flop. The
sleep-promoting homeostatic drive, h(t), describes the universally
recognized propensity for sleep that increases during time awake
and decreases during sleep, and is thought to involve the
neuromodulator adenosine (reviewed in [29]). The REM sleep-
promoting homeostatic drive, stp(t), represents the proposed
short-term process underlying REM sleep homeostasis [15], and
while its underlying physiological mechanisms have not been
identified, we model it similarly as the sleep-promoting homeostat
such that stp increases during NREM sleep and decreases during
REM sleep. The equations governing the homeostatic drives are:
h0~H(fW{hW )(hmax{h)=th,up
zH(hW {fW )(hmin{h)=th,down
ð5Þ
stp0~H(hRon{fRon)(stpmax{stp)=tstp,up
zH(fRon{hRon )(stpmin{stp)=tstp,down
ð6Þ
where H(z) is the Heaviside function defined as H(z)~0 if zƒ0and H(z)~1 if zw0, and hX (X~W ,Ron) are fX threshold values
indicating the occurrence of wake or REM sleep, respectively. The
parameters xmin,xmax (x~h,stp) give the minimum and maximum
values, respectively, that the drive variables can attain and
tx,up,tx,down dictate the time scales of their increase and decrease,
respectively. To incorporate the sleep-promoting homeostatic
drive into the wake/sleep flip-flops, we model the effects of
adenosine on the VLPO [54–56] by setting the half-activation
level of the sleep population’s steady-state activation function, S?,
to be dependent on h. Since there is less physiological evidence to
support how the REM-sleep homeostatic drive affects either the
REM-on or REM-off populations, we turn to a previous analysis
of flip-flop models for REM sleep control that indicated that
transition dynamics are more robust when the REM sleep-
promoting homeostatic drive acts on the REM-off population
[27]. Thus, we set the half-activation level of the REM-off steady
state activation function, Roff? , to be a function of stp. The
equations for the sleep and REM-off steady state activation
functions are as follows (compare to Equation (3)):
S?(c,h)~1
2Smax(1z tanh ((c{bS(h))=aS)) ð7Þ
Roff? (c,stp)~
1
2Roff
max(1z tanh ((c{bRoff (stp))=a
Roff )) ð8Þ
where bx(y)~k2x(y{k1
x) for x~S,Roff and y~h,stp, respectively.
For the wake/sleep flip-flop, k2Sv0 such that as h increases during
wake, bS(h) decreases to promote activation of the sleep
population and terminate the wake bout. For the REM-on/
REM-off flip-flop, k2
Roff w0 such that as stp increases during
NREM sleep, bRoff (stp) also increases to promote inactivation of
the REM-off population and allow the REM-on population to
activate.
A full listing of model equations and parameter values is given in
Appendix S1 and Table S1.
Sources of variability in the modelTo incorporate experimentally-documented variability of neu-
rotransmitter release into the model [57], we multiplicatively
scaled the steady state release functions for each neurotransmitter,
cX?, by a noise factor, jX (t) whose amplitude randomly varied
(with uniform distribution and unit mean) at discrete times
dictated by a Poisson process. Another source of variability
included in the model represents external excitatory stimuli to the
wake population resulting in brief wake bouts that fragment sleep
states as is characteristic of rat sleep patterning. These inputs are
modeled by the addition of random amplitude, brief excitatory
inputs occurring at discrete times dictated by a Poisson process,
d(t), in the argument of the steady-state activation function of the
wake population, W?.
Interactions between the wake/sleep and REM-on/REM-off flip-flops
As described above, analysis of the dynamics of state transitions
in the experimental sleep recordings under baseline conditions and
during recovery sleep following REM sleep deprivation informed
the interactions between the wake/sleep and REM-on/REM-off
flip-flops included in the model (Fig. 4A). Activity of the wake
population influences the REM sleep homeostatic drive stp such
that when the model is in the wake state, stp decays to a low level,
stpr, forcing the half-activation of the REM-off population,
bRoff (stp), to a low level and promoting its activation. When the
wake population is inactive, stp dynamics are governed by Eq. (6)
(see Eq. S15 in Appendix S1). We model an indirect effect of
activity in the REM-on population on the wake population such
that when the model is in REM sleep, the frequency of the
external excitatory stimuli targeting the wake population, d(t), is
increased.
Coupled Flip-Flop Model for REM Sleep Regulation
PLOS ONE | www.plosone.org 14 April 2014 | Volume 9 | Issue 4 | e94481

NumericsStatistical analysis was performed in the MATLAB software
package (The MathWorks, Natick, MA). The administrative code
was also written in MATLAB. Differential equation integration
was performed using the XPP software package [58] (www.math.
pitt.edu/bard/xpp/xpp.html), interfaced with MATLAB via
system calls. Two dimensional bifurcation diagrams were created
using XPP, and the higher dimensional diagram in Fig. S1B was
created using MATCONT (www.matcont.ugent.be).
Supporting Information
Figure S1 Modulation of the single wake/sleep flip-flopmodel by neurotransmitter expression variability. Mod-
ulation of the single wake/sleep flip-flop model by neurotransmit-
ter expression variability. A: h coordinates of the right (RKW ) and
left (LKW ) knees of the hysteresis loop as jS is varied (black dotted
curve, jW ~1) and as jW is varied (red solid curve, jS~1). B:
Distance between RKW and LKW as both jS and jW are varied.
Solid colored bands are contours indicating equal distance
between the knees. White x’s indicate values where the knees do
not exist.
(EPS)
Figure S2 Effects of model variability on distributionsof wake and sleep bout durations. Effects of model
variability on distributions of wake (A,C) and sleep (B,D) bout
durations. A,B: Variable neurotransmitter expression levels result
in positively skewed, Gaussian-like distributions with a positive tail
of long wake bouts. C,D: Random excitatory inputs to the wake-
promoting population result in a bi-modal distribution of wake
bout durations (C) and an exponential-like distribution of sleep
bout durations (D). Bout durations of the deterministic model are
indicated by vertical black lines in all plots; distributions were
normalized by the area under their curves.
(EPS)
Figure S3 Modulation of the REM-NREM hysteresisloop in the post-REM sleep deprivation condition. Values
of stp at the right knee (upper curve, RKS ) and at the left knee
(lower curve, LKS ) of the S-shaped curve of fixed point solutions
(S) of the fast subsystem of the REM/NREM flip-flop, as a
function of k2Roff . Observe that the stp interval between the knees
(vertical distance between curves) grows as k2Roff decreases from the
baseline value of 7.
(EPS)
Appendix S1 Full model equations, analysis of theeffects of model variability on the dynamics of a singleflip-flop model, and analysis of the differences betweenthe model baseline and post-REM sleep deprivationconditions.
(PDF)
Table S1 Model parameter values for baseline sleepcase.
(PDF)
Author Contributions
Conceived and designed the experiments: JRD GAM VB. Performed the
experiments: JRD GAM VB. Analyzed the data: JRD VB. Wrote the
paper: JRD VB.
References
1. McCarley RW (2004) Mechanisms and models of REM sleep control. Arch Ital
Biol 142: 429–467.
2. Aserinsky E, Kleitman N (1953) Regularly occurring periods of eye motility, and
concomitant phenomena, during sleep. Science 118: 273–274.
3. McCarley RW, Hobson JA (1975) Neuronal excitability modulation over the
sleep cycle: a structural and mathematical model. Science 189: 58–60.
4. McCarley RW, Massaquoi SG (1986) A limit cycle mathematical model of the
REM sleep oscillator system. Am J Physiol 251: R1011–1029.
5. Lu J, Sherman D, Devor M, Saper CB (2006) A putative ip-op switch for control
of REM sleep. Nature 441: 589–94.
6. Sapin E, Lapray D, Berod A, Goutagny R, Leger L, et al. (2009) Localization of
the brainstem GABAergic neurons controlling paradoxical (REM) sleep. PLoS
One 4: e4272.
7. Luppi PH, Clement O, Sapin E, Peyron C, Gervasoni D, et al. (2012) Brainstem
mechanisms of paradoxical (REM) sleep generation. Pugers Arch 463: 43–52.
8. Luppi PH, Clement O, Fort P (2013) Paradoxical (REM) sleep genesis by the
brainstem is under hypothalamic control. Curr Opin Neurobiol 23: 786–92.
9. Aeschbach D (2011) REM-sleep regulation: circadian, homeostatic, and non-
REM sleep-dependent determinants. In: Mallick B, Pandi-Perumal S, McCarley
R, Morrison A, editors, Rapid Eye Movement Sleep: Regulation and Function,
Cambridge University Press. pp. 80–88.
10. Shea JL, Mochizuki T, Sagvaag V, Aspevik T, Bjorkum A, et al. (2008) Rapid
eye movement (rem) sleep homeostatic regulatory processes in the rat: changes in
the sleep-wake stages and electroencephalographic power spectra. Brain Res
1213: 48–56.
11. Pal D, Lipinski WJ,Walker AJ, Turner AM, Mashour GA (2011) State-specific
effects of sevourane anesthesia on sleep homeostasis: selective recovery of slow
wave but not rapid eye movement sleep. Anesthesiology 114: 302–310.
12. Peyron C, Sapin E, Leger L, Luppi PH, Fort P (2009) Role of the melanin-
concentrating hormone neuropeptide in sleep regulation. Peptides 30: 2052–
2059.
13. Jego S, Salvert D, Renouard L, Mori M, Goutagny R, et al. (2012) Tuberal
hypothalamic neurons secreting the satiety molecule nesfatin-1 are critically
involved in paradoxical (REM) sleep homeostasis. PLoS One 7: e52525.
14. Gvilia I, Turner A, McGinty D, Szymusiak R (2006) Preoptic area neurons and
the homeostatic regulation of rapid eye movement sleep. J Neurosci 26: 3037–
3044.
15. Franken P (2002) Long-term vs. short-term processes regulating REM sleep.
J Sleep Res 11: 17–28.
16. Amici R, Cerri M, Ocampo-Garces A, Baracchi F, Dentico D, et al. (2008) Cold
exposure and sleep in the rat: Rem sleep homeostasis and body size. SLEEP 31:
708–715.
17. Saper CB, Chou TC, Scammell TE (2001) The sleep switch: hypothalamic
control of sleep and wakefulness. Trends Neurosci 24: 726–31.
18. Saper CB, Scammell TE, Lu J (2005) Hypothalamic regulation of sleep and
circadian rhythms. Nature 437: 1257–63.
19. Fuller PM, Saper CB, Lu J (2007) The pontine REM switch: past and present.
J Physiol 584: 735–741.
20. Tamakawa Y, Karashima A, Koyama Y, Katayama N, Nakao M (2006) A
quartet neural system model orchestrating sleep and wakefulness mechanisms.
J Neurophysiol 95: 2055–69.
21. Phillips AJ, Robinson PA (2007) A quantitative model of sleep-wake dynamics
based on the physiology of the brainstem ascending arousal system. J Biol
Rhythms 22: 167–79.
22. Diniz Behn CG, Brown EN, Scammell TE, Kopell NJ (2007) A mathematical
model of network dynamics governing mouse sleep-wake behavior.
J Neurophysiol 97: 3828–40.
23. Rempe MJ, Best J, Terman D (2010) A mathematical model of the sleep/wake
cycle. J Math Biol 60: 615–644.
24. Diniz Behn C, Booth V (2010) Simulating microinjection experiments in a novel
model of the rat sleep-wake regulatory network. J Neurophysiol 103: 1937–1953.
25. Kumar R, Bose A, Mallick BN (2012) A mathematical model towards
understanding the mechanism of neuronal regulation of wake-nrems-rems
states. PLoS One 7: e42059.
26. Robinson PA, Phillips AJK, Fulcher BD, Puckeridge M, Roberts JA (2011)
Quantitative modelling of sleep dynamics. Philos Trans A Math Phys Eng Sci
369: 3840–3854.
27. Diniz Behn CG, Ananthasubramaniam A, Booth V (2013) Contrasting existence
and robustness of rem/non-rem cycling in physiologically based models of rem
sleep regulatory networks. SIAM J Appl Dyn Syst 12: 279–314.
28. Lo CC, Chou T, Penzel T, Scammell TE, Strecker RE, et al. (2004) Common
scale-invariant patterns of sleep-wake transitions across mammalian species.
PNAS 101: 17545–17548.
29. Porkka-Heiskanen T (2013) Sleep homeostasis. Curr Opin Neurobiol 23: 799–
805.
30. Rinzel J (1985) Bursting oscillations in an excitable membrane model. In:
Sleeman B, Jarvis R, editors, Ordinary and Partial Differential Equations;
Proceedings of the 8th Dundee Conference, Lecture Notes in Mathematics
1151, Springer. pp. 304–316.
Coupled Flip-Flop Model for REM Sleep Regulation
PLOS ONE | www.plosone.org 15 April 2014 | Volume 9 | Issue 4 | e94481
31. Ermentrout G, Terman D (2010) Mathematical Foundations of Neuroscience.
Springer.
32. Izhikevich E (2007) Dynamical Systems in Neuroscience: The Geometry of
Excitability and Bursting. The MIT Press.
33. Diniz Behn C, Booth V (2012) A fast-slow analysis of the dynamics of REM
sleep. SIAM J Appl Dyn Syst 11: 212–242.
34. Mashour GA, Lipinski WJ, Matlen LB, Walker AJ, Turner AM, et al. (2010)
Isourane anesthesia does not satisfy the homeostatic need for rapid eye
movement sleep. Anesth Analg 110: 1283–1289.
35. Benington J, Heller H (1994) REM-sleep timing is controlled homeostatically by
accumulation of REM- sleep propensity in non-REM sleep. Amer J Physiol 266:
1992–2000.
36. Benington J, Heller H (1994) Does the function of REM sleep concern non-
REM sleep or waking? Prog Neurobiol 44: 433–449.
37. Diniz Behn CG, Kopell N, Brown EN, Mochizuki T, Scammell TE (2008)
Delayed orexin signaling consolidates wakefulness and sleep: physiology and
modeling. J Neurophysiol 99: 3090–3103.
38. Chervin RD, Fetterolf JL, Ruzicka DL, Thelen BJ, Burns JW (2009) Sleep stage
dynamics differ between children with and without obstructive sleep apnea.
SLEEP 32: 1325–1332.
39. Bianchi MT, Cash SS, Mietus J, Peng CK, Thomas R (2010) Obstructive sleep
apnea alters sleep stage transition dynamics. PLoS One 5: e11356.
40. Klerman EB, Wang W, Duffy JF, J DD, Czeisler C, et al. (2013) Survival
analysis indicates that age-related decline in sleep continuity occurs exclusively
during nrem sleep. Neurobiol Aging 34: 309–318.
41. Doksum KA, Sievers GL (1976) Plotting with confidence: Graphical compar-
isons of two populations. Biometrika 63: 421–434.
42. Chu-Shore J, Westover MB, Bianchi MT (2010) Power law versus exponential
state transition dynamics: application to sleep-wake architecture. PLoS One 5:
e14204.
43. Morris C, Lecar H (1981) Voltage oscillations in the barnacle giant muscle fiber.
Biophys J 35: 193–213.
44. Fleshner M, Booth V, Forger DB, Diniz Behn C (2011) Multiple signals from the
suprachiasmatic nucleus required for circadian regulation of sleep-wake
behavior in the nocturnal rat. Phil Trans Roy Soc A 369: 3855–3883.
45. Monti JM, Torterolo P, Lagos P (2013) Melanin-concentrating hormone control
of sleep-wake behavior. Sleep Med Rev 17.46. Jego S, Glasgow SD, Gutierrez Herrera D, Ekstrand M, Reed SJ, et al. (2013)
Optogenetic identification of a rapid eye movement sleep modulatory circuit in
the hypothalamus. Nat Neurosci 16: 1637–1646.47. de Andres I, Garson M, Villablanca J (2003) The disconnected brain stem does
not support rapid eye movement sleep rebound following selective deprivation.SLEEP 26: 419–425.
48. Sakurai T (2007) The neural circuit of orexin (hypocretin): maintaining sleep
and wakefulness. Nat Rev Neurosci 8: 171–181.49. Borbely A (1982) A two process model of sleep regulation. Hum Neurobiol 1:
195–204.50. Jouvet D, Vimont P, Delorme F, Jouvet M (1964) Study of selective deprivation
of the paradoxical sleep phase in the cat. C R Seances Soc Biol Fil 158: 756–759.51. Gross B, Walsh CM, Turakhia AA, Booth V, Mashour GA, et al. (2009) Open-
source logic-based automated sleep scoring software using electrophysiological
recordings in rats. J Neurosci Methods 184: 10–18.52. Wilson HR, Cowan JD (1972) Excitatory and inhibitory interactions in localized
populations of model neurons. Biophys J 12: 1–24.53. Deco G, Jirsa VK, Robinson PA, Breakspear M, Friston K (2008) The dynamic
brain: from spiking neurons to neural masses and cortical fields. PLoS Comput
Biol 4: e1000092.54. Morairty S, Rainnie D, McCarley R, Greene R (2004) Disinhibition of
ventrolateral preoptic area sleep-active neurons by adenosine: a new mechanismfor sleep promotion. Neuroscience 123: 451–7.
55. Chamberlin NL, Arrigoni E, Chou TC, Scammell TE, Greene RW, et al. (2003)Effects of adenosine on GABAergic synaptic inputs to identified ventrolateral
preoptic neurons. Neuroscience 119: 913–8.
56. Gallopin T, Luppi PH, Cauli B, Urade Y, Rossier J, et al. (2005) Theendogenous somnogen adenosine excites a subset of sleep-promoting neurons via
A2A receptors in the ventrolateral preoptic nucleus. Neuroscience 134: 1377–90.57. Aston-Jones G, Bloom FE (1981) Activity of norepinephrine-containing locus
coeruleus neurons in behaving rats anticipates uctuations in the sleep-waking
cycle. J Neurosci 1: 876–886.58. Ermentrout G (2002) Simulating, Analyzing, and Animating Dynamical
Systems: A Guide to XPPAUT for Researchers and Students. SIAM.
Coupled Flip-Flop Model for REM Sleep Regulation
PLOS ONE | www.plosone.org 16 April 2014 | Volume 9 | Issue 4 | e94481


