
CPC Forecasts: Current and FutureMethods and Requirements
Ed O’Lenic
NOAA-NWS-Climate Prediction Center
Camp Springs, Maryland
301-763-8000, ext 7528
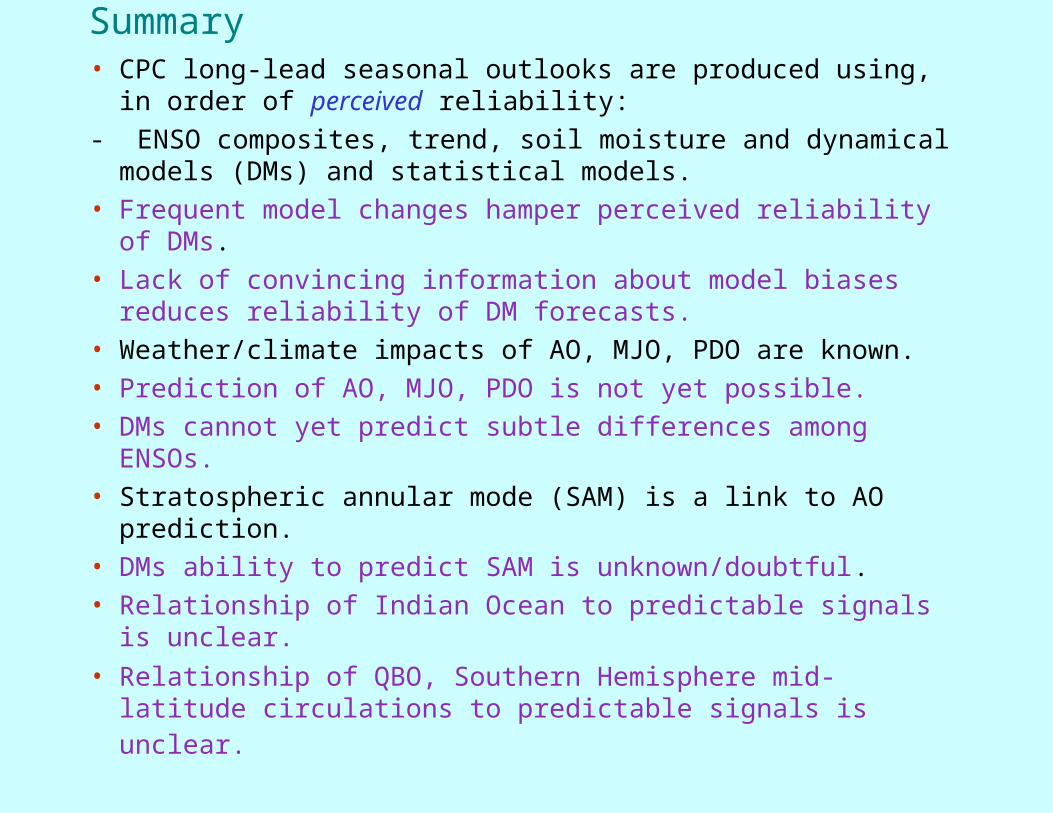
Summary• CPC long-lead seasonal outlooks are produced using, in order of
perceived reliability:
- ENSO composites, trend, soil moisture and dynamical models (DMs) and statistical models.
• Frequent model changes hamper perceived reliability of DMs.
• Lack of convincing information about model biases reduces reliability of DM forecasts.
• Weather/climate impacts of AO, MJO, PDO are known.
• Prediction of AO, MJO, PDO is not yet possible.
• DMs cannot yet predict subtle differences among ENSOs.
• Stratospheric annular mode (SAM) is a link to AO prediction.
• DMs ability to predict SAM is unknown/doubtful.
• Relationship of Indian Ocean to predictable signals is unclear.
• Relationship of QBO, Southern Hemisphere mid-latitude circulations to predictable signals is unclear.
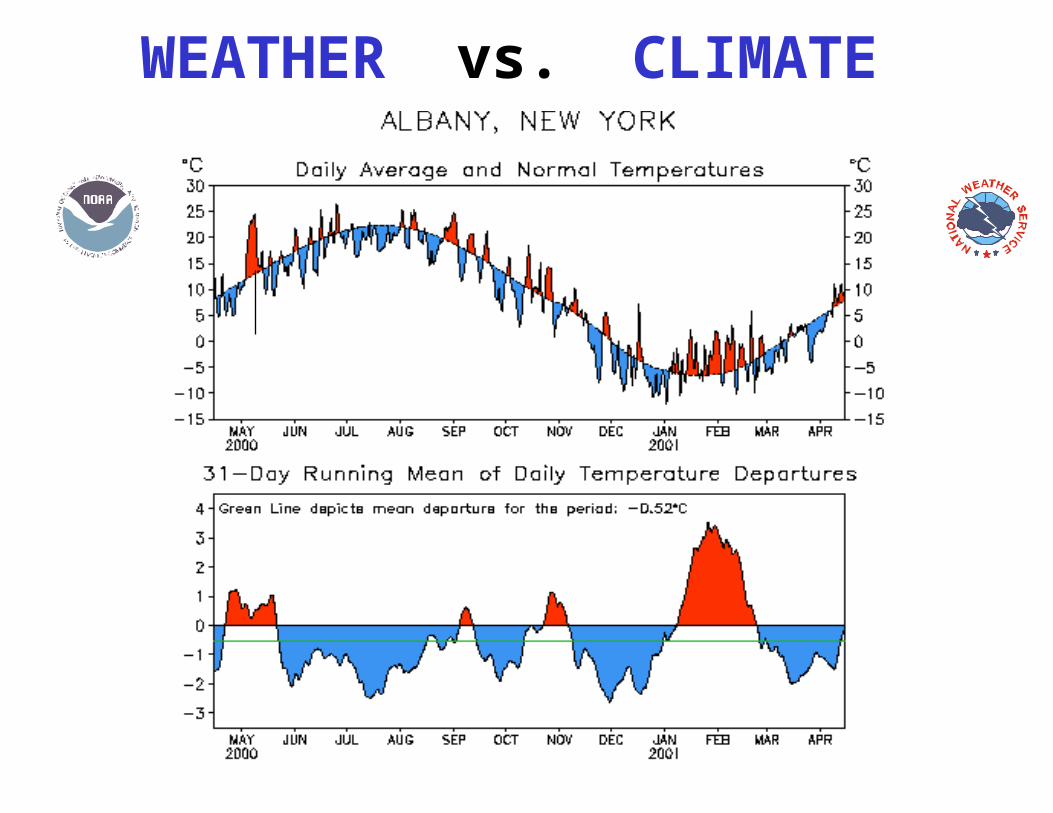
WEATHER vs. CLIMATE
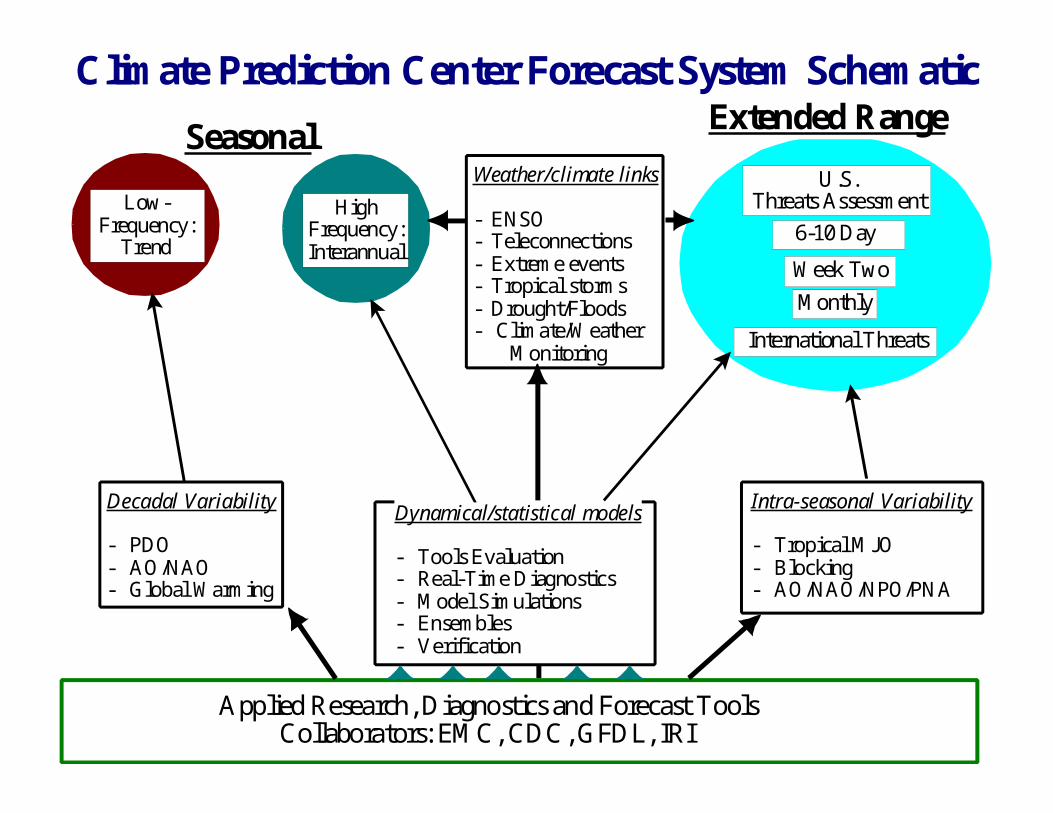
Weather/climate links
- ENSO- Teleconnections- Extreme events- Tropical storms- Drought/Floods- Climate/Weather Monitoring
Applied Research, Diagnostics and Forecast ToolsCollaborators: EMC, CDC, GFDL, IRI
Dynamical/statistical models
- Tools Evaluation- Real-Time Diagnostics- Model Simulations- Ensembles- Verification
Decadal Variability
- PDO- AO/NAO- Global Warming
Intra-seasonal Variability
- Tropical MJO- Blocking- AO/NAO/NPO/PNA
Seasonal Extended RangeClimate Prediction Center Forecast System Schematic
HighFrequency:Interannual
Low-Frequency:
Trend
U.S.Threats Assessment
6-10 Day
Week Two
Monthly
International Threats
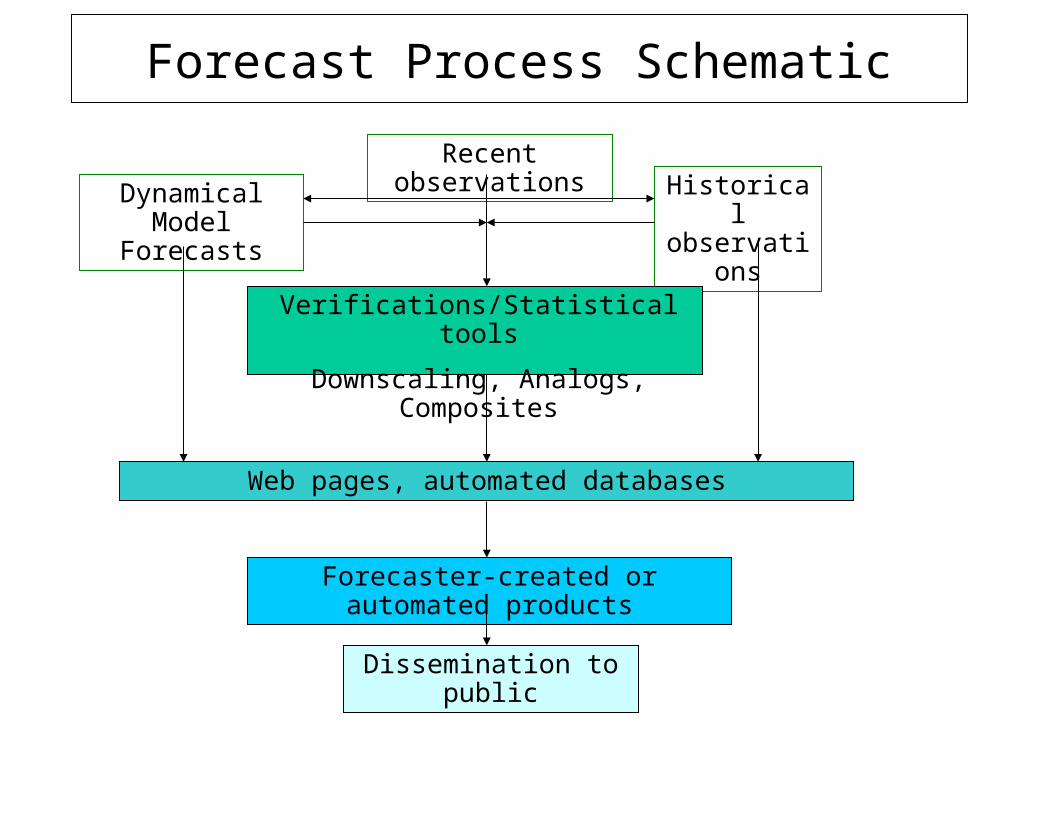
Forecast Process Schematic
Dynamical Model Forecasts
Recent observationsHistorical
observations
Verifications/Statistical tools
Downscaling, Analogs, Composites
Web pages, automated databases
Forecaster-created or automated products
Dissemination to public
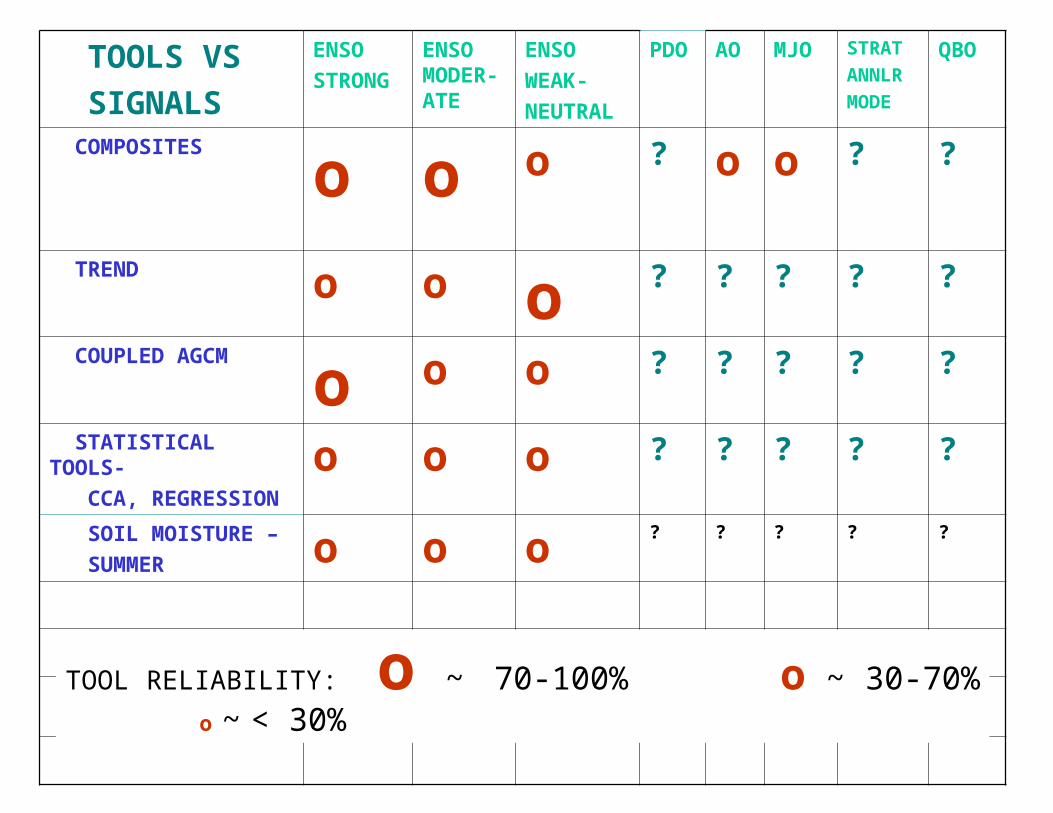
TOOLS VS
SIGNALS
ENSO
STRONG
ENSO MODER-ATE
ENSO
WEAK-
NEUTRAL
PDO AO MJO STRAT
ANNLR
MODE
QBO
COMPOSITES
o o o ? o o ? ?
TREND o o o ? ? ? ? ?
COUPLED AGCM
o o o ? ? ? ? ?
STATISTICAL TOOLS-
CCA, REGRESSION o o o ? ? ? ? ?
SOIL MOISTURE –
SUMMER o o o? ? ? ? ?
TOOLS VS SIGNALS
TOOL RELIABILITY: o ~ 70-100% o ~ 30-70% o ~ < 30%
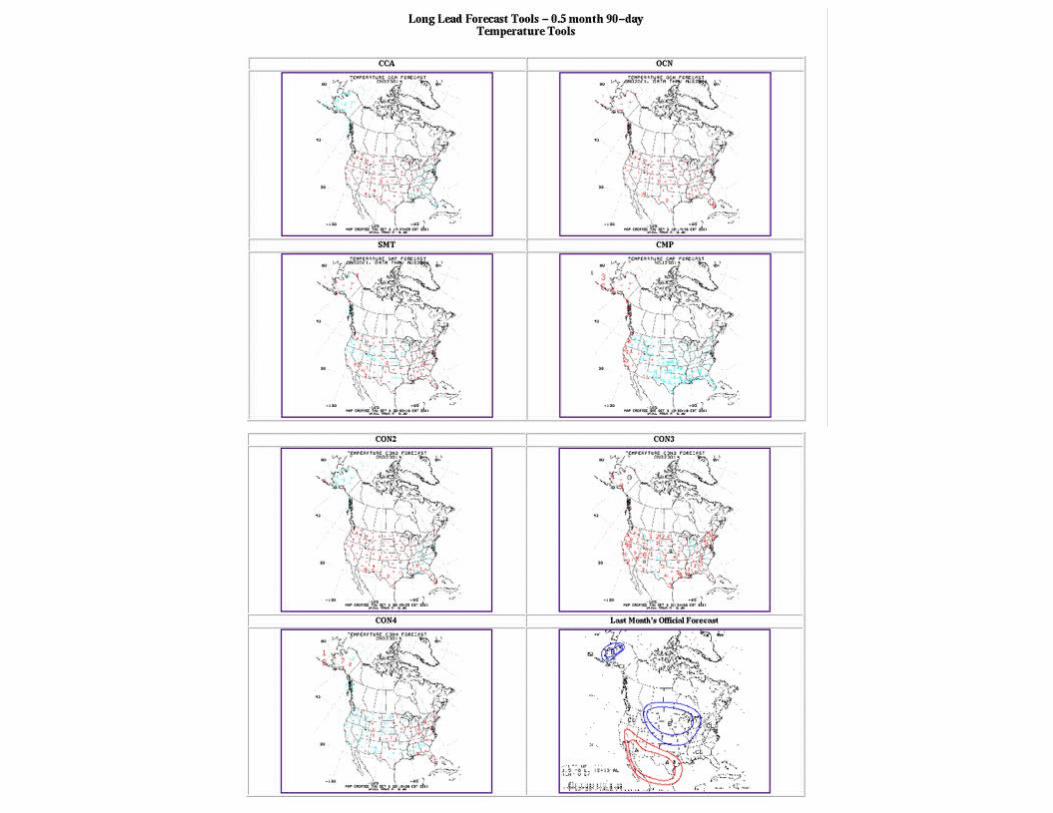
Forecast tools page
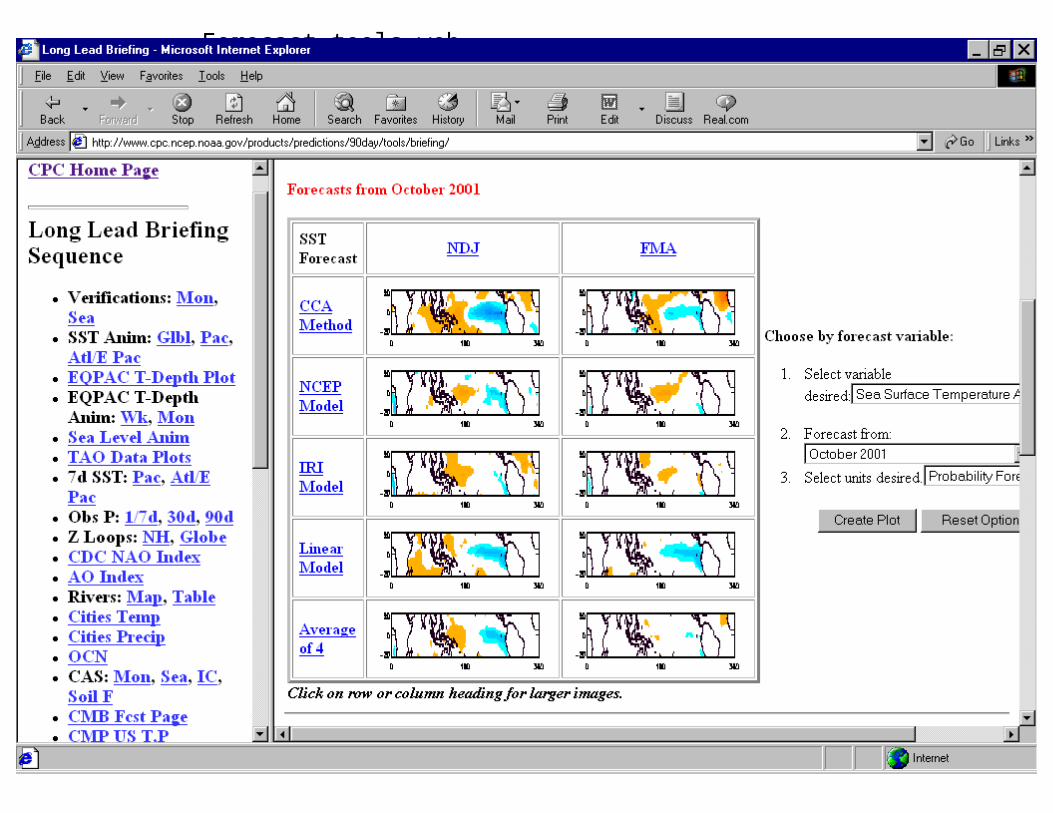
Forecast tools web page
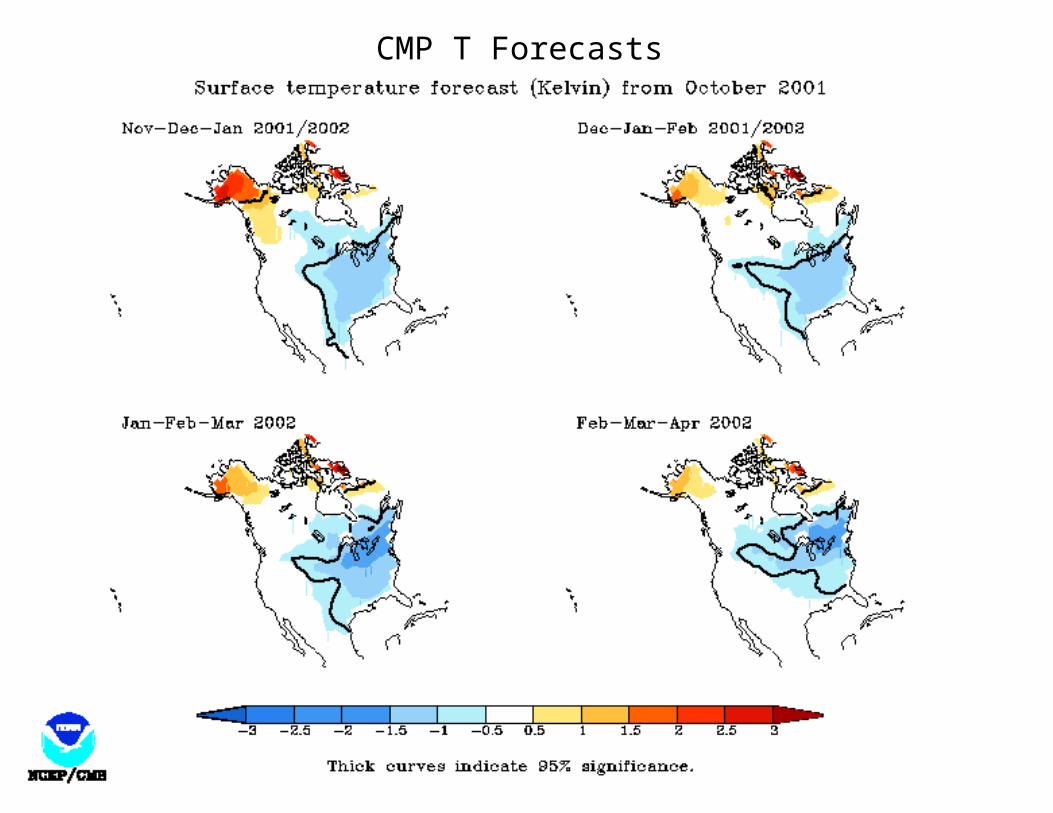
CMP T Forecasts

CMP NDJ 2000-01 T Verification

CCA 0.5 Mo lead NDJ T Outlook

OCN 0.5 Mo lead NDJ T Outlook
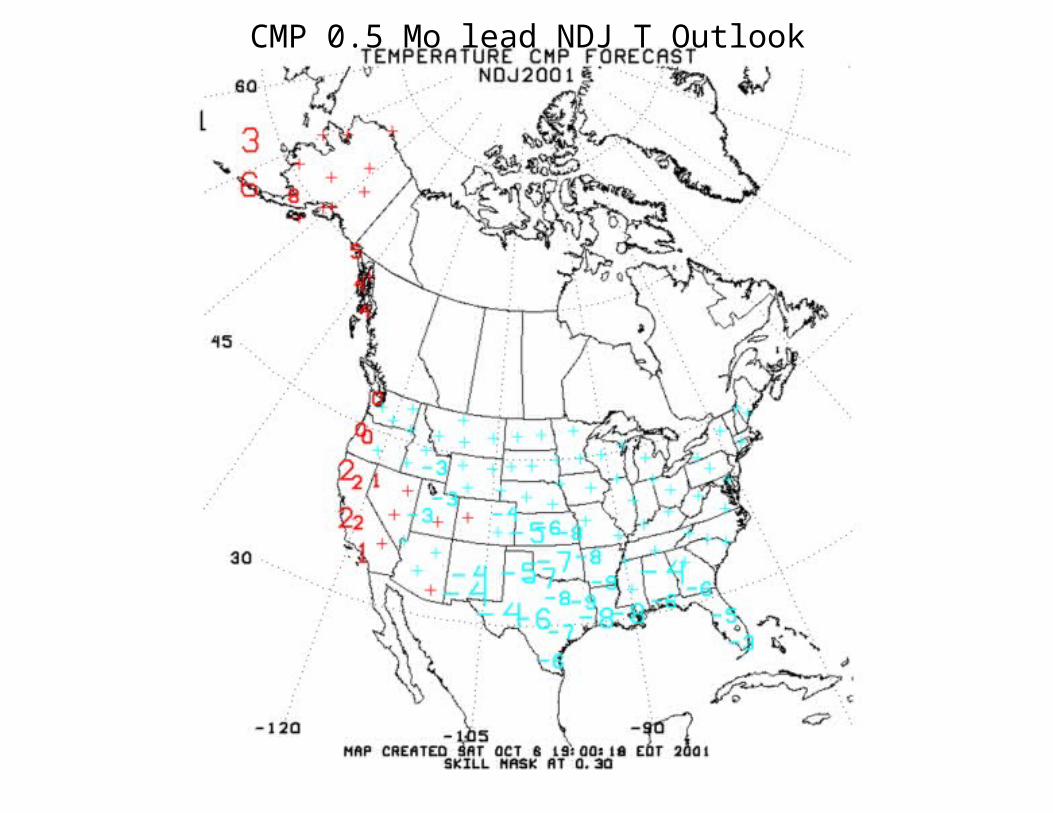
CMP 0.5 Mo lead NDJ T Outlook

OFFICIAL NDJ 2001-02 T Outlook

CMP P Forecasts
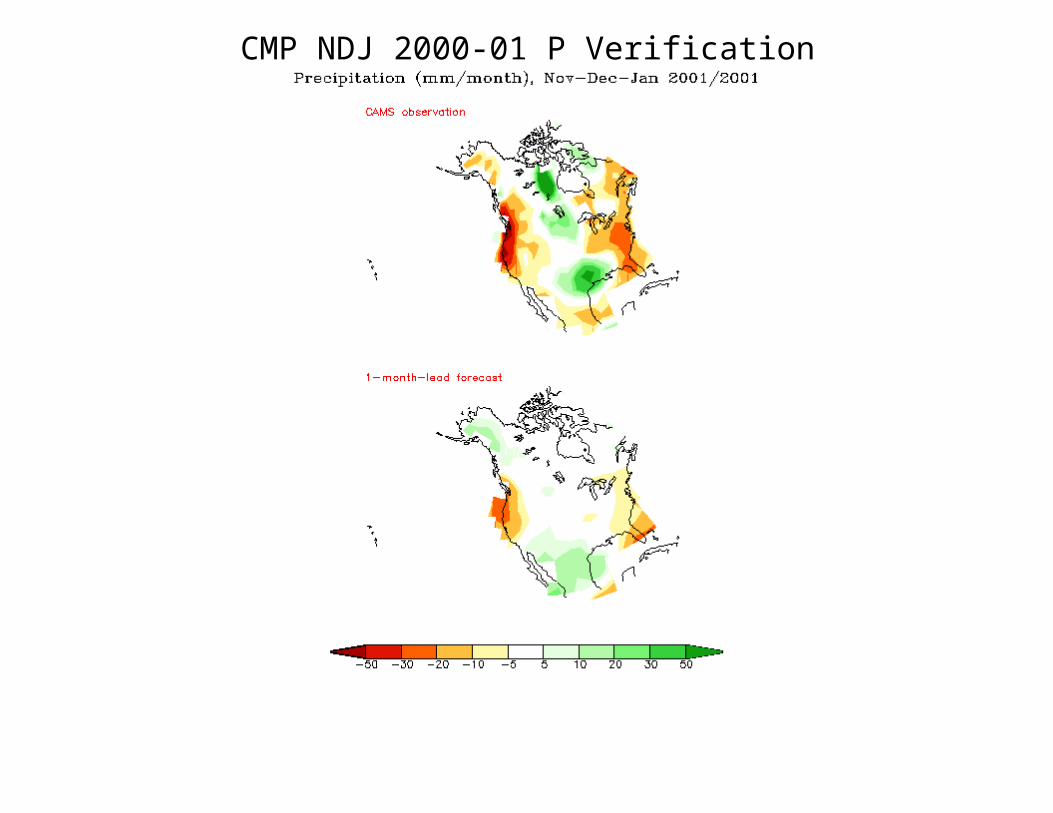
CMP NDJ 2000-01 P Verification
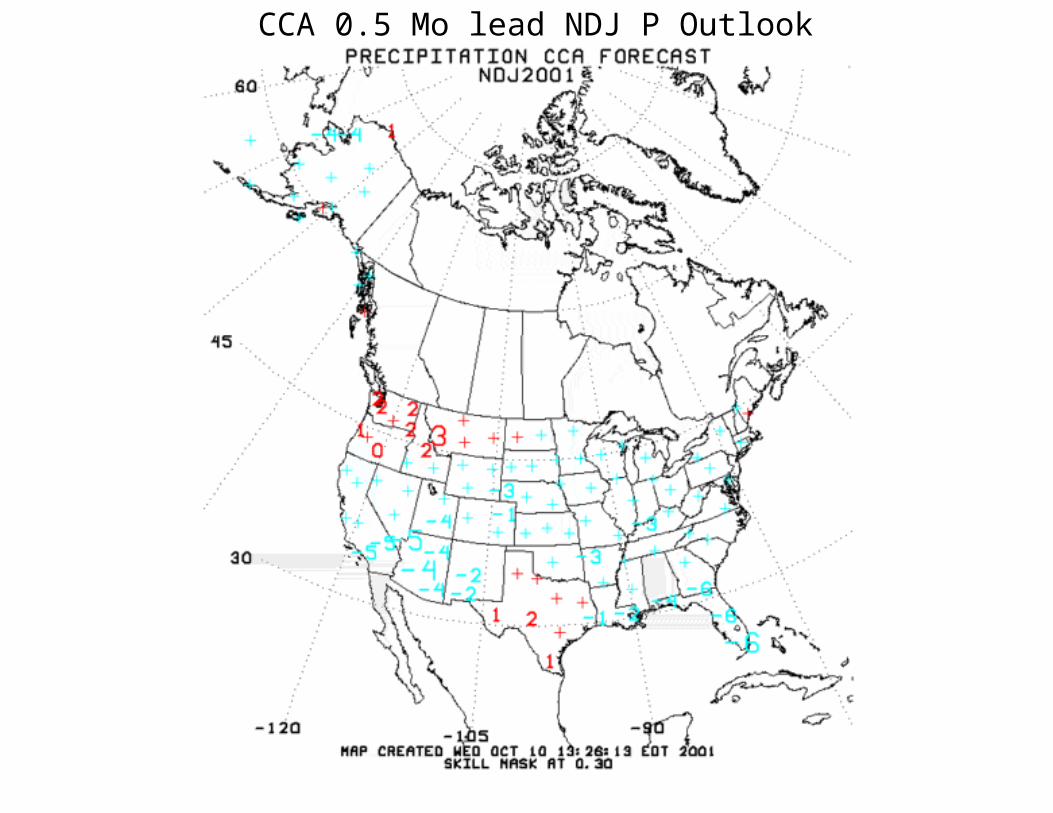
CCA 0.5 Mo lead NDJ P Outlook

OCN 0.5 Mo lead NDJ P Outlook

Official NDJ 2001-02 P Outlook
Operations Concept for Ocean/Atmosphere Model
• NCEP currently uses dynamical coupled ocean-atmosphere models in combination with statistical models to produce seasonal outlooks with ½ to 5 ½ month leads and, to a lesser extent, monthly outlooks with ½ month lead. Enhanced model operations which include increased numbers of ensemble members, more frequent model runs and enhanced capability to include the influence of within-season variations in SST and OLR will be used to:
- Produce more highly resolved distributions of predicted variables,
- Produce forecasts which increasingly and more appropriately reflect the influence of intra-seasonal variability on middle latitude climate,
- Produce improved week 2 and monthly outlooks and develop and implement new outlook products for the week 3-4
period.- Develop and implement new products to predict seasonal variations in frequency of extreme events, primarily during ENSO.

Detailed operations concept for ocean-atmosphere model
Currently, coupled dynamical model forecasts are one of several tools used in
preparing long-range outlooks. NCEP’s model is run to produce one set of
ensemble forecasts per month during the first week of the month. This is done in a
two-tiered system, in which first, an ensemble of 16 ocean forecasts are created
using a coupled GCM. The average of these is used as the official SST forecast.
This SST forecast is then used as the lower boundary for an AGCM to create a set
of 20 atmosphere ensemble members. The forecasts are run out to 9 months. A
20-year run of the AGCM is created each month. The seasonal means from this
run are used as the climatology to create anomaly maps from each of the
ensemble members. The means of these anomaly maps are used as the forecast
tools which are presented to the forecasters.
The forecasters use the NCEP model tools, together with other model tools to
subjectively create outlook maps of the probability of monthly and seasonal mean
temperature and total precipitation category.

1. Crop/Stock Dam age 2. Energy Savings 3. Famine 4. Fires 5. Fisheries Disruption 6. Health Risks 7. Hum an Fatalities
8. Pests Increased 9. Property Damage10. Tourism Decreased11. Transportation Problems12. Social Disruptions13. Wildlife Fatalities14. Water Rationing
Impac ts from 1997/98 E l N ino
1
1 8
1011
136
4
14
610
11
14
3
4
7
11
12
1
5 1 144
1
11
1434
6
8
9
9 9
101213
5
1
14
69
9
11
789
91
4
78
91113
52
~
El Nino Global Impacts

Summary• CPC long-lead seasonal outlooks are produced using, in order of
perceived reliability:
- ENSO composites, trend, soil moisture and dynamical models (DMs) and statistical models.
• Frequent model changes hamper perceived reliability of DMs.
• Lack of convincing information about model biases reduces perceived reliability of DM forecasts.
• Weather/climate impacts of AO, MJO, PDO are known.
• Prediction of AO, MJO, PDO is not yet possible.
• DMs cannot yet predict subtle differences among ENSOs.
• Stratospheric annular mode (SAM) is a link to AO prediction.
• DMs ability to predict SAM is unknown/doubtful.
• Relationship of Indian Ocean to predictable signals is unclear.
• Relationship of QBO, Southern Hemisphere mid-latitude circulations to predictable signals is unclear.


