
CropLife America & RISE2014 Spring Conference
Arlington, VA
Finding Common Ground in thePesticide Risk Assessment Process
Bruce K. Hope, Ph.D.
2
Committee on Ecological Risk Assessment Under FIFRA and ESA– Report: April 2013
CropLife Science Forum– May 2013
Agency efforts– “Interim Approaches for
National-Level Endangered Species…Assessments”
National Research Council (NRC)

3
Risk
Uncertainty (as a probability) about an outcome (with specified consequences) being realized in the future due to a decision made today– This probability is the “risk estimate”
Uncertainty about the risk estimate itself– Sources
• Natural / stochastic variability• Incertitude (lack of knowledge, ignorance)• Measurement and model error
– Can be expressed qualitatively and/or qualitatively– Essentially our “confidence” in the risk estimate
4
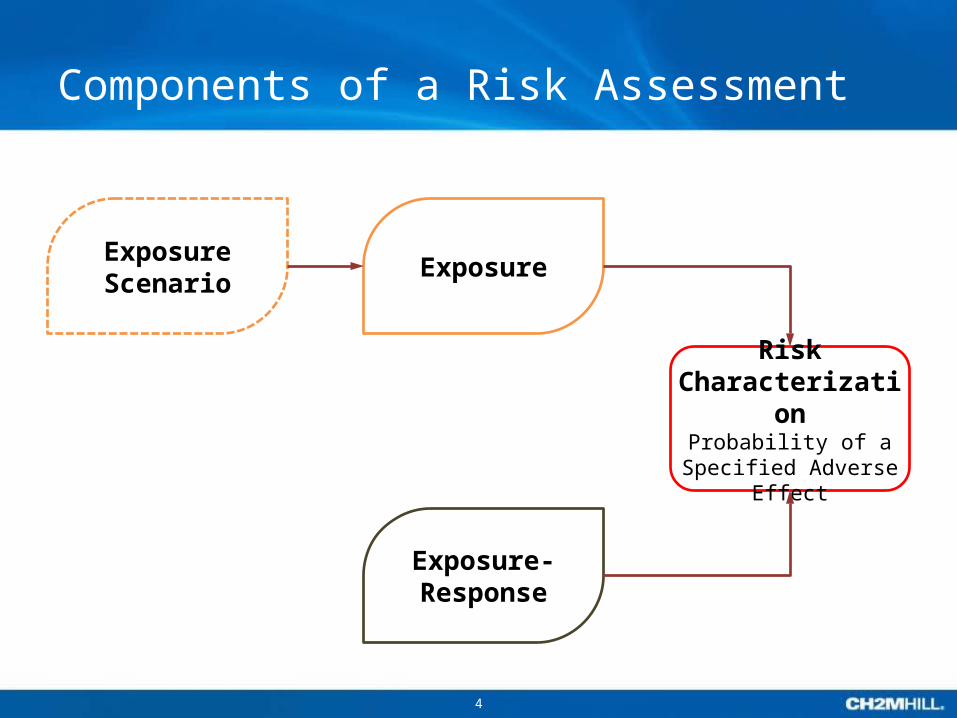
Components of a Risk Assessment
Risk Characterization
Probability of a Specified Adverse
Effect
Exposure
Exposure-Response
Exposure Scenario

5
Risk Characterization
CONCENTRATION
PRO
BABI
LITY
EXPOSURE-RESPONSEEXPOSURE (EEC)
Risk EstimateProbability of eliciting a specified response
in an individual

6
Interim Memo: Exposure
Step 1– Modeled estimates
Step 2– Modeled estimates w/ refinements
Step 3– Not specified
Role for both prediction and measurements (empirical data) for model corroboration)

7
Interim Memo: Exposure-Response
Step 1 (No Effect / May Affect; Action Area)– Animals: EEC LD0.000001 (individual mortality)
• 5th percentile species from SSD or most sensitive species tested
– Plants: Lowest NOAEC or EC05
Step 2 (NLAA / LAA)– Animals: EEC EC10 (10% decrease in individuals)
• 5th percentile species from SSD or most sensitive species tested
– Plants: Lowest LOAEC or EC25
Step 3 (Jeopardy)– Population model(s) - Same SSD, D/R slopes as in Steps 1 & 2
8
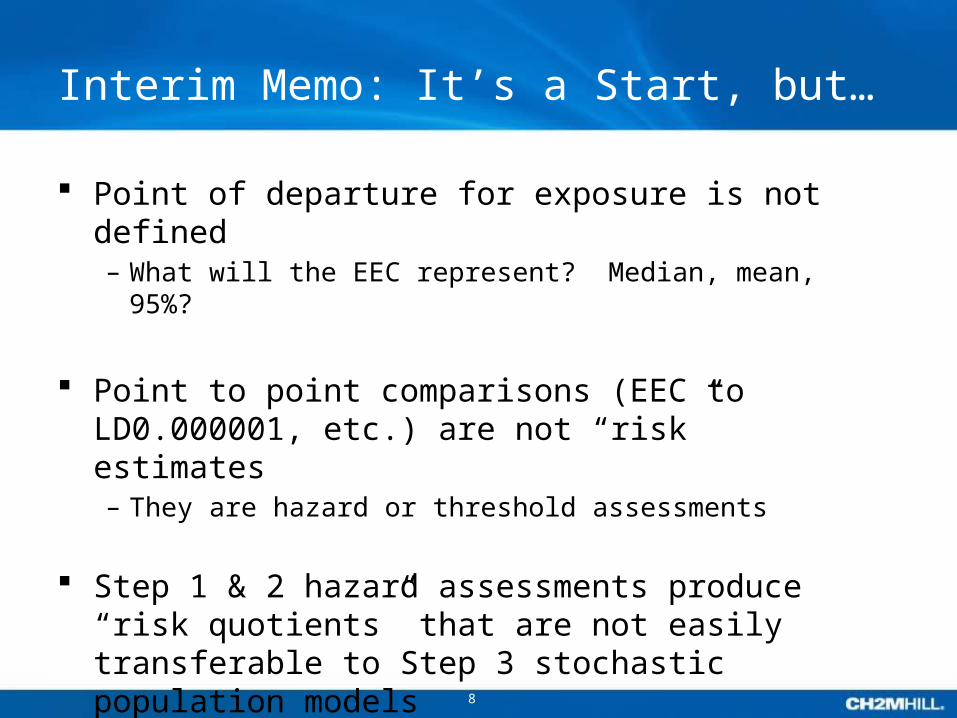
Interim Memo: It’s a Start, but…
Point of departure for exposure is not defined– What will the EEC represent? Median, mean, 95%?
Point to point comparisons (EEC to LD0.000001, etc.) are not “risk” estimates– They are hazard or threshold assessments
Step 1 & 2 hazard assessments produce “risk quotients” that are not easily transferable to Step 3 stochastic population models– A common basis in probability (risk) is missing

9
Why Not Quotients?
A hazard (threshold) assessment gives decision makers no idea of the chance of an outcome
But being just over the threshold is often perceived of as a 100% certainty of a detrimental outcome
Benefits can be foregone to avert a “certainty” that is highly unlikely to ever happen
This may lead to decisions that limit pesticide use to a greater extent than is intended by policy

10
Informing Decisions with Risk
If I plan to make decision X (to register a pesticide)…
What is the probability (p(Y)) that detrimental outcome Y will occur in the future? [p(Y) is the risk estimate]
What is my confidence in that estimate of p(Y)?– Where confidence is affected by variability and incertitude
Acceptability of p(Y)’s value is strictly a policy choice– But knowledge of it’s size (large or very small) is an important
component of informed decision making

11
Tools for quantitative risk analysis
Monte Carlo– First-order (variability + incertitude)
• Widely used approach, particularly for data-rich situations
– Second-order (variability, incertitude)• Useful for value of information determinations
Probability Bounds Analysis
Bayesian Methods– Can work across a hierarchy of data levels– Dempster-Shafer Theory (multiple lines of evidence)
12
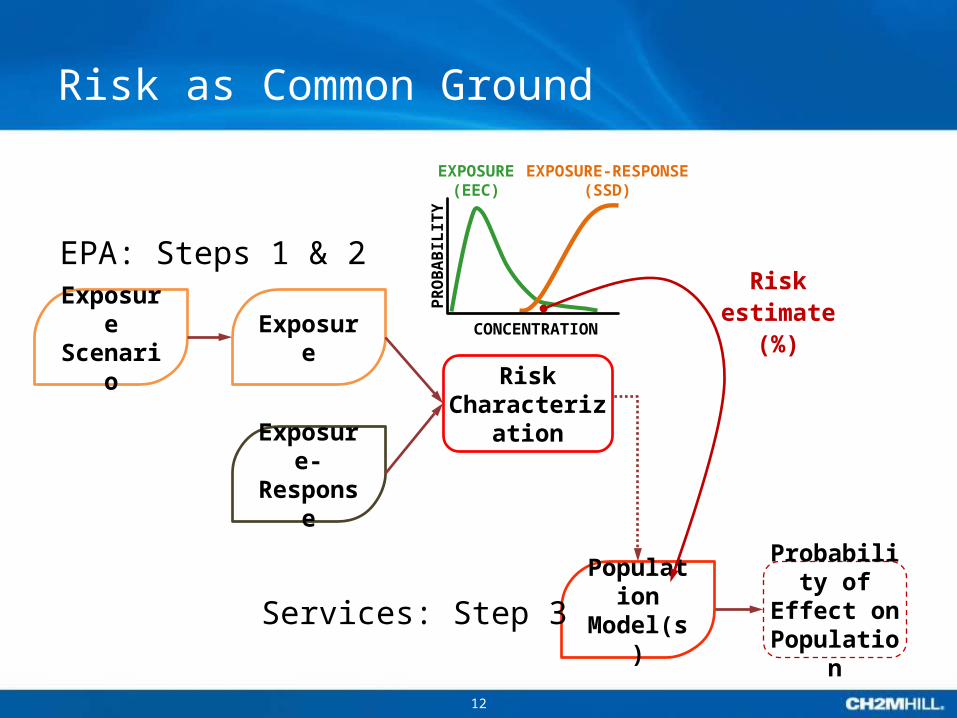
Risk as Common Ground
Probability of
Effect on Populatio
n
Exposure
Exposure-Response
Exposure Scenario
PopulationModel(s)
EPA: Steps 1 & 2
Services: Step 3
CONCENTRATION
PRO
BABI
LITY
EXPOSURE-RESPONSE(SSD)
EXPOSURE(EEC)
Riskestimate
(%)
Risk Characterization


