Chapter 3.6: Sketching Graphs 3.6.1: Domain, Intercepts, and Asymptotes
Curve Sketching
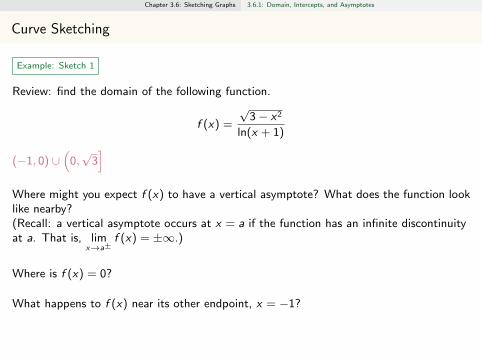
Example: Sketch 1
Review: find the domain of the following function.
f (x) =
√3− x2
ln(x + 1)
(−1, 0) ∪(
0,√
3]
Where might you expect f (x) to have a vertical asymptote? What does the function looklike nearby?(Recall: a vertical asymptote occurs at x = a if the function has an infinite discontinuityat a. That is, lim
x→a±f (x) = ±∞.)
Where is f (x) = 0?
What happens to f (x) near its other endpoint, x = −1?
https://www.desmos.com/calculator/9funm5gwrt
Chapter 3.6: Sketching Graphs 3.6.1: Domain, Intercepts, and Asymptotes
Curve Sketching
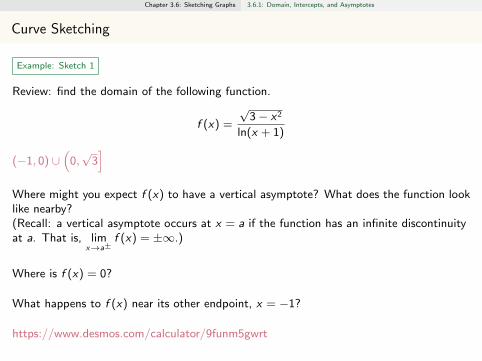
Example: Sketch 1
Review: find the domain of the following function.
f (x) =
√3− x2
ln(x + 1)
(−1, 0) ∪(
0,√
3]
Where might you expect f (x) to have a vertical asymptote? What does the function looklike nearby?(Recall: a vertical asymptote occurs at x = a if the function has an infinite discontinuityat a. That is, lim
x→a±f (x) = ±∞.)
Where is f (x) = 0?
What happens to f (x) near its other endpoint, x = −1?
https://www.desmos.com/calculator/9funm5gwrt
Chapter 3.6: Sketching Graphs 3.6.1: Domain, Intercepts, and Asymptotes
Curve Sketching
Good things to check:
• Domain
• Vertical asymptotes: limx→a
f (x) = ±∞
• Intercepts: x = 0, f (x) = 0
• Horizontal asymptotes and end behavior: limx→±∞
f (x)
Chapter 3.6: Sketching Graphs 3.6.1: Domain, Intercepts, and Asymptotes
Curve Sketching
Example: Sketch 2
What does the graph of the following function look like?
f (x) =x − 2
(x + 3)2
Remember: domain, vertical asymptotes, intercepts, and horizontal asymptotes
https://www.desmos.com/calculator/hyzl5cyq7i
Chapter 3.6: Sketching Graphs 3.6.1: Domain, Intercepts, and Asymptotes
Curve Sketching
Example: Sketch 3
What does the graph of the following function look like?
f (x) =(x + 2)(x − 3)2
x(x − 5)
https://www.desmos.com/calculator/ploa0q7bxn
Chapter 3.6: Sketching Graphs 3.6.1: Domain, Intercepts, and Asymptotes
Curve Sketching
Example: Sketch 3
What does the graph of the following function look like?
f (x) =(x + 2)(x − 3)2
x(x − 5)
https://www.desmos.com/calculator/ploa0q7bxn
Chapter 3.6: Sketching Graphs 3.6.2: First Derivative: Increasing or Decreasing
First Derivative
Example: Sketch 4
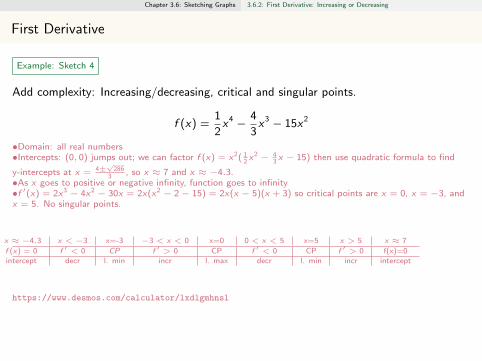
Add complexity: Increasing/decreasing, critical and singular points.
f (x) =1
2x4 − 4
3x3 − 15x2
•Domain: all real numbers•Intercepts: (0, 0) jumps out; we can factor f (x) = x2( 1
2 x2 − 4
3 x − 15) then use quadratic formula to find
y-intercepts at x = 4±√
2863 , so x ≈ 7 and x ≈ −4.3.
•As x goes to positive or negative infinity, function goes to infinity•f ′(x) = 2x3 − 4x2 − 30x = 2x(x2 − 2 − 15) = 2x(x − 5)(x + 3) so critical points are x = 0, x = −3, andx = 5. No singular points.
x ≈ −4.3 x < −3 x=-3 −3 < x < 0 x=0 0 < x < 5 x=5 x > 5 x ≈ 7
f (x) = 0 f ′ < 0 CP f ′ > 0 CP f ′ < 0 CP f ′ > 0 f(x)=0intercept decr l. min incr l. max decr l. min incr intercept
https://www.desmos.com/calculator/lxdlgmhnsl
Chapter 3.6: Sketching Graphs 3.6.2: First Derivative: Increasing or Decreasing
First Derivative
Example: Sketch 4
Add complexity: Increasing/decreasing, critical and singular points.
f (x) =1
2x4 − 4
3x3 − 15x2
•Domain: all real numbers•Intercepts: (0, 0) jumps out; we can factor f (x) = x2( 1
2 x2 − 4
3 x − 15) then use quadratic formula to find
y-intercepts at x = 4±√
2863 , so x ≈ 7 and x ≈ −4.3.
•As x goes to positive or negative infinity, function goes to infinity•f ′(x) = 2x3 − 4x2 − 30x = 2x(x2 − 2 − 15) = 2x(x − 5)(x + 3) so critical points are x = 0, x = −3, andx = 5. No singular points.
x ≈ −4.3 x < −3 x=-3 −3 < x < 0 x=0 0 < x < 5 x=5 x > 5 x ≈ 7
f (x) = 0 f ′ < 0 CP f ′ > 0 CP f ′ < 0 CP f ′ > 0 f(x)=0intercept decr l. min incr l. max decr l. min incr intercept
https://www.desmos.com/calculator/lxdlgmhnsl
Chapter 3.6: Sketching Graphs 3.6.2: First Derivative: Increasing or Decreasing
Example: Sketch 5
What does the following function look like?
f (x) =1
3x3 + 2x2 + 4x + 24
•Domain: all real numbers. No VA. Goes to ±∞.•f (0) = 24; f (x) = 1
3x2(x + 6) + 4(x + 6) = ( 1
3x2 + 4)(x + 6), so only one root:
f (−6) = 0.•f ′(x) = x2 + 4x4 = (x + 2)2; only one critical point, at x = −2, and increasingeverywhere else•So, at the left, comes from negative infinity; levels crosses x-axis at x = −6; levels outat x = −2; crosses y -axis at y = 24; carries on to infinityhttps://www.desmos.com/calculator/xum0mstmiv

Chapter 3.6: Sketching Graphs 3.6.2: First Derivative: Increasing or Decreasing
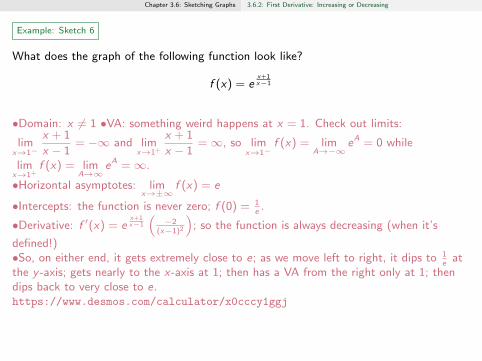
Example: Sketch 6
What does the graph of the following function look like?
f (x) = ex+1x−1
•Domain: x 6= 1 •VA: something weird happens at x = 1. Check out limits:
limx→1−
x + 1
x − 1= −∞ and lim
x→1+
x + 1
x − 1=∞, so lim
x→1−f (x) = lim
A→−∞eA = 0 while
limx→1+
f (x) = limA→∞
eA =∞.
•Horizontal asymptotes: limx→±∞
f (x) = e
•Intercepts: the function is never zero; f (0) = 1e
.
•Derivative: f ′(x) = ex+1x−1
(−2
(x−1)2
); so the function is always decreasing (when it’s
defined!)•So, on either end, it gets extremely close to e; as we move left to right, it dips to 1
eat
the y -axis; gets nearly to the x-axis at 1; then has a VA from the right only at 1; thendips back to very close to e.https://www.desmos.com/calculator/x0cccy1ggj
Chapter 3.6: Sketching Graphs 3.6.2: First Derivative: Increasing or Decreasing
Example: Sketch 6
What does the graph of the following function look like?
f (x) = ex+1x−1
•Domain: x 6= 1 •VA: something weird happens at x = 1. Check out limits:
limx→1−
x + 1
x − 1= −∞ and lim
x→1+
x + 1
x − 1=∞, so lim
x→1−f (x) = lim
A→−∞eA = 0 while
limx→1+
f (x) = limA→∞
eA =∞.
•Horizontal asymptotes: limx→±∞
f (x) = e
•Intercepts: the function is never zero; f (0) = 1e
.
•Derivative: f ′(x) = ex+1x−1
(−2
(x−1)2
); so the function is always decreasing (when it’s
defined!)•So, on either end, it gets extremely close to e; as we move left to right, it dips to 1
eat
the y -axis; gets nearly to the x-axis at 1; then has a VA from the right only at 1; thendips back to very close to e.https://www.desmos.com/calculator/x0cccy1ggj
Chapter 3.6: Sketching Graphs 3.6.3: Second derivative: concavity
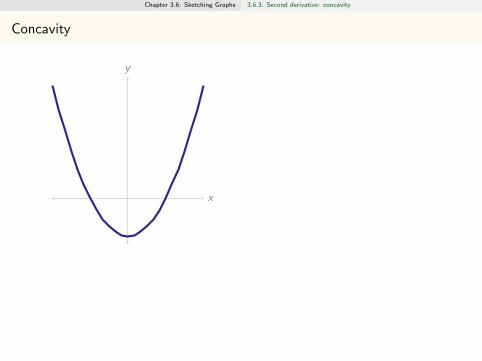
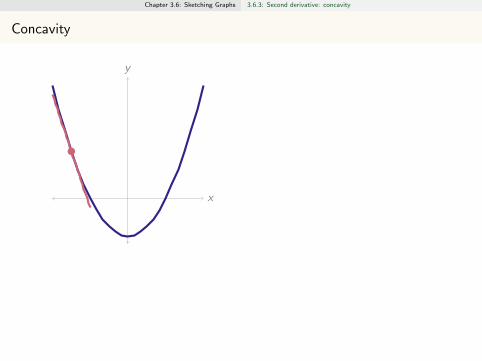
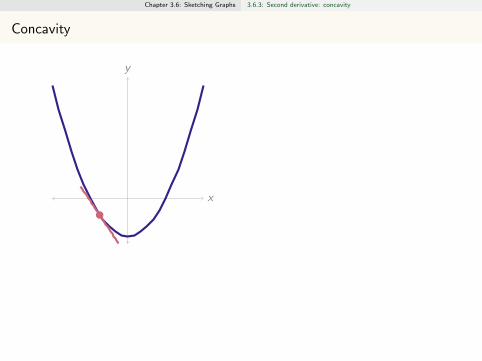
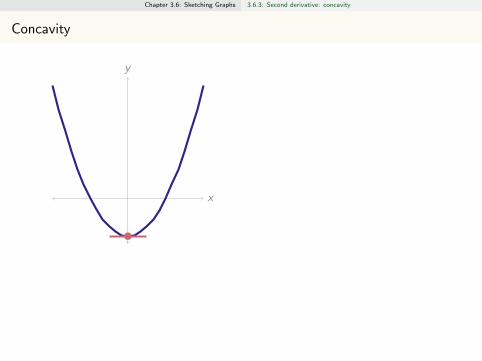
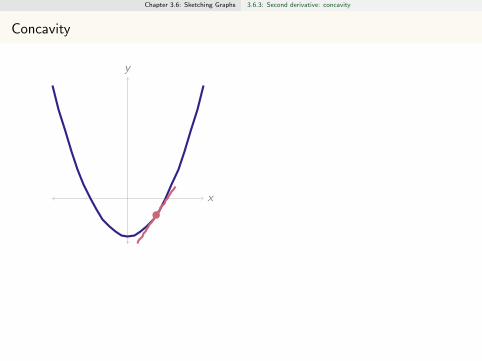
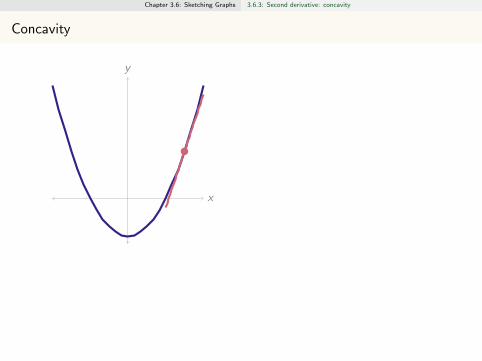
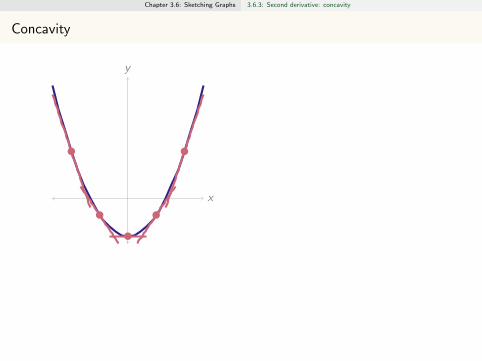
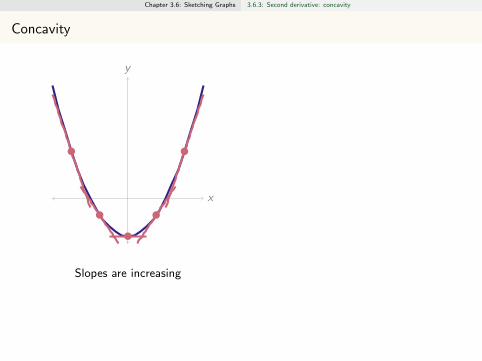
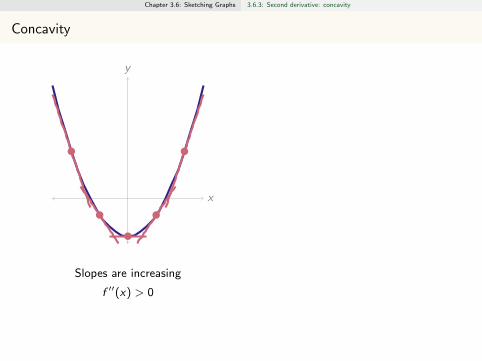
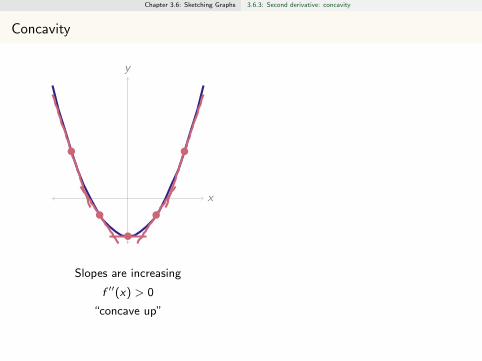
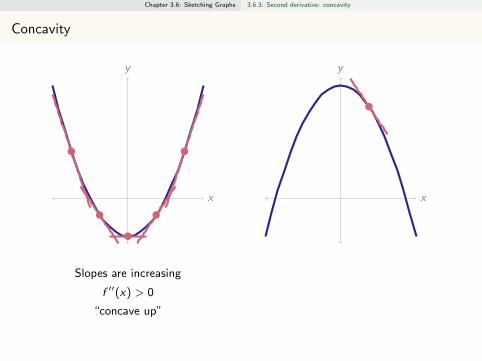
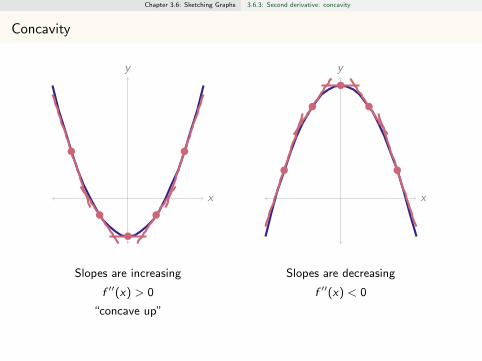
Concavity
x
y
Slopes are increasing
f ′′(x) > 0
“concave up”
tangent line below curve
x
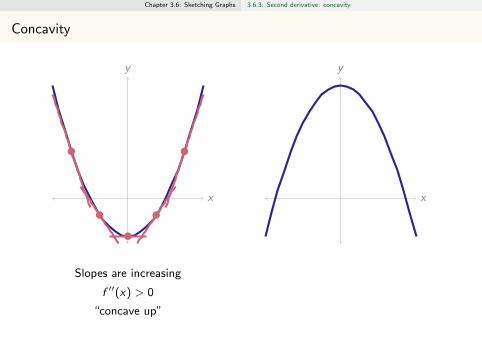
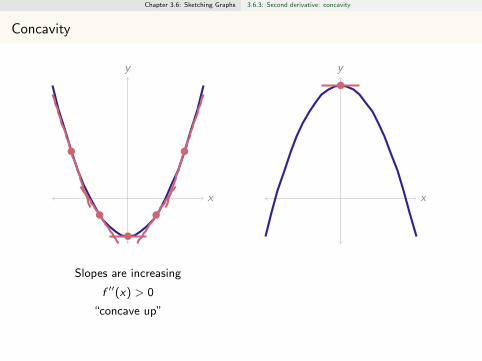
y
Slopes are decreasing
f ′′(x) < 0
“concave down”
tangent line above curve
Chapter 3.6: Sketching Graphs 3.6.3: Second derivative: concavity
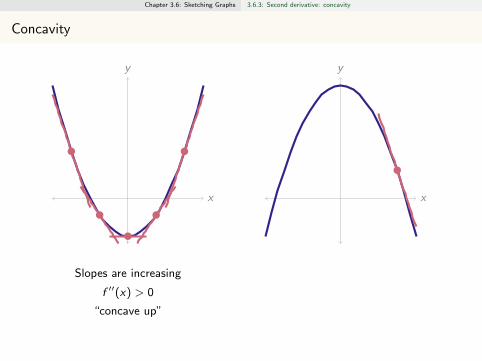
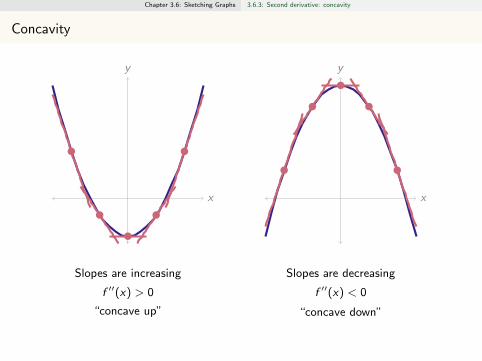
Concavity
x
y
Slopes are increasing
f ′′(x) > 0
“concave up”
tangent line below curve
x
y
Slopes are decreasing
f ′′(x) < 0
“concave down”
tangent line above curve
Chapter 3.6: Sketching Graphs 3.6.3: Second derivative: concavity
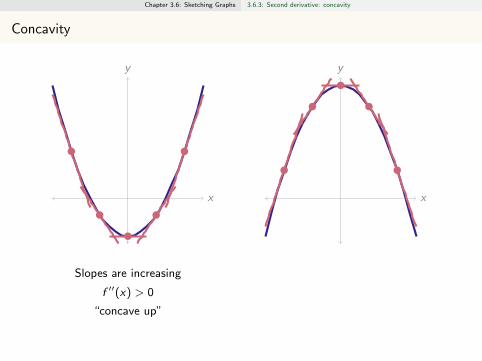
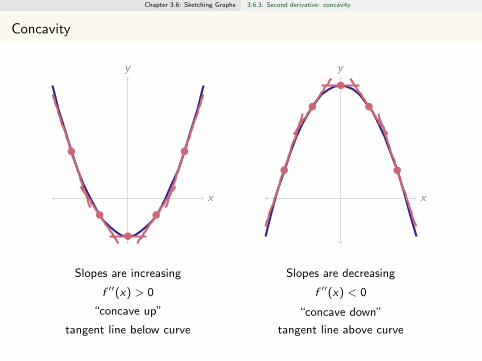
Concavity
x
y
Slopes are increasing
f ′′(x) > 0
“concave up”
tangent line below curve
x
y
Slopes are decreasing
f ′′(x) < 0
“concave down”
tangent line above curve
Chapter 3.6: Sketching Graphs 3.6.3: Second derivative: concavity
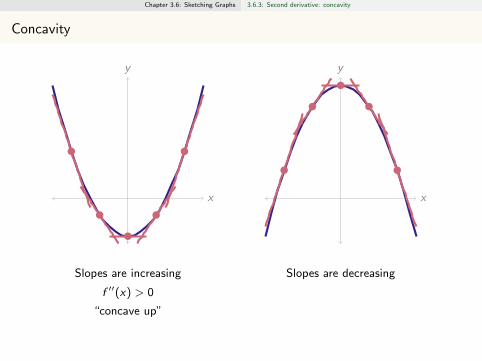
Concavity
x
y
Slopes are increasing
f ′′(x) > 0
“concave up”
tangent line below curve
x
y
Slopes are decreasing
f ′′(x) < 0
“concave down”
tangent line above curve
Chapter 3.6: Sketching Graphs 3.6.3: Second derivative: concavity
Concavity
x
y
Slopes are increasing
f ′′(x) > 0
“concave up”
tangent line below curve
x
y
Slopes are decreasing
f ′′(x) < 0
“concave down”
tangent line above curve
Chapter 3.6: Sketching Graphs 3.6.3: Second derivative: concavity
Concavity
x
y
Slopes are increasing
f ′′(x) > 0
“concave up”
tangent line below curve
x
y
Slopes are decreasing
f ′′(x) < 0
“concave down”
tangent line above curve
Chapter 3.6: Sketching Graphs 3.6.3: Second derivative: concavity
Concavity
x
y
Slopes are increasing
f ′′(x) > 0
“concave up”
tangent line below curve
x
y
Slopes are decreasing
f ′′(x) < 0
“concave down”
tangent line above curve
Chapter 3.6: Sketching Graphs 3.6.3: Second derivative: concavity
Concavity
x
y
Slopes are increasing
f ′′(x) > 0
“concave up”
tangent line below curve
x
y
Slopes are decreasing
f ′′(x) < 0
“concave down”
tangent line above curve
Chapter 3.6: Sketching Graphs 3.6.3: Second derivative: concavity
Concavity
x
y
Slopes are increasing
f ′′(x) > 0
“concave up”
tangent line below curve
x
y
Slopes are decreasing
f ′′(x) < 0
“concave down”
tangent line above curve
Chapter 3.6: Sketching Graphs 3.6.3: Second derivative: concavity
Concavity
x
y
Slopes are increasing
f ′′(x) > 0
“concave up”
tangent line below curve
x
y
Slopes are decreasing
f ′′(x) < 0
“concave down”
tangent line above curve
Chapter 3.6: Sketching Graphs 3.6.3: Second derivative: concavity
Concavity
x
y
Slopes are increasing
f ′′(x) > 0
“concave up”
tangent line below curve
x
y
Slopes are decreasing
f ′′(x) < 0
“concave down”
tangent line above curve

Chapter 3.6: Sketching Graphs 3.6.3: Second derivative: concavity
Concavity
x
y
Slopes are increasing
f ′′(x) > 0
“concave up”
tangent line below curve
x
y
Slopes are decreasing
f ′′(x) < 0
“concave down”
tangent line above curve

Chapter 3.6: Sketching Graphs 3.6.3: Second derivative: concavity
Concavity
x
y
Slopes are increasing
f ′′(x) > 0
“concave up”
tangent line below curve
x
y
Slopes are decreasing
f ′′(x) < 0
“concave down”
tangent line above curve
Chapter 3.6: Sketching Graphs 3.6.3: Second derivative: concavity
Concavity
x
y
Slopes are increasing
f ′′(x) > 0
“concave up”
tangent line below curve
x
y
Slopes are decreasing
f ′′(x) < 0
“concave down”
tangent line above curve
Chapter 3.6: Sketching Graphs 3.6.3: Second derivative: concavity
Concavity
x
y
Slopes are increasing
f ′′(x) > 0
“concave up”
tangent line below curve
x
y
Slopes are decreasing
f ′′(x) < 0
“concave down”
tangent line above curve
Chapter 3.6: Sketching Graphs 3.6.3: Second derivative: concavity
Concavity
x
y
Slopes are increasing
f ′′(x) > 0
“concave up”
tangent line below curve
x
y
Slopes are decreasing
f ′′(x) < 0
“concave down”
tangent line above curve
Chapter 3.6: Sketching Graphs 3.6.3: Second derivative: concavity
Concavity
x
y
Slopes are increasing
f ′′(x) > 0
“concave up”
tangent line below curve
x
y
Slopes are decreasing
f ′′(x) < 0
“concave down”
tangent line above curve
Chapter 3.6: Sketching Graphs 3.6.3: Second derivative: concavity
Concavity
x
y
Slopes are increasing
f ′′(x) > 0
“concave up”
tangent line below curve
x
y
Slopes are decreasing
f ′′(x) < 0
“concave down”
tangent line above curve
Chapter 3.6: Sketching Graphs 3.6.3: Second derivative: concavity
Concavity
x
y
Slopes are increasing
f ′′(x) > 0
“concave up”
tangent line below curve
x
y
Slopes are decreasing
f ′′(x) < 0
“concave down”
tangent line above curve
Chapter 3.6: Sketching Graphs 3.6.3: Second derivative: concavity
Concavity
x
y
Slopes are increasing
f ′′(x) > 0
“concave up”
tangent line below curve
x
y
Slopes are decreasing
f ′′(x) < 0
“concave down”
tangent line above curve
Chapter 3.6: Sketching Graphs 3.6.3: Second derivative: concavity
Concavity
x
y
Slopes are increasing
f ′′(x) > 0
“concave up”
tangent line below curve
x
y
Slopes are decreasing
f ′′(x) < 0
“concave down”
tangent line above curve
Chapter 3.6: Sketching Graphs 3.6.3: Second derivative: concavity
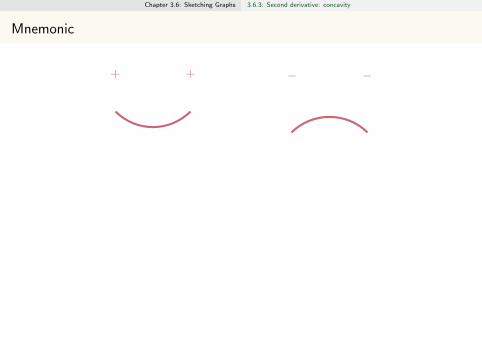
Mnemonic
+ + − −
Chapter 3.6: Sketching Graphs 3.6.3: Second derivative: concavity
Concavity
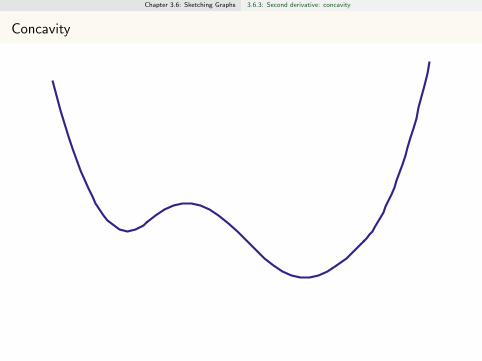
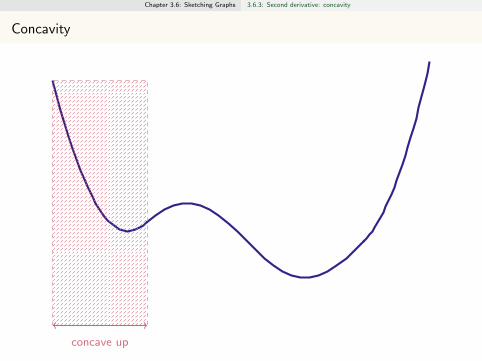
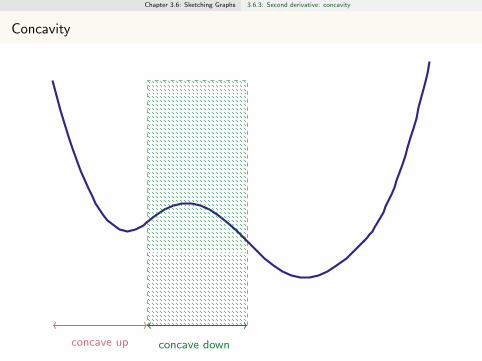
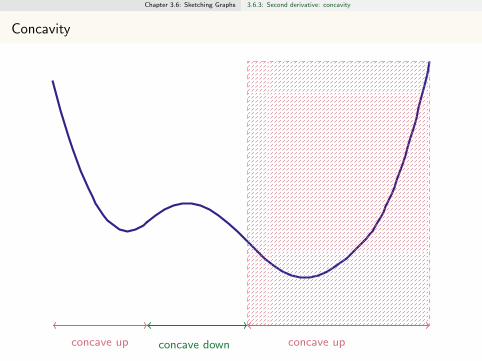
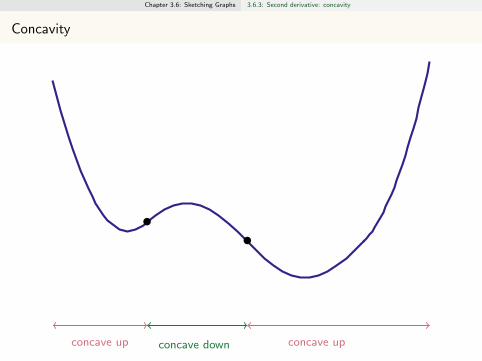
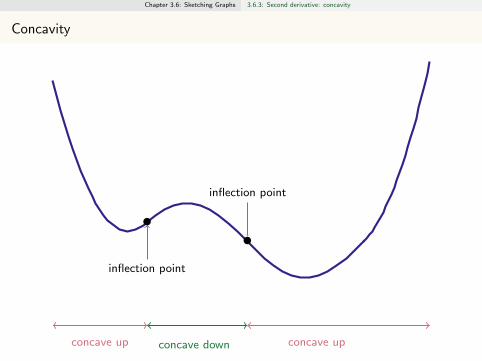
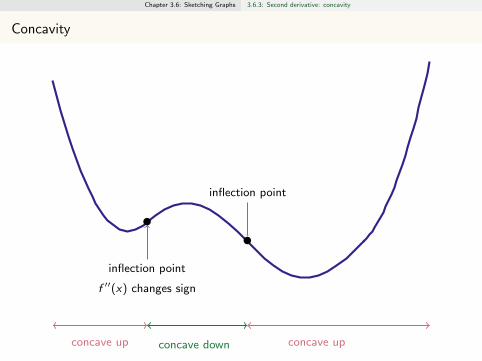
concave up concave down concave up
inflection point
inflection point
f ′′(x) changes sign
Chapter 3.6: Sketching Graphs 3.6.3: Second derivative: concavity
Concavity
concave up
concave down concave up
inflection point
inflection point
f ′′(x) changes sign
Chapter 3.6: Sketching Graphs 3.6.3: Second derivative: concavity
Concavity
concave up concave down
concave up
inflection point
inflection point
f ′′(x) changes sign
Chapter 3.6: Sketching Graphs 3.6.3: Second derivative: concavity
Concavity
concave up concave down concave up
inflection point
inflection point
f ′′(x) changes sign
Chapter 3.6: Sketching Graphs 3.6.3: Second derivative: concavity
Concavity
concave up concave down concave up
inflection point
inflection point
f ′′(x) changes sign
Chapter 3.6: Sketching Graphs 3.6.3: Second derivative: concavity
Concavity
concave up concave down concave up
inflection point
inflection point
f ′′(x) changes sign
Chapter 3.6: Sketching Graphs 3.6.3: Second derivative: concavity
Concavity
concave up concave down concave up
inflection point
inflection point
f ′′(x) changes sign
Chapter 3.6: Sketching Graphs 3.6.3: Second derivative: concavity
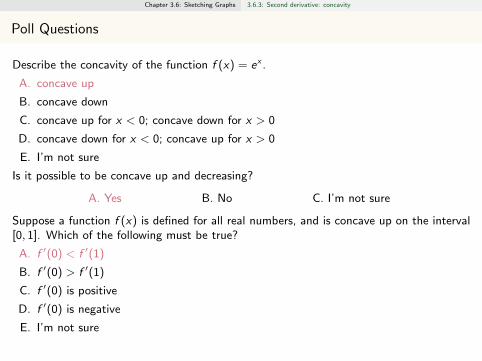
Poll Questions
Describe the concavity of the function f (x) = ex .
A. concave up
B. concave down
C. concave up for x < 0; concave down for x > 0
D. concave down for x < 0; concave up for x > 0
E. I’m not sure
Is it possible to be concave up and decreasing?
A. Yes B. No C. I’m not sure
Suppose a function f (x) is defined for all real numbers, and is concave up on the interval[0, 1]. Which of the following must be true?
A. f ′(0) < f ′(1)
B. f ′(0) > f ′(1)
C. f ′(0) is positive
D. f ′(0) is negative
E. I’m not sure
Chapter 3.6: Sketching Graphs 3.6.3: Second derivative: concavity
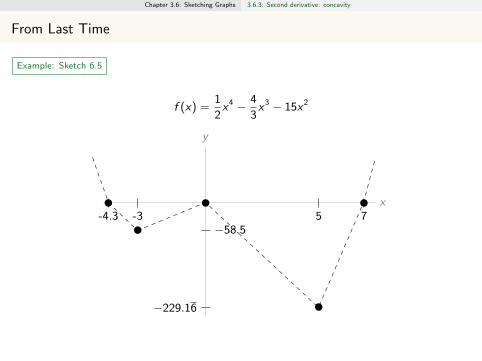
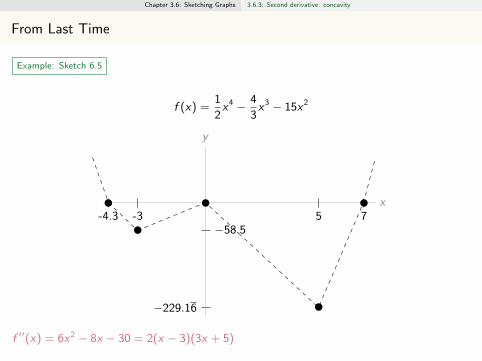
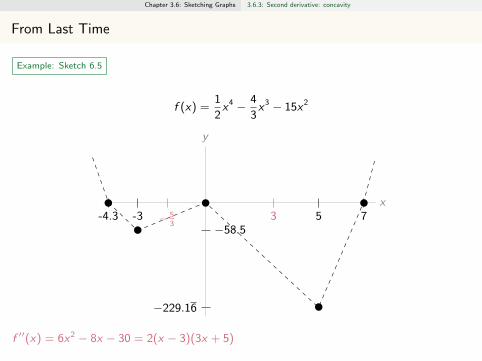
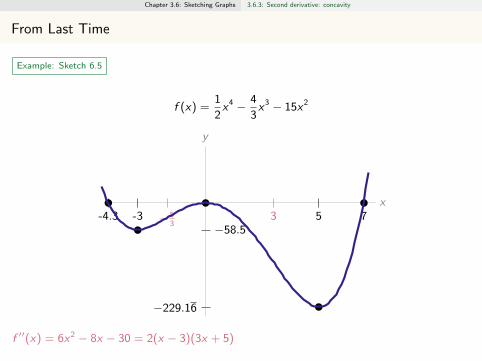
From Last Time
Example: Sketch 6.5
f (x) =1
2x4 − 4
3x3 − 15x2
x
y
-4.3 7-3−58.5
5
−229.16
3− 53
f ′′(x) = 6x2 − 8x − 30 = 2(x − 3)(3x + 5)
Chapter 3.6: Sketching Graphs 3.6.3: Second derivative: concavity
From Last Time
Example: Sketch 6.5
f (x) =1
2x4 − 4
3x3 − 15x2
x
y
-4.3 7-3−58.5
5
−229.16
3− 53
f ′′(x) = 6x2 − 8x − 30 = 2(x − 3)(3x + 5)
Chapter 3.6: Sketching Graphs 3.6.3: Second derivative: concavity
From Last Time
Example: Sketch 6.5
f (x) =1
2x4 − 4
3x3 − 15x2
x
y
-4.3 7-3−58.5
5
−229.16
3− 53
f ′′(x) = 6x2 − 8x − 30 = 2(x − 3)(3x + 5)
Chapter 3.6: Sketching Graphs 3.6.3: Second derivative: concavity
From Last Time
Example: Sketch 6.5
f (x) =1
2x4 − 4
3x3 − 15x2
x
y
-4.3 7-3−58.5
5
−229.16
3− 53
f ′′(x) = 6x2 − 8x − 30 = 2(x − 3)(3x + 5)
Chapter 3.6: Sketching Graphs 3.6.4 : Symmetries
Example: Sketch 7
Sketch:f (x) = x5 − 15x3
Symmetry!•Defined and differentiable for all real numbers.•Roots: x = 0, x = ±
√15 ≈ 4
•Goes to ±∞ as x goes to ±∞•CP: x = 0, x = ±3. Increasing on (−∞,−3), decreasing (−3, 0) and (0, 3), decreasing(3,∞)•So, local max at x = −3 and local min at x = 3•f ′′(x) = 0 for x = 0 and x = ± 3√
2≈ ±2. All of these are inflection points; concave
down (−∞,− 3√2), concave up ( 3√
2, 0), concave down (0, 3√
2), and concave up ( 3√
2,∞).
•f (3) = −162, f (−3) = −162, f (−3/√
2) ≈ 100, f (3/√
2) ≈ −100https://www.desmos.com/calculator/uoii6nmgr8
Chapter 3.6: Sketching Graphs 3.6.4 : Symmetries
Example: Sketch 7
Sketch:f (x) = x5 − 15x3
Symmetry!
•Defined and differentiable for all real numbers.•Roots: x = 0, x = ±
√15 ≈ 4
•Goes to ±∞ as x goes to ±∞•CP: x = 0, x = ±3. Increasing on (−∞,−3), decreasing (−3, 0) and (0, 3), decreasing(3,∞)•So, local max at x = −3 and local min at x = 3•f ′′(x) = 0 for x = 0 and x = ± 3√
2≈ ±2. All of these are inflection points; concave
down (−∞,− 3√2), concave up ( 3√
2, 0), concave down (0, 3√
2), and concave up ( 3√
2,∞).
•f (3) = −162, f (−3) = −162, f (−3/√
2) ≈ 100, f (3/√
2) ≈ −100https://www.desmos.com/calculator/uoii6nmgr8

Chapter 3.6: Sketching Graphs 3.6.4 : Symmetries
Example: Sketch 7
Sketch:f (x) = x5 − 15x3
Symmetry!•Defined and differentiable for all real numbers.•Roots: x = 0, x = ±
√15 ≈ 4
•Goes to ±∞ as x goes to ±∞•CP: x = 0, x = ±3. Increasing on (−∞,−3), decreasing (−3, 0) and (0, 3), decreasing(3,∞)•So, local max at x = −3 and local min at x = 3•f ′′(x) = 0 for x = 0 and x = ± 3√
2≈ ±2. All of these are inflection points; concave
down (−∞,− 3√2), concave up ( 3√
2, 0), concave down (0, 3√
2), and concave up ( 3√
2,∞).
•f (3) = −162, f (−3) = −162, f (−3/√
2) ≈ 100, f (3/√
2) ≈ −100https://www.desmos.com/calculator/uoii6nmgr8

Chapter 3.6: Sketching Graphs 3.6.4 : Symmetries
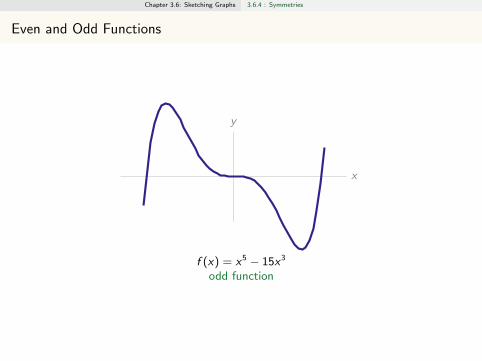
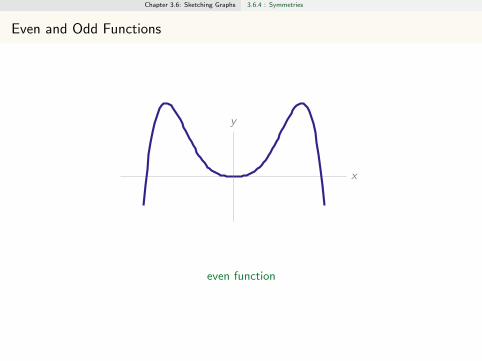
Even and Odd Functions
x
y
f (x) = x5 − 15x3
function
Chapter 3.6: Sketching Graphs 3.6.4 : Symmetries
Even and Odd Functions
x
y
f (x) = x5 − 15x3
odd function

Chapter 3.6: Sketching Graphs 3.6.4 : Symmetries
Even and Odd Functions
x
y
f (x) = x5 − 15x3
function
Chapter 3.6: Sketching Graphs 3.6.4 : Symmetries
Even and Odd Functions
x
y
f (x) = x5 − 15x3
even function
Chapter 3.6: Sketching Graphs 3.6.4 : Symmetries
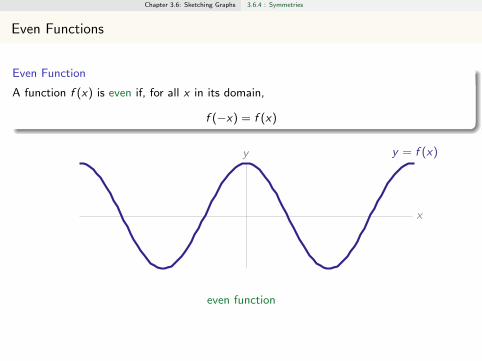
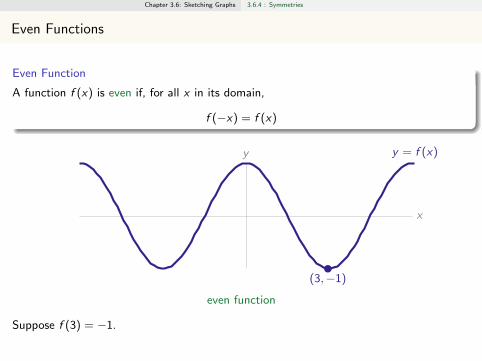
Even Functions
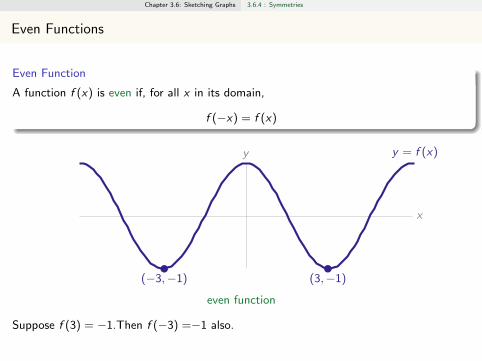
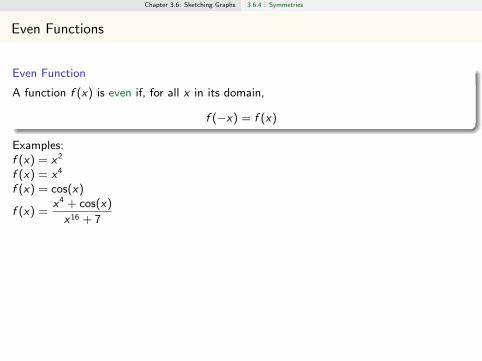
Even Function
A function f (x) is even if, for all x in its domain,
f (−x) = f (x)
x
y y = f (x)
(3,−1)(−3,−1)
(6, 1)(−6, 1)
even function
Suppose f (3) = −1.Then f (−3) =−1 also.Suppose f (6) = 1.Then f (−6) =1 also.
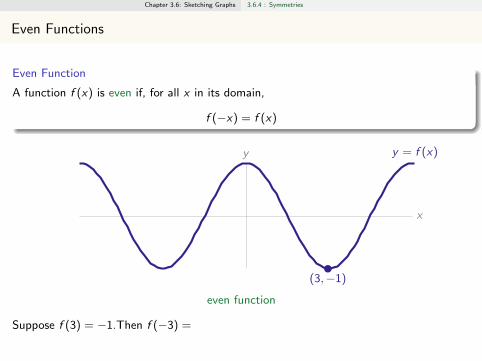
Chapter 3.6: Sketching Graphs 3.6.4 : Symmetries
Even Functions
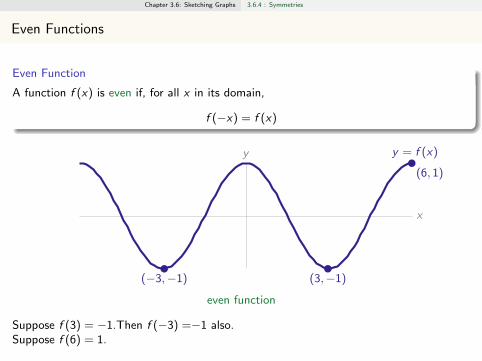
Even Function
A function f (x) is even if, for all x in its domain,
f (−x) = f (x)
x
y y = f (x)
(3,−1)
(−3,−1)
(6, 1)(−6, 1)
even function
Suppose f (3) = −1.
Then f (−3) =−1 also.Suppose f (6) = 1.Then f (−6) =1 also.
Chapter 3.6: Sketching Graphs 3.6.4 : Symmetries
Even Functions
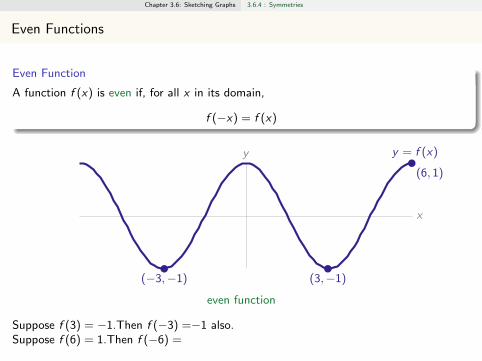
Even Function
A function f (x) is even if, for all x in its domain,
f (−x) = f (x)
x
y y = f (x)
(3,−1)
(−3,−1)
(6, 1)(−6, 1)
even function
Suppose f (3) = −1.Then f (−3) =
−1 also.Suppose f (6) = 1.Then f (−6) =1 also.
Chapter 3.6: Sketching Graphs 3.6.4 : Symmetries
Even Functions
Even Function
A function f (x) is even if, for all x in its domain,
f (−x) = f (x)
x
y y = f (x)
(3,−1)(−3,−1)
(6, 1)(−6, 1)
even function
Suppose f (3) = −1.Then f (−3) =−1 also.
Suppose f (6) = 1.Then f (−6) =1 also.
Chapter 3.6: Sketching Graphs 3.6.4 : Symmetries
Even Functions
Even Function
A function f (x) is even if, for all x in its domain,
f (−x) = f (x)
x
y y = f (x)
(3,−1)(−3,−1)
(6, 1)
(−6, 1)
even function
Suppose f (3) = −1.Then f (−3) =−1 also.Suppose f (6) = 1.
Then f (−6) =1 also.
Chapter 3.6: Sketching Graphs 3.6.4 : Symmetries
Even Functions
Even Function
A function f (x) is even if, for all x in its domain,
f (−x) = f (x)
x
y y = f (x)
(3,−1)(−3,−1)
(6, 1)
(−6, 1)
even function
Suppose f (3) = −1.Then f (−3) =−1 also.Suppose f (6) = 1.Then f (−6) =
1 also.
Chapter 3.6: Sketching Graphs 3.6.4 : Symmetries
Even Functions
Even Function
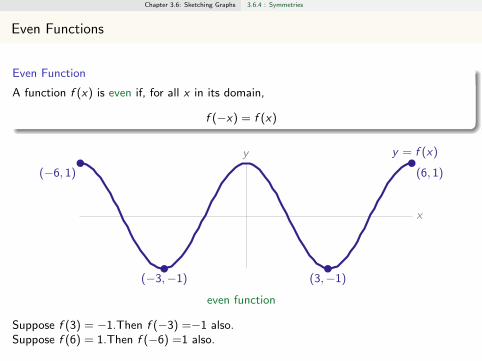
A function f (x) is even if, for all x in its domain,
f (−x) = f (x)
x
y y = f (x)
(3,−1)(−3,−1)
(6, 1)(−6, 1)
even function
Suppose f (3) = −1.Then f (−3) =−1 also.Suppose f (6) = 1.Then f (−6) =1 also.
Chapter 3.6: Sketching Graphs 3.6.4 : Symmetries
Even Functions
Even Function
A function f (x) is even if, for all x in its domain,
f (−x) = f (x)
Examples:
f (x) = x2
f (x) = x4
f (x) = cos(x)
f (x) =x4 + cos(x)
x16 + 7
Chapter 3.6: Sketching Graphs 3.6.4 : Symmetries
Even Functions
Even Function
A function f (x) is even if, for all x in its domain,
f (−x) = f (x)
Examples:f (x) = x2
f (x) = x4
f (x) = cos(x)
f (x) =x4 + cos(x)
x16 + 7
Chapter 3.6: Sketching Graphs 3.6.4 : Symmetries
Even Functions
Even Function
A function f (x) is even if, for all x in its domain,
f (−x) = f (x)
Examples:f (x) = x2
f (x) = x4
f (x) = cos(x)
f (x) =x4 + cos(x)
x16 + 7
Chapter 3.6: Sketching Graphs 3.6.4 : Symmetries
Even Functions
Even Function
A function f (x) is even if, for all x in its domain,
f (−x) = f (x)
Examples:f (x) = x2
f (x) = x4
f (x) = cos(x)
f (x) =x4 + cos(x)
x16 + 7
Chapter 3.6: Sketching Graphs 3.6.4 : Symmetries
Even Functions
Even Function
A function f (x) is even if, for all x in its domain,
f (−x) = f (x)
Examples:f (x) = x2
f (x) = x4
f (x) = cos(x)
f (x) =x4 + cos(x)
x16 + 7
Chapter 3.6: Sketching Graphs 3.6.4 : Symmetries
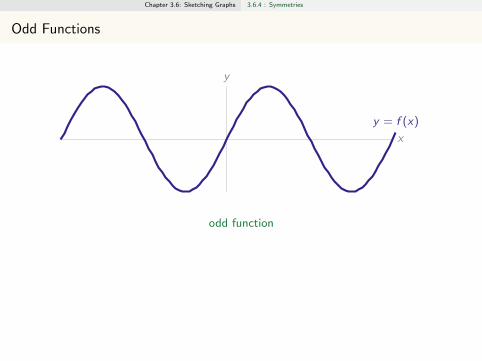
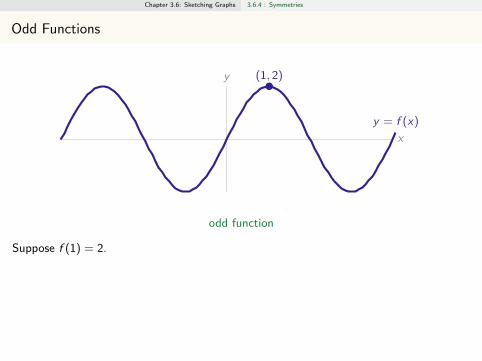
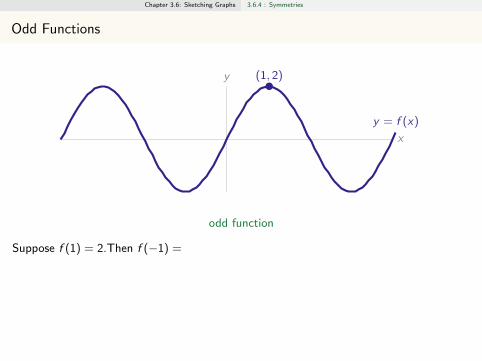
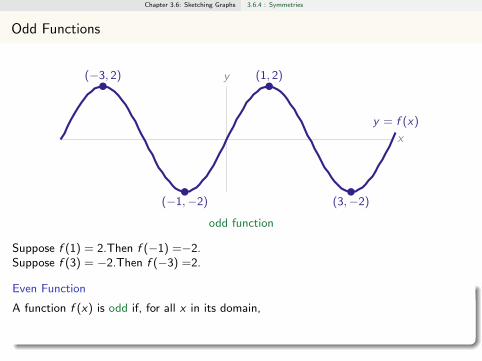
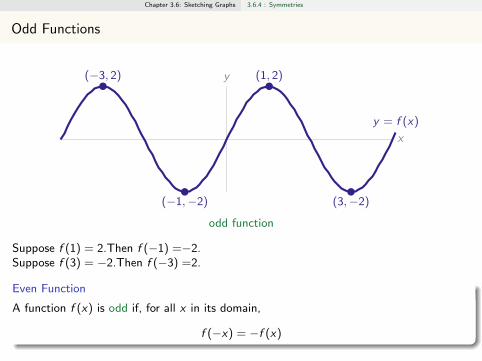
Odd Functions
x
y
y = f (x)
(1, 2)
(−1,−2) (3,−2)
(−3, 2)
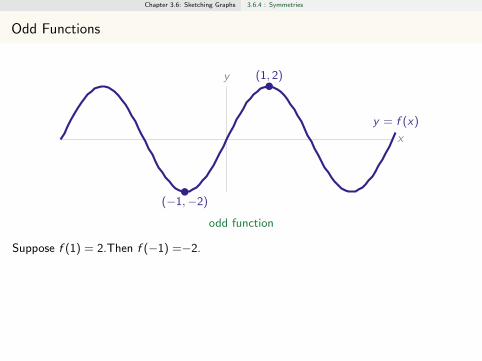
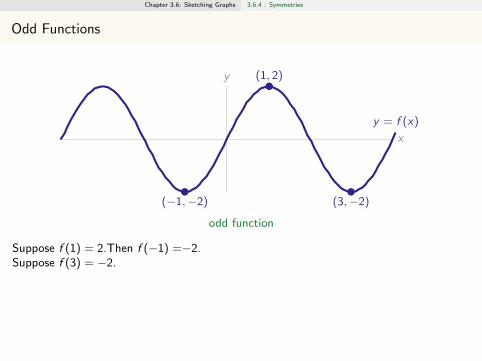
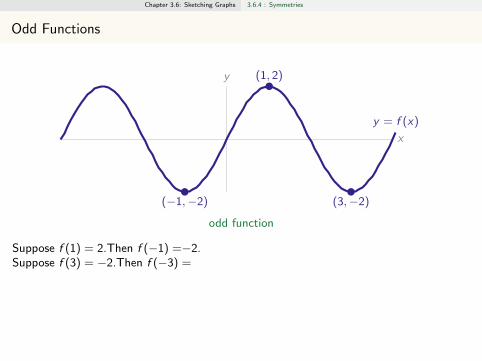
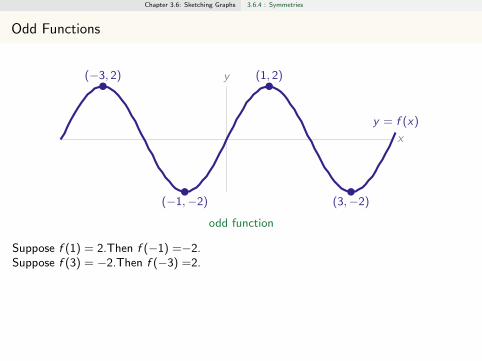
odd function
Suppose f (1) = 2.Then f (−1) =−2.Suppose f (3) = −2.Then f (−3) =2.
Even Function
A function f (x) is odd if, for all x in its domain,
f (−x) = −f (x)
Chapter 3.6: Sketching Graphs 3.6.4 : Symmetries
Odd Functions
x
y
y = f (x)
(1, 2)
(−1,−2) (3,−2)
(−3, 2)
odd function
Suppose f (1) = 2.
Then f (−1) =−2.Suppose f (3) = −2.Then f (−3) =2.
Even Function
A function f (x) is odd if, for all x in its domain,
f (−x) = −f (x)
Chapter 3.6: Sketching Graphs 3.6.4 : Symmetries
Odd Functions
x
y
y = f (x)
(1, 2)
(−1,−2) (3,−2)
(−3, 2)
odd function
Suppose f (1) = 2.Then f (−1) =
−2.Suppose f (3) = −2.Then f (−3) =2.
Even Function
A function f (x) is odd if, for all x in its domain,
f (−x) = −f (x)
Chapter 3.6: Sketching Graphs 3.6.4 : Symmetries
Odd Functions
x
y
y = f (x)
(1, 2)
(−1,−2)
(3,−2)
(−3, 2)
odd function
Suppose f (1) = 2.Then f (−1) =−2.
Suppose f (3) = −2.Then f (−3) =2.
Even Function
A function f (x) is odd if, for all x in its domain,
f (−x) = −f (x)
Chapter 3.6: Sketching Graphs 3.6.4 : Symmetries
Odd Functions
x
y
y = f (x)
(1, 2)
(−1,−2) (3,−2)
(−3, 2)
odd function
Suppose f (1) = 2.Then f (−1) =−2.Suppose f (3) = −2.
Then f (−3) =2.
Even Function
A function f (x) is odd if, for all x in its domain,
f (−x) = −f (x)
Chapter 3.6: Sketching Graphs 3.6.4 : Symmetries
Odd Functions
x
y
y = f (x)
(1, 2)
(−1,−2) (3,−2)
(−3, 2)
odd function
Suppose f (1) = 2.Then f (−1) =−2.Suppose f (3) = −2.Then f (−3) =
2.
Even Function
A function f (x) is odd if, for all x in its domain,
f (−x) = −f (x)
Chapter 3.6: Sketching Graphs 3.6.4 : Symmetries
Odd Functions
x
y
y = f (x)
(1, 2)
(−1,−2) (3,−2)
(−3, 2)
odd function
Suppose f (1) = 2.Then f (−1) =−2.Suppose f (3) = −2.Then f (−3) =2.
Even Function
A function f (x) is odd if, for all x in its domain,
f (−x) = −f (x)
Chapter 3.6: Sketching Graphs 3.6.4 : Symmetries
Odd Functions
x
y
y = f (x)
(1, 2)
(−1,−2) (3,−2)
(−3, 2)
odd function
Suppose f (1) = 2.Then f (−1) =−2.Suppose f (3) = −2.Then f (−3) =2.
Even Function
A function f (x) is odd if, for all x in its domain,
f (−x) = −f (x)
Chapter 3.6: Sketching Graphs 3.6.4 : Symmetries
Odd Functions
x
y
y = f (x)
(1, 2)
(−1,−2) (3,−2)
(−3, 2)
odd function
Suppose f (1) = 2.Then f (−1) =−2.Suppose f (3) = −2.Then f (−3) =2.
Even Function
A function f (x) is odd if, for all x in its domain,
f (−x) = −f (x)
Chapter 3.6: Sketching Graphs 3.6.4 : Symmetries
Even Functions
Even Function
A function f (x) is odd if, for all x in its domain,
f (−x) = −f (x)
Examples:
f (x) = xf (x) = x3
f (x) = sin(x)
f (x) =x(1 + x2)
x2 + 5
Chapter 3.6: Sketching Graphs 3.6.4 : Symmetries
Even Functions
Even Function
A function f (x) is odd if, for all x in its domain,
f (−x) = −f (x)
Examples:f (x) = x
f (x) = x3
f (x) = sin(x)
f (x) =x(1 + x2)
x2 + 5
Chapter 3.6: Sketching Graphs 3.6.4 : Symmetries
Even Functions
Even Function
A function f (x) is odd if, for all x in its domain,
f (−x) = −f (x)
Examples:f (x) = xf (x) = x3
f (x) = sin(x)
f (x) =x(1 + x2)
x2 + 5

Chapter 3.6: Sketching Graphs 3.6.4 : Symmetries
Even Functions
Even Function
A function f (x) is odd if, for all x in its domain,
f (−x) = −f (x)
Examples:f (x) = xf (x) = x3
f (x) = sin(x)
f (x) =x(1 + x2)
x2 + 5
Chapter 3.6: Sketching Graphs 3.6.4 : Symmetries
Even Functions
Even Function
A function f (x) is odd if, for all x in its domain,
f (−x) = −f (x)
Examples:f (x) = xf (x) = x3
f (x) = sin(x)
f (x) =x(1 + x2)
x2 + 5
Chapter 3.6: Sketching Graphs 3.6.4 : Symmetries
Poll Tiiime
Pick out the odd function.
A:
x
y
B:
x
y
C:
x
y
D:
x
y

Chapter 3.6: Sketching Graphs 3.6.4 : Symmetries
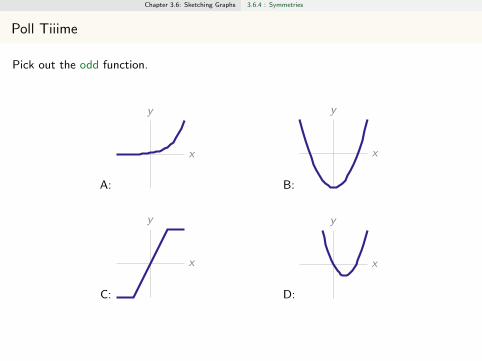
Poll Tiiime
Pick out the odd function.
A:
x
y
B:
x
y
C:
x
y
D:
x
y
Chapter 3.6: Sketching Graphs 3.6.4 : Symmetries
Poll Tiiime
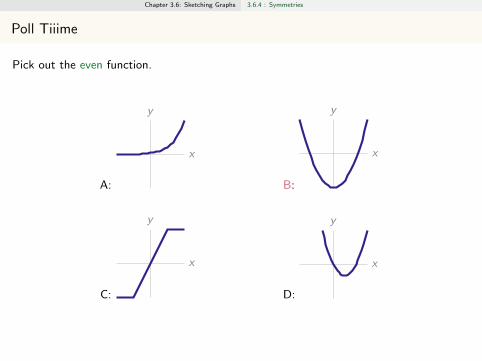
Pick out the even function.
A:
x
y
B:
x
y
C:
x
y
D:
x
y
Chapter 3.6: Sketching Graphs 3.6.4 : Symmetries
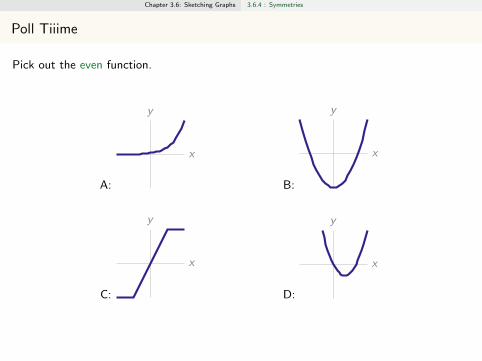
Poll Tiiime
Pick out the even function.
A:
x
y
B:
x
y
C:
x
y
D:
x
y
Chapter 3.6: Sketching Graphs 3.6.4 : Symmetries
Even more Poll tiiiiime
Suppose f (x) is an odd function, continuous, defined for all real numbers. What is f (0)?Pick the best answer.
A. f (0) = f (−0)
<— true but uninteresting, for all functions
B. f (0) = −f (0)
<— only possible for f (0) = 0
C. f (0) = 0
<— this is equivalent to the choice above
D. all of the above are true
E. none of the above are necessarily true
Chapter 3.6: Sketching Graphs 3.6.4 : Symmetries
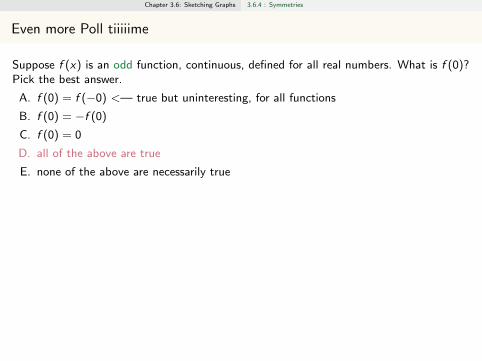
Even more Poll tiiiiime
Suppose f (x) is an odd function, continuous, defined for all real numbers. What is f (0)?Pick the best answer.
A. f (0) = f (−0) <— true but uninteresting, for all functions
B. f (0) = −f (0)
<— only possible for f (0) = 0
C. f (0) = 0
<— this is equivalent to the choice above
D. all of the above are true
E. none of the above are necessarily true
Chapter 3.6: Sketching Graphs 3.6.4 : Symmetries
Even more Poll tiiiiime
Suppose f (x) is an odd function, continuous, defined for all real numbers. What is f (0)?Pick the best answer.
A. f (0) = f (−0) <— true but uninteresting, for all functions
B. f (0) = −f (0) <— only possible for f (0) = 0
C. f (0) = 0 <— this is equivalent to the choice above
D. all of the above are true
E. none of the above are necessarily true
Chapter 3.6: Sketching Graphs 3.6.4 : Symmetries
Even more and more Poll tiiiiime
Suppose f (x) is an even function, continuous, defined for all real numbers. What is f (0)?Pick the best answer.
A. f (0) = f (−0)
B. f (0) = −f (0)
C. f (0) = 0
D. all of the above are true
E. none of the above are necessarily true
Chapter 3.6: Sketching Graphs 3.6.4 : Symmetries
OK OK... last one
Suppose f (x) is an even function, differentiable for all real numbers. What can we sayabout f ′(x)?
A. f ′(x) is also even
B. f ′(x) is odd
C. f ′(x) is constant
D. all of the above are true
E. none of the above are necessarily true
Chapter 3.6: Sketching Graphs 3.6.4 : Symmetries
Periodicity
Periodic
A function is periodic with period P if
f (x) = f (x + P)
whenever x and x + P are in the domain of f , and P is the smallest such (positive)number
Examples: sin(x), cos(x) both have period 2π; tan(x) has period π.
Chapter 3.6: Sketching Graphs 3.6.4 : Symmetries
Example: Sketch 8
f (x) = sin(sin x)
(ignore concavity)
Example: Sketch 9
g(x) = sin(2π sin x)

Chapter 3.6: Sketching Graphs 3.6.4 : Symmetries
Example: Sketch 8
f (x) = sin(sin x)
(ignore concavity)
Example: Sketch 9
g(x) = sin(2π sin x)
Chapter 3.6: Sketching Graphs 3.6.5: A checklist for sketching
Let’s Graph
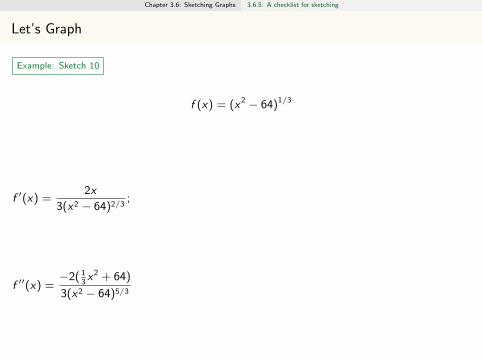
Example: Sketch 10
f (x) = (x2 − 64)1/3
f ′(x) =2x
3(x2 − 64)2/3;
f ′′(x) =−2( 1
3x2 + 64)
3(x2 − 64)5/3
Chapter 3.6: Sketching Graphs 3.6.5: A checklist for sketching
Let’s Graph
Example: Sketch 10
f (x) = (x2 − 64)1/3
f ′(x) =2x
3(x2 − 64)2/3;
f ′′(x) =−2( 1
3x2 + 64)
3(x2 − 64)5/3
Chapter 3.6: Sketching Graphs 3.6.5: A checklist for sketching
Let’s Graph
Example: Sketch 11
f (x) =x2 + x
(x + 1)(x2 + 1)2
Note for x 6= −1, f (x) =x(x + 1)
(x + 1)(x2 + 1)2=
x
(x2 + 1)2
Example: Sketch 12
g(x) :=x
(x2 + 1)2
g ′(x) =1− 3x2
(x2 + 1)3; g ′′(x) =
12x(x2 − 1)
(x2 + 1)4

Chapter 3.6: Sketching Graphs 3.6.5: A checklist for sketching
Let’s Graph
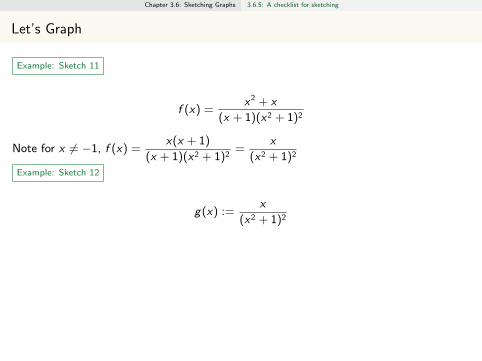
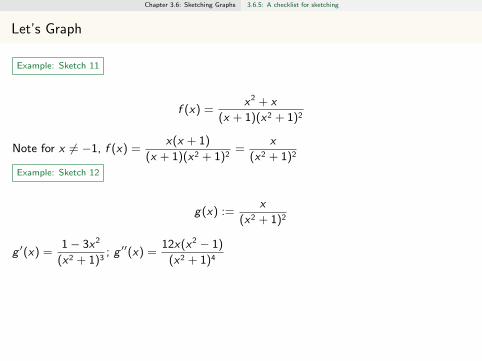
Example: Sketch 11
f (x) =x2 + x
(x + 1)(x2 + 1)2
Note for x 6= −1, f (x) =x(x + 1)
(x + 1)(x2 + 1)2=
x
(x2 + 1)2
Example: Sketch 12
g(x) :=x
(x2 + 1)2
g ′(x) =1− 3x2
(x2 + 1)3; g ′′(x) =
12x(x2 − 1)
(x2 + 1)4
Chapter 3.6: Sketching Graphs 3.6.5: A checklist for sketching
Let’s Graph
Example: Sketch 11
f (x) =x2 + x
(x + 1)(x2 + 1)2
Note for x 6= −1, f (x) =x(x + 1)
(x + 1)(x2 + 1)2=
x
(x2 + 1)2
Example: Sketch 12
g(x) :=x
(x2 + 1)2
g ′(x) =1− 3x2
(x2 + 1)3; g ′′(x) =
12x(x2 − 1)
(x2 + 1)4
Chapter 3.6: Sketching Graphs 3.6.5: A checklist for sketching
Let’s Graph
Example: Sketch 11
f (x) =x2 + x
(x + 1)(x2 + 1)2
Note for x 6= −1, f (x) =x(x + 1)
(x + 1)(x2 + 1)2=
x
(x2 + 1)2
Example: Sketch 12
g(x) :=x
(x2 + 1)2
g ′(x) =1− 3x2
(x2 + 1)3; g ′′(x) =
12x(x2 − 1)
(x2 + 1)4
Chapter 3.6: Sketching Graphs 3.6.5: A checklist for sketching
Let’s Graph
Example: Sketch 13
f (x) = x(x − 1)2/3

Chapter 3.6: Sketching Graphs 3.6.5: A checklist for sketching
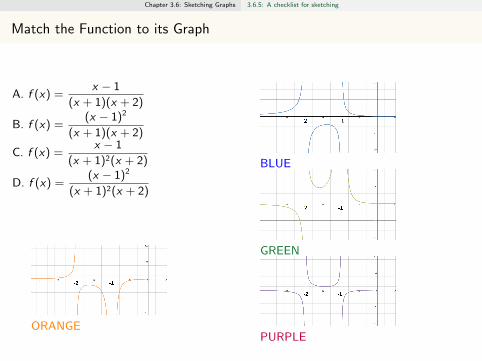
Match the Function to its Graph
A. f (x) =x − 1
(x + 1)(x + 2)
B. f (x) =(x − 1)2
(x + 1)(x + 2)
C. f (x) =x − 1
(x + 1)2(x + 2)
D. f (x) =(x − 1)2
(x + 1)2(x + 2)
BLUE
GREEN
PURPLEORANGE
Chapter 3.6: Sketching Graphs 3.6.5: A checklist for sketching
Match the Function to its Graph
A. f (x) =x − 1
(x + 1)(x + 2)
B. f (x) =(x − 1)2
(x + 1)(x + 2)
C. f (x) =x − 1
(x + 1)2(x + 2)
D. f (x) =(x − 1)2
(x + 1)2(x + 2)
BLUE
GREEN
PURPLEORANGE
Chapter 3.6: Sketching Graphs 3.6.5: A checklist for sketching
Match the Function to its Graph
A. f (x) = x3(x + 2)(x − 2) = x5 − 4x3
B. f (x) = x(x + 2)3(x − 2) = x5 + 4x4 − 16x2 − 16xC. f (x) = x(x + 2)(x − 2)3 = x5 − 4x4 + 16x2 − 16x
PURPLE BLACK
ORANGE
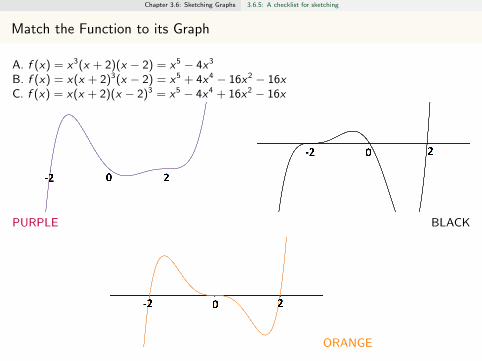
Chapter 3.6: Sketching Graphs 3.6.5: A checklist for sketching
Match the Function to its Graph
A. f (x) = x3(x + 2)(x − 2) = x5 − 4x3
B. f (x) = x(x + 2)3(x − 2) = x5 + 4x4 − 16x2 − 16xC. f (x) = x(x + 2)(x − 2)3 = x5 − 4x4 + 16x2 − 16x
PURPLE BLACK
ORANGE
Chapter 3.6: Sketching Graphs 3.6.5: A checklist for sketching
Match the Function to its Graph
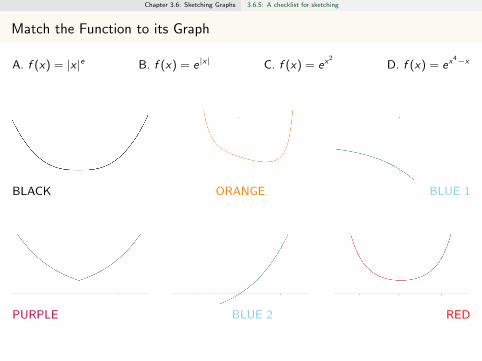
A. f (x) = |x |e B. f (x) = e|x| C. f (x) = ex2
D. f (x) = ex4−x
BLACK ORANGE BLUE 1
PURPLE BLUE 2 RED
Chapter 3.6: Sketching Graphs 3.6.5: A checklist for sketching
Match the Function to its Graph
A. f (x) = x5 + 15x3 B. f (x) = x5 − 15x3 C. f (x) = x5 − 15x2
D. f (x) = x3 − 15x E. f (x) = x7 − 15x4
Chapter 3.6: Sketching Graphs 3.6.5: A checklist for sketching
Match the Function to its Graph
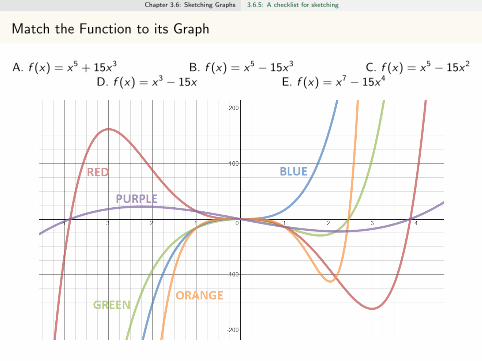
A. f (x) = x5 + 15x3 B. f (x) = x5 − 15x3 C. f (x) = x5 − 15x2
D. f (x) = x3 − 15x E. f (x) = x7 − 15x4


