
Deliverable report D3.1.5
Integrated Project (IP) Thematic Priority 6: Project No. TIP5-CT-2006-031415 Sustainable Development, Global Change and Ecosystems
Recommendation of, and
scientific basis for,
optimisation of switches &
crossings – part 1
INNOTRACK GUIDELINE

Recommendation of, and scientific basis for, optimisation of switches & crossings – part 1
INNOTRACK 2 . TIP5-CT-2006-031415
Table of Contents
1. Executive Summary ................................................................................................. 3
2. Introduction ............................................................................................................... 5 2.1. Bibliography ................................................................................................................ 6
3. Optimisation of geometry and stiffness in the switch panel ..................... 7 3.1. Background .................................................................................................................. 7 3.2. Track gauge optimisation ....................................................................................... 8
3.2.1. Through route ..................................................................................................................... 9 3.2.2. Diverging route ................................................................................................................ 12
3.3. Track stiffness optimisation ................................................................................13 3.4. Recommendation .....................................................................................................17 3.5. Future work ...............................................................................................................18 3.6. Bibliography ..............................................................................................................19
4. Optimisation of stiffness and geometry in the crossing panel .............. 20 4.1. Background ................................................................................................................20 4.2. Optimisation of transition geometry ................................................................21 4.3. Simulation results ....................................................................................................23 4.4. Conclusions and recommendations ..................................................................26 4.5. Future work ...............................................................................................................26 4.6. Bibliography ..............................................................................................................27
5. Conclusions .............................................................................................................. 28
6. Annexes ..................................................................................................................... 30

Recommendation of, and scientific basis for, optimisation of switches & crossings – part 1
INNOTRACK 3 . TIP5-CT-2006-031415
1. Executive Summary
The objective of INNOTRACK SP3.1 (task 3.1.6 Optimisation) is the development of innovative S&C (Switches & Crossings) designs that
allow for increased axle loads and speeds and that lead to a
decreased need for maintenance. The present report provides a
guideline for the optimisation of geometry and support stiffness in
the switch and crossing panels.
To meet these aims, simulation tools have been used to calculate
wheel-rail contact forces, wheel-rail contact stresses, wear index and
a rolling contact fatigue (RCF) index at key components in the S&C.
As reported in INNOTRACK deliverable 3.1.4, these tools have been validated with respect to results from a field test.
Railway vehicles often experience significant lateral displacements,
sometimes leading to wheel flange contact, when running in the
switch panel. This leads to increased wheel and rail wear and
sometimes RCF problems on the rails, requiring increased supervision and maintenance and reducing the life of the
components.
To find means to improve the switch panel design, the geometry of a
designed track gauge variation in the switch panel has been modelled in a parametric way. This was done for one type of turnout. For
traffic in the facing and trailing moves of the through route, an
optimum solution was identified and then validated by evaluating a
wider set of simulation cases (different wheel profiles). The optimum design includes a 12 mm maximum gauge widening. The main
benefits obtained by the proposed design are a significant reduction
of wear along the switch panel and a significant reduction of traction
coefficient, and therefore improved behaviour in terms of RCF. The
methodology can be applied to other types of turnout designs.
Severe impact loads may be generated when wheels transfer
between wing rail and crossing nose in the crossing panel. Thus,
another objective has been to optimise the crossing geometry and the
support stiffness of the superstructure in order to reduce the contact stresses induced by the wheels.
The numerical assessment of contact loads for a crossing panel with
reduced support stiffness (by means of elastic rail pads) instead of
Recommendation of, and scientific basis for, optimisation of switches & crossings – part 1
INNOTRACK 4 . TIP5-CT-2006-031415
the standard support stiffness shows that impact loads can be
reduced considerably especially for crossing negotiation at high
speed. Investigations of different crossing geometries show that it is difficult to find a solution that leads to a force reduction for all wheel
profiles occurring in service. Nevertheless, the MaKüDe crossing
design showed the best performance for moderately worn wheel
profiles in both running directions (facing and trailing moves). In combination with a reduced support stiffness, this crossing design
will lead to a significant reduction of the impact loads and
consequently has a high potential for LCC (Life Cycle Cost) reduction.
Field and laboratory testing of new S&C designs will be performed
within INNOTRACK SP3. Some tests have started, whereas some are still being planned. To enable an assessment of the influence of the
new designs on the long-term degradation of S&C, these field tests
will not be finished and reported before the end of INNOTRACK. A
report on results from field tests of different crossing designs at test site Haste in Germany will be reported in INNOTRACK deliverable
3.1.8 (due in December 2010). Results from field tests (Frankfurt and
Wirtheim, Germany) of modified stiffness in the switch panel will be
reported in INNOTRACK deliverable 3.19 (due in January 2011).
Finally, the results from a field test (Eslöv, Sweden) of new S&C designs will be reported in INNOTRACK deliverable 3.1.10 (due in
May 2011).

Recommendation of, and scientific basis for, optimisation of switches & crossings – part 1
INNOTRACK 5 . TIP5-CT-2006-031415
2. Introduction
The different components of a switch & crossing (S&C, turnout,
point) are illustrated in Figure 2.1 [2.1]. The through and diverging
routes are shown. Traffic in the facing move means that traffic is travelling from the switch panel to the crossing panel. Consequently,
traffic in the trailing move means traffic travelling in the opposite
direction.
Dynamics and damage of S&C are surveyed in the state-of-the-art
report by Sällström et al [2.2]. Mathematical modelling, numerical
simulation and field testing of dynamic vehicle–track interaction in S&C are treated by Kassa [2.3]. Statistics on the need for maintenance
in S&C have been presented by Nissen [2.4].
INNOTRACK deliverable 3.1.4 contains a validation of the simulation
models used here and a pre-report on the optimisation of S&C [2.5].
Figure 2.1. Components of a turnout with through and diverging routes. From [1]
front of turnout
rear of turnout
through rails
stock rails
check rails
closure rails
switch rails
wing rails crossing nose
switch heels
switch toes flange way
switching machines
crossing panel switch panel closure panel
through
diverging
Facing Move Trailing Move

Recommendation of, and scientific basis for, optimisation of switches & crossings – part 1
INNOTRACK 6 . TIP5-CT-2006-031415
The optimisation of stiffness and geometry in the switch panel was
performed by Manchester Metropolitan University (Rail Technology
Unit at the Department of Engineering and Technology). Section 3 in this guideline was written by Dr Elias Kassa. The optimisation of
stiffness and geometry in the crossing panel was performed by
Deutsche Bahn AG (Systemverbund Bahn, DB Systemtechnik).
Section 4 in this guideline was written by Mr Dirk Nicklisch. The guideline was edited by Prof Jens Nielsen of Chalmers University of
Technology (CHARMEC at the Department of Applied Mechanics).
2.1. Bibliography
2.1 E Kassa and J C O Nielsen, Dynamic interaction between train
and railway turnout – full-scale field test and validation of
simulation models. Vehicle System Dynamics Vol 46, Issue S1 &
2, 521-534, 2008
2.2 J H Sällström, T Dahlberg, M Ekh and J C O Nielsen, State-of-the
art study on railway turnouts – dynamics and damage, Research
Report, Department of Applied Mechanics, Chalmers University of
Technology, Gothenburg, Sweden, 50 pp, 2002
2.3 E Kassa, Dynamic train–turnout interaction – mathematical
modelling, numerical simulations and field testing, PhD thesis, Department of Applied Mechanics, Chalmers University of
Technology, Gothenburg, Sweden, 2007
2.4 A Nissen, Analys av statistic om spårväxlars underhållsbehov
(Analysis of statistics on the need for maintenance in switches
& crossings, in Swedish), Licentiate Thesis, Avdelning för drift
och underhåll, Luleå Technical University, JvtC – Railway research centre, Luleå, Sweden, 2005
2.5 J C O Nielsen (editor), Summary of results from simulations and
optimisation of switches, INNOTRACK deliverable 3.1.4, 35 pp
and 4 annexes, December 2008

Recommendation of, and scientific basis for, optimisation of switches & crossings – part 1
INNOTRACK 7 . TIP5-CT-2006-031415
3. Optimisation of geometry and stiffness in the switch panel
3.1. Background
In S&C, when a vehicle is running in the diverging route, large lateral wheelset displacements are developed leading to severe flange
contact with the curved switch rail. This is mainly due to the abrupt
change in track curvature and the large cant deficiency. It has also
been observed that vehicles running on the through route in the switch panel often experience significant lateral wheelset
displacements, sometimes leading to flange contact with the straight
switch rail. These flange contacts result in an increase in wear of the
switch rails and on some occasions in RCF problems on the rails,
requiring increased inspection and maintenance and leading to reduced life of the components.
Simulations of a train passing an S&C in both routes, and in facing
and trailing moves, have been performed using the MBS package
SIMPACK to understand the underlying phenomena and to devise a strategy for the gauge optimisation process, see also [3.1]. A freight
vehicle model, with a car body and two Y25 bogies, is used. In the
simulations the vehicle model is allowed to run on a length of tangent
track before entering the turnout which has constant curvature
geometry. The optimisation process was performed for a standard S&C design (UIC60-760-1:15) with curve radius 760 m and turnout
angle 1:15.
The rail cross-section varies continuously along the switch panel. At
switch panel entry, there is only one full rail cross-section on each side of the track. Additional rails are then introduced on each side,
with their cross-sections varying from a thin section at the switch toe
to a full-sized rail cross-section at the switch heel. These additional
rails lead to a continuous change in track stiffness, which has been
shown by track receptance measurements at several locations in an S&C, see [3.2].
The objective has been to optimise the vertical track stiffness in the
switch panel, possibly by adjusting the rail pad stiffness or by use of
under sleeper pads. In this way, the abrupt changes in track stiffness,

Recommendation of, and scientific basis for, optimisation of switches & crossings – part 1
INNOTRACK 8 . TIP5-CT-2006-031415
due to the appearance of two rails and changes in rail cross-section,
could be reduced and wheel-rail contact forces minimised. In
addition, optimisation of track gauge at the switch panel entry, where the curvature changes abruptly, has been performed and the
effectiveness of dynamic gauge widening techniques to reduce
tangential contact forces and hence wear of the switch rail has been
assessed.
3.2. Track gauge optimisation To balance the artificial gauge increase generated due to the contact
point trajectories in the switch panel, two possible dynamic gauge
widening geometries are proposed, one for each route. The geometry
is parameterised by three variables. It consists of four circular curves, see Figure 3.1. Dynamic gauge widening applies a continuous
variation of the gauge by moving the stock rails laterally at the switch
entry which results in a gauge increase. The optimisation process has
been carried out using only one type of vehicle model, a freight
vehicle model with Y25 bogies, and a typical wheel profile in the simulations. The optimised geometry was then evaluated with
several load cases consisting of 18 different measured wheel profiles
in terms of wear index, normal contact forces, RCF index and contact
point position on the rail.
Figure 3.1. Gauge optimisation parameters
R1
L1
LJump
LTotal
ROut d

Recommendation of, and scientific basis for, optimisation of switches & crossings – part 1
INNOTRACK 9 . TIP5-CT-2006-031415
3.2.1. Through route
The geometry of the gauge variation is represented parametrically by
three variables. For a more thorough discussion on the geometrical
representation, see [3.3]. Finding an optimal design for the dynamic
gauge widening is performed by varying the values of the maximum gauge widening amplitude. Several outputs were assessed to
determine the optimal dynamic gauge widening geometry, see [3.1]
for the full report. Here, some selected results from the study are
discussed. Figure 3.2 shows the influence of different gauge widening amplitudes on the normal wheel-rail contact force. The results are
compared with the nominal design. The smallest (8 mm) and the
highest (20 mm) amplitude designs result in high transients between
8 to 8.5 m from switch entry. This happens when the load is fully transferred from a two-point contact (the first contact point is the
contact on the stock rail whereas the second contact point is the
contact on the switch rail) to a single-point contact on the switch rail.
For the other studied gauge widening amplitudes, there is no
significant change in the normal contact force before or after the contact jump. However, the appearance of the second contact point,
contact on the switch rail, is delayed by 30 – 40 cm.
For the two contact points, the calculated wear indices along the
switch panel for all levels of gauge widening amplitudes are shown in Figure 3.3. Wear index is calculated as the product of the creep forces
and creepages in the longitudinal and lateral directions. It is
observed that the application of a dynamic gauge widening leads to a
reduction in wear index along the switch panel, and that the
maximum value of the wear index is reduced considerably for gauge widening amplitudes 8 mm – 16 mm. However, the 20 mm gauge
amplitude leads to an increase in wear index, and the reduction using
the 18 mm gauge amplitude design is not significant compared to the
other designs.

Recommendation of, and scientific basis for, optimisation of switches & crossings – part 1
INNOTRACK 10 . TIP5-CT-2006-031415
0
100
200
Nor
mal
for
ce −
1st [k
N]
7.5 8 8.5 9 9.5 10 10.50
100
200
Distance [m]
Nor
mal
forc
e −
2nd
[kN
]
8 mm12 mm16 mm18 mm20 mmnominal
Figure 3.2. Wheel-rail normal contact force in the switch panel for different gauge widening amplitudes. First contact point (top), second contact point
(bottom). Train in facing move of through route
0
20
40
60
80
Tγ
− 1
st [N
]
7 8 9 10 110
20
40
60
80
Distance [m]
Tγ
− 2
nd [N
]
8 mm12 mm16 mm18 mm20 mmnominal
Figure 3.3. Wear index (Tγ) in the switch panel for different gauge widening amplitudes. First contact point (top), second contact point (bottom). Train in
facing move of through route
Recommendation of, and scientific basis for, optimisation of switches & crossings – part 1
INNOTRACK 11 . TIP5-CT-2006-031415
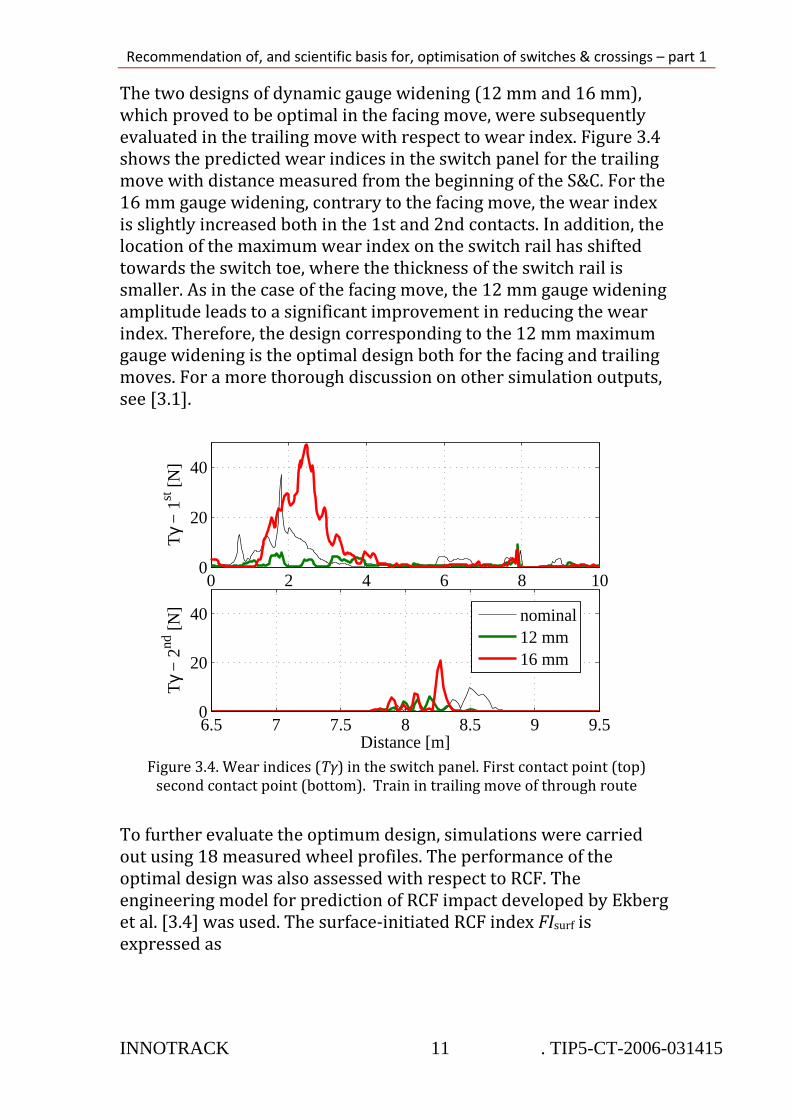
The two designs of dynamic gauge widening (12 mm and 16 mm),
which proved to be optimal in the facing move, were subsequently
evaluated in the trailing move with respect to wear index. Figure 3.4 shows the predicted wear indices in the switch panel for the trailing
move with distance measured from the beginning of the S&C. For the
16 mm gauge widening, contrary to the facing move, the wear index
is slightly increased both in the 1st and 2nd contacts. In addition, the location of the maximum wear index on the switch rail has shifted
towards the switch toe, where the thickness of the switch rail is
smaller. As in the case of the facing move, the 12 mm gauge widening
amplitude leads to a significant improvement in reducing the wear
index. Therefore, the design corresponding to the 12 mm maximum gauge widening is the optimal design both for the facing and trailing
moves. For a more thorough discussion on other simulation outputs,
see [3.1].
To further evaluate the optimum design, simulations were carried
out using 18 measured wheel profiles. The performance of the
optimal design was also assessed with respect to RCF. The
engineering model for prediction of RCF impact developed by Ekberg et al. [3.4] was used. The surface-initiated RCF index FIsurf is
expressed as
0 2 4 6 8 100
20
40
Tγ
− 1
st [
N]
6.5 7 7.5 8 8.5 9 9.50
20
40
Distance [m]
Tγ
− 2
nd [
N]
nominal12 mm16 mm
Figure 3.4. Wear indices (Tγ) in the switch panel. First contact point (top)
second contact point (bottom). Train in trailing move of through route

Recommendation of, and scientific basis for, optimisation of switches & crossings – part 1
INNOTRACK 12 . TIP5-CT-2006-031415
π+−
2 2
surf
n n
2=
3
x yT T abkFI
F F (1)
where Fn is the normal contact force, Tx and Ty are the creep forces in
the longitudinal and lateral directions, a and b are the semi-axes of the Hertzian contact patch, and k is the yield limit in pure shear (here
taken as 300 MPa). Surface-initiated RCF is predicted to occur if
FIsurf > 0. Based on simulations with 18 different wheel profiles, the
maximum FIsurf is shown in Figure 3.5. The limit for RCF prediction is exceeded at more locations for the nominal S&C design compared to
the gauge optimised geometry.
Thus, with the adopted geometrical representation of gauge
widening, the switch panel design corresponding to the 12 mm
maximum gauge widening is the optimal design for the through route, both for the facing and trailing moves.
5 10 15 20
−0.2
−0.1
0
0.1
0.2
0.3
Distance [m]
FI su
rf
12 mm 1st
12 mm 2nd
nominal 1st
nominal 2nd
Figure 3.5. Maximum RCF index along the switch panel for the nominal and optimised geometry. Train in facing move of through route
3.2.2. Diverging route
The aim of the gauge variation is to relieve the flange contact on the
switch rail at an early stage by steering the wheel towards the other
rail. Here, three levels of maximum gauge increase {8 mm, 12 mm
and 18 mm} were studied.
Based on simulations in the facing move for the nominal design and
with dynamic gauge widening, Figure 3.6 shows the wear indices for

Recommendation of, and scientific basis for, optimisation of switches & crossings – part 1
INNOTRACK 13 . TIP5-CT-2006-031415
all gauge amplitudes in the switch panel for the first and second
contact points. No significant improvement is obtained with respect
to the wear index for any of the three levels of gauge widening amplitudes. Thus, another type of gauge widening geometry, with
more design parameters, needs to be investigated to improve the
design of the diverging route.
0
500
1000
Tγ
− 1
st [N
]
0 5 10 15 200
500
1000
Distance [m]
Tγ
− 2
nd [N
]
nominal8 mm12 mm18 mm
Figure 3.6. Wear indices (Tγ) in the switch panel with three gauge widening
amplitudes. First contact point (top), second contact point (bottom). Train in
facing move of diverging route
3.3. Track stiffness optimisation
Measured track receptances, with single point excitation applied on
the rail head of the switch and stock rails both in the vertical and lateral directions, have been used to characterise the track. The
receptance was measured at several locations along a similar turnout
at Härad in Sweden [3.2], and the values measured at three locations
in the switch panel (4.5 m, 9.1 m and 21.85 m from the front of the S&C) were used to determine input data for a track model that was
used to optimise the track stiffness in the switch panel.
Two track models have been compared, see Figure 3.7. The first
model has three degrees-of-freedom (dof), while the second track
model has seven dof with two additional masses incorporated to represent the rail masses and two spring-damper pairs to represent
the combined rail and rail pad stiffness, see [3.1] for more detail. The

Recommendation of, and scientific basis for, optimisation of switches & crossings – part 1
INNOTRACK 14 . TIP5-CT-2006-031415
track model parameter values are varying along the switch panel.
This is done by varying the values of the rigid masses and the spring-
damper elements within the model.
kbv kbv
kby
cby cbv cbv
mt, J
kbv kbv
kpv kpz
kpy kpy
kby cpy cpy
cby
cpz cpv
cbv cbv
mr mr
mt, J
Figure 3.7. Moving track model with 3 dof (left) and 7 dof (right)
It was observed that the rail (and rail pad) stiffness at the second
measurement location (9.1 m) was increased by 40% compared to the corresponding stiffness at measurement point 1 (4.5 m). The
stiffness increased by 70% at the third measurement location
(21.85 m) compared to the first point.
Vertical track receptance measured close to the front of the turnout (4.5 m) and the corresponding calculated receptances based on the
two moving track models are illustrated in Figure 3.8. The first
resonance is obtained at about 30 Hz. A second resonance is obtained
at about 320 Hz. The magnitude of the calculated receptance is in good agreement with the measured receptance up to 400 Hz for the
seven-dof model and up to 150 Hz for the three-dof model.
101
102
103
10−6
10−5
10−4
Am
plitu
de [m
/kN
]
Frequency [ Hz ]
101
102
103
−150
−100
−50
0
Pha
se [
° ]
Frequency [ Hz ]
Measured 7 dof 3 dof
Figure 3.8. Calculated and measured vertical receptance amplitudes (left) and phase angle (right)

Recommendation of, and scientific basis for, optimisation of switches & crossings – part 1
INNOTRACK 15 . TIP5-CT-2006-031415
Compared to the track model that was tuned based on track
receptance measurements, the value of the rail/rail pad stiffness (kp)
in the first stiffness optimisation model, (kp_v1), was increased by 30% at location 1 and reduced by 15 % at location 3, keeping the
value at location 2 unchanged. This gives rise to a smaller change of
kp-values along the switch panel: 416 MN/m, 448 MN/m,
462.4 MN/m at locations 1, 2 and 3, respectively. The stiffness values in the second model (kp_v2) leads to a further reduction of the
stiffness increase between location 1 and location 3, down to about
8 %. This is obtained by increasing the value of kp at location 1 by
28 % from the measured value, and reducing it by 6 % and 19 % at
locations 2 and 3, respectively. This gives values of kp at the three locations of 409.6 MN/m, 441.6 MN/m, and 454.4 MN/m. The
stiffness variation is now relatively constant throughout the switch
panel. This can be achieved by placing stiffer rail pads starting from
some distance before the front of the turnout and softer rail pads close to the switch heel.
The optimisation was performed for one load case. The vehicle model
was simulated in the facing move of the through route and with the
three different track stiffness arrangements: nominal (kp_nom),
variation 1 (kp_v1), and variation 2 (kp_v2). Figure 3.9 shows the wear indices for the three stiffness variation cases. The maximum
wear index for the second contact point (at about 8.2 m) for the
nominal case is 10 N. A slight reduction is obtained, 9.3 N and 7.5 N,
when using the kp_v1 and kp_v2, model arrangements, respectively.
Together with the kp-variation, an optimisation of the spring-damper
element stiffness for the sleeper/ballast structure (kb) has also been
considered. The kb stiffness value was increased by 20% at location 1,
reduced by 10% at location 2 and reduced by 20% at location 3,
corresponding to 39 MN/m, 41 MN/m and 46.8 MN/m, respectively.

Recommendation of, and scientific basis for, optimisation of switches & crossings – part 1
INNOTRACK 16 . TIP5-CT-2006-031415
0
5
10
15
Tγ
− 1
st [N
]
6 7 8 9 10 11 12 130
5
10
15
Distance [m]
Tγ
− 2
nd [N
]
kp_nom
kp_v2
kp_v1
Figure 3.9. Wear indices (Tγ) for three variations of kp. First contact point
(top), second contact point (bottom). Train in facing move of through route
Wear indices along the switch panel for different combinations of
variations in kp and kb are shown in Figure 3.10. Maintaining the nominal kp-values, while varying kb, reduces the wear index at the
second contact point by almost 50 %, from 10 N to 5.3 N. A relatively
large reduction in the wear index is obtained when optimised kp and
kb stiffness values are used in combination. The reduction is seen
both at the first and second contact points. At the first contact point, the maximum wear index (at 10.7 m) is reduced by 50 % from 18.9 N
to 9.5 N. The maximum wear index at the second contact is reduced
by more than the sum of the individual reduction to only 2.2 N, i.e. an
80 % reduction is obtained.

Recommendation of, and scientific basis for, optimisation of switches & crossings – part 1
INNOTRACK 17 . TIP5-CT-2006-031415
0
5
10
15
Tγ
− 1
st [N
]
6 7 8 9 10 11 12 130
5
10
15
Distance [m]
Tγ
− 2
nd [N
]
kp_nom k
b_nom
kp_v2 k
b_nom
kp_v2 k
b_v1
kp_nom k
b_v1
Figure 3.10. Wear indices (Tγ) with combinations of variations in kp and kb.
First contact point (top), second contact point (bottom). Train in facing move
of through route
3.4. Recommendation Based on the performed simulations, it has been shown that the application of gauge widening in the switch panel has a strong
potential in reducing wear and RCF.
The proposed geometry modification with a widening of the gauge at
switch entry could relieve the flange contact with the switch rail at
the early stage by steering the wheel towards the other rail. In
addition, with this geometry modification, the tip of the switch rail could be thicker which gives more material for wear and hence
reduces LCC for the switch.
The optimisation process was performed for a standard S&C design
(UIC60-760-1:15) with curve radius 760 m. The optimal gauge
widening amplitude for this design is 12 mm resulting in an
improved performance. The results may not be directly applicable to other designs; however, the conclusion could give a good
approximation. The same methodology can be applied to other S&C
designs. The geometry modification can easily be incorporated into
new designs without extra cost. It can also be incorporated in

Recommendation of, and scientific basis for, optimisation of switches & crossings – part 1
INNOTRACK 18 . TIP5-CT-2006-031415
existing designs without further investigation as the maximum gauge
variation (12 mm) could be within the tolerance limit.
For track stiffness optimisation, two alternative stiffness variation
models were considered. The influences on wear index and wheel-
rail contact forces were investigated. The stiffness variation is expected to be achieved by varying the rail pad stiffness along the
switch panel and by applying under sleeper pads. Placing stiffer rail
pads starting from some distance before the front of the turnout and
softer rail pads close to the switch heel can improve the smoothing of the large change in track stiffness along the switch panel. A
considerable reduction in wear index is obtained (up to 80% on the
peak value) when varying the kp stiffness by a maximum of ±30% and
kb stiffness values by a maximum of ±20%.
3.5. Future work
The gauge optimisation presented here was based on the position of
the contact point jump location for one type of traffic (freight vehicle
with Y25 bogies). However, in practice, for the same turnout
geometry design, the position of the contact point jump varies a lot due to several variables related to different types of passing train.
Therefore, the outcome of this study should be taken as a preliminary
result, and a more thorough analysis including other load cases and
scatter in load conditions should be considered in the optimisation
process. The optimisation process assumed only one type of gauge widening geometry with a single variable (maximum gauge
widening). Other types of gauge widening geometry, with more
design variables, could be investigated.
The track model used here is not sufficient to carry out a comprehensive track stiffness optimisation exercise. One deficiency
of the present track model is that the interaction of adjacent
wheelsets, through the rail, is not accounted for. In addition, the
flexibilities of the different components (rail and rail pad) are lumped
into a single stiffness value, and its variation along the switch is not well represented. Therefore, a more advanced track model, based on
an FE model that can describe all the different flexible components
and represent the stiffness variation along the turnout more
accurately, see for example [3.5], is required.
Only an optimisation of vertical track stiffness was covered in this
study. An optimisation of lateral track stiffness could also be
Recommendation of, and scientific basis for, optimisation of switches & crossings – part 1
INNOTRACK 19 . TIP5-CT-2006-031415
performed, mainly for the diverging track. In addition, different
countries adopt different rail inclinations in turnouts. The influence
of rail inclination could also be investigated to identify an optimum inclination.
3.6. Bibliography
3.1 E Kassa, S Iwnicki, J Perez, P Allen, Y Bezin, Optimisation of
track gauge and track stiffness along a switch using a multibody simulation tool, to be published in the Proceedings
of the 21st International Symposium on Dynamics of Vehicles
on Roads and Tracks, Stockholm, Sweden, August 17 – 21,
2009, 12 pages
3.2 E Kassa and J C O Nielsen, Data from field test in turnout in
Härad, INNOTRACK Technical report, 19 pp, June 2007
3.3 J Perez, Optimisation of the dynamic gauge for railway
switches, INNOTRACK Technical report, December 2008, 25 pp
(Appendix C in D3.1.4)
3.4 A. Ekberg, E. Kabo, and H. Andersson, An engineering model for
prediction of rolling contact fatigue of railway wheels. Fatigue
& Fracture of Engineering Materials & Structures, 25(10), p.
899-909, 2002
3.5 E. Kassa and J.C.O. Nielsen, Dynamic train-turnout interaction
in an extended frequency range using a detailed model of track dynamics. Journal of Sound and Vibration, 320(4-5),
p. 893-914, 2009

Recommendation of, and scientific basis for, optimisation of switches & crossings – part 1
INNOTRACK 20 . TIP5-CT-2006-031415
4. Optimisation of stiffness and geometry in the crossing panel
4.1. Background One objective of INNOTRACK SP3.1 is to optimise the transition
geometry and support stiffness of the superstructure in order to minimise the material degradation induced by wheels passing the
frog (crossing nose and wing rails). For this purpose, the influence of
different system parameters on impact loads generated on a German
standard crossing EH 60-500-1:12 has been studied. Several
alternative frog geometries have been investigated.
The simulations were carried out by DB Systemtechnik using the MBS package SIMPACK. Because of the higher speed and
consequently higher impact loads compared to the diverging route,
only the through route of the turnout was considered.
The influence of operational and service conditions was studied by
varying the following parameters:
• static wheel load,
• speed, • wheel profile,
• initial lateral wheel position at crossing entry,
• track stiffness, unsupported sleepers,
• running direction (facing and trailing move).
The simulations were performed with complete 3-dimensional
vehicle models of a Loco BR 101 and of an ICE-T coach (BR 411), representing two different wheel loads (Loco BR 101: Q0 = 107 kN,
ICE-T coach: Q0 = 67 kN). Three different wear states of the wheel
profiles were used: nominal S1002, medium-worn and hollow worn.
The track was represented by a finite element model (FEM)
consisting of elastic rails and elastically supported elastic sleepers.
More details are given in [4.1].
The investigation was based on the assumption that the maximum
normal wheel-rail contact force is representative for the material
degradation of the frog. To verify this approach, it was decided to use
Kalker’s CONTACT program for additional calculations of the

Recommendation of, and scientific basis for, optimisation of switches & crossings – part 1
INNOTRACK 21 . TIP5-CT-2006-031415
maximum contact stresses for some selected load cases. The result of
Kalker’s linear-elastic material model is the 3-dimensional stress
state within the discretised contact patch from which the equivalent
von Mises stress has been determined, for details see [4.2].
4.2. Optimisation of transition geometry Regarding the optimisation of transition geometry of rigid (non-
movable) crossings, two general approaches have been studied. The
first one has the target to prevent the wheel from making contact with the crossing nose at a section being too weak to withstand the
impact loads. The second approach aims at smoothing the vertical
wheel movement during the transition between wing rail and
crossing nose to reduce the impact loads. Based on these approaches
the following solutions were investigated by simulations:
• Reduction of the flangeway width between crossing nose and wing rail within the allowed tolerances in order to delay the
transition area to a thicker cross-section of the crossing nose;
• Profiling of the frog by following a kinked ramp to decrease the
gradient of the vertical wheel movement after transition to the crossing nose (optimisation for facing move);
• Superelevation of the wing rail and profiling with a negative
wheel shape to reduce the vertical wheel movement (MaKüDe).
Examples of the improved curves of the vertical wheel movement
compared to what is obtained for the nominal frog geometry are
shown in Figure 4.1. This figure also contains a short version of the kinked ramp which has the same effect on the impact loads in the
transition area as the longer version.
Furthermore, another modification of the nominal crossing design
was investigated which was initiated by the known problem of wing
rail damage caused by hollow worn wheels passing in the trailing
move. In trailing move, the outer section of a hollow worn wheel arrives too deep and hits the gauge corner of the wing rail. To avoid
this, a small chamfer was added on the wing rail flange to reduce the
contact angle when the wheel is transferred to the wing rail. This
effect is illustrated in Figure 4.2. More details regarding the
investigated designs can be found in [4.1].

Recommendation of, and scientific basis for, optimisation of switches & crossings – part 1
INNOTRACK 22 . TIP5-CT-2006-031415
EH60-500-1:12 - Comparison of vertical wheel movement (profile S1002)
-4
-3.5
-3
-2.5
-2
-1.5
-1
-0.5
0
0.5
1
-1.5 -1 -0.5 0 0.5 1 1.5 2 2.5 3
distance [m]
vert
ical
dis
pla
cem
ent
[mm
]
kinked ramp kinked ramp (short) 41mm flangeway wing rail MaKüDe nomial frog geometry
C - C
H K
N
facing move
Figure 4.1: Influence of geometric frog design on vertical wheel movement, with
point N indicating the tip of the crossing nose (s = 0 m)
-18
-16
-14
-12
-10
-8
-6
-4
-2
0
-50 -30 -10 10 30 50 70 90 110 130
Figure 4.2: Contact situations at the point of wheel transition for new and hollow
-worn wheel profiles on a chamfered wing rail. The severely worn wheel (green thick line) will be transferred at the green cross-section with a deep chamfer, the moderately hollow worn wheel (blue thick line) at the blue cross-section with a shallow chamfer and the new wheel (brown thick line) at the nominal transition
point represented by the red cross-section

Recommendation of, and scientific basis for, optimisation of switches & crossings – part 1
INNOTRACK 23 . TIP5-CT-2006-031415
4.3. Simulation results In the following, the most important simulation results are
presented. More details can be found in [4.1] and [4.2].
The results of the investigation regarding track stiffness are
illustrated in Figure 4.3. An interesting result is that a reduction of
track stiffness from 500 kN/mm to 85 kN/mm, due to the use of
elastic rail pads, leads to significantly lower normal contact forces
and an increasing effect with increasing speed. Also in the case of one unsupported sleeper below the transition area of the crossing,
slightly reduced impact loads can be observed. Thus the modification
of track stiffness in the crossing panel indicates a high potential for
reduction of material degradation of frogs.
Maximum Normal Force in dependency on Speed and Track StiffnessLoco BR101 (Q0 = 107 kN), S1002, EH 60-500-1:12, facing move
0
50
100
150
200
250
300
350
400
230 200 160 120 25
Speed [km/h]
Nm
ax [
kN]
85 kN/mm
85 kN/mm with unsupp. sleeper
500 kN/mm
500 kN/mm with unsupp. sleeper
Figure 4.3: Influence of train speed and track stiffness on the maximum normal contact force
Maximum normal contact forces and maximum equivalent stresses
for the alternative crossing designs are presented in Figure 4.4. For
the theoretical S1002 wheel profile, the biggest force reduction (up to 50 kN) can be reached with the kinked ramp design whereas the
MaKüDe design leads to even higher normal contact forces than the
nominal design. This is caused by the steep gradient of the wheel
movement after transition to the frog, see Figure 4.1. For worn wheels, the effect is inverted. Here the MaKüDe design provides by
far the lowest normal contact forces. For the medium-worn wheel

Recommendation of, and scientific basis for, optimisation of switches & crossings – part 1
INNOTRACK 24 . TIP5-CT-2006-031415
profile, the MaKüDe design leads to a peak force reduction of nearly
50 %.
Looking at the calculated equivalent von Mises stresses, different
trends than for the normal contact forces can be observed. The
reason is that the maximum normal contact force usually occurs at a different location than the maximum equivalent stress because, due
to the differences of the rail profile geometry, at some locations
relatively low normal forces may cause very high stresses and vice
versa, see Figure 4.5. Hence, small changes of contact conditions (contact radii) may lead to big variations in contact stresses. Only for
the MaKüDe design passed by worn wheels, both an evaluation in
terms of maximum normal contact force and equivalent contact
stress lead to the same conclusion. In this case, the MaKüDe design
provides the best performance with respect to both criteria.
It should be noted that the contact stresses are evaluated from simulations featuring a linear-elastic material model. Calculated
stress values higher than the yield limit are unrealistic and indicate
that in reality plastic deformation will occur. Consequently, in
practice, a quick adaptation of the rail shape will be observed at these positions of the crossing leading to a significant stress reduction. In
parallel, strain hardening will increase the resistance of the frog
material. Thus, for practical applications, it seems to be more
relevant to compare impact forces than linear-elastic contact
stresses.

Recommendation of, and scientific basis for, optimisation of switches & crossings – part 1
INNOTRACK 25 . TIP5-CT-2006-031415
Figure 4.4: Influence of transition geometry and wheel profile on maximum normal contact force and equivalent stress
0
50
100
150
200
250
300
350
400
22.10 22.15 22.20 22.25 22.30 22.35 22.40 22.45 22.50
distance [m]
No
rmal
Fo
rce
[kN
]
0
500
1000
1500
2000
2500
3000
3500
4000
von
Mis
es S
tres
s [M
Pa]
normal force
equivalent stress
running direction (facing move)
1 2 3
Figure 4.5: Normal contact force evaluated for a Loco BR 101 passing at v = 160 km/h with wheel profile S1002 in centred position (1 – wheel transition from wing rail to frog, 2 – maximum equivalent stress, 3 – maximum normal
force)

Recommendation of, and scientific basis for, optimisation of switches & crossings – part 1
INNOTRACK 26 . TIP5-CT-2006-031415
4.4. Conclusions and recommendations For a German rigid frog EH 60-500-1:12, the influence of different
system parameters on the impact loads has been studied by means of MBS simulations with SIMPACK. The investigation was focused on
the vertical track stiffness in the crossing panel and on the transition
geometry which is represented by the vertical wheel movement
when passing the crossing.
It was shown that impact loads can be reduced considerably,
especially for crossings passed at high speed, if a reduced support stiffness is introduced by means of elastic rail pads. However, it has
to be considered that the possible softening of the elastic foundation
may be limited due to potential fatigue of the rail foot caused by
bending.
Furthermore, several crossing geometries were investigated to find
an optimal geometric design for the crossing nose and wing rails. The calculation results illustrate that it is difficult, if not impossible, to
find a solution which leads to a force reduction for all wheel profiles
occurring in service. Nevertheless, the MaKüDe design developed by
DB Systemtechnik showed the best performance for moderately worn wheel profiles in both running directions (facing and trailing
moves). In connection with reduced support stiffness (e.g. elastic rail
pads), this crossing design will lead to a significant reduction of
impact loads and consequently provide a high potential of LCC
reduction.
4.5. Future work The investigation of contact stresses on crossings calculated by
means of Kalker’s CONTACT program has demonstrated the limited
usefulness of linear-elastic material models in this field of
application. On the other hand, considering only maximum contact forces with regard to material degradation on frogs could lead to
invalid conclusions. Before carrying out expensive in-field tests, the
most promising frog designs could be investigated by means of the
simulation methodology [4.3] developed by Chalmers University of Technology to evaluate frog degradation in terms of plastic
deformations and wear.

Recommendation of, and scientific basis for, optimisation of switches & crossings – part 1
INNOTRACK 27 . TIP5-CT-2006-031415
4.6. Bibliography
4.1 D. Nicklisch, SIMPACK-simulations of passing switches and
crossings, INNOTRACK Technical report, December 2008, 11 pp and two appendices (Appendix D in D3.1.4)
4.2 D. Nicklisch, SIMPACK-simulations of contact stresses on
switches and crossings, INNOTRACK Technical report, July
2009, 8 pp and two appendices
4.3 A. Johansson, B. Pålsson, M. Ekh, J. C. O. Nielsen, M. K. A. Ander, J. Brouzoulis and E. Kassa, Simulation of wheel-rail contact and
damage in switches and crossings, To be published in the
Proceedings of the 8th International Conference on Contact
Mechanics and Wear of Rail/Wheel Systems, Firenze, Italy, September 15 – 18, 2009

Recommendation of, and scientific basis for, optimisation of switches & crossings – part 1
INNOTRACK 28 . TIP5-CT-2006-031415
5. Conclusions
The presented numerical simulations show that a significant
reduction of wear and RCF on the through route of S&C can be
achieved by applying a dynamic gauge widening at the switch entry.
The gauge optimisation process was based on varying a single variable (maximum gauge widening), which represented the gauge
optimisation geometry. Several gauge widening amplitudes were
analysed. Large gauge amplitudes lead to larger displacements to the
other side of the track, which cause the wheelset to exhibit additional
lateral excitation. The geometry with 12 mm gauge widening amplitude resulted in an improved performance, both in the facing
and trailing moves of the through route. This was validated by
running several simulations with a wide set of load cases to prove
that this is an optimal design. The optimised geometry showed more consistency in the results (significant reduction of wear and RCF
indices compared to the nominal design) when using different wheel
profiles.
The gauge optimisation is assumed for a given contact point jump
location. However, in practice, for the same turnout geometry design, the contact point jump varies due to several variables related to the
different types of passing train. Therefore, future work is intended to
develop a systematic approach of the novel dynamic gauge widening
technique that will be valid for all S&C designs and that takes into account the scatter in the loading conditions.
For track stiffness optimisation, two alternative stiffness variation
models were considered. The maximum variations of the track
stiffness at the three locations were limited to ±30 %. This is expected to be achieved by varying rail pad stiffness and by applying
under sleeper pads. The influence on wear index and wheel-rail
contact forces was investigated. Optimising only the rail/rail pad
stiffness (kp) value shows a slight reduction in the maximum wear
index. Optimising only the sleeper/ballast stiffness (kb) value leads to a reduction of the wear index by almost 50% for the switch rail
contact while the change for the stock rail contact is minimal. A
considerable reduction in the wear index is obtained (up to 80%)
when both the kp and kb stiffness values are optimised. However, no

Recommendation of, and scientific basis for, optimisation of switches & crossings – part 1
INNOTRACK 29 . TIP5-CT-2006-031415
significant change in normal contact force is obtained for any of the
track stiffness optimised models.
The assessment of a crossing panel with reduced support stiffness (by means of elastic rail pads) instead of the standard support
stiffness showed that impact loads can be reduced considerably
especially for crossing negotiation at high speed. Investigations of
different crossing geometries showed that it is difficult to find a solution that leads to a force reduction for all wheel profiles
occurring in service. Nevertheless, the MaKüDe crossing design
showed the best performance for moderately worn wheel profiles in
both running directions (facing and trailing moves). In combination
with reduced support stiffness, this crossing design should lead to a significant reduction of the impact loads and consequently has a high
potential for LCC reduction.

Recommendation of, and scientific basis for, optimisation of switches & crossings – part 1
INNOTRACK 30 . TIP5-CT-2006-031415
6. Annexes Elias Kassa, Simon Iwnicki, Javier Perez, Paul Allen and Yann Bezin,
Optimisation of track gauge and track stiffness along a switch using a
multibody simulation tool, to be published in the Proceedings of the
21st International Symposium on Dynamics of Vehicles on Roads and Tracks, Stockholm, Sweden, August 17 – 21, 2009, 12 pages
(Appendix A in D3.1.5)
Dirk Nicklisch, SIMPACK-simulations of contact stresses on switches
and crossings, Report 06-P-4798-TZF63-INNOTRACK, Deutche Bahn AG, Systemverbund Bahn – Technik, DB Systemtechnik, July 2008,
8 pp and two appendices (Appendix B in D3.1.5)


![Pareto-Optimality Solution Recommendation Using A … · Pareto-Optimality Solution Recommendation Using ... and the bat algorithm for multi-objective optimisation [20], ... perform](https://cdn.vdocument.in/doc/165x107/5aea74df7f8b9ae5318c7671/pareto-optimality-solution-recommendation-using-a-solution-recommendation-using.jpg)