
Stacy McGaugh
Dark Matter Laws of Galactic Dynamics: what every Physicist
should Know beyond Flat Rotation Curves
with collaboratorsFederico Lelli (CWRU/ESO)Jim Schombert (U. Oregon)
Marcel Pawlowski (CWRU/UC Irvine)
support fromNASA (Spitzer; ADAP)
The John Templeton Foundation
McGaugh, Lelli, & Schombert 2016, PRL, 117, 201101
Lelli
Schombert
PawlowskiLelli, McGaugh, Schombert, & Pawlowski 2016, ApJ, 836, 152
16 May 2017 CWRU
and input from the entire HI radio interferometry community

with collaboratorsFederico Lelli (CWRU/ESO)Jim Schombert (U. Oregon)
Marcel Pawlowski (CWRU/UC Irvine)
and support fromNASA (Spitzer; ADAP)
The John Templeton Foundation
McGaugh S. S., Lelli F., & Schombert J. M. 2016, PRL, 117, 201101
Lelli
Schombert
PawlowskiLelli F., McGaugh S. S., Schombert J. M., & Pawlowski 2016, ApJ, 836, 152
16 May 2017 CWRU
and the entire HI radio interferometry community
FL
SSM

Rubi
n, T
honn
ard,
& F
ord
1978
, ApJ
, 225
, L10
7Rotation curves become flat at large radii.

Rubi
n, T
honn
ard,
& F
ord
1978
, ApJ
, 225
, L10
7Rotation curves become flat at large radii.


There is ample evidence for mass discrepancies - not just rotation curves & clusters & CMB

Rubi
n, T
honn
ard,
& F
ord
(197
8)
Flat rotation curves
de Blok & McGaugh (1996, 1997)Lelli et al. (2011, 2013, 2016)Famaey & McGaugh (2012)
Tully-Fisher Relation
Tully
& F
isher
(197
7)
Pers
ic &
Sal
ucci
(199
1)
Surface brightness dependence
Sancisi (1995; 2004)
“When you see a feature in the light, you see a corresponding feature in the rotation curve, and vice-versa.”
Renzo’s Rule
Acceleration scale
Sanders (1990)
“Universal” Rotation Curve
Many regularities have been noted in rotation curves

SPARC is a sample of - 176 disk galaxies with - Spitzer 3.6 micron photometry tracing the stellar mass - high-quality HI/H! rotation curves tracing the gravitational potential
all have 21 cm cubes - all late morphological types (S0 to Irr - basically everything that rotates)
Federico Lelli | Stacy McGaugh | James Schombert
All data available on-line: http://astroweb.case.edu/SPARC/
Lelli, McGaugh, & Schombert 2016, ApJ, 827, 19

SPARC provides a comprehensive view of disk galaxy properties

SPARC provides a comprehensive view of disk galaxy properties
F549-1Milky Way

NGC 6946 stars & gas
SPARC has well resolved data for both stars and gas for all galaxies

NGC 6946 velocity field
e.g., THINGS (Walter et al. 2008de Blok et al. 2008)
SPARC has rotation curves derived from 21 cm velocity fields
V sini = Vsys + Vc cosθ + Vr sinθ

F568-1
Surface photometry quantifies the variation of surface brightness with radius. These data are used to numerically solve the Poisson equation to obtain the gravitational potential of the stars.
bulge
stellar disk
Surf
ace
Bri
ghtn
ess
�@�⇤@R
= 2⇡G⌃⇤

M⇤ = ⌥⇤L
We observe the light distribution. We need to know the stellar mass distribution. This introduces an unavoidable conversion factor, the stellar mass-to-light ratio ⌥⇤
Expect the near-IR to be the best tracer of the mass. - least scatter - least dependent on color
Note: this is not necessary for the gas, as the conversion from flux to mass is well known from the physics of the 21 cm spin-flip transition of atomic hydrogen.
bulge
disk
⌥[3.6]⇤ = 0.7 M�/L�
⌥[3.6]⇤ = 0.5 M�/L�
Simple modelA single mass-to-light ratio for the bulge and disk of all galaxies
Only 31 SPARC galaxies have a significant bulge.

NGC 6946
Rotation curve data fromBoomsma et al (2008) [HI]Daigle et al (2006) [H!]Blais-Ouellette et al (2004) [H!]
VfMass model
bulge gas
stellar disk
baryons
Construct mass models for all SPARC galaxies Attempt to control for systematics: Reject
- 12 galaxies for being messed-up strong asymmetries in velocity field
indication of non-circular motions - 10 galaxies for being too face-on
i < 30o causes 1/sin(i) errors to blow up - 698 individual points with uncertainty > 10% in V
leaves 2693 points in 153 galaxies

baryons
Vf
Vbar
total
Vbar < Vf
The observed stars and gas cannot account for the total rotation (assuming Newtonian gravity).

Sancisi (1995; 2004)
“When you see a feature in the light, you see a corresponding feature in the rotation curve, and vice-versa.”
Renzo’s Rule

Sancisi (1995; 2004)
“When you see a feature in the light, you see a corresponding feature in the rotation curve, and vice-versa.”
Renzo’s Rule
Small bulge (4% of total light) causes sharp rise & fall of inner rotation curve

Sancisi (1995; 2004)
“When you see a feature in the light, you see a corresponding feature in the rotation curve, and vice-versa.”
Renzo’s Rule
Small bulge (4% of total light) causes sharp rise & fall of inner rotation curve
Asymmetry in gas distribution causes dip in rotation curve
Note that this occurs despite apparent dark matter domination

star
dom
inat
ed H
SB
gas dominated LSBs
Rotation curves are flat; amplitude of flat rotation correlates with mass

Stellar Mass Tully-Fisher relation
line-width outer (flat) velocityga
s dom
inated
star d
omina
tedX
McGaugh et al. (2000)
Gurovich et al. (2010)
Begum et al. (2008)Trachternach et al. (2009)
McGaugh (2005)Stark et al. (2009)Begum et al. (2008)Trachternach et al. (2009)
Stellar mass
M⇤ = ⌥⇤L

Baryonic Tully-Fisher relation
line-width outer (flat) velocityga
s dom
inated
star d
omina
tedX
McGaugh et al. (2000)
Gurovich et al. (2010)
Begum et al. (2008)Trachternach et al. (2009)
McGaugh (2005)Stark et al. (2009)
slope: x = 3.5 slope: x = 4
Begum et al. (2008)Trachternach et al. (2009)
Baryonic mass
Mb = M⇤ +Mg

outer (flat) velocityga
s dom
inated
star d
omina
tedX
McGaugh et al. (2000)
Gurovich et al. (2010)
Begum et al. (2008)Trachternach et al. (2009)
McGaugh (2005)Stark et al. (2009)
slope: x = 4
Begum et al. (2008)Trachternach et al. (2009)
Tully-Fisher is, fundamentally,
a relation between baryonic mass
(stars+gas) and the amplitude of the
flat rotation speed
Mb = AV 4f
A = 47± 6 M� km�4 s4
Negligible intrinsic scatter

Two galaxies with the same baryonic mass Mb, same Vf
- Indistinguishable on TF plane -
but have different baryonic mass distributions and different rotation curves
NGC 2403
UGC 128
Images as the same physical scale
HSB LSB
NGC 2403
UGC 128
mass
surf
ace
brig
htne
ss

radius in kpc
radius in scale lengths

Famaey & McGaugh (2012)
SPARC
optical data + popsynth M*/L
near-IR data with constant M*/L
The distribution of luminous mass is reflected in the shape
of the rotation curve.
High surface brightness galaxies have rapidly rising rotation curves
Low surface brightness galaxies have slowly rising rotation curves

Rb Re R2.2
Vb
Vf
[3.6] surface brightness profile
Rotation curve
HSB galaxy
High surface brightness galaxies have rapidly rising rotation curves

RbReR2.2
Vb
Vf
[3.6] surface brightness profile
Rotation curve
LSB galaxy
Low surface brightness galaxies have slowly rising rotation curves

⌃dyn(0) =1
2⇡G
Z 1
0
V 2(R)
r2dR
cent
ral d
ynam
ical
surf
ace
dens
ity
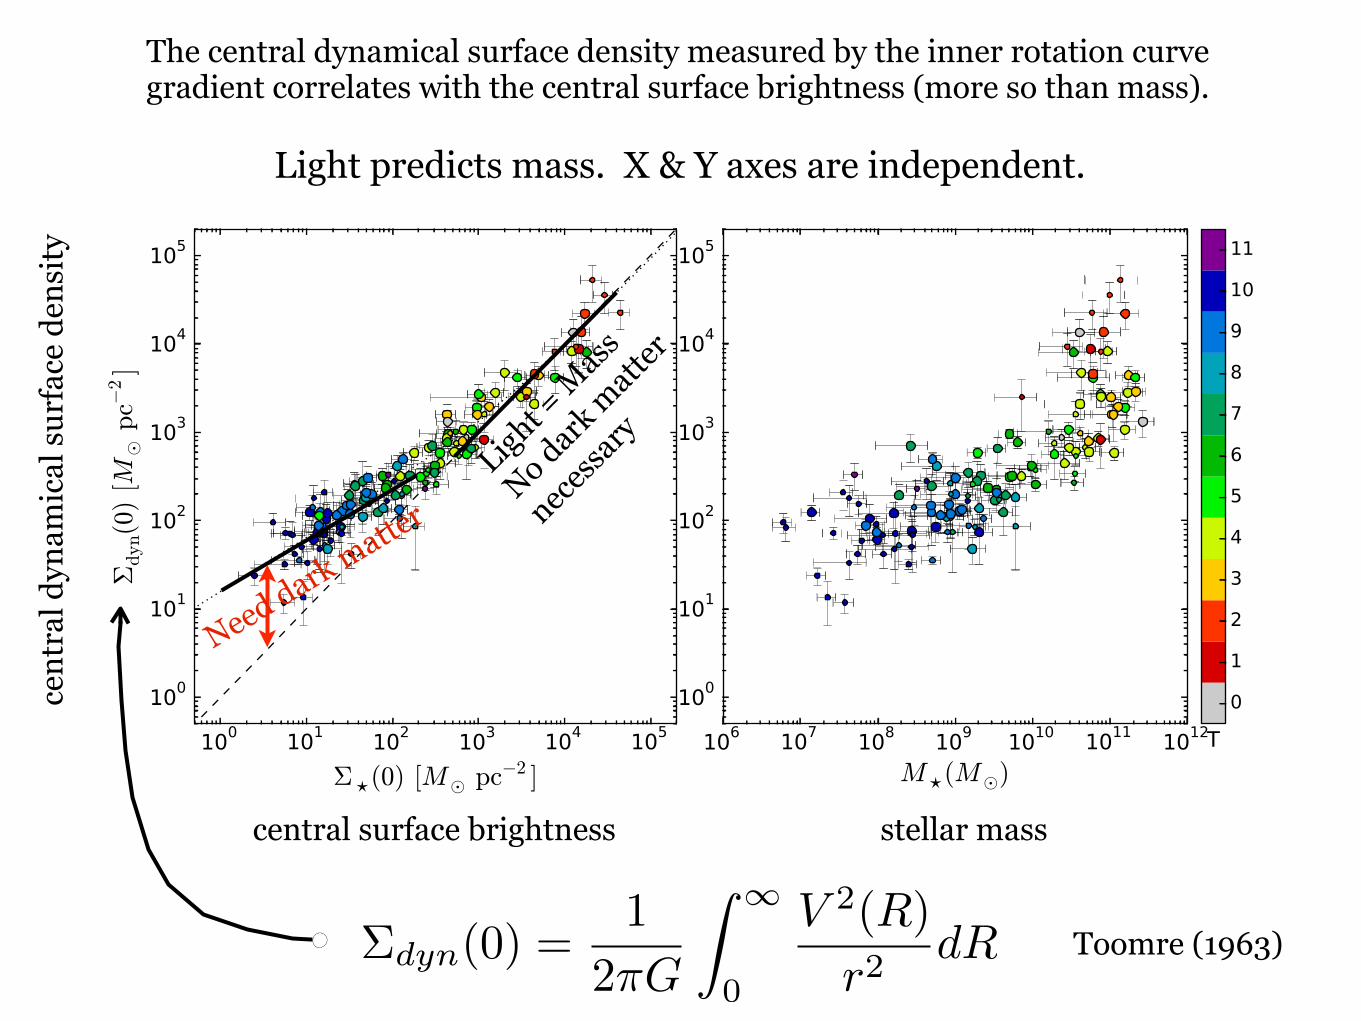
central surface brightness stellar mass
Light predicts mass. X & Y axes are independent.
Toomre (1963)
The central dynamical surface density measured by the inner rotation curve gradient correlates with the central surface brightness (more so than mass).

⌃dyn(0) =1
2⇡G
Z 1
0
V 2(R)
r2dR
cent
ral d
ynam
ical
surf
ace
dens
ity
central surface brightness stellar mass
Light predicts mass. X & Y axes are independent.
Light =
Mass
No dark m
atter
necessa
ry
Toomre (1963)
The central dynamical surface density measured by the inner rotation curve gradient correlates with the central surface brightness (more so than mass).
⌃dyn(0) =1
2⇡G
Z 1
0
V 2(R)
r2dR
cent
ral d
ynam
ical
surf
ace
dens
ity
central surface brightness stellar mass
Light predicts mass. X & Y axes are independent.
Light =
Mass
No dark m
atter
necessa
ry
Need dark matter
Toomre (1963)
The central dynamical surface density measured by the inner rotation curve gradient correlates with the central surface brightness (more so than mass).

Rb Re R2.2
Vb
Vf
[3.6] surface brightness profile
Rotation curve
The observed centripetal acceleration is linked to that predicted by the observed distribution of baryons.
gbar = |r�|r2� = 4⇡G⇢
gobs
=V 2
R
What about everything in between?

gobs
=V 2
Rgbar = |@�
@R|
determined from rotation curve determined from baryon distribution
independent quantities

Radial Acceleration
Relation
153 galaxies
rms = 0.13s = 0.11

Radial Acceleration
Relation
153 galaxies
gobs
=gbar
1� e�p
gbar/g†
well fit by
±0.02 (random)± 0.24 (systematic)
g† = 1.20⇥ 10�10 ms�2
rms = 0.13s = 0.11

Radial Acceleration
Relation
153 galaxies
gobs
=gbar
1� e�p
gbar/g†
well fit by
±0.02 (random)± 0.24 (systematic)
g† = 1.20⇥ 10�10 ms�2
observed rms scatter
scatter expected from observational errors
The data are consistent with zero intrinsic scatter
rms = 0.13s = 0.11
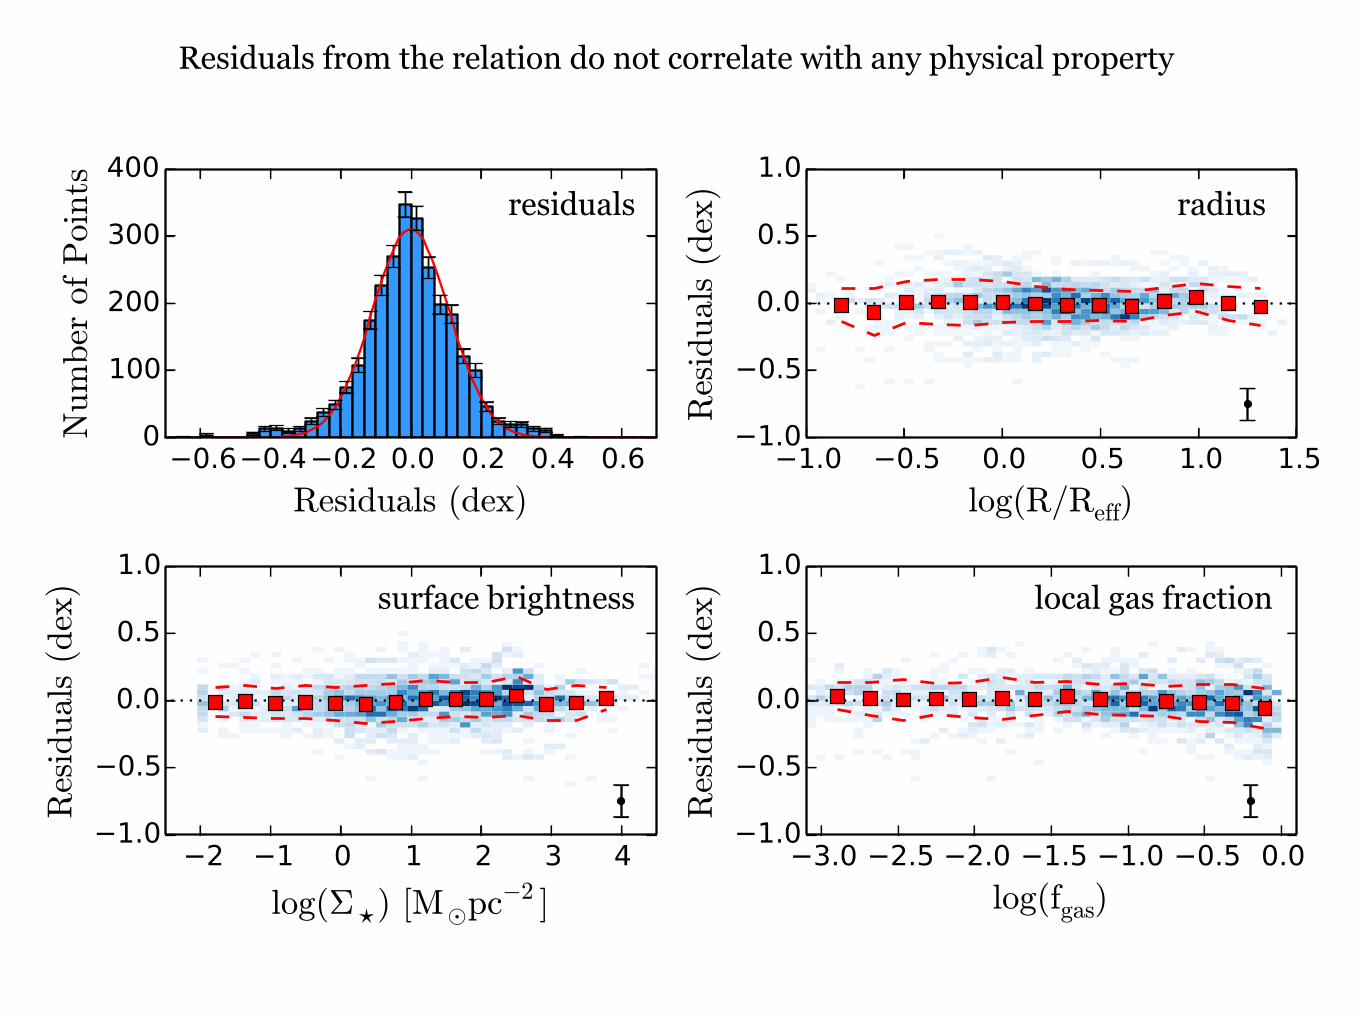
Residuals from the relation do not correlate with any physical property
radius
local gas fractionsurface brightness
residuals

±0.02 (random)± 0.24 (systematic)
g† = 1.20⇥ 10�10 ms�2
gobs
= F(gbar
) F =gbar
1� e�p
gbar/g†
gDM
= gobs
� gbar
gDM = F(gbar)� gbar
total
dark matter
The dark matter distribution is specified by the baryon distribution
The Radial Acceleration Relation can be used to infer the dark matter distribution just by looking at a galaxy.
One consequence for dark matter
That’s weirdThe baryonic tail wags the dark matter dog.

Sancisi (1995; 2004)
“When you see a feature in the light, you see a corresponding feature in the rotation curve, and vice-versa.”
Renzo’s Rule

Sancisi (1995; 2004)
“When you see a feature in the light, you see a corresponding feature in the rotation curve, and vice-versa.”
Renzo’s Rule
The Radial Acceleration Relation maps between what we see and what we get.

Laws of Galactic Rotation1. Rotation curves tend towards asymptotic flatness
2. Baryonic Tully-Fisher Relation
3. Central Density Relation
4. Radial Acceleration Relation
5. Renzo’s Rule
Vf ! constant
Mb / V 4f
g
bar
predictive of g
obs
⌃light predictive of ⌃mass
“When you see a feature in the light, you see a corresponding feature in the rotation curve, and vice-versa.”
gobs
=gbar
1� e�p
gbar/g†


