Download - DDaattaa MMaannaaggeemmeenntt
Photo: © . Used with permission.
Data ManagementData ManagementFor Scientific Research
Stanza

Session 3: Systems Analysis and DesignSession 3: Systems Analysis and Design

Image:
Systems Development Life Cycle (SDLC)Systems Development Life Cycle (SDLC)
One of several approaches to systems development is the ,also called the “Waterfall” model.
SDLC
Peter Kemp / Paul Smith / Wikimedia
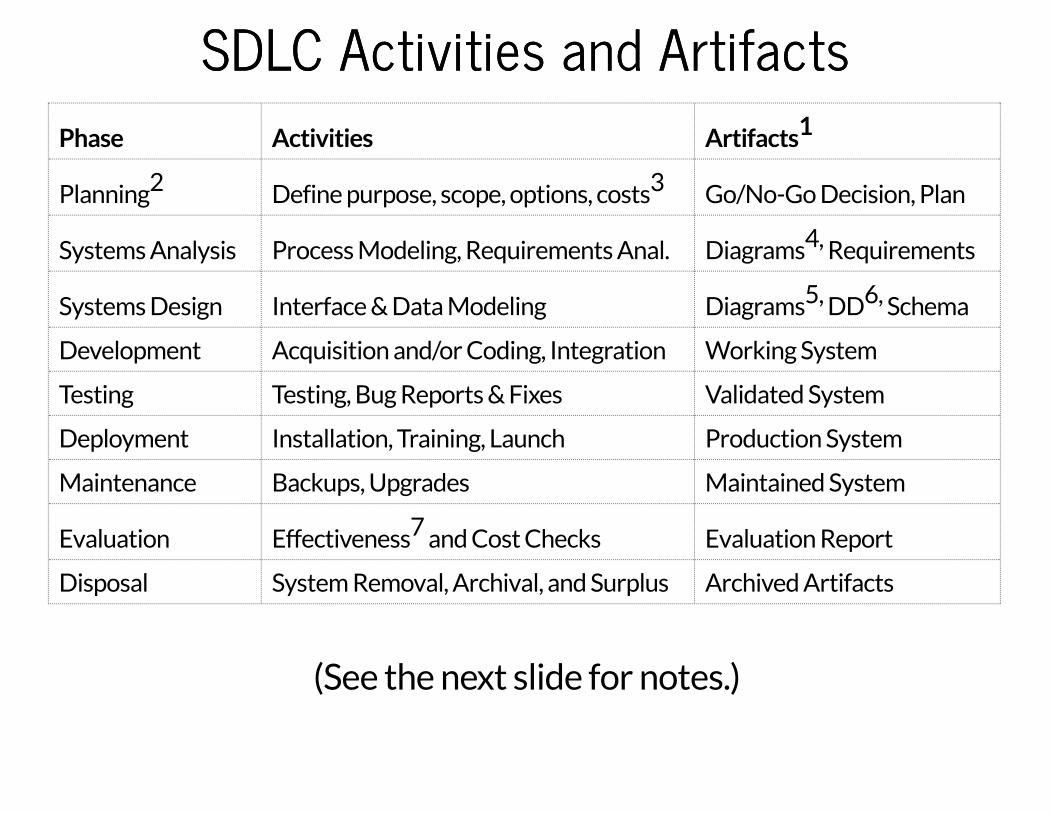
SDLC Activities and ArtifactsSDLC Activities and ArtifactsPhase Activities Artifacts1
Planning2 Define purpose, scope, options, costs3 Go/No-Go Decision, Plan
Systems Analysis Process Modeling, Requirements Anal. Diagrams4, Requirements
Systems Design Interface & Data Modeling Diagrams5, DD6, Schema
Development Acquisition and/or Coding, Integration Working System
Testing Testing, Bug Reports & Fixes Validated System
Deployment Installation, Training, Launch Production System
Maintenance Backups, Upgrades Maintained System
Evaluation Effectiveness7 and Cost Checks Evaluation Report
Disposal System Removal, Archival, and Surplus Archived Artifacts
(See the next slide for notes.)

SDLC Activities and ArtifactsSDLC Activities and ArtifactsNotes
1 There are of potential from each phase.
2 The may also be called the preliminary investigation, system
investigation, feasibility study, or project initiation phase, among other names.
3 Determination of options and costs (in the ) is often referred to,
specifically, as a .
4 may produce , , (DFD),
and diagrams.
5 may produce (ER) diagrams and UML diagrams.
6 As a systems design artifact, DD represents a document.
7 The will have numerous measures of .
dozens artifacts
planning phase
planning phase
feasibility study
Systems analysis flow charts swim lanes data flow diagrams
UML
Systems design Entity-relationship
Data Dictionary
Evaluation phase effectiveness
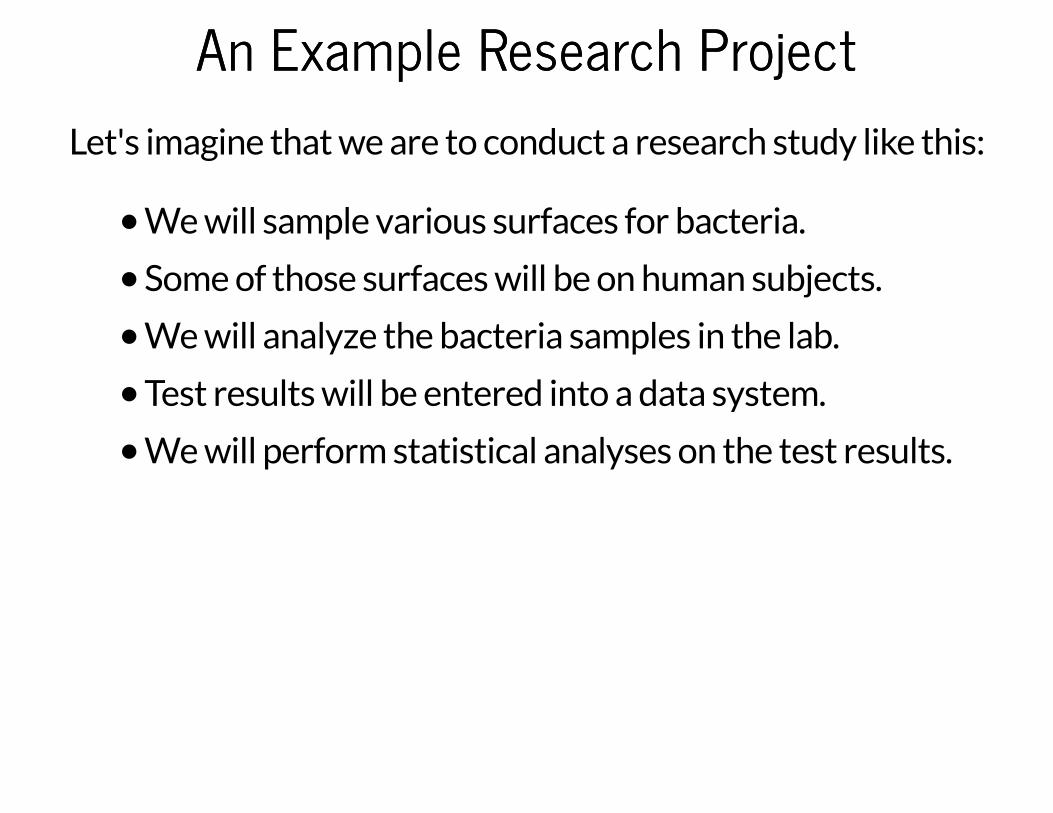
An Example Research ProjectAn Example Research Project
Let's imagine that we are to conduct a research study like this:
We will sample various surfaces for bacteria.
Some of those surfaces will be on human subjects.
We will analyze the bacteria samples in the lab.
Test results will be entered into a data system.
We will perform statistical analyses on the test results.

Goals ListGoals List
The stakeholder goals for system, in “verb noun” form are:
Role Goal
Subject Sign Consent Form
Sampler Collect Consent Form
Subject Complete Subject Form
Sampler Collect Subject Form
Sampler Collect Sample
Sampler Deliver Sample
Lab Tech Test Sample
Lab Tech Dispose Sample
Statistician Analyze Results

Structured NarrativesStructured Narratives
From this goals list, we can create use case diagrams and astructured narrative. A structured narrative is a description
which conforms to some sort of standardized format.
For the purposes of our preliminary investigation, we will justadd one-sentence descriptions for each goal in our list. Ourdescription will use terms such as “if”, “must” or “may” and
phrases like “for each” or “for all”.
This simple structure will allow us to develop a process modelusing various types of diagrams. From our process model, we will
develop a data model.

Structured Narrative: Part 1, Subject DataStructured Narrative: Part 1, Subject DataActor Use Case Description
Subject Sign Consent Form If a human subject is sampled, the subject must sign a
consent form.
Sampler Collect Consent
Form
The sampler must collect the consent form before
sampling the subject.
Subject Complete Subject
Data Form
The subject must complete a subject data form by
providing personal information.
Sampler Collect Subject Data
Form
The sampler must collect the subject data form
before sampling the subject.
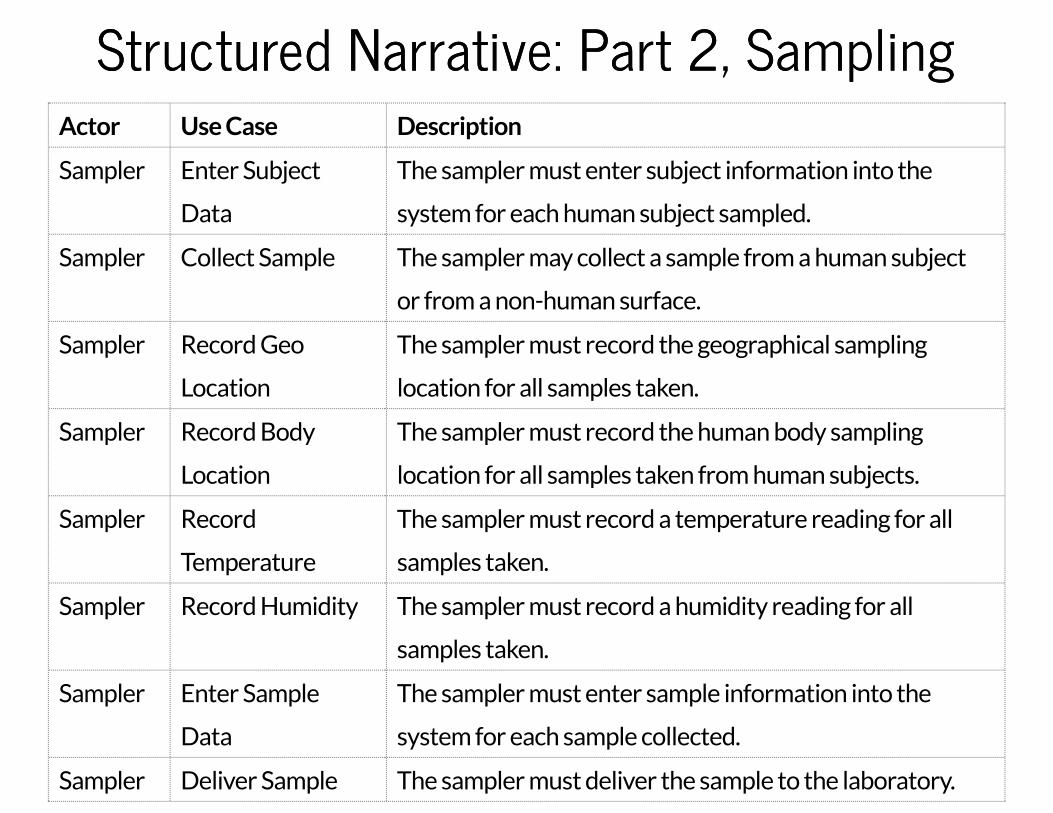
Structured Narrative: Part 2, SamplingStructured Narrative: Part 2, SamplingActor Use Case Description
Sampler Enter Subject
Data
The sampler must enter subject information into the
system for each human subject sampled.
Sampler Collect Sample The sampler may collect a sample from a human subject
or from a non-human surface.
Sampler Record Geo
Location
The sampler must record the geographical sampling
location for all samples taken.
Sampler Record Body
Location
The sampler must record the human body sampling
location for all samples taken from human subjects.
Sampler Record
Temperature
The sampler must record a temperature reading for all
samples taken.
Sampler Record Humidity The sampler must record a humidity reading for all
samples taken.
Sampler Enter Sample
Data
The sampler must enter sample information into the
system for each sample collected.
Sampler Deliver Sample The sampler must deliver the sample to the laboratory.

Structured Narrative: Part 3, AnalysisStructured Narrative: Part 3, AnalysisActor Use Case Description
Lab Tech Receive
Sample
The laboratory technician must receive the sample when
it is delivered.
Lab Tech Store Sample The laboratory technician must store the sample in a
cooler (refrigerator).
Lab Tech Split Sample The laboratory technician must split the sample before
testing.
Lab Tech Test Sample The laboratory technician must test the sample before it
expires.
Lab Tech Enter Test
Result
The laboratory technician must enter the test result into
the system.
Lab Tech Dispose
Sample
The laboratory technician must dispose of the sample
after it is no longer needed.
Statistician Query
Results
The statistician may query the system for test results.
Statistician Analyze The statistician may analyze the results using statistical
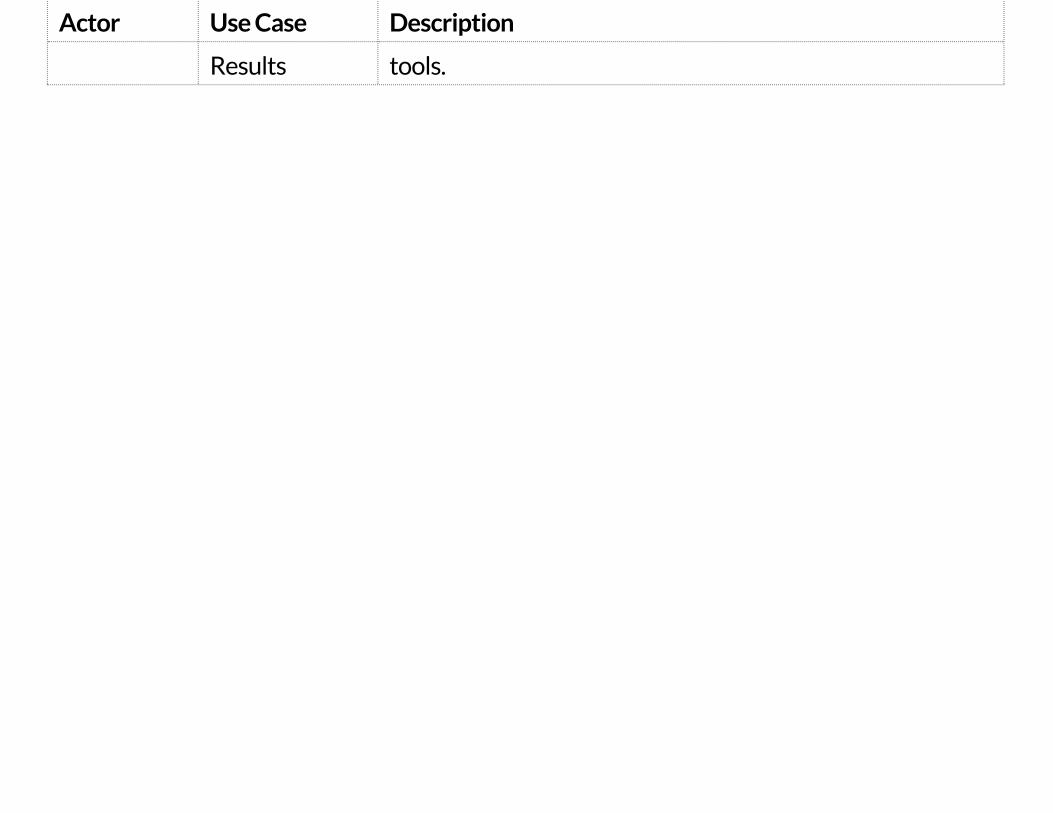
Actor Use Case Description
Results tools.

Use Case NarrativesUse Case Narratives
For even more clarity, one can also develop ,which go into far greater detail. This level of detail might be
useful in later design phases.
use case narratives
Image: UI CyberGIS Project
UseUseCase Diagrams: Project OverviewCase Diagrams: Project Overview
This diagram shows the actors and their project goals.
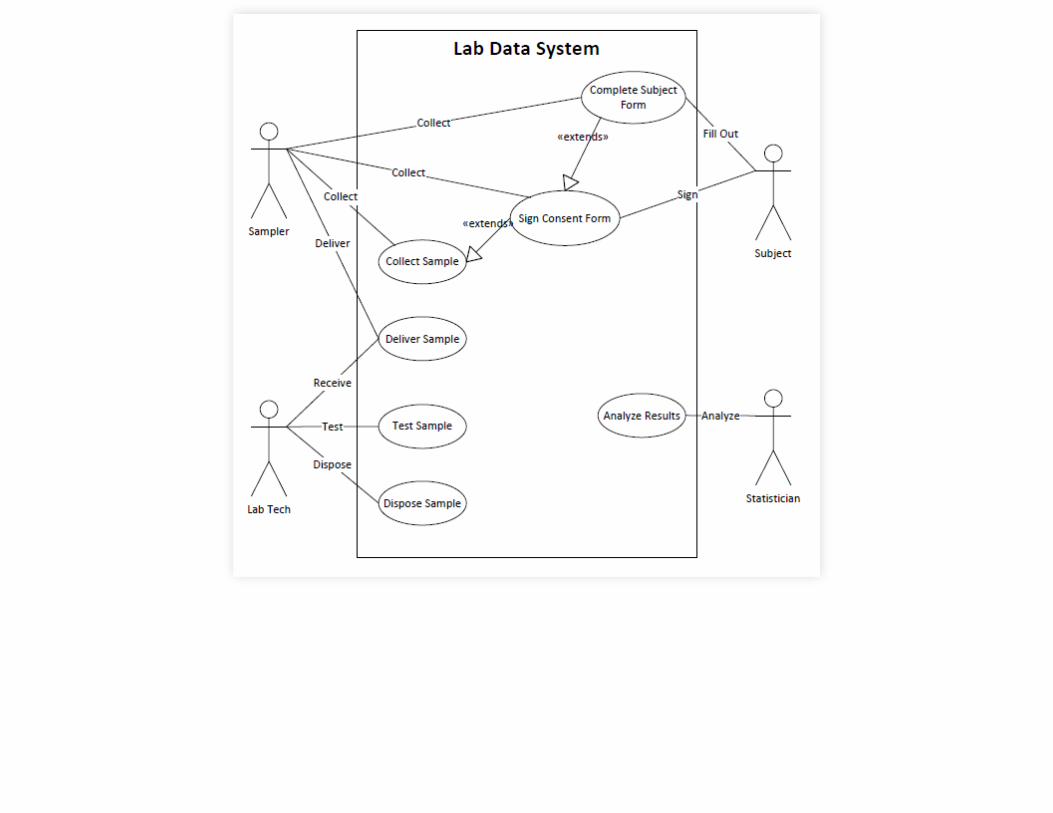

Use Case Diagrams: More Detailed ViewUse Case Diagrams: More Detailed View
This diagram shows a more detailed view of the actors and theirproject goals.


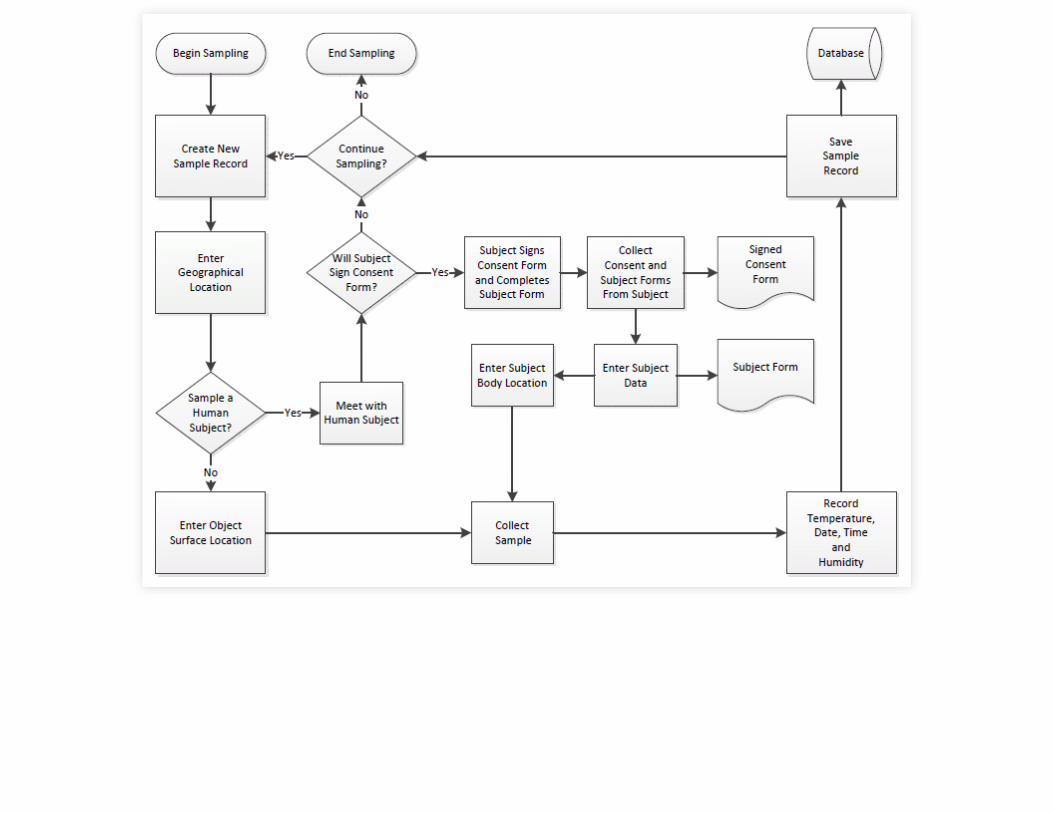
Flow ChartsFlow Charts
To better elucidate process branching in a system, we can use aflow chart. Here is a closer look at the sampling process.

Swim Lane DiagramsSwim Lane Diagrams
This swim lane diagram shows an overview of the system. Thelanes not only show actors, but also sequence and outputs.

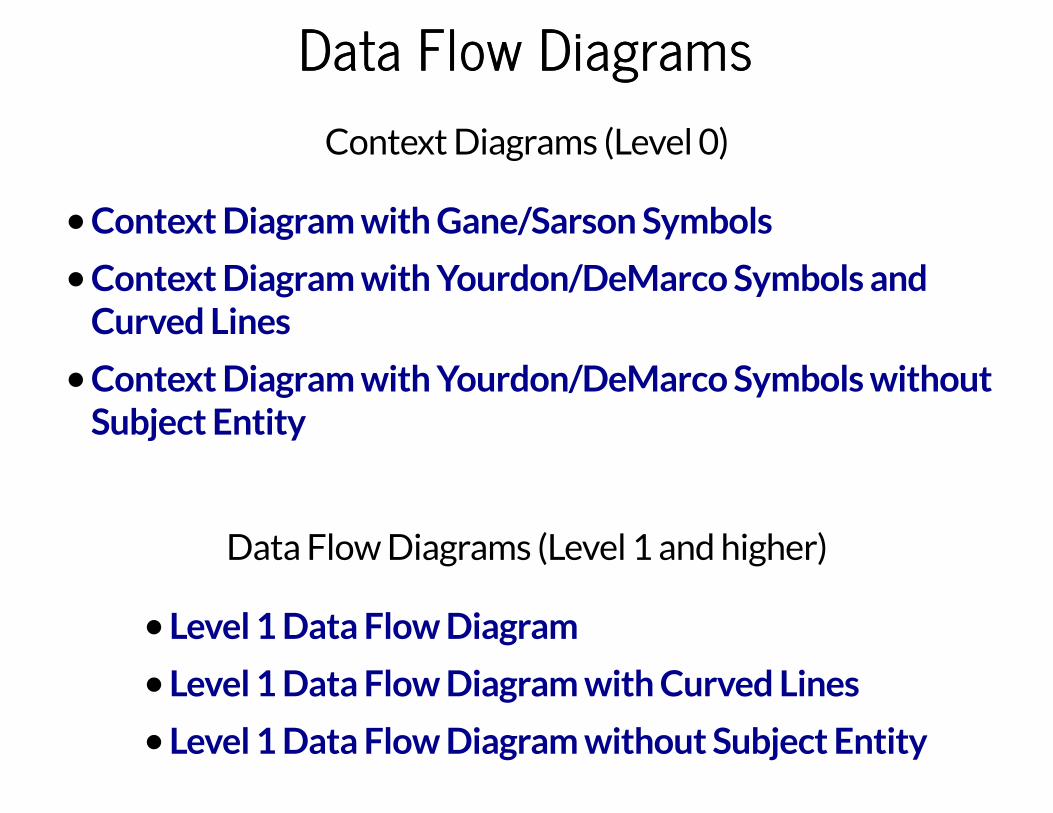
Data Flow DiagramsData Flow Diagrams
Context Diagrams (Level 0)
Data Flow Diagrams (Level 1 and higher)
Context Diagram with Gane/Sarson Symbols
Context Diagram with Yourdon/DeMarco Symbols andCurved Lines
Context Diagram with Yourdon/DeMarco Symbols withoutSubject Entity
Level 1 Data Flow Diagram
Level 1 Data Flow Diagram with Curved Lines
Level 1 Data Flow Diagram without Subject Entity


Context Diagram (Gane/Sarson Symbols)Context Diagram (Gane/Sarson Symbols)

Context Diagram (Yourdon/DeMarco)Context Diagram (Yourdon/DeMarco)
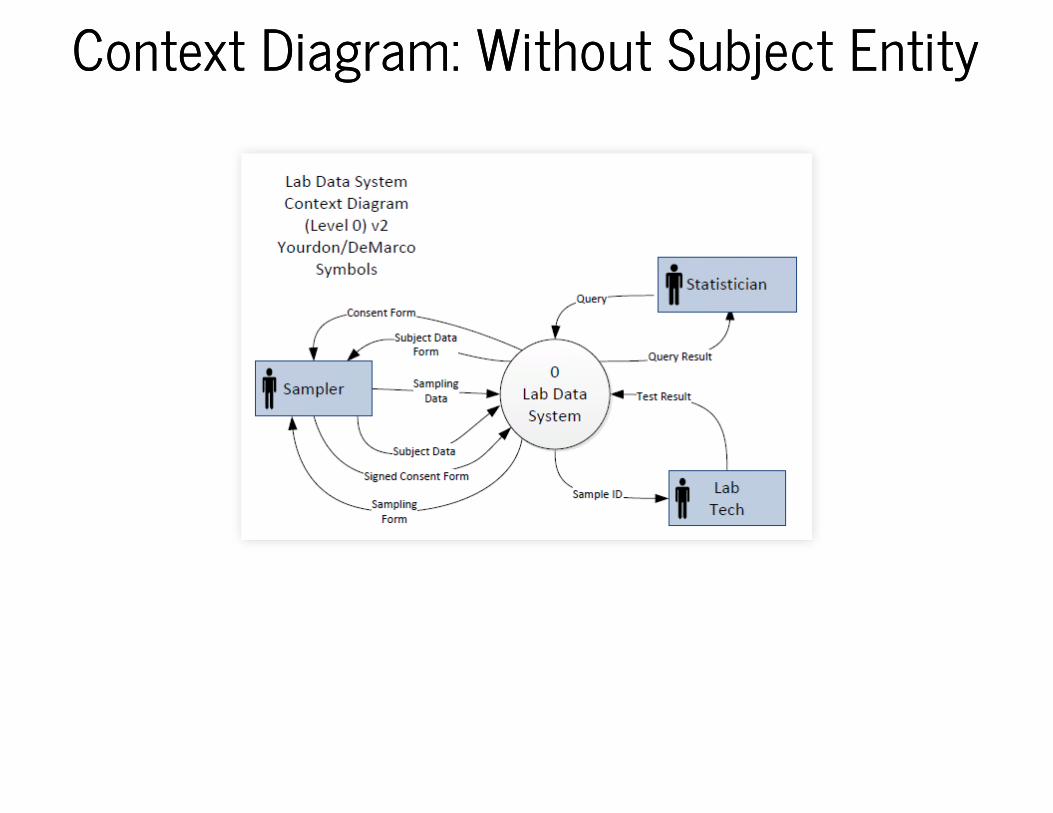
Context Diagram: Without Subject EntityContext Diagram: Without Subject Entity
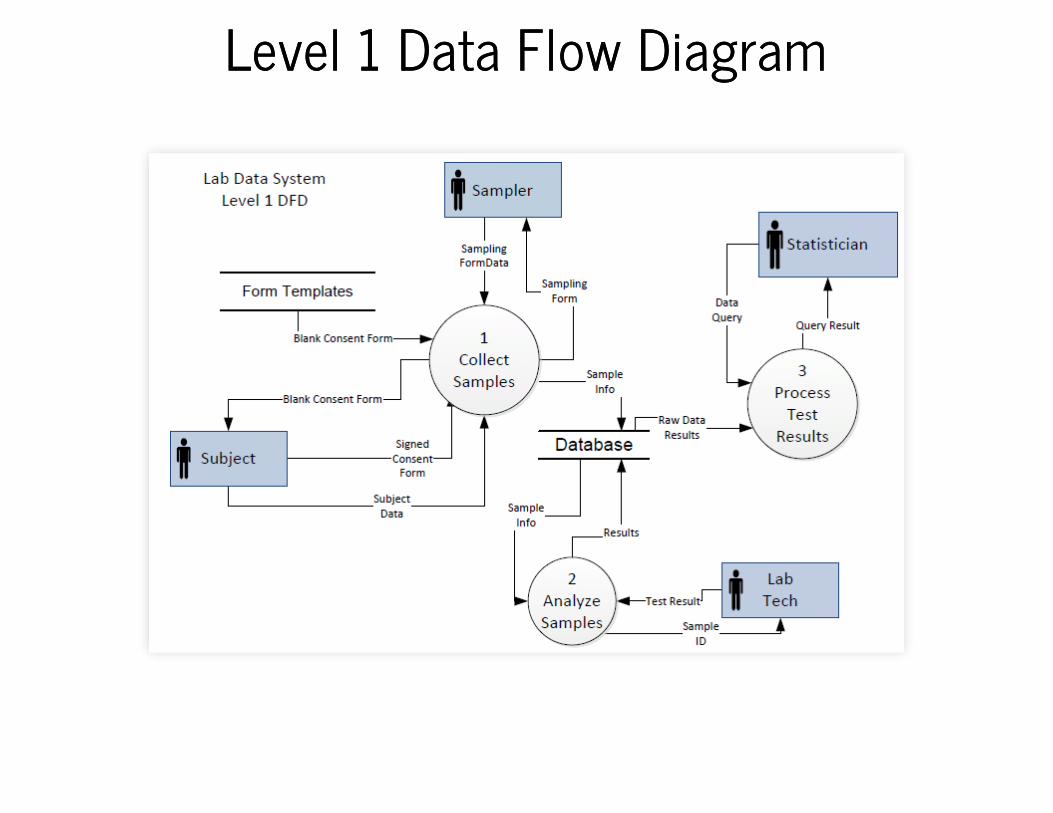
Level 1 Data Flow DiagramLevel 1 Data Flow Diagram
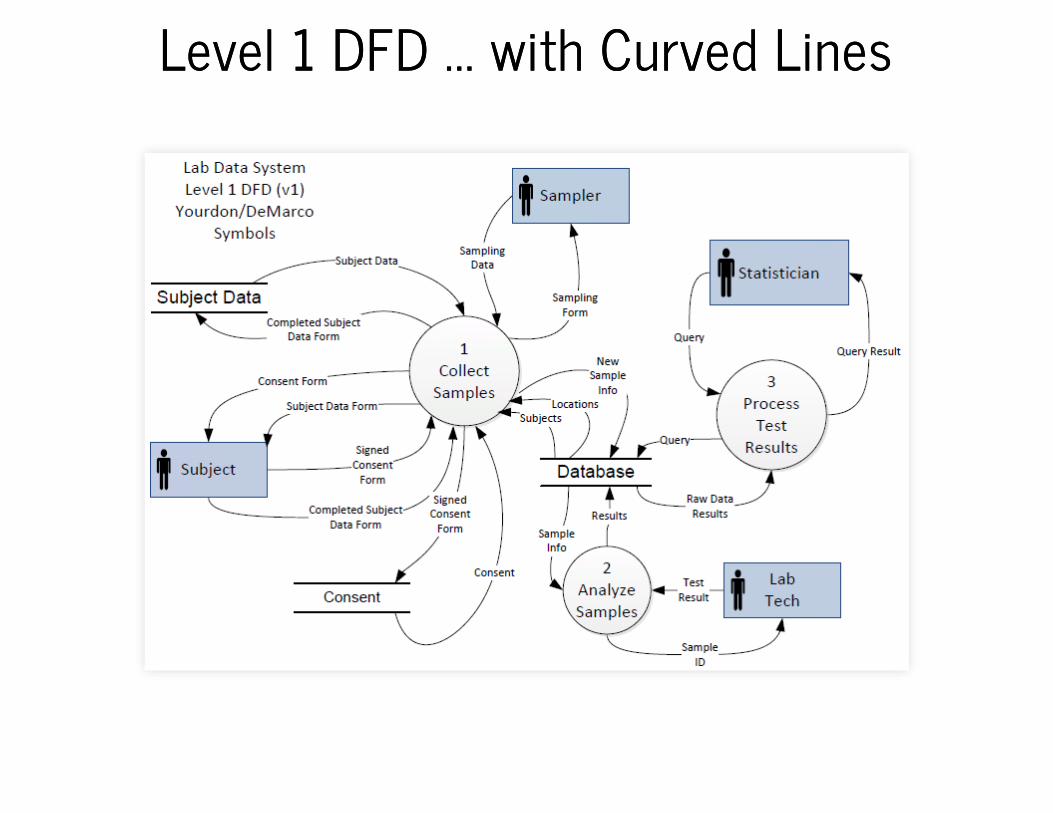
Level 1 DFD ... with Curved LinesLevel 1 DFD ... with Curved Lines
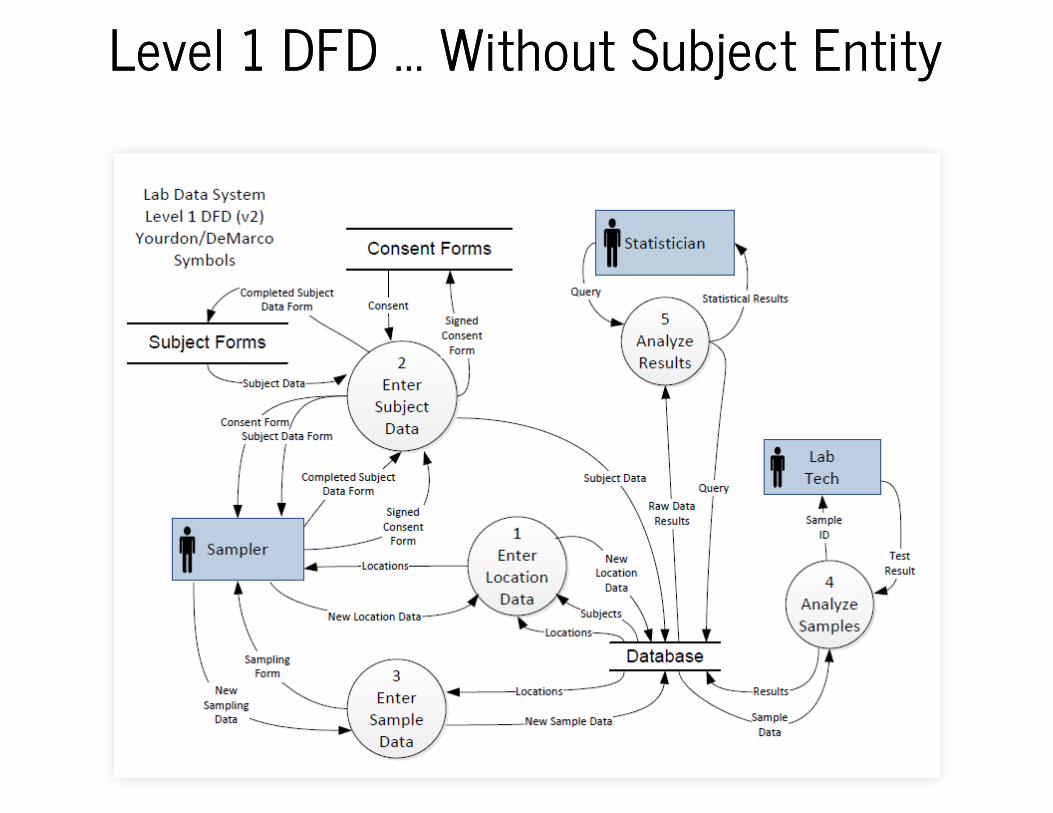
Level 1 DFD ... Without Subject EntityLevel 1 DFD ... Without Subject Entity

Hands-on Group ExerciseHands-on Group Exercise
Working as a group, with a pen or pencil and paper, make somesystems analysis diagrams. Sticky notes, a whiteboard, etc. may
be helpful when brainstorming and designing the diagrams.

Photo: SarahStierch / Wikimedia
Hands-onHands-onGroup Exer‐Group Exer‐cise: Varia‐cise: Varia‐
tionstionsData Flow Diagrams
Transform your use casediagram(s) into a contextdiagram and level 1 DFD,
especially if there are manydata processing steps or data
sources. Diagram furtherlevels (time permitting).
Flow Charts and Swim Lanes
Alternatively, if there arecomplex decisions, branching,
or multiple entities performingvarious actions, then make a
flow chart or swim lanediagram from your use case
diagram(s).

Graphic:
DiscussionDiscussion
Explain your diagrams to the group as though you werepresenting your data system requirements to those who wouldbuild the data system. Ask questions that a system implementer
might ask, especially where there are ambiguities.
Jagbirlehl / Wikimedia

In the Coming Sessions...In the Coming Sessions...Entity-Relationship Diagrams
MySQL Workbench
Building Database Tables
Database Applications

Action Items (videos, readings, and tasks)Action Items (videos, readings, and tasks)
textbook: Chapter5. Handling Text in the Shell
Skim: Wikipedia: , , and
Explore: , ,
Optional- Skim: textbook: Chapters 3-4
Create enough diagrams to describe your system “unambiguously”
Post your system documents and diagrams in your project wiki
Organize your material into a “Requirements Document” wiki page
Refer to the in the “Data Management” project wiki
Conceptual Data Modeling
Defining table relationships
Databases and SQL
ERD Training
PCfB
Req. anal. DB design, E-R model normalization
UW Privacy SA Wiki BA Guidebook
RDDaI3CE
example

See AlsoSee AlsoRapid application development
Creately - Ultimate Flowchart Guide
Traditional vs Modern Flowcharts
DFD over Flowcharts PDF
DFD Slideshow
Creately DFD
DFDs - and follow link to “Article”
UML Data Modeling Video
Graphical Data Flow Programming in LabVIEW Video

Image: / Wikimedia
Questions and CommentsQuestions and Comments
© Nevit Dilmen

Some Parting WordsSome Parting Words
–
Source: Empirical Model-Building and Response Surfaces (1987), p.424. ( .)
Essentially, all models are wrong, but some are useful.
George E. P. Box
Wikiquote

Source: Camille Flammarion / Wikimedia


