
Debt Investor Presentation Financial Results January – March 2017
1

Disclaimer IMPORTANT NOTICE THIS PRESENTATION IS NOT AN OFFER OR SOLICITATION OF AN OFFER TO BUY OR SELL SECURITIES. IT IS SOLELY FOR USE AT AN INVESTOR PRESENTATION AND IS PROVIDED AS INFORMATION ONLY. THIS PRESENTATION DOES NOT CONTAIN ALL OF THE INFORMATION THAT IS MATERIAL TO AN INVESTOR. THIS PRESENTATION IN AND OF ITSELF SHOULD NOT FORM THE BASIS OF ANY INVESTMENT DECISION. BY ATTENDING THE PRESENTATION OR BY READING THE PRESENTATION SLIDES YOU AGREE TO BE BOUND AS FOLLOWS: This presentation is not an offer for sale of securities in the United States, Canada or any other jurisdiction. This presentation may not be all-inclusive and may not contain all of the information that you may consider material. Neither SEB nor any third party nor any of their respective affiliates, shareholders, directors, officers, employees, agents and advisers makes any expressed or implied representation or warranty as to the completeness, fairness or reasonableness of the information contained herein and none of them accepts any responsibility or liability (including any third party liability) for any loss or damage, whether or not arising from any error or omission in compiling such information or as a result of any party’s reliance on or use of such information. Certain data in this presentation was obtained from various external data sources and SEB has not verified such data with independent sources. Accordingly, SEB makes no representations as to the accuracy or completeness of that data. Such data involves these risks and uncertainties and is subject to change based on various factors. Any securities, financial instruments or strategies mentioned herein may not be suitable for all investors. The recipient of this presentation must make its own independent decision regarding any securities or financial instruments and its own independent investigation and appraisal of the business and financial condition of SEB and the nature of the securities. Each recipient is strongly advised to seek its own independent financial, legal, tax, accounting and regulatory advice in relation to any investment. This presentation does not constitute a prospectus or other offering document or an offer or invitation to subscribe for or purchase any securities and nothing contained herein shall form the basis of any contract or commitment whatsoever. This presentation is being furnished to you solely for your information and may not be reproduced, copied, shared, disseminated or redistributed, in whole or in part, in any manner whatsoever to any other person. The distribution of this presentation in certain jurisdictions may be restricted by law and persons into whose possession this presentation comes should inform themselves about, and observe, any such restrictions. Safe Harbor Certain statements contained in this presentation reflect SEB’s current views with respect to future events and financial and operational performance. Except for the historical information contained herein, statements in this presentation which contain words or phrases such as “will”, “aim”, “will likely result”, “would”, “believe”, “may”, “result”, “expect”, “will continue”, “anticipate”, “estimate”, “intend”, “plan”, “contemplate”, “seek to”, “future”, “objective”, “goal”, “strategy”, “philosophy”, “project”, “should”, “will pursue” and similar expressions or variations of such expressions may constitute “forward-looking statements”. These forward-looking statements involve a number of risks, uncertainties and other factors that could cause SEB’s actual development and results to differ materially from any development or result expressed or implied by such forward-looking statements. These risks and uncertainties include, but are not limited to, SEB’s ability to successfully implement its strategy, future levels of non-performing loans, its growth and expansion, the adequacy of its allowance for credit losses, its provisioning policies, technological changes, investment income, cash flow projections, exposure to market risks as wells other risks. SEB undertakes no obligation to publicly update or revise forward-looking statements contained herein, whether as a result of new information, future events or otherwise. In addition, forward-looking statements contained in this presentation regarding past trends or activities should not be taken as a representation that such trends or activities will continue in the future. You should not place undue reliance on forward-looking statements, which speak only as of the date of this presentation.
2

Contents
3
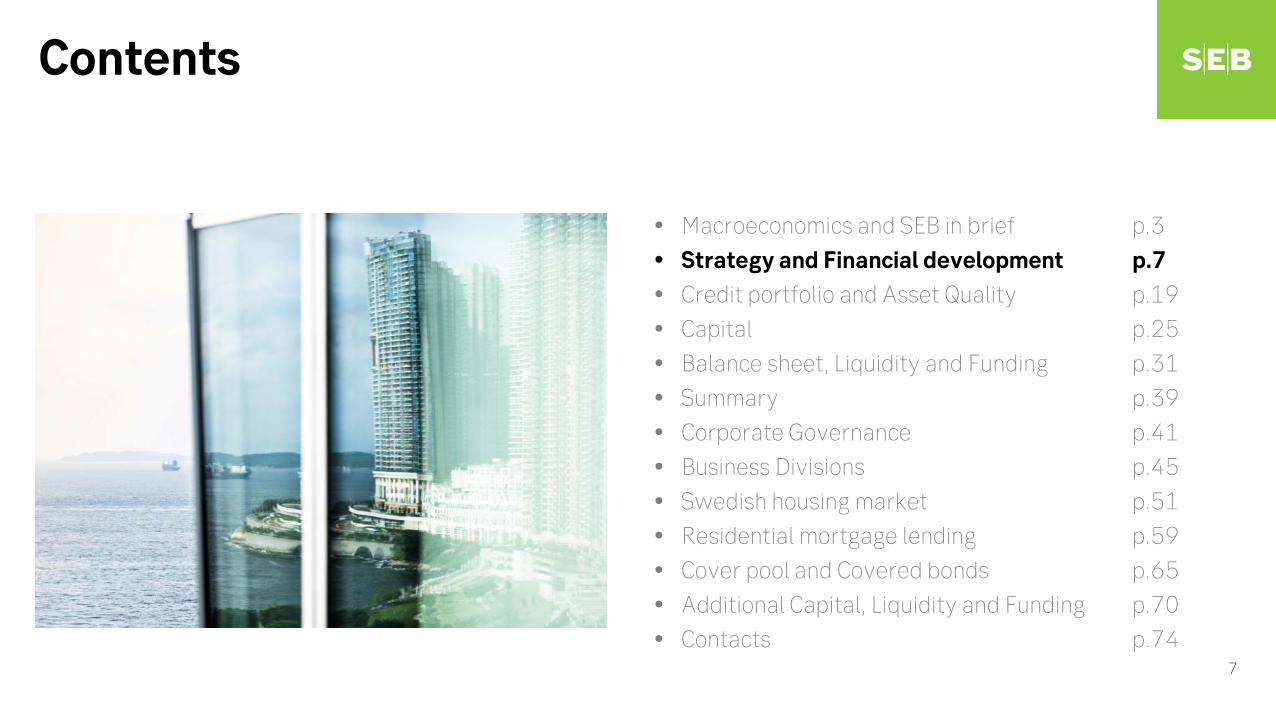
Macroeconomics and SEB in brief p.3 Strategy and Financial development p.7
Credit portfolio and Asset Quality p.19
Capital p.25
Balance sheet, Liquidity and Funding p.31
Summary p.39
Corporate Governance p.41
Business Divisions p.45
Swedish housing market p.51
Residential mortgage lending p.59
Cover pool and Covered bonds p.65
Additional Capital, Liquidity and Funding p.70
Contacts p.74
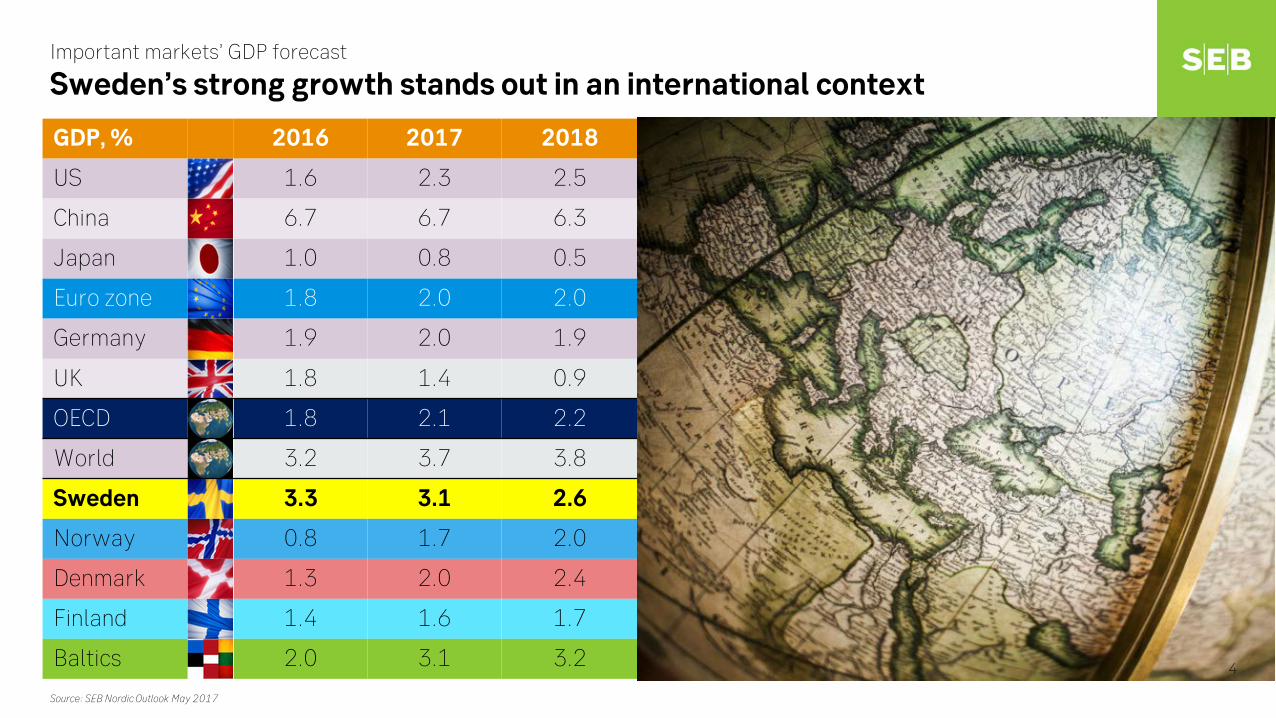
GDP, % 2016 2017 2018
US 1.6 2.3 2.5
China 6.7 6.7 6.3
Japan 1.0 0.8 0.5
Euro zone 1.8 2.0 2.0
Germany 1.9 2.0 1.9
UK 1.8 1.4 0.9
OECD 1.8 2.1 2.2
World 3.2 3.7 3.8
Sweden 3.3 3.1 2.6
Norway 0.8 1.7 2.0
Denmark 1.3 2.0 2.4
Finland 1.4 1.6 1.7
Baltics 2.0 3.1 3.2
Source: SEB Nordic Outlook May 2017
Important markets’ GDP forecast
Sweden’s strong growth stands out in an international context
4

Strong GDP-growth in a European context GDP growth of 3.3% in 2016 and expected to be 3.1% in 2017 and 2.6% in 2018
GDP growth is driven by home buildings, public sector investments and manufacturing activity is strengthening significantly
Growth has also been supported by the Central Bank’s monetary policy – see below
Current Account surplus slowly decreasing from around 6% as a % of GDP in recent years to around 4% in the coming years Exports constitute approx 45% of GDP (GDP 2016 was approx. SEK 4,181 (USD 468bn)
Goods constituted approx. 30%. Services constitute approx. 15% and are increasing in importance
Approx. 50% of exports were to the Nordic countries, Germany, UK and the USA
Relatively weak Swedish Krona due to exceptional monetary policy
General government gross debt is decreasing and is expected to be just below 40% in 2017 and even lower in 2018 Central Government debt is approx. 30% and below 25% if excluding re-lending to the Swedish Central bank
Central government shows a budget surplus of 2% of GDP in 2016 and an estimated 1% in 2017 thanks to the higher than expected tax revenues and despite increased costs for immigration
Healthy new job creation Rapid job growth, but a rising participation rate is keeping unemployment up at 6.4% but is expected to fall to 6% in early 2018 due to strong population
growth
Construction and private sector firms say much higher growth is possible if they can find suitable emploees, the public sector shortages is increasing
Low Inflation (“CPI”) , negative interest rates and QE Inflation was below target at 1% in 2016, but reached the target 2% in February, lower price increase for Energy and Vegetables and a drop in travel
prices retreated the inflation to 1.6% in April.It is expected to pick up to be just below target in 2017 and 2018
Beginning in February 2015, the Central Bank introduced a quantitative easing (“QE”) programme, that has been expanded to five steps , in which the Swedish Riksbank aims to purchase SEK 275 billion of government bonds by June 2017, In end of April they extended the program by SEK 15 billion, half nominal bonds and half IL-bonds, to be purchased in the second half of 2017
The QE programme corresponds to around 7% of GDP
The repo rate has been at -0.50% since February 2016
Source: SEB Nordic Outlook May 2017 and Statistics Sweden
SEB’s Core Market
Swedish Economy 2016 to 2018
5
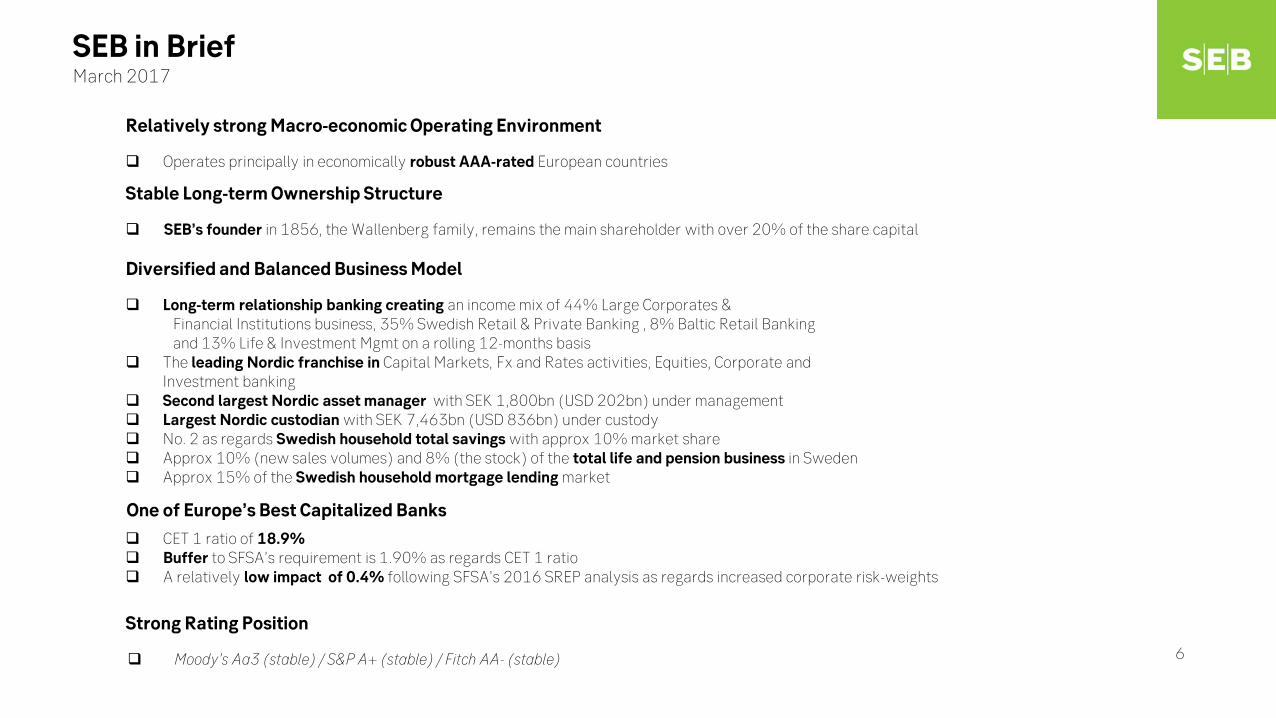
Relatively strong Macro-economic Operating Environment
Operates principally in economically robust AAA-rated European countries
Stable Long-term Ownership Structure
SEB’s founder in 1856, the Wallenberg family, remains the main shareholder with over 20% of the share capital
Diversified and Balanced Business Model
Long-term relationship banking creating an income mix of 44% Large Corporates & Financial Institutions business, 35% Swedish Retail & Private Banking , 8% Baltic Retail Banking and 13% Life & Investment Mgmt on a rolling 12-months basis The leading Nordic franchise in Capital Markets, Fx and Rates activities, Equities, Corporate and Investment banking Second largest Nordic asset manager with SEK 1,800bn (USD 202bn) under management Largest Nordic custodian with SEK 7,463bn (USD 836bn) under custody No. 2 as regards Swedish household total savings with approx 10% market share Approx 10% (new sales volumes) and 8% (the stock) of the total life and pension business in Sweden Approx 15% of the Swedish household mortgage lending market
One of Europe’s Best Capitalized Banks
SEB in Brief March 2017
CET 1 ratio of 18.9% Buffer to SFSA’s requirement is 1.90% as regards CET 1 ratio A relatively low impact of 0.4% following SFSA’s 2016 SREP analysis as regards increased corporate risk-weights
Strong Rating Position
Moody’s Aa3 (stable) / S&P A+ (stable) / Fitch AA- (stable) 6
Contents
7
Macroeconomics and SEB in brief p.3
Strategy and Financial development p.7 Credit portfolio and Asset Quality p.19
Capital p.25
Balance sheet, Liquidity and Funding p.31
Summary p.39
Corporate Governance p.41
Business Divisions p.45
Swedish housing market p.51
Residential mortgage lending p.59
Cover pool and Covered bonds p.65
Additional Capital, Liquidity and Funding p.70
Contacts p.74

35%
8%
13%
44%Lithuania
Denmark
Norway Finland
Sweden Latvia
Estonia
Germany
Lithuania
Corporate & Private Customers
(Swedish SMEs and Private Customers)
Life & Investment Management
Baltic Banking
Operates principally in economically robust AAA rated European countries
Diversified Business mix
Universal banking in Sweden and the Baltics
Principally corporate banking in the other Nordic countries and Germany
Total operating income from business divisions
rolling 12m Mar 2017
SEK 43.6bn (USD 4.9bn)
SEB’s Core Markets and Business
Well-diversified business in a strong economic environment
Large Corporates & Financial Institutions
8

• Consolidation Group functions
• Increasing the corporate franchise in the other Nordic countries &
Germany
• New organizational structure more closely aligned with customer segments
• Invest in service and distribution • Digitization of information vis à vis customers and
internally
• Swedish Retail Banking transformation and increasing
franchise Private
individuals
Corporate & Institutions
REFOCUS ON THE CORE
TRANSFORM AND GROW THE CORE STRENGTHEN
THE CORE
2005
• Sale of non-core businesses
SEB’s strategic development
Expanding the Corporate Franchise and Transformation of the Swedish Retail business
2010-2015 2016-2018
9

Full focus on Swedish businesses
Continue to grow in the Nordics and Germany
Savings & pension growth
World-class service
Digitization and automation
Next generation competences
10
Business Plan 2016 - 2018
Focus on growth and transformation continues

Benchmarking Swedish Banks’ Business Profile and Income Diversification
SEB’s diversified business mix sustains earnings
SEB has its roots in servicing large corporates and institutions and high net worth individuals which is reflected in the broadest income generation base with less dependence on NII in contrast to its peers
Diversified income streams and lower dependence on NII Operating income by revenue stream, FY 2016
Highly diversified Corporate Business and Low Real Estate & Mortgage exposure
Sector credit exposure composition (EAD) 1) December 31, 2016
Source: Companies ’ FY 2016 reports
0%
10%
20%
30%
40%
50%
60%
70%
80%
90%
100%
SEB Peer 1 Peer 2 Peer 3
Net interest income Net fee & commission income Net financial income Net other income
39%
16%
2% 7%
23%
5%
43%
69% 60%
29%
6%
48%
33%
17%
2% 1%
81% of SEB’s corporate exposure is to large Swedish, other large Nordic and German international corporates with geographically diversified sales and income streams SEB has the lowest total real estate and mortgage exposure
1) EAD = Risk Exposure Amount / Risk Weight Source: Companies ’ Pillar 3 reports
42%
29% 24% 16%
15%
11% 15%
25%
3%
1% 7% 8%
28%
35%
45% 39%
5%
9%
3% 6% 6%
11%
6% 5% 1% 4% 1%
SEB Peer 1 Peer 2 Peer 3Other Institutions
Other retail loans (SME and households) Household mortgages
Housing co-operative associations Real estate
Corporates
11

Swedish Large Corporates’ Franchise
Revenue streams for Swedish large corporates well distributed across geographies
Asia 12%
Americas 18%
Northern Europe 25%
Nordics 31%
RoW 14%
Note: Sales of 120 largest listed Swedish corporates Source: Annual reports 2016 12

-10
0
10
20
30
40
50
19
90
19
91
19
92
19
93
19
94
19
95
19
96
19
97
19
98
19
99
20
00
20
01
20
02
20
03
20
04
20
05
20
06
20
07
20
08
20
09
20
10
20
11
20
12
20
13
20
14
20
15
20
16
SEK bn
SEB’s Long-term Profit Development 1990 – 2016, rolling 12m
Profitable growth through focused business strategy, increased franchise and cost control
Credit losses Operating income Operating expenses Profit before credit losses
CAGR +5% 3.
Operating profit
1. Consequences of the Swedish economic paradigm shift and the ensuing financial crisis. SEB is one of two of major banks that was not taken over or directly guaranteed by the state
2. Credit losses driven by the Baltics during the Financial Crisis – important to note the strong revenue generation and overall profitability during this period notwithstanding the Financial Crisis
3. Adjusted for items affecting comparability in 2014-2016. See p.18
1
2
3.
13
CAGR +8% 3.
CAGR +4% 3.

1 000
2 000
3 000
4 000
5 000
6 000
7 000
2006 2007 2008 2009 2010 2011 2012 2013 2014 2015 2016 Jan - Mar2017
Payments, card, lending Asset value based
Activity based Total Life (Trad Life & Unit-linked) insurance income (up to and incl. 2013)
Life insurance income, Unit-linked
2 000
4 000
6 000
8 000
10 000
12 000
2006 2007 2008 2009 2010 2011 2012 2013 2014 2015 2016 Jan-Mar2017
Net interest income Net commission Net financial income LC & FI Net financial income, excl. LC&FI Net other income
Strong market franchise and high recurring income generation render stable fees and commissions
Average quarterly income in SEKm
2006 – Mar 2017
Average quarterly fees and commissions income in SEKm
2006 – Mar 2017
35%
4%
49%
42%
38%
1%
Non-NII is more important than NII
11% 9%
SEB’s Income Profile Development
Business mix and Franchise create diversified and stable income
10%
1)
1) LC&F is the division Large Corporates and Financial Institutions 2) Trad. Life income booked under NFI from Jan 2014
2)
26%
27%
34% 42%
33%
17%
8% 14%
Split of operating income
14
Split of fees and commissions

23.5 22.9 22.3 22.1
5.4
0.0
5.0
10.0
15.0
20.0
25.0
30.0
2011 2012 2013 2014 2015 2016 2017 2018
Activities
Decentralisation of Decision Making Synergies and streamlining Transfer of business operations to Riga and Vilnius Outsource where not distinctive or cost competitive
Partnering to achieve scale and reach in offering Collaboration in non-core areas
Successful introduction of cost caps
Investments in growth and customer interface Agile IT development All development and management of digital services are
assembled in one department Business 100% responsible for IT development
21.8
Operating Leverage
Increased leverage on existing cost caps
Cost cap 22.5bn Cost cap 23.1bn Cost cap 24bn
Cost cap 22.0bn
21.8
SEKbn
15 Note:. Adjusted for items affecting comparability in 2014-2016. See p.18
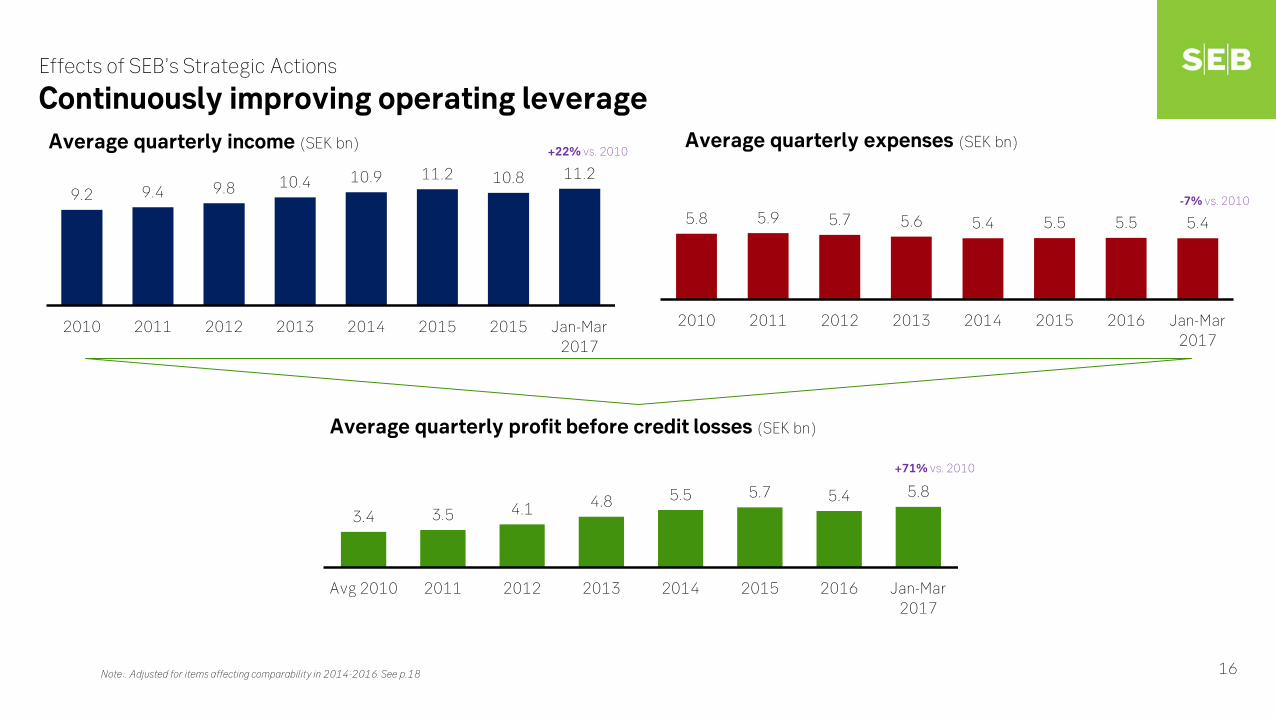
Average quarterly income (SEK bn)
9.2 9.4 9.8 10.4 10.9 11.2 10.8 11.2
2010 2011 2012 2013 2014 2015 2015 Jan-Mar2017
Average quarterly expenses (SEK bn)
5.8 5.9 5.7 5.6 5.4 5.5 5.5 5.4
2010 2011 2012 2013 2014 2015 2016 Jan-Mar2017
Average quarterly profit before credit losses (SEK bn)
3.4 3.5 4.1 4.8 5.5 5.7 5.4 5.8
Avg 2010 2011 2012 2013 2014 2015 2016 Jan-Mar2017
Effects of SEB’s Strategic Actions
Continuously improving operating leverage +22% vs. 2010
-7% vs. 2010
+71% vs. 2010
16 Note:. Adjusted for items affecting comparability in 2014-2016. See p.18

Sustained High Underlying Operating Profit • 12.2% RoE Q1 ‘17
• Strong capital generation (Rolling 12m Net Profit) of 2.7%
• Q1 ‘17 operating income and operating profit of 4% and 9% , respectively, were higher than the quarterly average figures of 2016
Diversified Business Mix and Growing Franchise underpin strong Earnings Generation • Mitigating the effects of negative interest rates, geo-political uncertainty and low large activity
The start of 2016 was challenging but improved during the year and beginning of 2017 • SEK repo rate on average 23 bps lower in ‘16 vs.’15; flat in Q1 ‘17 vs Q4 ’16
• Increased lending margins and volumes mitigated the effects of negative interest rates in ’16 ; sustained margins and stable lending growth in Q1 ’17 vs.Q4 ’16>50% higher regulatory fees in Q1 ‘17 vs the quarterly average in ‘16 affecting net interest income even more negtively
• Asset values and related fees were negatively affected by equity markets in ‘16 but improved in Q1 ’17
• Net inflow of AuM and increased life insurance business offset the negative asset value effects to some degree in 16 but were rather stable in Q1 ‘17
• Card and lending fees negatively affected by regulatory requirements
• Large corporate activity slow in H1 ‘16 but gradually improving in H2 ‘16 and beginning of ’17
• High corporate demand for risk management advice and services had positive result effects
Robust Liquidity, Strong Capital and High Asset Quality position • Highly diversified funding mix, stable deposit base and less dependent on wholesale funding compared to peers
• Strong CET 1 ratio of 18.9 ; 1.9% above regulatory requirement and 0.4% above management buffer
• Net credit loss level is stable at 5bps
Financial Highlights Full Year 2016 and Q1 2017
Q1 ’17 Operating income and Operating profit higher than 2016 quarterly average figures
17
1)
1) Adjusted for items affecting comparability in 2014-2016. See p.18
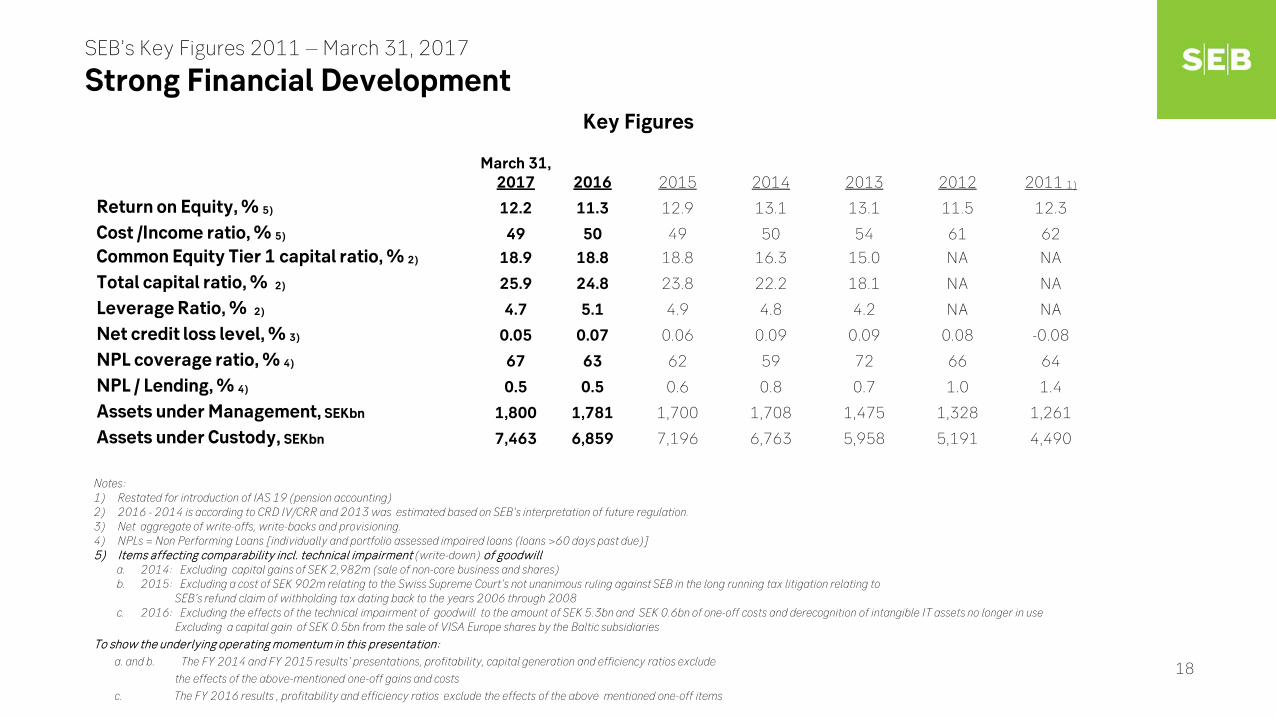
March 31, 2017 2016 2015 2014 2013 2012 2011 1)
Return on Equity, % 5) 12.2 11.3 12.9 13.1 13.1 11.5 12.3
Cost /Income ratio, % 5) 49 50 49 50 54 61 62
Common Equity Tier 1 capital ratio, % 2) 18.9 18.8 18.8 16.3 15.0 NA NA
Total capital ratio, % 2) 25.9 24.8 23.8 22.2 18.1 NA NA
Leverage Ratio, % 2) 4.7 5.1 4.9 4.8 4.2 NA NA
Net credit loss level, % 3) 0.05 0.07 0.06 0.09 0.09 0.08 -0.08
NPL coverage ratio, % 4) 67 63 62 59 72 66 64
NPL / Lending, % 4) 0.5 0.5 0.6 0.8 0.7 1.0 1.4
Assets under Management, SEKbn 1,800 1,781 1,700 1,708 1,475 1,328 1,261
Assets under Custody, SEKbn 7,463 6,859 7,196 6,763 5,958 5,191 4,490
Key Figures
Notes: 1) Restated for introduction of IAS 19 (pension accounting) 2) 2016 - 2014 is according to CRD IV/CRR and 2013 was estimated based on SEB’s interpretation of future regulation. 3) Net aggregate of write-offs, write-backs and provisioning. 4) NPLs = Non Performing Loans [individually and portfolio assessed impaired loans (loans >60 days past due)] 5) Items affecting comparability incl. technical impairment (write-down) of goodwill
a. 2014: Excluding capital gains of SEK 2,982m (sale of non-core business and shares) b. 2015: Excluding a cost of SEK 902m relating to the Swiss Supreme Court’s not unanimous ruling against SEB in the long running tax litigation relating to SEB’s refund claim of withholding tax dating back to the years 2006 through 2008 c. 2016: Excluding the effects of the technical impairment of goodwill to the amount of SEK 5.3bn and SEK 0.6bn of one-off costs and derecognition of intangible IT assets no longer in use Excluding a capital gain of SEK 0.5bn from the sale of VISA Europe shares by the Baltic subsidiaries
To show the underlying operating momentum in this presentation: a. and b. The FY 2014 and FY 2015 results’ presentations, profitability, capital generation and efficiency ratios exclude
the effects of the above-mentioned one-off gains and costs
c. The FY 2016 results , profitability and efficiency ratios exclude the effects of the above mentioned one-off items
SEB’s Key Figures 2011 – March 31, 2017
Strong Financial Development
18

Contents
19
Macroeconomics and SEB in brief p.3
Strategy and Financial development p.7
Credit portfolio and Asset Quality p.19 Capital p.25
Balance sheet, Liquidity and Funding p.31
Summary p.39
Corporate Governance p.41
Business Divisions p.45
Swedish housing market p.51
Residential mortgage lending p.59
Cover pool and Covered bonds p.65
Additional Capital, Liquidity and Funding p.70
Contacts p.74

0
200
400
600
800
1,000
Mar
'10
Sep
'10
Mar
'11
Sep
'11
Mar
'12
Sep
'12
Mar
'13
Sep
'13
Mar
'14
Sep
'14
Mar
'15
Sep
'15
Mar
'16
Sep
'16
Mar
'17
Growth in lower risk sectors Credit Portfolio – Business split
SEB Total Credit Portfolio excl. Banks (on and off balance sheet)
Diversified Corporate and low-risk Swedish Residential Mortgage exposure dominate
Corporates
Commercial Real Estate
Swedish Household Mortgages
SEK bn
Residential Apartment Buildings Households excl. Swedish Household Mortgages
SEK 2,041bn (USD 229bn) March 31, 2017
50%
Corporates Commercial Real Estate
Residential Mortgages Household consumer finance
Public Sector
34%
3% 4%
9%
50%
SEK 2,041bn (USD 229bn) March 31, 2017
20

0%
5%
10%
15%
20%
25%
30%
35%
40%
45%
Dec '08 Dec '09 Dec '10 Dec '11 Dec '12 Dec '13 Dec '14 Dec '15 Dec '16 Mar '17
Large Corporates
Swedish Residential Mortgage
Commercial Real Estate
Baltic total non-bank credit portfolio
Swedish SMEs
Credit Portfolio geographic split development
Total Credit Portfolio excl. banks (on and off balance sheet)
Increasing Nordic and Low-risk Exposure
Development of business mix further strengthened by SEB’s diversified and low-risk exposure
31% 29%
14% 23%
4%
8% 10%
16% 25%
10%
12% 7% 4% 6%
Dec '08 Mar '17
Other
Baltics
Germany
Other Nordics
Swedish residential mortgage
Swedish household mortgage
Sweden excl. residential mortgage
Sweden From 49% to 60%
Total Nordics From 59% to 76%
SEK 1,649bn (USD 185bn) SEK 2,041bn (USD 229bn)
21

0% 10% 20% 30% 40% 50% 60%
Agriculture, forestry andfishing
Construction
Other
Transportation
Mining, oil and gasextraction
Shipping
Electricity, water and gassupply
Wholesale and Retail
Finance & Insurance
Business and HouseholdServices
Manufacturing
Total Corporate CreditPortfolio
Loan portfolio Undrawn Committments, guarantees and net derivatives
Total Corporate Credit Portfolio excl. banks (on and off balance sheet), March 31, 2017 Low actual on-balance sheet and diversified Large Coprorate exposure render lower Credit Risk
Total Corporate Credit Portfolio by sector Split into loans and other types of exposure % of Total Credit Portfolio SEK 2,041bn (USD 229bn)
Total Corporate Credit Portfolio split by Business
80% 83% 82%
81% 84% 83% 82% 81%
9% 9% 10%
12%
10% 10%
11% 12%
8%
8% 7%
7%
6% 6%
7% 7%
666 708 730
784
952 936
1,029 1,026
Dec '10 Dec '11 Dec '12 Dec '13 Dec '14 Dec '15 Dec '16 Mar '17
Large Corporates Swedish SMEs Baltic
22
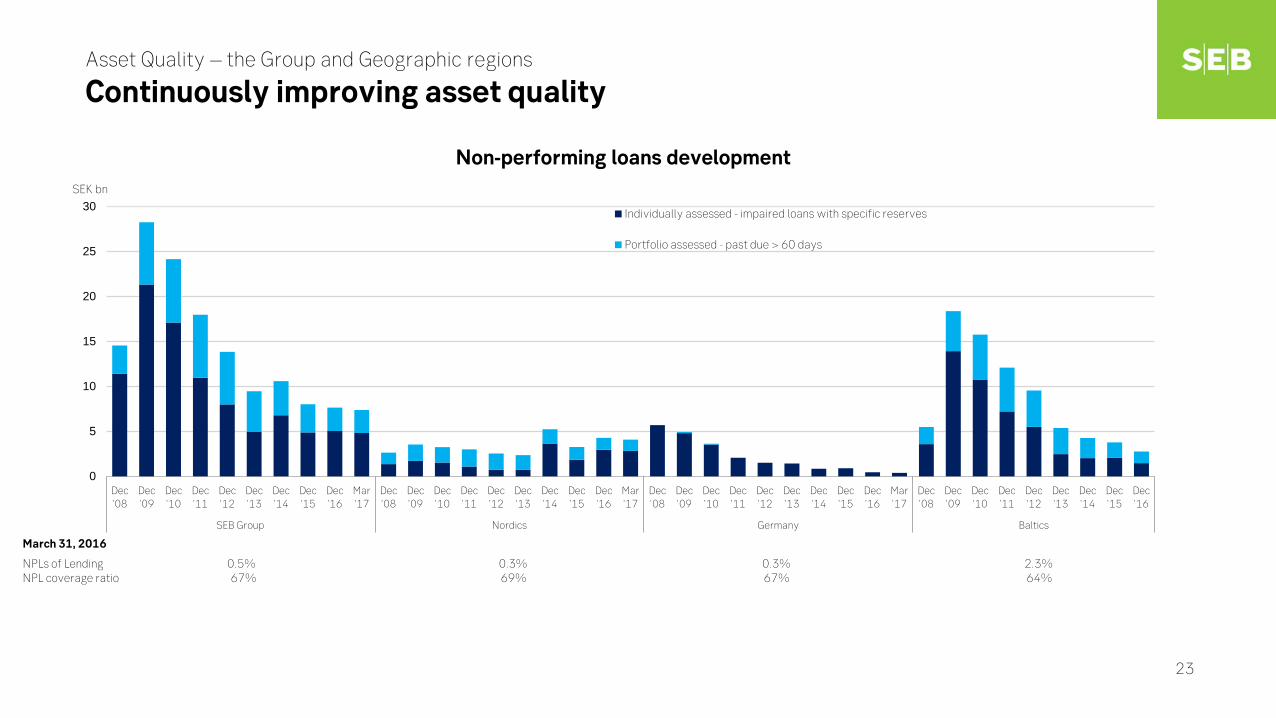
Non-performing loans development
March 31, 2016
SEK bn
Asset Quality – the Group and Geographic regions
Continuously improving asset quality
0
5
10
15
20
25
30
Dec'08
Dec'09
Dec'10
Dec'11
Dec'12
Dec'13
Dec'14
Dec'15
Dec'16
Mar'17
Dec'08
Dec'09
Dec'10
Dec'11
Dec'12
Dec'13
Dec'14
Dec'15
Dec'16
Mar'17
Dec'08
Dec'09
Dec'10
Dec'11
Dec'12
Dec'13
Dec'14
Dec'15
Dec'16
Mar'17
Dec'08
Dec'09
Dec'10
Dec'11
Dec'12
Dec'13
Dec'14
Dec'15
Dec'16
SEB Group Nordics Germany Baltics
Individually assessed - impaired loans with specific reserves
Portfolio assessed - past due > 60 days
NPLs of Lending 0.5% 0.3% 0.3% 2.3% NPL coverage ratio 67% 69% 67% 64%
23

Nordic countries, net credit losses in %
0.43 1.28
5.43
0.63
-1.37
0.33 0.40 0.21 0.12 0.05
-0.06
2007 2008 2009 2010 2011 2012 2013 2014 2015 2016 March'17
0.05 0.18 0.17 0.06 0.07 0.05 0.06 0.11 0.06 0.08 0.11
2007 2008 2009 2010 2011 2012 2013 2014 2015 2016 March'17
0.10 0.090.22 0.14
0.02 0.02 0.05
-0.07
0.01 0.01
-0.01
2007 2008 2009 2010 2011 2012 2013 2014 2015 2016 March'17
0.11 0.30
0.92
0.15
-0.08
0.08 0.09 0.09 0.06 0.07 0.05
2007 2008 2009 2010 2011 2012 2013 2014 2015 2016 March'17
Baltic countries, net credit losses in %
Germany, net credit losses in % SEB Group, net credit losses in %
Net credit losses = the aggregated net of write-offs, write-backs and provisions
Negative net credit losses = reversals
Asset Quality – the Group and Geographic regions
Low net credit losses in all geographic areas
24

Contents
25
Macroeconomics and SEB in brief p.3
Strategy and Financial development p.7
Credit portfolio and Asset Quality p.19
Capital p.25 Balance sheet, Liquidity and Funding p.31
Summary p.39
Corporate Governance p.41
Business Divisions p.45
Swedish housing market p.51
Residential mortgage lending p.59
Cover pool and Covered bonds p.65
Additional Capital, Liquidity and Funding p.70
Contacts p.74

1.23%
0.16%
0.95%
1.63% 2.00%
2.47% 2.63%
3.06%
2.62% 2.73%
0.0%
0.5%
1.0%
1.5%
2.0%
2.5%
3.0%
3.5%
2008 2009 2010 2011 2012 2013 2014 2015 2016 Rolling 12m NetProfit
Profitable throughout the Financial Crisis Sustained underlying profit
Strong underlying capital generation
15.6 17.0
13.0 14.2
15.2
19.3
21.8 22.9
21.4
5.8
12.4
5.7
11.4
15.0 14.2
18.1
20.4 21.8
20.3
5.5
0
5
10
15
20
25
2008 2009 2010 2011 2012 2013 2014 2015 2016 March '17
Profit before credit losses Operating profit
Note: RWA 2008 – 2012 Basel II without transitional floor REA 2013 – 2015 Basel III fully implemented
SEK bn
SEB’s Capital Generation 2008 – March 2017
Sustained strong Earnings and Capital Generation
Net Profit / RWA Net Profit / REA
26
0
5
10
15
20
25
30
2014 2015 2016 March '17
Tier 2
Legacy Hybrid Tier 1
Additional Tier 1
Common Equity Tier 1
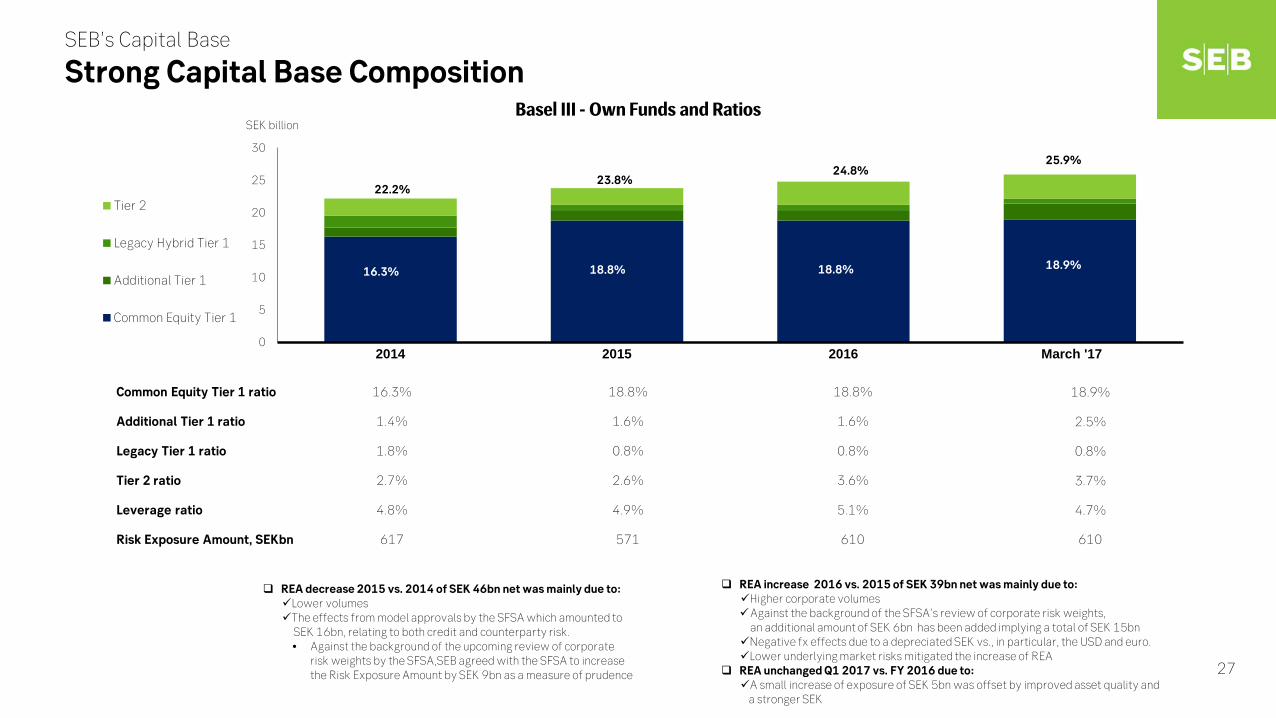
Basel III - Own Funds and Ratios
SEB’s Capital Base
Strong Capital Base Composition
REA decrease 2015 vs. 2014 of SEK 46bn net was mainly due to: Lower volumes The effects from model approvals by the SFSA which amounted to SEK 16bn, relating to both credit and counterparty risk.
• Against the background of the upcoming review of corporate risk weights by the SFSA,SEB agreed with the SFSA to increase the Risk Exposure Amount by SEK 9bn as a measure of prudence
22.2% 23.8%
24.8%
REA increase 2016 vs. 2015 of SEK 39bn net was mainly due to: Higher corporate volumes Against the background of the SFSA’s review of corporate risk weights,
an additional amount of SEK 6bn has been added implying a total of SEK 15bn Negative fx effects due to a depreciated SEK vs., in particular, the USD and euro. Lower underlying market risks mitigated the increase of REA
REA unchanged Q1 2017 vs. FY 2016 due to: A small increase of exposure of SEK 5bn was offset by improved asset quality and
a stronger SEK
SEK billion
18.8% 18.8% 16.3%
25.9%
18.9%
Common Equity Tier 1 ratio 16.3% 18.8% 18.8% 18.9%
Additional Tier 1 ratio 1.4% 1.6% 1.6% 2.5%
Legacy Tier 1 ratio 1.8% 0.8% 0.8% 0.8%
Tier 2 ratio 2.7% 2.6% 3.6% 3.7%
Leverage ratio 4.8% 4.9% 5.1% 4.7%
Risk Exposure Amount, SEKbn 617 571 610 610
27

4.5% 4.5%
3.5% 2.1%
2.8%
2.0%
2.5%
2.0%
2.0%
3.0%
3.0%
0.9%
0.9%
2.5%
2.5%
18.9%
2.5%
0.8%
3.7%
0%
5%
10%
15%
20%
25%
30%
SEB CET1 Requirement SEB Total Capital Requirement SEB Reported CET1 SEB Reported Total Capital
SFSA’s Capital Requirements and SEB’s Reported Ratios, March 31, 2017
SEB’s ratios exceed SFSA’s risk-sensitive and high requirements
Other Individual Pillar 2
Mortgage Risk Weight Floor
Systemic Risk
Countercyclical
Systemic Risk
Min Total Capital
requirements under Pillar 1
AT1 1.5% & T2 2.0%
Combined Buffer Requirement under
Pillar 1
Pillar 2 requirements
Min CET1 requirements
Total 17.0%
Total 21.7%
Total 25.9%
Total 18.9%
SEB’s CET1 ratio is 1.9% above the SFSA CET1 requirement as at March 31, 2017 and 0.4% above targeted management buffer
Tier 2
Additional Tier 1
Legacy Hybrid 1 Capital Conservation
Common Equity Tier 1
Composition of SEB’s CET 1 and Total Capital Requirements
SEB’s reported CET 1 ratio and Total Capital ratio composition
28

0
10
20
30
40
50
60
70
2019 2020 2021 2022
Estimated non-preferred senior debt issuance need
"Preferred" senior debt maturities
8.0%
6.4%
7.3%
21.7%
15.3%
0.0%
5.0%
10.0%
15.0%
20.0%
25.0%
30.0%
35.0%
40.0%
Total Capital Requiremet Total Capital Requirement + MREL
Current proposed introduction of Swedish MREL
Modest need for non-preferred senior debt
29
Min Total Capital requirement under Pillar 1
CBR under Pillar 1
Pillar 2 requirement
Total 21.7%
Total 37.0%
Recap Amount under MREL
=> SEK 93 bn1)
Total Capital Requirement
Bank specific MREL requirement announced
MREL Requirement apply
Possible earliest introduction of new
insolvency law
Q4 2017
2020
2019
2018
2022
2021
SEK bn
Estimated phasing-in period of non-preferred senior debt
SEB Total capital and non-preferred senior debt requirement ”Preferred” senior debt maturities clearly exceed Non-preferred senior debt issuance needs
1) Recao amount based in capital requirements at March 21st, 2017 2) Issuance volume recap amount phased in over a 4 year period

SEB has the lowest Pillar 2 capital requirements of Swedish banks CET 1 requirements for Swedish Banks as at December 31, 2016
10.7% 10.6% 11.0% 10.9%
6.2% 6.9% 10.3% 10.5%
16.9% 17.4%
21.2% 21.4%
SEB Peer 1 Peer 2 Peer 3
Pillar II requirement Pillar I requirement
30%
23%
8%
16%
10% 7% 6%
Other BalticsGermany Other NordicsSwedish residential mortgage Swedish household mortgageSweden excl. residential mortgage
Approx. 80% of SEB’s exposure is Nordic December 31, 2016
Well-managed, Low-risk, Diversified Nordic Business and Strong Corporate Culture render the lowest corrective capital requirements of Swedish peers
42% 29% 24%
16%
15%
11% 15% 25%
3%
1% 7% 8%
28%
35%
45% 39%
5%
9%
3% 6% 6%
11% 6% 5% 4%
SEB Peer 1 Peer 2 Peer 3Other InstitutionsOther retail loans (SME and households) Household mortgagesHousing co-operative associations Real estateCorporates
Highly diversified Corporate Business Low Real Estate & Mortgage Exposure (EAD)
Sector credit exposure composition (EAD) 1) December 31, 2016
EAD = Risk Exposure Amount / Risk Weight Source: Companies ’ Pillar 3 reports, Finansinspektionen
77%
Low credit-related concentration risk including single name, geographical and industry concentration (as percentage of total REA), December 31, 2016
0.50% 0.40%
0.80% 0.90%
SEB Peer 1 Peer 2 Peer 3Source: SFSA report Feb 2017
30

Contents
31
Macroeconomics and SEB in brief p.3
Strategy and Financial development p.7
Credit portfolio and Asset Quality p.19
Capital p.25
Balance sheet, Liquidity and Funding p.31 Summary p.39
Corporate Governance p.41
Business Divisions p.45
Swedish housing market p.51
Residential mortgage lending p.59
Cover pool and Covered bonds p.65
Additional Capital, Liquidity and Funding p.70
Contacts p.74

Equity
Corporate & Public Sector lending
Corporate & Public Sector Deposits
Household Lending Household Deposits
Liquidity Portfolio Funding, remaining
maturity >1y
Cash & Deposits in Central Banks
Central Bank deposits
Funding, remaining maturity<1y
Client Trading Client Trading
Derivatives Derivatives
Credit Institutions Credit Institutions
Life Insurance Life Insurance
Other Other
0%
10%
20%
30%
40%
50%
60%
70%
80%
90%
100%
Assets Liabilities
32
Balance Sheet March 31, 2017
Diversified and Liquid Balance Sheet Total Assets SEK 2,927bn (USD 328bn)
Liquid assets
”Banking book” 1)
Banking book is 79% of Stable funding
Liquid assets is 161% of Short-term funding
Stable funding
Short-term funding
1) A relatively large share of lending is contractually short which allows for swift re-pricing to adjust for e.g. changed funding costs.
2) Central bank deposits refer to long-term relationship-based deposits from central banks and do not refer to borrowings from central banks
2)

0%
10%
20%
30%
40%
50%
60%
70%
80%
90%
100%
SEB Peer 1 Peer 2 Peer 3
Depositis from the Public
Deposits from CreditInstitutions
CP/CD
Covered Bonds
Senior unsecured bonds
Subordinated debt
Equity
49% 40% 43% 38%
8%
11% 7% 7%
8%
7% 7% 14%
16% 23% 28% 23%
5% 6% 6% 7%
10% 10% 9% 12% 2% 2% 1% 1%
Benchmarking Swedish Banks’ Total Funding Sources incl. equity
SEB has strong funding structure and the lowest asset encumbrance
Source: Companies ’ FY 2016 reports
Average quarterly balances in 2016
33

-
200
400
600
800
1,000
Q4
20
07
Q1
20
08
Q2
20
08
Q3
20
08
Q4
20
08
Q1
20
09
Q2
20
09
Q3
20
09
Q4
20
09
Q1
20
10
Q2
20
10
Q3
20
10
Q4
20
10
Q1
20
11
Q2
20
11
Q3
20
11
Q4
20
11
Q1
20
12
Q2
20
12
Q3
20
12
Q4
20
12
Q1
20
13
Q2
20
13
Q3
20
13
Q4
20
13
Q1
20
14
Q2
20
14
Q3
20
14
Q4
20
14
Q1
20
15
Q2
20
15
Q3
20
15
Q4
20
15
Q1
20
16
Q2
20
16
Q3
20
16
Q4
20
16
Q1
20
17
Total Total (ex. non-bank deposits with Treasury function)
Corporate sector Private sector
Non-bank deposit with Treasury function Public sector
Wholesale funding represents 31% of the funding base
Note: • Excluding repos • Excluding public covered bonds issued by the German subsidiary which are in a run-off mode
SEK 2,028bn (USD 227bn)
SEB’s Funding Base March 31, 2017
Stable deposit base and structural funding position Stable and strong structural funding position
Stable development of deposits from corporate sector and private individuals SEK bn
31%
15%
35%
2%
0%
20%
40%
60%
80%
100%
120%
Jan-12 Jan-14 Mar-15 Sep-15 Feb-16 May-16 Jul-16 Aug-16 Sep-16 Oct-16 Nov-16 Dec-16 Jan-17 Mar-17
Core Gap is the amount of funding in excess of one year in relation to assets with a maturity of more than one year based on internal behavioral modelling
Core Gap ratio averaged 116% over the period 2012-14 A more conservative model introduced in 2015 renders an average of 112% over 2015 – 2016 . Average levels in 2017 Q1 at 114%.
34
36%
13%
5% 4% 3%
29%
2% 8%
Corporate deposits
Private IndividualdepositsFinancial InstitutiondepositsPublic entity deposits
Central Bank deposits
Long-term funding
Subordinated debt
CPs/CDs
Core Gap Ratio

56% 37%
7% Mortgage CoveredBonds
Senior Unsecured Debt
Subordinated Debt
Long-term wholesale funding mix USD 70bn (SEK 626bn)
Instrument 2014 2015 2016 Q1 2017
Covered bonds 6.7 6.2 6.9 1.8
Senior unsecured 3.6 4.5 8.3 1.9
Subordinated debt 1.9 - 0.9 0.6
Total 12.2 10.6 16.2 4.3
Issuance of bonds USDbn equivalent
Maturity profile in USD bn equivalent
Long-term wholesale funding March 31, 2017
Well-balanced long-term funding structure
0
2
4
6
8
10
12
14
16
18
20
<1Y 1-2Y 2-3Y 3-4Y 4-5Y 5-7Y 7-10Y >10Y
Subordinated Debt
Senior UnsecuredDebt
Mortgage CoveredBonds, non-SEK
Mortgage CoveredBonds, SEK
11
13 12
18
9
5
0.4 1
Rating institute Short term Stand-alone Long term Uplift Outlook
S&P A-1 a A+ 1* Stable
Moody’s P-1 a3 Aa3 3* Stable
Fitch F1+ aa- AA- 0 Stable
Strong Credit Ratings
* of which one notch is due to the implicit state support
35
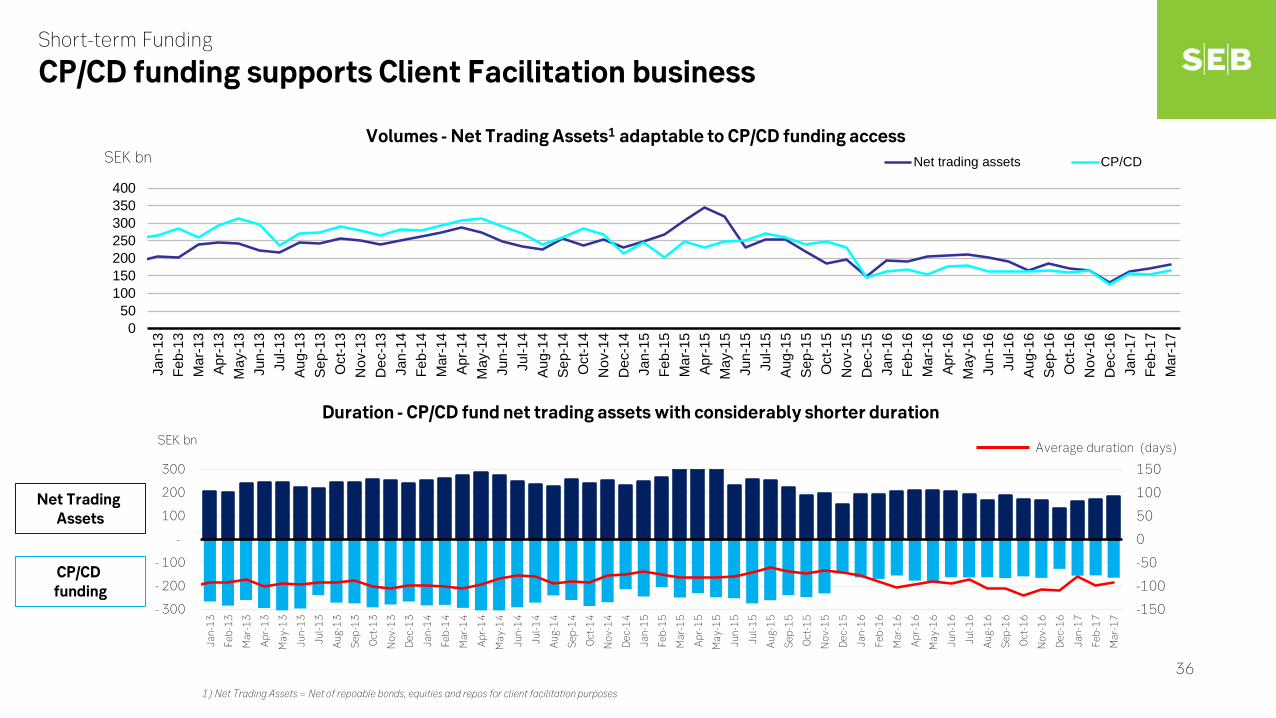
Duration - CP/CD fund net trading assets with considerably shorter duration
Volumes - Net Trading Assets1 adaptable to CP/CD funding access
1) Net Trading Assets = Net of repoable bonds, equities and repos for client facilitation purposes
Short-term Funding
CP/CD funding supports Client Facilitation business
Average duration (days) SEK bn
-150
-100
-50
0
50
100
150
- 300
- 200
- 100
-
100
200
300
Jan-
13
Feb-
13
Mar
-13
Apr
-13
May
-13
Jun-
13
Jul-1
3
Aug
-13
Sep-
13
Oct
-13
Nov
-13
Dec
-13
Jan-
14
Feb-
14
Mar
-14
Apr
-14
May
-14
Jun-
14
Jul-1
4
Aug
-14
Sep-
14
Oct
-14
Nov
-14
Dec
-14
Jan-
15
Feb-
15
Mar
-15
Apr
-15
May
-15
Jun-
15
Jul-1
5
Aug
-15
Sep-
15
Oct
-15
Nov
-15
Dec
-15
Jan-
16
Feb-
16
Mar
-16
Apr
-16
May
-16
Jun-
16
Jul-1
6
Aug
-16
Sep-
16
Oct
-16
Nov
-16
Dec
-16
Jan-
17
Feb-
17
Mar
-17
CP/CD funding
Net Trading Assets
SEK bn
050
100150200250300350400
Jan-
13Fe
b-13
Mar
-13
Apr-1
3M
ay-1
3Ju
n-13
Jul-1
3Au
g-13
Sep-
13O
ct-1
3N
ov-1
3D
ec-1
3Ja
n-14
Feb-
14M
ar-1
4Ap
r-14
May
-14
Jun-
14Ju
l-14
Aug-
14Se
p-14
Oct
-14
Nov
-14
Dec
-14
Jan-
15Fe
b-15
Mar
-15
Apr-1
5M
ay-1
5Ju
n-15
Jul-1
5Au
g-15
Sep-
15O
ct-1
5N
ov-1
5D
ec-1
5Ja
n-16
Feb-
16M
ar-1
6Ap
r-16
May
-16
Jun-
16Ju
l-16
Aug-
16Se
p-16
Oct
-16
Nov
-16
Dec
-16
Jan-
17Fe
b-17
Mar
-17
Net trading assets CP/CD
36

SEB’s Core Liquidity Reserve* is 226% of wholesale funding maturities within 1 year
Liquidity
Strong Liquidity and Maturing Funding position Also vs. Peers
* Definition of Core Liquidity Reserve according to Swedish Bankers’ Association
0
100
200
300
400
500
600
Cash & holdings in Central Banks O/N bank deposits
Treasuries & other Public Bonds Covered bonds
Non-Financial corporates Financial corporates
SEK 570bn (USD 64bn)
SEK bn
1) Liquid assets defined as on balance sheet cash and balances with central banks + securities (bonds and equities) net of short positions
Definition: Liquid Assets 1)/ (Maturing Wholesale Funding within 3/12m + Net interbank borrowing within 3/12m)
Source : Fact Book of SEB and the three other major Swedish banks. One peer does not disclose the 3m ratio
57%
14%
22%
Development 3m funding ratio Q1 2016-Q1 2017
Development 12m funding ratio Q1 2016-Q1 2017
Maturing Funding ratio 3m and 12m Peer benchmarking
0%50%
100%150%200%250%300%350%400%
Q1 2016 Q2 2016 Q3 2016 Q4 2016 Q1 2017
SEB Peer 1 Peer 2 Peer 3
0%
50%
100%
150%
200%
250%
Q1 2016 Q2 2016 Q3 2016 Q4 2016 Q1 2017
SEB Peer 1 Peer 2 Peer 3 Average
37

Profitability Return on Equity Competitive with peers long-term
aspiration of 15%
Capital Common Equity Tier 1 ratio About 150 bps over the regulatory
requirement
Dividend Pay-out ratio 40% or above of EPS
Focus on development of nominal amount
Ratings Funding access and credibility as
counterpart
Maintain credit ratings in support of competitive funding access and costs and
as a viable counterpart in financial markets
Efficiency Nominal cost cap
< SEK 22.0bn
in 2017 and 2018
SEB’s Targets
Financial Targets
38

Contents
39
Macroeconomics and SEB in brief p.3
Strategy and Financial development p.7
Credit portfolio and Asset Quality p.19
Capital p.25
Balance sheet, Liquidity and Funding p.31
Summary p.39 Corporate Governance p.41
Business Divisions p.45
Swedish housing market p.51
Residential mortgage lending p.59
Cover pool and Covered bonds p.65
Additional Capital, Liquidity and Funding p.70
Contacts p.74

Effects of Strategy 2010-2016
Financial performance and position
Business Plan 2016-2018
Capital position
Growth of corporate franchise in the Nordics and Germany and transformation of Retail business
Strengthened core areas and strong platform for further growth
SEB has sustained strong earnings and capital generation since the financial crisis in Sweden in the early 1990s
CET1 ratio of 18.9% as at March 31, 2017
Lowest Pillar 2 capital req. of Swedish peers due to well-managed, low-risk franchise and strong corporate culture
Leverage ratio at 4.7% as at March 31, 2017; well above future requirement of 3%
SEB has sustained strong earnings and capital generation since the financial crisis in Sweden in the early 1990s
EBA stress test results highlighted SEB’s strong capital & business position; profitable in every year of the adverse scenario,
only bank in Europe with improved leverage ratio in the adverse scenario, and lowest impairments
across Swedish banks in baseline scenario
Well diversified business model operating principally in economically robust AAA rated European countries
Sustained diversified earnings due to leading market positions in areas such as Large Corporate and Financial Institutions
business Swedish Retail and Private Banking and Life & Pension business
Stable long-term ownership structure; SEB’s founder in 1856, the Wallenberg family (through Investor AB), remains the
main shareholder with over 20% of the share capital and voting rights
Well experienced board and executive management, new internally recruited CEO with unchanged strategy
Executive summary
Governance & Ownership
Continued focus on customers and world-class services
Estimated financial levels communicated with regards to macro development
Financial targets and aspiration remain including prolonged cost cap (until 2018)
40

Contents
41
Macroeconomics and SEB in brief p.3
Strategy and Financial development p.7
Credit portfolio and Asset Quality p.19
Capital p.25
Balance sheet, Liquidity and Funding p.31
Summary p.39
Corporate Governance p.41 Business Divisions p.45
Swedish housing market p.51
Residential mortgage lending p.59
Cover pool and Covered bonds p.65
Additional Capital, Liquidity and Funding p.70
Contacts p.74

Corporate Governance Structure
President and Chief Executive Officer
Risk & Capital Committee Audit & Compliance Committee
Board of Directors
Appointed by
Chief Risk Officer
SEB’s activities are managed, controlled and followed up in accordance with policies and instructions established by the Board and the President and CEO.
Reporting/Informing to
Head of Group Internal Audit
Shareholders/General Meeting
Group Credit Officer
CEO Committees • Group Executive
Committee • Group Risk Committee • Asset & Liability
Committee
Nomination Committee
External Auditor
Remuneration & HR Committee
Head of Group Compliance
Head of Group Risk
42

Governance
Long-term major shareholders Strong corporate culture ”Tone at the top” from Board of Directors and Executive Management
SEB Code of Conduct
First line of defence
Line business management is primary responsible for managing risk
Strong governance and internal control Clear implementation of “three lines of defense approach”
Independent control functions with strong mandate and resources
Global (Group wide) Compliance function implemented 2008 based on international “best practice”
Compliance is an integrated part of performance management for all SEB staff
43

SEB organization Effective as of 1 January 2016
Business Support
Group Staff & Control Functions
Life and Investment Management
Large Corporates & Financial Institutions Baltic
President & CEO
Corporate & Private Customers
44

Contents
45
Macroeconomics and SEB in brief p.3
Strategy and Financial development p.7
Credit portfolio and Asset Quality p.19
Capital p.25
Balance sheet, Liquidity and Funding p.31
Summary p.39
Corporate Governance p.41
Business Divisions p.45 Swedish housing market p.51
Residential mortgage lending p.59
Cover pool and Covered bonds p.65
Additional Capital, Liquidity and Funding p.70
Contacts p.74

SEB’s Large Corporate & Financial Institutions Business
Strong Franchise and Successful Client Acquisition Strategy
472
Diversified business and solid efficiency render healthy profitability despite considerably higher regulatory requirements
C/I ratio Business Equity RoBE 1)
Q1 2017 50% SEK 66.1bn 9.7%
2016 47% 2) SEK 62.4bn 11.7%
2015 4) 45% 3) SEK 67.1bn 12.5%
2014 4) 46% SEK 57.7bn 12.8%
2013 50% SEK 48.8bn 12.9%
2012 54% SEK 36.7bn 14.3%
2011 54% SEK 26.1bn 20.6%
2016 results affected by continued macro uncertainty and dampened business activity during the first half of 2016 Positive market sentiment and customer activity improved results towards the end of 2016 and at the beginning of Q1 2017 2.5x more allocated capital and doubling of resolution fund fee with negative effects on profitablity
1) Return on Business Equity 2) Excl. One-off costs of SEK 354m 3) Excl. One-off costs of SEK 902m 4) Restated figures following the new organizational structure as of Jan 1, 2016. As a result 2011-2013 figures not quite comparable
2)
Large cross-selling potential Total Client income in SEK bn
Number of accumulated new clients
209
305
413
84
209 305 413 84
Total client income New clients’ income share of total
472 535
14.0 15.0 15.1 15.6
17.6
19.3 19.0
2 % 5 % 7 % 10 % 12 % 12 % 15 %
2010 2011 2012 2013 2014 2015 2016
594
46

72 negative trading days out of 2,574 Average loss SEK 12m (USD 1.3m)
Daily trading / client facilitation income Jan 1, 2007 – March 31, 2017
Low-risk in client facilitation operations render minimal losses in the markets operations
SEB’s Large Corporates & Financial Institutions Business
Entrenched Franchise and Low risk Client Facilitation Business
SEKm
Split of average quarterly income 2006 – March 2017
Larger number of clients and a relevant business offering create strong and diversified income streams
39%
24%
1) Restated figures following the new organizational structure as of Jan 1, 2016. As a results 2006-2013 figures are not quite comparable
1 000
2 000
3 000
4 000
5 000
6 000
2006 2007 2008 2009 2010 2011 2012 2013 2014 2015 2016 March '17Net interest income Net commission Net financial income Net other income
2007 2008 2009 2010 2011 2012 2013 2014 2015 2016 2017
32%
5%
39%
24%
45%
33%
1%
21%
47

Substantially increased operating profit since 2011
Growing franchise among SMEs in Sweden
Strong development of efficiency and profitability despite almost 4x more allocated capital and higher resolution fund fees
0.81.1
1.4
1.9 1.8 1.91.8
0
500
1,000
1,500
2,000
2011 2012 2013 2014 2015 2016 Q1 '17rolling12m
C/I ratio Business Equity RoBE 3)
Q1 2017 47% SEK 40.4bn 14.6%
2016 48% SEK 38.7bn 15.2%
2015 48% SEK 38.1bn 14.7%
2014 46% SEK 27.8bn 21.4%
2013 49% SEK 20.2bn 21.9%
2012 57% SEK 14.4bn 22.3%
2011 65% SEK 10.8bn 21.4%
SEK m
Average quarterly operating profit 2011 – March 2017
SEB’s Swedish SME and Private Customers Business
Successful Client Acquisition Strategy
12%
0%
5%
10%
15%
2011 2012 2013 2014 2015 March '17
1) Market share measured as SEB customers compared to total number of registered corporates in Sweden.
Increasing market shares in the SME market
0
50
100
150
200
250
2012 2013 2014 2015 March '17
Full-service customers (thousands) Total Lending (SEK bn)
*)
2) Restated figures following the new organizational structure as of Jan 1, 2016 As a result 2011-2013 figures not quite comparable 3) Return on Business Equity
15%
2)
2)
48
1)

SEB’s Swedish SME and Private Customers Business
Private customers’ behavior changes rapidly…
49
0
100
200
300
400
500
600
0
10
20
30
40
50
60
2012Q1
2013Q1
2014Q1
2015Q1
2016Q1
2017Q1
Digital logins, web Digital logins, mobile
Branch office visits Contact center calls
# of customers on-boarded
digitally in Q1 Million logins
Thousands visits/calls
Digital mortgage applications
SEB invests to take on changing customer behavior
3,000
1 of 8

Relatively strong operating environment
Above Eurozone growth
Falling unemployment, increasing employment and real income
Consumption prime driver, higher investments and growing exports
Economic health remains above Eurozone average
Deleveraged corporates and private individuals
Competitive industry
New markets – diversification of trading partners
Small , if any, budget deficits and government debt imbalances
SEB’s business and exposures are of a different nature than prior to the financial crisis
Strong development of key ratios
C/I Business Equity RoBE 1)
Q1 2017 47% SEK 7.6bn 23.4%
2016 49% 2),3) SEK7.6bn 20.1%
2015 50% 3) SEK 7.5bn 18.6%
2014 50% SEK 8.9bn 14.5%
2013 52% SEK 8.8bn 12.9%
2012 62% SEK 8.8bn 9.7%
2011 58% SEK 8.8bn 29.6% 4)
Maintaining leading market shares in lending* 2014 - 2016
SEB Baltic division
Strong Profitability despite uncertain times
1) Return on Business Equity 2) Excl. One-off cost of SEK 68m 3) Excl. Assets held for sale 4) Write-backs of provisions of SEK 1.5bn
3)
0%
10%
20%
30%
40%
50%
Q1-14
Q3 Q1-15
Q3 Q1-16
Q3 Q1-17
Estonia 5)
0%
10%
20%
30%
40%
50%
Q1-14
Q3 Q1-15
Q3 Q1-16
Q3 Q1-17
Latvia 5)
0%
10%
20%
30%
40%
50%
Q1-14
Q3 Q1-15
Q3 Q1-16
Q3 Q1-17
Lithuania 6)
5) Competitors Q1 2017 volumes are not available at time of publication; Q1 2017 Figures are February 2017 6) Lithuania Q4 2016 and Q1 2017 not available at time of publication
Source: Estonian Financial Supervision Authority, Association of Latvian Commercial Banks, Association of Lithuanian Banks, SEB Group
50

Contents
51
Macroeconomics and SEB in brief p.3
Strategy and Financial development p.7
Credit portfolio and Asset Quality p.19
Capital p.25
Balance sheet, Liquidity and Funding p.31
Summary p.39
Corporate Governance p.41
Business Divisions p.45
Swedish housing market p.51 Residential mortgage lending p.59
Cover pool and Covered bonds p.65
Additional Capital, Liquidity and Funding p.70
Contacts p.74

History Shift in government policy on subsidies for residential mortgage purposes and deregulation of the credit markets 27 years ago had a huge negative impact on residential construction
The lack of housing is most pronounced in the larger cities of Stockholm, Göteborg and Malmö to which there continues to be a strong migration
Maintained rent regulation, high land and construction costs incl. planning and environmental legislation, ability to appeal against planned housing constructions and poor competition in the building sector continue to reduce the incentive for the construction of rental apartment buildings
Currently Government takes measures to stimulate residential investments
Residential investments (housing construction) rose by nearly 20% during the last three years is expected to increase about 15% in 2017 contributing approx. 1% to yearly GDP growth
Increasing residential investments International comparison
Sources: Macrobond, Nordic Outlook February 2017
House prices (index 1995=100) International comparison
Swedish Housing Market – International comparison Increasing investments in Sweden not enough to remedy structural lack of housing and upward pressure on prices
% of GDP
0
50
100
150
200
250
300
350
400
450
-95 -96 -97 -98 -99 -00 -01 -02 -03 -04 -05 -06 -07 -08 -09 -10 -11 -12 -13 -14 -15 -16 -17
UK Denmark Germany Norway USA Sweden
0.0
1.0
2.0
3.0
4.0
5.0
6.0
7.0
8.0
9.0
-00 -01 -02 -03 -04 -05 -06 -07 -08 -09 -10 -11 -12 -13 -14 -15 -16 -17
Denmark UK Norway
Sweden USA Germany
52
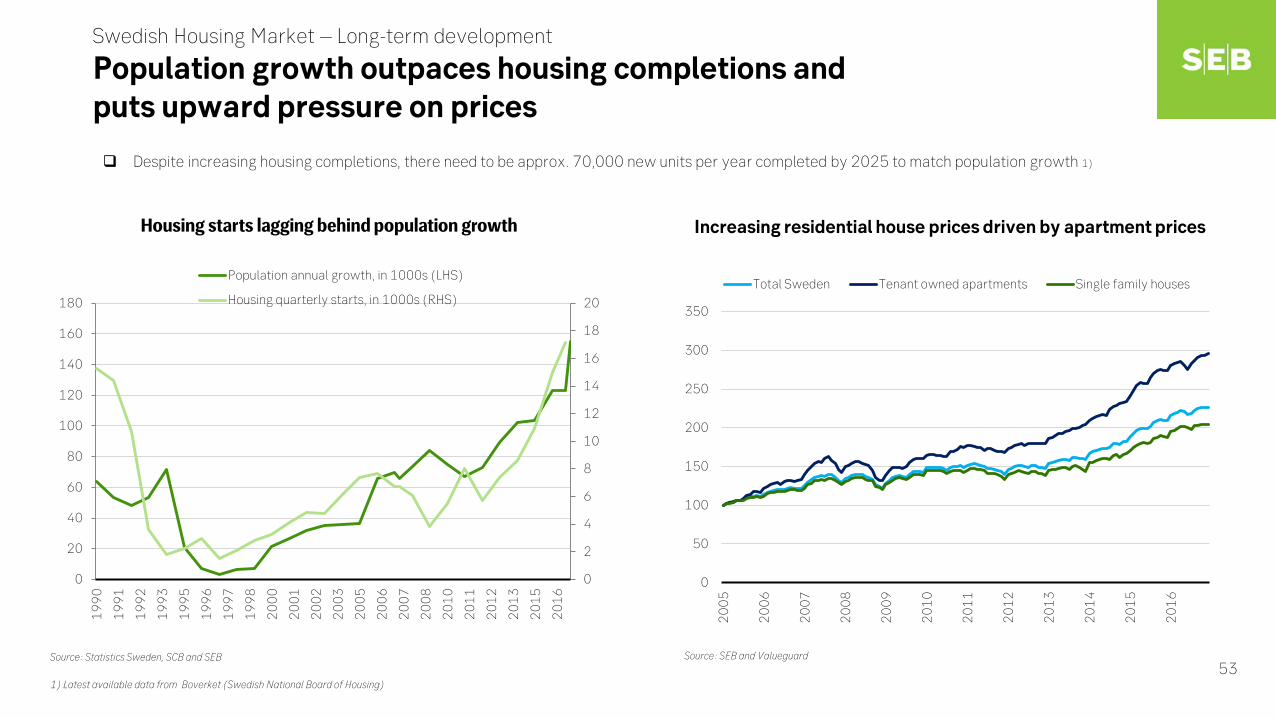
Despite increasing housing completions, there need to be approx. 70,000 new units per year completed by 2025 to match population growth 1)
0
50
100
150
200
250
300
350
20
05
20
06
20
07
20
08
20
09
20
10
20
11
20
12
20
13
20
14
20
15
20
16
Total Sweden Tenant owned apartments Single family houses
0
2
4
6
8
10
12
14
16
18
20
0
20
40
60
80
100
120
140
160
180
19
90
19
91
19
92
19
93
19
95
19
96
19
97
19
98
20
00
20
01
20
02
20
03
20
05
20
06
20
07
20
08
20
10
20
11
20
12
20
13
20
15
20
16
Population annual growth, in 1000s (LHS)
Housing quarterly starts, in 1000s (RHS)
1) Latest available data from Boverket (Swedish National Board of Housing)
Source: Statistics Sweden, SCB and SEB Source: SEB and Valueguard
Swedish Housing Market – Long-term development
Population growth outpaces housing completions and puts upward pressure on prices
Increasing residential house prices driven by apartment prices Housing starts lagging behind population growth
53

Sensitivity to rates has increased However Household debt and interest rate
expenditure, % of income
Household savings are rising and Household savings,% of income
Households’ Balance Sheet is strong Household assets and debt,% of income
-15
-10
-5
0
5
10
15
20
19
80
19
83
19
86
19
89
19
92
19
95
19
98
20
01
20
04
20
07
20
10
20
13
20
16
Total savings Own financial savings
0
2
4
6
8
10
12
90
110
130
150
170
190
Jan/90 Jan/03 Jan/16
Household debt (LHS)
Household interst payments (after tax) (RHS)
0
100
200
300
400
500
600
700
800
Jan/
00
Mar
/01
May
/02
Jul/0
3
Sep/
04
Nov
/05
Jan/
07
Mar
/08
May
/09
Jul/1
0
Sep/
11
Nov
/12
Jan/
14
Mar
/15
Real assets Financial assets
Debt Total assets
Source: Riksbank, SCB and SEB
Swedish Households
Strong affordability despite increasing indebtedness
Households’ aggregated debt to disposable income ratio is approximately 180% and has been rising faster than household income the last few years
Approx. 80% of the household debt is mortgage debt
The sharp increase of indebtedness that took place between 2003 - 2010 was to a large extent due to changing ownership structures and higher affordability
Households’ assets (real and financial assets) are 3.66x larger than their debt of which financial assets are 1.66x
Households have substantial resilience to higher interest rates, loss of income and declining house prices
Savings ratio at historical highs 54

Credit information agency (“UC”) Provides unique information regarding customers, e.g. marital and employment status, age, income, fixed assets, debt, payment record, property ownership
Practically impossible to escape claims A borrower is personally liable, for life, even after a default and foreclosure procedure
Strong household income A household’s income is to a very high degree based on two persons’ income. A mortgage loan is typically a joint liability
Direct debit Customers make payments via authorized direct debit from their account
Enforcement orders are processed in a expedient and reliable way State enforcement office
Banks and bank owned mortgage institutions originate the loans themselves and the loans remain on their balance sheet
No intermediaries
No buy-to-let market A regulated rental market and tenant owner subletting restrictions
Swedish Household Mortgage Market and Indebtedness
Institutional and Socio-economic factors underpin high Asset Quality and mitigate effects of Household Indebtedness
55

Upward pressures Severe structural lack of supply particularly in the major cities to which there is a strong migration despite the last few years’ increased residential investments Low interest rates Increase of households’ disposable income Household expenditure on housing as a percentage of total expenditure on consumption is at a record low level Home ownership approx. 66% by 2015. Up from 59% in 1995
Regulatory bodies’ actions to stem households’ indebtedness and increasing house prices Regulatory LTV cap of 85% (Fall 2010) New and extended regulatory requirements on banks
Swedish rules stricter than Basel III and EU requirements Mortgage risk-weight floor – 25% under Pillar 2 effective from Jan 1, 2015 Higher counter-cyclical buffers for Swedish exposures – an increase to 1.5% in June 2016 from 1% and to 2% in March 2017
Strict amortization requirements on LTVs above 50% was introduced on June 1, 2016
Topics publicly discussed to further lower the risk of the house price development
Hottest topics: A cap on household leverage (debt to income ratio) Gradual decrease of the ability of households to deduct interest rate costs for tax purposes favored by important bodies such as the SFSA, the Central Bank, Swedish Bankers
Association, and many independent economists (today: 30% up to about USD15k and 21% on the amount above USD15k can be deducted for tax purposes)
Gradual abolishment of the regulation of rents to stimulate the construction of rental apartment buildings
The Swedish household mortgage market
House price developments – some key features
56

Households’ aggregated debt to disposable income ratio (debt ratio) is around 180% 7)
This ratio increased from 100% to 170% between the late 1990s and 2010 when it slowed down considerably
The increase taking place before 2010 was partly due to changing residential ownership structure and higher affordability
Since early 2014 indebtedness has started to rise again and was by the end of 2016 around 180%
The most indebted people are the ones that can afford it 1), 2), 6)
Approx. 80% of household debt is mortgage loans and household debt is closely linked to house prices The most indebted people are the ones that:
Have the highest income and net wealth, Have the highest level of education and Live in the economically more prosperous and flourishing regions in Sweden
Weak relationship between debt-to-income ratio and loan-to-value (“LTV”) Households with an LTV>85% have a distinctively lower debt-to-income ratio than households with a LTV ratio between 50 and 85%
Mitigating factors of private indebtedness 3), 5)
Aggregated total wealth, excluding collective insurances, is more than 6 times higher than household disposable income Aggregated net wealth (total assets minus total debt) is almost 5 times higher than disposable income Financial assets are 3 times higher than disposable income Increased affordability:
Increased disposable income due to higher real salaries, Income tax cuts, Abolishment of wealth tax and a substantial lowering of real estate tax Low interest rates High savings ratio
The potential risks with Households’ indebtedness is offset by a low public sector debt and a capacity for countercyclical measures Socio-economic factors
1) A government report from November 2013 2) The Central Bank’s report ”How indebted are Swedish Housholds?” May 2014. The volume of loans in the data covers about 80% of all household loans and 94% of all mortgages 3) Swedish Central Bank’s Financial Stability Report of November 2014 4) Swedish Central Bank’s Financial Stability Report of November 2015
5) SFSA Stability in the financial system of December 2015 6) SFSA The Swedish Mortgage Market April 2016 7) Swedish Central Bank ’s Financial Stability Report of May 2016
The Swedish household mortgage market
Households’ indebtedness and affordability - key features
57

Households’ aggregated debt to disposable income ratio (debt ratio) is around 180% 7)
This ratio increased from 100% to 170% between the late 1990s and 2010 when it slowed down considerably
The increase taking place before 2010 was partly due to changing residential ownership structure and higher affordability
Since early 2014 indebtedness has started to rise again and was by the end of 2016 around 180%
The most indebted people are the ones that can afford it 1), 2), 6)
Approx. 80% of household debt is mortgage loans and household debt is closely linked to house prices The most indebted people are the ones that:
Have the highest income and net wealth, Have the highest level of education and Live in the economically more prosperous and flourishing regions in Sweden
Weak relationship between debt-to-income ratio and loan-to-value (“LTV”) Households with an LTV>85% have a distinctively lower debt-to-income ratio than households with a LTV ratio between 50 and 85%
Mitigating factors of private indebtedness 3), 5)
Aggregated total wealth, excluding collective insurances, is more than 6 times higher than household disposable income Aggregated net wealth (total assets minus total debt) is almost 5 times higher than disposable income Financial assets are 3 times higher than disposable income Increased affordability:
Increased disposable income due to higher real salaries, Income tax cuts, Abolishment of wealth tax and a substantial lowering of real estate tax Low interest rates High savings ratio
The potential risks with Households’ indebtedness is offset by a low public sector debt and a capacity for countercyclical measures Socio-economic factors
1) A government report from November 2013 2) The Central Bank’s report ”How indebted are Swedish Housholds?” May 2014. The volume of loans in the data covers about 80% of all household loans and 94% of all mortgages 3) Swedish Central Bank’s Financial Stability Report of November 2014 4) Swedish Central Bank’s Financial Stability Report of November 2015
5) SFSA Stability in the financial system of December 2015 6) SFSA The Swedish Mortgage Market April 2016 7) Swedish Central Bank ’s Financial Stability Report of May 2016
The Swedish household mortgage market
Households’ indebtedness and affordability - key features
58

Contents
59
Macroeconomics and SEB in brief p.3
Strategy and Financial development p.7
Credit portfolio and Asset Quality p.19
Capital p.25
Balance sheet, Liquidity and Funding p.31
Summary p.39
Corporate Governance p.41
Business Divisions p.45
Swedish housing market p.51
Residential mortgage lending p.59 Cover pool and Covered bonds p.65
Additional Capital, Liquidity and Funding p.70
Contacts p.74

Residential Apartment Buildings
Strong asset quality
1 bp (USD 1.3m) of impaired loans
No major problem loans since the 1990’s
No net credit losses
Low and conservative LTVs
Conservative lending policy
Cash-flow generation
Legal structure: Counterparty has to have direct and immediate access to the cash-flow and the assets taken in as collateral.
Tenor max 10 years
LTV <75% but depending on geographic location. Rural areas LTV<65%.
Amortization structure required depending on geographic location
Household Mortgage lending SEK 435bn (USD 49bn) Single family houses 63% Tenant owned apartments 33% Second homes 4%
Residential Apartment Buildings SEK 142bn (USD 16bn) Private companies 56% Housing co-op associations 37% State/Community owned 7%
Total SEK 578bn (USD 65bn)
SEB’s Swedish Residential Mortgage lending
Household mortgage lending dominates the portfolio March 31, 2017
75% 76%
24%
60
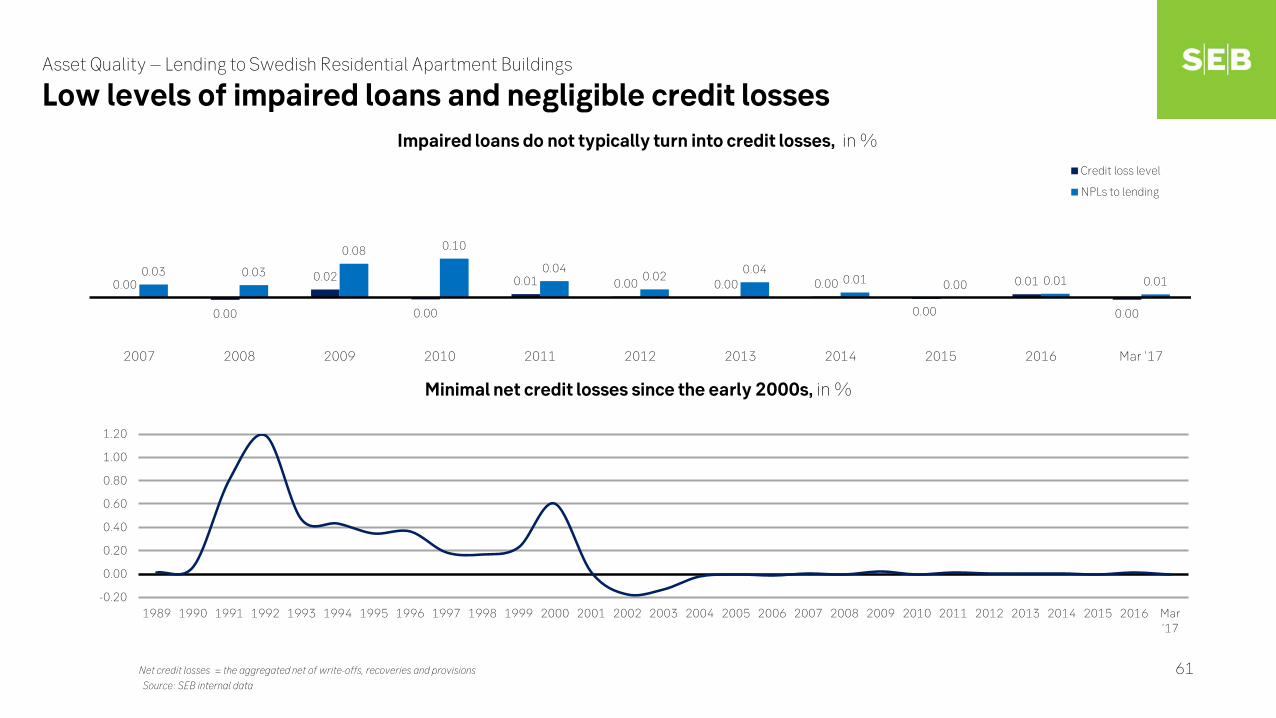
Minimal net credit losses since the early 2000s, in %
Impaired loans do not typically turn into credit losses, in %
Net credit losses = the aggregated net of write-offs, recoveries and provisions
Source: SEB internal data
Asset Quality – Lending to Swedish Residential Apartment Buildings
Low levels of impaired loans and negligible credit losses
-0.20
0.00
0.20
0.40
0.60
0.80
1.00
1.20
1989 1990 1991 1992 1993 1994 1995 1996 1997 1998 1999 2000 2001 2002 2003 2004 2005 2006 2007 2008 2009 2010 2011 2012 2013 2014 2015 2016 Mar'17
0.00
0.00
0.02
0.00
0.01 0.00 0.00 0.00
0.00
0.01
0.00
0.03 0.03
0.08 0.10
0.04 0.02
0.04 0.01 0.00 0.01 0.01
2007 2008 2009 2010 2011 2012 2013 2014 2015 2016 Mar '17
Credit loss level
NPLs to lending
61

Serve core clients
Concentration to larger cities
Market share approx.15%
Growing at 4% YoY, below market growth at 8% YoY
Past-due >60days at 5bps or SEK 236m (USD 26m)
Net credit loss level is 0%
Household affordability assessment and strict lending criteria
Low LTV values
Strict credit scoring and assessment
The affordability assessment, funds left to live on after all fixed costs and taxes are considered, includes among other things:
A stressed interest rate scenario of 7% on personal debt
A stressed interest rate scenario of 5.5% on a housing co-op’s debt which indirectly affects the private individual – “double leverage”
LTVs between 70% and 85% amortized at least 2% a year and <70 at least 1 % a year – a regulatory requirement
Max loan amount 5x total gross household income irrespective of LTV and no more than one payment remark on any kind of debt (information via national credit information agency (“UC”))
Strengthened advisory services
“Sell first and buy later”
0-50%
51-70% 9%
>85% 0%
Loan-to-value Share of portfolio
90%
1% 71-85%
229 272
322 358 383 404 418 431 435
Dec'09
Dec'10
Dec'11
Dec'12
Dec'13
Dec'14
Dec'15
Dec'16
Mar'17
SEB’s Swedish Household Mortgage lending
Successful Retail Strategy produced growth but relatively stricter underwriting standards render below market growth March 31, 2016
Weigthed average LTV = 51%
Selective origination Stabilizing lending volumes, SEKbn
62

Dual income households in the major cities High income households Personal savings above average Stronger credit rating vs. market average Amortizing share of new loans in SEB as at March 31, 2017
All new loans 87% LTV over 70% 99%
SEB’s typical mortgage customer Age distribution of SEB’s customers
SEB’s mortgage customers have a relatively stronger credit quality than market average
1) UC scoring is defined as the probability of getting a payment remark within one year
UC Scoring 1)
SEB’s Swedish Household Mortgage Lending
Strong economic profile of customers
0%
10%
20%
30%
40%
50%
60%
18-25 26-35 36-50 51-65 66-
Portfolio New loans
63
0
0.2
0.4
0.6
0.8
1
1.2
1.4
Dec '10 Apr '11 Aug '11 Dec '11 Apr '12 Aug '12 Dec '12 Apr '13 Aug '13 Dec '13 Apr '14 Aug '14 Dec '15 Apr '15 Aug '15 Dec '15 Apr '16 Aug '16 Dec '16
Market SEB
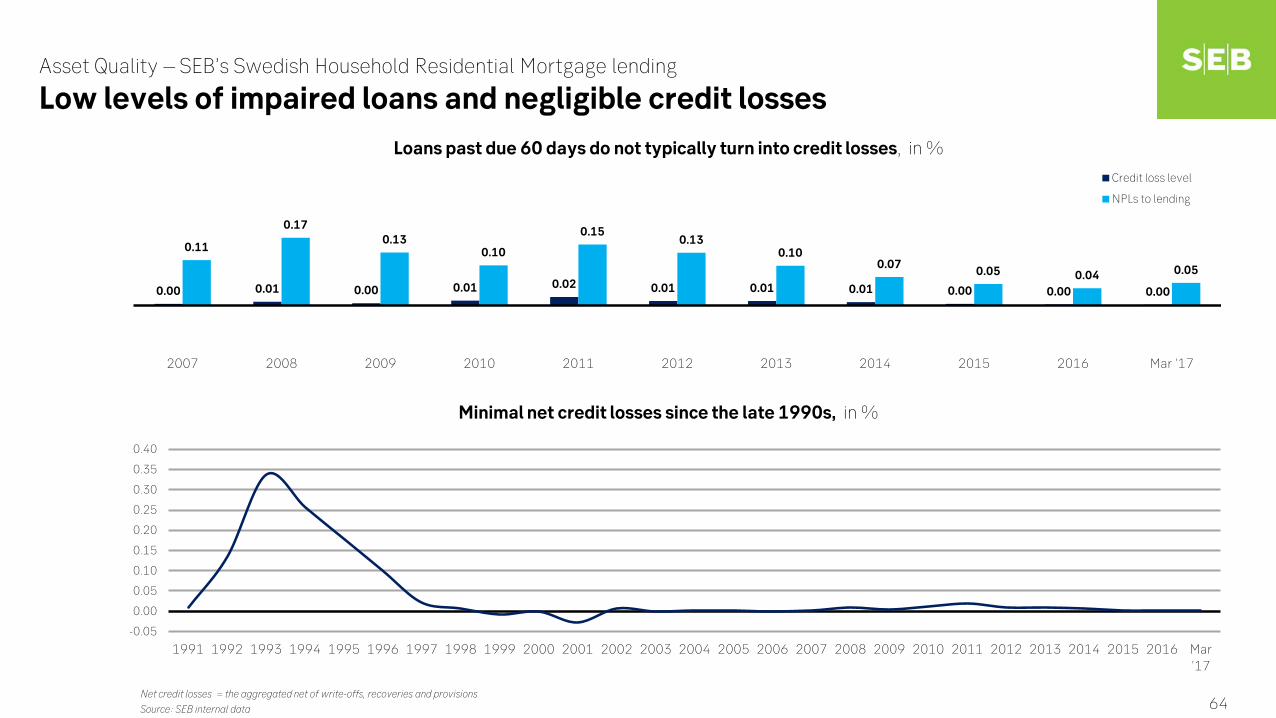
Minimal net credit losses since the late 1990s, in %
Loans past due 60 days do not typically turn into credit losses, in %
Asset Quality – SEB’s Swedish Household Residential Mortgage lending
Low levels of impaired loans and negligible credit losses
Net credit losses = the aggregated net of write-offs, recoveries and provisions
Source: SEB internal data
-0.05
0.00
0.05
0.10
0.15
0.20
0.25
0.30
0.35
0.40
1991 1992 1993 1994 1995 1996 1997 1998 1999 2000 2001 2002 2003 2004 2005 2006 2007 2008 2009 2010 2011 2012 2013 2014 2015 2016 Mar'17
0.00 0.01 0.00 0.01 0.02 0.01 0.01 0.01 0.00 0.00 0.00
0.11
0.17 0.13
0.10
0.15 0.13
0.10 0.07 0.05 0.04 0.05
2007 2008 2009 2010 2011 2012 2013 2014 2015 2016 Mar '17
Credit loss level
NPLs to lending
64

Contents
65
Macroeconomics and SEB in brief p.3
Strategy and Financial development p.7
Credit portfolio and Asset Quality p.19
Capital p.25
Balance sheet, Liquidity and Funding p.31
Summary p.39
Corporate Governance p.41
Business Divisions p.45
Swedish housing market p.51
Residential mortgage lending p.59
Cover pool and Covered bonds p.65 Additional Capital, Liquidity and Funding p.70
Contacts p.74

Highlights
Only Swedish Residential Mortgages in the Cover Pool, which historically have had very low credit losses
SEB’s Cover Pool is more concentrated towards Single family and Tenant owned apartments, which generally have somewhat higher LTVs
The Cover Pool is on the parent bank’s balance sheet contrary to SEB’s major Swedish peers
All eligible Swedish residential mortgages are directly booked in the Cover Pool on origination , i.e. no cherry picking of mortgages from balance sheet to Cover Pool
Covered Bonds are issued out of the parent bank and investors have full and dual recourse to the parent bank’s assets as well as secured exposure to the Cover Pool
SEB runs a high OC – currently at 58%
Covered Bonds
Cover Pool
Q1 2017 Q4 2016 Q4 2015 Q4 2014 Total outstanding covered bonds (SEK bn) 325 314 311 310 Rating of the covered bond programme Aaa Moody's Aaa Moody's Aaa Moody's Aaa Moody's FX distribution SEK 72% 71% 72% 76%
non-SEK 28% 29% 28% 24%
Q1 2017 Q4 2016 Q4 2015 Q4 2014
Total residential mortgage assets (SEK bn) 514 510 483 465
Weighted average LTV (property level) 50% 50% 57% 57%
Number of loans (thousand) 713 711 697 683
Number of borrowers (thousand) 424 424 427 427
Weighted average loan balance (SEK thousand) 721 718 693 680
Substitute assets (SEK thousand) 0 0 0 0
Loans past due 60 days (basis points) 4 4 4 6
Net credit losses (basis points) 1 0 0 0
Over-Collateralization level 58% 63% 55% 50%
Cover Pool and Covered Bonds March 31, 2017
Only Swedish Residential Mortgages in SEB’s Cover Pool
66

Floating (3m) 73%
Fixed reset <2y 14%
Fixed rate reset 2y<5y 11%
Fixed rate reset =>5y 1%
Single family 59%
Tenant owned apartments
27%
Residential apt bldgs 15%
NOTE: Distribution in different LTV buckets based on exact order of priority for the individual mortgage deeds
according to the Association of Swedish Covered Bond Issuers (www.asbc.se)
Type of loans Interest rate type Geographical distribution
LTV distribution by volume in % of the Cover Pool Prior ranking loans Interest payment frequency
Cover Pool in March 31, 2017
SEBs mortgage lending is predominantly in the three largest and fastest growing cities with an interest rate reset date within two years
Stockholm region 42%
Gothenburg region 16%
Malmoe region
8%
Larger regional cities 34%
84%
16%
Monthly
Quarterly
93%
6%
1%
No priorranks
<25% ofproperty
value>25<75% of
propertyvalue
24% 21%
18% 15%
11% 7%
3% 1%
0-10%10-20%20-30%30-40%40-50%50-60%60-70%70-75%
67

72%
28%
0%
10%
20%
30%
40%
50%
60%
70%
80%
90%
Q1 '0
9
Q3 '0
9
Q1 '1
0
Q3 '1
0
Q1 '1
1
Q3 '1
1
Q1 '1
2
Q3 '1
2
Q1 '1
3
Q3 '1
3
Q1 '1
4
Q3 '1
4
Q1 '1
5
Q3 '1
5
Q1 '1
6
Q3 '1
6
Q1 '1
7
Covered Bond SEK Covered Bond Non-SEK
SEB Swedish Mortgage Covered Bonds Outstanding covered bonds (SEK bn)
Currency mix
Maturity profile (SEK bn)
Moody’s Rating Aaa
Total outstanding SEK 325bn
FX distribution SEK 72%
non-SEK 28%
Benchmark Benchmark 93 %
Non Benchmark 7 % 0
50
100
150
200
250
300
350
Q1 '1
2
Q2 '1
2
Q3 '1
2
Q4 '1
2
Q1 '1
3
Q2 '1
3
Q3 '1
3
Q4 '1
3
Q1 '1
4
Q2 '1
4
Q3 '1
4
Q4 '1
4
Q1 '1
5
Q2 '1
5
Q3 '1
5
Q4 '1
5
Q1 '1
6
Q2 '1
6
Q3 '1
6
Q4 '1
6
Q1 '1
7
0
10
20
30
40
50
60
70
80
2017
2018
2019
2020
2021
2022
2023
2024
2026
2031
2032
2039
2041
Non-Benchmark
Non-SEK Benchmark
SEK Benchmark
Covered Bonds March 31, 2017
Profile of outstanding Covered Bonds
68

OC sensitivity to house prices
Stress test done on property level
Covered Bonds March 31, 2017
Sufficient OC level to absorb significant decline in house prices
The market value on underlying property were updated in December2016.
69
0%
10%
20%
30%
40%
50%
60%
70%
0% -5% -10% -15% -20% -25% -30% -35% -40% -45% -50%

Contents
Macroeconomics and SEB in brief p.3
Strategy and Financial development p.7
Credit portfolio and Asset Quality p.19
Capital p.25
Balance sheet, Liquidity and Funding p.31
Summary p.39
Corporate Governance p.41
Business Divisions p.45
Swedish housing market p.51
Residential mortgage lending p.59
Cover pool and Covered bonds p.65
Additional Capital, Liquidity and Funding p.70 Contacts p.74
70

Capital
Ownership and dividends
Dividend policy: 40% or above of net profit (Earnings per share)
SEK m
SEB’s main shareholders Dividends paid
0
5,000
10,000
15,000
20,000
25,000
2011 2012 2013 2014 2015 2016
Total dividend Net profit
DPS, SEK 1.75 2.75 4.00 4.75 5.25 5.50 Pay-out ratio 35% 52% 59% 54% 66% 1) 75% 1)
Share of capital, 31 Mar 2017 per cent
Investor AB 20.8
Alecta 6.8
Trygg Foundation 6.0
Swedbank/Robur Funds 4.2
AMF Insurance & Funds 3.5
Blackrock 1.8
SEB Funds 1.7Nordea Funds 1.2
Fjärde AP-fonden 1.1Vanguard 1.1
Totalshare of foreign owners 24.2Source: Euroclear Sweden/Modular Finance
71 1) Excluding items affecting comparability

Household lending - deposits and covered bond funding Corporate & public lending - deposits and senior bonds
Household lending growth funded by deposit increases and issued covered bonds
Corporate lending growth funded by deposit increases and issued senior unsecured bonds
Balance Sheet
Strategic lending growth funded through deposits and long-term debt SEB Group, March 31, 2017
SEK bn
SEK bn
-100
0
100
200
300
400
500
600
700
800
Mar
-08
Sep-
08
Mar
-09
Sep-
09
Mar
-10
Sep-
10
Mar
-11
Sep-
11
Mar
-12
Sep-
12
Mar
-13
Sep-
13
Mar
-14
Sep-
14
Mar
-15
Sep-
15
Mar
-16
Sep-
16
Mar
-17
Lending Deposits
Covered Bonds Net = lending - deposits - outstanding cov bonds
Overcollateralisation in Swedish cover pool
-100
0
100
200
300
400
500
600
700
800
900
Mar
-08
Sep
-08
Mar
-09
Sep
-09
Mar
-10
Sep
-10
Mar
-11
Sep
-11
Mar
-12
Sep
-12
Mar
-13
Sep
-13
Mar
-14
Sep
-14
Mar
-15
Sep
-15
Mar
-16
Sep
-16
Mar
-17
Lending Deposit Senior Debt Net = Lending - deposits - senior debt
72

Outstanding wholesale funding in SEKbn
0% 1% 3%
16%
1%
30%
0% 10%
12%
2%
8%
5%
4%
6% 2% 2%
CPs Swedish CPs French
CPs European CPs US
Yankee CDs Sterling CDs
Domestic Covered bond program Domestic MTN program
Global MTN program Covered Global MTN program Senior
144A Mortgage covered bonds 144A Senior unsecured
3(a)(2) Senior unsecured Retail index linked bonds
Subordinated debt SEB AG Covered bonds
SEB AG Senior unsecured
Wholesale funding distribution
SEBs wholesale funding sources
Diversified funding mix
Short-term funding sources Q2 2016 Q3 2016 Q4 2016 Q1 2017
Commercial paper (CP) programs Total
70 63 31 31 Swedish 1 1 0 0 French 1 2 1 1 Global:
European 27 20 11 10 US
40 40 19 21 Commercial deposit (CD) programs Total
92 102 96 133 Yankee CDs 78 95 90 128 Sterling CDs 14 8 6 5
Long-term funding sources Q2 2016 Q3 2016 Q4 2016 Q1 2017
SEB AB Total 508 550 566 594
Domestic Covered bond program 211 219 222 234 Domestic MTN program 4 3 3 1 Global MTN programs: 0 0 0
Covered 76 79 78 78 Senior 81 88 88 93
144A Mortgage covered bonds 13 13 14 13 144A Senior unsecured 51 58 63 62 3(a)(2) Senior unsecured 11 28 29 40 Retail index linked bonds 30 32 30 28 Subordinated debt 31 31 40 45 SEB AG Total 31 31 29 29
Mortgage covered bonds 18 18 17 17 Senior unsecured 13 13 13 12
73

Contents
Macroeconomics and SEB in brief p.3
Strategy and Financial development p.7
Credit portfolio and Asset Quality p.19
Capital p.25
Balance sheet, Liquidity and Funding p.31
Summary p.39
Corporate Governance p.41
Business Divisions p.45
Swedish housing market p.51
Residential mortgage lending p.59
Cover pool and Covered bonds p.65
Additional Capital, Liquidity and Funding p.70
Contacts p.74 74

Contacts Thomas Bengtson, Head of Debt Investor Relations Email: [email protected] phone: +46 8 763 8150 Julia Ehrhardt, Investor Relations Email: [email protected] phone: +46 8 763 85 60 John Arne Wang, Head of Treasury Management Email: [email protected] phone: +46 8 506 23255
SEB Contacts and information
More information
Available on www.sebgroup.com
You will find it under Investor Relations 75


