Deep Deep Deep Deep DecarbonisationDecarbonisationDecarbonisationDecarbonisation for Indian Industries: for Indian Industries: for Indian Industries: for Indian Industries:
reflections on strategy, policy and international reflections on strategy, policy and international reflections on strategy, policy and international reflections on strategy, policy and international
cooperationcooperationcooperationcooperation
Joyashree Roy
Bangabandhu Chair Professor, Asian Institute of Technology, Thailand
@iets, Vienna, Austria
October 11,2019

Transformational changes in process
technology
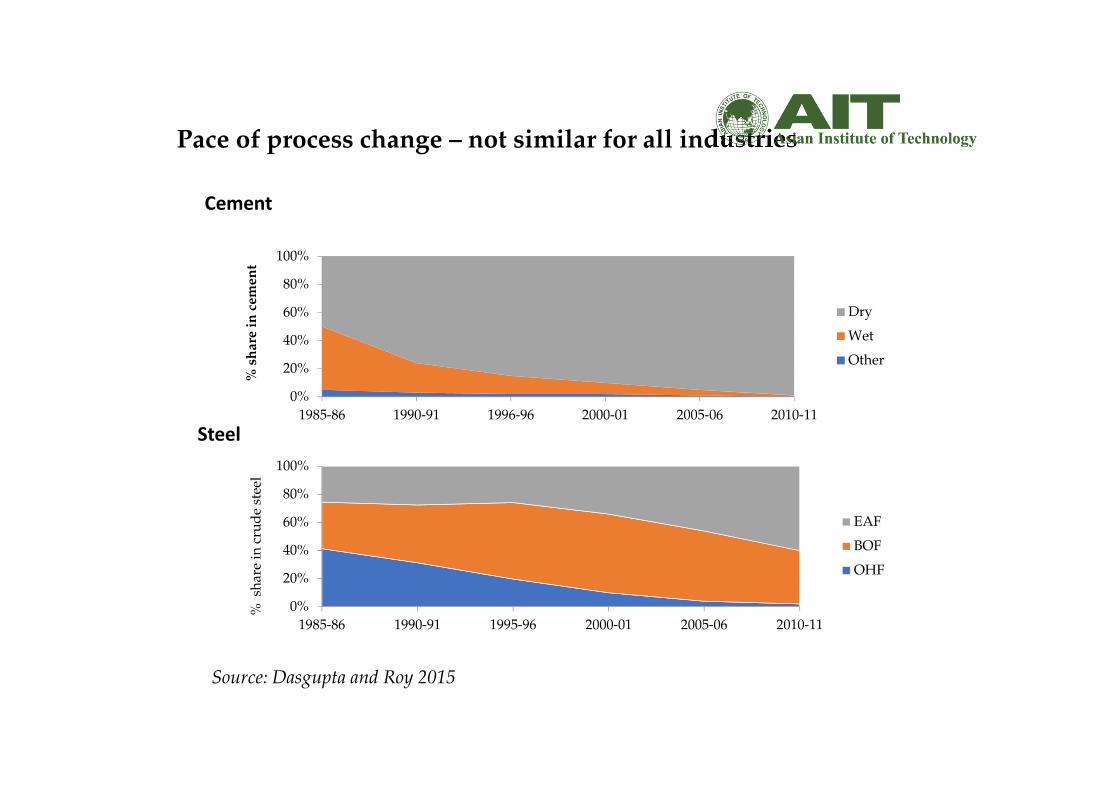
Pace of process change – not similar for all industries
Cement
Steel
Source: Dasgupta and Roy 2015
0%
20%
40%
60%
80%
100%
1985-86 1990-91 1995-96 2000-01 2005-06 2010-11
% s
har
e in
cru
de
stee
l
EAF
BOF
OHF
0%
20%
40%
60%
80%
100%
1985-86 1990-91 1996-96 2000-01 2005-06 2010-11
% s
hare
in
ce
men
t
Dry
Wet
Other
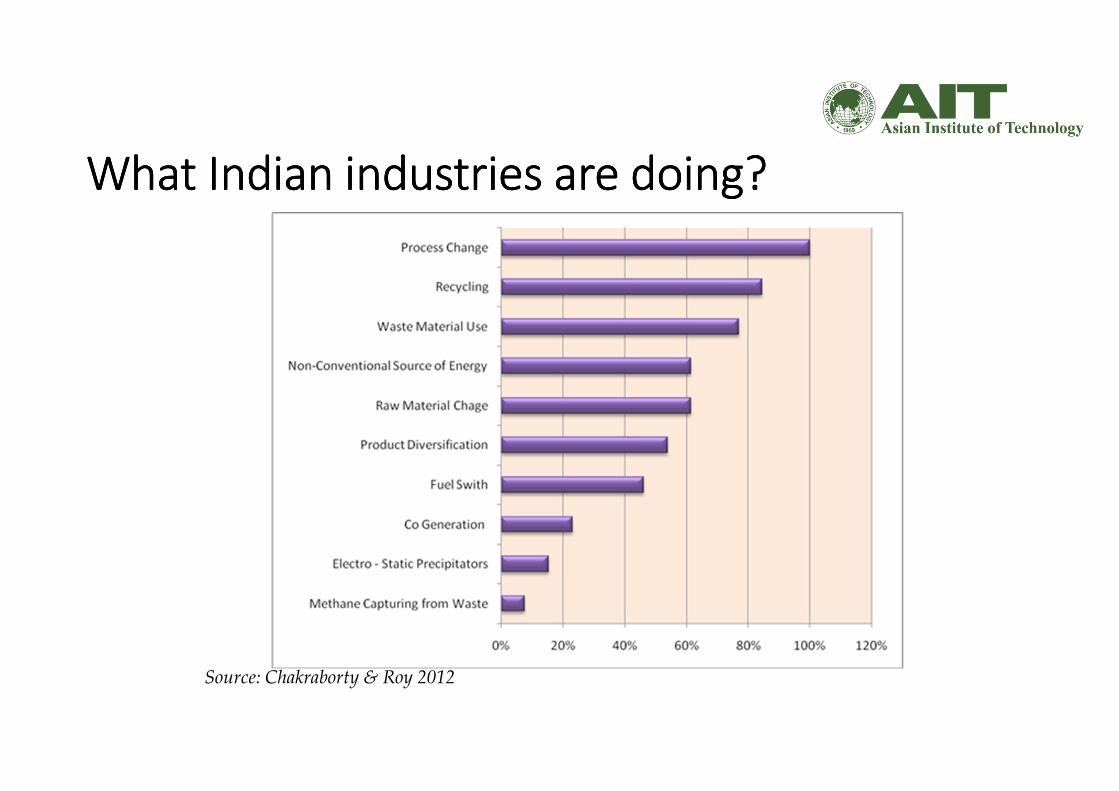
What Indian industries are doing?What Indian industries are doing?What Indian industries are doing?What Indian industries are doing?
Source: Chakraborty & Roy 2012

Energy Efficiency
Based on Annual Survey of Industries, India 1973-74 – 2010-11Dasgupta and Roy (2017)
Decomposition of energy demand -Indian manufacturing industries
Energy Efficiency

Catching up with BAT

Energy efficiency performance of Indian industries vis-à-vis world
0
30
60
90
120
19
85
19
87
19
89
19
91
19
93
19
95
19
97
19
99
20
01
20
03
20
05
20
07
20
09
20
11
20
13
GJ/
ton
Aluminium
0
30
60
90
120
150
19
91
19
93
19
95
19
97
19
99
20
01
20
03
20
05
20
07
20
09
20
11
20
13
kW
h/
ton
Cement
0
20
40
60
19
85
19
87
19
89
19
91
19
93
19
95
19
97
19
99
20
01
20
03
20
05
20
07
20
09
20
11
20
13
GJ/
ton
Iron and Steel
0
20
40
60
GJ/
ton
Paper
Source: Dasgupta and Roy 2015

Primary energy emission decomposition-All India
-800
-600
-400
-200
0
200
400
600
800
1000
Ch
an
ge
in
em
issi
on
(mil
lio
n t
on
ne
CO
2)
Change in
total emission
Activity
growth
Energy
intensity
Structural
change
Fuel mix
Das 2019. Unpublished Ph D Thesis
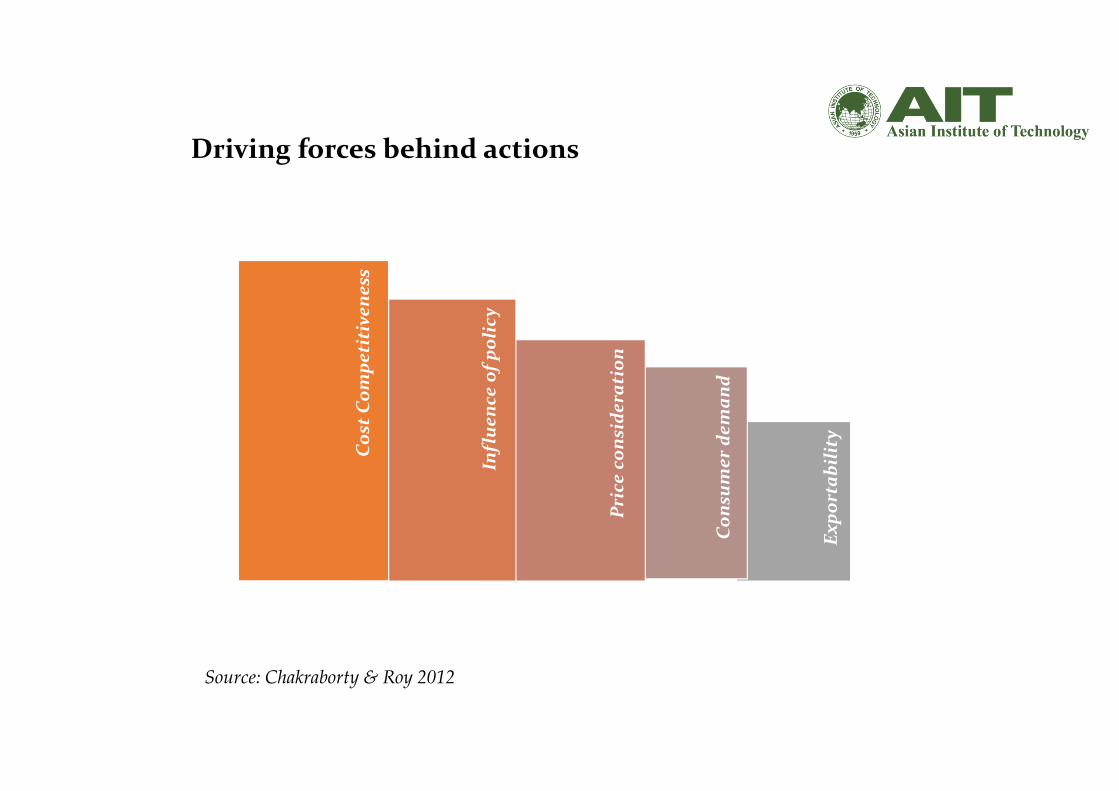
Driving forces behind actions
Ex
po
rta
bil
ity
Co
nsu
me
r d
em
an
d
Pri
ce c
on
sid
era
tio
n
Infl
ue
nce
of
po
lic
y
Co
st C
om
pe
titi
ve
ne
ss
Source: Chakraborty & Roy 2012

Costs associated with the energy efficiency measures (USD2010/tCO2)
• achieving near‐zero emission intensity levels in the industry sector would require additional realization of long‐term step‐change options and these options are associated with higher cost

Energy Conservation Awards (since 1991)
Electrical energy saving in terms of equivalent avoided Capacity in MW
Participation (voluntary) increased from 123 units in 1999 to 773 in 2012
Investment energy conservation in 2012 = INR. 1948 Crores
Monetary saving achieved in 2013 = INR. 2886 Crores in 2013
A payback period of 8 months
Bureau of Energy Efficiency, Government of India, 2014

Results from GCAM
Reference scenario
Global Carbon price
scenario
Advanced EE
technology scenario
Global carbon price
with advanced EE
technology scenario
Source: Dasgupta, Roy et.al (2017)
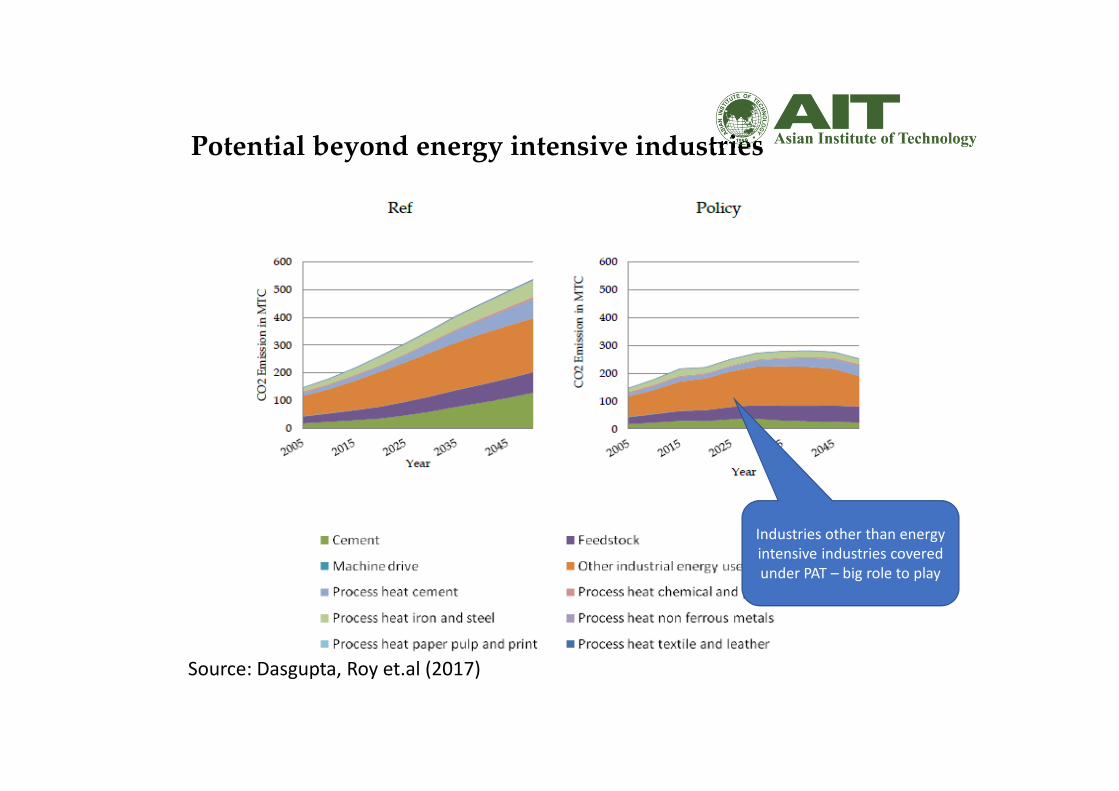
Potential beyond energy intensive industries
Industries other than energy
intensive industries covered
under PAT – big role to play
Source: Dasgupta, Roy et.al (2017)
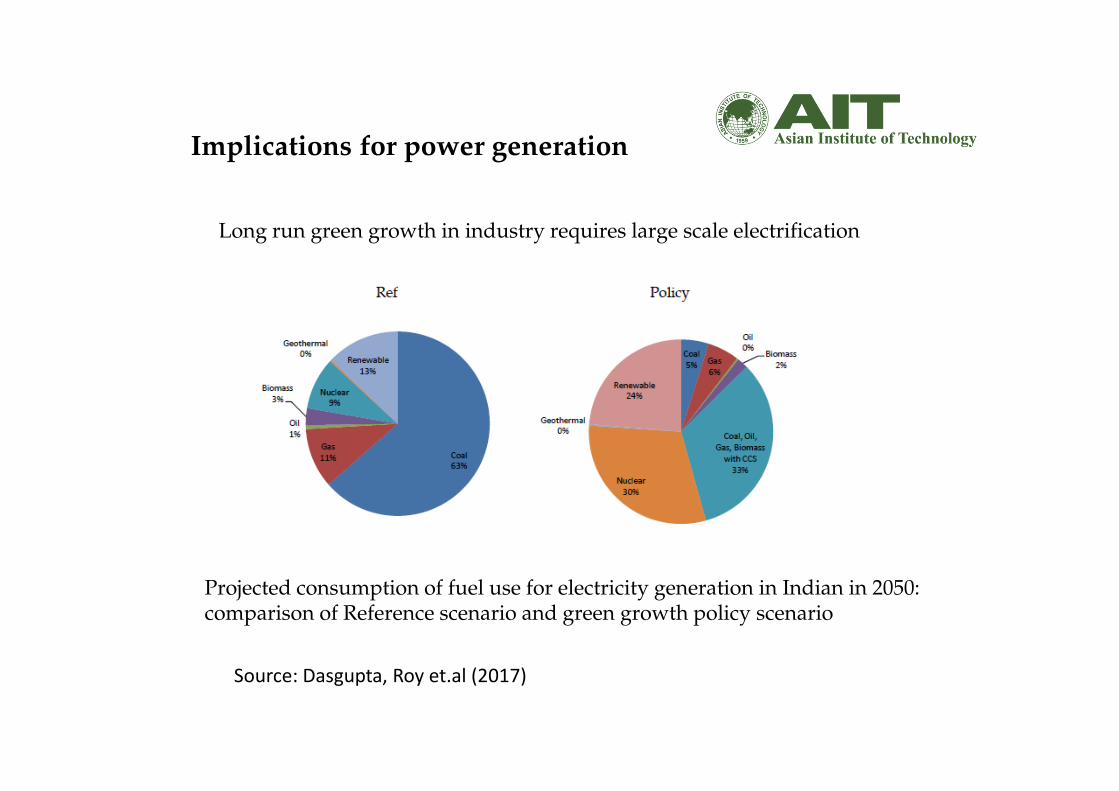
Implications for power generation
Projected consumption of fuel use for electricity generation in Indian in 2050: comparison of Reference scenario and green growth policy scenario
Long run green growth in industry requires large scale electrification
Source: Dasgupta, Roy et.al (2017)
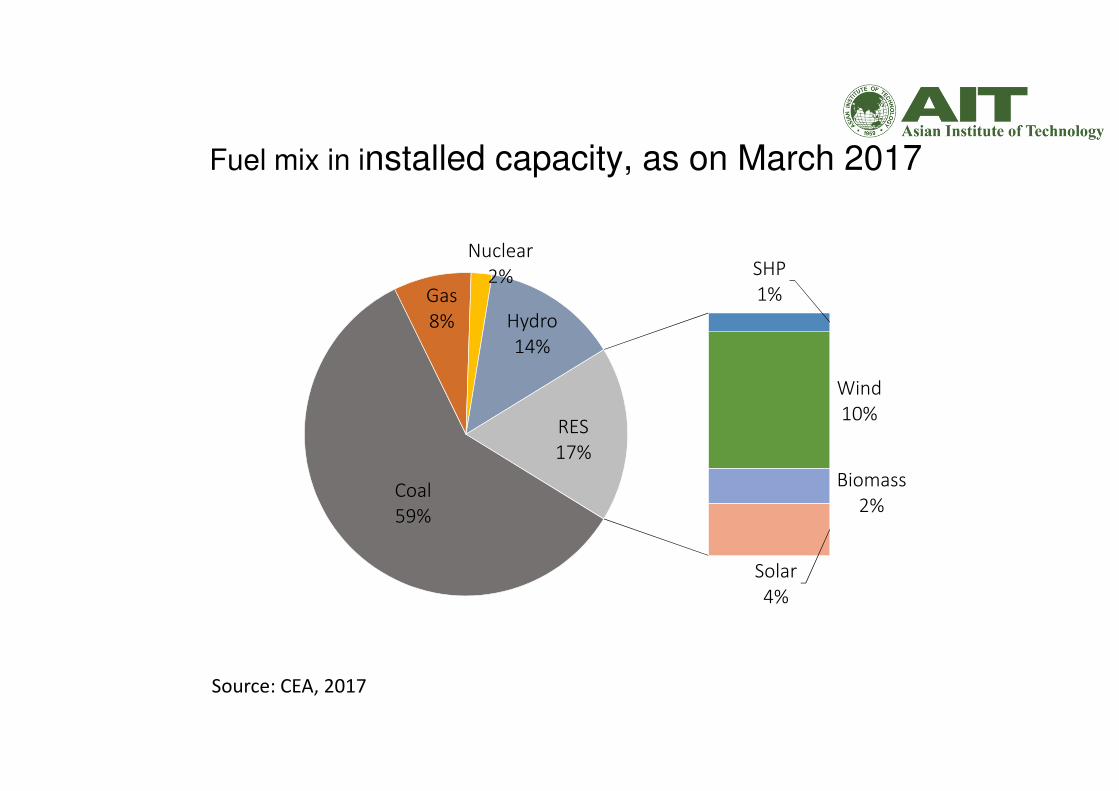
Fuel mix in installed capacity, as on March 2017
Source: CEA, 2017
Coal
59%
Gas
8%
Nuclear
2%
Hydro
14%
SHP
1%
Wind
10%
Biomass
2%
Solar
4%
RES
17%
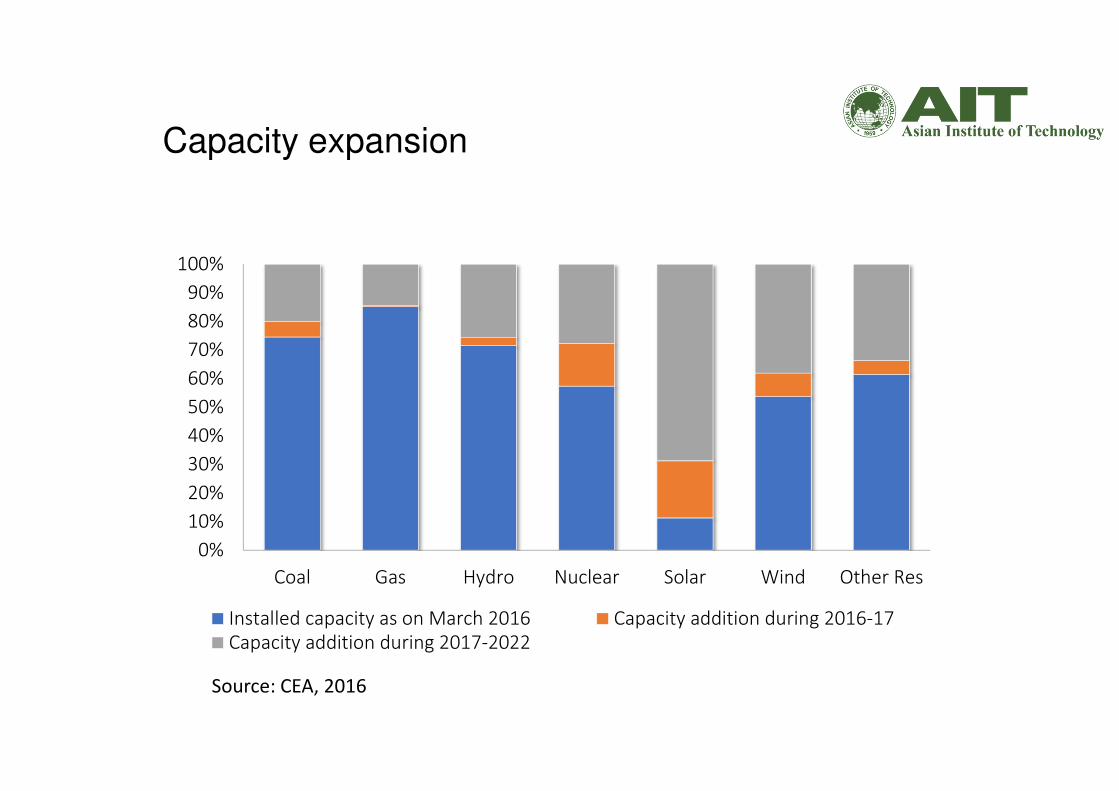
Capacity expansion
Source: CEA, 2016
0%
10%
20%
30%
40%
50%
60%
70%
80%
90%
100%
Coal Gas Hydro Nuclear Solar Wind Other Res
Installed capacity as on March 2016 Capacity addition during 2016-17
Capacity addition during 2017-2022
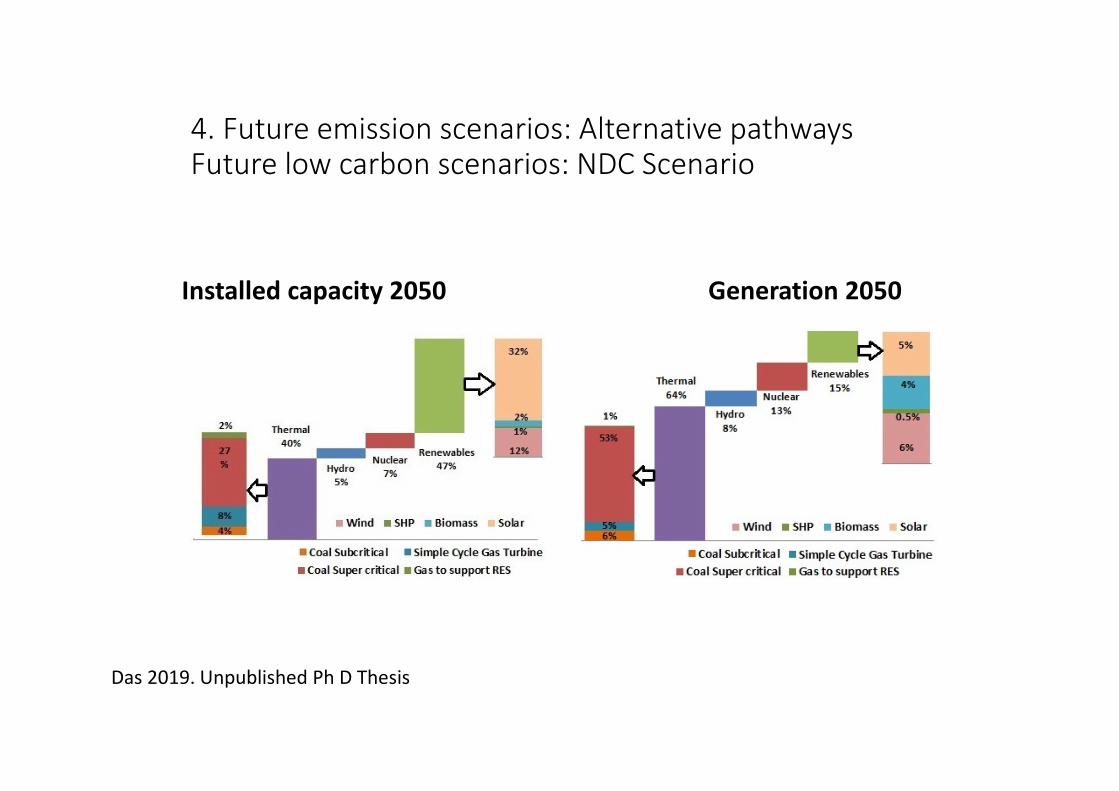
4. Future emission scenarios: Alternative pathways
Future low carbon scenarios: NDC Scenario
Installed capacity 2050 Generation 2050
Das 2019. Unpublished Ph D Thesis

Uptake of systemic policies and contribution of
renewable energy in selected Indian states
Policies to support Renewable EnergyMaharashtra
Gujarat Karnataka Rajasthan
Rebate on Municipal Taxes for promoting
renewable energy
√
Renewable Energy Re-purchase Obligation √ √ √ √
Facilitating land acquisition for projects
leading to
generation of renewable energy
√ √ √ √
Special Tariff for Renewable Energy, Feed-in
Tariff, Feed in Premium
√ √
Single Window System for Projects for
Renewable Energy Generation
√ √
Share of renewable in total power generation
(in %)
15.54 10.85 22.25 10.19

India: drivers of success and failure storiesIndia: drivers of success and failure storiesIndia: drivers of success and failure storiesIndia: drivers of success and failure stories
• National Biodiesel Mission of 2003
• New technology with Missing new routines and new regulators• Mobility sector: Intermediate transport
• National Mission of Biodiesel
• Enhanced Energy Efficiency National Mission 2008
• Pre conceived new technology with new routines and new regulators
• Policy, price, global partnership, trained manpower
• PAT: new market system, institutional innovationSource Roy et. al . 2017
How to operationalize
• “Technology is at least as important in reducing emissions as demographicchange and economic development” – IPCC (2014)
• Three major dimensions: capacity building; enabling environments; and mechanisms for technology transfer
• In its Intended Nationally Decided Contributions (INDCs) submitted toUNFCC India has committed to cut emission intensity of GDP by 30-35percent by 2030 from 2005 level.
• Thrust is on mobilizing finance, technology transfer and capacity building to achieve this target
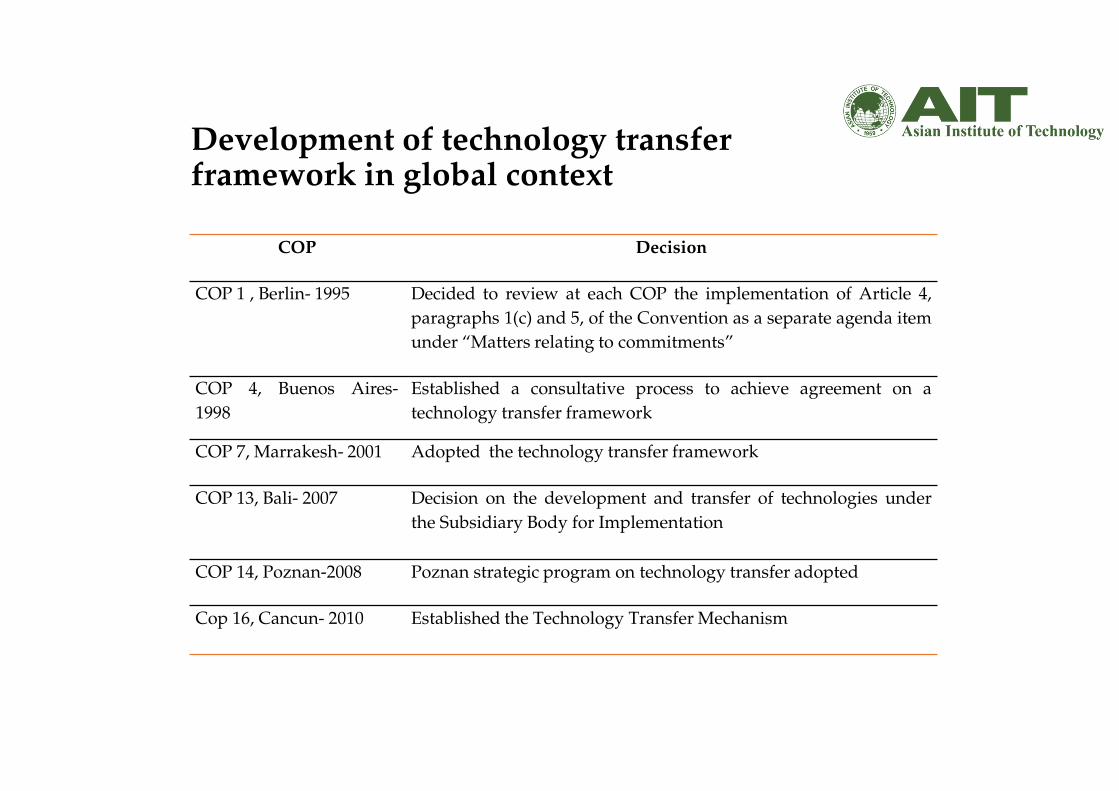
Development of technology transfer framework in global context
COP Decision
COP 1 , Berlin- 1995 Decided to review at each COP the implementation of Article 4,
paragraphs 1(c) and 5, of the Convention as a separate agenda item
under “Matters relating to commitments”
COP 4, Buenos Aires-
1998
Established a consultative process to achieve agreement on a
technology transfer framework
COP 7, Marrakesh- 2001 Adopted the technology transfer framework
COP 13, Bali- 2007 Decision on the development and transfer of technologies under
the Subsidiary Body for Implementation
COP 14, Poznan-2008 Poznan strategic program on technology transfer adopted
Cop 16, Cancun- 2010 Established the Technology Transfer Mechanism

Thank you
Acknowledgement
Global Change Programme Research Team
Jadavpur University, India
http://juglobalchangeprogram.org/


