
8/8/2019 Deep Structures and Tectonics of Burmese Arc 1988
http://slidepdf.com/reader/full/deep-structures-and-tectonics-of-burmese-arc-1988 1/24
Tectonophysics, 149 (1988) 299-322
Elsevier Science Publishers B.V., Amsterdam - Printed in The Netherlands
299
Deep structure and tectonics of the Burmese arc:
constraints from earthquake and gravity data
MANOJ ~UKHOPADHYAY ’ and SUJIT DASGUPTA ’
’ Department of Geophysics, Indian School of Mines, Dhanbad-826004 (India)
’ Publication Division, Geological Survey of India, 29, J. L Nehru Road Calcutta-16 (India)
(Received January 1.1987; revised version accepted October 27,1987)
Abstract
Mukhopadhyay, M. and Das8upta, S., 1988. Deep structure and tectonics of the Burmese arc: constraints from
earthquake and gravity data. Tectonophysics, 149: 299-322.
Active subduction of the Indian plate is currently occurring beneath the Burmese arc along an east dipping Benioff
zone which extends to a depth of about 180 km. The overriding Burma plate has an appearance of an inland se ismic
slab that is deflected downwards in the vicinity of the Benioff zone. A crustal seismic zone some 60-80 km east of the
Benioff zone correlates to backarc activity. A triangular aseismic wedge in the top part of the crust outlines the Central
Belt molasse basin east of the Burmese foldbelt. Fault plane solutions show that the Burmese Benioff zone is
characterized by shallow angle thrusting at its upper edge whereas down-tip tensional events dominate its tower edge.
Most of the backam seismicity is accounted for by the Sagaing transform or by the activity of the Shan scarp normal
fault zone at the margin of the Asian plate. A gravity anomaly pair with amplitude of 175 mGal coincides with the1100~km long Burmese arc lying in a north-south direction. The gravity anomalies along a profile in central Burma and
in adjacent areas of the Bengal basin are interpreted in terms of plate subduction as well as near-surface mass
anomalies. This suggests that sediments below the Central Belt may have an average thickness of the order of 10 km
but may be as thick as 15 km at the subduction zone. The oceanic crust underl~g deeper parts of the Bengal basin
experiences phase transition at about 30 km depth in a Benioff zone environment east of the Burmese foldbelt. Several
thrust planes are present within the folded and deformed Cretaceous-Tertiary sediments of the fold belt; these are
often associated with ophiolites and basic to ultrabasic rocks. A low density zone, at least 60 km wide, underlies the
andesitic volcanic axis in the overriding plate.
Mroduction 1946; Gulatee, 1956). With the advent of plate
A variety of natural resources was perhaps one
reason which attracted the early explorers and
field geologists to Burma during the last century;
this eventually led to the publication of two com-
prehensive accounts of the geology and mineral
wealth of Burma, compiled by Chhibber (1934a,
b) more than fifty years ago. The general pattern
of the gravity field for Burma and its adjoining
Indian territories came to be known quite early
through the work of the Burmah Oil Companyand the Survey of India (Evans and Crompton,
tectonics Burma was again studied with renewed
interest with an emphasis on explaining the
tectonic development of the Burmese arc as a
whole together with its neotectonics (see, among
others, Bnmnschweiler, 1966, 1974; Mitchell and
McKerrow, 1975; Curray et al., 1979). More re-
cently correlative study of surface geology with
aerial photographs and Landsat imagery (Nandy,
1980; Le Dain et al., 1984) has signif icantly in-
creased our knowledge on the tectonic framework
of Burma. It is now commonly accepted, as wasinitially suggested by Chhibber (1934a), that the
0040-1951,‘88,‘SO3.50 0 1988 Elsevier science Publishers B.V.

8/8/2019 Deep Structures and Tectonics of Burmese Arc 1988
http://slidepdf.com/reader/full/deep-structures-and-tectonics-of-burmese-arc-1988 2/24
300
Burmese and Andaman arcs together provide an
important transitional link between the Himalayan
collision zone and the Indonesian arc; the latter is
in direct tectonic continuation of the Western
Pacific arc systems.
Several contrasting views have been put for-
ward concerning the tectonic development and
current stress regime of the Burmese arc. For
instance, Mitchell and McKerrow (1975) ascribed
the evolution of the arc to a process of eastward
subduction of the Indian plate at the Asian con-
tinental margin continuing from at least the Late
Cretaceous to the present affecting the Benioff
zone lying to the west of the Burmese foldbelt (the
Arakan-Yoma mountains). Curray et al. (1979)
have proposed a lenticular plate, the Burma plate,forming a structural province in the area between
the Arakan-Yomas on the west and the Indochina
highlands on the east. This plate has been created
since Middle Miocene time as a result of opening
of the Andaman Sea by at least 460 km (Curray et
al., 1982). Le Dain et al. (1984) suggest that sub-
duction of the Indian plate below the Burmese arc
has stopped recently or occurs aseismically and
the hanging lithospheric slab is being dragged
north by India through the surrounding litho-sphere. We have suggested elsewhere (Mukho-
padhyay, 1984) that the Indian plate actively sub-
ducts below the Burmese arc as shown by an
east-dipping Benioff zone that extends to about
180 km depth below the central lowlands east of
the Arakan-Yomas. However, recently Tapponnier
et al. (1982) propose that active spreading in the
Andaman Sea and lateral motion along the Saga-
ing transform in Burma is a consequence of prop-
agating extrusion tectonics in response to rigid
indentation by India into Asia at the northeast
corner of the Himalaya.
In the present article we consider earthquake
data for the Burmese arc in order to study details
of the subduction zone geometry over various
segments of the 1100 km long arc. Stress distribu-
tion and the pattern of faulting within the Burmese
Benioff zone are studied using a large number of
selected earthquakes. Using the Benioff zone con-
figuration, we next interpret a representative grav-
ity profile across central Burma and its forearcregion covering the Bengal basin to infer the deep
structure of the Burmese arc. For gravity interpre-
tation, we use geologic information and available
seismic data as important constraints. The results
obtained from the analysis of earthquake and
gravity data are then discussed from the viewpoint
of tectonics of the Burmese arc.
Regional geology
Burma comprises three major physiographic di-
visions extending north-south: the Shan plateau
to the east, the Central Belt (CB) including the
basins of the Irrawaddy, Chindwin and Sittang
rivers, and the Burmese Fold Mountain Belt
(FMB) on the west (Fig. 1). The Fold Mountain
Belt includes the Arakan-Yoma mountains and
the Chin, Naga, Manipur, Lushai and Patkai hills.
Further west lies the Bengal basin. The eastern-
most tectonic unit is the Shan plateau forming the
eastern highlands which is elevated by about 0.7
km above the Burmese plains (CB) containing the
Tertiary deposits against a prominent scarp/fault,
called the Shan scarp. Burma, west of the Shan
plateau is believed to have formed a part of an-
cient Gondwanaland whose shore line possibly
ran along the western boundary of the Shanplateau and is now marked by this great scarp or
the boundary fault (Chhibber, 1934a, p. 510). The
Mogok metamorphic belt, consisting of undif-
ferentiated igneous and metamorphic rocks with
acid intrusives, runs north-south along the west-
ern edge of the Shan plateau for a distance of
more than 1000 km with an average width of
24-40 km. According to Searle and Haq (1964),
metasediments which range in age from Pre-
cambrian to possibly Cretaceous were migmatized
during the Himalayan orogeny to form the Mogok
metamorphic belt. The Mogok Series consists of
migmatites, gneissic rocks (garnet-biotite gneiss,
biotite gneiss and g~et-Capote-si~manite
gneiss), and calcareous and arenaceous rocks
(marbles and talc-silicate granulites). Associated
intrusive rocks contain alaskitic suite and mafic
rocks (Late Eocene-Early Oligocene in age),
pegmatites and aplites (Middle Miocene in age),
and the Kabaing granite which is the largest and
youngest intrusive (Late Miocene-Pliocene). TO-wards the east, the Mogok belt is covered by
8/8/2019 Deep Structures and Tectonics of Burmese Arc 1988
http://slidepdf.com/reader/full/deep-structures-and-tectonics-of-burmese-arc-1988 3/24
301
d8”
m Quoternary
da*m Tethyan ophiol ite
Crystalline rocks of Himalayam and Burma
Cretoceous-PaleogeneIK-P9 Flysch
m Crystalline rocks of Indian
Shield
m Mesozoic votcanics .-+“‘x Structural trend
[-“ %-j Subrecent forecent volcano # Fault ,Thrust
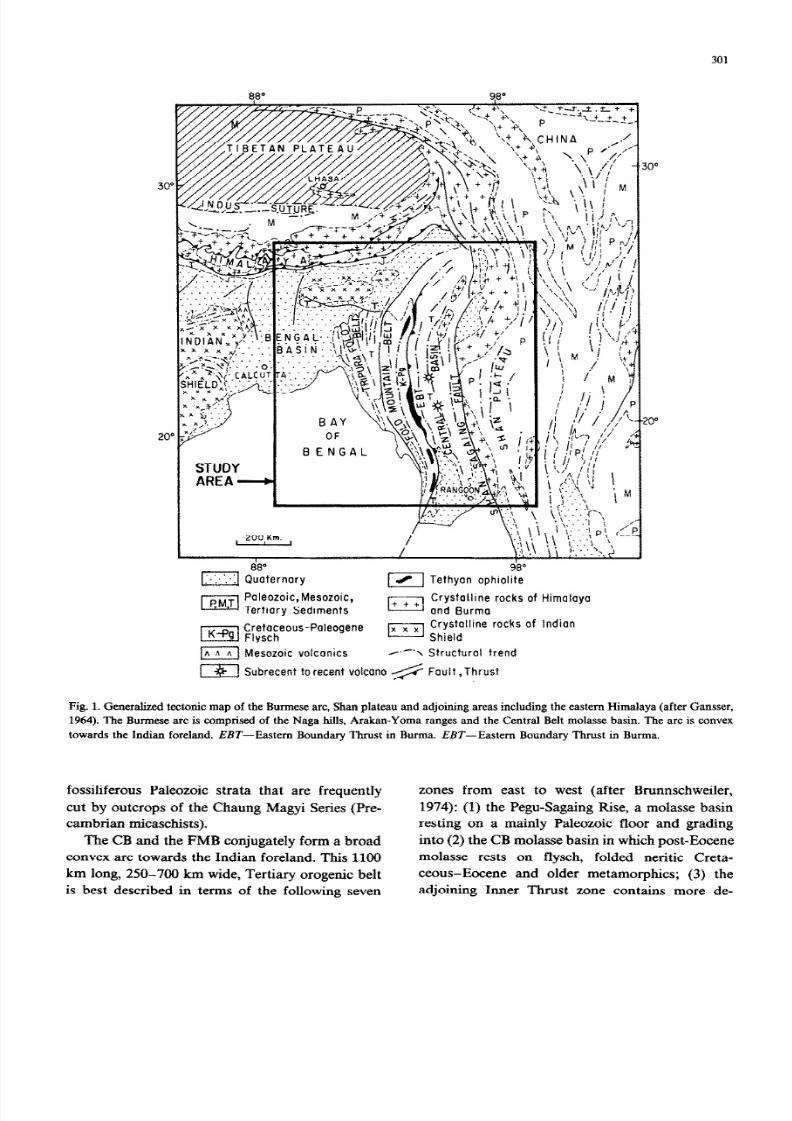
Fig 1. Generalized tectonic map of the Burmese arc, Shari plateau and adjoining areas including the eastern Himdaya (after Gansser,
1964). The Burmese arc is comprised of the Naga hills, At&an-Yoma ranges and the Central Belt molasse basin. The arc is convex
towards the Indian foreland. EBT-Eastern Boundary Thrust in Burma. EBT--Eastern Boundary Thrust in Burma.
fossiIiferous Paleozoic strata that are frequently zones from east to west (after ~~~schweiler~
cut by outcrops of the Chaung Magyi Series (Fre- 1974): (I) the Pegu-Sagaing Rise, a molasse basin
cambrian micaschists). resting on a mainly Paleozoic floor and grading
The CB and the FM3 conjugately form a broad into (2) the CB malasse basin in which post-Eocene
convex arc towards the Indian foreland. This 1100 molasse rests on flysch, folded neritic Creta-
km long, 250-700 km wide, Tertiary erogenic belt ceous-Eocene and older metamorphics; (3) theis best described in terms of the following seven adjoining Inner Thrust zone contains more de-

8/8/2019 Deep Structures and Tectonics of Burmese Arc 1988
http://slidepdf.com/reader/full/deep-structures-and-tectonics-of-burmese-arc-1988 4/24
302
formed sediments with exposed pre-Alpine meta-
morphics including Cretaceous ophiolites: (4) fur-
ther west is a Cretaceous-Miocene flysch trough
of great thickness resting on abyssal Cretaceous-
Mesozoic strata with ophiolites; (5) the coastal
Ramri-Andaman Ridge has a comparable belt of
Cretaceous-Eocene strata, strongly folded and
thrust which overlies (6) an outer molasse basin
containing Tertiary sediments (Tripura fold belt)
INDEX
issl
PRE-CRETACEOUS ROCKS OF
EASTERN AND WESTERN BURMA
up to 20 km thick which are folded and mildly
thrust; (7) beyond the Indian border is the
Bengal-Surma foredeep and relatively undisturbed
Bengal-Asam peri-cratonic foreland in which only
the Pliocene deposits achieved major thicknesses
(Fig. 2). In the CB (zones 1 and 2) young ande-
sitic and basaltic volcanics occur along the Mt.
Popa-Chindwin-Wuntho volcanic line in south
Burma (Chhibber, 1934a) and continue through
Fig. 2. Prominent geologic and tectonic features of Burma. Data sources are cited in text.
8/8/2019 Deep Structures and Tectonics of Burmese Arc 1988
http://slidepdf.com/reader/full/deep-structures-and-tectonics-of-burmese-arc-1988 5/24
2J n
2L 6 #
D
WE
LO
O
G
G
P
d
TO
A
M
(M
~
O
(M
Fg
3
B
m
c
g
ao
m
o
h
B
b
n
e
o
so
c
a
a
a
e
e
o
m
o
h
S
o
a
S
pae
o
e
o
h
m
ae
w
a
e
o
th
B
m
ac
ep
v
y
C
o
ae
nm
e
T
m
nee
n
te
o
c
e
ue
o
h
B
b
n
sp
h
th
E
Hn
Z
e

8/8/2019 Deep Structures and Tectonics of Burmese Arc 1988
http://slidepdf.com/reader/full/deep-structures-and-tectonics-of-burmese-arc-1988 6/24
304
the Jade mines area in north Burma, whereas
Cretaceous ophiolites together with basic and ul-
trabasic submarine flows are found in zones 3. 4
and 5 (Bender, 1985). The Upper Creta-
ceous-Eocene flysch constituting the FMB is
limited by step faults and thrusts on the east side
and also partly on the west side. Ophiolitic rocks
occur along the eastern thrust (cf. Nandy, 1980)
which has been called the Eastern Boundary Thrust
(EBT). The EBT represents a major tectonic ele-
ment as it defines the contact between the FMB
and the CB throughout Burma; north of about
24” N it adopts a NNE trend south of the steeply
thrust Naga hills (Fig. 2) and then turns to the
northeast only to be cut off by the Mishmi crystal-
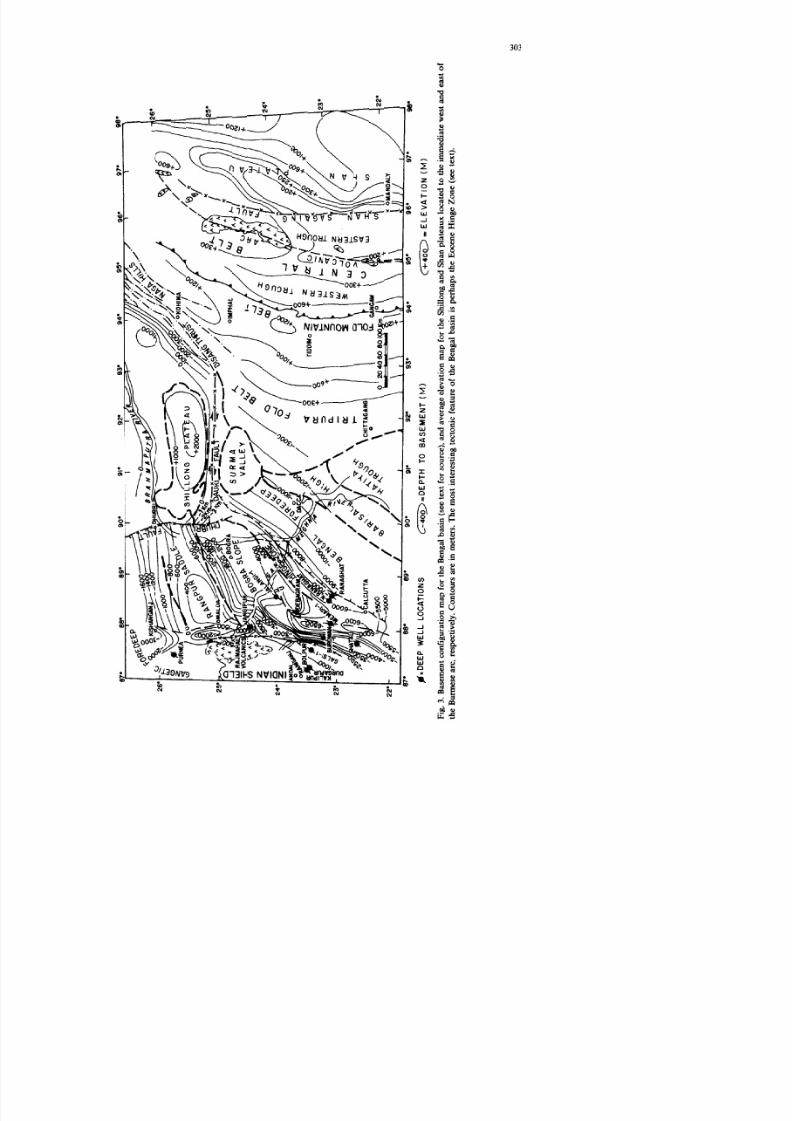
line thrust sheet at the eastern Himalayan syn-taxis. The Bengal basin underlies a thick section of
Cretaceous-Tertiary deposits whose total thick-
ness may be as high as 13 km in deeper parts of
the basin. Major tectonic features of the basin
(after Zaher and Rahman, 1980) and its underly-
ing basement configuration including the peri-
cratonic areas of the Shillong plateau (source:
Evans, 1964; Rao, 1973; Choudhury and Datta,
1973) are illustrated in Fig. 3. Note that the “Hinge
zone” (HZ) underlying the basin is taken to meanthe slope feature defined by the Eocene limestone
seismic reflector. Structural dips on this reflector
increases from 2-3” at the shelf edge to 6-12” on
the Bogra slope, flattening out to l-2” in the
basin foredeep (Salt et al., 1986). The HZ outlines
a zone of clear differential thickening and subsi-
dence of the overlying Oligo-Miocene sections,
between the shelf on the northwest and deeper
basin to the southeast. The HZ is at least 500 km
in length between the Dauki fault on the north
and Calcutta on the south; it also extends further
south into the Bay of Bengal. Its width varies from
25 km in the north, 110 km in the central part and
35 km in the south (Matin et al., 1986). Across the
HZ, the Bengal basin basement steeply plunges
from 4 to 10 km or even further (Fig. 3).
Seismicity and Benioff zone
Several authors gave prepared seismicity maps
for the Burmese arc and its adjacent areas, utiliz-
ing data for different time periods and from vari-ous agencies to study the correlation of seismicity
to tectonics (cf. Santo, 1969: Fitch, 1970, 1972:
Chandra, 1975, 1978; Verma et al., 1976: Khattri
et al., 1984; Le Dain et al., 1984). It was Santo
(1969) who first drew attention to an inclined
seismic zone underlying Burma. However. a major
difficulty in preparing a reliable seismicity map of
Burma is the poor distribution of recording sta-
tions. This led Le Dain et al. (1984) to apply a
selection procedure on the basis of distribution of
seismic stations and the number and consistency
of reported P- or pP-wave phases for each earth-
quake located by the ISC for preparing the
seismicity map. However, Gupta (1976) has shown
that earthquake detectability levels for the Burmese
seismic zone are extremely poor at present: they
are mb = 5.2 for all earthquakes which are re-
ported for the region, while for mb = 4.5 only 4%
earthquakes are reported. The corresponding fig-
ures for the western U.S. are mb = 4.3, and 100%.
Gupta (1976) also estimates that the error in-
volved in epicenter location for Burmese
earthquakes is about 2 km for an event of mb = 5.0
which increases to about 5 km for m,, = 4.0, al-
though the actual capability of the seismic net-
work could be one order of magnitude worse than
these statistical figures. The status of the seismicnetwork has not presumably improved much over
the past decade. It is therefore obvious that severe
restraint must be exercised in evaluating any ex-
isting seismic map of Burma, in particular, for
geologic correlation and hazard studies.
Keeping in view the limitations of the seismic
network and errors involved in epicentral de-
terminations, we have prepared a seismicity map
of Burma (Fig. 4) using ISC data for the period
1964-1980 with events having m,, > 4.0 M, >, 5.0;
for purposes of the present study this is consid-
ered as the cut off magnitude level. With this we
also include ISS/NOAA earthquake data for the
immediately preceding period 1956-1963 using
only those events of M, 2 5.0. For reasons dis-
cussed earlier, this allows us to deal with a greater
volume of data for purposes of correlation with
regional structures. However, for smaller events
the error involved in epicentral determination is
rather high for the Burmese earthquakes. Gen-
eralized tectonic features of the Burmese arc arealso superposed on Fig. 4.

8/8/2019 Deep Structures and Tectonics of Burmese Arc 1988
http://slidepdf.com/reader/full/deep-structures-and-tectonics-of-burmese-arc-1988 7/24
305
23r
C-22*
21
Fig. 4. Seismoteetonic map of Burma; earthquake data sampling period: 19561980. Notice the different notations used to represent
the data for the periods 1956-1963 and 1964-1980 for reasons discussed in the text. Maximum earthquake concentration is seen for
the Central Belt to the east of tire Eastern Boundary Thrust. The seismicity map is classified into four sectors, I-IV, in accordance
with the change in strike direction of the convex Burmese are. Section AA’ through DD’ taken across the middle of the individual
sectors are illustrated on Fig. 5. Results of 45 focal mechanism solutions are schematically shown on the map; dark and blank areasrefer to compressional and dilatational quadrants respectively. Digits identify the solution number as listed in Table 1. Diverging
half-arrows indicate fateral slip.

8/8/2019 Deep Structures and Tectonics of Burmese Arc 1988
http://slidepdf.com/reader/full/deep-structures-and-tectonics-of-burmese-arc-1988 8/24
NW
ln
a
pae
P
o
1
1
D
a
s
c
S
P
o
1
1
D
a
s
c
N
S
M
>
50
A
S
e
AB
A
smc
B
EFZ
E
h
Fe
Z
’
J
Fg
5
S
o
ln
A
tho
D
b
w
n
h
a
s
h
B
m
(
Fg
4
o
o
o
iu
e
s
g
o
a
th
u
yn
s
m
c
z
T
n
a
pae
ce
~
u
hu
th
B
m
pae
b
ow
th
B
m
a
Dg
r
to
f
pa
s
u
o
o
e
h
l
e
in
T
e
1
G
o
c
in
/2
cy
a
n
b
m
2=
m
am
p
c
3=
y
4=m
a
5=
v
c
c
6=
o
o
e

8/8/2019 Deep Structures and Tectonics of Burmese Arc 1988
http://slidepdf.com/reader/full/deep-structures-and-tectonics-of-burmese-arc-1988 9/24
307
In order to best define the seismicity of Burma,
Fig. 4 is classified into four sectors, of comparable
sizes, having their characteristic mo~holo~c and
tectonic settings. They are: Sector I corresponding
to the Naga Hills area in the extreme north to the
northeastern part of the Burmese arc where the
collision process has just set in (cf. Mitchell and
McKerrow, 1975); Sector II corresponding to the
Chin Hills area where the northeast trend of the
Burmese arc takes an arcuate trend to become
N-S in more southern areas, and where deforma-
tion is believed to be largely controlled by a
basement spur of the Precambrian Shillong-Mikir
massif of the Indian foreland (cf. Evans, 1964;
Fig. 1); Sector III corresponding to the central
portion of the Burmese arc where the arc is widest
and folding is mostly N-S; and Sector IV covering
coastal Burma where the arc orientation changes
to NW-SE. For each of these sectors we present a
representative geologic section on the basis of
available informations including our field studies
data in parts of the FMB, and a seismologic
section using the data given on Fig. 4. These are
discussed below.
Figure 4 demonstrates that Sectors I to III are
seismically very active whereas Sector IV is farless seismic. Four east-west sections, AA’-DD’
(Fig. 5), taken through the midparts of these sec-
tors illustrate the surface geology and the hypo-
central pattern of earthquakes underlying these
section lines. The earthquake events have been
projected onto a vertical plane below the section
lines from both the north and south areas located
within the individual sectors. As can be seen from
Fig. 5 an inclined seismic zone is colon for
Sectors I to III, while for coastal Burma this
pattern is either greatly subdued (a quiet zone) or
not well represented by the present data set. The
earthquake foci range in depth from near surface
to around 180 km. The foci dist~bution in the
inclined seismic zone is used here to define the
boundaries of the subducting Indian plate below
the Burmese arc. The horizontal lower boundary
of the lithosphere is placed immediately below the
lowest foci at a depth of 75 km; when traced
eastward this boundary dips to the cast in the
region below the FMB and plunges to a depth ofabout 180 km in Sectors I and II, to 160 km in
Sector III, but reaches up to about 80-100 km in
Sector IV. The thickness of the Benioff zone is of
the order of 60 km below the CB, having an
average dip of about 45 O. The Burmese volcanic
arc generally corresponds to the deepest part of
the Benioff zone. Further east of the Benioff zone
two shallower seismic zones are located within the
overriding Burma plate in Sectors I to III. Follow-
ing Sacks et al. (1978) and Yamashina et al.
(1978), we designate this as the inland seismic slab
within the Burma plate. The relatively shallow
seismic zone closest to the Benioff zone occurs
below the Chindwin forearc basin; hence, it is
termed the forearc seismicity, whereas the crustal
seismic zone farthest away from the Benioff zone
corresponds to backarc activity. The backarc
seismicity is most intense in the Jade Mines area
in north Burma, although the Shan-Sagaing fault
shows appreciable activity over its full extent. It
further appears that the forearc and backarc
seismic zones are distinguished by an aseismic
zone between them. The inland seismic slab un-
derlying the CB is 50-70 km thick; this provides
an approximate indication of the thickness of the
Burma plate (Fig. 5). A triangular “aseismic belt”
at shallower depths appears to be defined by theupper surfaces of the Benioff zone and the inland
seismic slab in all the four sectors in Burma. The
western margin of the aseismic belt is, however, ill
defined at present because of poor depth control
for seismic events; Fig. 5 sections give only an
approximate idea about its configuration. Note
that the apex of the “aseismic belt” is always
deflected downward-concordant with the dip di-
rection of the Benioff zone. This bending of the
inland seismic slab is presumably a consequence
of downward drag experienced by the overriding
plate near the subduction zone.
Focal mechanism study and stress pat ter n
Here we examine 45 focal mechanism solutions
for both shallow and intermediate depth
earthquakes in Burma for purposes of infering the
stress distribution and faulting pattern. For Sec-
tors I-III there is a total of 43 solutions de-
termined which are more or less evenly distributed
in these sectors, while for Sector IV only two

8/8/2019 Deep Structures and Tectonics of Burmese Arc 1988
http://slidepdf.com/reader/full/deep-structures-and-tectonics-of-burmese-arc-1988 10/24
solutions could be obtained. Of these 37 events
relate to the Benioff zone seismicity, 3 events are
for the forearc seismic zone whereas the remaining
5 events correspond to backarc activity. The solu-
tions have been determined using P-wave (both
short and long periods) and first motion directions
(source: ISC Bulletin) plotted as stereographic
projection of the lower hemisphere of the focal
sphere employing (i, A) curves of Ritsema (1958).
A double couple source mechanism was assumed.
The focal mechanism solutions are illustrated on
Fig. 6 and the solution parameters are given in
Table 1. Their main results are discussed below.
@W27 03 1964 25.82N95.7lE 5.3 ll5Km .
12 07 1964 24.88N 953lE 55 152Km. 29 07 1970 26.02N 95.37E 6.4 68Km.
N
28 04 1969 25.93N 9520E 5.0 68Km. 03 06 1964 25.88N 95.69E 5.4 I21 Km. 23 07 1975 26.58N 96.36E 5.2 22Km.
Fig. 6. Lower hemisphere stereographic projection for 45 fault plane solutions of Burmese earthquakes. Solid circle and triangle
symbols indicate compressional and dilational first motions of P waves, respectively. P and T correspond to the P and T axes. The
solution parameters are listed in Table 1.

8/8/2019 Deep Structures and Tectonics of Burmese Arc 1988
http://slidepdf.com/reader/full/deep-structures-and-tectonics-of-burmese-arc-1988 11/24
3001 1967 26.lON 96.l4E 5.4 39Km. 29 12 1971 25.17N 94.73E 5.6 46Km.
N N
3005 1971 25.20N96.4lE 5.6 40Km. 31 05 1971 2522N 96.5tE 5.2 22Km.
I I 08 1979 24.20i94.93E 5.0 ll3Km . 13 12 1975 23.62N94.27E 5.2 62Km
25 I I 1979 25.21\96.32E5.0 50Km.
2606 1971 24.6ON94.78E 5.0 74Km.
N
27 07 1973 23.27N 94.49E 5.4 60Km.
N N N
04 07 1973 23.60N 94.86E 5.0126Km. 29 05 1979 24.5ON 94.74E 5.2 82Km.
Fig. 6 (continued).

8/8/2019 Deep Structures and Tectonics of Burmese Arc 1988
http://slidepdf.com/reader/full/deep-structures-and-tectonics-of-burmese-arc-1988 12/24
1802 1965 24.97N 94.21E 5.4 45Km. 31 05 1973 243lN 93.52E 5.8 3OKm. 29 05 1970 2396N 94.06E 5. I 49Km.
N N N
20 05 IS80 23.72N 94.20E 4.8 63Km. 13 IO 1977 23.47N 93.33E 5.2 61Km. IS 06 1963 24.97N92.06E 5.9 44Km.
17 IO1969 23.OW97.70E 6.1 i24Km . 23 02 IS78 23.Ofk S4.7OE 5.0 113Km. 22 01 1964 2233i 93.58E 6.3 60Km.
Fig. 6 (continued).

8/8/2019 Deep Structures and Tectonics of Burmese Arc 1988
http://slidepdf.com/reader/full/deep-structures-and-tectonics-of-burmese-arc-1988 13/24
311
15 12 1965 22.OON94.47E5.2 lO9Km. 03 02 1978 23.02N94.70E 5.1 92Km. 12 519772(.66N92.96E5.439Km
N
05 04 1974 21.33N 93.&8E 5.0 47Km. 0807 1975 2t.42N94.62E 5.9 112Km. L3 06 1964 23.OON93.95E 5.2 6OKm.
Y-+---L 8
@U @F-L22 IO 1966 23.04N 94.28E 5.1 72Km. 20 I 960 2_7&&t92E 5.2 30Km. 1410 971 3.&%3.86E5. I 47Km.
IO IO 1971 3.CON95.92E4.96Km. 15 02 1967 2033h93.99E 5.4 55Km.
Fig. fcontinued).

8/8/2019 Deep Structures and Tectonics of Burmese Arc 1988
http://slidepdf.com/reader/full/deep-structures-and-tectonics-of-burmese-arc-1988 14/24
T
1
Pmeo
pasuooeh
*
N
De
Ec
DhMau
P
T
B
N
pa1
N
pa2
L”N
LoE
cw
(MI
P0A
P
A
P
A
S
D
D
S
D-
1
001
24
93
9
50
1
3
7
1
0
4
N
2
1
2
011
24
93
9
52
1
3
7
1
0
3
N
2
1
3
201
23
90
7
52
1
3
7
1
0
3
N
3
1
4
201
28
97
1
53
1
2
7
6
1
1
N
3
1
5
101
28
93
1
55
2
2
4
0
2
1
N
3
1
6
201
20
93
6
64
4
2
2
1
4
2
NE
7
1
I
201
29
92
6
50
5
2
2
1
2
3
N
7
1
8
001
28
96
1
54
5
2
4
1
0
1
N
8
1
9
201
25
%3
2
52
3
1
0
2
5
3
NOW 7
2
1
301%
21
91
3
54
0
8
1
1
7
3
N
7
3
1
211
21
97
4
56
0
3
2
1
6
2
N
8
3
1
211
22
93
5
50
0
2
1
3
7
1
N
7
1
1
301
22
94
4
56
0
2
1
3
7
1
N
8
1
1
301
22
95
2
52
1
2
1
3
6
9
N
7
1
1
201
26
97
7
50
1
2
6
1
0
0
NOW 2
8
1
101
22
99
1
50
2
2
6
1
0
1
NE
2
1
1
111
26
92
6
52
3
3
5
1
0
4
N
0
9
1
201
22
94
6
54
3
2
5
5
0
1
NO
1
1
1
201
28
90
5
53
4
1
1
9
4
3
NW 7
6
2
001
26
98
1
50
1
1
7
3
0
1
N
6
1
2
201
25
97
8
52
0
3
4
2
6
7
N
6
1
N
6
NO
6
N
5
NW
6
NW 7
N
5
N
3
NW 0
N
6
NW 8
NW 7
NW 8
NW 8
NW 8
NO
5
N
6
N
8
NW 7
N
4
N
3
NW 6
D~ 3 3 3 2 2 3 3 2 3 3 2 2 2 1 2 2 3 2 3 2 1

8/8/2019 Deep Structures and Tectonics of Burmese Arc 1988
http://slidepdf.com/reader/full/deep-structures-and-tectonics-of-burmese-arc-1988 15/24
2
101
29
92
4
54
1
51
1
6
2
NW 9
2
301
23
95
3
58
0
41
1
7
2
NW 8
2
201
29
90
4
51
0
21
1
7
2
N
8
2
201
27
92
8
48
0
2
1
1
7
3
N
7
2
1m-1
24
93
6
52
0
15
1
3
2
NW 4
2
101
29
90
4
59
3
1
5
3
0
8
N
8
2
201
29
94
4
52
2
2
6
1
0
1
NW 1
2
201
26
94
9
60
3
2
5
7
0
1
N
1
3
111
25
94
8
54
2
2
6
1
0
0
NW 2
3
111
20
97
1
61
6
2
2
1
0
2
N
7
3
201
20
97
1
50
3
2
1
9
4
3
NW 8
3
201
23
95
6
63
5
2
2
1
2
2
N
7
3
111
20
94
1
52
6
2
2
6
0
1
NW 6
3
001
20
97
9
51
0
8
3
1
5
3
NW 6
3
101
26
99
3
54
0
1
2
1
6
2
N
6
3
001
23
96
4
50
1
8
2
1
5
3
NW 8
3
001
24
96
1
59
2
2
6
5
0
1
N
2
3
101
20
99
6
52
4
2
2
2
4
1
N
5
4
211
20
92
7
51
1
2
1
3
6
1
N
6
4
211
27
99
3
52
0
2
1
3
7
1
NW 7
4
111
20
98
4
51
2
1
1
9
5
3
NW 8
4
111
20
99
4
49
2
1
1
9
5
3
NW 7
4
101
23
99
5
54
2
1
2
7
5
2
N
5
4
001
21
98
8
52
4
2
3
8
1
3
NW 8
0 3 3 2 1 7 9 8 1 6 1 6 4 3 4 9 1 1 8 5 5 3 7
N
6
2
N
7
2
NW 8
2
NW 8
2
N
5
3
NW 1
1
N
7
2
NW 8
2
N
7
2
N
2
3
N
5
3
N
3
3
NW 2
2
N
6
2
NW 7
2
N
5
3
NW 7
2
NW 8
5
NW 8
3
N
8
1
N
5
3
N
6
3
NW 8
2
N
1
3
l P=PuA=AmuhS=SkD=DpD=Dpd
o
Yw
8/8/2019 Deep Structures and Tectonics of Burmese Arc 1988
http://slidepdf.com/reader/full/deep-structures-and-tectonics-of-burmese-arc-1988 16/24
Stress und fault pattern within the Benioff zone
Figures 5 and 6, and Table 1 demonstrate that
three distinct categories of faulting and stress pat-
tern are evidenced in the subducting Indian plate
They are:
(1) Low angle thrust events at the upper edge
of the Benioff zone as indicated by solutions l-5
in Sector I, 15-18 in Sector II and 28-30 with 38
in Sector III, all of which suggest pure thrusting
along a shallow dipping nodal plane (G 30 “) to-
wards the east to southeast. Solutions 29 and 38
are reinterpreted here from Le Dain et al. (1984).
The eastward unde~~sting of the Indian plate is
evidenced by these earthquakes occurring at shal-
low to intermediate depths. Events 26-28 furtherdemonstrate that thrusting continues westward at
shallower levels along the west margin of the FMB
in areas of the T~pura-C~ttagong hills where
E-W shortening has produced N-S folds of
Plio-Pleistocene age.
(2) Down-dip tensional events at the lower edge
of the Benioff zone are shown by solutions 6-8 in
Sector I, 19 in Sector II, 31-34 in Sector III and
45 in Sector IV. In general these events suggest
normal faulting or normal faulting with a compo-nent of right-lateral slip along steeply dipping
nodal planes oriented subparallel to the strike of
the Burmese arc. Solutions 6, 19, 31 and 33 are for
the events already studied by Le Dain et al. (1984).
Notice that the suggested normal faulting occurs
generally below the zone of thrusting in all the
sectors. Inferred shallow-angle thrusting at the
upper edge of the subducting lithosphere and
down-dip tensional events at its lower edge
strongly suggest that a double seismic zone ulti-
mately may be discovered in Burma when the
capability of the local seismic network increases.
Such a faulting and stress pattern, characteristic of
a double seismic zone, have been described for
several Western Pacific arcs (cf. Kawakatsu, 1985).
(3) Lateral faulting at shallower depths is indi-
cated by solutions for event 11 in Sector I, events
22-26 in Sector II, events 36, 37 and 40 in Sector
III, and by event 44 in Sector IV. Most of these
events or their inferred slip motion correspond to
transverse lineaments/faults transecting theBurmese arc in NW-NE directions. Earthquake
events 22-26, 39 and 40 appear to correlate to
already mapped transverse faults on the basis of
surface geology and airphoto inte~retation (see
Fig. 2). Event 26 occurred at the south end of the
Mat fault, the most extensive transverse fault
crossing the FMB including the Tripura foldbelt
bordering the Bengal basin. Similarly, events 39
and 40 appear to have originated in association
with another major but unnamed transverse fault
oriented NE across the FMB. The sense of shear
motion as inferred from these focal mechanism
solutions is corroborated by surface geology in
several areas (Fig. 5).
Focal mechanism results for forearc and backarc
seismic zones
Solutions for events 9 and 10 in Sector I and 41
in Sector III suggest a strike-slip m~ha~sm where
the slip motion is believed to occur along
steeply-dipping NNE oriented nodal planes. All
three events are of magnitudes greater than 5.0,
are of crustal origin (Table 1) and locate below the
Chindwin forearc basin. Hence they provide sig-
nificant information about the current motion of
the overriding Burma plate by virtue of theirdepth of origin above the subducting slab. Accord-
ing to a conceptual model given by Sacks et al.
(1978) such a forearc seismic region is commonly
under the influence of a tensional regime. How-
ever, in the present case where only three solutions
are available for the forearc seismic region, we are
inclined to believe that the overriding Burma plate
may be in relative motion in respect to the Indian
plate in addition to being deflected downwards by
the subducting plate. The evolution of the
Chindwin forearc basin (the “Western Trough” of
Mitchell and McKerrow, 1975) must then be
ascribed to the complex deformation experienced
by the Burma plate in the vicinity of the subduc-
tion zone.
It is noted above that the backarc and forearc
seismic zones are apparently separated by a seismic
gap. The most prominent tectonic feature of the
backarc is the Sagaing transform; further east the
Shan scarp is located, bordering the CB against
the eastern highlands (Fig. 2 shows only a gen-eralized pattern). Earthquake events 12-14 in Sec-

8/8/2019 Deep Structures and Tectonics of Burmese Arc 1988
http://slidepdf.com/reader/full/deep-structures-and-tectonics-of-burmese-arc-1988 17/24
315
8/8/2019 Deep Structures and Tectonics of Burmese Arc 1988
http://slidepdf.com/reader/full/deep-structures-and-tectonics-of-burmese-arc-1988 18/24
tor I and events 42 and 43 in Sector 111 belong to
the backarc area. For events 12-14, focal mecha-
nism solutions suggest right-lateral shear along a
steeply dipping fault plane striking NNE. This
conforms with the known slip motion for the
Sagaing transform. But for events 42 and 43 which
are located some distance further east, dominant
east-west tensional stress is indicated by their
focal mechanism results. This we interpret as due
to westward normal faulting at the Shan scar-p.
The Shan plateau belonging to the Asian plate has
been uplifted in respect of the Burmese plains
against the Shan scarp normal fault.
Gravity anomalies
The Bouguer anomalies over Burma and ad-
joining Indian territories (source: Evans and
Crompton, 1946; Gulatee, 1956; Verma and
Mukhopadhyay, 1977; Fig. 7) show two distinct
contour trends reflecting the major structural lin-
eation-an E-W trend over the Shillong plateau
and the Assam Valley north of it forming the
eastern Himalayan foredeep, and a N-S trend
over the Bengal basin paralleling the Indian shield
margin and also over the Burmese arc followingthe Shan scarp geometry. The Bouguer anomalies
range between 0 to -25 mGa1 over most of the
Bengal basin, while the Shiflong massif is outlined
by a higher Bouguer gravity field up to 42 mGa1.
Their margin is marked by the Dauki fault system
that is associated with a very steep gravity gradi-
ent. Several alternating gravity highs and lows, of
relative amplitudes up to 40 mGa1 or more,
dominate the otherwise passive gravity field of the
Bengal basin. These clearly correspond to the
structural highs or depressions underlying the
basin as mapped by seismic, aeromagnetic and
other geophysical surveys. They are: (1) an exten-
sive N-S gravity high at the Indian shield margin
in the area of the Rajmahal hills on the extreme
west which relates to a near-surface layer of high
density (= 3.08 g cm-‘) metamorphics (Mukho-
padhyay et al., 1986); (2) a north-south gravity
low over western parts of the Bengal basin, sub-
parallel to the shield margin gravity high, which
results from a buried Gondwana sediment troughmarked by basement faults (Sengupta, 1966;
Choudhury and Datta. 1973); (3) a gravity high
over the Rangpur saddle that has the form of a
structural high between the Indian shield and the
Shillong massif across the northwestern edge of
the Bengal basin: (4) a region of falling gravity
across the Bogra slope: (5) a NNE-trending grav-
ity high, called the Calcutta-Mymensingh gravity
high, coinciding with an Eocene hinge zone at
depth; (6) a region of NNE and finally E-W
trending zone of low gravity over the Bengal fore-
deep and the Surma basin (cf. Zaher and Rahman,
1980); (7) a gravity high over the Bar&al structural
high; and finally (8) a zone of low gravity across
the Tripura foldbelt as well as over the Hatiya
trough near Chittagong on the Burmese coast.
The gravity field of the Bengal basin steadilydecreases eastward across the Burmese orogen. A
Iinear negative-positive anomaly pair, of am-
plitude in excess of 175 mGa1, runs N-S over a
distance of 1100 km encompassing the CB and the
andesitic volcanic axis (VA) of Burma (only the
central portion of this extensive anomaly zone is
shown in Fig. 7). To the east of the positive
anomaly axis, a narrow but linear negative
anomaly zone is only partly developed over a
strike distance of 700 km, which, however, givesway to a less well-developed zone of “high” grav-
ity near the Shan scarp. The Shan plateau has a
wider extent of smoothly varying negative anoma-
lies spread over the Paleozoic basin in the interior
of the plateau.
Deep structure
The gravity anomalies along a profile I-I’ (Io-
cation shown on Fig. 7), extending from the In-
dian shield to the Shan plateau across the Bengal
basin and Burmese arc, are interpreted here in the
context of a descending lithosphere dipping east
below the CB. For this the regional gravity field
due to the sources in the upper mantle is initially
removed from the observed gravity field. The re-
gional gravity along the profile is obtained from a
GEM 10 model as given by Lerch et al. (1979).
The configuration of the Benioff zone under the
Burmese arc (discussed above for Section BB’
across Sector II) together with the lithosphericboundaries are used for model construction as-

8/8/2019 Deep Structures and Tectonics of Burmese Arc 1988
http://slidepdf.com/reader/full/deep-structures-and-tectonics-of-burmese-arc-1988 19/24
E. -9o- a-o_0 OBSERVED
I t-.-.- COMPUTED
-120
a,/ “I
op o Up0 Km
~J;~~--+-BENGAL n*c lhl -FM R -CR-4 VA 1 I-EASTERN HIGH
_^ I.,_~,
ieo-Km
500 600 7DQ 600 900 loo0
200 I-
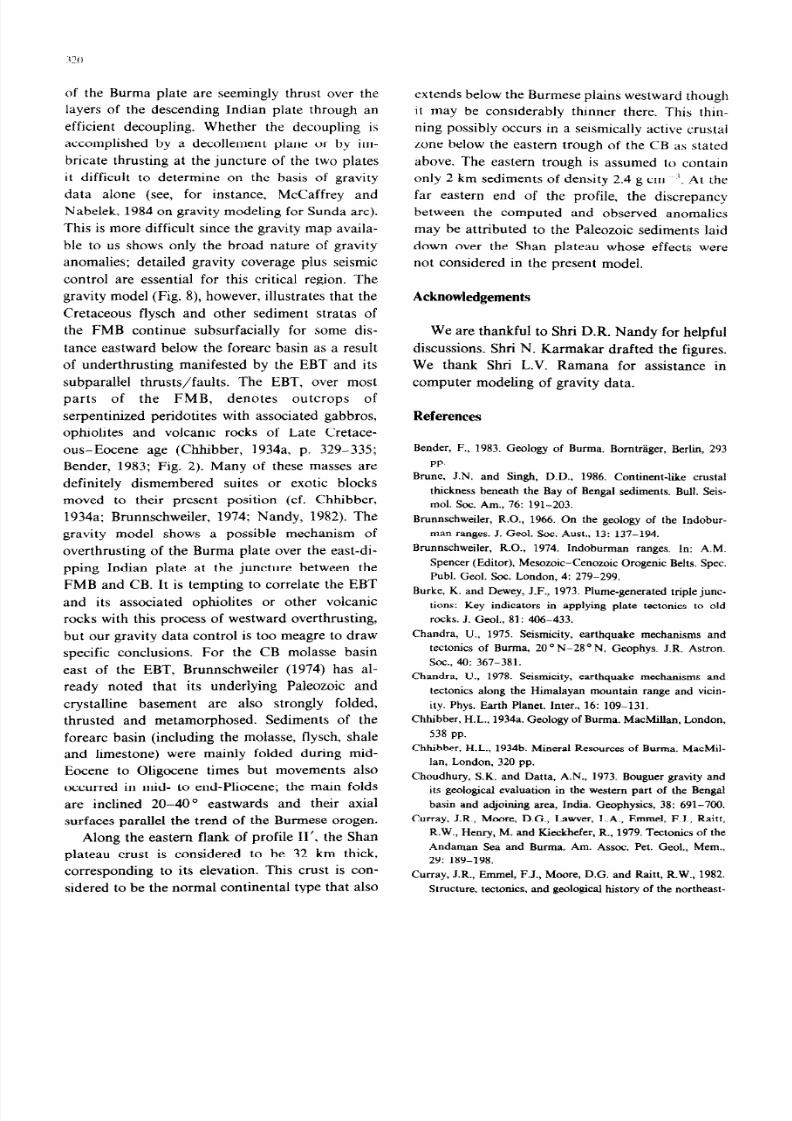
Fig. 8. Two-dimensional gravity model along profile II’. Inset shows the computed gravity effect due to the descending Indian
lithosphere below 75 km depth corresponding to the Beniof f zone geometry for seismologic section B B’ illustrated on Fig. 5. The
schematic geology underlying the gravity profile is also shown. Digits refer to density values in g cmA3. B .S.-Bogra stope;
H . Z.--Hinge zone; B. F.-Bengal foredeep; B.H.-Bar&l high; T. F. B.-Tripura foldbelt; F. M. B.-Fold Mountain Belt (Indo-
Burman ranges); C.B.-Central Belt molasse basin of Burma; W.T. and E.T.-western and eastern troughs, respectively, together
constituting the C.B.; V.A.--andesitic volcanic axis of Burma; E.&T.---eastern boundary thrust of the F. M. B . against the C.B.
Geologic index is the same as in Fig. 5.
suming two-dimension~ty (Fig. 8). The gravity
model assumes a dip of about 20” on the Benioff
zone beneath the EBT at the eastern margin of the
Arakan-Yoma, but at depths more than 30 km the
dip steepens to about 45-50” below the CB. The
base of the lithosphere of the Indian plate is
assumed to be 75 km below the Bengal basin. The
density structure for the lithosphere and astheno-sphere in the gravity model is assumed to be
primarily due to temperature perturbations in an
upper mantle of peridotite composition, and fol-
lowing Grow (1973), we assume a higher density
for the subcrustal lithosphere (3.40 g cmS3) than
for the upper asthenosphere (3.35 g cmW3). At
destructive plate margins at depths below 150 km,
the asthenosphere is probably denser than 3.35 g
cm-3 and the descending lithosphere probably
denser than 3.40 g cme3 (Grow, 1973); however,
only the density contrast between the descending
slab and the surrounding asthenosphere is signifi-
cant for calculation of the gravity values rather
than their absolute densities.
Even though the assumed density contrast of
0.05 g cmP3 for the dipping lithosphere below the
Burmese arc against its surroundings is relatively
small, the positive gravity contribution of the de-
scending lithosphere (below 75 km) reaches a max-
imum of 45 mGa1 over the CB molasse basin and
the VA (see inset in Fig. 8). This positive gravity
contribution must be compensated by a lower
density zone above the descending slab in order to
fit the observed gravity anomalies over the CB and
VA. Although the gradient, amplitude and width
of the observed anomalies put severe constraints
on the possible configuration of the low density
zone, much uncertainty remains due to the lack of
density ~fo~ation. As a result, config~ations of
the low density zone differing from that shown in
Fig. 8 are possible. The Fig. 8 data was obtained
by inferring crustal thickening under the CB

8/8/2019 Deep Structures and Tectonics of Burmese Arc 1988
http://slidepdf.com/reader/full/deep-structures-and-tectonics-of-burmese-arc-1988 20/24
molasse basin (in particular, under the Western
Trough) and by inferring a low density zone under
the VA. For the VA. we use density values varying
from 2.60 to 2.80 g cm -’ between its higher and
deeper parts, and approximate its shape from the
inferred geometry of the inland seismic slab shown
in Fig. 5 in relation to seismologic section BB’.
The density value of 2.60 g cm--’ for the upper
portion of the volcanic arc is our estimated aver-
age value for the measured rock density of the
volcanic rocks of the VA. It is of interest to note
that in places the core of the VA is occupied by
intrusive granites; field evidence is available (cf.
Chhibber, 1934a), describing rocks of continental
character that were ejected during violent volcanic
eruptions among others as volcanic bombs. Thissuggests low density rocks under the VA whose
adjacent basement, at least towards the east, is
possibly continental in character. According to
Grow (1973) in the Kamchatka, Alaska, Kurile
and probably the Aleutian arc areas, the volcanic
zones (comparable to the VA of the present case)
are associated with high seismic shearwave at-
tenuation, high temperatures and low densities in
the crust and lithosphere. Seismological studies
are, however, needed to confirm the proposed lowdensity zone below the VA in Burma.
Another significant density anomaly in the
mantle is caused by the crustal layer below the
FMB that is carried down with the descending
plate. The Bengal basin, in its deeper parts, is
believed to be underlain by oceanic crust (Burke
and Deway, 1973; Verma and Mukhopadhyay,
1977). Current subduction of the Indian plate
below the Burmese arc also requires that the Ben-
gai basin must be underlain by oceanic crust. The
Indian shield crust therefore must transit into
oceanic crust below the Bengal basin. However,
keeping in view the most recent results obtained
by Brune and Singh (1986) from the observed
dispersion of fundamental mode Rayleigh and
Love Waves across the Bay of Bengal sediments,
we believe that the crust underlying the basin may
not be truly oceanic rather it may be semioceanic
considering the fact that the basin contains huge
sediments and also the fact that the basin reached
its present land-status as early as Late Oligocene(cf. Evans, 1964; Nandy. 1982). Since at the mo-
ment no deep seismic sounding data are available
for the basin, we can only speculate that this
crustal transition possibly occurs across the east-
ern slope of the Eocene hinge zone. Our main
reasons for this assumption are:
(1) The hinge zone is a regionally extensive
curvilinear tectonic feature continuing in a
NNE-SSW to SW direction from the Bengal basin
into the Bay of Bengal further south; in the latter
area it apparently correlates to the margin of the
continental crust for the Mahanadi offshore basin
along the east coast of India (cf. Talukdar, 1982):
seaward of this zone, 130-100 m.y. old oceanic
magnetic anomalies are believed to be present (cf.
Johnson et al., 1976).
(2) Across the hinge zone the sediment thick-ness underlying the Bengal basin rapidly increases
toward its deeper parts (see above). Landsat image
shows (cf. Nandy, 1980) prominent NE-oriented
lineaments over the area; the iineaments are corre-
latable to the Eocene hinge zone at depth, and are
seismically active. The fold pattern and subsi-
dence character also differ across the hinge zone
(see, Morgan and McIntyre, 1959).
(3) A two-stage evolution for the Bengal basin
is envisaged by Salt et al. (1986); an initial stageof creation of a new oceanic basin in
Jurassic-Early Cretaceous in association with a
passive Indian continental margin, while the sec-
ond stage involves crustal subduction, collision
and orogeny in the Indo-Burman ranges to the
north and east of the basin during the Tertiary.
This has resulted in continuous basin destruction
along its eastern margin. In a framework of con-
tinuing oblique subduction, the Bengal basin is
thus classified as a “remnant ocean basin”.
(4) The pattern of gravity signature across the
hinge zone (Fig. 7) has a semblance with that of
continent-ocean transitional areas; a gravity high
on the continental side and a gravity low ocean-
ward outlined by a zone of steep gravity between
them (cf. Dehlinger, 1978, p. 231-232). This is
evidenced by an anomaly variation of more than
70 mGa1 between the Rangpur saddle and the
Bengal foredeep across the hinge zone (Figs. 3 and
7). This change in gravity is even more pro-
nounced in the N-S direction {total variation is inexcess of 105 mGa1) between the Shillong massif

8/8/2019 Deep Structures and Tectonics of Burmese Arc 1988
http://slidepdf.com/reader/full/deep-structures-and-tectonics-of-burmese-arc-1988 21/24
319
and the Surma valley across the Dauki fault; the
fault has an associated sharp gravity gradient.
For gravity modeling along profile I-I’, we
assume that the Indian shield crust underlying the
western part of the Bengal basin is a nearly 30 km
thick two layered continental crust having respec-
tive densities of 2.70 and 2.90 g cme3 in its top
and lower parts. This crust would be in approxi-
mate isostatic equilibrium as required by the low
elevation of the region. It is also assumed that
gravity variation along the profile is caused by
changes in crustal configuration from the shield
margin to deeper parts of the Bengal basin. We
have suggested elsewhere (Verma and Mukho-
padhyay, 1976, 1977) that the Bengal basin is in
approximate isostatic equilibrium as required byits near-zero Free-air and isostatic anomalies. The
Cretaceous and Tertiary sediments forming most
of the sediment sequences of the basin are to-
gether considered to be of average density 2.40 g
cmP3 (cf. Evans and Crompton, 1946; Verma and
Mukhopadhyay, 1977); the sediment thickness un-
derlying the profile I-I’ is taken from Fig. 3. In
the gravity model we also incorporate two rather
localized geologic bodies: (1) a layer of high den-
sity (= 3.08 g cma3) metamorphics located on thesurface at the margin of the Indian shield (after
Mukhopadhyay et al., 1986) and (2) locally
densified Eocene limestone strata at about 4 km
depth near the hinge zone having density = 2.65 g
cmw3 (after Tiwari, 1983) whose dimensions are
known from seismic surveys. The gross sediment
thickness pattern and crustal geometry considered
in the following ~te~retation may, however, rep-
resent an oversimplified version of the actual sub-
surface situation. While some of these assump-
tions are ambiguous, certain important inferences
can be made on the approximate configurations of
the sedimentary and crustal layers below the FMB
and near the subduction zone in Burma which
satisfy the gravity data.
The sedimentary and crustal layers underlying
the Bengal basin are carried down the trench with
gentle dips at shallow level which steepen at depth
following the geometry of the Benioff zone (Fig.
8). Immediately to the east of the Chin hills, the
average sediment thickness is of the order of 13km, but down the trench the sediments may ex-
tend to a depth of about 15 km. These figures are
comparable to geological estimates (see fig. 5 in
Brunnschweiler, 1974). Grow (1973) and Grow
and Bowin (1975) have discussed the effect on
density as the oceanic crust experiences transition
from lower to higher pressure assemblages (basalt
to eclogite) at pressures between 10 to 20 kb
(30-60 km depth) in a Benioff zone environment.
This process is grossly simplified here by a simple
density change of the oceanic crust from 2.9 to 3.4
g cme3 at about 30 km depth. The derived geom-
etry in Fig. 8 shows that both the sedimentary and
deeper crustal layers are depressed into their re-
spective substrata over a distance of 200 km below
the FMB (covering the Tripura foldbelt and the
Chin hills at the location of the gravity profile)towards the immediate east of the Bengal basin
before being carried down the trench. The Barisal
gravity and structural high developed within the
Bengal basin would therefore correspond, both in
location and amplitude, to typical “outer” gravity
and bathymetric highs seaward of trenches as seen
for several western pacific arcs (cf. Watts and
Talwani, 1974). As the Barisal structural high is
buried below a thick sediment cover, its exact
magnitude is not known; according to Matin et al.(1986) its dimension does not exceed that of a
local fold. But the wavelength of its associated
gravity “high’ however suggests otherwise. Our
gravity model infers that a corresponding upward
bulge by about 400-500 m at the base of the
oceanic crust is required to explain the amplitude
of the gravity high.
Focal mechanism solutions for earthquake
events 26-28 originating under the Tripura fold-
belt (see above) suggest E-W compression, where
faulting presumably occurs in a N-S direction.
This is in accordance with the mapped faults and
axial trend of the FMB. Sediments with an aver-
age thickness of 8-10 km are present for at least
50-60 km east of the gravity ~~rnurn below the
forearc basin (the western trough belonging to CB
molasse basin in Fig. 8) east of the FMB; the
basin appears to have an asymmetric shape, its
maximum sediment thickness of 15 km overlies
the area where the Burma plate is deflected down-
wards in the vicinity of the inclined seismic zone.These sediments together with the underlying crust
8/8/2019 Deep Structures and Tectonics of Burmese Arc 1988
http://slidepdf.com/reader/full/deep-structures-and-tectonics-of-burmese-arc-1988 22/24
of the Burma plate are seemingly thrust over the
layers of the descending Indian plate through an
efficient decoupling. Whether the decoupling is
accomplished by a decollement plane or by im-
bricate thrusting at the juncture of the two plates
it difficult to determine on the basis of gravity
data alone (see, for instance, McCaffrey and
Nabelek. 1984 on gravity modeling for Sunda arc).
This is more difficult since the gravity map availa-
ble to us shows only the broad nature of gravity
anomalies; detailed gravity coverage plus seismic
control are essential for this critical region. The
gravity model (Fig. S), however, illustrates that the
Cretaceous flysch and other sediment stratas of
the FMB continue subsurfacially for some dis-
tance eastward below the forearc basin as a resultof underth~sting manifested by the EBT and its
subparallel thrusts/faults. The EBT, over most
parts of the FMB, denotes outcrops of
serpentinized peridotites with associated gabbros,
ophiolites and volcanic rocks of Late Cretace-
ous-Eocene age (Chhibber, 1934a, p. 329-335;
Bender, 1983; Fig. 2). Many of these masses are
definitely dismembered suites or exotic blocks
moved to their present position (cf. Chhibber,
1934a; B~nnschw~iler, 1974: Nandy, 1982). The
gravity model shows a possible mechanism of
overthrusting of the Burma plate over the east-di-
pping Indian plate at the juncture between the
FMB and CB. It is tempting to correlate the EBT
and its associated ophiolites or other volcanic
rocks with this process of westward overthrusting,
but our gravity data control is too meagre to draw
specific conclusions. For the CB molasse basin
east of the EBT, Brunnschweiler (1974) has al-
ready noted that its underlying Paleozoic and
crystalline basement are also strongly folded,
thrusted and metamorphosed. Sediments of the
forearc basin (including the molasse, flysch, shale
and limestone) were mainly folded during mid-
Eocene to Oligocene times but movements also
occurred in mid- to end-Pliocene; the main folds
are inclined 20-40° eastwards and their axial
surfaces parallel the trend of the Burmese orogen.
Along the eastern flank of profile II’, the Shan
plateau crust is considered to be 32 km thick,
corresponding to its elevation. This crust is con-sidered to be the normal continental type that also
extends below the Burmese plains westward though
it may be considerably thinner there. This thin-
ning possibly occurs in a seismically active crustai
zone below the eastern trough of the CB as stated
above. The eastern trough is assumed to contain
only 2 km sediments of density 2.4 g cm ‘” At the
far eastern end of the profile. the discrepancy
between the computed and observed anomalies
may be attributed to the Paleozoic sediments laid
down over the Shan plateau whose effects were
not considered in the present model.
Acknowledgements
We are thankful to Shri DR. Nandy for helpful
discussions. Shri N. Karmakar drafted the figures.We thank Shri L.V. Ramana for assistance in
computer modeling of gravity data.
References
Bender, F., 1983. Geology of Burma. Bomtrager, Berlin, 293
PP-
Brune, J.N. and Singh, D.D., 1986. Continent-li ke crustat
thickness beneath the Bay of Bengal sediments. Bull. Seis-
mol. Sot. Am., 76: 191-203.
B~nnschweiler, R.O., 1966. G n the geology of the fndobur-man ranges. J. Geol. Sot. Aust., 13: 137-194.
Brunnschweiler, R.O., 1974. Indoburman ranges. In: A.M.
Spencer (Editor), Mesozoic-Cenozoic Orogenic Belts. Spec.
Publ. Geol. Sot. London, 4: 279-299.
Burke, K. and Dewey, J.F.. 1973. Plume-generated triple junc-
tions: Key indicators in applying plate tectonics to old
rocks. J. Geol., 81: 406-433.
Chandra, U., 1975. Seismicity, earthquake mechanisms and
tectonics of Burma, 20°N-28ON. Geophys. J.R. Astron.
Sot., 40: 367-381.
Chandra, U., 1978. S eismicity, earthquake mechanisms and
tectonics along the Himalayan mountain range and vicin-
ity. Phys. Earth Planet. Inter., 16: 109-131.
Chhibber, H.L., 1934a. G eology of Burma. MacMil lan, London,
538 pp.
Chhibber, H.L., 1934b . Mineral Resources of Burma. MacMil -
lan, London, 320 pp.
Choudhury, S.K. and Datta, A.N., 1973. Bouguer gravity and
its geological evaluation in the western part of the Bengal
basin and adjoining area, India. Geophysics, 38: 691-700.
Curray, J.R., Moore, D.G., Lawyer, L.A., Emmel, F.J., Rai tt,
R.W., Henry, M. and Kieckhef er, R., 1979. Tectonics of the
Andaman Sea and Burma. Am. Assoc. Pet. Geoi., Mem.,
29: 189-198.
Curray, J.R., Emmel, F.J., Moore, D.G. and Raitt, R.W., 1982.
Structure, tectonics, and geological hi story of the northeast-

8/8/2019 Deep Structures and Tectonics of Burmese Arc 1988
http://slidepdf.com/reader/full/deep-structures-and-tectonics-of-burmese-arc-1988 23/24
321
em Indian Gcean. In: A.E.M. Naim and F.G. Stehli (Edi-
tors), The Ckean Basins and Margins, Vol. 6. Plenum, New
York, N.Y., pp. 399-450.
Dehlinger, P., 1978. Marine Gravity. Elsevier, Amsterdam, 322
PP.
Evans, P., 1964. The tectonic framework of Assam. J. Geol.
Sot. India, 5: 80-96.
Evans, P. and Crompton, W., 1946. Geological factors in
gravity interpretation by evidence from India and Burma.
Q. J. Geol. Sot. London, 102: 211-249.
Fitch, T.J., 1970. Earthquake mechanisms in the Himalayan,
Burmese, and Andaman regions and continental tectonics
in central Asia. J. Geophys. Res., 75: 2699-2709.
Fitch, T.J., 1972. Plate convergence, transcurrent faults, and
internal deformation adjacent to southeast Asia and the
Western Pacific. J. Geophys. Res., 77: 44324460.
Gansser, A., 1964. Geology of the Himalayas. Interscience,
New York, N.Y., 289 pp.
Grow, J.A., 1973. Crustal and upper mantle structure of the
central Aleutian arc. Geol. See. Am. Bull., 84: 2169-2192.
Grow, J.A. and Bowin, C.O., 1975. Evidence for high-density
crust and mantle beneath the Chile trench due to descend-
ing lithosphere. J. Geophys. Res., 80: 1449-1458.
Gulatee, B.L., 1956. Gravity data in India. Surv. India, Tech.
Pap., 10: 195.
Gupta, H.K. 1976. Seismological investigations and the tecton-
ics of the Kashmir-Hindukush-Pamir region. Atti. Acad.
Naz. Lincei, Roma, 21: 43-66.
Johnson, B.D., Powell, C. McA. and Veevers, J.J., 1976.
Spreading history of the eastern Indian Ocean and Greater
India’s northward flight from Antarctica and Australia.
Geol. Sot. Am. Bull., 87: 1560-1566.
Kawakatsu, H., 1985. Double seismic zone in Tonga. Nature,
316: 53-55.
Khattri, K.N., Rogers, A.M., Perkins, D.M. and Algermissen,
S.T., 1984. A seismic hazard map of India and adjacent
areas. Tectonophysics, 108: 93-134.
Le Dain, A.Y., Tapponnier, P. and Molnar, P., 1984. Active
faulting and tectonics of Burma and surrounding regions. J.
Geophys. Res., 89: 453-472.
Lerch, F.J., KIosko, S.M., Laubscher, R.E. and Wagner, C.A.,
1979. Gravity model improvement using Geos 3 (GEM 9
and 10). J. Geophys. Res., 84: 3897-3916.Matin, M.A., Fariduddin, M.M.T., Khan, M.A.M., Boul, M.A.
and Kononov, A.I., 1986. New concepts on the tectonic
zonation of Bengal foredeep. Offshore SE Asia Conf., 6th,
1986, Singapore, pp. 51-54.
McCaffrey, R. and Nabelek, J., 1984. The geometry of back arc
thrusting along the eastern Sunda arc, Indonesia: Con-
straints from earthquake and gravity data. J. Geophys.
Res., 89: 6171-6179.
Mitchell, A.H.G. and McKerrow, W.S., 1975. Analogous
evolution of the Burma orogen and the Scottish
Caledonides. Geol. Sot. Am. Bull., 86: 305-315.
Morgan, J.P. and McIntyre, W.G., 1959. Quatemary geologyof the Bengal basin. Geol. Sot. Am. Bull., 70: 319-342.
Mukhopadhyay, M., 1984. Seismotectonics of subduction and
back-arc rifting under the Andaman Sea. Tectonophysics,
108: 229-239.
Mukhopadhyay, M., Verma, R.K. and Ashraf, M.H., 1986.
Gravity field and structures of the Rajmahal hills: Example
of the Paleo-Mesozoic continental margin in eastern India.
Tectonophysics, 131: 353-367.
Nandy, D.R., 1980. Tectonic patterns in northeastern India.
Indian J. Earth Sci., 7: 103-107.
Nandy, D.R., 1982. Geological set-up of the eastern Himalaya
and the Patkoi-Naga-Arakan Yoma (Indo-Burma@ hill
ranges in relation to the Indian plate movement. Geol.
Surv. India, Misc. Publ., 41: 205-213.
Rao, M.B.R., 1973. The subsurface geology of Indo-Gangetic
plains. J. Geol. Sot. India, 14: 217-242.
R&ma, A.R., 1958. (i, A)-Curves for bodily seismic waves of
any focal depth. Verhand. 54, Lemb. Meteor. Geof.,
Djakarta, 1958.
Sacks, I.S., Linde, A.T., Rodriguez, A.B. and Snoke, J.A., 1978.
Shallow seismicity in subduction zones. Geophys. Res. Lett.,
5: 901-903.
Salt, C.A., Alam, M.M. and Hossain, M.M., 1986. Bengal
basin: Current exploration of the hinge zone area of
southwestern Bangladesh. Offshore SE Asia Conf., 6th..
1986, Singapore, pp. 55-67.
Santo, T., 1969. On the characteristic seismicity in south Asia
from Hindukush to Burma. Bull. Inter. Inst. Seismol.
Earthquake Eng., 6: 81-93.
Searle, D.L. and Haq, B.T., 1964. The Mogok belt of Burma
and its relationship to the Himalayan orogeny. Rep. Int.
Geol. Congr., 22nd, New Delhi, XI: 132-161.
Sengupta, S., 1966. Geological and geophysical studies in west-
em part of Bengal basin, India. Am. Assoc. Pet. Geol.,
Bull., 50: 1001-1017.
Talukdar, S.N., 1982. Geology and hydrocarbon prospects of
east coast basins of India and their relationship to evolu-
tion of the Bay of Bengal. Offshore SE Asia Conf., 82,
1982, Singapore, Expl. I-General Sess. pp. l-8.
Tapponnier, P., Peltzer, G., Le Dam, A.Y., Armijo, R. and
Cobbold, P., 1982. Propagating extrusion tectonics in Asia:
new insights from simple experiments with plasticine. Geol-
ogy, 10: 611-616.
Tiwari, S., 1983. The problem of Calcutta gravity high and its
solution. Bull. Oil. Nat. Gas Comm., India, 20: 47-61.
Verma, R.K. and Mukhopadhyay, M., 1976. Tectonic signifi-
cance of anomaly-elevation relationships in northeastern
India. Tectonophysics, 34: 117-133.
Verma, R.K. and Mukhopadhyay, M., 1977. An analysis of the
gravity field in northeastern India. Tectonophysics 42:
283-317.
Verma, R.K., Mukhopadhyay, M. and Ahluwalia, M.S., 1976.
Earthquake mechanisms and tectonic features of northern
Burma. Tectonophysics, 32: 387-399.
Watts, A.B. and Talwani, M., 1974. Gravity anomalies seaward
of deep-sea trenches and their tectonic implications. Geo-phys. J. R. Astron. Sot., 36: 57-90.

8/8/2019 Deep Structures and Tectonics of Burmese Arc 1988
http://slidepdf.com/reader/full/deep-structures-and-tectonics-of-burmese-arc-1988 24/24
Yamashina, K., Sbimazaki, K. and Kato, T., 1978. Aseismic lions for minerals in the northern part of Bangladesh
belt along the frontal arc and plate subduction in Japan. J. Seminar Vol. Pet. Miner. Resow. of Bangladesh. X 12 Oct.
Phys. Earth. Tokyo, 26: S 447-S 458. 1980. Ministry of Petrol. Mineral Resources Bangladesh.
Zaher, M.A. and Rahman, A., 1980. Prospects and investiga- Dacca, pp. 9- 1 X.


