Download - Defense Porftolio Analysis

Journal of Computations & Modelling, vol.4, no.1, 2014, 327-347
ISSN: 1792-7625 (print), 1792-8850 (online)
Scienpress Ltd, 2014
Defense Porftolio Analysis
Lazaros Sidiropoulos 1, Alexia Sidiropoulou
2, and Sotirios Lalagas
3
Abstract.
This is a Portfolio Management Analysis assessment, the focus of which is to
identify and assess current Commercial Off-the-Shelf (COTS) Portfolio Analysis (PA)
software products and solutions—with attention to market positioning, market share,
product features, and other features. Two products (Risk Simulator and Palisades
@Risk) were used to develop Portfolio Models ([1]). These models were populated
with relevant data, and then run through an appropriate number of simulation
iterations to assess candidate projects with respect to risk and Expected Military
Value (EMV).
This document discusses Portfolio Management Analysis (PMA) during
various stages of project management and system engineering. The goal for Portfolio
Management Analysis is realized after the entire project design infrastructure is
implemented from agency heads to managers, and the end users instruments are
provided for implementation.
The results of this analysis will be synthesized, documented and
recommended to Defense military organizations, and agency heads for
consideration. The intent is to identify approaches and tools to incorporate PMA
net-centric strategies to meet war fighter and business operations requirements,
while continuing to maintain current levels of service, ensuring conservation
of manpower and meeting infrastructure resource requirements.
Keywords: Defense portfolio analysis, decision-support process, resource allocation.
1 4 Filomilas str., 54351 Toumpa, Thessaloniki, Greece
E-mail: [email protected]
2 4 Eirinis str., Saint Pavlos, 55438 Thessaloniki, Greece
E-mail: [email protected]
3 5 Serron str., 54454 Toumpa, Thessaloniki, Greece
E-mail: [email protected]

328 Defense Portfolio Analysis
1. Introduction
This study defines and describes Portfolio Analysis (PA); where it started,
what it measures, how other industries are utilizing it, why it is important today, and
what the Department of Defense (DoD) is doing and planning for the future.
Modern Portfolio Theory was introduced by Harry Markowitz with his paper
“Portfolio Selection,” which appeared in the Journal of Finance (1952). He
demonstrated that a portfolio of individual securities composed of consistently good
risk- reward characteristics (e.g., stocks of all rail companies), could well be
foolish. He detailed the mathematics of diversification, which focused on selecting
portfolios based on their overall risk-reward characteristics. He felt that investors
should create portfolios of dissimilar securities rather than purchase and hold only
individual securities (e.g., only shares of IBM). Portfolio theory provides a broad
context for understanding the interactions of systematic and non-systematic risk
and reward.
Portfolio Analysis (PA) is the art and science of allocating scarce
resources to satisfy strategic objectives, or determining how to best spend limited
dollars ([1]). PA also provides tools for organizing and managing a set of projects in
a portfolio of projects to meet its goal ([4]). Portfolio Management begins with an
enterprise-level identification and definition of market opportunities and then
prioritization of those opportunities within resource constraints ([20], p. 9). A set of
projects tracked across the entire portfolio in a timely and effective manner helps
senior leadership make sound decisions, data-based decisions supported by
analysis of cost, schedule and performance risks ([1]). These future projects will
have a National strategic impact as situations and partners change. The ability of
senior leadership to adjust portfolios to meet Defense needs now and in the future is
critical.
Portfolio Analysis (PA) is used by businesses to measure everything from
money to performance. In the finance industry, it is used to measure the strength of a
group of investments to make appropriate tradeoffs of expected return on investment
and risk. Using the Markowitz Efficient Frontier ([23]), a ratio of the expected return
for each asset, the standard deviation of each asset’s logarithmic relative returns
(measure of risk), and the correlation matrix between these assets, sets of

L. Sidiropoulos, A. Sidiropoulou and S. Lalagas 329
portfolios with expected returns greater than any other with the same or lesser risk,
and lesser risk than any other with the same or greater return could be identified
(MVO, 2009). In the Information Technology (IT) sector, PA is used to manage
priorities for resource allocation. Based on limited resources (budget), which projects
should we keep while increasing profits and which are failing to perform and losing
money? Whatever is being measured during the analysis, it is a key factor in the
success or failure of the business. Companies commonly use Net Present Value
(NPV) analysis, which can show, in today’s dollars, the relative cash flow of
various alternatives over a long period of time ([20], p. 15).
In general, successful companies take a disciplined approach to prioritizing
needs and initiating a balanced mix of executable development programs ([20], p
7). hey begin with an enterprise level approach to identifying market opportunities and
then prioritize them based on strategic goals, resources available, and risk. The
market opportunities with the greatest potential to succeed are included in the
portfolio.
But, what is the DoD currently doing? The DoD is using individual
program managers to manage specific programs/systems, without regard to the
overall strategic goal of the U.S. Each program is its own entity, with little or no
interaction with other programs and program managers are not held responsible for
minimizing the risks associated with their particular programs. The DoD’s
service-centric structure and fragmented decision-making processes are at odds
with the integrated, portfolio management approach used by successful
commercial companies to make enterprise- level investment decisions ([20], p 18).
In 2004, the Defense Finance and Accounting Service (DFAS)
implemented portfolio management in an effort to help prioritize initiatives and
more closely link budget to agency strategy, while answering a presidential call for
improving financial management. In doing this, they developed an approach
which not only governs technology investments but includes all high-value
initiatives ($250,000 or more). As a decision-making tool, Portfolio Management
requires essential data about all initiatives o be entered into a central database and
requires those initiatives to be scored against basic criteria and risk (decision
analysis). Portfolio Management treats existing and new initiatives as assets to be
managed instead of costs. The process is dynamic and iterative so that the Portfolio

330 Defense Portfolio Analysis
reflects changing agency goals and priorities. The key to assessing portfolio
effectiveness is measuring the right things. Because of the importance of
performance measures in completing the portfolio requirements, it is crucial for DFAS
to agree on the appropriate measures early in the Portfolio Management process.
Each initiative receives a weighted score on three dimensions: Mission, Financial and
Benefits, and Risk ([20], p 21).
In the U.S. Military context, risk analysis, real options analysis, and portfolio
optimization techniques are enablers of a new way of approaching the problems of
estimating ROI and the risk-value of various strategic real options ([26], p. 1). This
analysis can be performed by running various risk modelling programs including,
Monte Carlo Simulations, Stochastic Forecasting, Real Options Analysis (ROA),
and Portfolio Optimization using Knowledge Value Added (KVA). These
methodologies help in making the best possible decisions, allocating budgets, predicting
outcomes, creating portfolios with the highest strategic value and ROI, and so
forth, where the conditions surrounding these decisions are risky or uncertain ([11];
[26], p 2).
What are these modelling programs? Monte Carlo methods are a class
of computational algorithms that rely on repeated random sampling to compute their
results. Monte Carlo methods are often used when simulating physical and
mathematical systems. Because of their reliance on repeated computation and
random or pseudorandom numbers, Monte Carlo methods are most suited to
calculation by a computer. Monte Carlo methods are useful for modelling phenomena
with significant uncertainty in inputs, such as the calculation of risk in business. In
Stochastic Forecasting, the objective is to minimize a given cost function that
depends on a large number of discrete or continuous variables. ROA applies
financial options valuation techniques to real physical assets and capital budgeting
decisions ([4]). ROA itself is the right, but not the obligation, to undertake some
business decision; typically the option to make, or abandon, a capital investment
([17]). PA provides decision makers with an efficient set of portfolios, based on
minimizing risk subject to a particular return ([31]). Risk modelling refers to the
use of formal econometric techniques to determine the aggregate risk in a
financial portfolio. Risk modelling is one of many subtasks within the broader area
of financial modelling. Risk modelling uses a variety of techniques including market
L. Sidiropoulos, A. Sidiropoulou and S. Lalagas 331
risk, VaR, Historical Simulation, or Extreme Value Theory in order to analyze a
portfolio and make forecasts of the likely losses that would be incurred for a
variety of risks. Such risks are typically grouped into credit risk, liquidity risk,
interest rate risk, and operational risk categories ([17]).
As part of the project background, we must include a short discussion about
risk. So what is risk? Risk is any uncertainty that affects a system in an unknown
fashion and its ramifications are unknown, but it brings great fluctuation in the
value and outcome.
We have talked about both PA and portfolio management a great deal up to
this point. To clarify, this paper focuses on PA, but in doing so, we must also
discuss portfolio management. There are similarities, such that in both portfolio
(decision) analysis and portfolio management one must analyze and practice risk
management. PA, using the Markowitz Efficient Frontier ([23]) optimization
approach, provides decision makers with an efficient set of portfolios based on
minimizing risk subject to a particular return.
Portfolio Management provides guidance as to what level of risk-taking is
appropriate. PA alone does not provide managerial guidance about which efficient
portfolio is best for the organization. Combining PA and portfolio management can
improve the overall decision process, and could ultimately improve organizational
performance ([31]).
2 System Engineering
2.1. Requirements
2.1.2 Objectives
System Engineering (SE) begins with the capture of requirements. For this
research project, several sources were used to establish requirements. In
understanding the requirements provided from different organizations, it is necessary
to understand how each organization defines PA. The Project Management Institute
defines:

332 Defense Portfolio Analysis
Portfolio as “a collection of projects and programs and other work that are
grouped together to facilitate effective management of that work to meet strategic
business objectives. The projects or programs of the portfolio may not necessarily be
interdependent or directly related.”
Portfolio Management (PfM) as “The centralized management of one or
more portfolios, which includes identifying, prioritizing, authorizing,
managing, and controlling projects, programs and other related work to achieve
specific strategic business objectives.”
PfM, in the context of this research paper, views each program investment
from an enterprise level as contributing to the collective whole, rather than an
independent and unrelated program investment. With this enterprise perspective,
Portfolio Managers can effectively:
a. Identify and prioritize opportunities, and
b. Apply available resources to potential products to select the best mix
of products to exploit the highest-priority and/or most
promising— opportunities ([20]).
This type of approach depends on strong enterprise governance with
committed leadership; it also depends on information tools which provide the ability
to visualize complex data relationships in a comprehensible manner.
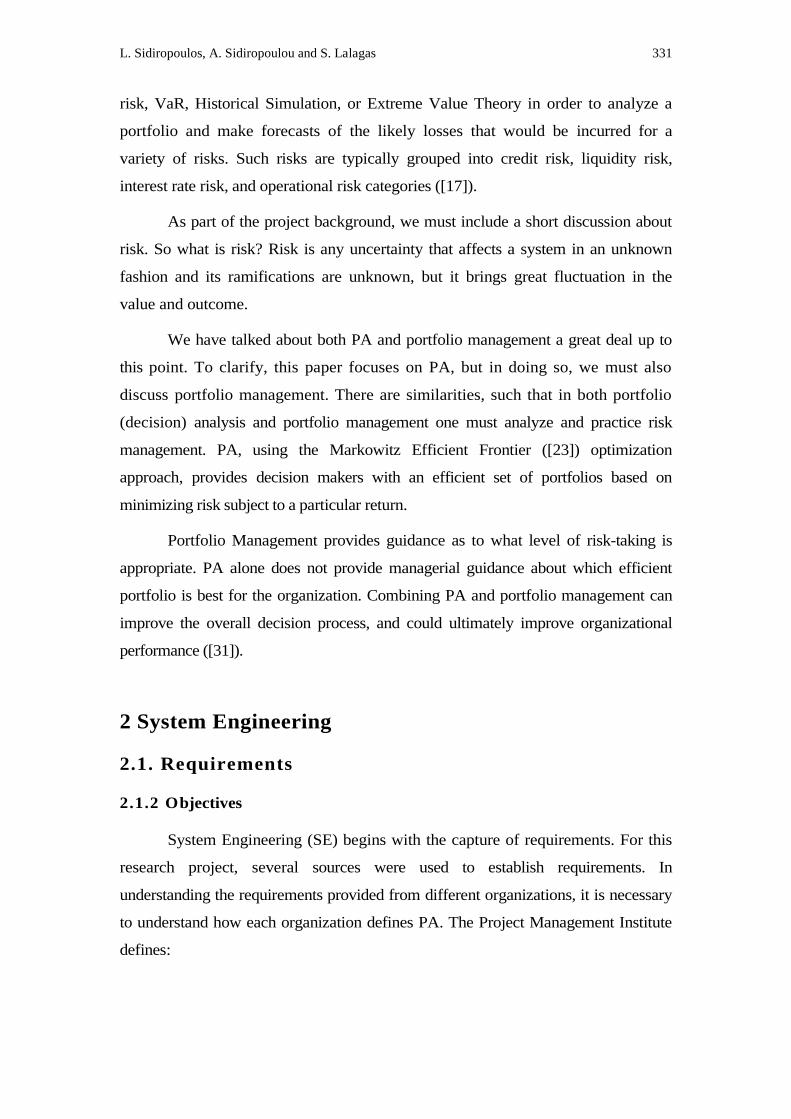
A PfM approach begins with an enterprise-level framework and
definition of market opportunities and then the prioritization of those opportunities
within resource constraints. At each review gate, programs are assessed against
available resources, established criteria, competing programs, and the goals and
objectives of the DoD as a whole. As alternatives pass through each review gate,
the number is expected to decrease, until only those alternatives with the greatest
potential to succeed make it into the product portfolio ([20], Figure 1).
L. Sidiropoulos, A. Sidiropoulou and S. Lalagas 333
Figure 1. PfM Approach to Product Investments
In support of the framework identified as a best practice by the GAO
([20]), a fundamental premise of this paper is the need to identify COTS systems that
can provide the capabilities identified in the Requirements section.
This project analyzes applicable PA tools, systems and underlying
methodologies in terms of relevancy to identification of viable requirements and
technical alternatives.
2.1.2 Scope
This research project encompasses PA pertaining to the DoD, as identified
in the requirements provided, both explicit and derived. Some interpretation of
requirements is needed as requirements are decomposed into functional
capabilities. These interpretations, in terms of this paper, have not been
presented to, nor vetted with the authors and agencies that provided the top-level
requirements. The research scope fully explores the applicability of PA systems,
vis-a-vis the requirements, using a System Engineering approach.

334 Defense Portfolio Analysis
2.1.3 Identified Needs and Best Practices
This section begins to address the research questions in terms of
performance, functional requirements, and system requirements. As outlined
in the Project Methodology, a Literature Review was conducted to examine the
current PA landscape from a requirements perspective..
2.1.4 Capability Requirements
The Cost of Capability Concept must also be considered, but may be
viewed as a pre-expenditure, or constant plus a fixed fee for changes. The
capability concept document is pre-portfolio selection, and assembly of capabilities as
portfolios to meet the mission need should be based on this concept document.
Inflation over time is a constant for any capability selection from the portfolios and is
not considered a major factor in selection.
2.2 Analysis
2.2.1 Portfolio Capability Evaluation
From the DoD acquisition perspective, capabilities to meet
identified requirements that satisfy mission gaps in execution of military strategies
are tied to cost, schedule, and performance. In turn then, it is logical to view
portfolios in a manner that optimizes these values. Let us consider that, for an
optimum identified capability requirement, the following is true, regardless of
whether it is from existing legacy, evolutionary, or new development (Figure 2):
Figure 2. Capabilities Equation ([1])

L. Sidiropoulos, A. Sidiropoulou and S. Lalagas 335
The summation of sub-folders in a notional capability portfolio will result
in a final capability that matches the DoD mission gap requirement, is better
than the requirement, or is somewhat less than the requirement, but is good enough
to serve as an interim solution (a lower threshold must be established to know
when a sub-folder must be discarded as not useful). In turn, each of the pieces
of this notional capability (let us call them $K or notional constant dollars for
the baseline) portfolio may be further decomposed such that (Figure 3):
Figure 3. Summation of Capabilities ([1])
As shown above, changes (or the +/- deltas) to the notional baseline
capability result in increases/decreases for cost, schedule and/or performance. At
the enterprise level, then, these parameters may be used to graphically show
advantages and disadvantages for various options within each of the portfolio
sub-folders (we will examine the individual parameters graphically later on). This
same rationale may be used for evaluating schedule and performance. When
numerical values are assigned, portfolios of capabilities and their components may
be evaluated to select those most favourable within cost, schedule and performance
desired to meet the capability gap. Note that risk is not an issue in capability
parameter selection at this point. Risk is an integral part of sub-folder or technology
evaluation that may make a specific capability option within the portfolio infeasible.
Risk may be evaluated at each enterprise level calculation and at each subsequent

336 Defense Portfolio Analysis
parent-child decomposition, such that risk is always a consideration
throughout the selection process.
Evaluation of the portfolio must also consider the desired timeframe for
fielding the capability. If technologies or equipment within the selected sub-folders
have low probability of reaching the fielding date, they must be shelved until they
are mature enough for consideration. Schedules for the selected comparison
parameters must use arbitrary weighted earned values. Depending upon the
capability requirement, there are several types of scheduling software products
that may be used. Regardless of the scheduling tool, as long as it is consistent, a
reasonable comparison may be made between portfolio sub-folders that meet
notional Earned Value Management System and Integrated Defense Acquisition,
Technology, and Logistics management framework milestone and alternative
decision point requirements.
Although the capability performance may be measured by several criteria, it
may be best measured via established criteria, as set forth in a Technology
Readiness Assessment and/or Manufacturing Readiness Assessment. These
criteria are well- recognized throughout the DoD and other government activities.
Because of the expandable nature of the requirements for each level of
performance, each of the parameters for evaluating a sub-folder within the
portfolio may be tailored to fit the criteria of technology and manufacturing
readiness. When compared with one another, using the same criteria, selection of the
most promising sub-folders for the capability can be accomplished.
Because sub-folders consider existing, evolutionary, and new developments,
use of this method allows the evaluator to be able to inject capabilities into the
performance versus time chart at the current level and select those that may be more
mature and, therefore, have the best chance of success, all other weighted factors
being near equal. The evaluator must be attuned to the pitfalls of selecting mature
technologies, even though they meet a current need, which cannot evolve and
remain interoperable with other capabilities in the battle space in the out years.

L. Sidiropoulos, A. Sidiropoulou and S. Lalagas 337
2.2.2 Threat Environments (Based on the 2008 National Defense
Strategy (NDS)
Today’s current environmental threat is: Global struggle against violent
extremist ideology seeking to overturn the international state
system, asymmetrical/irregular warfare.
2.2.3 Gartner Group’s COTS PA Product Landscape
Applications for project, portfolio and resource management boost
team performance and enable IT management and others to access real-time
data via dashboards for prioritization and quick decision making.
2.2.4 Forrester Research COTS PA Product Landscape
The Forrester WaveTM Project Portfolio Management Tools, Q4 2007
report established CA as the PPM leader in 2007, according to an article
published 18 December 2007, by Mr. Lewis Cardin et al. (p. 8). Forrester evaluated
fourteen leading PPM vendors across ninety-five criteria and found that CA and
Planview established PPM leadership within the field thanks to their wide choice
of mature features and functions. Forrester’s COTS PA product research uncovered
a market environment in which:
CA, Planview, HP, Primavera, and IBM lead the pack
Compuware, Oracle, Serena, and Microsoft offer competitive options
SAP and Daptiv lack the expected full suite of out-of-the-box
offerings
This evaluation of the COTS PPM Suite market is intended to be a starting
point only. Readers are encouraged to view detailed product evaluations and adapt the
criteria weightings to suit their individual needs through the ForresterTM
Wave
Excel-based vendor comparison tool.
2.2.5 Real Options Valuation’s Risk Simulator
Real Options Valuation’s Risk Simulator software package will help to
identify, quantify, and evaluate risk in projects and decisions. Risk Simulator, a

338 Defense Portfolio Analysis
powerful Excel add-in application, is used for applying simulation, forecasting,
statistical analysis, and optimization in existing Excel spreadsheet models. It
contains four different modules: Monte Carlo Simulation, Optimization, Statistical
and Analytical tools, Time Series and Cross-Sectional forecasting. Risk simulator is
also integrated with the Real Options Super Lattice Solver software, for solving
strategic real options, financial options, and employee stock options.
2.2.6 Palisade @RISK (http://www.palisade.com/)
Palisade @RISK performs risk analysis using Monte Carlo simulation to
show you many possible outcomes using Microsoft Excel spreadsheets, and tells
you how likely outcomes are to occur. You can then decide which risks are worth
taking and which ones to avoid, allowing for improved decision making under
uncertainty. @RISK uses simulation to answer questions like:
a. “What is the probability of profit exceeding $10 million?”
b. “What are the chances of losing money on this venture?”
c. “What is the probability that the project will be delivered within
budget?”
d. “How much contingency (management reserve) should be
included?”
@RISK is an add-in to Microsoft Excel, integrating completely with
the spreadsheet. All @RISK functions are Excel functions, and behave exactly the
same as native Excel functions. @RISK windows are all linked directly to cells
in your spreadsheet, so changes in one place are carried over to the other. @RISK
graphs point to their cells via callout windows.
2.2.7 Shortcomings of COTS Products
The drive to incorporate COTS software and hardware is often based
on incomplete or inaccurate information. Clearly identified requirements that
cannot incorporate COTS software and hardware need additional research,
cost, and development within their product design. However, using PPM COTS
products does offer many advantages and disadvantages. For instance, many of

L. Sidiropoulos, A. Sidiropoulou and S. Lalagas 339
these shortcomings are described by engineers who are reluctant to move to COTS, if
for no other reason than a general resistance to change. Many engineers display the
attitude “if we did not make it; the product design is no good.” It is basically that
type of mentality that promotes a general distrust of COTS products.
a. Advantages of COTS
The advantages associated with the use of COTS are:
Immediately available and shorter development
schedule
Re d uc e d c os t
Increased portabil i ty
Improved Quality (resulting from more efficient
testing)
b. Disadvantages of COTS
The disadvantages associated with the use of COTS are:
Hard to meet special requirements
Continual investment in COTS product
Bad interoperability .
2.3 Model Development
2.3.1 Model Data
Using the basic data depicted in Figure 33 below, our research team attempted to
develop a model in (1) Real Options Valuation’s Risk Simulator and (2) @RISK that
would analyze the data and provide usable output as measures of EMV. We also
attempted to model this data with the Program Management (PM) software but were
unable to do so. The EMV measures for this model were developed by our team.
However, in practice, the EMV measures should be developed by Budget, Strategic, and
Acquisition professionals to ensure their accuracy.

340 Defense Portfolio Analysis
Figure 4. Base Evaluation Model ([1])
Earned Net Present Value is an enhancement of the NPV that explicitly
addresses uncertainty. NPV compares a single stream of cash flows in today’s
dollars to the value of that same dollar in the future. Cost is the actual cost
listed in the 2009 Defense Procurement Budget Request. Strategic Ranking,
Military Score, and Tactical Score are EMV measures developed by evaluating
the NDS and then scoring the programs based on how they meet the NDS. FTE
resources equates to the amount of actual resources used as a percent. One
hundred percent means that all resources are fully utilized all the time. The goal
is to maximize the portfolio returns without exceeding an arbitrary budget of
$10,500 while keeping the strategic ranking below 100 and the FTE below 80.
In evaluating this model, we plan to verify that PA and Defense budget
decision making can be improved using COTS software.
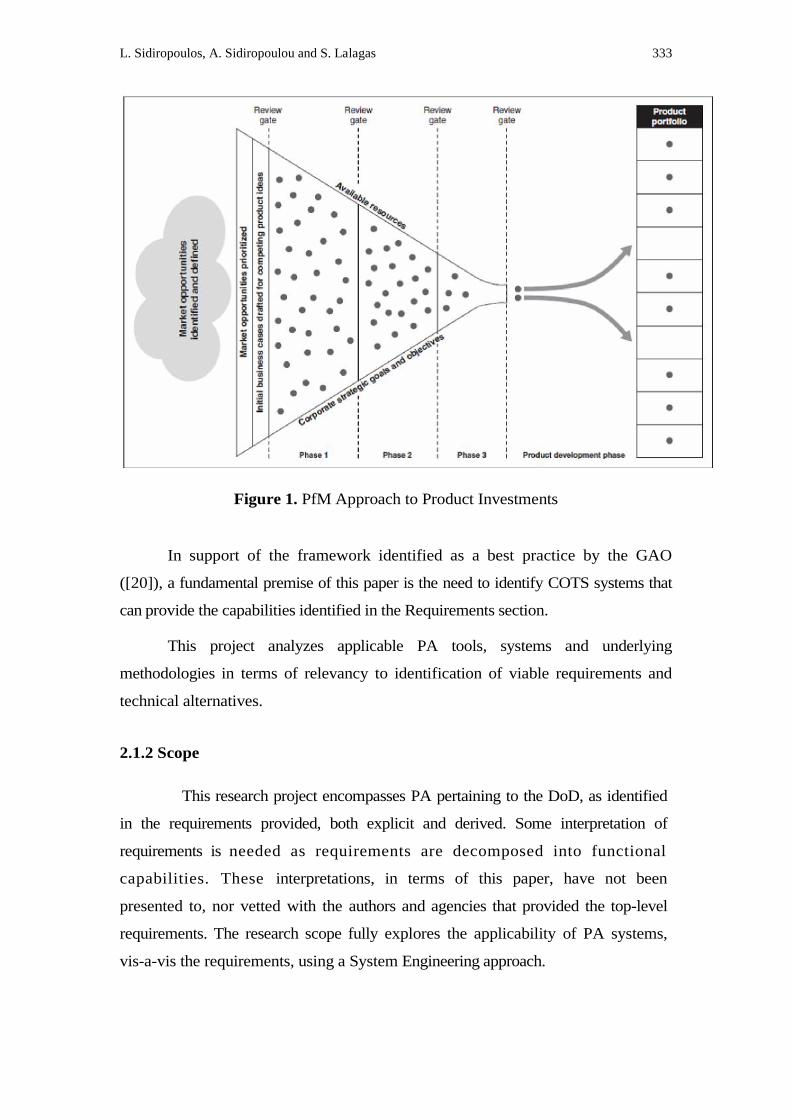
2.3.2 Real Options Valuation’s Risk Simulator
Figure 5 is the model developed using the Real Options Risk Simulator.
The task was to run an optimization/simulation to determine which ten of the
following twenty programs best meet the requirements outlined in the NDS.
Only ten programs will go forward. These are real programs in the FY 2009
L. Sidiropoulos, A. Sidiropoulou and S. Lalagas 341
budget with the real costs included. The names of the real programs will be
revealed later in the analysis section. The ranking and military/tactical scores,
along with the FTE resources, are based on the NDS and the President’s goals are
located: http://www.whitehouse.gov/agenda/defense/.
Because our thesis is based on PA, we will attempt to run this through
PPM programs as well as risk simulators. For the purpose of this model, the
military score, comprehensive score, and tactical score are all measures of EMV.
After running the discrete (static) optimization on this model with the
original budget of less than $10,500, and a strategy rank of less than 100, no
more than ten programs, and FTE resources not to exceed 80.
Figure 5. Real Programs in the FY09 Budget with Costs ([1])
2.3.3 Real Options Valuation’s Risk Simulator Data Analysis
The analysis of the risk simulator model shows, without a doubt, that there is
a definite efficient frontier in which there is a substantial ROI limit in the profile
used in this model. As shown in Figure 6 below, from $9,500 to $10,500 there is
actually a decrease in the ROI maximization objective. From $10,500 to $12,500
there is a substantial increase in the EMV and ROI objectives with a rapid slow
down in ROI above that threshold. Note that by increasing the budget by $2,000
and allowing for additional programs, decision makers are given the “opportunity” to

342 Defense Portfolio Analysis
increase the Defense capabilities outlined in the NDS. This “opportunity” is one of the
options available to Defense decision makers. The option does not have to be
exercised, but it is available if needs dictate and funding is available from Congress.
Other options include using eleven programs or thirteen programs, if funding
becomes available, or even using nine programs in the case of budget cuts. Note
that using nine programs provides an even better ROI than the baseline.
Figure 6. Efficient Frontier ROI from Baseline
This tells the decision makers in Washington that, based on the NDS, a budget of
$10,500 is not the most optimal to provide for our Defense needs. If more funding
were allotted, the most optimal solution, based on strategic value, would be a
budget of $12,500 and twelve programs. Anything more would be a waste of
taxpayers’ money by funding a low ROI, and anything less would decrease the value
of the Defense plan and make the budget less effective, while decreasing Defense
capabilities.
3. Conclusions
3.1 Comparing the Evaluation Model with Reality
After developing the evaluation model, running simulations, and performing data
analysis, the research team has concluded that Risk Simulator is a very capable
Microsoft Excel plug-in which can evaluate program risk, evaluate EMVs, and
optimize budgeting and programming constraints, all within the scope of the NDS.
This software also has hundreds of risk models built in, including the military model.
These models are easily modifiable to fit any number or programming requirements.
To verify this assessment, refer to Figure 7, the original model with the real program
names.

L. Sidiropoulos, A. Sidiropoulou and S. Lalagas 343
Figure 7. Evaluation Model with Real Program Names ([1])
3.2 Modeling Using Costs Products
Gartner and Forrester identified several PPM software suites which can be used
to develop and manage project models. However, these models do not offer
robust simulations which account for a range of probability distributions while
accounting for risk across model scenarios. These products excel at providing
graphical representations of complex data in the form of digital “dashboards,”
bubble-charts, and efficient frontiers. When used in conjunction with PA modelling
software, these PPM suites are excellent at helping to efficiently manage large
projects while helping to mitigate risk.
The authors of this paper found that the Real Options Valuation’s Risk
Simulator and @RISK were better suited for the research being conducted in
accordance with the intent of this research paper. Risk Simulator was by far the
superior product evaluated and provided hundreds of readymade models
including; Military models, Efficient Frontier Models, multiple simulations. These
modelling tools leverage the capabilities of Microsoft Excel and Monte-Carlo
simulation to develop a range of statistical probability distributions using an array of
variable inputs. This provides the ability to look at the best, worst and most likely
scenarios.

344 Defense Portfolio Analysis
3.3 Research Limitations
The authors found that the “boil the ocean” approach to evaluating products
was beyond the scope that was executable in a (1) distributed team environment (i.e.,
team not collocated), and (2) without a central laboratory environment with
configuration control of the products being evaluated. Additionally, it was difficult to
codify all the numerous requirements and variables from multiple sources. The
model was developed using only a few of the variables and requirements
identified in the present study. More complex models could be developed using
the work in this document as a starting point.
References
[1] A. Adams, E. Bala, B. Minner and T. Woodland: Defense Portfolio Analysis,
Joint Applied Project, NPS, Monterey California, 2009
[2] J. Bennett: Pentagon details new acquisition strategy: Focus shifts from systems
to capabilities, Defense News (28 April, 2008). Retrieved February 22, 2009,
from http://www.defensenews.com/story.php?i=3505424
[3] CA Clarity PPM: Make IT more efficient through best practice project execution,
resource optimization, and cost management, 2008. Retrieved February 22,
2009, from http://myclarity.com/project-portfolio-management-535.html
[4] J. H. Cable, J. F. Ordonez, G. Chintalapani and C. Plaisant: Portfolio theory;
project portfolio earned value management using tree maps, Proc. of Project
Management Institute Research Conference, 2004. Retrieved November 20,
2008, from http://riskglossary.com/link/portfolio theory.htm
[5] L. Cardin, A. Cullen, M. Cecere and T. De Gennaro: Project Portfolio
Management Tools “CA and Planview lead, With HP, IBM, and Primavera close
behind” report, 2007, Retrieved February 22, 2009, from
http://www.oracle.com/corporate/analyst/reports/ent apps/ppm/ppm-wave-
q407.pdf
[6] L. Cardin, A. Cullen, M. Cecere and T. De Gennaro: How Microsoft fared in
this evaluation “Microsoft Advances as a Leader in the PPmMarket” report, 2007,
L. Sidiropoulos, A. Sidiropoulou and S. Lalagas 345
Retrieved February 22, 2009, from
http://www.forrester.com/Research/Document/Excerpt/0,7211,44227,00.html
[7] L. Cardin, A. Cullen, M. Cecere and T. De Gennaro: How Planview fared in
this evaluation “Planview Is an Undeniable Leader in the PPM Market” report,
2007, Retrieved February 22, 2009, from
http://www.forrester.com/Research/Document/Excerpt/0,7211,44234,00.html
[8] L. Cardin, A. Cullen, M. Cecere and T. De Gennaro: How CA fared in this
evaluation “CA Leads in Many Offerings in the PPM Market” report 2007,
Retrieved February 22, 2009, from
http://www.forrester.com/Research/Document/Excerpt/0,7211,44258,00.html
[9] L. Cardin, A. Cullen, M. Cecere and T. De Gennaro: “Primavera Is a Leader in
the Large Enterprise PPM Market” report, 2007, Retrieved February 22, 2009,
from
http://www.forrester.com/Research/Document/Excerpt/0,7211,44263,00.html
[10] Chairman of the Joint Chiefs of Staff Instruction: Warfighting Mission
Area, 2007
a. Information Technology Portfolio Management and Net-Centric Data
Sharing, CJCSI 8410.01.
[11] J.P. Davis: Information Technology Portfolio Management and the
Real Options Method: Managing the risks of IT investments in the Department
of the Navy (DoN), 2003.
[12] Defense Acquisition University Logistics: 102 (LOG 102) course
curriculum, 2008.
[13] Department of Defense Directive 7450.20: Capability Portfolio
Management, DODD 7450.20, 2008.
[14] Department of Defense Directive: Information Technology Portfolio
Management, DODD 8115.01 (October 10, 2005).
[15] Department of Defense Instruction: Information Technology Portfolio
Management implementation, DODI 8115.02, 2006.
[16] Financial Risk Management, 2008, Retrieved January 15, 2009, from

346 Defense Portfolio Analysis
http://www.riskglossary.com/link/risk management.htm
[17] Fintor and other Contributors: Real options analysis., 2009 Retrieved
February 10, 2009, from http://en.wikipedia.org/w/index.php?title=Real options
analysis&oldid=2685 15594
[18] B. Flynn and J. Field: Transformation of analytical tools: using portfolio
analysis techniques in defense applications, 2006. Armed Forces Comptroller.
[19] Government Accountability Office (GAO): Assessing risks and returns: A
guide for evaluating federal agencies’ it investment decision-making,
(GAO/AIMD-10.1.13) Version 1, 1997
[20] Government Accounting Office (GAO): Best Practices: An Integrated
Portfolio Management Approach to Weapon System Investments Could Improve
DOD’s Acquisition Outcomes, GAO-07-3 88, Washington, D.C., 2007
[21] Government Accounting Office (GAO): Defense Acquisitions, DOD’s
Practices and Process for Multiyear Procurement Should Be Improved, GAO-
08-298, Washington, D.C., 2008
[22] B. Hubbard, B.: Portfolio Management at the Defense Finance and
Accounting Service: The right funding for the right projects, 2004, Armed
Forces Comptroller. Retrieved September 19, 2008, from
http://findarticles.com/p/articles/mi hb6527/is /ai n29 104597
[23] Mean-Variance Optimization (MVO): Markowitz portfolio Selection,
2009, Retrieved February 22, 2009, from
http://www.effisols.com/basics/MVO.htm
[24] Microsoft PPM. (2008). Retrieved January 22, 2009, from
http://www.microsoft.com/downloads/details.aspx?FamilyID=7cf44f2c-49d5-
4431- bd3e-a1 003 5ec 1 a3 9&DisplayLang=en
[25] J. Mun: Modeling risk: Applying Monte Carlo simulations, real options
analysis, forecasting, and optimization. 2nd
Ed. Wiley, 2006
[26] J. Mun and T. Housel: A primer on applying monte carlo simulation, real
options analysis, knowledge value added, forecasting, and portfolio
optimization, acquisitions [White Paper]. Naval Postgraduate School, 2006

L. Sidiropoulos, A. Sidiropoulou and S. Lalagas 347
[27] Plainview PPM.: Plan view Enterprise Tool for Forecasting Costs and
Monitoring Spending, 2008, Retrieved January 18, 2009, from
http://www.projectconnections.com/templates/newformat/portfolio-pmo-
mmp.html?gclid=CPGhmeip3 5gCFQNItAodMElGcg
[28] Primavera PPM., 2009, Retrieved February 22, 2009, from
http://www.primavera.com/products/p6/portfolio_man.asp
[29] RAND: Portfolio-Analysis Methods for Assessing Capability Options,
2008
[30] Value-at-Risk (VaR) Options, 2009, Retrieved February 22, 2009, from
http://www.riskglossary.com/link/value at risk.htm
[31] M. R. Walls: Combining Decision Analysis and Portfolio Management to
Improve Project Selection in the Exploration and Production Firm, Journal of
Petroleum Science and Engineering, 44(1-2)(2004), 55-65.


