
DELAWARE STATE LOTTERY An Enterprise Fund of the State of Delaware
COMPREHENSIVE ANNUAL FINANCIAL REPORT FOR THE YEARS ENDED JUNE 30, 2019 AND 2018

DELAWARE STATE LOTTERY An Enterprise Fund of the State of Delaware
COMPREHENSIVE ANNUAL FINANCIAL REPORT FOR THE YEARS ENDED JUNE 30, 2019 AND 2018
Prepared by:
The Finance and Accounting Department of the Lottery
Tina M. Leager
Senior Fiscal Administrative Officer
Delaware State Lottery

i
TABLE OF CONTENTS
INTRODUCTORY SECTION PAGE
LETTER OF TRANSMITTAL ........................................................................................ 2 PRINCIPAL OFFICIALS .............................................................................................. 18 ORGANIZATION CHART ........................................................................................... 19 CERTIFICATE OF ACHIEVEMENT FOR EXCELLENCE IN FINANCIAL REPORTING FOR FY 2018............................................................................ 20
FINANCIAL SECTION
REPORT OF INDEPENDENT AUDITOR ...................................................................... 22 MANAGEMENT’S DISCUSSION AND ANALYSIS ....................................................... 24 BASIC FINANCIAL STATEMENTS STATEMENTS OF NET POSITION AS OF JUNE 30, 2019 AND 2018 .................... 30 STATEMENTS OF REVENUE, EXPENSES AND CHANGES IN NET POSITION FOR THE YEARS ENDED JUNE 30, 2019 AND 2018 ............................................ .31 STATEMENTS OF CASH FLOWS FOR THE YEARS ENDED JUNE 30, 2019 AND 2018 .................................................................................. .32 NOTES TO FINANCIAL STATEMENTS, JUNE 30, 2019 and 2018 ........................ .33 REQUIRED SUPPLEMENTARY INFORMATION ........................................................ 51
STATISTICAL SECTION
TABLE OF CONTENTS................................................................................... 54
EXHIBIT I – NUMBER OF FULL‐TIME EQUIVALENT EMPLOYEES ................. 55 EXHIBIT II – NUMBER OF RETAILERS/AGENTS ............................................ 55

ii
TABLE OF CONTENTS (cont’d) EXHIBIT III – STATE OF DELAWARE DEMOGRAPHIC AND ECONOMIC STATISTICS ....................................... 56
EXHIBIT IV – SCHEDULE OF CHANGE IN NET POSITION (last 10 years) ...... 57
EXHIBIT V – CONSOLIDATED GROSS REVENUE ........................................... 58 EXHIBIT VI – INSTANT GAMES GROSS REVENUE ....................................... 58 EXHIBIT VII –TRADITIONAL DRAWING GAMES GROSS REVENUE ............... 59 EXHIBIT VIII – VIDEO LOTTERY GROSS REVENUE ........................................ 59 EXHIBIT IX – I‐GAMING GROSS REVENUE .................................................. 60 EXHIBIT X – TABLE GAMES GROSS REVENUE ............................................. 60 EXHIBIT XI – SPORTS LOTTERY REVENUE & HOLD ..................................... 61 EXHIBIT XII – TRADITIONAL LOTTERY PRIZES AWARDED TO PLAYERS ....... 61 EXHIBIT XIII – OPERATING EXPENSES .......................................................... 62 EXHIBIT XIV ‐ CASH CONTRIBUTIONS TO STATE GENERAL FUND ............... 62
EXHIBIT XV – DELAWARE LOTTERY STATISTICS SINCE 1976 ....................... 63
U.S. LOTTERY STATISTICS
EXHIBIT XVI ‐ FISCAL YEAR 2019 & 2018 COMPARISON OF U.S. SALES BY GAME ................................ 64
EXHIBIT XVII ‐ FISCAL YEAR 2018 U.S LOTTERY SALES BY GAME ................ 65 EXHIBIT XVIII ‐ FISCAL YEAR 2019 U.S. LOTTERY SALES BY GAME .............. 66

INTRODUCTORY SECTION

2
S TA T E O F DE LAWAR E
DE PA RTMENT O F F I N AN C E
STATE LOTTERY OFF ICE
MCK E E B U S I N E S S P A R K
1 5 7 5 MCK E E RO A D , S U I T E 1 0 2
DO V E R , D E L AW A R E 1 9 9 0 4 ‐ 1 9 0 3
OFFICE OF THE TELEPHONE: (302) 739‐5291
DIRECTOR FAX: (302) 739‐6706
November 1, 2019 The Honorable Rick Geisenberger Secretary of Finance, State of Delaware INTRODUCTION We are pleased to submit to you this Comprehensive Annual Financial Report of the Delaware State Lottery for the fiscal year ended June 30, 2019. This report has been prepared by the Finance and Accounting Department of the Lottery. Responsibility for both the accuracy of the financial data and the completeness and fairness of the presentation, including all disclosures, rests with the Delaware State Lottery. To the best of our knowledge and belief, the data presented is accurate in all material respects and is reported in a manner designed to present fairly the financial position, results of operations, and cash flows of the Lottery. All disclosures necessary to enable the reader to gain an understanding of the Lottery’s financial activities have been included. This Comprehensive Annual Financial Report is presented in three sections, as outlined below: The Introductory section is comprised of this transmittal letter, a list of principal officials, an organization chart and a copy of the Certificate of Achievement for Excellence in Financial Reporting for the year ended June 30, 2018. The Financial section begins with the independent auditors’ report followed by management’s discussion and analysis and then by the Lottery’s audited financial statements and accompanying notes for the years ended June 30, 2019 and 2018. The Statistical section presents trends of financial and other relevant data. It includes data on the Delaware State Lottery and certain data pertaining to the United States Lottery industry.

3
REPORTING ENTITY OVERVIEW: The Reporting entity is the Delaware State Lottery (the Lottery). The Lottery operates traditional lottery games, video lottery, sports lottery and table games such as blackjack and poker, and internet gaming for video and tables (I‐Gaming). This report includes only activity of the Lottery and does not include data or information related to any other state agency or fund. LOTTERY MISSION STATEMENT: To maximize revenue contributions to the State’s General Fund, thereby helping to fund the delivery of governmental services to the people of Delaware: ‐ Through the marketing, sale and distribution of innovative, entertaining and secure Lottery products
that ensure the public’s confidence in the integrity of the games, retailers, agents, and Lottery operations, and
‐ By providing leadership and a corporate culture that encourages productive change leading to
improvement in every aspect of the business. TRADITIONAL LOTTERY: The Lottery was established by enabling legislation signed into law on May 31, 1974, by the Governor of the State of Delaware and placed under his Executive Office. On July 7, 1976, the Lottery was transferred from the Office of the Governor to the Department of Finance. This enabling legislation, which established the traditional lottery, placed the operation of the lottery under the supervision of a Director. The Director has the power and duty to establish rules for conducting games, including the type and number of games, the price of tickets, the number and amounts of winning tickets, the manner of prize payment, frequency of drawings, locations and methods for the sale of tickets, procedures for licensing of retailers and all other functions related to the operations of the lottery. The legislation provided that at least 45 percent of total revenue shall be used to pay prizes, operating expenses shall not exceed 20 percent of total revenue and up to 30 percent of total revenue will be paid to the General Fund of the State of Delaware. TRADITIONAL LOTTERY PRODUCTS
Instant tickets were introduced in February 1976. These games are easy to play since all that is required is to scratch the latex covering off the play area on the ticket. If the correct combination appears, the player becomes an instant winner. The Lottery currently has a wide variety of instant game themes and ticket prices by game.
Play 3 was the first traditional drawing game introduced by the Lottery in January 1978. Players pick three numbers from 0 to 9 and choose among nine different play options. Players also have the option of selecting

4
for a “Day” or a “Night” drawing. “Day” drawings are held Monday through Saturday and “Night” drawings are held seven nights a week. Odds of winning and payouts vary depending on the selected option.
Play 4 was introduced in January 1980. Players pick four numbers from 0 to 9 and choose among five different options. Players also have the option of selecting for a “Day” or a “Night” drawing. “Day” drawings are held Monday through Saturday and “Night” drawings are held seven nights a week. Odds of winning and payouts vary depending on the selected option.
Lotto was first introduced in April 1983 with a “6 of 30” matrix. The jackpot prize for picking all six correct numbers out of 30 was paid as an annuity over a maximum of twenty years. In July 1984, an EZ pick option, which gave players the choice of having the computer pick all or some of the numbers to be played, was added. Multi‐Win Lotto was created during January 2005, replacing the Lotto game. The matrix changed to “6 of 35”. Tickets cost $2 with each ticket giving players three lines of play. A prize can be won by matching three, four, five or six numbers straight across on any of the three lines of numbers. Players can also win by combining number matches from all three lines. This is accomplished by matching a total of at least six numbers from the three lines. Drawings for Multi‐Win Lotto are held on every Monday, Wednesday and Friday.
Powerball is a traditional lottery drawing game jointly operated by multiple lotteries of throughout the United States. (Please see Note 6 of the Notes to Financial Statements in the “Financial Section” of this report for a further description of MUSL). In its current form, Powerball has a matrix of “5 of 69” for the first set and a matrix of “1 of 26” for the second (Powerball) set. Players have the option of receiving the jackpot as an annuity over 29 years or receiving the present value of the annuity stream in cash. A Powerball ticket costs $2. The minimum jackpot offered is $40 million. There are eight prize levels up to $2 million. Drawings are held every Wednesday and Saturday. The jackpot amount increases for each drawing if no winning ticket matches the first set of five numbers and the Powerball number of the second set. An additional feature of the Powerball game is the Power Play option. Players can wager an additional $1 for each Powerball game that they chose to play. If they win, they’re guaranteed to win the set Power Play prize amount. Power Play does not apply to the jackpot.
During January 2010, the Lottery began to sell tickets for Mega Millions, one of the country’s biggest traditional lottery drawing jackpot game. Changes made in fiscal year 2018, included: starting jackpot of $40 million, tickets cost $2 per play and players select five different numbers from 1 to 70 from one pool of numbers, and one Mega Ball number from 1 to 25. Lottery players also can wager an additional $1 to activate the Mega plier option, which could multiply their non‐jackpot prize by 2X – 5X. Players win the jackpot by matching all six numbers in a drawing. Drawings are held on Tuesday and Friday nights.

5
In January 2013, Keno was launched. Keno is an easy, fun and fast‐paced traditional lottery drawing game that allows you to choose how many numbers to play and how much money to wager. Keno is played using a field of numbers from 1 to 80. You may choose up to 10 numbers in that field. The Lottery’s computer continuously generates random sets of 20 numbers. These numbers are then displayed on the Keno monitor. There are a variety of ways to win based on matching some, all, or in some cases, none of the numbers. Keno is available daily from 6:04 a.m. to 12:04 a.m. Drawings take place every four minutes.
In February of 2015, Delaware joined a game called Lucky for Life. A total of 26 other states have combined their sales on this multi‐state game. The top prize for this game is $1,000 a day for life. The second prize is $25,000 a year for life. Players select five numbers from 1 to 48 plus one number from 1 to 18 for the “Lucky” ball. The ticket cost $2 and there are 8 set prizes in the pool ranging from $4 to $5,000. Drawings are held every Monday and Thursday nights.
In 2017, Delaware joined a multi‐state game called Lotto America. Lotto America cost $1 to play, selecting five numbers 1 to 52 for the red balls, then selecting one number from 1 to 10 for the Lotto America Star Ball. Lotto America’s Grand Prize starts at $2 million and increases by a minimum of $50,000 per draw until it is won. Players win the Grand Prize or one of 8 sets of cash prizes matching one of the 9 ways to win. For an addition $1 per play, the Lotto America All Star Bonus can multiply winnings by 2, 3, 4, or 5 times. The multiplier number is randomly selected just before each drawing. The All‐Star Bonus does not apply to the Grand Prize.
Retailer Data:

6
On July 16, 1994, enabling legislation called the “Horse Racing Redevelopment Act” (the Act) was passed by the General Assembly of the State of Delaware allowing the three existing racetracks (agents), upon license approval, to implement video lottery machines within their facilities. The purpose of the Act was to increase the economic activity and vitality of Delaware’s Standardbred and Thoroughbred horse racing industries. The Act authorized the operation of a maximum of 1,000 video lottery machines at each racetrack. The Act covered all aspects of video lottery operations by setting into law the parameters by which the tracks could operate in Delaware. The Act also placed the Delaware State Lottery Office and its Director fully in charge of both implementation and oversight of operations as set forth by the legislation and authorized the creation of the Video Lottery Enforcement Unit to administer the security and law enforcement provisions of the Act and to conduct background investigations. In 2010, the Division of Gaming Enforcement was created under the Department of Safety and Homeland Security to replace the Video Lottery Enforcement Unit. Consequently, the Delaware State Lottery Office established certain rules and regulations to be followed by the agents and gaming machine providers concerning: ‐ Licensing of agents and gaming machine providers ‐ Duties of agents and gaming machine providers ‐ Game requirements ‐ Transportation, registration, location and maintenance of video lottery machines ‐ Standards of operation

7
‐ Standards for advertising, marketing and promotional materials ‐ Payout percentages to players as established by law The Lottery also developed a methodology for distributing video lottery revenue net of payments to players in accordance with the legislation. Based on weekly calculations, payments are made to the State General Fund and to the Department of Agriculture to be used for purse increases at the tracks and to the vendors of the gaming machines. The balance is returned to the agents as commissions. Video lottery operations officially began on December 29, 1995 at Delaware Park and Dover Downs with 715 and 500 gaming machines, respectively. On August 20, 1996, Harrington Raceway opened its doors to the public with an initial count of 500 video lottery machines. The enabling legislation, as mentioned above, contained a sunset clause, which would have terminated the Act after five years from March 15, 1995, if the legislation was not extended or reenacted. On March 26, 1998, the Act was re‐authorized, and the sunset provision was revoked. Among other provisions, this legislation also authorized the operation of an additional 1,000 video lottery machines at each racetrack, bringing the total allowable machines at each track to 2,000. Additional legislation was passed on June 13, 2003, which permits the Lottery Director to authorize 500 additional video lottery machines at each licensed racetrack, bringing the total allowable machines at each track to 2,500. Again, on January 19, 2006, legislation was passed to increase the maximum number of video lottery machines at each racetrack from 2,500 to 4,000. As of June 30, 2019, there were 2,288 machines at Delaware Park, 2,219 machines at Dover Downs and 1,726 machines at Harrington Raceway. There are three types of video lottery machines in operation currently – mechanical reel, video display, and multi‐player automated table machines. Wagering limits vary from 1 cent to a maximum of $100. In July 2013, new legislation allowed fraternal or veterans organization with national affiliation or an organization whose membership consists primarily of veterans honorably discharged or active duty service member to operate charitable video lottery machines within their organizations upon approval from the Director of the Lottery. There are currently 48 Charitable Gaming Organizations with over 450 machines operating throughout the state. More legislative changes were made based on the recommendations of the Lottery & Gaming Study Commission created by the General Assembly changing the initial methodology of video revenue distribution. Effective July 1, 2014, 75% of certain video lottery equipment costs will be deducted from net revenue prior to the calculation of the State’s share of revenue. Effective July 1, 2018, legislation authorized the decrease in state share by 1% and increasing the purse shares for the Standardbred and Thoroughbred industry operating in Delaware
On May 12, 2009, enabling legislation was passed by the General Assembly of the State of Delaware requiring the Lottery Director to use his or her authority to reestablish a sports lottery, in order to enhance the Delaware Lottery, protect Delaware employment, and provide additional revenues for the State. The sports lottery authorization excluded collegiate sporting events that involve a Delaware college or university, as well as prohibiting persons under the age of 21 from participating in the sports lottery. The Governor signed the
8
legislation into law on May 12, 2009. In reestablishing the sports lottery, the bill took advantage of an exemption granted to the State of Delaware under federal law, namely the 1992 Professional and Amateur Sports Protection Act, which allows the states of Delaware, Nevada, Oregon, and Montana to engage in sports betting. The bill authorized the conduct of sports lottery only at the three casinos presently operating. Proceeds from the conduct of sports lottery at the casinos would be divided equally between the casinos and the State. The bill imposed a collective annual license fee of $4,000,000, which is divided among the three casinos in proportion to each property's percentage of the State's total video lottery net proceeds. This fee was eliminated in fiscal year 2012 with the passage of House Bill 333, The Delaware Gaming Competitiveness act of 2012. The Delaware Lottery proceeded to promulgate rules and regulations for the sports lottery and engaged a vendor to provide a sport wagering system, selling terminals and risk management. In response to an action brought by the National Football League (NFL), citing language from the 1992 Professional and Amateur Sports Protection Act, in late August 2009 a three‐judge panel of the 3rd U.S. Circuit Court of Appeals limited the Delaware Sports Lottery to only parlay bets of three or more selections of at least three separate NFL games in a single wager. On September 10, 2009, sales began for the Delaware Sports Lottery. The Lottery offered “off‐the‐board” parlay wagering as well as traditional parlay type cards, including a ½ point card, a teaser card and a super teaser card. A special card was introduced mid‐season in which a customer had to select 15 games from that week’s schedule, with a $100,000 payoff for picking all games correctly.
Sports Lottery continued to expand gaming options for the 2011 season by introducing halftime wagers at the beginning of the season. Prior to the playoffs, pro football championship futures wagers were also added. For halftime wagers, point spreads were adjusted at halftime but still applied to the final score of the game and not to second half scoring alone. Futures wagers allowed players to bet on a team to win the Championship Game. To win a futures wager, a player’s team must win three games: at least two playoff games and the Championship game. Totals (Over/Under) wagers were introduced for the 2013/2014 season. This is a wager based on the combined amount of points scored by both teams during the game, including overtime.
As a result of the passage of House Bill 333, The Delaware Gaming Competitiveness Act of 2012, Sports Lottery was expanded into retail locations in time for the 2012/2013 pro football season. Initially, 31 Sports Lottery retail locations were established throughout the State and currently extended to over 100 retailers. On June 5, 2018, the Delaware Lottery became the first to offer full‐scale sports betting, this side of the Mississippi, due to the Supreme Court’s decision to strike down a 1992 federal law that banned commercial sports betting in most states.
On January 15, 2010, enabling legislation was passed by the General Assembly of the State of Delaware authorizing the introduction and operation of table games by the Delaware Lottery at licensed video lottery agents. On January 28, 2010, the legislation was signed into law by the Governor. Like video lottery, table games are offered on the premises of Delaware's video lottery agents. The Delaware Lottery was given administrative and regulatory oversight of table games, including determining which table games (blackjack, craps, roulette, poker, etc.) would be played, as well as establishing regulations for the effective management of the games.

9
Proceeds from the operation of the table games are paid to the Delaware Lottery, which keeps a portion of those proceeds to cover its administrative expenses and its law‐enforcement and security expenses, as well as an amount to fund programs for the treatment, education and assistance of compulsive gamblers, with the remainder contributed to the State General Fund. This bill also imposed a license fee structure that will reward video lottery agents for making capital investments by allowing them to reduce the annual license fee by up to 50% to account for the cost of capital projects, and that reduces the total license fee further if the video lottery agents are able to achieve certain table gaming revenue annual targets. As such, this bill promotes capital investment by video lottery agents, encourages the video lottery agents to achieve reasonable revenue targets, and creates additional new employment opportunities. This bill also authorized the creation of a Lottery Commission, which would have responsibility for conducting hearings on disputed licensing and exclusion matters. Additionally, the bill authorized the creation of the Division of Gaming Enforcement in the Department of Safety and Homeland Security. Replacing the Video Lottery Enforcement Unit, the Division would consist of Delaware State Police investigators, responsible for investigating table gaming crimes, as well as the background checks. Effective July 1, 2019, legislation passed reducing the state share of table games revenue from 29.4% to 15.5%. The bill also suspended the license fees due for fiscal year 2020 in exchange for providing proof of qualified investments by video lottery agents in the competitiveness of its facilities and business. I‐GAMING ‐ (INTERNET VIDEO LOTTERY & INTERNET TABLE GAMES) During fiscal year 2014, the Lottery was tasked with continuing the implementation of House Bill 333, The Delaware Gaming Competitiveness Act of 2012. One of the four main components was the authorization of casino style internet wagering. The Lottery launched the nation’s first full‐scale internet casino and poker offering in October of 2013. This included three internet casinos, one associated with each of the State’s licensed video lottery agents, Delaware Park, Dover Downs, and Harrington Raceway. Delaware’s internet gaming also introduced the nation’s first “shared liquidity” poker network, allowing players from multiple Delaware internet casinos to sit in one common poker room and play against each other. In fiscal year 2015, the Delaware and Nevada governors signed a Multi‐State Internet Gaming Licensees' Agreement to start a “shared liquidity” between the two states. Poker tables opened in March 2015 allowing players from Nevada and Delaware to sit at the same internet poker table. The lottery office added a second vendor to supply game content on our I‐gaming platform and launched a mobile application to allow internet gaming through mobile devices in fiscal year 2016. In May 2018, the Multi‐State Internet Gaming Licensees' Agreement was amended to add New Jersey. ECONOMIC OUTLOOK U.S. LOTTERY INDUSTRY: Based on statistics compiled by LaFleur’s, a gaming industry publication, total unaudited lottery sales for U.S. lotteries increased 6% to $80.8 billion in fiscal year 2019, an increase of $4.8 million. The Wyoming Lottery led the industry with a 31% increase in total lottery sales in fiscal year 2019. Forty‐four U.S. Lotteries posted an increase in sales growth for traditional lottery in fiscal year 2019. The New York Lottery ranked first in gross traditional sales at $8.2 billion. The Massachusetts Lottery ranked first in per capita total sales at $792.

10
Total U.S instant ticket sales increased 4% to $50.1 billion, up $2.1 billion in additional instant sales over previous year. The Massachusetts Lottery ranked first in per capita instant sales at $532. The California Lottery ranked first in gross sales of $5.2 billion. The West Virginia Lottery ranked first with an 17% increase in fiscal year 2019 instant sales over fiscal year 2018. The traditional lottery sales increase had a big part to do with the $1.5 billion Mega Millions jackpot won in October 2018. MAJOR INITIATIVES GENERAL: After the completion of fiscal year 2019 the Delaware Lottery has distributed over $5.4 billion to the State General Fund. Since the commencement of video lottery and table games, The Delaware Lottery has contributed $36.9 million to the Department of Health and Social Services to help fund initiatives that address problem gambling in Delaware. The Delaware Lottery was ranked 25th out of 44 U.S. lotteries in total traditional lottery sales and finished 8th in per capita sales. The Delaware Lottery ranked 27th in per capita instant sales and placed 38th in overall change in instant sales. The Delaware Lottery ranked 30th out of 44 states in draw sales and ranked 8th in per capita sales. VIDEO LOTTERY: Video Lottery net proceeds for FY2019 totaled more than $365 million.
The Lottery extended its contract with Gaming Labs International (GLI) for Video Lottery testing, inspection, and
consulting services for one year. Existing contracts with vendors who provide Video Lottery Terminals (VLTs)
were extended for two years. The Lottery worked with Scientific Games to upgrade the central system in late
2018, improving security and reporting capabilities of the State’s 6200 VLTs.
The MegaHits progressive multi‐state program was terminated and thirteen MegaHits IGT machines were
removed from the State in July 2018. The remaining funds will be distributed in FY20 to IGT players through a
variety of exciting promotions.
There are 497 Charitable VLTs operating in 48 approved Charitable Gaming Organizations.
In fiscal year 2019, there were ten winners of VLT jackpots over $50K; two of them were over $100K.
TABLE GAMES: Fiscal Year 2019 is the ninth full year for Table Gaming operations in the state. Request for changes to the Internal Controls from the venues were submitted. These change requests range from 22 new games to modifications that involved their operation processes. Between the three venues over 150 gaming tournaments were held. These tournaments were made up of Poker, Black Jack and Craps. There is an ongoing process for updating the Internal controls to keep up with any changes to the Lottery Minimum Internal Controls. These

11
changes can be created due to new games being introduced, as well as changes in the Gaming Laws. The three venues offer a total of 38 Poker Table and 103 Gaming Tables. This number is lower than FY 2018 due to adjustments in the ongoing demand and the recent opening of neighboring venues. The venues continue to provide the latest games to the public. Delaware Park continue to update the gaming floor with the latest games that are available. Along with new games they are working on ways to update the facility for the enjoyment of the patrons. They held over 60 poker tournaments. Dover Downs began the process of a merger with Twin Rivers Casino located in Rhode Island. This process involved the review of their Internal Controls to make sure they were up to date and to meet with Twin Rivers to review what is expected of them for gaming in Delaware. Harrington offers a Match Play/ Free Play program for their Table Gaming patron which has gone over well. There have been some updates to their gaming floor with the addition of some new games. Harrington continues to offer daily Poker Tournaments and yearly Black Jack Tournaments. MARKETING AND SALES MANAGEMENT: This fiscal year the Delaware Lottery launched a new rewards program called Collect ‘N Win; where players 18 and older can earn entries to win monthly cash prizes just by entering eligible, non‐winning Delaware Lottery tickets. Players collect symbols for their Delaware lottery Collect ‘N Win play card. Once all six symbols are collected, they will be automatically entered to win monthly cash prizes. Players can download the Collect ‘N Win app directly in the Apple store and its available for Android users downloaded directly from delottery.com. Since launch, the Collect ‘N Win registered players has grew to over 12,000 participants. The Lottery’s new Advanced Entertainment Games Information System (AEGIS) continued with new releases throughout FY19 to deliver promotional opportunities and expanded reporting capabilities. This new system is tied to the Lottery’s strategic plan to enhance the opportunity to offer technology and initiatives that will support the responsibly to increase revenue for the State of Delaware and its beneficiaries. As a result of the implementation to the new system, the Lottery was able to acquire new state‐of‐the‐art, self‐service, Player High Definition (PHD) machines. The PHD machines were placed in all of the Delaware Wawa locations and all Royal Farms. The addition of the PHDs brought in an extra $17.6 million in revenue to the state. Also, during fiscal 2019, we launched a new Licensed Property Instant Ticket – Willy Wonka Golden Ticket. The game had a second chance prize built in where one lucky Delaware winner was selected to win a trip to Las Vegas and have an opportunity to play the BILLION DOLLAR CHALLENGE™ on April 16th, 2019, with a chance to win up to $1 Billion! The trip to Las Vegas included a 4‐day/3‐night trip for two; round‐trip airfare; deluxe accommodations; ground transportation at destination; $1,000 spending money; admission to the BILLION DOLLAR CHALLENGE™ theater/venue for the Prizewinner and guest with a chance for the Prizewinner to participate in the BILLION DOLLAR CHALLENGE™ along with a group of Lottery winners from across the United States. Delaware Lottery’s marketing programs maintained its long‐standing sponsorships with University of Delaware, Delaware State University, Wilmington Blue Rocks and the Delaware 87ers, participating in a variety of cooperative sports programs conducted during the spring and winter sports seasons. In addition, the Lottery continued sponsorships with the Delaware State Fair as well as participating in more recent associations with such diverse events as the Out and About Loop Series, Wyoming Peach Festival, Milford Bud & Bug Festival, Saint Anthony’s Italian Festival, Dover Days and The Lady Bug Festival.

12
FUTURE AND ON‐GOING PROJECTS OVERALL:
Continue to grow, expand and optimize the traditional lottery retailer network.
Maintain regulatory oversight and control of the video and sports lottery gaming systems.
Provide administrative and regulatory oversight of licensed Charitable Gaming Organizations.
Provide constant onsite regulatory oversight of table game operations at the three video lottery facilities.
Provide the public with games that are fun, easy and exciting to play.
Explore new lottery gaming opportunities allowing Delaware to stay competitive with neighboring states.
Continue monitoring and improving internal controls and accounting practices and policies. VIDEO LOTTERY:
A request to revise current Video Lottery statute was submitted for consideration.
Exploring options for bringing additional VLT vendors into Delaware to provide an even greater variety of games for our players!
TABLE GAMES:
Dover Downs is currently going through a major reconfiguration of their gaming floor. This process involves the moving of Video Lottery machines and Table Games. The lottery is present during this process to make sure all regulations are followed for the placement of tables, machines and surveillance cameras.
MARKETING AND SALES MANAGEMENT:
Continue the expansion of our retailer network by actively recruiting new and unique trade styles.
Expand retailer network to grow Keno sales.
Leverage sponsorship assets in communication with players and non‐players.
Continue to develop effective mass media and alternative media advertising programs including digital and social.
Continue to effectively use “cooperative services” program by developing new and exciting games and promotional programs.
Conduct player and customer satisfaction surveys as well as strive to continually improve service in accordance with the Lottery’s quality initiative.
Contribute to the design and development of improved sales management, reporting, and communications solutions for Lottery support staff and retailers that capitalize on available Internet and wireless technologies.
Continue to employ effective sales management techniques to stimulate positive selling activities among licensed retailers.
13
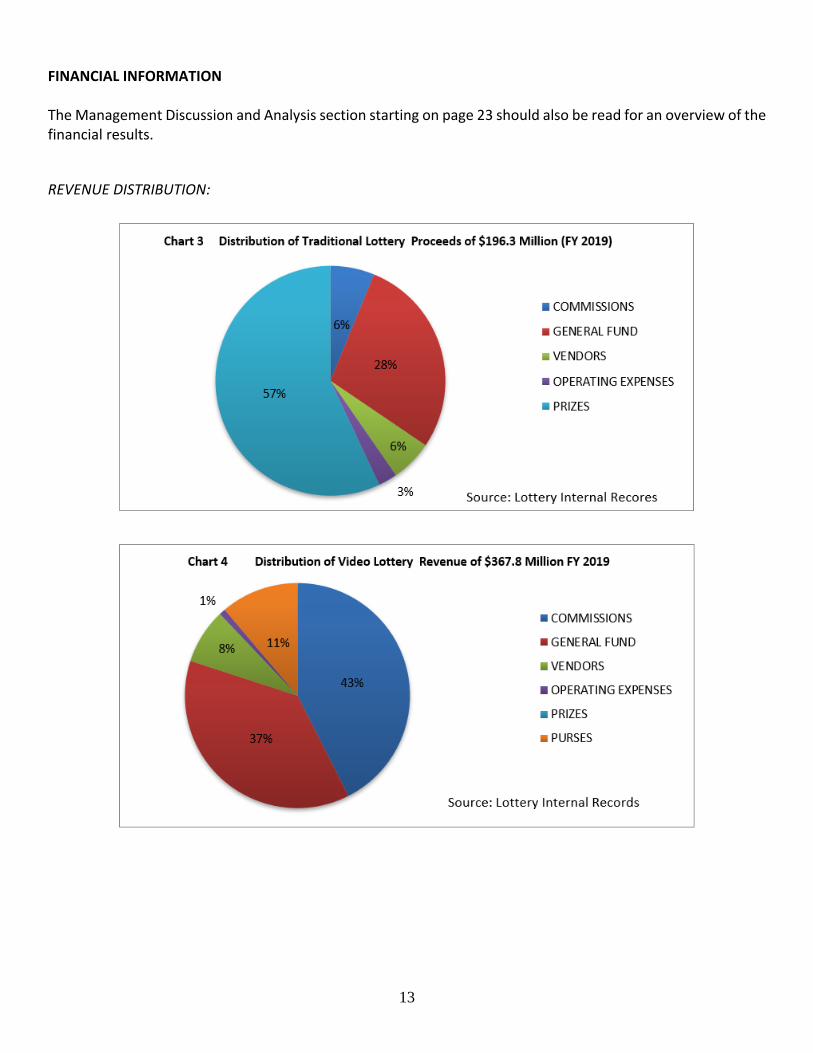
FINANCIAL INFORMATION The Management Discussion and Analysis section starting on page 23 should also be read for an overview of the financial results.
REVENUE DISTRIBUTION:
14
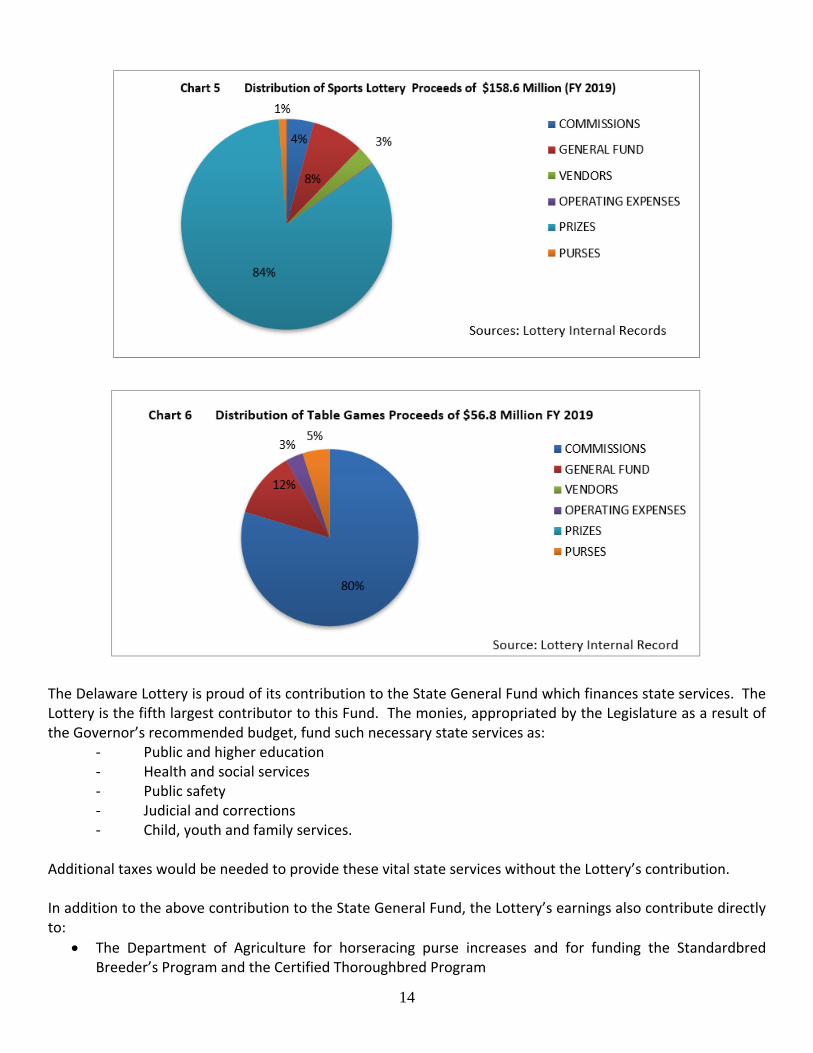
The Delaware Lottery is proud of its contribution to the State General Fund which finances state services. The Lottery is the fifth largest contributor to this Fund. The monies, appropriated by the Legislature as a result of the Governor’s recommended budget, fund such necessary state services as:
‐ Public and higher education ‐ Health and social services ‐ Public safety ‐ Judicial and corrections ‐ Child, youth and family services.
Additional taxes would be needed to provide these vital state services without the Lottery’s contribution. In addition to the above contribution to the State General Fund, the Lottery’s earnings also contribute directly to:
The Department of Agriculture for horseracing purse increases and for funding the Standardbred Breeder’s Program and the Certified Thoroughbred Program

15
The Department of Health and Social Services for operating the Problem Gamblers’ program As seen from the chart below, when these distributions are added to the contributions made to the State General Fund, the Lottery contributed 27 cents of every sales dollar to the State of Delaware in fiscal year 2019.
INTERNAL CONTROL ENVIRONMENT: The Lottery has established and maintains an internal control system designed to ensure that its assets are protected from loss, theft, or misuse. The system also ensures that adequate accounting data is compiled in an accurate and timely fashion to allow for the preparation of financial statements in conformity with Generally Accepted Accounting Practices (GAAP). Because the costs of a control should not exceed the benefits to be derived, the objective is to provide reasonable, but not absolute, assurance that the financial statements are free of any material misstatements. Lottery officials believe that the Lottery’s internal control structure provides reasonable assurance that the above objectives are met. Lottery management also believes that the organization’s responsibility towards internal control extends far beyond the aforementioned objectives. The success of the Lottery is wholly dependent upon favorable public perception as well as the public’s confidence in the honesty, integrity, and security of its games. To maintain this public perception of Lottery integrity, the Lottery has enhanced its system of internal controls to include:
‐ Maintaining highly secure lottery facilities and limiting access to them ‐ Providing for multiple drawing algorithms ‐ Hiring an independent CPA firm to test data and witness drawings ‐ Printing lottery tickets with special inks, dyes and security codes ‐ Having the central system provider’s system of internal controls tested and certified by an
independent CPA firm on an annual basis ‐ Having video lottery machines and software tested by an independent laboratory ‐ Performing background checks on retailers, agents, vendors and video lottery employees, and
Delaware Lottery employees.

16
BUDGETARY CONTROLS: The Lottery submits an operating budget and forecasted revenue contribution for the State General Fund to the Department of Finance on an annual basis. The revenue contribution is tracked and reported monthly and is revised on a quarterly basis if necessary. This information is included in the State’s budget under the Department of Finance. The Lottery also uses an internal budget for expense control and business management. This internal budget mirrors the budget submitted to the State in revenue generated and contribution to the State General Fund. The internal budget consolidates certain detailed expense categories to reduce recording time and for better management. ENTERPRISE OPERATIONS: The Delaware State Lottery operates as an enterprise fund. An enterprise fund is used to account for the operations of an entity that is financed and operated in a manner similar to a private enterprise. The intent of the State is that the costs of providing Lottery services and products to the general public on a continuing basis should be financed by or recovered primarily through user charges. The Lottery’s financial statements are included in the State’s Comprehensive Annual Financial Report under Proprietary Fund Type – Enterprise Fund. Although the Lottery provides an annual operating budget to the State, all capital expenditures and operating expenses are funded by the Lottery through internally generated funds. The Lottery utilizes internal services of other State agencies for items such as postage, telephone, automobiles, graphics and printing, pension administration, etc. These agencies are compensated by the Lottery through inter‐fund transfers. DEBT ADMINISTRATION: Money owed to the State of Delaware in the event that the Lottery’s MUSL games are discontinued is $2.8 million as of June 30, 2019. This amount has been reserved by MUSL (Multi‐State Lottery) that operates the Powerball, Lotto America and Mega Million games. Please see Note 6 of the Notes to Financial Statements under the “Financial Section” of this report. The Lottery’s enabling legislation does not provide the ability to issue bonded debt. OTHER INFORMATION INDEPENDENT AUDIT: Enabling legislation of the Lottery requires that the State of Delaware Auditor’s Office conduct an annual audit of all accounts and transactions of the Delaware State Lottery Office. The cost of the audit is paid by money from the Lottery and designated as operating expenses.

17
The State Auditor’s Office has contracted with an independent Certified Public Accounting firm to perform annual audits of the Lottery’s financial statements. The independent auditor’s opinion and the current annual audit report are included in the “Financial Section” of this report. AWARDS: The Government Finance Officers Association of the United States and Canada (GFOA) awarded a Certificate of Achievement for Excellence in Financial Reporting to the Delaware State Lottery for its comprehensive annual financial report for the fiscal year ended June 30, 2018. This was the nineteenth consecutive year that the Lottery has achieved this prestigious award. A copy of the certificate for fiscal year 2018 can be seen in this report. In order to be awarded a Certificate of Achievement, a government must publish an easily readable and efficiently organized comprehensive annual financial report. This report must satisfy both generally accepted accounting principles and applicable legal requirements. A Certificate of Achievement is valid for a period of one year only. We believe that our current comprehensive annual financial report continues to meet the Certificate of Achievement Program’s requirements and we are submitting it to the GFOA to determine its eligibility for another certificate. ACKNOWLEDGMENTS: This Comprehensive Annual Financial Report for fiscal year 2019 signifies the Delaware State Lottery’s commitment to comprehensive disclosure of its financial condition. The preparation of this report was made possible by cooperation from all departments of the Lottery. We wish to express our special appreciation to the Lottery’s Finance and Accounting department as well as to other groups and individuals who assisted in the preparation of this report. Respectfully submitted, DELAWARE STATE LOTTERY
Vernon A. Kirk Director Delaware State Lottery
Tina M. Leager Senior Fiscal Administrative Officer Delaware State Lottery

18
DELAWARE STATE LOTTERY PRINCIPAL OFFICIALS
Governor John Carney Secretary of Finance Richard Geisenberger Lottery Director Vernon Kirk Lottery Deputy Director Helene Keeley Lottery Deputy Attorney General Julie Donoghue Assistant Director of Marketing & Sales Barbara Hutchins‐Miller Assistant Director of Video Lottery Jayne Gooden Assistant Director of Table Games Richard MacDonald Senior Fiscal Administrative Officer Tina Leager

19
Delaware State Lottery Organization Chart

20
Government Finance Officers Association
Certificate of Achievement for
Excellence in Financial Reporting
Presented to
Delaware State Lottery
For its Comprehensive Annual
Financial Report
for the Fiscal Year Ended
June 30, 2018
Executive Director/CEO

FINANCIAL SECTION
INDEPENDENT AUDITORS' REPORT
Vernon Kirk, Director of Delaware State Lottery, and Richard Geisenberger, Secretary of Finance, State of Delaware Dover, Delaware Report on the Financial Statements
We have audited the accompanying financial statements of the Delaware State Lottery (the Lottery), an enterprise fund of the State of Delaware, as of and for the year ended June 30, 2019, and the related notes to the financial statements, which collectively comprise the Lottery’s basic financial statements as listed in the table of contents. Management’s Responsibility for the Financial Statements
Management is responsible for the preparation and fair presentation of these financial statements in accordance with accounting principles generally accepted in the United States of America; this includes the design, implementation, and maintenance of internal control relevant to the preparation and fair presentation of financial statements that are free from material misstatement, whether due to fraud or error. Auditors’ Responsibility
Our responsibility is to express opinions on these financial statements based on our audit. We conducted our audit in accordance with auditing standards generally accepted in the United States of America and the standards applicable to financial audits contained in Government Auditing Standards, issued by the Comptroller General of the United States. Those standards require that we plan and perform the audit to obtain reasonable assurance about whether the financial statements are free from material misstatement. An audit involves performing procedures to obtain audit evidence about the amounts and disclosures in the financial statements. The procedures selected depend on the auditors’ judgment, including the assessment of the risks of material misstatement of the financial statements, whether due to fraud or error. In making those risk assessments, the auditor considers internal control relevant to the entity’s preparation and fair presentation of the financial statements in order to design audit procedures that are appropriate in the circumstances, but not for the purpose of expressing an opinion on the effectiveness of the entity’s internal control. Accordingly, we express no such opinion. An audit also includes evaluating the appropriateness of accounting policies used and the reasonableness of significant accounting estimates made by management, as well as evaluating the overall presentation of the financial statements. We believe that the audit evidence we have obtained is sufficient and appropriate to provide a basis for our audit opinions. Opinions
In our opinion, the financial statements referred to above present fairly, in all material respects, the financial position of the Lottery, an enterprise fund of the State of Delaware as of June 30, 2019, and the changes in financial position and, where applicable, cash flows thereof for the year then ended in accordance with accounting principles generally accepted in the United States of America.

Vernon Kirk, Director of Delaware State Lottery, and Richard Geisenberger, Secretary of Finance, State of Delaware
Emphasis of Matter
As discussed in Note 1, the financial statements present only the Lottery and do not purport to, and do not present fairly the financial position of the State of Delaware as of June 30, 2019 and 2018, the changes in financial position, or, where applicable, its cash flows for the years then ended in accordance with accounting principles generally accepted in the United States of America. Our opinion is not modified with respect to this matter. Other Matters
Required Supplementary Information
Accounting principles generally accepted in the United States of America require that the management’s discussion and analysis on pages 24 through 29, and the required supplementary information on pages 51 and 52 as listed in the table of contents, be presented to supplement the basic financial statements. Such information, although not a part of the basic financial statements, is required by the Governmental Accounting Standards Board who considers it to be an essential part of financial reporting for placing the basic financial statements in an appropriate operational, economic, or historical context. We have applied certain limited procedures to the required supplementary information in accordance with auditing standards generally accepted in the United States of America, which consisted of inquiries of management about the methods of preparing the information and comparing the information for consistency with management’s responses to our inquiries, the basic financial statements, and other knowledge we obtained during our audit of the basic financial statements. We do not express an opinion or provide any assurance on the information because the limited procedures do not provide us with sufficient evidence to express an opinion or provide any assurance. Other Information
The introductory section and statistical section have not been subjected to the auditing procedures applied in the audit of the basic financial statements, and accordingly, we do not express an opinion or provide any assurance on it. Other Reporting Required by Government Auditing Standards
In accordance with Government Auditing Standards, we have also issued our report dated November 1, 2019, on our consideration of the Lottery’s internal control over financial reporting and on our tests of its compliance with certain provisions of laws, regulations, contracts, and grant agreements and other matters. The purpose of that report is solely to describe the scope of our testing of internal control over financial reporting and compliance and the results of that testing, and not to provide an opinion on the effectiveness of the Lottery’s internal control over financial reporting or on compliance. That report is an integral part of an audit performed in accordance with Government Auditing Standards in considering the Lottery’s internal control over financial reporting and compliance. Prior Year Financial Statements
The 2018 financial statements of the Delaware State Lottery were audited by other auditors whose report dated November 30, 2018 expressed an unmodified opinion on those statements.
a
CliftonLarsonAllen LLP Baltimore, Maryland November 1, 2019

DELAWARE STATE LOTTERY
Management’s Discussion and Analysis June 30, 2019 and 2018
24
The management of the Delaware State Lottery (the Lottery) offers this narrative overview and analysis of the Lottery’s financial activities for the years ended June 30, 2019 and 2018, which should be read in conjunction with the Lottery’s basic financial statements. Overview of the Basic Financial Statements
This discussion and analysis is intended to serve as an introduction to the Lottery’s basic financial statements. Since the Lottery is an enterprise fund of the State of Delaware, these financial statements are presented in a manner similar to a private‐sector business. As required by accounting principles generally accepted in the United States of America (GAAP), current year’s revenues are recorded when earned and expenses are recorded as they are incurred, regardless of when the cash is received or disbursed. The Statement of Net Position presents information on all of the Lottery’s assets, liabilities, deferred outflows, and deferred inflows with the residual of all elements reported as the net position. Pursuant to Delaware law, the Lottery’s net position should remain relatively unchanged, since all excess monies are to be sent directly to the State’s General Fund, allowing the Lottery to maintain a net position of $1,000,000. The Statement of Revenue, Expenses, and Changes in Net Position show the result of the Lottery’s total operations and reflect both operating and nonoperating activities. Changes in net position (increases or decreases) reflect the current fiscal year’s operating impact upon the overall financial position of the Lottery. The Statement of Cash Flows provides a detailed analysis of all sources and uses of cash. The direct method of cash flows is presented, ending with a reconciliation of operating income to net cash provided by operating activities. The Statement of Cash Flows is divided into three sections – operating, noncapital financing, and investing. Notes to the basic financial statements contain additional information, and often offer explanations to the basic financial statements. The notes are intended to assist the reader in understanding the Lottery’s basic financial statements.

DELAWARE STATE LOTTERY
Management’s Discussion and Analysis June 30, 2019 and 2018
25
Condensed Net Position
June 30Assets 2019 2018 2017
Cash and investments $ 4.7 5.9 3.8 Accounts receivable 12.4 10.8 7.9 Due from State of Delaware 12.6 12.7 12.4 Deposit with Multi‐State Lottery 2.8 2.5 2.3
Total assets 32.5 31.9 26.4
Deferred outflows 1.0 1.1 1.3
Liabilities and Net PositionLiabilities:
Prizes liability 8.5 6.7 5.1 Accounts payable and accrued liabilities 6.9 6.6 4.7 Due to the State of Delaware 0.7 2.4 0.9 Pension and OPEB liability 11.4 12.1 13.6 Multi‐State Lottery reserve 2.8 2.5 2.3
Total liabilities 30.3 30.3 26.6
Deferred inflows 2.2 1.7 0.1
Net position:Unrestricted $ 1.0 1.0 1.0
Table 1(In millions)
The Lottery’s accounting periods are predicated on a 4‐4‐5‐week cycle except at year‐end when the closing date includes additional days up to and including June 30. These extra days amounted to five days in 2017, six days in 2018 and seven days in 2019. Table 1 above shows that the one extra day of sales in fiscal year 2019 over 2018 and one day from 2018 over 2017 allows for an increase in accounts receivable. Prizes liability as shown in Table 1 has increased in fiscal year 2019 over fiscal year 2018 by $1.8 million mainly due to the addition of sports wagering all year on all sports compared to just football in 2018. The liability had increased in fiscal year 2018 over fiscal year 2017 by $1.6 million. With the implementation of the Governmental Accounting Standards Board (GASB) Statement No. 75, Accounting and Financial Reporting for Postemployment Benefits Other than Pensions, the Pension and OPEB liability and the amount due from the State of Delaware increased for fiscal years 2019 and 2018 from fiscal year 2017 to cover such obligations. Since the Lottery is required to send all surplus funds to the State General Fund, any monies required to pay these liabilities would come from the State’s General Fund.

DELAWARE STATE LOTTERY
Management’s Discussion and Analysis June 30, 2019 and 2018
26
Revenue Table 2
Revenue
(In millions)
Year ended June 302019 2018 2017
Play 3 $ 27.5 27.0 27.5 Play 4 23.7 22.8 22.7 Multi Win Lotto 4.5 4.6 4.3 Powerball 25.2 24.6 22.8 Hot Lotto ‐ 1.3 2.7 Mega Millions 20.7 12.1 8.9 Lotto America 3.4 2.1 ‐ Keno 8.6 8.7 8.2 Lucky for Life 2.9 3.0 3.4 Instant games 79.8 70.6 69.3
Traditional games revenue 196.3 176.8 169.8
Video lottery, net 367.4 353.8 352.8 I‐Gaming 3.2 2.2 2.7 Video lottery expired jackpots and credit slips 0.4 0.4 0.3 Casino license fees 0.2 3.2 3.2 Sports lottery 158.6 54.7 46.1 Table games, net 56.6 54.6 53.1
Total revenue $ 782.7 645.7 628.0 Table 2 above compares revenue for each lottery game category. Fiscal year 2019 saw a record year in instant sales, a record jackpot for Mega Millions and the addition of sports wagering to include all sports all year‐round increased sales $137 million or 21.2% over fiscal year 2018. There is an increase in revenue in fiscal year 2018 of $17.7 million or 2.8% over fiscal year 2017. The increase is primarily due to the increase of popularity of sports lottery. Powerball, Mega Millions and Lotto America sales are typically driven by the size of the jackpot. Mega Millions had a record billion‐dollar jackpot in fiscal year 2019 providing the increase in sales of $8.6 million or 71% over fiscal year 2018. Mega Millions had a large jackpot in fiscal year 2018 explaining the increase in sales of $3.2 million or 36% over fiscal year 2017. Sports Lottery expanded at the end of fiscal year 2018 to allow betting on all sports along with single game bets. This expansion for the last three weeks of the fiscal year led to a significant jump in sales for sports lottery over fiscal year 2017 with an increase of $8.6 million or 18.7%. With the expansion of Sports Lottery to include all sports for the entire fiscal year, sales increased dramatically $103.9 million for fiscal year 2019 over fiscal year 2018. Video lottery and table games revenue increased 3.8% and 3.6% respectively from fiscal year 2019 over fiscal year 2018 following industry wide trends. Other contributing factors include the increase of capital and marketing expenditures required by new legislative changes for fiscal year 2019. Video lottery only had a slight increase of $1 million for fiscal year 2018 over fiscal year 2017. Table games revenue increased $1.5 million or

DELAWARE STATE LOTTERY
Management’s Discussion and Analysis June 30, 2019 and 2018
27
2.8% in fiscal year 2018 over fiscal year 2017. These increases shared the same trends as all lottery product increases for the current fiscal year. Cost of Games
(In millions and as a percentage of all revenue)
Year ended June 302017
Commission expense $ 220.5 28.2% $ 199.9 31.0% $ 196.7 31.3%Gaming vendor fees and costs 47.4 6.1% 43.0 6.7% 39.8 6.3%Prize expense 244.4 31.2% 136.5 21.1% 135.0 21.5%
Total cost of games $ 512.3 $ 379.4 $ 371.5
2019 2018
Table 3
Cost of Games
Table 3 above compares the cost of games for the last three years. Commission expense includes payments to lottery retailers for selling and cashing traditional and sports lottery tickets, and commissions to casinos for the operation of video lottery, internet gaming, sports lottery, and table games. Delaware law allows for the net of sports (sports sales minus sports win) to be used in the calculations for commissions and vendors fees. Commission expense for fiscal year 2019 increased over fiscal year 2018 by $20.6 million or 10.3%. Fiscal year 2018 increased slightly from fiscal year 2017 by $3.2 million or 1.6%. Both increases have grown the same percentage as the sales. Gaming vendor fees and costs include the cost of the central system used to monitor and collect pertinent data for the traditional draw games and the video lottery system, the instant games supplier fees, the cost of leasing video lottery terminals and franchise video games, and the cost incurred by internet gaming for fees and website maintenance. Gaming vendor fees for fiscal year 2019 increased over fiscal year 2018 by $4.4 million or 10.2%. The increase in sales was a contributing factor to the increase in vendor fees. Fiscal year 2018 increased over fiscal year 2017 by $3.2 million or 8.0%. The increase in vendor fees was due to the fact of the increase in sales and the increase in net revenue of sports lottery.

DELAWARE STATE LOTTERY
Management’s Discussion and Analysis June 30, 2019 and 2018
28
Prize Expense, Net of Reversions
Year ended June 302019 2018 2017
Play 3 $ 13.3 13.1 12.8 Play 4 11.7 11.0 10.3 Multi Win Lotto 2.6 2.8 2.6 Powerball 12.2 12.0 10.7 Hot Lotto — 0.5 1.3 Mega Millions 10.5 6.1 4.6 Keno 5.0 5.2 4.8 Lucky for Life 1.7 1.8 1.6 Lotto America 1.7 1.1 — Sports lottery 132.5 36.2 40.2 Instant games 53.1 46.7 46.1
Total prize expense $ 244.3 136.5 135.0
Table 4
Prize Expense, Net of Reversions
(In millions)
Table 4 above compares prize expense for each lottery game category for the past three years. Prize expense includes the costs for winning tickets for traditional and sports lottery. In general, prize expense by game will increase or decrease from year to year in proportion to the increase or decrease in sales for a particular game. However, the prize expenses for the Play 3 and Play 4 games are impacted by the luck of the draw, and actual prize payment is determined by lottery players’ luck in matching the particular set of numbers randomly selected in each drawing for each game. Overall prize expense for the instant game product category is controllable for the most part, by printing a predetermined number and value of winning tickets for each instant game. Sports lottery winners vary from year to year due to the unpredictability of the outcome of professional sports. During any given sports event the liability of the game could exceed the sales for that event. The prize expense for fiscal year 2019 increased $107.8 million or 78.97% over fiscal year 2018. The increase for mega million and instant prize expense is due to the increase in the sales for those games. Most of the increase for FY19 prize expense over FY18 is in sports. Sports prize expense increased $96.3 million also because of the increase in sports sales. The prize expense for fiscal year 2018 increased slightly over fiscal year 2017 by $1.5 million or 1.1%. Sport lottery prize costs were unusually low for the 2018 NFL season and with the expansion into other professional and college sports the liability is predicted to be much more constant over the course of the events. Sports lottery accounted for much of the increase in FY18 as well.

DELAWARE STATE LOTTERY
Management’s Discussion and Analysis June 30, 2019 and 2018
29
Operating Expenses
Table 5
Operating Expenses
(In millions)
Year ended June 302019 2018 2017
Operating expenses $ 10.7 10.4 10.7
Operating expenses remained relativity unchanged from fiscal year 2017 through fiscal year 2019 with a slight decrease in fiscal year 2018 from spending less in travel, supplies, and capital purchases.
Nonoperating Expenses
Table 6
Nonoperating Expenses
(In millions)
Year ended June 302019 2018 2017
Contributions to the State of Delaware:Standardbred Breeder’s Program $ 3.0 3.0 3.0 Certified Thoroughbred Program 1.0 1.0 1.0 Department of Agriculture Purses 40.2 36.9 35.7 Department of Health & Social Services 1.7 1.6 1.6 State of Delaware ‐ General Fund 213.8 213.3 204.4
Total nonoperating expenses $ 259.7 255.8 245.7
Table 6 shows the expenses incurred to other state agencies as dictated by Delaware Law. The increase in contributions to nonoperating expenses in fiscal year 2019 over fiscal year 2018 of $3.9 million or 1.5% is due to the increase in total revenue and the increase in the percentage of revenue to purses for video due to legislative changes. The portion of nonoperating expenses increased in fiscal year 2018 over fiscal year 2017 by $10.1 million or 4.1%. This increase was in correlation of the increase in sales for the year and the decrease in sports expense.

30
Assets 2019 2018
Current assets:
Cash and investments $ 4,748,553 $ 5,903,324
Accounts receivable 12,369,828 10,836,366
Due from the State of Delaware 12,607,234 12,657,006
Total current assets 29,725,615 29,396,696
Noncurrent assets:
Deposit Multi‐State Lottery 2,845,122 2,467,039
Total assets 32,570,737 31,863,735
Deferred outflows 967,386 1,127,219
Liabilities and Net Position
Current liabilities:
Prizes liability 8,545,304 6,662,632
Accounts payable and accrued liabilities 6,872,002 6,615,524
Due to the State of Delaware 701,075 2,461,534
Total current liabilities 16,118,381 15,739,690
Noncurrent liabilities:
Multi‐State Lottery reserve 2,845,122 2,467,039
Pension and OPEB liability 11,410,101 12,095,841
Total noncurrent liabilities 14,255,223 14,562,880
Total liabilities 30,373,604 30,302,570
Deferred inflows 2,164,519 1,688,384
Net position:
Unrestricted $ 1,000,000 $ 1,000,000
See accompanying notes to basic financial statements.
DELAWARE STATE LOTTERY
Basic Statements of Net Position
June 30, 2019 and 2018

31
2019 2018
Revenue:
Video lottery, net $ 367,399,349 $ 353,776,920
Video lottery expired jackpots and credit slips 381,685 379,558
Casino license fees 211,300 3,221,800
I‐Gaming 3,166,045 2,178,023
Sports lottery 158,630,194 54,747,779
Table games, net 56,611,092 54,629,995
Draw games 116,507,746 106,188,593
Instant games 79,809,999 70,599,375
Total revenue 782,717,410 645,722,043
Cost of games:
Video lottery commissions 156,338,344 149,150,781
Prize costs, net of reversions 244,362,133 136,506,526
Gaming vendor fees and costs 47,448,710 43,009,044
Instant and draw games commissions 12,178,982 10,764,400
Sports lottery commissions 6,699,434 3,913,713
Table games commissions 45,288,873 36,110,427
Total cost of games 512,316,476 379,454,891
Gross margin 270,400,934 266,267,152
Operating expenses:
Advertising and promotions 3,251,410 3,147,412
Payroll and related benefits 5,754,456 5,506,623
Other general and administrative 1,703,148 1,791,987
Total operating expenses 10,709,014 10,446,022
Operating income 259,691,920 255,821,130
Nonoperating expenses:
Delaware Standardbred Breeder’s Program 3,000,000 3,000,000
Delaware Certified Thoroughbred Program 1,000,000 1,000,000
State of Delaware 255,691,920 251,821,130
Total nonoperating expenses 259,691,920 255,821,130
Change in net position ‐ ‐
Net position at beginning of year 1,000,000 1,000,000
Net position at end of year $ 1,000,000 $ 1,000,000
See accompanying notes to basic financial statements.
DELAWARE STATE LOTTERY
Basic Statements of Revenue, Expenses, and Changes in Net Position
Years ended June 30, 2019 and 2018

32
DELAWARE STATE LOTTERY
Basic Statements of Cash Flows
Years ended June 30, 2019 and 2018
2019 2018
Cash flows from operating activities:
Receipts from customers $ 781,183,948 $ 642,806,077
Payments to vendors for goods and services (52,437,817) (47,712,684)
Payments to employees for services (5,750,054) (5,524,150)
Payments for prizes (242,479,461) (134,890,079)
Payments for commissions (220,219,008) (198,263,195)
Net cash provided by operating activities 260,297,608 256,415,969
Cash flows from noncapital financing activities:
Transfers to the Delaware Standardbred Breeder’s Program (3,000,000) (3,000,000)
Transfers to the Delaware Certified Thoroughbred Program (1,000,000) (1,000,000)
Transfers to the State of Delaware (257,452,379) (250,304,247)
Net cash used in noncapital financing activities (261,452,379) (254,304,247)
Net change cash and investments (1,154,771) 2,111,722
Cash and investments at beginning of year 5,903,324 3,791,602
Cash and investments at end of year $ 4,748,553 $ 5,903,324
Reconciliation of operating income to net cash provided by operating activities:
Operating income $ 259,691,920 $ 255,821,130
Adjustments to reconcile operating income to net cash
provided by operating activities:
Effect of changes in operating assets and liabilities:
Accounts receivable, net (1,533,462) (2,915,966)
Prizes liability 1,882,672 1,616,447
Accounts payable and accrued liabilities 256,478 1,894,358
Net cash provided by operating activities $ 260,297,608 $ 256,415,969
See accompanying notes to basic financial statements.

DELAWARE STATE LOTTERY Notes to Basic Financial Statements
June 30, 2019 and 2018
33
(1) Summary of Significant Accounting Policies
(a) Legislative Enactment
The Delaware State Lottery (the Lottery) was established by Enabling Legislation (the Legislation) passed on May 31, 1974, by the General Assembly of the State of Delaware (the General Assembly) under the authority of the Governor’s Office and under the supervision of a Director. In July 1976, the Lottery was transferred to the Office of the Secretary of Finance. The Director has the power and duty to establish rules for conducting games, including the type and number of games, the price of tickets, the number and amounts of winning tickets, the manner of selecting winning tickets, the manner of prize payment, frequency of drawings, locations and methods for the sale of tickets, procedures for licensing of retailers, and all other functions related to the operation of the Lottery. The Legislation provides that, for the non‐video lottery games, at least 45% of total revenue shall be used to pay prizes, operating expenses shall not exceed 20% of total revenue, and the Lottery shall undertake to provide into the General Fund of the State of Delaware a payment of earnings of 30%. Enabling legislation for video lottery was enacted on July 16, 1994 and provides that, for the video lottery games, at least 87%, but not more than 95% (unless approved by the Director), of total proceeds on an average annual basis shall be used to pay prizes.
(b) Reporting Entity
The Delaware State Lottery (reporting entity) is an enterprise fund of the State of Delaware.
(c) Basis of Presentation
In accordance with accounting principles generally accepted in the United States of America, the financial statements are prepared on the accrual basis of accounting, which requires recognition of revenues when earned and expenses when incurred.
(d) Deferred Outflows and Inflows of Resources
In addition to assets, the Statement of Net Position includes a separate section for deferred outflows of resources. The deferred outflows of resources represent a consumption of net position that applies to future periods.
In addition to liabilities, the Statement of Net Position includes a separate section for deferred inflows of resources. This separate section represents a source of net position that will be amortized to future periods.

DELAWARE STATE LOTTERY Notes to Basic Financial Statements
June 30, 2019 and 2018
34
(e) Cash and Investments
Cash and investments consist of deposits held in bank accounts and highly liquid overnight investment accounts, as well as deposits held by the State to fund future non‐prize costs during the next month.
(f) Accounts Receivable
Accounts receivable consist primarily of unsettled balances due to the Lottery from the racetracks for video lottery and table games, and from retailers, which principally include grocery and convenience stores serving as the primary distribution channel for traditional lottery sales (drawing and instant games) to the general public. Accounts receivable are stated at the carrying amount net of allowance for uncollectible accounts. An allowance for uncollectible accounts receivable is established when specific customer collection issues are identified. Uncollectible accounts are written off when management has determined that the balance will not be collected.
2019 2018
Receivables:Accounts $ 12,369,828 $ 11,669,384
Total receivables 12,369,828 11,669,384
Allowance for doubtful accounts — (833,018)
Total receivables, net $ 12,369,828 $ 10,836,366
Amounts not scheduled for collection during thesubsequent year $ — —
(g) Investments
Investments consist of annuity contracts purchased from insurance companies to fund future prize payments and are carried at amortized cost as nonparticipating investment contracts. The practice of purchasing and holding annuity contracts to fund future prize obligations is no longer employed by the Lottery, as investment amounts reported represent annuity contracts whose most recent purchase was during 1998. It is the Lottery’s policy to hold all investments of this nature that were purchased to fund prize obligations until maturity. All investments the Lottery had on hand have matured.
(h) Capital Assets
All purchases of capital assets, mostly computer equipment and furniture and fixtures, in excess of $25,000 are capitalized and carried at cost. Depreciation is computed by using the straight‐line method over the estimated useful life of 10 years. When assets are retired or otherwise disposed of, the cost and related accumulated depreciation are removed from the accounts and any resulting gain or loss is reflected in operations in the period of disposal. During the fiscal years ending June 30, 2019, and June 30, 2018, the Lottery had no new purchases of capital assets and had properly disposed of all old capital assets
DELAWARE STATE LOTTERY Notes to Basic Financial Statements
June 30, 2019 and 2018
35
(i) Revenue Recognition
Revenue from drawing games and sports lottery is recognized on the day of purchase. Revenue from the sale of instant tickets is recognized when the book has been activated and when one of the following occurs:
85% of the related prizes of an activated book is paid
90 days from the date of activation
When the next pack of the same game is activated
Revenue from video lottery and table game sales is recognized, net of prizes paid, at the time the public plays the game. All revenue that the Lottery reports is considered operating revenue.
(j) Prize Obligations
Prize obligations for the traditional draw games and sports lottery are determined and recognized after each drawing or sports game is held. For the number’s games, winners are paid a certain amount depending upon the number of, or order of, winning numbers. Of every Multi Win Lotto sales dollar, a fixed payment goes to fund the nine lower prize levels with the balance going into the jackpot. If there are no jackpot winners in the Lotto game, the amount is carried forward until there is a winner. For the Powerball, Lotto America, and Mega Millions, 50% of the revenues are allocated to the prize pool.
Prize obligations related to instant games are recognized by taking the greater of prize cash disbursements or the historical estimates of claimed prizes. Disbursements for prizes, including installment prize awards, are charged against the obligations for unpaid prize awards. Prizes unclaimed after one year revert back to the Lottery and reduce the prize costs for the year. Such unclaimed monies are then remitted to the State.
(k) Compensated Absences
The Lottery has accrued a liability included in accounts payable and accrued liabilities for employee future absences, recognizing the obligation relating to services already rendered. This liability represents benefits accrued to Lottery employees for vacation earned as of year‐end and sick leave estimated to be paid out at retirement for services rendered as of June 30, 2019. Employees earn from 9.5 to 13.25 hours of vacation leave per month depending on years of service. The employee or his or her estate is paid for unused vacation upon termination of employment. Employees earn 9.5 hours of sick leave per month. The Lottery’s obligation for sick leave credit is a maximum of 337.5 hours. As of June 30, 2019, and 2018, the Lottery had liabilities of $234,915 and $229,406 for accrued vacation and $231,990 and $221,760 for accrued sick leave, respectively.

DELAWARE STATE LOTTERY Notes to Basic Financial Statements
June 30, 2019 and 2018
36
(l) Operating and Nonoperating Expenses
Operating expenses generally result from providing services and producing and delivering goods in connection with the Lottery’s principal ongoing operations. Operating expenses of the Lottery include personnel costs, travel costs, contracted services, and supplies. All expenses not meeting this definition are reported as nonoperating expenses.
(m) Net Pension Liability
For purposes of measuring the net pension liability, deferred outflows of resources and deferred inflows of resources related to pensions, and pension expense, information about the fiduciary net position of the Delaware Public Employees Retirement System (DPERS) and additions to/deductions from DPERS’ fiduciary net position have been determined on the same basis as they are reported by DPERS. For this purpose, benefit payments (including refunds of employee contributions) are recognized when due and payable in accordance with the benefit terms. Investments are reported at fair value.
(n) Net OPEB Liability For purposes of measuring the net Other Postemployment Benefits (OPEB) liability, deferred outflows of resources and deferred inflows of resources related to OPEB and OPEB expenses, information about the fiduciary net position of OPEB Trust and additions to/deductions from OPEB Trust’s fiduciary net position have been determined on the same basis as they are reported by the OPEB Trust. For this purpose, benefit payments (including refunds of employee contributions) are recognized when due and payable in accordance with the benefit terms. Investments are reported a fair value.
(2) Cash and Investments
Cash and investments reported reflect three types of account balances: the Lottery deposit account, the Lottery prize accounts, and pooled cash and investments held by the State Treasurer’s Office. Cash receipts and all cash transfers to other state agencies are made in and out of the Lottery deposit account. Prize disbursements are made out of the Lottery prize accounts. Pooled cash and investments are comprised of cash and cash equivalents and short and long‐term investments that are managed by the State Treasurer’s Office.

DELAWARE STATE LOTTERY Notes to Basic Financial Statements
June 30, 2019 and 2018
37
Cash and investment balances consisted of the following:
June 302019 2018
On hand and in bank $ 2,771,742 $ 3,461,584 Pooled cash and investments 1,976,811 2,441,740
Total cash and investment balances $ 4,748,553 $ 5,903,324
Custodial Credit Risk
For deposits, custodial credit risk is the risk that, in the event of the failure of a depository financial institution, the deposits or collateral securities may not be recovered from an outside party.
All deposits are required by state law to be collateralized by direct obligations of, or obligations guaranteed by, the U.S. government or other suitable obligations as determined by the State’s Cash Management Policy Board (the Board), unless the Board shall find such collateralization not in the best interest of the State. Additionally, the Board has determined that deposits need not be collateralized provided they are held in a bank that for the previous two years has had a return on total average assets of 0.5% or greater and has had an average capital ratio (total equity to total assets) of at least 5.0%. If the bank does not meet the aforementioned criteria, collateral must consist of one or more of the following:
U.S. government securities;
U.S. government agency securities;
Federal Home Loan Board letters of credit;
State securities; or
Securities of a political subdivision of the State with a Moody’s Investors service rating of “A” or better.
In addition, the bank must ensure that those securities pledged as collateral have a market value equal to or greater than 102% of the ledger balance(s) in the account(s) each day and ensure that securities pledged are identified as held in the State’s name and are segregated on the bank’s records.
The bank balance of deposits was not subject to custodial credit risk as all amounts were either fully insured and/or collateralized. As of June 30, 2019, and June 30, 2018, the total bank balance of cash in all bank accounts was $2,881,693 and $3,598,928 respectively. Pooled cash and investments maintained by the State Treasurer is not deemed to have custodial credit risk with regard to the Lottery.

DELAWARE STATE LOTTERY Notes to Basic Financial Statements
June 30, 2019 and 2018
38
(3) Investments
All previous investments reported on the statement of net position have reached maturity. (a) Interest Rate Risk
Interest rate risk is the risk that changes in interest rates of debt instruments will adversely affect the value of an investment. Investments reported on the balance sheet are not subject to interest rate risk.
(b) Credit Risk and Concentration of Credit Risk
Credit risk is the risk that an issuer or other counterparty to an investment will not fulfill its obligations. While the Lottery no longer utilizes the purchase of annuity contracts to fulfill prize obligations, the Lottery places no limit on the amount it may invest in any one issuer.
(4) Capital Assets During the years ending June 30, 2019, and June 30, 2018, the Lottery did not have any new purchases of capital assets. Currently, there are no capital assets or corresponding depreciation expense.
(5) Prize Obligations
The following is a reconciliation of changes in the prize liability account, which includes the present value of prize installment obligations, for the fiscal years ended June 30, 2019 and 2018:
2019 2018
Prize obligations, beginning of year $ 6,662,632 $ 5,065,864 Prize payments (242,479,461) (134,909,758) Prize costs, net of reversions 244,362,133 136,506,526
Prize obligations, end of year $ 8,545,304 $ 6,662,632
(6) Participation in the Multi‐State Lottery
The Lottery is a member of the Multi‐State Lottery (the MUSL), which operates traditional draw games on behalf of participating state lotteries. Each MUSL member sells game tickets through its agents and makes weekly wire transfers to the MUSL in an amount equivalent to the member’s share of the estimated grand prize liability. Each MUSL member pays lesser prizes directly to the winners. The MUSL has operated the Powerball game since fiscal year 2008, Mega Millions game since 2010, and Lotto America since 2018. Participating lotteries are required to maintain deposits with MUSL for contingency reserves to protect MUSL from unforeseen prize liabilities. The money in this reserve fund is refundable to MUSL members if the MUSL disbands or if a member leaves the MUSL Board. The MUSL has an agreement that grants MUSL the nonexclusive right to offer the

DELAWARE STATE LOTTERY Notes to Basic Financial Statements
June 30, 2019 and 2018
39
multi‐jurisdictional lottery game known as the “Mega Millions Game,” to be conducted by the MUSL member lotteries. The amount the Lottery had on deposit with the MUSL, as of June 30, 2019 and 2018, equaled $2,845,122 and $2,467,039 respectively. These amounts are also reported as a liability on the Lottery’s balance sheet because they represent the amount to be paid to the State’s General Fund upon separation from the MUSL, if the MUSL is not required to use any portion of the Lottery’s reserves held by the MUSL.
(7) Delaware Standard Breeder’s Program and Delaware Certified Thoroughbred Program
In March 1998, an amendment to the Legislation was passed by the General Assembly that established the Delaware Standardbred Breeder’s Program for the purpose of promoting the Delaware harness racing industry. This legislation, amended in 2004, and 2008 requires the Lottery to withhold $3,000,000 of funds annually ($750,000 from the State General Fund, $1,500,000 from Purses, and $750,000 from Video commissions) and remit to the Delaware Standardbred Breeder’s Program. In the epilogue language of the fiscal year 2006 Bond Bill, an amendment was passed by the General Assembly that established the Delaware Certified Thoroughbred Program for the purpose of enhancing the quantity of thoroughbred foals and/or yearlings stabled within Delaware. This legislation, amended in 2008, requires the Lottery to withhold $1,000,000 of funds annually ($250,000 from the State General Fund, $500,000 from Purses, and $250,000 from Video Commissions) and remit these funds to the Delaware Certified Thoroughbred Program.
(8) Contributions to the State of Delaware
As required, under the Legislation, net position of the Lottery may not exceed $1,000,000; therefore, the Lottery periodically transfers surplus funds to the State in accordance with the Legislation. For the years ended June 30, 2019 and 2018, the Lottery made the following contributions to the State.
June 30
2019 2018
Amounts transferred and to be transfered to the State for the fiscal year:
General Fund $ 213,826,875 $ 213,325,651 Department of Health and Social Services 1,728,607 1,584,083 Department of Agriculture 40,136,438 36,911,396
$ 255,691,920 $ 251,821,130

DELAWARE STATE LOTTERY Notes to Basic Financial Statements
June 30, 2019 and 2018
40
(9) Revenue and Expenses by Game
The following revenue was recognized:
Year ended June 302019 2018
Draw games:
Play 3 Day $ 10,739,010 $ 10,491,733
Play 3 Night 16,721,484 16,530,817
Play 4 Day 8,985,908 8,564,019
Play 4 Night 14,737,567 14,217,965
Multi Win Lotto 4,514,384 4,559,172
Powerball 25,229,105 24,577,701
Hot Lotto ‐ 1,300,792
Lotto America 3,367,629 2,129,759
Mega Millions 20,707,521 12,072,786
Keno 8,594,476 8,721,480
Lucky for Life 2,910,662 3,022,369
Total draw games 116,507,746 106,188,593
Instant games 79,809,999 70,599,375
Total traditional lottery 196,317,745 176,787,968
Video lottery, net 367,399,349 353,776,920
I‐Gaming video lottery, net 3,166,045 2,178,023
Video lottery expired jackpots and credit slips 381,685 379,558
Casino license fees 211,300 3,221,800
Sports lottery 158,630,194 54,747,779
Table games, net 56,611,092 54,629,995
Total revenue $ 782,717,410 $ 645,722,043

DELAWARE STATE LOTTERY Notes to Basic Financial Statements
June 30, 2019 and 2018
41
The revenue, prize costs, and commission expense, by game type, are listed below:
Video lottery Igaming Sports Table
net video, net lottery games, net Draw games Instant Total
Year ended June 30, 2019:
Revenue $ 367,399,348 3,166,045 158,630,194 56,611,092 116,507,746 79,808,944 782,123,370
Other income 381,685 211,300 1,055 594,040
Prize costs, net of
reversions 132,473,496 58,773,996 53,114,641 244,362,133
367,781,033 3,166,045 26,156,699 56,822,392 57,733,750 26,695,358 538,355,277
Commissions expense 156,338,344 — 6,699,434 45,288,873 7,296,461 4,882,522 220,505,634
Contributionmargin
per game $ 211,442,689 3,166,045 19,457,265 11,533,519 50,437,289 21,812,836 317,849,643
Game vendor fees 29,205,706 2,101,162 4,639,631 — 6,578,755 4,923,456 47,448,710
Gross margin 182,236,983 1,064,883 14,817,634 11,533,519 43,858,534 16,889,380 270,400,933
Video lottery Igaming Sports Table
net video, net lottery games, net Draw games Instant Total
Year ended June 30, 2018:
Revenue $ 353,776,920 2,178,023 54,747,779 54,629,995 106,188,593 70,599,375 642,120,685
Other income 3,601,358 — — — — — 3,601,358
Prize costs, net of
reversions — — 36,199,716 — 53,621,285 46,685,525 136,506,526
357,378,278 2,178,023 18,548,063 54,629,995 52,567,308 23,913,850 509,215,517
Commissions expense 149,150,781 — 3,913,713 36,110,427 6,546,770 4,217,630 199,939,321
Contributionmargin
per game $ 208,227,497 2,178,023 14,634,350 18,519,568 46,020,538 19,696,220 309,276,196
Game vendor fees 27,253,703 1,782,125 3,842,631 — 6,155,206 3,975,379 43,009,044
Gross margin 180,973,794 395,898 10,791,719 18,519,568 39,865,332 15,720,841 266,267,152
(10) Payroll‐Related and Other Benefits
All Lottery personnel are employees of the State of Delaware and are covered by pension, health insurance, and other employee benefit programs administered by agencies of the State. During fiscal year 2019 and fiscal year 2018, the Lottery incurred $5,754,456 and $5,506,623 respectively, of payroll and benefit costs, including pension, health insurance, and other employee benefit costs, paid to various state agencies responsible for the administration of benefit programs.
(11) Pension and Other Postemployment Benefits
(a) Pension
The Lottery contributes to the State Employees’ Pension Plan (the Plan) established by the State to provide benefits for state employees. The Plan is a cost‐sharing multiple employer
DELAWARE STATE LOTTERY Notes to Basic Financial Statements
June 30, 2019 and 2018
42
defined benefit pension plan established in the Delaware Code. The State of Delaware is responsible for setting benefits and amending plan provisions. The Plan prepares separate financial statements and is administered by the Delaware Public Employees’ Retirement System (DPERS). All details of the Plan can be obtained by writing to the State Board of Pension Trustees and Office of Pensions, McArdle Building, Suite #1, 860 Silver Lake Boulevard, Dover, Delaware 19904‐2402.
Benefits Provided
The Plan provides retirement, disability and death benefits. Pre‐2012 members are eligible for monthly retirement benefits upon reaching (a) age 62 with at least five years of credit service: (b) age 60 with 15 years of credit service; or (c) 30 or more years of service regardless of age. Post‐2011 members are eligible for monthly retirement benefits upon reaching (a) age 65 with at least ten years of credited service; (b) age 60 with 20 years of credit service; or (c) 30 or more years of service regardless of age. Pre‐2012 participants are eligible for disability benefits after five years of credited service. In lieu of disability pension benefits, over 90% of the members in this plan opted into a Disability Insurance Program offered by the State effective January 1, 2006. Post‐2011 participants are not offered disability pension benefits and are in the Disability Insurance Program. Death benefits are payable upon the death of an active member who has reached age 62 with at least five years of credit service. Such benefits are paid at 75% of the benefit the employee would have received at age 62. If an employee is currently receiving a pension, the eligible survivor receives 50% of the pension benefit (or 75% with 3% reduction of benefit). Burial benefits of $7,000 per member are also provided.
Employee Contributions
Pre‐2012 members contribute at 3% of earnings in excess of $6,000. Post‐2011 members contribute at 5% of earnings in excess of $6,000.
Employer Contributions
Employer contributions are determined by the Board of Pension Trustees. For the year ended June 30, 2019 and 2018, the rate of the employer contribution was 11.8% and 10.4% percent of covered payroll respectively. The Lottery’s employer contributions for the years ended June 30, 2019 and 2018 was $304,759 and $253,999 respectively.
Net Pension Liability and Expense
At June 30, 2019 and 2018, the Lottery reported a net pension liability of $1,585,580 and $1,860,152, respectively, for its proportionate share of the net pension liability of the State of Delaware. The net pension liability at June 30, 2019, was measured as of June 30, 2018, and the total pension liability used to calculate the net pension liability was determined by

DELAWARE STATE LOTTERY Notes to Basic Financial Statements
June 30, 2019 and 2018
43
rolling forward the Plan's total pension liability as of June 30, 2017 to June 30, 2018. As of the measurement date, June 30, 2018, the lottery’s proportion was 0.1228 percent, a decrease of 0.0041 percent from June 30, 2017. As of the measurement date, June 30, 2017, the Lottery’s proportion was 0.1269 percent, which was a decrease of 0.0058 percent from its proportion measured as of June 30, 2016. For the years ended June 30, 2019 and 2018, the Lottery recognized a pension expense of $306,987 and $359,712.
Deferred Outflows and Inflows of Resources
At June 30, 2019 and 2018, the Lottery reported deferred outflows of resources of $304,759 and $253,999, respectively, for its contributions after the measurement date, which will be recognized as a reduction of the net pension liability in the following year.
At June 30, 2019 and 2018, the Lottery reported deferred outflows of resources related to pensions from the following sources:
2019 2018
Net difference between projected and and actual
investment earnings ‐$ 217,458$
Difference between actual and expected
experience 82,865 21,474
Changes in assumptions 276,068 365,495
Contributions sussequent to the date of
measurement 304,759 253,999
663,692$ 858,426$
At June 30, 2019 and 2018, the Lottery reported deferred inflows of resources related to pensions from the following sources:
2019 2018
Net difference between projected and actual
investment earnings 67,212$ ‐$
Difference between actual and expected experience 22,884 32,796
Changes in proportions 103,445 91,693
193,541$ 124,489$

DELAWARE STATE LOTTERY Notes to Basic Financial Statements
June 30, 2019 and 2018
44
Amounts reported as deferred inflows of resources at June 30, 2019, related to pensions will be recognized as part of pension expense in future periods as follows:
Year Ending
June 30
2020 (183,912)$
2021 (101,089)
2022 84,226
2023 26,458
2024 8,925
(165,392)$
Actuarial Assumptions
The collective total pension liability for the June 30, 2018 measurement date was determined by an actuarial valuation as of June 30, 2017, with update procedures used to roll forward the total pension liability to June 30, 2018. This actuarial valuation used the following actuarial assumptions:
Investment Return includes inflation at 2.5% Salary Increases – 2.5% + Merit, includes inflation at 2.5%
The total pension liabilities are measured based on assumptions pertaining to the interest rates inflation rates, and employee demographic behavior in future years. It is likely that future experience will not exactly conform to these assumptions. To the extent that actual experience deviates from these assumptions, the emerging liabilities may be higher or lower than anticipated. The more the experience deviates the larger the impact on future financial statements. Mortality assumptions are based on the Sex distinct RP‐2014 tables with gender adjustments for healthy annuitants and disabled retirees and an adjusted version on MP‐2015 mortality improvement scale on a fully generational basis. Projected benefit payments do not include the effects of projected ad hoc cost‐of‐living adjustments (ad hoc COLAs) as they are not substantively automatic. The primary considerations relevant to making this determination include the historical pattern of granting the changes and the consistency in the amounts of the changes. The long‐term expected rate of return on plan investments was determined using a building‐block method in which best‐estimate ranges of expected future real rates of return (expected returns, net of plan investment expense and inflation) are developed for each major asset class. These ranges are combined to produce the long‐term expected rate of return by weighting the expected future real rates of return by an asset allocation percentage, which is based on the nature and mix of current and expected plan investments, and by adding
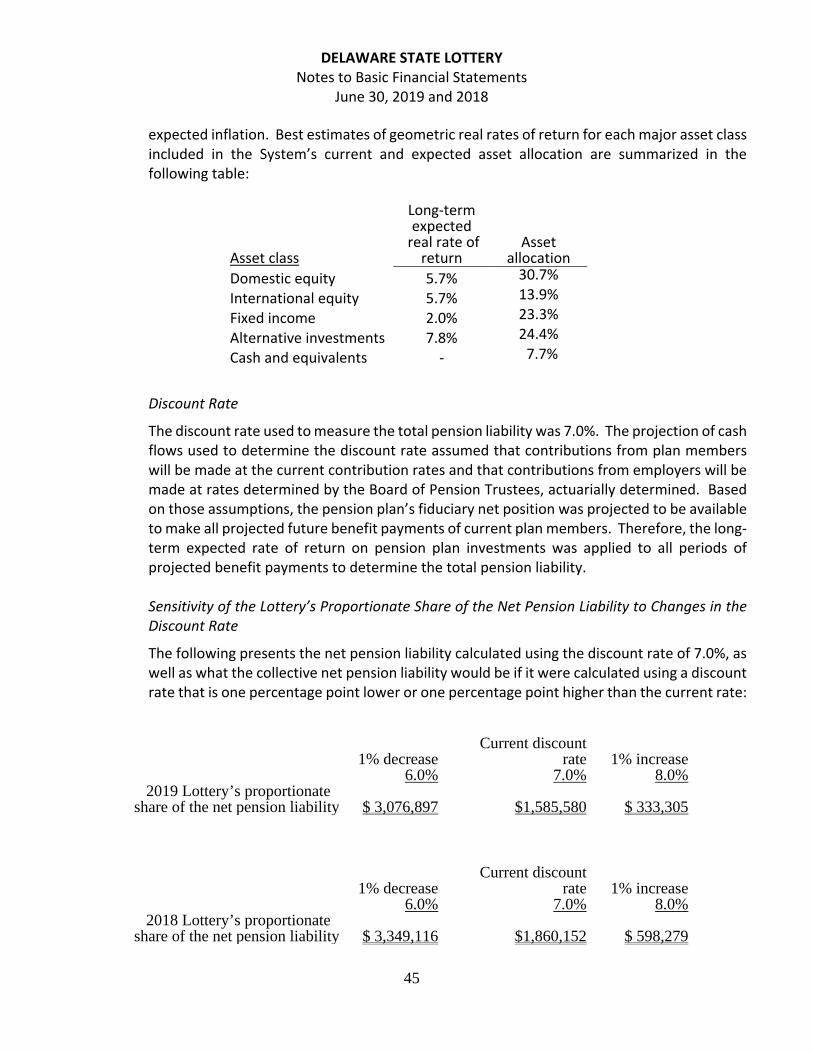
DELAWARE STATE LOTTERY Notes to Basic Financial Statements
June 30, 2019 and 2018
45
expected inflation. Best estimates of geometric real rates of return for each major asset class included in the System’s current and expected asset allocation are summarized in the following table:
Asset class
Long‐term expected
real rate of return
Asset allocation
Domestic equity 5.7% 30.7%
International equity 5.7% 13.9%
Fixed income 2.0% 23.3%
Alternative investments 7.8% 24.4%
Cash and equivalents ‐ 7.7%
Discount Rate
The discount rate used to measure the total pension liability was 7.0%. The projection of cash flows used to determine the discount rate assumed that contributions from plan members will be made at the current contribution rates and that contributions from employers will be made at rates determined by the Board of Pension Trustees, actuarially determined. Based on those assumptions, the pension plan’s fiduciary net position was projected to be available to make all projected future benefit payments of current plan members. Therefore, the long‐term expected rate of return on pension plan investments was applied to all periods of projected benefit payments to determine the total pension liability. Sensitivity of the Lottery’s Proportionate Share of the Net Pension Liability to Changes in the Discount Rate
The following presents the net pension liability calculated using the discount rate of 7.0%, as well as what the collective net pension liability would be if it were calculated using a discount rate that is one percentage point lower or one percentage point higher than the current rate:
1% decrease
6.0%
Current discount rate
7.0% 1% increase
8.0% 2019 Lottery’s proportionate share of the net pension liability $ 3,076,897 $1,585,580 $ 333,305
1% decrease
6.0%
Current discount rate
7.0% 1% increase
8.0% 2018 Lottery’s proportionate share of the net pension liability $ 3,349,116 $1,860,152 $ 598,279

DELAWARE STATE LOTTERY Notes to Basic Financial Statements
June 30, 2019 and 2018
46
Pension Plan Fiduciary Net Position
Detailed information about the Delaware Public Employees’ Retirement System (DPERS) fiduciary net position is available in the DPERS Comprehensive Annual Financial Report which can be obtained from the pension office at McArdle Building, Suite 1; 860 Silver Lake Blvd; Dover, DE, 19904. Net Position – Pension
By implementing the requirements of GASB Statement No. 68 and GASB Statement No. 71 in fiscal year 2015, the Lottery recognized deferred outflows, net pension liability, and deferred inflows, which affects the Lottery’s net position. Legislation dictates that the Lottery can only maintain a net position of $1,000,000; therefore, any such changes are reflected as an amount due from the State.
(12) Other Postemployment Benefits (OPEB)
The Lottery contributes to the State Employees’ Other Postemployment Benefits Fund Trust (OPEB Trust) established by the State to provide benefits for state employees. The OPEB Trust is a cost‐sharing multiple employer defined benefit plan established in the Delaware Code. Policy for and management of the OPEB Trust benefits provided to retirees are the responsibility of the State. Beginning in FY 2018, the OPEB Trust prepares separate financial statements and is administered by the Delaware Public Employees’ Retirement System (DPERS). All details of the OPEB Trust can be obtained by writing to the State Board of Pension Trustees and Office of Pensions, McArdle Building, Suite #1, 860 Silver Lake Boulevard, Dover, Delaware 19904‐2402.
Benefits Provided
The OPEB Trust provides medical coverage to eligible pensioners and their eligible dependents through the same healthcare plans that are available to active employees. The participant’s cost and vesting provisions of OPEB benefits is variable based on years of service. Pensioners who retire after July 1, 2012 and who become eligible for Medicare will pay an additional five percent of the Medicare Supplement offered by the State. Surviving spouses are eligible for coverage after a retiree’s death. Contributions
Participating employers fund the OPEB Trust for current retirees on a pay‐as‐you‐go basis along with funding for future benefits at a rate that is approved in the annual budget, but not actuarially determined. By State Statute Chapter 52, Title 29 of the Delaware Code, contribution requirements of plan members and the government are established and may not be amended by the State Legislature.

DELAWARE STATE LOTTERY Notes to Basic Financial Statements
June 30, 2019 and 2018
47
For the year ended June 30, 2019, the rate of the employer contribution 12.1 percent of covered payroll. The Lottery’s employer contributions for the years ended June 30, 2019 and 2018 was $303,694 and $268,793, respectively. The Lottery’s required contributions equaled actual contributions made for the years ended June 30, 2019 and 2018. Net OPEB Liability and Expense At June 30, 2019 and 2018, the Lottery reported a net Other Postemployment Benefits (OPEB) liability of $9,824,521 and $10,235,689, respectively, for its proportionate share of the net OPEB liability of the State of Delaware. The net OPEB liability was measured as of June 30, 2018, and the total OPEB liability used to calculate the net OPEB liability was determined by rolling forward the Plan’s total OPEB liability as of June 30, 2017 to June 30, 2018. The net OPEB liability was measured as of June 30, 2017, and the total OPEB liability used to calculate the net OPEB liability was determined by rolling forward the Plan’s total OPEB liability as of June 30, 2016 to June 30, 2017. As of the measurement date, June 30, 2018, the Lottery’s proportion is based on the percentage of actual employer contributions during the period ending June 30, 2018. The Lottery’s 2018 and 2017 proportion was 0.1197 percent and 0.1240 percent, respectively. The 2018 portion showed a decrease of 0.0004 percent from its proportion measured as of June 20, 2017. The 2017 portion showed a decrease of 0.0046 percent from its proportion measured as of June 30, 2016. For the year ended June 30, 2019 and 2018, the Lottery recognized an OPEB expense of $264,708 and $412,436, respectively. Deferred Outflows and Inflows of Resources
At June 30, 2019 and 2018, the Lottery reported deferred outflows of resources related to OPEB from the following sources:
2019 2018 Contributions subsequent to the date of
measurement $ 303,694 $ 268,793
At June 30, 2019 and 2018, the Lottery reported deferred inflows of resources related to OPEB from the following sources:
2019 2018 Net difference between projected and actual
investment earnings $ 24,685 $ 20,267 Changes in assumptions 1,334,798 1,194,939 Changes in proportions 611,495 348,689
$ 1,970,978
$ 1,563,895

DELAWARE STATE LOTTERY Notes to Basic Financial Statements
June 30, 2019 and 2018
48
The cumulative amounts of collective net deferred outflows of resources and deferred inflows of resources will be recognized in OPEB expense as follows:
Year Ending
June 30
2020 (458,442)$
2021 (458,442)
2022 (458,442)
2023 (453,375)
2024 (142,277)
(1,970,978)$
Actuarial Assumptions
The total OPEB liability for the June 30, 2018 measurement date was determined by an actuarial valuation as of June 30, 2017, with update procedures used to roll forward the total OPEB liability to June 30, 2018. These actuarial valuations used the following actuarial assumptions.
Actuarial assumptions: June 30, 2018 June 30, 2017 Discount Rate 3.87% 3.58%
Projected Salary increases 3.25% + Merit 3.25% + Merit Healthcare cost trends rates 6.80% 7.00%
Mortality rates were based on the sex‐distinct employee, healthy annuitant, and disabled annuitant mortality tables derived from the RP‐2014 Total Dataset Employee Mortality Table, including adjustment factors. Future mortality improvements are reflected by applying a custom projection scale on a generational basis to adjusted base tables from the base year. The total OPEB liabilities are measured based on assumptions pertaining to the interest rates, inflation rates, health costs, and employee demographics behavior in future years. The assumptions used were based on the results of an actuarial experience study conducted in 2016. It is likely that future experiences will not exactly conform to these assumptions. To that extent liabilities may be higher or lower than anticipated. The more the experience deviates the larger the impact on future financial statements.
The long‐term expected rate of return on the Trust’s investments was determined using a building‐block method in which best‐estimate ranges of expected future real rates of return (expected returns, net of investment expense and inflation) are developed for each major asset class. These ranges are combined to produce the long‐term expected rate of return by

DELAWARE STATE LOTTERY Notes to Basic Financial Statements
June 30, 2019 and 2018
49
weighting the expected future real rates of return by the target asset allocation percentage and by adding expected inflation. Best estimates of arithmetic real rates of return for each major asset class as of June 30, 2018 are summarized in the following table:
Asset class
Asset
Allocation Range
Min Max
Long‐term expected real rate of return
Asset allocation
Equity 20% 80% Domestic equity 5.7% 38.7% International equity 5.7% 19.0% Fixed income 20% 80% Domestic Fixed Income 2.0% 39.3% Cash and Cash Equivalents 0.0%
Discount Rate
The discount rate used to measure the total OPEB liability was 3.58% at the beginning of the current measurement period and 3.87% at the end of the current measurement period, based on the Bond Buyer GO 20‐Bond Municipal Bond Index. The projection of cash flows used to determine the discount rate assumed that contributions from plan members will be made at the current contribution rate and the employer contributions to the OPEB will continue to follow the pay‐as‐you‐go contribution policy. Based on the assumptions of a pay‐as‐you‐go plan, the discount rates used for June 30, 2018 measurement dates are equal to the applicable rate of the 20‐year, tax exempt general obligation municipal bonds with an average rating of AA/Aa or higher.
Sensitivity of the Net OPEB Liability to Changes in the Discount Rate:
1 % Decrease
Discount Rate
1% Increase
2.87% 3.87% 4.87% 2019 Lottery’s proportionate share of Collective Net OPEB liability
$11,690,918
$9,824,521
$8,356,972
1 % Decrease
Discount Rate
1% Increase
2.58% 3.58% 4.58% 2018 Lottery’s proportionate share of Collective Net OPEB liability
$12,272,674
$10,235,689
$8,647,782

DELAWARE STATE LOTTERY Notes to Basic Financial Statements
June 30, 2019 and 2018
50
Sensitivity of the Net OPEB Liability to Changes in the Healthcare Cost Trend Rates:
1 % Decrease Health Care Trend 1% Increase 5.8% 6.8% 7.8%
2019 Lottery’s proportionate share of Collective Net OPEB liability
$8,364,989
$9,824,521
$11,601,859
1 % Decrease Health Care Trend 1% Increase 6.0% 7.0% 8.0%
2018 Lottery’s proportionate share of Collective Net OPEB liability
$8,666,222
$10,235,689
$12,157,385
Pension Plan Fiduciary Net Position
Detailed information about the Delaware Public Employees’ Retirement System (DPERS) fiduciary net position is available in the DPERS Comprehensive Annual Financial Report which can be obtained from the pension office at McArdle Building, Suite 1; 860 Silver Lake Blvd; Dover, DE, 19904.
(13) Risk Management
The Lottery stipulates in its vendor contracts that the vendors carry various insurance coverage such as property (video gaming machines and online terminals, etc.), general liability, errors and omissions, automotive, and crimes. The Lottery’s risks of losses related to workers’ compensation, employee healthcare, automobile, and a portion of property and casualty claims are insured internally by the State.
(14) Commitments
The Lottery has entered into various contracts for services to be rendered relating principally to the operation of the Lottery’s games. Under the gaming systems contract the Lottery is committed to 5.371% of draw game sales, 4.18% of PHD sales, 9.95% of Keno sales, 5.6% of instant sales, 12.5% of track sports net revenue and 25% of retailer sports net revenue, 1% of video net gaming revenue, and 25% of net win for charitable gaming video machines to its central system provider through October 2022. For video lottery terminals, the lottery is committed to a range of 6.5% to 7.0% to video lottery vendors through October 28, 2020. For video lottery terminals classified as electronic table games (ETG), the Lottery is committed to a range of 7% to 20% through March 15, 2021.

51
Proportionate Share of Net Pension Liability
Measurement date 6/30/2018 6/30/2017 6/30/2016 6/30/2015 6/30/2014
Lottery's proportion of the net pension l iabil ity 0.1228% 0.1269% 0.1327% 0.1370% 0.1407%
Lottery's proportion of the net pension l iabil ity ‐
dollar value 1,585,580$ 1,860,152$ 1,999,680$ 911,588$ 518,009$
Lottery's covered payroll 2,438,127$ 2,472,103$ 2,530,813$ 2,555,038$ 2,589,613$
Lottery's proportionate share of the net pension
l iabil ity 65.0% 75.2% 79.0% 35.7% 20.0%
as a percentage of its covered payroll
Plan fiduciary net position as a percentage of the
total pension l iabil ity 87.5% 85.4% 84.1% 92.7% 95.8%
Contributions 2019 2018 2017 2016 2015
Contractually required contributions 304,759$ 253,999$ 236,800$ 242,448$ 244,307$
Contributions in relation to the contractually
required contributions 304,759 253,999 236,800 242,448 244,307
Contribution excess (deficit) ‐$ ‐$ ‐$ ‐$ ‐$
Lottery's covered payroll 2,577,989$ 2,438,127$ 2,472,103$ 2,530,813$ 2,555,038$
Contribution as a percentage of covered payroll 11.83% 10.42% 9.58% 9.58% 9.56%
Delaware State Lottery
Required Supplementary Information
Schedule of Proportionate Share of the Net Pension Liability and Contributions
In accordance with GASB Statement No. 68, this schedule has been prepared prospectively as the above information for the
preceding years is not readily available.
This schedule will accumulate each year until sufficient information to present a ten year trend is available.

52
Proportionate Share of Net OPEB Liability
Measurement date 6/30/2018 6/30/2017 6/30/2016
Lottery's proportion of the net OPEB l iabil ity 0.1197% 0.1240% 0.1286%
Lottery's proportion of the net OPEB l iability ‐ dollar value 9,824,521$ 10,235,689$ 11,681,265$
Lottery's covered payroll 2,455,646$ 2,472,103$ 2,530,772$
Lottery's proportionate share of the net OPEB l iabil ity 400.1% 414.0% 461.6%
as a percentage of its covered payroll
Plan fiduciary net position as a percentage of the total OPEB l iabil ity 4.4% 4.1% 3.3%
Contributions 2019 2018 2017
Contractually required contributions 303,694$ 268,793$ 294,117$
Contributions in relation to the contractually required contributions 303,694$ 268,793$ 294,117$
Contribution excess (deficit) ‐$ ‐$ ‐$
Lottery's covered payroll 2,577,989$ 2,455,646$ 2,472,103$
Contribution as a percentage of covered payroll 11.78% 10.95% 11.90%
Delaware State Lottery
Required Supplementary Information
Schedule of Proportionate Share of the Net OPEB Liability and Schedule of Contributions
In accordance with GASB Statement No. 75, this schedule has been prepared prospectively as the above information
for the preceding years is not readily available.
This schedule will accumulate each year until sufficient information to present a ten year trend is available.

53
STATISTICAL SECTION

54
STATISTICAL SECTION
TABLE OF CONTENTS
Employee & Retailer Demographics Please see Exhibits I & II that show numbers of Lottery Employees and Retailers. Delaware Demographics and Economic Information Please see Exhibits III that shows the State of Delaware statistics for the last 10 calendar years. Financial Trend Data Please see Exhibits IV for Delaware Lottery financial trends for the last 10 fiscal years. Revenue Capacity Data and Operation Information Please see Exhibits V to XIV that show the contributions and revenue generated by the various components of the Lottery. Delaware State Lottery Historical Data Please see Exhibit XV for Delaware State Lottery historical data since inception. U.S. Lottery Statistics Please see Exhibits XVI to XVIII that shows statistics on the U.S. Lotteries Debt Capacity Data The Delaware State Lottery has no Legislative debt limit.

55
Exhibit I
Exhibit II

56
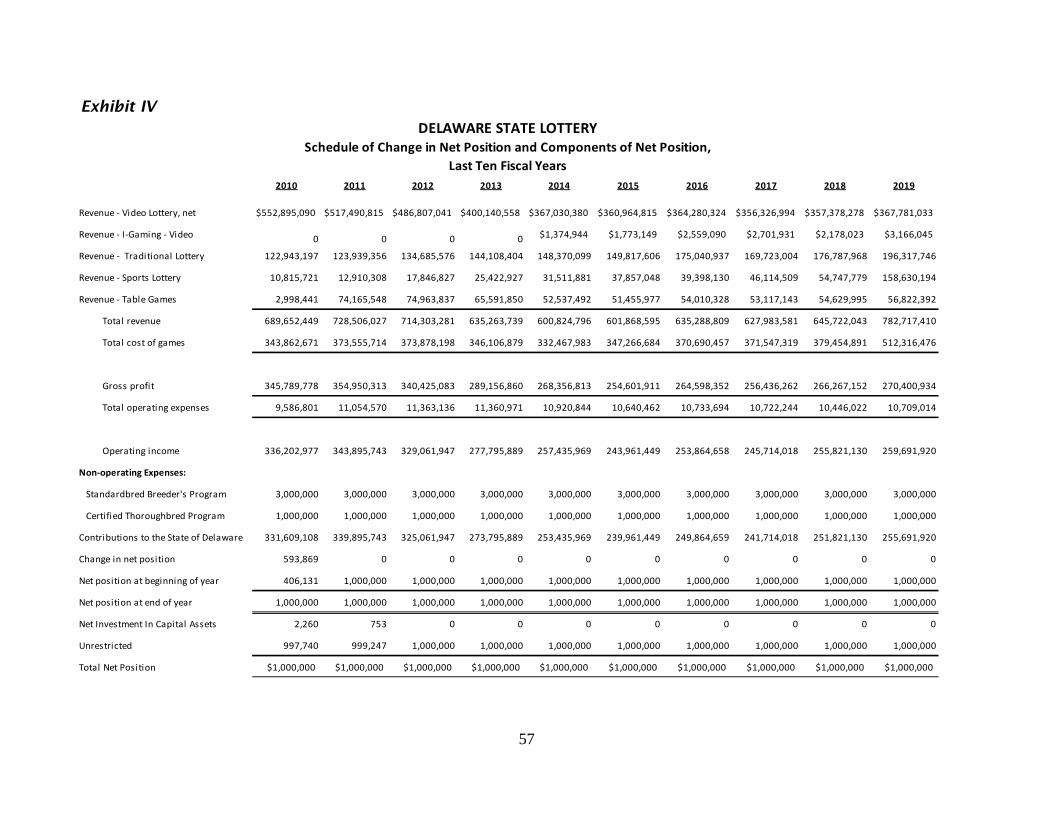
57
Exhibit IV
2010 2011 2012 2013 2014 2015 2016 2017 2018 2019
Revenue ‐ Video Lottery, net $552,895,090 $517,490,815 $486,807,041 $400,140,558 $367,030,380 $360,964,815 $364,280,324 $356,326,994 $357,378,278 $367,781,033
Revenue ‐ I‐Gaming ‐ Video 0 0 0 0 $1,374,944 $1,773,149 $2,559,090 $2,701,931 $2,178,023 $3,166,045
Revenue ‐ Traditional Lottery 122,943,197 123,939,356 134,685,576 144,108,404 148,370,099 149,817,606 175,040,937 169,723,004 176,787,968 196,317,746
Revenue ‐ Sports Lottery 10,815,721 12,910,308 17,846,827 25,422,927 31,511,881 37,857,048 39,398,130 46,114,509 54,747,779 158,630,194
Revenue ‐ Table Games 2,998,441 74,165,548 74,963,837 65,591,850 52,537,492 51,455,977 54,010,328 53,117,143 54,629,995 56,822,392
Total revenue 689,652,449 728,506,027 714,303,281 635,263,739 600,824,796 601,868,595 635,288,809 627,983,581 645,722,043 782,717,410
Total cost of games 343,862,671 373,555,714 373,878,198 346,106,879 332,467,983 347,266,684 370,690,457 371,547,319 379,454,891 512,316,476
Gross profit 345,789,778 354,950,313 340,425,083 289,156,860 268,356,813 254,601,911 264,598,352 256,436,262 266,267,152 270,400,934
Total operating expenses 9,586,801 11,054,570 11,363,136 11,360,971 10,920,844 10,640,462 10,733,694 10,722,244 10,446,022 10,709,014
Operating income 336,202,977 343,895,743 329,061,947 277,795,889 257,435,969 243,961,449 253,864,658 245,714,018 255,821,130 259,691,920
Non‐operating Expenses:
Standardbred Breeder's Program 3,000,000 3,000,000 3,000,000 3,000,000 3,000,000 3,000,000 3,000,000 3,000,000 3,000,000 3,000,000
Certified Thoroughbred Program 1,000,000 1,000,000 1,000,000 1,000,000 1,000,000 1,000,000 1,000,000 1,000,000 1,000,000 1,000,000
Contributions to the State of Delaware 331,609,108 339,895,743 325,061,947 273,795,889 253,435,969 239,961,449 249,864,659 241,714,018 251,821,130 255,691,920
Change in net position 593,869 0 0 0 0 0 0 0 0 0
Net position at beginning of year 406,131 1,000,000 1,000,000 1,000,000 1,000,000 1,000,000 1,000,000 1,000,000 1,000,000 1,000,000
Net position at end of year 1,000,000 1,000,000 1,000,000 1,000,000 1,000,000 1,000,000 1,000,000 1,000,000 1,000,000 1,000,000
Net Investment In Capital Assets 2,260 753 0 0 0 0 0 0 0 0
Unrestricted 997,740 999,247 1,000,000 1,000,000 1,000,000 1,000,000 1,000,000 1,000,000 1,000,000 1,000,000
Total Net Position $1,000,000 $1,000,000 $1,000,000 $1,000,000 $1,000,000 $1,000,000 $1,000,000 $1,000,000 $1,000,000 $1,000,000
DELAWARE STATE LOTTERYSchedule of Change in Net Position and Components of Net Position,
Last Ten Fiscal Years

58
Exhibit V
Exhibit VI

59
Exhibit VII
Exhibit VIII

60
Exhibit IX
Exhibit X

61
Exhibit XI
Exhibit XII

62
Exhibit XIII
Exhibit XIV
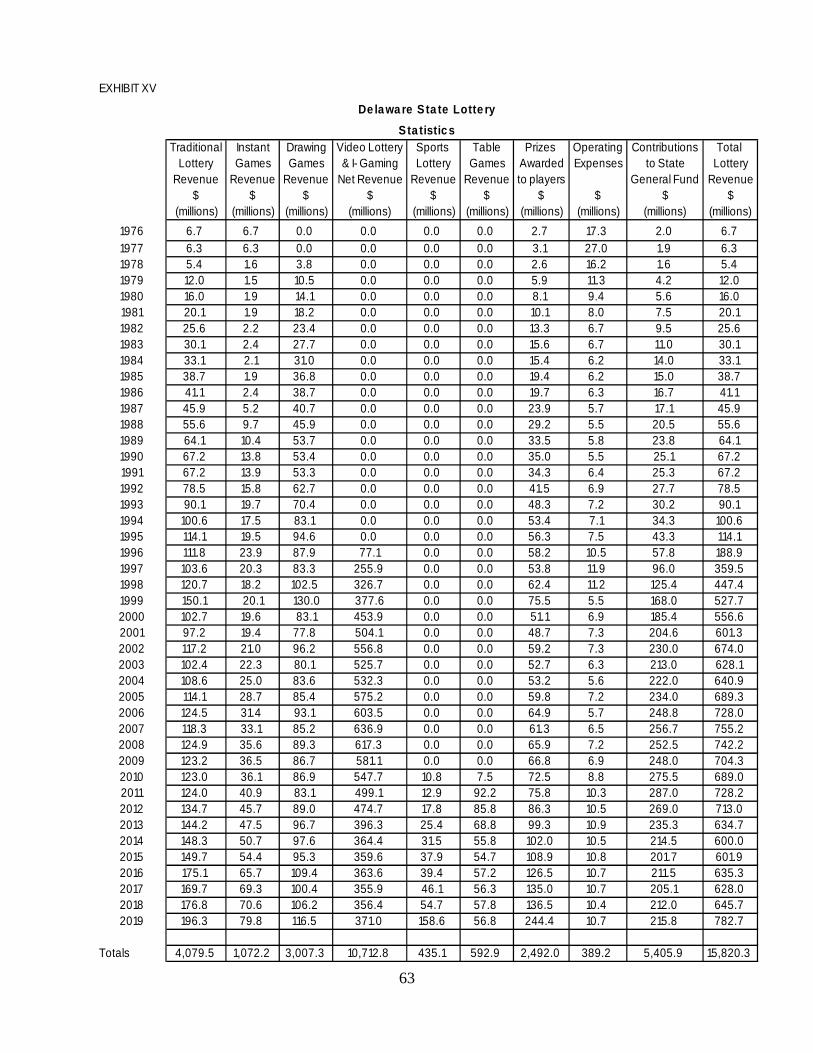
63
EXHIBIT XV
Traditional Instant Drawing Video Lottery Sports Table Prizes Operating Contributions Total Lottery Games Games & I- Gaming Lottery Games Awarded Expenses to State Lottery
Revenue Revenue Revenue Net Revenue Revenue Revenue to players General Fund Revenue$ $ $ $ $ $ $ $ $ $
(millions) (millions) (millions) (millions) (millions) (millions) (millions) (millions) (millions) (millions)
1976 6.7 6.7 0.0 0.0 0.0 0.0 2.7 17.3 2.0 6.7
1977 6.3 6.3 0.0 0.0 0.0 0.0 3.1 27.0 1.9 6.31978 5.4 1.6 3.8 0.0 0.0 0.0 2.6 16.2 1.6 5.41979 12.0 1.5 10.5 0.0 0.0 0.0 5.9 11.3 4.2 12.01980 16.0 1.9 14.1 0.0 0.0 0.0 8.1 9.4 5.6 16.01981 20.1 1.9 18.2 0.0 0.0 0.0 10.1 8.0 7.5 20.11982 25.6 2.2 23.4 0.0 0.0 0.0 13.3 6.7 9.5 25.61983 30.1 2.4 27.7 0.0 0.0 0.0 15.6 6.7 11.0 30.11984 33.1 2.1 31.0 0.0 0.0 0.0 15.4 6.2 14.0 33.11985 38.7 1.9 36.8 0.0 0.0 0.0 19.4 6.2 15.0 38.71986 41.1 2.4 38.7 0.0 0.0 0.0 19.7 6.3 16.7 41.11987 45.9 5.2 40.7 0.0 0.0 0.0 23.9 5.7 17.1 45.91988 55.6 9.7 45.9 0.0 0.0 0.0 29.2 5.5 20.5 55.61989 64.1 10.4 53.7 0.0 0.0 0.0 33.5 5.8 23.8 64.11990 67.2 13.8 53.4 0.0 0.0 0.0 35.0 5.5 25.1 67.21991 67.2 13.9 53.3 0.0 0.0 0.0 34.3 6.4 25.3 67.21992 78.5 15.8 62.7 0.0 0.0 0.0 41.5 6.9 27.7 78.51993 90.1 19.7 70.4 0.0 0.0 0.0 48.3 7.2 30.2 90.11994 100.6 17.5 83.1 0.0 0.0 0.0 53.4 7.1 34.3 100.61995 114.1 19.5 94.6 0.0 0.0 0.0 56.3 7.5 43.3 114.11996 111.8 23.9 87.9 77.1 0.0 0.0 58.2 10.5 57.8 188.91997 103.6 20.3 83.3 255.9 0.0 0.0 53.8 11.9 96.0 359.51998 120.7 18.2 102.5 326.7 0.0 0.0 62.4 11.2 125.4 447.41999 150.1 20.1 130.0 377.6 0.0 0.0 75.5 5.5 168.0 527.72000 102.7 19.6 83.1 453.9 0.0 0.0 51.1 6.9 185.4 556.62001 97.2 19.4 77.8 504.1 0.0 0.0 48.7 7.3 204.6 601.32002 117.2 21.0 96.2 556.8 0.0 0.0 59.2 7.3 230.0 674.02003 102.4 22.3 80.1 525.7 0.0 0.0 52.7 6.3 213.0 628.12004 108.6 25.0 83.6 532.3 0.0 0.0 53.2 5.6 222.0 640.92005 114.1 28.7 85.4 575.2 0.0 0.0 59.8 7.2 234.0 689.32006 124.5 31.4 93.1 603.5 0.0 0.0 64.9 5.7 248.8 728.02007 118.3 33.1 85.2 636.9 0.0 0.0 61.3 6.5 256.7 755.22008 124.9 35.6 89.3 617.3 0.0 0.0 65.9 7.2 252.5 742.22009 123.2 36.5 86.7 581.1 0.0 0.0 66.8 6.9 248.0 704.32010 123.0 36.1 86.9 547.7 10.8 7.5 72.5 8.8 275.5 689.02011 124.0 40.9 83.1 499.1 12.9 92.2 75.8 10.3 287.0 728.22012 134.7 45.7 89.0 474.7 17.8 85.8 86.3 10.5 269.0 713.02013 144.2 47.5 96.7 396.3 25.4 68.8 99.3 10.9 235.3 634.72014 148.3 50.7 97.6 364.4 31.5 55.8 102.0 10.5 214.5 600.02015 149.7 54.4 95.3 359.6 37.9 54.7 108.9 10.8 201.7 601.92016 175.1 65.7 109.4 363.6 39.4 57.2 126.5 10.7 211.5 635.32017 169.7 69.3 100.4 355.9 46.1 56.3 135.0 10.7 205.1 628.02018 176.8 70.6 106.2 356.4 54.7 57.8 136.5 10.4 212.0 645.72019 196.3 79.8 116.5 371.0 158.6 56.8 244.4 10.7 215.8 782.7
Totals 4,079.5 1,072.2 3,007.3 10,712.8 435.1 592.9 2,492.0 389.2 5,405.9 15,820.3
De la wa re S ta te Lotte ry
Sta tistic s

64
Exhibit XVI
U.S. Lotteries'
Comparison of Sales by Game
Fiscal Years 2019 and 2018
(in $millions)
GAME SALES (MILLIONS) 2019 2018 %
INCREASE
(DECREASE)
INSTANT $50,053.1 $47,930.3 4.43%
PULL TAB 103.5 99.2 4.33%
3-DIGIT 5,749.2 5,575.1 3.12%
4-DIGIT 4,782.7 4,624.0 3.43%
LOTTO 3,769.8 3,700.0 1.89%
POWERBALL 4,840.4 4,940.9 -2.03%
MEGA MILLIONS 5,145.7 3,140.8 63.83%
FOR LIFE 446.8 461.4 -3.16%
KENO 4,720.7 4,417.3 6.87%
VLT (VIDEO LOTTERY) 6,837.6 6,533.8 4.65%
OTHER 1,233.6 1,050.9 17.39%
TOTAL $87,683.1 $82,473.7 6.32%
Source: La Fleur's Magazine, Sept/Oct 2019

65
AZ 6.9 710.9 8.7 11.7 62.6 118.5 60.9 8.1 981.4 142AR 3.0 407.6 7.7 4.5 7.9 36.7 19.6 2.9 12.7 499.6 167CA 39.3 5,088.8 149.4 29.8 429.9 537.0 434.6 307.6 6,977.1 178CO 5.5 407.5 12.2 50.0 88.2 38.4 15.7 0.0 612.0 111CT 3.6 730.7 121.6 120.9 56.0 88.1 42.2 19.6 86.4 2.1 1,267.6 352DC 0.7 49.1 40.3 53.3 11.1 6.8 2.2 11.8 15.4 22.2 212.2 303DE 1.0 70.6 27.0 22.8 4.6 3.4 24.6 12.1 3.0 8.8 54.7 231.6 232 347.8FL 20.6 4,652.3 366.1 259.3 578.6 474.0 220.6 59.2 17.8 0.0 72.9 6,700.8 325
GA 10.3 3,163.4 525.4 282.6 127.2 155.9 125.6 9.8 9.5 190.9 7.4 4,597.7 446ID 1.7 146.9 45.4 2.4 0.0 3.5 2.7 33.1 13.6 3.3 11.1 3.1 265.1 156IL 12.8 1,880.5 278.1 248.8 228.4 161.2 125.0 0.0 6.5 2,928.5 229IN 6.6 935.0 36.4 35.0 89.3 108.1 45.9 5.4 11.8 3.1 1,270.0 192IA 3.1 244.3 10.9 7.7 4.3 0.0 8.6 58.5 21.3 5.6 9.7 0.0 370.9 120KS 2.9 171.6 7.1 0.0 11.9 9.6 40.1 17.3 6.0 14.2 6.5 284.3 98KY 4.4 613.1 149.7 43.5 17.7 77.9 39.8 7.8 82.8 10.3 1,042.6 237LA 4.7 217.2 52.1 48.7 34.9 96.2 41.9 0.0 491.0 104ME 1.3 219.1 5.6 4.4 1.5 15.6 24.1 8.7 3.7 6.1 288.8 222MD 6.0 750.9 235.4 296.2 54.3 111.2 88.6 13.2 484.0 2,033.8 339 1,046.7MA 6.8 3,651.3 0.7 325.2 111.2 127.3 88.9 24.2 1,011.6 5,340.4 785MI 9.9 1,465.3 32.4 363.0 460.6 107.6 127.0 129.3 14.6 75.0 646.8 122.1 3,543.7 358MN 5.5 411.2 17.7 0.0 28.4 12.5 75.4 26.0 6.6 11.7 0.0 7.0 596.5 108MO 6.1 907.3 78.7 52.4 58.8 103.6 48.4 8.0 57.4 0.0 1,314.6 216MT 1.0 18.6 0.0 7.6 2.7 13.6 4.9 2.7 3.8 3.2 57.1 57NE 1.9 100.8 5.5 0.0 17.3 1.9 38.6 15.0 4.3 183.4 97NH 1.3 239.0 5.5 4.9 0.0 12.1 35.8 16.8 5.2 3.3 8.3 330.9 255NJ 8.9 1,852.3 421.3 267.2 223.0 231.8 180.3 41.3 29.3 53.0 3,299.5 371
NM 2.1 72.3 5.6 0.0 7.7 4.8 29.6 13.2 0.0 0.8 0.0 0.1 134.1 64NY 19.7 4,178.5 887.3 927.0 309.5 408.1 311.8 94.0 793.2 29.6 7,939.0 403 1,638.8NC 10.1 1,782.8 317.1 145.1 65.4 168.7 78.6 19.2 28.5 2,605.4 258ND 0.8 0.0 0.0 7.5 14.3 6.3 3.2 0.0 31.3 39OH 11.6 1,600.6 340.1 205.1 87.4 148.1 120.1 20.7 164.5 432.7 40.8 3,160.1 272 987.3OK 3.9 127.6 5.3 0.0 4.7 9.2 49.6 22.8 2.0 0.0 221.2 57OR 4.1 130.4 1.6 41.7 60.1 30.1 0.0 102.0 2.5 368.4 90 934.0PA 12.8 2,824.2 270.4 220.7 250.4 272.7 133.9 17.8 114.4 7.6 88.3 4,200.4 328RI 1.1 98.7 0.0 0.0 23.2 4.5 30.2 13.3 5.0 82.4 1.0 258.3 235 481.4SC 5.0 1,260.6 213.1 101.1 23.9 93.2 45.5 12.7 1,750.1 350SD 0.9 30.2 0.0 0.0 3.3 2.8 14.4 4.7 2.6 58.0 64 220.6TX 27.9 4,406.2 259.8 113.4 280.1 294.8 259.0 0.0 5,613.3 201VT 0.6 102.0 1.3 1.2 0.0 5.0 10.1 4.5 1.7 6.5 132.3 221VA 8.4 1,184.6 296.6 302.7 46.5 130.8 110.4 15.2 45.4 7.5 2,139.7 255WA 7.3 507.9 18.9 0.0 73.9 72.9 54.7 5.7 734.0 101WV 1.8 99.2 7.9 4.7 4.8 5.3 36.5 14.9 0.0 3.6 0.0 176.9 98 877.2WI 5.8 419.4 1.0 23.9 13.9 70.7 98.2 39.5 0.8 667.4 115WY 0.6 0.0 9.8 10.8 5.3 2.9 28.8 48
Total 300.5 47,930.5 99.1 5,574.9 4,624.1 3,596.5 103.7 4,940.7 3,141.1 461.3 553.3 4,417.2 497.4 75,939.8 9,398.3 6,533.8
Total SalesPull Tab Lotto for LifePowerball
EXHIBIT XVIIU.S. Lotteries' Unaudited Fiscal Year 2018 Sales by Game
(in $millions)
VLT*PC SalesOtherMega
MillionsPopulation
(M)Instant ITG
Source: La Fleur's Magazine, Sept/Oct 2018
4 - Digit3 - DigitStateQUICK DRAW
Cash Lotto

66
AZ 7.2 750.3 9.6 12.3 68.0 111.7 103.3 17.8 1,073.0 150AR 3.0 407.8 7.7 4.4 9.3 34.2 33.6 3.2 15.3 515.5 171CA 39.6 5,174.8 153.2 30.7 429.8 521.1 736.3 346.1 7,392.1 187CO 5.7 443.4 12.9 47.6 86.1 72.7 17.0 679.8 119CT 3.6 736.4 126.7 123.0 71.9 81.4 72.6 18.9 102.9 1,333.9 373DC 0.7 52.2 38.6 51.7 10.0 10.3 2.1 10.6 15.9 21.9 213.3 304DE 1.0 79.8 27.2 23.7 4.5 3.4 25.2 20.7 2.9 8.6 158.6 354.7 367 367.1FL 21.3 4,937.8 380.3 253.4 556.5 459.4 417.0 50.3 21.0 75.5 7,151.2 336
GA 10.5 3,219.4 518.4 302.5 120.9 148.3 199.1 9.7 6.7 201.8 49.2 4,776.0 454ID 1.8 159.0 48.6 2.5 3.7 2.8 30.3 23.5 3.2 11.4 2.7 287.9 164IL 12.7 1,856.8 274.6 250.9 223.3 158.6 213.3 2,977.6 234IN 6.7 974.9 39.2 37.9 99.1 96.2 77.7 4.6 14.4 3.7 1,347.8 201IA 3.2 250.6 10.9 7.9 4.3 8.8 54.8 36.3 5.4 11.9 390.9 124KS 2.9 178.0 7.1 21.1 8.7 35.7 29.0 5.7 19.0 4.0 308.2 106KY 4.5 669.2 149.9 44.6 20.2 73.5 63.1 7.5 84.3 17.4 1,129.7 253LA 4.7 225.6 54.8 50.3 32.6 90.6 70.2 524.0 112ME 1.3 224.6 5.4 4.3 1.3 14.9 22.4 16.3 3.7 6.6 299.5 224MD 6.0 812.4 245.6 312.2 54.8 114.1 137.7 12.4 498.1 2,187.3 362 1,125.2MA 6.9 3,673.3 0.6 325.4 114.4 132.6 154.3 24.4 1,055.2 5,480.1 794MI 10.0 1,654.7 32.8 389.9 487.5 116.7 133.4 172.2 14.8 68.6 614.5 145.6 3,830.8 383MN 5.6 435.3 18.4 29.5 11.8 68.0 48.9 6.9 11.0 7.0 636.8 113MO 6.1 914.8 83.4 54.7 54.5 97.7 81.8 8.3 57.3 1,352.6 221MT 1.1 19.3 7.6 2.4 12.5 9.4 2.7 4.0 3.2 61.3 58NE 1.9 104.1 5.8 15.8 1.9 35.8 24.4 4.1 192.0 100NH 1.4 250.6 5.4 4.8 11.6 35.7 30.3 5.4 5.1 26.9 375.9 277NJ 8.9 1,868.4 404.8 259.1 236.6 236.3 284.3 37.1 22.8 129.7 3,479.1 391
NM 2.1 74.9 5.5 1.1 7.3 4.5 26.9 22.5 0.9 0.1 143.6 69NY 19.5 4,226.7 931.4 955.5 311.6 432.4 437.5 87.9 814.1 30.6 8,227.6 421 1,663.1NC 10.4 1,908.9 352.1 161.6 73.3 158.7 142.1 20.5 42.5 2,859.6 275ND 0.8 7.9 12.8 11.2 3.5 35.4 47OH 11.7 1,663.0 354.0 216.9 83.5 143.3 192.7 20.4 171.6 470.8 44.5 3,360.8 288 1,058.6OK 3.9 136.0 5.7 4.0 7.2 44.4 39.8 4.6 241.7 61OR 4.2 131.2 1.8 42.0 49.8 50.2 102.7 2.3 380.1 91 966.5PA 12.8 2,989.7 269.2 225.3 271.9 260.5 229.5 16.7 103.3 46.7 90.6 4,503.3 352RI 1.1 102.9 0.0 23.0 3.9 27.2 20.2 5.0 79.8 1.2 263.3 249 522.8SC 5.1 1,450.4 217.6 103.7 23.5 92.9 80.1 12.6 1,980.9 390SD 0.9 32.4 3.9 2.4 13.1 8.7 2.6 63.1 72 230.2TX 28.7 4,844.4 260.2 122.2 271.7 340.3 408.5 6,247.2 218VT 0.6 107.0 1.2 1.2 5.0 9.4 8.0 1.8 5.7 139.3 222VA 8.5 1,221.9 329.2 326.4 47.0 125.5 167.0 18.2 50.6 7.9 2,293.6 269WA 7.5 523.9 19.5 92.7 69.4 91.9 5.9 803.3 107WV 1.8 115.6 7.9 4.6 4.8 5.4 33.3 24.5 3.9 1.2 201.3 111 904.1WI 5.8 450.4 1.0 23.6 14.1 75.2 84.8 63.3 0.8 713.1 123WY 0.6 15.1 9.8 9.4 2.7 0.6 37.6 65
Total 304.2 50,053.1 103.5 5,749.2 4,782.7 3,671.2 98.6 4,840.4 5,145.7 446.8 559.0 4,720.7 674.6 80,845.5 10,008 6,837.6
3 - DigitMega
Millions
Source: La Fleur's Magazine, Sept/Oct 2019
Kenofor Life ITGPull Tab 4 - Digit Powerball VLT*Instant Lotto
EXHIBIT XVIII
Total Sales PC SalesPopulation
(M)Cash Lotto
U.S. Lotteries' Unaudited Fiscal Year 2019 Sales by Game
State Other
(in $millions)


