
Department of Examinations
STATISTICAL HANDBOOK2005 - 2007
Research & Development Branch National Evaluation & Testing Service Department of Examinations P.O.Box 1503Colombo Sri Lanka

Department of Examinations
STATISTICAL HANDBOOK 2005 – 2007
Research & Development Branch
National Evaluation & Testing Service
Department of Examinations
P.O.Box 1503
Colombo
Sri Lanka
Statistical Handbook 2005 – 2007
Statistics on Examinations held by
National Evaluation & Testing Service
Research & Development Branch
National Evaluation & Testing Service
Department of Examinations
Pelawatta P.O.Box 1503
Battaramulla Colombo.

- iii -
FOREWORD
Provision of information is the prime duty and responsibility of an organization. It gives me
immense pleasure to write this note for this statistical handbook, which comprises, general
information relevant to the (NETS) Department of Examinations, Sri Lanka, statistical data on
organization, evaluation and issuing of results of school and other examinations conducted by the
Department of Examinations (NETS), subject statistics, performance of candidates at school
examinations.
This data would be useful to Educationists, Policy makers, Researchers and Others who are in
need of information on education and educational evaluation systems.
I would like to express my sincere thanks to the staff of the Research and Development Branch,
the Computer Branch and the Printing Press of the department for collecting and processing data
and organizing the publication of this handbook, and also to the staff of other branches for
furnishing relevant statistical information.
I am happy to state that the Department of Examinations will undertake to continue this
programme of publication annually. Any constructive suggestions in this regard will be greatly
appreciated.
1st
September 2011,
Department of Examinations,
P.O. Box. 1503,
Colombo, Anura Edirisinghe
Sri Lanka. Commissioner General of Examinations
National Evaluation & Testing Service
Department of Examinations, Sri Lanka
VISION STATEMENT
Provide leadership in improving teaching and learning through excellence in evaluation
methodologies and practices and in conducting other examination functions.
MISSION STATEMENT
Provide guidance towards excellence in educational achievement and certification
activities using evaluation instruments and methodologies, ensuring reliability and
validity to suit national needs.
- ii -

- iv -
Presentation of the Research and Development Branch Department of Examinations
Guidance Mr. Anura Edirisinghe - Commissioner General of Examinations
Co-ordinating & Designing Mrs. K.D.G.M. Abeygunasekera - Commissioner of Examinations (Research & Development)
Assistance Mr. R. Subasinghe - Deputy Commissioner of Examinations Mr. J.A.J.R. Jayakody - Assistant Commissioner of Examinations Type Setting, Page making & Graphics Mrs. K.V.T. Priyadarshanie Miss. W.A.D.Chathurika Dissanayaka Miss. G.V. Sulochana Dushanthi
All rights reserved
Published in 2011 Printed & Published by Department of Examinations (NETS), Sri Lanka.
- v -
CONTENTS
Grade Five Scholarship Examination
No. of Candidates Applied - 2005 to 2007 ................................................................................................. 1
Performance of Candidates - 2005 to 2007 ................................................................................................ 2
Percentage of Candidates who obtained marks above Cut Off - 2005 to 2007 (Graph) ......................... 3
Performance & Awarding of Bursaries by Medium - 2007 (Graph) ........................................................ 4
Performance of Student by Gender - 2005 to 2007 ................................................................................... 5
Performance of All Candidates - 2005 by District ..................................................................................... 6
Performance of All Candidates - 2006 by District...................................................................................... 7
Performance of All Candidates - 2007 by District...................................................................................... 8
Percentage of Candidates who obtained marks above Cut off - 2007 by District (Graph) ...................... 9
G.C.E. (O.L) Examination
No. of Candidates Applied - 2005 to 2007 ................................................................................................. 10
Percentage of Candidates Applied by Medium - 2005 to 2007 (Graph) .................................................. 11
No. of All Candidates sat for each Subject - 2005 ..................................................................................... 12
No. of All Candidates sat for each Subject - 2006 ..................................................................................... 14
No. of All Candidates sat for each Subject - 2007 ..................................................................................... 16
No. of School Candidates sat for each Subject - 2005 ............................................................................... 18
No. of School Candidates sat for each Subject - 2006 ............................................................................... 20
No. of School Candidates sat for each Subject - 2007 ............................................................................... 22
Results by Grades in each Subject - 2005 All Candidates ........................................................................ 24
Results by Grades in each Subject - 2006 All Candidates ........................................................................ 26
Results by Grades in each Subject - 2007 All Candidates ........................................................................ 28
Results by Grades in each Subject - 2005 School Candidates .................................................................. 30
Results by Grades in each Subject - 2006 School Candidates .................................................................. 32
Results by Grades in each Subject - 2007 School Candidates .................................................................. 34
Continued

- vi -
Results by Grades in each Subject - 2005 School Candidates (Freshers) ................................................ 36
Results by Grades in each Subject - 2006 School Candidates (Freshers) ................................................ 38
Results by Grades in each Subject - 2007 School Candidates (Freshers) ................................................ 40
Performance of School Candidates - 2005 to 2007 .................................................................................... 42
Performance of All Candidates - 2005 to 2007 .......................................................................................... 43
Percentage of Candidates Qualified for G.C.E. (A.L) - 2005 to 2007 (Graph) ........................................ 44
No. of School Candidates Qualified for G.C.E. (A.L) with SBA results - 2005 to 2007 ........................ 45
Performance of All Candidates - 2005 to 2007 by District ....................................................................... 46
Performance of School Candidates - 2005 to 2007 by District ................................................................. 47
Percentage of School Candidates Qualified for G.C.E. (A.L) - 2005 by District (Graph)....................... 48
Percentage of School Candidates Qualified for G.C.E. (A.L) - 2006 by District (Graph)....................... 49
Percentage of School Candidates Qualified for G.C.E. (A.L) - 2007 by District (Graph)....................... 50
Performance of School Candidates - 2005 by District................................................................................ 51
Performance of School Candidates - 2006 by District................................................................................ 52
Performance of School Candidates - 2007 by District................................................................................ 53
Performance of School Candidates (Freshers) - 2005 by Zone................................................................. 54
Performance of School Candidates (Freshers) - 2006 by Zone................................................................. 58
Performance of School Candidates (Freshers) - 2007 by Zone................................................................. 62
No. of Schools according to the percentage of Candidates (Freshers) Qualified for
G.C.E. (A.L) - 2005 by District ................................................................................................................... 66
No. of Schools according to the percentage of Candidates (Freshers) Qualified for
G.C.E. (A.L) - 2006 by District ................................................................................................................... 67
No. of Schools according to the percentage of Candidates (Freshers) Qualified for
G.C.E. (A.L) - 2007 by District ................................................................................................................... 68
Means and Standard Deviations of All Subjects - 2005 to 2007 ............................................................... 69
Continued
- vii -
G.C.E. (A.L) Examination
No. of Candidates Applied - 2005 to 2007 ................................................................................................. 71
Percentage of Candidates Applied by Medium - 2005 to 2007 (Graph) .................................................. 72
No. of All Candidates sat for each Subject by Medium- 2005 .................................................................. 73
No. of All Candidates sat for each Subject by Medium- 2006 .................................................................. 75
No. of All Candidates sat for each Subject by Medium- 2007 .................................................................. 77
Results by Grades in each Subject - 2005 All Candidates.......................................................................... 79
Results by Grades in each Subject - 2006 All Candidates.......................................................................... 81
Results by Grades in each Subject - 2007 All Candidates.......................................................................... 83
Results by Grades in each Subject - 2005 School Candidates ................................................................... 85
Results by Grades in each Subject - 2006 School Candidates ................................................................... 87
Results by Grades in each Subject - 2007 School Candidates ................................................................... 89
Performance of Candidates by Gender - 2005 ............................................................................................ 91
Performance of Candidates by Gender - 2006 ............................................................................................ 92
Performance of Candidates by Gender - 2007 ............................................................................................ 93
Percentage of Candidates Qualified for University Entrance - 2005 to 2007 (Graph) ............................. 94
Performance of School Candidates - 2005 by District................................................................................ 95
Percentage of School Candidates Qualified for University Entrance - 2005 by District (Graph) ........... 96
Performance of School Candidates - 2006 by District .............................................................................. 97
Percentage of School Candidates Qualified for University Entrance - 2006 by District (Graph) ........... 98
Performance of School Candidates - 2007 by District................................................................................ 99
Percentage of School Candidates Qualified for University Entrance - 2007 by District (Graph) ........... 100
Performance of All Candidates - 2005 by District...................................................................................... 101
Performance of All Candidates - 2006 by District...................................................................................... 102
Performance of All Candidates - 2007 by District ..................................................................................... 103
Continued

- viii -
Streamwise Performance of School Candidates (Freshers) by Medium - 2005 to 2007......................... 104
No. of School Candidates (Freshers) Qualified for University Entrance
by Stream - 2005 to 2007 (Graph) ............................................................................................................... 105
Streamwise Performance of School Candidates (Freshers) Qualified for University Entrance 2005
by District ................................................................................................................................................... 106
Streamwise Performance of School Candidates (Freshers) Qualified for University Entrance 2006
by District ..................................................................................................................................................... 107
Streamwise Performance of School Candidates (Freshers) Qualified for University Entrance 2007
by District .................................................................................................................................................... 108
Means and Standard Deviations of All Subjects 2005 to 2007 .................................................................. 109
General
Details of Evaluation of Answerscripts - School Examinations - 2005 to 2007....................................... 111
Details of Institutional Examinations - 2005 to 2007 ................................................................................. 112
Details of Dishonesty Cases reported in each Examination - 2005 to 2007 ............................................. 113
Details of Releasing of Results - Grade Five Scholarship Examination........................................... 114
G.C.E. (O.L) Examination ............................................................ 115
G.C.E. (A.L) Examination ............................................................ 116
GRADE FIVE SCHOLARSHIP EXAMINATION
2005 - 2007
- 2 -
- 1 -
Marks Freq.
Sinhala 230,687 222,126 19,176 189 1 76.73 36.12 7,493
2005 Tamil 71,981 65,349 4,291 175 2 64.17 34.36 2,499
Total 302,668 287,475 23,467 73.87 36.11 9,992
Sinhala 231,428 226,252 18,843 196 1 88.23 37.73 7,492
2006 Tamil 70,371 64,777 4,278 185 1 77.95 36.89 2,506
Total 301,799 291,029 23,121 85.93 37.78 9,998
Sinhala 224,686 219,014 28,444 200 1 98.92 40.24 11,950
2007 Tamil 70,635 64,723 5,450 190 1 79.92 39.17 3,358
Total 295,321 283,737 33,894 94.58 40.78 15,308
MeanStandard
Deviation
No. of
Scholarships
Awarded
Performance of Candidates
Highest Marks
& Frequency
Grade Five Scholarship Examination 2005 - 2007
Year MediumNo. of
ApplicantsNo.sat
No. of
Candidates
Above the
Cut Off
Year
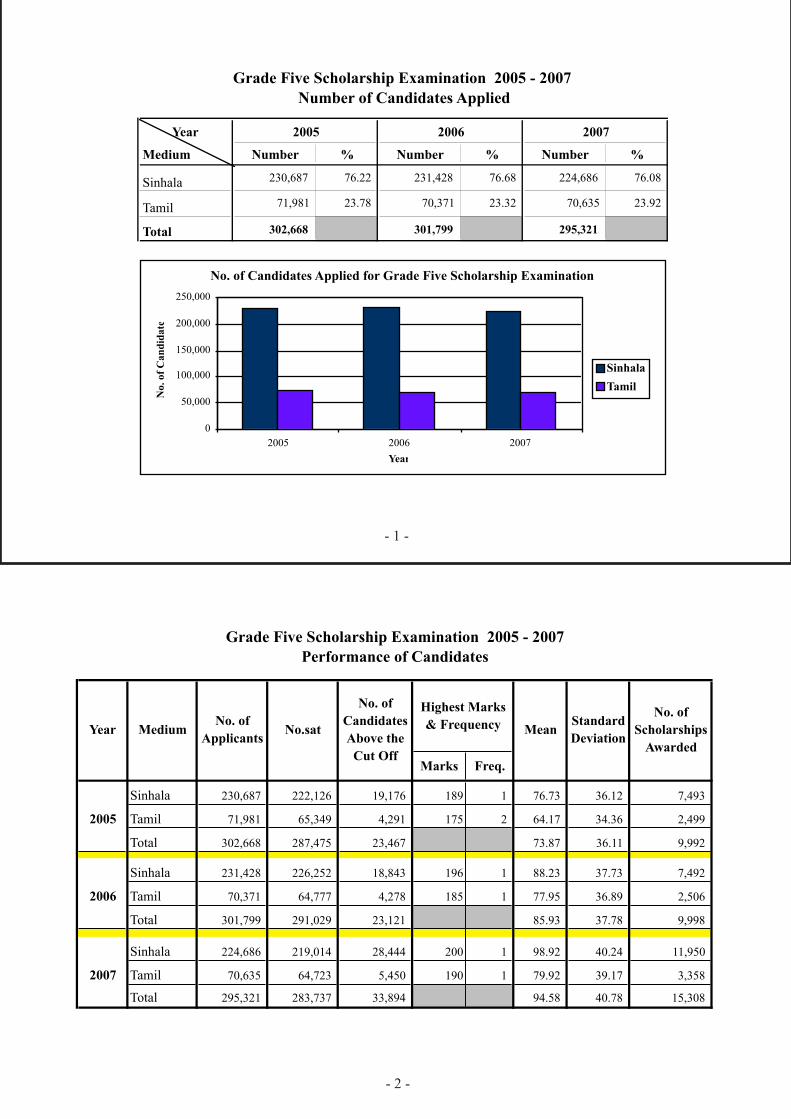
Medium Number % Number % Number %
Sinhala 230,687 76.22 231,428 76.68 224,686 76.08
Tamil 71,981 23.78 70,371 23.32 70,635 23.92
Total 302,668 301,799 295,321
Grade Five Scholarship Examination 2005 - 2007
Number of Candidates Applied
2005 2006 2007
No. of Candidates Applied for Grade Five Scholarship Examination
0
50,000
100,000
150,000
200,000
250,000
2005 2006 2007
Year
No. of
Can
did
ate
s
Sinhala
Tamil

- 4 -
Sinhala Tamil
Performance and Awarding of Bursaries by Medium
Grade Five Scholarship Examination 2007
- 04 -
Number Sat
23%
77%
Above Cut off
84%
16%
Qualified for Bursaries
78%
22%
- 3 -
Grade Five Scholarship Examination 2005 - 2007
Percentage of Candidates who Obtained Marks above Cut Off
0
2
4
6
8
10
12
14
2005 2006 2007
Year
Per
cen
tage Sinhala
Tamil

- 6 -
- 5 -
No. % No. %
2005 10,714 45.66 12,753 54.34
2006 10,478 45.32 12,643 54.68
2007 15,030 44.34 18,864 55.66
Performance of Student by Gender
Above Cut Off
Male FemaleYear
2007
55.7%44.3%
2005
45.7%
54.3%
2006
45.3%54.7%
Male Female
No. % No. %1 Colombo 29,095 2,802 9.63 14,066 795 5.65
2 Gampaha 27,778 2,848 10.25 17,948 1,164 6.49
3 Kalutara 15,491 1,438 9.28 10,964 560 5.11
4 Kandy 19,970 1,399 7.01 13,196 522 3.96
5 Matale 6,831 359 5.26 5,015 102 2.03
6 Nuwara Eliya 10,276 703 6.84 7,493 323 4.31
7 Galle 16,306 1,272 7.80 11,866 520 4.38
8 Matara 11,931 927 7.77 9,019 431 4.78
9 Hambantota 9,248 756 8.17 7,815 420 5.37
10 Jaffna 9,855 857 8.70 8,602 537 6.24
11 Kilinochchi 2,076 50 2.41 1,920 33 1.72
12 Mannar 1,561 75 4.80 1,393 48 3.45
13 Vavuniya 2,755 187 6.79 2,454 111 4.52
14 Mullativu 1,579 51 3.23 1,475 30 2.03
15 Batticaloa 7,059 528 7.48 6,219 296 4.76
16 Ampara 10,078 802 7.96 8,277 408 4.93
17 Trincomalee 6,064 604 9.96 4,752 313 6.59
18 Kurunegala 22,971 1,990 8.66 17,089 797 4.66
19 Puttalam 10,944 507 4.63 8,792 214 2.43
20 Anuradhapura 12,737 1,167 9.16 9,480 473 4.99
21 Polonnaruwa 5,951 504 8.47 4,931 278 5.64
22 Badulla 12,589 1,204 9.56 9,449 483 5.11
23 Monaragala 7,134 474 6.64 5,954 212 3.56
24 Ratnapura 15,644 1,001 6.40 12,930 505 3.91
25 Kegalle 11,552 962 8.33 8,485 414 4.88
Total 287,475 23,467 8.16 209,584 9,989 4.77
* Below Income Level - Annual Income Rs. 24000/- or less
Above Cut Off Above Cut Off No. Sat. No. Sat.
District
Grade Five Scholarship Examination - 2005
Performance of All Candiadates by District
Candidates who obtained marks above District Cut Off
All Candidates * Below Income Level

- 8 -
- 7 -
No. % No. %1 Colombo 29,753 2,525 8.49 14,693 758 5.16
2 Gampaha 28,437 2,681 9.43 18,450 1,129 6.12
3 Kalutara 16,290 1,405 8.62 11,455 570 4.98
4 Kandy 19,969 1,420 7.11 13,108 503 3.84
5 Matale 6,980 350 5.01 5,099 131 2.57
6 Nuwara Eliya 10,195 713 6.99 7,385 323 4.37
7 Galle 16,574 1,335 8.05 11,711 531 4.53
8 Matara 12,405 898 7.24 9,484 427 4.50
9 Hambantota 9,454 830 8.78 7,698 422 5.48
10 Jaffna 8,085 889 11.00 6,897 534 7.74
11 Kilinochchi 2,140 48 2.24 1,999 33 1.65
12 Mannar 1,485 72 4.85 1,309 47 3.59
13 Vavuniya 2,597 207 7.97 2,264 119 5.26
14 Mullativu 1,702 50 2.94 1,575 29 1.84
15 Batticaloa 7,957 518 6.51 6,966 298 4.28
16 Ampara 9,854 843 8.55 8,013 408 5.09
17 Trincomalee 5,564 644 11.57 4,232 312 7.37
18 Kurunegala 23,146 1,885 8.14 16,976 789 4.65
19 Puttalam 11,535 548 4.75 9,345 227 2.43
20 Anuradhapura 13,198 1,141 8.65 9,752 469 4.81
21 Polonnaruwa 5,874 492 8.38 4,822 282 5.85
22 Badulla 13,411 1,232 9.19 10,115 495 4.89
23 Monaragala 7,372 397 5.39 6,183 214 3.46
24 Ratnapura 15,360 947 6.17 12,639 499 3.95
25 Kegalle 11,692 1,051 8.99 8,528 449 5.27
Total 291,029 23,121 7.94 210,698 9,998 4.75
Grade Five Scholarship Examination - 2006
Performance of All Candiadates by District
All Candidates * Below Income Level
Candidates who obtained marks above District Cut Off
DistrictAbove Cut Off Above Cut Off
No. Sat.
* Below Income Level - Annual Income Rs. 24000/- or less
No. Sat.
No. % No. %1 Colombo 29,810 3,426 11.49 13,987 1,057 7.56
2 Gampaha 27,895 4,120 14.77 17,317 1,725 9.96
3 Kalutara 16,048 2,142 13.35 11,012 876 7.95
4 Kandy 19,687 1,875 9.52 12,702 696 5.48
5 Matale 6,759 558 8.26 4,872 212 4.35
6 Nuwara Eliya 9,812 947 9.65 7,048 449 6.37
7 Galle 16,342 1,961 12.00 11,452 879 7.68
8 Matara 11,677 1,424 12.19 8,608 686 7.97
9 Hambantota 8,485 1,154 13.60 6,962 678 9.74
10 Jaffna 7,921 1,182 14.92 6,807 770 11.31
11 Kilinochchi 1,991 110 5.52 1,838 72 3.92
12 Mannar 1,389 115 8.28 1,208 62 5.13
13 Vavuniya 2,481 340 13.70 2,133 210 9.85
14 Mullativu 1,773 111 6.26 1,625 72 4.43
15 Batticaloa 7,648 643 8.41 6,653 382 5.74
16 Ampara 9,997 1,111 11.11 7,919 569 7.19
17 Trincomalee 5,670 559 9.86 4,264 272 6.38
18 Kurunegala 22,686 3,349 14.76 16,192 1,466 9.05
19 Puttalam 11,435 872 7.63 9,170 425 4.63
20 Anuradhapura 12,912 1,670 12.93 9,075 722 7.96
21 Polonnaruwa 5,786 697 12.05 4,551 381 8.37
22 Badulla 12,744 1,722 13.51 9,291 732 7.88
23 Monaragala 6,903 722 10.46 5,577 363 6.51
24 Ratnapura 14,520 1,583 10.90 11,573 841 7.27
25 Kegalle 11,366 1,501 13.21 8,060 711 8.82
Total 283,737 33,894 11.95 199,896 15,308 7.66
* Below Income Level - Annual Income Rs. 24000/- or less
All Candidates * Below Income Level
No. Sat. No. Sat.
Grade Five Scholarship Examination - 2007
Performance of All Candiadates by District
Candidates who obtained marks above District Cut Off
Above Cut Off Above Cut Off District

- 10 -
- 9 -
Grade Five Scholarship Examination 2007
Percentage of Candidates who Obtained Marks above District Cut Off
0
10
20
30
40
50
60
70
80
90
100
Col
ombo
Gam
paha
Kal
utara
Kan
dy
Mat
ale
Nuw
ara
Eliy
a
Gal
le
Mat
ara
Ham
banto
ta
Jaffna
Kili
nochch
i
Man
nar
Vavuniy
a
Mulla
tivu
Bat
tical
oa
Am
para
Trinco
mal
ee
Kuru
negal
a
Puttal
am
Anura
dhapura
Polon
naruw
a
Bad
ulla
Mon
arag
ala
Rat
napura
Keg
alle
Total
District
Per
cen
tag
e
Below Income Level (Qualified for Bursaries) Above Income Level
G.C.E. (O.L.) EXAMINATION
2005 - 2007

- 11 -
-10 -
No. % No. % No. %
Sinhala 307,866 81.28 84,797 57.26 392,663 74.53
Tamil 70,861 18.71 44,555 30.09 115,416 21.91
English 35 0.01 18,742 12.66 18,777 3.56
Total
Sinhala 305,100 80.78 87,263 59.65 392,363 74.88
Tamil 72,560 19.21 42,083 28.76 114,643 21.88
English 43 0.01 16,955 11.59 16,998 3.24
Total
Sinhala 321,571 80.54 72,801 55.94 394,372 74.50
Tamil 77,651 19.45 47,193 36.27 124,844 23.58
English 35 0.01 10,138 7.79 10,173 1.92
Total
524,004146,301
130,132 529,389
G.C.E. (O.L.) Examination 2005-2007
Number of Candidates Applied
School Private TotalYear Medium
2006
2007
2005
377,703
378,762
399,257
148,094 526,856
G.C.E. (O.L.) Examination 2005 - 2007
Percentage of Candidates Applied by Medium
0
20
40
60
80
2005 2006 2007
Year
Per
cen
tage
Sinhala Tamil English

- 13 -
- 12 -
Medium
Subject No. % No. % No. %
11. Buddhism 240,985 99.93 2 0.00 168 0.07 241,155
12. Saivism - 0.00 38,860 100.00 - 0.00 38,860
13. Hinduism 2 4.26 - 0.00 45 95.74 47
14. Catholicism 13,306 67.19 6,460 32.62 39 0.20 19,805
15. Christianity 1,416 41.54 1,934 56.73 59 1.73 3,409
16. Islam 3,490 13.02 22,654 84.48 671 2.50 26,815
21. Sinhala Language & Literature 261,670 99.96 3 0.00 111 0.04 261,784
22. Tamil Language & Literature 7 0.01 71,501 99.87 89 0.12 71,597
31. English 316,808 76.06 86,934 20.87 12,778 3.07 416,520
32. Mathematics 291,038 78.59 78,091 21.09 1,185 0.32 370,314
34. Science & Technology 264,544 78.61 71,076 21.12 889 0.26 336,509
35. Construction Techniques 230 99.57 1 0.43 - 0.00 231
36. Electrical & Electronic Techniques 80 72.73 30 27.27 - 0.00 110
37. Mechanics & Mechanical Techniques 86 100.00 - 0.00 - 0.00 86
38. Home Gardening Techniques 258 100.00 - 0.00 - 0.00 258
39. Creative Arts 101 93.52 7 6.48 - 0.00 108
40. Food Proc. & Dress Desing. Tech. 215 100.00 - 0.00 - 0.00 215
43. Social Studies & History 259,676 78.42 70,708 21.35 769 0.23 331,153
46. English Literature 15,718 85.60 1,501 8.17 1,143 6.22 18,362
47. Sinhala Literature 78,313 99.96 32 0.04 - 0.00 78,345
48. Tamil Literature 19 0.05 39,744 99.95 - 0.00 39,763
49. Arabic Literature 1 0.20 504 99.21 3 0.59 508
51. Art 111,037 77.89 31,273 21.94 251 0.18 142,561
52. Dancing (Sinhala) 62,965 100.00 - 0.00 3 0.00 62,968
53. Dancing (Bharatha) 18 0.51 3,537 99.49 - 0.00 3,555
54. Music (Sinhala) 63,931 99.99 7 0.01 - 0.00 63,938
55. Music (Carnatic) 2 0.01 17,791 99.98 1 0.01 17,794
56. Music (Western) 2,218 96.02 70 3.03 22 0.95 2,310
57. Drama & Theatre 9,748 92.28 816 7.72 - 0.00 10,564
G.C.E. (O.L.) Examination - 2005
Number of Candidates Sat for Each Subject - All Candidates
Tamil EnglishTotal
Sinhala
Medium
Subject No. % No. % No. %
61. Pali 861 98.85 - 0.00 10 1.15 871
62. Sanskrit 549 96.49 8 1.41 12 2.11 569
63. Arabic 20 1.14 1,548 88.51 181 10.35 1,749
64. Second Language (Sinhala) - 0.00 15,543 96.40 581 3.60 16,124
65. Second Language (Tamil) 3,624 94.52 - 0.00 210 5.48 3,834
67. Latin 2 100.00 - 0.00 - 0.00 2
68. French 522 72.40 20 2.77 179 24.83 721
69. Malay 1 25.00 1 25.00 2 50.00 4
70. History 82,823 92.60 6,612 7.39 4 0.00 89,439
71. Geography 74,446 79.53 19,138 20.44 26 0.03 93,610
72. Development Studies 32,331 80.07 8,029 19.88 18 0.04 40,378
73. Health & Physical Education 158,028 77.15 46,621 22.76 188 0.09 204,837
75. Hindi 82 94.25 1 1.15 4 4.60 87
76. Japanese 697 97.08 1 0.14 20 2.79 718
77. German 24 44.44 4 7.41 26 48.15 54
78. Agriculture 96,315 78.66 26,096 21.31 28 0.02 122,439
79. Horticulture 7,972 97.45 206 2.52 3 0.04 8,181
80. Animal Husbandry 19 79.17 5 20.83 - 0.00 24
81. Business & Accounting Studies 69,431 71.43 26,939 27.72 829 0.85 97,199
87. Inland Bio-Resources Technology 2 15.38 9 69.23 2 15.38 13
88. Marine Bio-Resources Technology 174 16.51 878 83.30 2 0.19 1,054
89. Food Science & Technology 261 90.94 24 8.36 2 0.70 287
90. Construction Technology 7,073 88.77 893 11.21 2 0.03 7,968
92. Shorthand & Type Writing (Sinhala) 519 99.62 1 0.19 1 0.19 521
93. Shorthand & Type Writing (Tamil) 1 0.78 128 99.22 - 0.00 129
94. Shorthand & Type Writing (English) 26 19.12 24 17.65 86 63.24 136
95. Mechanical Technology 5,752 96.97 170 2.87 10 0.17 5,932
96. Arts & Crafts 4,774 98.66 64 1.32 1 0.02 4,839
97. Electricity & Electronics Technology 6,535 93.68 424 6.08 17 0.24 6,976
98. Home Economics 59,653 80.16 14,732 19.80 35 0.05 74,420
Total English Tamil Sinhala
Number of Candidates Sat for Each Subject - All Candidates
G.C.E. (O.L.) Examination - 2005

- 15 -
- 14 -
Medium
Subject No. % No. % No. %
11. Buddhism 231,128 99.91 1 0.00 206 0.09 231,335
12. Saivism - 0.00 35,781 99.98 6 0.02 35,787
13. Hinduism 2 2.94 - 0.00 66 97.06 68
14. Catholicism 13,275 68.76 5,981 30.98 49 0.25 19,305
15. Christianity 1,330 41.67 1,813 56.80 49 1.54 3,192
16. Islam 3,526 12.74 23,403 84.55 751 2.71 27,680
21. Sinhala Language & Literature 252,793 99.93 43 0.02 142 0.06 252,978
22. Tamil Language & Literature 33 0.05 69,023 99.82 94 0.14 69,150
31. English 311,007 76.51 83,876 20.63 11,617 2.86 406,500
32. Mathematics 291,504 78.92 76,506 20.71 1,344 0.36 369,354
34. Science & Technology 253,344 78.56 68,100 21.12 1,038 0.32 322,482
35. Construction Techniques 340 99.13 3 0.87 - 0.00 343
36. Electrical & Electronic Techniques 137 93.84 9 6.16 - 0.00 146
37. Mechanics & Mechanical Techniques 107 86.99 16 13.01 - 0.00 123
38. Home Gardening Techniques 390 91.12 38 8.88 - 0.00 428
39. Creative Arts 201 92.63 16 7.37 - 0.00 217
40. Food Proc. & Dress Desing. Tech. 417 99.05 4 0.95 - 0.00 421
43. Social Studies & History 249,966 78.39 67,988 21.32 925 0.29 318,879
46. English Literature 15,574 86.13 1,385 7.66 1,124 6.22 18,083
47. Sinhala Literature 72,041 99.95 28 0.04 7 0.01 72,076
48. Tamil Literature 46 0.12 39,853 99.88 - 0.00 39,899
49. Arabic Literature 1 0.16 620 99.68 1 0.16 622
51. Art 105,276 78.70 28,280 21.14 221 0.17 133,777
52. Dancing (Sinhala) 60,851 99.99 1 0.00 8 0.01 60,860
53. Dancing (Bharatha) 12 0.38 3,173 99.47 5 0.16 3,190
54. Music (Sinhala) 59,510 99.99 1 0.00 2 0.00 59,513
55. Music (Carnatic) 2 0.01 15,075 99.93 8 0.05 15,085
56. Music (Western) 2,067 96.36 64 2.98 14 0.65 2,145
57. Drama & Theatre 12,506 88.33 1,652 88.33 - 0.00 14,158
Number of Candidates Sat for Each Subject - All Candidates
G.C.E. (O.L.) Examination - 2006
Sinhala Tamil EnglishTotal
Medium
Subject No. % No. % No. %
61. Pali 807 97.82 1 0.12 17 2.06 825
62. Sanskrit 457 94.03 13 2.67 16 3.29 486
63. Arabic 17 1.05 1,426 88.30 172 10.65 1,615
64. Second Language (Sinhala) 56 0.33 16,291 95.98 627 3.69 16,974
65. Second Language (Tamil) 3,955 93.70 44 1.04 222 5.26 4,221
68. French 479 69.52 19 2.76 191 27.72 689
69. Malay - 0.00 1 33.33 2 66.67 3
70. History 80,374 94.00 5,118 5.99 15 0.02 85,507
71. Geography 69,072 79.97 17,286 20.01 16 0.02 86,374
72. Development Studies 34,470 79.36 8,954 20.61 12 0.03 43,436
73. Health & Physical Education 166,534 77.36 48,380 22.48 344 0.16 215,258
75. Hindi 137 91.95 2 1.34 10 6.71 149
76. Japanese 930 97.08 9 0.94 19 1.98 958
77. German 53 66.25 2 2.50 25 31.25 80
78. Agriculture 95,302 78.06 26,762 21.92 27 0.02 122,091
79. Horticulture 7,369 98.08 143 1.90 1 0.01 7,513
80. Animal Husbandry 9 64.29 5 35.71 - 0.00 14
81. Business & Accounting Studies 67,856 73.20 23,851 25.73 987 1.06 92,694
87. Inland Bio-Resources Technology 3 30.00 7 70.00 - 0.00 10
88. Marine Bio-Resources Technology 144 16.48 729 83.41 1 0.11 874
89. Food Science & Technology 193 88.13 18 8.22 8 3.65 219
90. Construction Technology 6,586 86.64 1,016 13.36 - 0.00 7,602
92. Shorthand & Type Writing (Sinhala) 348 100.00 - 0.00 - 0.00 348
93. Shorthand & Type Writing (Tamil) - 0.00 79 98.75 1 1.25 80
94. Shorthand & Type Writing (English) 19 25.68 13 17.57 42 56.76 74
95. Mechanical Technology 5,744 97.46 146 2.48 4 0.07 5,894
96. Arts & Crafts 4,306 98.54 64 1.46 - 0.00 4,370
97. Electricity & Electronics Technology 5,914 93.83 375 5.95 14 0.22 6,303
98. Home Economics 54,130 79.24 14,138 20.70 41 0.06 68,309
English Tamil SinhalaTotal
Number of Candidates Sat for Each Subject - All Candidates
G.C.E. (O.L.) Examination - 2006

- 17 -
- 16 -
Medium
Subject No. % No. % No. %
11. Buddhism 238,086 99.87 3 0.00 311 0.13 238,400
12. Saivism 1 0.00 39,644 99.98 5 0.01 39,650
13. Hinduism 3 4.05 - 0.00 71 95.95 74
14. Christianity R.C. 14,093 68.59 6,379 31.04 76 0.37 20,548
15. Christianity N.R.C. 1,407 41.04 1,945 56.74 76 2.22 3,428
16. Islam 3,908 12.42 26,706 84.86 855 2.72 31,469
21. Sinhala Language & Literature 262,752 99.88 41 0.02 274 0.10 263,067
22. Tamil Language & Literature 60 0.08 76,796 99.75 133 0.17 76,989
31. English 319,763 75.82 94,994 22.52 6,979 1.65 421,736
32. Mathematics 307,599 77.60 87,117 21.98 1,654 0.42 396,370
34. Science & Technology 266,191 77.14 77,489 22.46 1,374 0.40 345,054
35. Construction Techniques 209 88.56 27 11.44 - 0.00 236
36. Electrical & Electronic Techniques 99 79.84 25 20.16 - 0.00 124
37. Mechanics & Mechanical Techniques 117 98.32 2 1.68 - 0.00 119
38. Home Gardening Techniques 155 91.72 14 8.28 - 0.00 169
39. Creative Arts 67 84.81 12 15.19 - 0.00 79
40. Food Proc. & Dress Desing. Tech. 112 81.16 26 18.84 - 0.00 138
43. Social Studies & History 258,880 77.13 75,561 22.51 1,183 0.35 335,624
46. English Literature 15,979 84.72 1,576 8.36 1,306 6.92 18,861
47. Sinhala Literature 71,237 99.94 38 0.05 5 0.01 71,280
48. Tamil Literature 51 0.11 44,743 99.89 - 0.00 44,794
49. Arabic Literature 3 0.35 858 99.54 1 0.12 862
51. Art 109,183 78.37 29,928 21.48 200 0.14 139,311
52. Dancing (Sinhala) 64,067 99.99 1 0.00 8 0.01 64,076
53. Dancing (Bharatha) 6 0.18 3,287 99.76 2 0.06 3,295
54. Music (Sinhala) 58,606 99.99 4 0.01 4 0.01 58,614
55. Music (Carnatic) 4 0.03 15,669 99.95 4 0.03 15,677
56. Music (Western) 2,164 95.63 69 3.05 30 1.33 2,263
57. Drama & Theatre 16,358 84.38 3,029 15.62 - 0.00 19,387
G.C.E. (O.L.) Examination - 2007
Number of Candidates Sat for Each Subject - All Candidates
Sinhala Tamil EnglishTotal
Medium
Subject No. % No. % No. %
61. Pali 730 98.25 - 0.00 13 1.75 743
62. Sanskrit 394 94.94 8 1.93 13 3.13 415
63. Arabic 31 1.80 1,517 88.25 171 9.95 1,719
64. Second Language (Sinhala) - 0.00 19,233 96.29 742 3.71 19,975
65. Second Language (Tamil) 4,279 93.80 - 0.00 283 6.20 4,562
68. French 503 72.27 25 3.59 168 24.14 696
70. History 80,394 94.15 4,988 5.84 11 0.01 85,393
71. Geography 67,210 78.04 18,886 21.93 23 0.03 86,119
72. Development Studies 38,859 79.13 10,222 20.81 29 0.06 49,110
73. Health & Physical Education 184,769 76.16 57,214 23.58 610 0.25 242,593
74. Communication & Media Studies 3,706 96.84 119 3.11 2 0.05 3,827
75. Hindi 204 97.14 4 1.90 2 0.95 210
76. Japanese 820 97.50 10 1.19 11 1.31 841
77. German 62 70.45 2 2.27 24 27.27 88
78. Agriculture 97,855 75.90 31,024 24.06 41 0.03 128,920
79. Horticulture 6,127 98.19 113 1.81 - 0.00 6,240
80. Animal Husbandry 9 60.00 5 33.33 1 6.67 15
81. Business & Accounting Studies 60,908 72.89 21,547 25.78 1,112 1.33 83,567
87. Inland Bio-Resources Technology - 0.00 5 100.00 - 0.00 5
88. Marine Bio-Resources Technology 143 15.18 798 84.71 1 0.11 942
89. Food Science & Technology 191 88.84 18 8.37 6 2.79 215
90. Construction Technology 6,172 84.16 1,162 15.84 - 0.00 7,334
92. Shorthand & Type Writing (Sinhala) 195 100.00 - 0.00 - 0.00 195
93. Shorthand & Type Writing (Tamil) - 0.00 50 100.00 - 0.00 50
94. Shorthand & Type Writing (English) 30 38.96 15 19.48 32 41.56 77
95. Mechanical Technology 5,007 95.37 240 4.57 3 0.06 5,250
96. Arts & Crafts 4,229 97.87 92 2.13 - 0.00 4,321
97. Electricity & Electronics Technology 4,471 93.09 318 6.62 14 0.29 4,803
98. Home Economics 52,165 77.43 15,190 22.55 18 0.03 67,373
99.Information & Communition Technology 19,384 82.86 3,834 16.39 177 0.76 23,395
Number of Candidates Sat for Each Subject - All Candidates
G.C.E. (O.L.) Examination - 2007
Sinhala Tamil EnglishTotal

- 19 -
- 18 -
Medium
Subject No. % No. % No. %
11. Buddhism 232,282 99.99 - - 29 0.01 232,311
12. Saivism - - 32,823 100.00 - - 32,823
13. Hinduism 1 100.00 - - - - 1
14. Catholicism 13,027 69.89 5,613 30.11 - - 18,640
15. Christianity 1,341 45.24 1,623 54.76 - - 2,964
16. Islam 3,374 15.58 18,286 84.42 - - 21,660
21. Sinhala Language & Literature 251,266 99.99 1 0.00 29 0.01 251,296
22. Tamil Language & Literature 2 0.00 58,752 100.00 - - 58,754
31. English 268,248 81.27 61,806 18.72 29 0.01 330,083
32. Mathematics 268,712 81.52 60,902 18.48 31 0.01 329,645
34. Science & Technology 253,966 81.18 58,863 18.81 30 0.01 312,859
35. Construction Techniques 230 99.57 1 0.43 - - 231
36. Electrical & Electronic Techniques 80 72.73 30 27.27 - - 110
37. Mechanics & Mechanical Techniques 86 100.00 - - - - 86
38. Home Gardening Techniques 258 100.00 - - - - 258
39. Creative Arts 101 93.52 7 6.48 - - 108
40. Food Proc. & Dress Desing. Tech. 215 100.00 - - - - 215
43. Social Studies & History 250,438 80.97 58,819 19.02 30 0.01 309,287
46. English Literature 15,247 91.77 1,337 8.05 30 0.18 16,614
47. Sinhala Literature 76,652 99.98 15 0.02 - - 76,667
48. Tamil Literature 9 0.03 35,235 99.97 - - 35,244
49. Arabic Literature - - 101 100.00 - - 101
51. Art 107,197 79.85 27,057 20.15 1 0.00 134,255
52. Dancing (Sinhala) 61,163 100.00 - - - - 61,163
53. Dancing (Bharatha) 7 0.23 3,056 99.77 - - 3,063
54. Music (Sinhala) 62,134 100.00 - - - - 62,134
55. Music (Carnatic) 1 0.01 15,257 99.99 - - 15,258
56. Music (Western) 2,176 96.93 69 3.07 - - 2,245
57. Drama & Theatre 9,465 94.37 565 5.63 - - 10,030
G.C.E. (O.L.) Examination - 2005
Sinhala Tamil English
Number of Candidates Sat for Each Subject - School Candidates
Total
Medium
Subject No. % No. % No. %
61. Pali 211 100.00 - - - - 211
62. Sanskrit 95 95.96 4 4.04 - - 99
63. Arabic 20 2.25 867 97.75 - - 887
64. Second Language (Sinhala) - - 13,838 100.00 - - 13,838
65. Second Language (Tamil) 2,661 99.81 - - 5 0.19 2,666
68. French 461 97.67 11 2.33 - - 472
69. Malay 1 100.00 - - - - 1
70. History 80,896 93.73 5,415 6.27 - - 86,311
71. Geography 72,901 81.31 16,749 18.68 4 0.00 89,654
72. Development Studies 31,828 81.56 7,186 18.42 8 0.02 39,022
73. Health & Physical Education 154,672 79.19 40,611 20.79 23 0.01 195,306
75. Hindi 18 100.00 - - - - 18
76. Japanese 403 100.00 - - - - 403
77. German 2 66.67 1 33.33 - - 3
78. Agriculture 92,324 81.64 20,765 18.36 - - 113,089
79. Horticulture 7,752 97.60 190 2.39 1 0.01 7,943
80. Animal Husbandry 12 100.00 - - - - 12
81. Business & Accounting Studies 66,926 73.93 23,570 26.04 28 0.03 90,524
88. Marine Bio-Resources Technology 166 17.47 784 82.53 - - 950
89. Food Science & Technology 229 100.00 - - - - 229
90. Construction Technology 6,757 91.26 647 8.74 - - 7,404
92. Shorthand & Type Writing (Sinhala) 241 100.00 - - - - 241
93. Shorthand & Type Writing (Tamil) - - 34 100.00 - - 34
95. Mechanical Technology 5,485 97.81 123 2.19 - - 5,608
96. Arts & Crafts 4,542 99.39 28 0.61 - - 4,570
97. Electricity & Electronics Technology 6,288 95.49 297 4.51 - - 6,585
98. Home Economics 57,463 82.16 12,477 17.84 - - 69,940
Sinhala Tamil English
Number of Candidates Sat for Each Subject - School Candidates
Total
G.C.E. (O.L.) Examination - 2005

- 21 -
- 20 -
Medium
Subject No. % No. % No. %
11. Buddhism 222,173 99.99 - - 30 0.01 222,203
12. Saivism - - 31,057 99.98 6 0.02 31,063
14. Catholicism 12,982 71.06 5,288 28.94 - - 18,270
15. Christianity 1,263 45.27 1,527 54.73 - - 2,790
16. Islam 3,390 15.33 18,725 84.66 2 0.01 22,117
21. Sinhala Language & Literature 242,018 99.99 1 0.00 33 0.01 242,052
22. Tamil Language & Literature - - 57,061 99.99 6 0.01 57,067
31. English 264,731 81.16 61,395 18.82 38 0.01 326,164
32. Mathematics 264,702 81.50 60,061 18.49 41 0.01 324,804
34. Science & Technology 242,704 80.94 57,095 19.04 41 0.01 299,840
35. Construction Techniques 339 100.00 - - - - 339
36. Electrical & Electronic Techniques 135 100.00 - - - - 135
37. Mechanics & Mechanical Techniques 106 88.33 14 11.67 - - 120
38. Home Gardening Techniques 386 91.25 37 8.75 - - 423
39. Creative Arts 201 93.93 13 6.07 - - 214
40. Food Proc. & Dress Desing. Tech. 417 100.00 - - - - 417
43. Social Studies & History 240,383 80.80 57,095 19.19 39 0.01 297,517
46. English Literature 15,207 92.31 1,230 7.47 37 0.22 16,474
47. Sinhala Literature 70,209 99.99 4 0.01 - - 70,213
48. Tamil Literature 36 0.10 35,252 99.90 - - 35,288
49. Arabic Literature - - 176 100.00 - - 176
51. Art 101,626 80.24 25,027 19.76 1 0.00 126,654
52. Dancing (Sinhala) 58,899 100.00 - - 1 0.00 58,900
53. Dancing (Bharatha) 4 0.14 2,808 99.79 2 0.07 2,814
54. Music (Sinhala) 57,602 100.00 - - 1 0.00 57,603
55. Music (Carnatic) 2 0.02 13,240 99.95 4 0.03 13,246
56. Music (Western) 2,037 97.00 63 3.00 - - 2,100
57. Drama & Theatre 12,180 90.66 1,255 9.34 - - 13,435
Tamil EnglishTotal
G.C.E. (O.L.) Examination - 2006
Number of Candidates Sat for Each Subject - School Candidates
Sinhala
Medium
Subject No. % No. % No. %
61. Pali 200 100.00 - - - - 200
62. Sanskrit 77 95.06 4 4.94 - - 81
63. Arabic 8 1.03 771 98.97 - - 779
64. Second Language (Sinhala) - - 14,001 99.95 7 0.05 14,008
65. Second Language (Tamil) 2,347 100.00 - - - - 2,347
68. French 398 96.60 14 3.40 - - 412
70. History 78,366 94.87 4,233 5.12 8 0.01 82,607
71. Geography 67,548 81.88 14,947 18.12 3 0.00 82,498
72. Development Studies 33,880 80.98 7,952 19.01 7 0.02 41,839
73. Health & Physical Education 162,405 79.31 42,330 20.67 30 0.01 204,765
75. Hindi 46 100.00 - - - - 46
76. Japanese 499 99.80 1 0.20 - - 500
77. German 30 96.77 - - 1 3.23 31
78. Agriculture 91,190 80.75 21,744 19.25 - - 112,934
79. Horticulture 7,166 98.08 140 1.92 - - 7,306
80. Animal Husbandry 2 100.00 - - - - 2
81. Business & Accounting Studies 65,474 75.41 21,308 24.54 39 0.04 86,821
88. Marine Bio-Resources Technology 135 17.98 616 82.02 - - 751
89. Food Science & Technology 153 100.00 - - - - 153
90. Construction Technology 6,340 89.78 722 10.22 - - 7,062
92. Shorthand & Type Writing (Sinhala) 202 100.00 - - - - 202
93. Shorthand & Type Writing (Tamil) - - 19 100.00 - - 19
94. Shorthand & Type Writing (English) 2 100.00 - - - - 2
95. Mechanical Technology 5,511 98.17 103 1.83 - - 5,614
96. Arts & Crafts 4,065 99.29 29 0.71 - - 4,094
97. Electricity & Electronics Technology 5,653 95.59 261 4.41 - - 5,914
98. Home Economics 51,891 81.22 11,999 18.78 - - 63,890
G.C.E. (O.L.) Examination - 2006
Number of Candidates Sat for Each Subject - School Candidates
Sinhala Tamil EnglishTotal

- 23 -
- 22 -
Medium
Subject No. % No. % No. %
11. Buddhism 230,006 99.99 - - 33 0.01 230,039
12. Saivism - - 34,202 100.00 - - 34,202
14. Christianity R.C. 13,850 70.83 5,703 29.17 - - 19,553
15. Christianity N.R.C. 1,338 44.70 1,655 55.30 - - 2,993
16. Islam 3,791 15.18 21,182 84.82 - - 24,973
21. Sinhala Language & Literature 252,499 99.99 - - 33 0.01 252,532
22. Tamil Language & Literature 1 0.00 63,141 100.00 - - 63,142
31. English 282,069 80.47 68,411 19.52 34 0.01 350,514
32. Mathematics 281,323 80.68 67,316 19.31 33 0.01 348,672
34. Science & Technology 255,682 79.96 64,039 20.03 33 0.01 319,754
35. Construction Techniques 205 99.51 1 0.49 - - 206
36. Electrical & Electronic Techniques 99 98.02 2 1.98 - - 101
37. Mechanics & Mechanical Techniques 115 100.00 - - - - 115
38. Home Gardening Techniques 154 97.47 4 2.53 - - 158
39. Creative Arts 64 92.75 5 7.25 - - 69
40. Food Proc. & Dress Desing. Tech. 109 87.20 16 12.80 - - 125
43. Social Studies & History 250,040 79.82 63,176 20.17 34 0.01 313,250
46. English Literature 15,669 91.70 1,386 8.11 33 0.19 17,088
47. Sinhala Literature 69,517 100.00 - - - - 69,517
48. Tamil Literature 29 0.07 39,357 99.93 - - 39,386
49. Arabic Literature - - 228 100.00 - - 228
51. Art 105,844 80.02 26,415 19.97 5 0.00 132,264
52. Dancing (Sinhala) 62,175 100.00 - - - - 62,175
53. Dancing (Bharatha) 3 0.10 2,856 99.90 - - 2,859
54. Music (Sinhala) 56,841 100.00 - - - - 56,841
55. Music (Carnatic) 3 0.02 13,795 99.98 - - 13,798
56. Music (Western) 2,123 96.98 66 3.02 - - 2,189
57. Drama & Theatre 15,993 87.62 2,260 12.38 - - 18,253
Total English
G.C.E. (O.L.) Examination - 2007
Number of Candidates Sat for Each Subject - School Candidates
Sinhala Tamil
Medium
Subject No. % No. % No. %
61. Pali 174 100.00 - - - - 174
62. Sanskrit 77 95.06 4 4.94 - - 81
63. Arabic 26 4.15 600 95.85 - 626
64. Second Language (Sinhala) - - 16,142 100.00 - - 16,142
65. Second Language (Tamil) 2,740 100.00 - - - - 2,740
68. French 419 96.54 15 3.46 - - 434
70. History 78,427 94.94 4,179 5.06 - - 82,606
71. Geography 65,780 80.25 16,184 19.75 1 0.00 81,965
72. Development Studies 38,237 80.87 9,024 19.09 22 0.05 47,283
73. Health & Physical Education 180,437 78.29 49,996 21.69 33 0.01 230,466
74. Communication & Media Studies 3,670 97.35 100 2.65 - - 3,770
75. Hindi 136 100.00 - - - - 136
76. Japanese 572 99.65 2 0.35 - - 574
77. German 38 100.00 - - - - 38
78. Agriculture 93,855 78.67 25,439 21.32 7 0.01 119,301
79. Horticulture 5,967 98.40 97 1.60 - - 6,064
81. Business & Accounting Studies 58,852 75.52 19,061 24.46 20 0.03 77,933
88. Marine Bio-Resources Technology 137 16.91 673 83.09 - - 810
89. Food Science & Technology 148 99.33 1 0.67 - - 149
90. Construction Technology 5,975 88.48 778 11.52 - - 6,753
92. Shorthand & Type Writing (Sinhala) 107 100.00 - - - - 107
93. Shorthand & Type Writing (Tamil) - - 14 100.00 - - 14
94. Shorthand & Type Writing (English) 1 100.00 - - - - 1
95. Mechanical Technology 4,868 96.64 169 3.36 - - 5,037
96. Arts & Crafts 4,039 99.04 39 0.96 - - 4,078
97. Electricity & Electronics Technology 4,333 95.40 209 4.60 - - 4,542
98. Home Economics 50,182 79.54 12,905 20.46 - - 63,087
99.Information & Communition Technology 19,247 83.99 3,645 15.91 23 0.10 22,915
G.C.E. (O.L.) Examination - 2007
Number of Candidates Sat for Each Subject - School Candidates
Total Sinhala Tamil English

- 25 -
- 24 -
Subject No.Sat A % B % C % S % A+B+C+S % W %
11. Buddhism 241,155 53,827 22.32 30,499 12.65 54,289 22.51 58,324 24.19 196,939 81.66 44,216 18.34
12. Saivism 38,860 11,029 28.38 5,149 13.25 9,332 24.01 9,506 24.46 35,016 90.11 3,844 9.89
13. Hinduism 47 6 12.77 2 4.26 12 25.53 20 42.55 40 85.11 7 14.89
14. Catholicism 19,805 5,533 27.94 4,194 21.18 5,745 29.01 3,430 17.32 18,902 95.44 903 4.56
15. Christianity 3,409 654 19.18 667 19.57 1,013 29.72 854 25.05 3,188 93.52 221 6.48
16. Islam 26,815 4,521 16.86 3,723 13.88 7,522 28.05 7,377 27.51 23,143 86.31 3,672 13.69
21. Sinhala Language & Literature 261,784 27,825 10.63 37,503 14.33 81,600 31.17 69,990 26.74 216,918 82.86 44,866 17.14
22. Tamil Language & Literature 71,597 8,011 11.19 10,042 14.03 21,682 30.28 19,298 26.95 59,033 82.45 12,564 17.55
31. English 416,520 30,509 7.32 18,025 4.33 43,549 10.46 77,879 18.70 169,962 40.81 246,558 59.19
32. Mathematics 370,314 32,573 8.80 17,291 4.67 40,695 10.99 68,285 18.44 158,844 42.89 211,470 57.11
34. Science & Technology 336,509 19,582 5.82 19,411 5.77 46,780 13.90 91,329 27.14 177,102 52.63 159,407 47.37
35. Construction Techniques 231 11 4.76 17 7.36 79 34.20 86 37.23 193 83.55 38 16.45
36. Electrical & Electronic Techniques 110 12 10.91 7 6.36 24 21.82 20 18.18 63 57.27 47 42.73
37. Mechanics & Mechanical Techniques 86 9 10.47 8 9.30 41 47.67 20 23.26 78 90.70 8 9.30
38. Home Gardening Techniques 258 57 22.09 52 20.16 100 38.76 38 14.73 247 95.74 11 4.26
39. Creative Arts 108 61 56.48 25 23.15 16 14.81 2 1.85 104 96.30 4 3.70
40. Food Proc. & Dress Desing. Tech. 215 17 7.91 43 20.00 84 39.07 58 26.98 202 93.95 13 6.05
43. Social Studies & History 331,153 21,329 6.44 32,677 9.87 85,456 25.81 113,832 34.37 253,294 76.49 77,859 23.51
46. English Literature 18,362 1,644 8.95 2,198 11.97 4,252 23.16 4,360 23.74 12,454 67.82 5,908 32.18
47. Sinhala Literature 78,345 3,359 4.29 5,363 6.85 14,365 18.34 22,752 29.04 45,839 58.51 32,506 41.49
48. Tamil Literature 39,763 2,869 7.22 3,242 8.15 7,618 19.16 10,385 26.12 24,114 60.64 15,649 39.36
49. Arabic Literature 508 95 18.70 105 20.67 143 28.15 129 25.39 472 92.91 36 7.09
51. Art 142,561 3,697 2.59 5,315 3.73 18,587 13.04 52,127 36.56 79,726 55.92 62,835 44.08
52. Dancing (Sinhala) 62,968 9,214 14.63 9,373 14.89 17,575 27.91 18,607 29.55 54,769 86.98 8,199 13.02
53. Dancing (Bharatha) 3,555 491 13.81 342 9.62 660 18.57 1,062 29.87 2,555 71.87 1,000 28.13
54. Music (Sinhala) 63,938 2,699 4.22 3,367 5.27 10,546 16.49 21,572 33.74 38,184 59.72 25,754 40.28
55. Music (Carnatic) 17,794 1,368 7.69 1,152 6.47 2,536 14.25 5,125 28.80 10,181 57.22 7,613 42.78
56. Music (Western) 2,310 1,021 44.20 437 18.92 422 18.27 262 11.34 2,142 92.73 168 7.27
57. Drama & Theatre 10,564 2,033 19.24 1,869 17.69 2,798 26.49 2,733 25.87 9,433 89.29 1,131 10.71
G.C.E. (O.L.) Examination - 2005
Results by Grades in Each Subject - All Candidates
Subject No.Sat A % B % C % S % A+B+C+S % W %
61. Pali 871 58 6.66 82 9.41 297 34.10 258 29.62 695 79.79 176 20.21
62. Sanskrit 569 25 4.39 29 5.10 76 13.36 140 24.60 270 47.45 299 52.55
63. Arabic 1,749 570 32.59 164 9.38 235 13.44 335 19.15 1,304 74.56 445 25.44
64. Second Language (Sinhala) 16,124 390 2.42 862 5.35 2,645 16.40 4,479 27.78 8,376 51.95 7,748 48.05
65. Second Language (Tamil) 3,834 103 2.69 209 5.45 637 16.61 939 24.49 1,888 49.24 1,946 50.76
67. Latin 2 - - - - - - - - - - 2 100.00
68. French 721 72 9.99 68 9.43 140 19.42 138 19.14 418 57.98 303 42.02
69. Malay 4 - - 1 25.00 3 75.00 - - 4 100.00 - -
70. History 89,439 4,657 5.21 6,099 6.82 17,246 19.28 28,484 31.85 56,486 63.16 32,953 36.84
71. Geography 93,610 3,721 3.98 6,917 7.39 20,021 21.39 30,741 32.84 61,400 65.59 32,210 34.41
72. Development Studies 40,378 5,338 13.22 6,918 17.13 12,350 30.59 10,297 25.50 34,903 86.44 5,475 13.56
73. Health & Physical Education 204,837 35,085 17.13 37,001 18.06 69,178 33.77 46,979 22.93 188,243 91.90 16,594 8.10
75. Hindi 87 24 27.59 12 13.79 21 24.14 15 17.24 72 82.76 15 17.24
76. Japanese 718 124 17.27 73 10.17 82 11.42 79 11.00 358 49.86 360 50.14
77. German 54 24 44.44 13 24.07 9 16.67 2 3.70 48 88.89 6 11.11
78. Agriculture 122,439 7,601 6.21 10,092 8.24 32,193 26.29 42,882 35.02 92,768 75.77 29,671 24.23
79. Horticulture 8,181 806 9.85 682 8.34 2,049 25.05 2,662 32.54 6,199 75.77 1,982 24.23
80. Animal Husbandry 24 4 16.67 2 8.33 7 29.17 9 37.50 22 91.67 2 8.33
81. Business & Accounting Studies 97,199 10,903 11.22 13,160 13.54 22,524 23.17 25,728 26.47 72,315 74.40 24,884 25.60
87. Inland Bio-Resources Technology 13 2 15.38 2 15.38 2 15.38 7 53.85 13 100.00 - -
88. Marine Bio-Resources Technology 1,054 102 9.68 228 21.63 442 41.94 192 18.22 964 91.46 90 8.54
89. Food Science & Technology 287 39 13.59 48 16.72 95 33.10 79 27.53 261 90.94 26 9.06
90. Construction Technology 7,968 348 4.37 732 9.19 2,091 26.24 2,534 31.80 5,705 71.60 2,263 28.40
92. Shorthand & Type Writing (Sinhala) 521 171 32.82 29 5.57 53 10.17 23 4.41 276 52.98 245 47.02
93. Shorthand & Type Writing (Tamil) 129 37 28.68 10 7.75 27 20.93 8 6.20 82 63.57 47 36.43
94. Shorthand & Type Writing (English) 136 11 8.09 5 3.68 7 5.15 1 0.74 24 17.65 112 82.35
95. Mechanical Technology 5,932 820 13.82 639 10.77 1,494 25.19 1,614 27.21 4,567 76.99 1,365 23.01
96. Arts & Crafts 4,839 456 9.42 610 12.61 1,529 31.60 1,499 30.98 4,094 84.60 745 15.40
97. Electricity & Electronics Technology 6,976 865 12.40 551 7.90 1,203 17.24 1,974 28.30 4,593 65.84 2,383 34.16
98. Home Economics 74,420 791 1.06 2,867 3.85 17,514 23.53 30,349 40.78 51,521 69.23 22,899 30.77
G.C.E.(O.L.) Examination - 2005
Results by Grades in Each Subject - All Candidates

- 27 -
- 26 -
Subject No. Sat A % B % C % S % A+B+C+S % W %
11. Buddhism 231,335 63,280 27.35 32,127 13.89 52,061 22.50 46,158 19.95 193,626 83.70 37,709 16.30
12. Saivism 35,787 7,532 21.05 4,820 13.47 9,476 26.48 9,364 26.17 31,192 87.16 4,595 12.84
13. Hinduism 68 5 7.35 10 14.71 17 25.00 16 23.53 48 70.59 20 29.41
14. Catholicism 19,305 5,544 28.72 4,492 23.27 5,624 29.13 2,902 15.03 18,562 96.15 743 3.85
15. Christianity 3,192 731 22.90 650 20.36 909 28.48 616 19.30 2,906 91.04 286 8.96
16. Islam 27,680 5,398 19.50 4,129 14.92 7,502 27.10 6,981 25.22 24,010 86.74 3,670 13.26
21. Sinhala Language & Literature 252,978 26,102 10.32 30,915 12.22 78,636 31.08 68,122 26.93 203,775 80.55 49,203 19.45
22. Tamil Language & Literature 69,150 8,287 11.98 9,849 14.24 20,991 30.36 18,658 26.98 57,785 83.56 11,365 16.44
31. English 406,500 30,027 7.39 16,815 4.14 36,186 8.90 80,997 19.93 164,025 40.35 242,475 59.65
32. Mathematics 369,354 23,433 6.34 17,104 4.63 38,338 10.38 76,668 20.76 155,543 42.11 213,811 57.89
34. Science & Technology 322,482 14,697 4.56 17,855 5.54 42,676 13.23 68,328 21.19 143,556 44.52 178,926 55.48
35. Construction Techniques 343 32 9.33 44 12.83 77 22.45 117 34.11 270 78.72 73 21.28
36. Electrical & Electronic Techniques 146 4 2.74 7 4.79 30 20.55 50 34.25 91 62.33 55 37.67
37. Mechanics & Mechanical Techniques 123 7 5.69 15 12.20 37 30.08 43 34.96 102 82.93 21 17.07
38. Home Gardening Techniques 428 83 19.39 85 19.86 138 32.24 83 19.39 389 90.89 39 9.11
39. Creative Arts 217 81 37.33 49 22.58 52 23.96 28 12.90 210 96.77 7 3.23
40. Food Proc. & Dress Desing. Tech. 421 20 4.75 62 14.73 167 39.67 129 30.64 378 89.79 43 10.21
43. Social Studies & History 318,879 31,118 9.76 33,966 10.65 78,899 24.74 98,600 30.92 242,583 76.07 76,296 23.93
46. English Literature 18,083 1,258 6.96 2,126 11.76 4,294 23.75 4,734 26.18 12,412 68.64 5,671 31.36
47. Sinhala Literature 72,076 7,418 10.29 7,307 10.14 14,259 19.78 16,215 22.50 45,199 62.71 26,877 37.29
48. Tamil Literature 39,899 3,423 8.58 3,386 8.49 6,616 16.58 8,497 21.30 21,922 54.94 17,977 45.06
49. Arabic Literature 622 139 22.35 122 19.61 163 26.21 146 23.47 570 91.64 52 8.36
51. Art 133,777 3,118 2.33 4,676 3.50 16,686 12.47 47,457 35.47 71,937 53.77 61,840 46.23
52. Dancing (Sinhala) 60,860 8,847 14.54 8,268 13.59 14,937 24.54 18,183 29.88 50,235 82.54 10,625 17.46
53. Dancing (Bharatha) 3,190 513 16.08 306 9.59 532 16.68 1,012 31.72 2,363 74.08 827 25.92
54. Music (Sinhala) 59,513 4,713 7.92 4,074 6.85 9,989 16.78 17,682 29.71 36,458 61.26 23,055 38.74
55. Music (Carnatic) 15,085 1,868 12.38 1,117 7.40 2,465 16.34 3,855 25.56 9,305 61.68 5,780 38.32
56. Music (Western) 2,145 958 44.66 429 20.00 303 14.13 206 9.60 1,896 88.39 249 11.61
57. Drama & Theatre 14,158 3,624 25.60 3,165 22.35 3,994 28.21 2,658 18.77 13,441 94.94 717 5.06
Results by Grades in Each Subject - All Candidates
G.C.E. (O.L.) Examination - 2006
Subject No. Sat A % B % C % S % A+B+C+S % W %
61. Pali 825 89 10.79 120 14.55 223 27.03 242 29.33 674 81.70 151 18.30
62. Sanskrit 486 29 5.97 29 5.97 66 13.58 114 23.46 238 48.97 248 51.03
63. Arabic 1,615 535 33.13 163 10.09 206 12.76 336 20.80 1,240 76.78 375 23.22
64. Second Language (Sinhala) 16,974 388 2.29 846 4.98 2,645 15.58 4,481 26.40 8,360 49.25 8,614 50.75
65. Second Language (Tamil) 4,221 157 3.72 207 4.90 608 14.40 1,098 26.01 2,070 49.04 2,151 50.96
68. French 689 31 4.50 45 6.53 116 16.84 162 23.51 354 51.38 335 48.62
69. Malay 3 2 66.67 1 33.33 - - - - 3 100.00 - -
70. History 85,507 3,376 3.95 4,781 5.59 13,601 15.91 26,413 30.89 48,171 56.34 37,336 43.66
71. Geography 86,374 2,985 3.46 4,496 5.21 14,742 17.07 29,286 33.91 51,509 59.63 34,865 40.37
72. Development Studies 43,436 5,719 13.17 7,661 17.64 13,614 31.34 11,120 25.60 38,114 87.75 5,322 12.25
73. Health & Physical Education 215,258 35,320 16.41 40,626 18.87 72,780 33.81 48,905 22.72 197,631 91.81 17,627 8.19
75. Hindi 149 46 30.87 21 14.09 34 22.82 23 15.44 124 83.22 25 16.78
76. Japanese 958 277 28.91 84 8.77 103 10.75 117 12.21 581 60.65 377 39.35
77. German 80 25 31.25 12 15.00 9 11.25 12 15.00 58 72.50 22 27.50
78. Agriculture 122,091 9,449 7.74 11,387 9.33 32,293 26.45 38,747 31.74 91,876 75.25 30,215 24.75
79. Horticulture 7,513 1,465 19.50 983 13.08 1,899 25.28 1,950 25.96 6,297 83.81 1,216 16.19
80. Animal Husbandry 14 - - 2 14.29 6 42.86 5 35.71 13 92.86 1 7.14
81. Business & Accounting Studies 92,694 19,290 20.81 11,237 12.12 19,634 21.18 23,699 25.57 73,860 79.68 18,834 20.32
87. Inland Bio-Resources Technology 10 1 10.00 3 30.00 1 10.00 5 50.00 10 100.00 - -
88. Marine Bio-Resources Technology 874 88 10.07 207 23.68 286 32.72 204 23.34 785 89.82 89 10.18
89. Food Science & Technology 219 25 11.42 42 19.18 73 33.33 57 26.03 197 89.95 22 10.05
90. Construction Technology 7,602 779 10.25 1,021 13.43 2,440 32.10 2,103 27.66 6,343 83.44 1,259 16.56
92. Shorthand & Type Writing (Sinhala) 348 119 34.20 17 4.89 19 5.46 12 3.45 167 47.99 181 52.01
93. Shorthand & Type Writing (Tamil) 80 19 23.75 24 30.00 15 18.75 9 11.25 67 83.75 13 16.25
94. Shorthand & Type Writing (English) 74 7 9.46 1 1.35 8 10.81 1 1.35 17 22.97 57 77.03
95. Mechanical Technology 5,894 547 9.28 544 9.23 1,374 23.31 1,754 29.76 4,219 71.58 1,675 28.42
96. Arts & Crafts 4,370 333 7.62 532 12.17 1,183 27.07 1,386 31.72 3,434 78.58 936 21.42
97. Electricity & Electronics Technology 6,303 722 11.45 525 8.33 1,137 18.04 1,906 30.24 4,290 68.06 2,013 31.94
98. Home Economics 68,309 1,175 1.72 3,913 5.73 15,141 22.17 30,969 45.34 51,198 74.95 17,111 25.05
G.C.E. (O.L.) Examination - 2006
Results by Grades in Each Subject - All Candidates

- 29 -
- 28 -
Subject No. Sat A % B % C % S % A+B+C+S % W %
11. Buddhism 238,400 63,442 26.61 34,062 14.29 55,109 23.12 49,077 20.59 201,690 84.60 36,710 15.40
12. Saivism 39,650 9,979 25.17 6,530 16.47 10,816 27.28 8,437 21.28 35,762 90.19 3,888 9.81
13. Hinduism 74 8 10.81 10 13.51 28 37.84 17 22.97 63 85.14 11 14.86
14. Christianity R.C. 20,548 4,607 22.42 4,276 20.81 6,110 29.74 4,300 20.93 19,293 93.89 1,255 6.11
15. Christianity N.R.C. 3,428 828 24.15 636 18.55 954 27.83 707 20.62 3,125 91.16 303 8.84
16. Islam 31,469 5,238 16.64 4,911 15.61 9,046 28.75 8,371 26.60 27,566 87.60 3,903 12.40
21. Sinhala Language & Literature 263,067 29,746 11.31 41,240 15.68 79,023 30.04 66,707 25.36 216,716 82.38 46,351 17.62
22. Tamil Language & Literature 76,989 7,331 9.52 9,035 11.74 21,675 28.15 23,711 30.80 61,752 80.21 15,237 19.79
31. English 421,736 44,605 10.58 23,119 5.48 44,877 10.64 67,691 16.05 180,292 42.75 241,444 57.25
32. Mathematics 396,370 29,712 7.50 19,370 4.89 48,734 12.30 102,044 25.74 199,860 50.42 196,510 49.58
34. Science & Technology 345,054 15,358 4.45 19,157 5.55 44,164 12.80 74,823 21.68 153,502 44.49 191,552 55.51
35. Construction Techniques 236 30 12.71 53 22.46 99 41.95 45 19.07 227 96.19 9 3.81
36. Electrical & Electronic Techniques 124 1 0.81 1 0.81 22 17.74 39 31.45 63 50.81 61 49.19
37. Mechanics & Mechanical Techniques 119 - - 1 0.84 11 9.24 51 42.86 63 52.94 56 47.06
38. Home Gardening Techniques 169 14 8.28 40 23.67 54 31.95 41 24.26 149 88.17 20 11.83
39. Creative Arts 79 45 56.96 18 22.78 8 10.13 6 7.59 77 97.47 2 2.53
40. Food Proc. & Dress Desing. Tech. 138 - - 10 7.25 66 47.83 50 36.23 126 91.30 12 8.70
43. Social Studies & History 335,624 34,583 10.30 33,268 9.91 77,311 23.04 105,856 31.54 251,018 74.79 84,606 25.21
46. English Literature 18,861 1,861 9.87 2,544 13.49 4,198 22.26 4,605 24.42 13,208 70.03 5,653 29.97
47. Sinhala Literature 71,280 9,119 12.79 9,123 12.80 16,981 23.82 16,061 22.53 51,284 71.95 19,996 28.05
48. Tamil Literature 44,794 3,675 8.20 4,118 9.19 8,401 18.75 11,929 26.63 28,123 62.78 16,671 37.22
49. Arabic Literature 862 175 20.30 182 21.11 273 31.67 191 22.16 821 95.24 41 4.76
51. Art 139,311 3,748 2.69 6,079 4.36 22,781 16.35 58,608 42.07 91,216 65.48 48,095 34.52
52. Dancing (Sinhala) 64,076 7,726 12.06 7,648 11.94 14,079 21.97 20,682 32.28 50,135 78.24 13,941 21.76
53. Dancing (Bharatha) 3,295 1,120 33.99 456 13.84 496 15.05 845 25.64 2,917 88.53 378 11.47
54. Music (Sinhala) 58,614 4,432 7.56 4,119 7.03 9,100 15.53 17,387 29.66 35,038 59.78 23,576 40.22
55. Music (Carnatic) 15,677 2,493 15.90 1,711 10.91 2,895 18.47 4,314 27.52 11,413 72.80 4,264 27.20
56. Music (Western) 2,263 1,370 60.54 336 14.85 264 11.67 180 7.95 2,150 95.01 113 4.99
57. Drama & Theatre 19,387 3,603 18.58 3,796 19.58 5,958 30.73 4,622 23.84 17,979 92.74 1,408 7.26
G.C.E. (O.L.) Examination - 2007
Results by Grades in Each Subject - All Candidates
Subject No. Sat A % B % C % S % A+B+C+S % W %
61. Pali 743 18 2.42 38 5.11 171 23.01 267 35.94 494 66.49 249 33.51
62. Sanskrit 415 31 7.47 20 4.82 64 15.42 128 30.84 243 58.55 172 41.45
63. Arabic 1,719 680 39.56 221 12.86 221 12.86 243 14.14 1,365 79.41 354 20.59
64. Second Language (Sinhala) 19,975 469 2.35 1,334 6.68 4,236 21.21 5,565 27.86 11,604 58.09 8,371 41.91
65. Second Language (Tamil) 4,562 346 7.58 482 10.57 860 18.85 1,129 24.75 2,817 61.75 1,745 38.25
68. French 696 132 18.97 63 9.05 93 13.36 102 14.66 390 56.03 306 43.97
70. History 85,393 7,023 8.22 6,804 7.97 16,972 19.88 26,279 30.77 57,078 66.84 28,315 33.16
71. Geography 86,119 3,208 3.73 5,773 6.70 18,001 20.90 30,340 35.23 57,322 66.56 28,797 33.44
72. Development Studies 49,110 5,066 10.32 6,574 13.39 14,075 28.66 14,956 30.45 40,671 82.82 8,439 17.18
73. Health & Physical Education 242,593 53,590 22.09 45,418 18.72 72,516 29.89 49,351 20.34 220,875 91.05 21,718 8.95
74. Communication & Media Studies 3,827 453 11.84 631 16.49 1,104 28.85 1,008 26.34 3,196 83.51 631 16.49
75. Hindi 210 45 21.43 21 10.00 30 14.29 33 15.71 129 61.43 81 38.57
76. Japanese 841 227 26.99 64 7.61 87 10.34 107 12.72 485 57.67 356 42.33
77. German 88 16 18.18 11 12.50 20 22.73 11 12.50 58 65.91 30 34.09
78. Agriculture 128,920 3,921 3.04 7,059 5.48 27,626 21.43 47,273 36.67 85,879 66.61 43,041 33.39
79. Horticulture 6,240 499 8.00 528 8.46 1,591 25.50 2,115 33.89 4,733 75.85 1,507 24.15
80. Animal Husbandry 15 1 6.67 3 20.00 1 6.67 4 26.67 9 60.00 6 40.00
81. Business & Accounting Studies 83,567 12,245 14.65 9,192 11.00 17,492 20.93 23,621 28.27 62,550 74.85 21,017 25.15
87. Inland Bio-Resources Technology 5 - - - - 1 20.00 4 80.00 5 100.00 - -
88. Marine Bio-Resources Technology 942 27 2.87 108 11.46 429 45.54 259 27.49 823 87.37 119 12.63
89. Food Science & Technology 215 12 5.58 27 12.56 60 27.91 81 37.67 180 83.72 35 16.28
90. Construction Technology 7,334 476 6.49 694 9.46 2,219 30.26 2,433 33.17 5,822 79.38 1,512 20.62
92. Shorthand & Type Writing (Sinhala) 195 62 31.79 8 4.10 27 13.85 9 4.62 106 54.36 89 45.64
93. Shorthand & Type Writing (Tamil) 50 5 10.00 7 14.00 8 16.00 4 8.00 24 48.00 26 52.00
94. Shorthand & Type Writing (English) 77 3 3.90 6 7.79 4 5.19 2 2.60 15 19.48 62 80.52
95. Mechanical Technology 5,250 337 6.42 329 6.27 1,057 20.13 1,892 36.04 3,615 68.86 1,635 31.14
96. Arts & Crafts 4,321 542 12.54 809 18.72 1,487 34.41 1,078 24.95 3,916 90.63 405 9.37
97. Electricity & Electronics Technology 4,803 750 15.62 397 8.27 859 17.88 1,393 29.00 3,399 70.77 1,404 29.23
98. Home Economics 67,373 1,222 1.81 3,640 5.40 18,901 28.05 28,883 42.87 52,646 78.14 14,727 21.86
99.Information & Communition Technology 23,395 5,322 22.75 3,952 16.89 6,297 26.92 5,138 21.96 20,709 88.52 2,686 11.48
G.C.E. (O.L.) Examination - 2007
Results by Grades in Each Subject - All Candidates

- 31 -
- 30 -
Subject No. Sat A % B % C % S % A+B+C+S % W %
11. Buddhism 232,311 52,895 22.77 29,222 12.58 51,425 22.14 55,565 23.92 189,107 81.40 43,204 18.60
12. Saivism 32,823 10,040 30.59 4,235 12.90 7,396 22.53 7,774 23.68 29,445 89.71 3,378 10.29
13. Hinduism 1 - - - - - - - - - - 1 100.00
14. Catholicism 18,640 5,339 28.64 3,928 21.07 5,293 28.40 3,221 17.28 17,781 95.39 859 4.61
15. Christianity 2,964 621 20.95 581 19.60 851 28.71 714 24.09 2,767 93.35 197 6.65
16. Islam 21,660 4,001 18.47 3,031 13.99 5,781 26.69 5,819 26.87 18,632 86.02 3,028 13.98
21. Sinhala Language & Literature 251,296 27,695 11.02 36,640 14.58 77,223 30.73 66,160 26.33 207,718 82.66 43,578 17.34
22. Tamil Language & Literature 58,754 7,642 13.01 8,814 15.00 17,353 29.54 14,794 25.18 48,603 82.72 10,151 17.28
31. English 330,083 24,418 7.40 12,054 3.65 27,356 8.29 51,634 15.64 115,462 34.98 214,621 65.02
32. Mathematics 329,645 31,919 9.68 16,462 4.99 36,777 11.16 57,285 17.38 142,443 43.21 187,202 56.79
34. Science & Technology 312,859 19,355 6.19 18,998 6.07 44,978 14.38 83,749 26.77 167,080 53.40 145,779 46.60
35. Construction Techniques 231 11 4.76 17 7.36 79 34.20 86 37.23 193 83.55 38 16.45
36. Electrical & Electronic Techniques 110 12 10.91 7 6.36 24 21.82 20 18.18 63 57.27 47 42.73
37. Mechanics & Mechanical Techniques 86 9 10.47 8 9.30 41 47.67 20 23.26 78 90.70 8 9.30
38. Home Gardening Techniques 258 57 22.09 52 20.16 100 38.76 38 14.73 247 95.74 11 4.26
39. Creative Arts 108 61 56.48 25 23.15 16 14.81 2 1.85 104 96.30 4 3.70
40. Food Proc. & Dress Desing. Tech. 215 17 7.91 43 20.00 84 39.07 58 26.98 202 93.95 13 6.05
43. Social Studies & History 309,287 21,216 6.86 32,078 10.37 80,501 26.03 103,191 33.36 236,986 76.62 72,301 23.38
46. English Literature 16,614 1,593 9.59 2,096 12.62 3,965 23.87 3,947 23.76 11,601 69.83 5,013 30.17
47. Sinhala Literature 76,667 3,340 4.36 5,319 6.94 14,114 18.41 22,118 28.85 44,891 58.55 31,776 41.45
48. Tamil Literature 35,244 2,825 8.02 3,060 8.68 6,828 19.37 8,955 25.41 21,668 61.48 13,576 38.52
49. Arabic Literature 101 25 24.75 15 14.85 19 18.81 28 27.72 87 86.14 14 13.86
51. Art 134,255 3,592 2.68 5,156 3.84 17,851 13.30 48,915 36.43 75,514 56.25 58,741 43.75
52. Dancing (Sinhala) 61,163 9,065 14.82 9,200 15.04 17,046 27.87 17,893 29.25 53,204 86.99 7,959 13.01
53. Dancing (Bharatha) 3,063 481 15.70 331 10.81 610 19.92 888 28.99 2,310 75.42 753 24.58
54. Music (Sinhala) 62,134 2,689 4.33 3,349 5.39 10,386 16.72 20,863 33.58 37,287 60.01 24,847 39.99
55. Music (Carnatic) 15,258 1,346 8.82 1,106 7.25 2,287 14.99 4,375 28.67 9,114 59.73 6,144 40.27
56. Music (Western) 2,245 1,012 45.08 429 19.11 408 18.17 251 11.18 2,100 93.54 145 6.46
57. Drama and Theatre 10,030 1,931 19.25 1,772 17.67 2,640 26.32 2,593 25.85 8,936 89.09 1,094 10.91
G.C.E. (O.L.) Examination - 2005
Results by Grades in Each Subject - School Candidates
Subject No. Sat. A % B % C % S % A+B+C+S % W %
61. Pali 211 24 11.37 23 10.90 67 31.75 60 28.44 174 82.46 37 17.54
62. Sanskrit 99 6 6.06 6 6.06 15 15.15 32 32.32 59 59.60 40 40.40
63. Arabic 887 164 18.49 48 5.41 110 12.40 217 24.46 539 60.77 348 39.23
64. Second Language (Sinhala) 13,838 235 1.70 672 4.86 2,238 16.17 3,882 28.05 7,027 50.78 6,811 49.22
65. Second Language (Tamil) 2,666 53 1.99 134 5.03 450 16.88 665 24.94 1,302 48.84 1,364 51.16
68. French 472 49 10.38 45 9.53 94 19.92 83 17.58 271 57.42 201 42.58
69. Malay 1 - - 1 100.00 - - - - 1 100.00 - -
70. History 86,311 4,634 5.37 6,022 6.98 16,789 19.45 27,236 31.56 54,681 63.35 31,630 36.65
71. Geography 89,654 3,626 4.04 6,691 7.46 19,190 21.40 29,168 32.53 58,675 65.45 30,979 34.55
72. Development Studies 39,022 5,300 13.58 6,805 17.44 11,913 30.53 9,753 24.99 33,771 86.54 5,251 13.46
73. Health & Physical Education 195,306 34,592 17.71 35,705 18.28 65,018 33.29 43,950 22.50 179,265 91.79 16,041 8.21
75. Hindi 18 4 22.22 3 16.67 5 27.78 3 16.67 15 83.33 3 16.67
76. Japanese 403 50 12.41 34 8.44 54 13.40 43 10.67 181 44.91 222 55.09
77. German 3 2 66.67 - - - - - - 2 66.67 1 33.33
78. Agriculture 113,089 7,396 6.54 9,574 8.47 29,459 26.05 38,835 34.34 85,264 75.40 27,825 24.60
79. Horticulture 7,943 798 10.05 680 8.56 2,007 25.27 2,559 32.22 6,044 76.09 1,899 23.91
80. Animal Husbandry 12 1 8.33 1 8.33 4 33.33 5 41.67 11 91.67 1 8.33
81. Business & Accounting Studies 90,524 9,920 10.96 12,459 13.76 21,378 23.62 23,971 26.48 67,728 74.82 22,796 25.18
88. Marine Bio-Resources Technology 950 86 9.05 199 20.95 410 43.16 168 17.68 863 90.84 87 9.16
89. Food Science & Technology 229 39 17.03 41 17.90 72 31.44 54 23.58 206 89.96 23 10.04
90. Construction Technology 7,404 316 4.27 651 8.79 1,891 25.54 2,349 31.73 5,207 70.33 2,197 29.67
92. Shorthand & Type Writing (Sinhala) 241 39 16.18 6 2.49 19 7.88 17 7.05 81 33.61 160 66.39
93. Shorthand & Type Writing (Tamil) 34 1 2.94 - - 7 20.59 2 5.88 10 29.41 24 70.59
95. Mechanical Technology 5,608 782 13.94 609 10.86 1,395 24.88 1,514 27.00 4,300 76.68 1,308 23.32
96. Arts & Crafts 4,570 445 9.74 581 12.71 1,427 31.23 1,388 30.37 3,841 84.05 729 15.95
97. Electricity & Electronics Technology 6,585 854 12.97 538 8.17 1,140 17.31 1,847 28.05 4,379 66.50 2,206 33.50
98. Home Economics 69,940 778 1.11 2,800 4.00 16,648 23.80 28,269 40.42 48,495 69.34 21,445 30.66
G.C.E. (O.L.) Examination - 2005
Results by Grades in Each Subject - School Candidates

- 33 -
- 32 -
Subject No. Sat A % B % C % S % A+B+C+S % W %
11. Buddhism 222,203 61,698 27.77 30,535 13.74 49,148 22.12 43,970 19.79 185,351 83.42 36,852 16.58
12. Saivism 31,063 7,165 23.07 4,207 13.54 7,855 25.29 7,769 25.01 26,996 86.91 4,067 13.09
14. Catholicism 18,270 5,393 29.52 4,220 23.10 5,195 28.43 2,746 15.03 17,554 96.08 716 3.92
15. Christianity 2,790 679 24.34 576 20.65 749 26.85 548 19.64 2,552 91.47 238 8.53
16. Islam 22,117 4,824 21.81 3,342 15.11 5,659 25.59 5,322 24.06 19,147 86.57 2,970 13.43
21. Sinhala Language & Literature 242,052 25,923 10.71 30,248 12.50 74,503 30.78 63,864 26.38 194,538 80.37 47,514 19.63
22. Tamil Language & Literature 57,067 8,070 14.14 8,861 15.53 16,973 29.74 14,237 24.95 48,141 84.36 8,926 15.64
31. English 326,164 24,441 7.49 11,602 3.56 23,812 7.30 56,521 17.33 116,376 35.68 209,788 64.32
32. Mathematics 324,804 22,914 7.05 16,375 5.04 34,894 10.74 63,619 19.59 137,802 42.43 187,002 57.57
34. Science & Technology 299,840 14,562 4.86 17,585 5.86 41,394 13.81 63,423 21.15 136,964 45.68 162,876 54.32
35. Construction Techniques 339 32 9.44 44 12.98 76 22.42 115 33.92 267 78.76 72 21.24
36. Electrical & Electronic Techniques 135 4 2.96 7 5.19 30 22.22 45 33.33 86 63.70 49 36.30
37. Mechanics & Mechanical Techniques 120 7 5.83 15 12.50 37 30.83 42 35.00 101 84.17 19 15.83
38. Home Gardening Techniques 423 82 19.39 84 19.86 137 32.39 82 19.39 385 91.02 38 8.98
39. Creative Arts 214 80 37.38 48 22.43 51 23.83 28 13.08 207 96.73 7 3.27
40. Food Proc. & Dress Desing. Tech. 417 20 4.80 62 14.87 167 40.05 128 30.70 377 90.41 40 9.59
43. Social Studies & History 297,517 30,937 10.40 33,230 11.17 73,780 24.80 88,888 29.88 226,835 76.24 70,682 23.76
46. English Literature 16,474 1,198 7.27 2,013 12.22 4,017 24.38 4,398 26.70 11,626 70.57 4,848 29.43
47. Sinhala Literature 70,213 7,368 10.49 7,200 10.25 13,926 19.83 15,537 22.13 44,031 62.71 26,182 37.29
48. Tamil Literature 35,288 3,343 9.47 3,237 9.17 5,983 16.95 7,219 20.46 19,782 56.06 15,506 43.94
49. Arabic Literature 176 64 36.36 32 18.18 23 13.07 32 18.18 151 85.80 25 14.20
51. Art 126,654 3,027 2.39 4,540 3.58 16,126 12.73 44,961 35.50 68,654 54.21 58,000 45.79
52. Dancing (Sinhala) 58,900 8,785 14.92 8,120 13.79 14,452 24.54 17,345 29.45 48,702 82.69 10,198 17.31
53. Dancing (Bharatha) 2,814 508 18.05 298 10.59 489 17.38 861 30.60 2,156 76.62 658 23.38
54. Music (Sinhala) 57,603 4,682 8.13 4,044 7.02 9,776 16.97 16,943 29.41 35,445 61.53 22,158 38.47
55. Music (Carnatic) 13,246 1,849 13.96 1,077 8.13 2,262 17.08 3,335 25.18 8,523 64.34 4,723 35.66
56. Music (Western) 2,100 954 45.43 426 20.29 297 14.14 201 9.57 1,878 89.43 222 10.57
57. Drama and Theatre 13,435 3,506 26.10 3,006 22.37 3,746 27.88 2,484 18.49 12,742 94.84 693 5.16
G.C.E. (O.L.) Examination - 2006
Results by Grades in Each Subject - School Candidates
Subject No. Sat. A % B % C % S % A+B+C+S % W %
61. Pali 200 20 10.00 27 13.50 65 32.50 49 24.50 161 80.50 39 19.50
62. Sanskrit 81 4 4.94 5 6.17 18 22.22 23 28.40 50 61.73 31 38.27
63. Arabic 779 195 25.03 49 6.29 83 10.65 171 21.95 498 63.93 281 36.07
64. Second Language (Sinhala) 14,008 250 1.78 636 4.54 2,105 15.03 3,698 26.40 6,689 47.75 7,319 52.25
65. Second Language (Tamil) 2,347 52 2.22 122 5.20 368 15.68 613 26.12 1,155 49.21 1,192 50.79
68. French 412 16 3.88 27 6.55 67 16.26 93 22.57 203 49.27 209 50.73
70. History 82,607 3,339 4.04 4,709 5.70 13,288 16.09 25,329 30.66 46,665 56.49 35,942 43.51
71. Geography 82,498 2,941 3.56 4,365 5.29 14,219 17.24 27,723 33.60 49,248 59.70 33,250 40.30
72. Development Studies 41,839 5,696 13.61 7,569 18.09 13,124 31.37 10,445 24.96 36,834 88.04 5,005 11.96
73. Health & Physical Education 204,765 34,880 17.03 39,187 19.14 68,139 33.28 45,617 22.28 187,823 91.73 16,942 8.27
75. Hindi 46 10 21.74 7 15.22 10 21.74 5 10.87 32 69.57 14 30.43
76. Japanese 500 123 24.60 42 8.40 51 10.20 67 13.40 283 56.60 217 43.40
77. German 31 9 29.03 3 9.68 1 3.23 1 3.23 14 45.16 17 54.84
78. Agriculture 112,934 9,220 8.16 10,848 9.61 29,769 26.36 35,045 31.03 84,882 75.16 28,052 24.84
79. Horticulture 7,306 1,462 20.01 967 13.24 1,830 25.05 1,855 25.39 6,114 83.68 1,192 16.32
80. Animal Husbandry 2 - - - - - - 2 100.00 2 100.00 - -
81. Business & Accounting Studies 86,821 18,223 20.99 10,582 12.19 18,561 21.38 22,097 25.45 69,463 80.01 17,358 19.99
88. Marine Bio-Resources Technology 751 79 10.52 179 23.83 238 31.69 175 23.30 671 89.35 80 10.65
89. Food Science & Technology 153 22 14.38 31 20.26 48 31.37 36 23.53 137 89.54 16 10.46
90. Construction Technology 7,062 731 10.35 922 13.06 2,219 31.42 1,981 28.05 5,853 82.88 1,209 17.12
92. Shorthand & Type Writing (Sinhala) 202 45 22.28 12 5.94 15 7.43 9 4.46 81 40.10 121 59.90
93. Shorthand & Type Writing (Tamil) 19 1 5.26 5 26.32 5 26.32 5 26.32 16 84.21 3 15.79
94. Shorthand & Type Writing (English) 2 - - - - - - - - - - 2 100.00
95. Mechanical Technology 5,614 535 9.53 529 9.42 1,309 23.32 1,660 29.57 4,033 71.84 1,581 28.16
96. Arts & Crafts 4,094 323 7.89 503 12.29 1,098 26.82 1,276 31.17 3,200 78.16 894 21.84
97. Electricity & Electronics Technology 5,914 708 11.97 513 8.67 1,074 18.16 1,767 29.88 4,062 68.68 1,852 31.32
98. Home Economics 63,890 1,163 1.82 3,804 5.95 14,293 22.37 28,472 44.56 47,732 74.71 16,158 25.29
Results by Grades in Each Subject - School Candidates
G.C.E. (O.L.) Examination - 2006

- 35 -
- 34 -
Subject No. Sat A % B % C % S % A+B+C+S % W %
11. Buddhism 230,039 62,369 27.11 32,684 14.21 52,296 22.73 46,792 20.34 194,141 84.39 35,898 15.61
12. Saivism 34,202 9,287 27.15 5,529 16.17 8,833 25.83 7,076 20.69 30,725 89.83 3,477 10.17
14. Christianity R.C. 19,553 4,467 22.85 4,028 20.60 5,733 29.32 4,115 21.05 18,343 93.81 1,210 6.19
15. Christianity N.R.C. 2,993 777 25.96 558 18.64 810 27.06 594 19.85 2,739 91.51 254 8.49
16. Islam 24,973 4,511 18.06 3,977 15.93 7,070 28.31 6,401 25.63 21,959 87.93 3,014 12.07
21. Sinhala Language & Literature 252,532 29,563 11.71 40,345 15.98 74,942 29.68 62,719 24.84 207,569 82.20 44,963 17.80
22. Tamil Language & Literature 63,142 7,121 11.28 8,183 12.96 17,795 28.18 18,152 28.75 51,251 81.17 11,891 18.83
31. English 350,514 37,866 10.80 17,508 4.99 32,953 9.40 51,001 14.55 139,328 39.75 211,186 60.25
32. Mathematics 348,672 28,944 8.30 18,411 5.28 43,834 12.57 84,307 24.18 175,496 50.33 173,176 49.67
34. Science & Technology 319,754 15,177 4.75 18,771 5.87 42,474 13.28 69,105 21.61 145,527 45.51 174,227 54.49
35. Construction Techniques 206 26 12.62 46 22.33 91 44.17 35 16.99 198 96.12 8 3.88
36. Electrical & Electronic Techniques 101 1 0.99 1 0.99 14 13.86 32 31.68 48 47.52 53 52.48
37. Mechanics & Mechanical Techniques 115 - - 1 0.87 11 9.57 50 43.48 62 53.91 53 46.09
38. Home Gardening Techniques 158 13 8.23 39 24.68 52 32.91 37 23.42 141 89.24 17 10.76
39. Creative Arts 69 43 62.32 17 24.64 5 7.25 4 5.80 69 100.00 - -
40. Food Proc. & Dress Desing. Tech. 125 - - 8 6.40 64 51.20 47 37.60 119 95.20 6 4.80
43. Social Studies & History 313,250 34,350 10.97 32,543 10.39 72,735 23.22 95,696 30.55 235,324 75.12 77,926 24.88
46. English Literature 17,088 1,810 10.59 2,429 14.21 3,948 23.10 4,207 24.62 12,394 72.53 4,694 27.47
47. Sinhala Literature 69,517 9,051 13.02 8,971 12.90 16,496 23.73 15,468 22.25 49,986 71.90 19,531 28.10
48. Tamil Literature 39,386 3,611 9.17 3,907 9.92 7,606 19.31 10,161 25.80 25,285 64.20 14,101 35.80
49. Arabic Literature 228 72 31.58 45 19.74 56 24.56 46 20.18 219 96.05 9 3.95
51. Art 132,264 3,638 2.75 5,940 4.49 22,056 16.68 55,534 41.99 87,168 65.90 45,096 34.10
52. Dancing (Sinhala) 62,175 7,634 12.28 7,510 12.08 13,747 22.11 19,860 31.94 48,751 78.41 13,424 21.59
53. Dancing (Bharatha) 2,859 1,073 37.53 418 14.62 420 14.69 670 23.43 2,581 90.28 278 9.72
54. Music (Sinhala) 56,841 4,413 7.76 4,071 7.16 8,926 15.70 16,767 29.50 34,177 60.13 22,664 39.87
55. Music (Carnatic) 13,798 2,434 17.64 1,590 11.52 2,576 18.67 3,692 26.76 10,292 74.59 3,506 25.41
56. Music (Western) 2,189 1,361 62.17 329 15.03 250 11.42 161 7.35 2,101 95.98 88 4.02
57. Drama & Theatre 18,253 3,391 18.58 3,573 19.57 5,620 30.79 4,329 23.72 16,913 92.66 1,340 7.34
G.C.E. (O.L.) Examination - 2007
Results by Grades in Each Subject - School Candidates
Subject No. Sat. A % B % C % S % A+B+C+S % W %
61. Pali 174 3 1.72 7 4.02 47 27.01 59 33.91 116 66.67 58 33.33
62. Sanskrit 81 3 3.70 2 2.47 18 22.22 32 39.51 55 67.90 26 32.10
63. Arabic 626 161 25.72 66 10.54 73 11.66 103 16.45 403 64.38 223 35.62
64. Second Language (Sinhala) 16,142 283 1.75 1,006 6.23 3,410 21.13 4,448 27.56 9,147 56.67 6,995 43.33
65. Second Language (Tamil) 2,740 188 6.86 321 11.72 550 20.07 632 23.07 1,691 61.72 1,049 38.28
68. French 434 89 20.51 40 9.22 55 12.67 64 14.75 248 57.14 186 42.86
70. History 82,606 6,979 8.45 6,717 8.13 16,471 19.94 25,077 30.36 55,244 66.88 27,362 33.12
71. Geography 81,965 3,136 3.83 5,575 6.80 17,257 21.05 28,553 34.84 54,521 66.52 27,444 33.48
72. Development Studies 47,283 5,046 10.67 6,501 13.75 13,674 28.92 14,137 29.90 39,358 83.24 7,925 16.76
73. Health & Physical Education 230,466 52,867 22.94 43,723 18.97 67,886 29.46 45,532 19.76 210,008 91.12 20,458 8.88
74. Communication & Media Studies 3,770 446 11.83 618 16.39 1,083 28.73 993 26.34 3,140 83.29 630 16.71
75. Hindi 136 14 10.29 10 7.35 17 12.50 22 16.18 63 46.32 73 53.68
76. Japanese 574 141 24.56 43 7.49 61 10.63 79 13.76 324 56.45 250 43.55
77. German 38 5 13.16 2 5.26 9 23.68 7 18.42 23 60.53 15 39.47
78. Agriculture 119,301 3,879 3.25 6,912 5.79 26,045 21.83 43,124 36.15 79,960 67.02 39,341 32.98
79. Horticulture 6,064 496 8.18 525 8.66 1,549 25.54 2,036 33.58 4,606 75.96 1,458 24.04
81. Business & Accounting Studies 77,933 11,314 14.52 8,655 11.11 16,567 21.26 22,187 28.47 58,723 75.35 19,210 24.65
88. Marine Bio-Resources Technology 810 23 2.84 98 12.10 353 43.58 227 28.02 701 86.54 109 13.46
89. Food Science & Technology 149 11 7.38 25 16.78 47 31.54 53 35.57 136 91.28 13 8.72
90. Construction Technology 6,753 441 6.53 633 9.37 1,974 29.23 2,249 33.30 5,297 78.44 1,456 21.56
92. Shorthand & Type Writing (Sinhala) 107 24 22.43 4 3.74 16 14.95 6 5.61 50 46.73 57 53.27
93. Shorthand & Type Writing (Tamil) 14 - - - - 1 7.14 - - 1 7.14 13 92.86
94. Shorthand & Type Writing (English) 1 1 100.00 - - - - - - 1 100.00 - -
95. Mechanical Technology 5,037 334 6.63 321 6.37 1,024 20.33 1,804 35.81 3,483 69.15 1,554 30.85
96. Arts & Crafts 4,078 522 12.80 781 19.15 1,392 34.13 993 24.35 3,688 90.44 390 9.56
97. Electricity & Electronics Technology 4,542 739 16.27 389 8.56 824 18.14 1,291 28.42 3,243 71.40 1,299 28.60
98. Home Economics 63,087 1,199 1.90 3,531 5.60 17,811 28.23 26,706 42.33 49,247 78.06 13,840 21.94
99.Information & Communition Technology 22,915 5,200 22.69 3,866 16.87 6,169 26.92 5,044 22.01 20,279 88.50 2,636 11.50
G.C.E. (O.L.) Examination - 2007
Results by Grades in Each Subject - School Candidates

- 37 -
- 36 -
Subject No. Sat A % B % C % S % A+B+C+S % W %
11. Buddhism 201,280 50,614 25.15 25,139 12.49 40,791 20.27 44,770 22.24 161,314 80.14 39,966 19.86
12. Saivism 27,643 8,998 32.55 3,273 11.84 5,729 20.72 6,512 23.56 24,512 88.67 3,131 11.33
14. Catholicism 16,822 5,083 30.22 3,479 20.68 4,546 27.02 2,893 17.20 16,001 95.12 821 4.88
15. Christianity 2,568 595 23.17 501 19.51 695 27.06 602 23.44 2,393 93.19 175 6.81
16. Islam 19,713 3,839 19.47 2,753 13.97 5,033 25.53 5,203 26.39 16,828 85.36 2,885 14.64
21. Sinhala Language & Literature 217,971 27,412 12.58 34,226 15.70 62,256 28.56 53,431 24.51 177,325 81.35 40,646 18.65
22. Tamil Language & Literature 50,381 7,341 14.57 7,716 15.32 13,801 27.39 12,200 24.22 41,058 81.50 9,323 18.50
31. English 267,321 23,722 8.87 10,881 4.07 22,935 8.58 39,168 14.65 96,706 36.18 170,615 63.82
32. Mathematics 267,730 31,645 11.82 15,884 5.93 31,492 11.76 38,872 14.52 117,893 44.03 149,837 55.97
34. Science & Technology 267,415 19,285 7.21 18,739 7.01 41,900 15.67 66,482 24.86 146,406 54.75 121,009 45.25
35. Construction Techniques 224 11 4.91 17 7.59 78 34.82 80 35.71 186 83.04 38 16.96
36. Electrical & Electronic Techniques 99 12 12.12 7 7.07 23 23.23 18 18.18 60 60.61 39 39.39
37. Mechanics & Mechanical Techniques 81 9 11.11 8 9.88 41 50.62 16 19.75 74 91.36 7 8.64
38. Home Gardening Techniques 256 57 22.27 52 20.31 100 39.06 36 14.06 245 95.70 11 4.30
39. Creative Arts 108 61 56.48 25 23.15 16 14.81 2 1.85 104 96.30 4 3.70
40. Food Proc. & Dress Desing. Tech. 215 17 7.91 43 20.00 84 39.07 58 26.98 202 93.95 13 6.05
43. Social Studies & History 267,827 21,089 7.87 30,946 11.55 68,705 25.65 81,656 30.49 202,396 75.57 65,431 24.43
46. English Literature 16,178 1,587 9.81 2,084 12.88 3,920 24.23 3,840 23.74 11,431 70.66 4,747 29.34
47. Sinhala Literature 67,842 3,296 4.86 5,123 7.55 12,700 18.72 18,616 27.44 39,735 58.57 28,107 41.43
48. Tamil Literature 30,439 2,775 9.12 2,835 9.31 5,872 19.29 7,313 24.03 18,795 61.75 11,644 38.25
49. Arabic Literature 98 25 25.51 15 15.31 18 18.37 26 26.53 84 85.71 14 14.29
51. Art 115,874 3,501 3.02 4,919 4.25 16,079 13.88 40,692 35.12 65,191 56.26 50,683 43.74
52. Dancing (Sinhala) 53,868 8,833 16.40 8,572 15.91 14,720 27.33 14,696 27.28 46,821 86.92 7,047 13.08
53. Dancing (Bharatha) 2,609 473 18.13 313 12.00 554 21.23 716 27.44 2,056 78.80 553 21.20
54. Music (Sinhala) 54,376 2,676 4.92 3,292 6.05 9,808 18.04 17,826 32.78 33,602 61.80 20,774 38.20
55. Music (Carnatic) 12,775 1,319 10.32 1,038 8.13 2,011 15.74 3,491 27.33 7,859 61.52 4,916 38.48
56. Music (Western) 2,214 1,012 45.71 424 19.15 402 18.16 243 10.98 2,081 93.99 133 6.01
57. Drama and Theatre 9,037 1,914 21.18 1,698 18.79 2,322 25.69 2,148 23.77 8,082 89.43 955 10.57
G.C.E. (O.L.) Examination - 2005
Results by Grades in Each Subject - School Candidates (Freshers)
Subject No. Sat. A % B % C % S % A+B+C+S % W %
61. Pali 159 18 11.32 14 8.81 52 32.70 47 29.56 131 82.39 28 17.61
62. Sanskrit 70 4 5.71 5 7.14 8 11.43 25 35.71 42 60.00 28 40.00
63. Arabic 833 160 19.21 47 5.64 104 12.48 202 24.25 513 61.58 320 38.42
64. Second Language (Sinhala) 12,312 222 1.80 628 5.10 1,984 16.11 3,348 27.19 6,182 50.21 6,130 49.79
65. Second Language (Tamil) 2,485 49 1.97 126 5.07 422 16.98 606 24.39 1,203 48.41 1,282 51.59
68. French 340 22 6.47 20 5.88 54 15.88 58 17.06 154 45.29 186 54.71
69. Malay 1 - - 1 100.00 - - - - 1 100.00 - -
70. History 75,842 4,591 6.05 5,871 7.74 14,984 19.76 22,025 29.04 47,471 62.59 28,371 37.41
71. Geography 79,099 3,601 4.55 6,516 8.24 17,420 22.02 24,087 30.45 51,624 65.27 27,475 34.73
72. Development Studies 35,684 5,234 14.67 6,516 18.26 10,560 29.59 8,417 23.59 30,727 86.11 4,957 13.89
73. Health & Physical Education 172,658 33,670 19.50 31,890 18.47 53,712 31.11 38,090 22.06 157,362 91.14 15,296 8.86
75. Hindi 14 2 14.29 3 21.43 4 28.57 3 21.43 12 85.71 2 14.29
76. Japanese 340 26 7.65 22 6.47 44 12.94 35 10.29 127 37.35 213 62.65
77. German 3 2 66.67 - - - - - - 2 66.67 1 33.33
78. Agriculture 96,274 7,154 7.43 8,592 8.92 23,839 24.76 31,354 32.57 70,939 73.68 25,335 26.32
79. Horticulture 7,016 798 11.37 668 9.52 1,806 25.74 2,081 29.66 5,353 76.30 1,663 23.70
81. Business & Accounting Studies 81,403 9,514 11.69 11,906 14.63 19,953 24.51 20,775 25.52 62,148 76.35 19,255 23.65
88. Marine Bio-Resources Technology 791 77 9.73 156 19.72 330 41.72 145 18.33 708 89.51 83 10.49
89. Food Science & Technology 199 37 18.59 33 16.58 61 30.65 47 23.62 178 89.45 21 10.55
90. Construction Technology 6,362 304 4.78 575 9.04 1,516 23.83 1,935 30.41 4,330 68.06 2,032 31.94
92. Shorthand & Type Writing (Sinhala) 216 34 15.74 6 2.78 16 7.41 15 6.94 71 32.87 145 67.13
93. Shorthand & Type Writing (Tamil) 31 1 3.23 - - 6 19.35 2 6.45 9 29.03 22 70.97
95. Mechanical Technology 4,903 769 15.68 577 11.77 1,180 24.07 1,213 24.74 3,739 76.26 1,164 23.74
96. Arts & Crafts 3,962 434 10.95 525 13.25 1,155 29.15 1,180 29.78 3,294 83.14 668 16.86
97. Electricity & Electronics Technology 6,036 849 14.07 532 8.81 1,091 18.07 1,628 26.97 4,100 67.93 1,936 32.07
98. Home Economics 59,070 762 1.29 2,608 4.42 14,089 23.85 22,767 38.54 40,226 68.10 18,844 31.90
G.C.E. (O.L.) Examination - 2005
Results by Grades in Each Subject - School Candidates (Freshers)

- 39 -
- 38 -
Subject No. Sat A % B % C % S % A+B+C+S % W %
11. Buddhism 193,585 58,884 30.42 25,929 13.39 38,562 19.92 35,839 18.51 159,214 82.25 34,371 17.75
12. Saivism 26,685 6,743 25.27 3,577 13.40 6,200 23.23 6,437 24.12 22,957 86.03 3,728 13.97
14. Catholicism 16,561 5,148 31.09 3,789 22.88 4,495 27.14 2,458 14.84 15,890 95.95 671 4.05
15. Christianity 2,465 642 26.04 512 20.77 637 25.84 460 18.66 2,251 91.32 214 8.68
16. Islam 20,239 4,662 23.03 3,080 15.22 4,995 24.68 4,707 23.26 17,444 86.19 2,795 13.81
21. Sinhala Language & Literature 210,198 25,701 12.23 28,856 13.73 62,133 29.56 49,772 23.68 166,462 79.19 43,736 20.81
22. Tamil Language & Literature 49,748 7,842 15.76 7,977 16.03 13,778 27.70 11,894 23.91 41,491 83.40 8,257 16.60
31. English 258,975 23,678 9.14 10,336 3.99 19,665 7.59 41,677 16.09 95,356 36.82 163,619 63.18
32. Mathematics 259,265 22,732 8.77 15,961 6.16 30,085 11.60 41,741 16.10 110,519 42.63 148,746 57.37
34. Science & Technology 258,948 14,481 5.59 17,492 6.76 39,734 15.34 53,505 20.66 125,212 48.35 133,736 51.65
35. Construction Techniques 308 30 9.74 42 13.64 63 20.45 104 33.77 239 77.60 69 22.40
36. Electrical & Electronic Techniques 122 3 2.46 7 5.74 28 22.95 42 34.43 80 65.57 42 34.43
37. Mechanics & Mechanical Techniques 106 7 6.60 12 11.32 33 31.13 39 36.79 91 85.85 15 14.15
38. Home Gardening Techniques 391 76 19.44 77 19.69 120 30.69 81 20.72 354 90.54 37 9.46
39. Creative Arts 201 77 38.31 44 21.89 46 22.89 27 13.43 194 96.52 7 3.48
40. Food Proc. & Dress Desing. Tech. 383 19 4.96 61 15.93 150 39.16 113 29.50 343 89.56 40 10.44
43. Social Studies & History 259,096 30,758 11.87 31,968 12.34 62,821 24.25 70,008 27.02 195,555 75.48 63,541 24.52
46. English Literature 16,082 1,192 7.41 2,002 12.45 3,956 24.60 4,301 26.74 11,451 71.20 4,631 28.80
47. Sinhala Literature 62,064 7,238 11.66 6,826 11.00 12,185 19.63 12,723 20.50 38,972 62.79 23,092 37.21
48. Tamil Literature 31,140 3,290 10.57 3,120 10.02 5,397 17.33 5,991 19.24 17,798 57.15 13,342 42.85
49. Arabic Literature 132 36 27.27 21 15.91 21 15.91 29 21.97 107 81.06 25 18.94
51. Art 109,763 2,937 2.68 4,350 3.96 14,783 13.47 37,699 34.35 59,769 54.45 49,994 45.55
52. Dancing (Sinhala) 52,091 8,594 16.50 7,681 14.75 12,837 24.64 14,158 27.18 43,270 83.07 8,821 16.93
53. Dancing (Bharatha) 2,452 494 20.15 277 11.30 437 17.82 722 29.45 1,930 78.71 522 21.29
54. Music (Sinhala) 50,158 4,635 9.24 3,948 7.87 9,096 18.13 14,201 28.31 31,880 63.56 18,278 36.44
55. Music (Carnatic) 11,258 1,819 16.16 1,022 9.08 1,929 17.13 2,717 24.13 7,487 66.50 3,771 33.50
56. Music (Western) 2,064 950 46.03 427 20.69 296 14.34 197 9.54 1,870 90.60 194 9.40
57. Drama and Theatre 12,193 3,453 28.32 2,826 23.18 3,238 26.56 2,042 16.75 11,559 94.80 634 5.20
G.C.E. (O.L.) Examination - 2006
Results by Grades in Each Subject - School Candidates (Freshers)
Subject No. Sat. A % B % C % S % A+B+C+S % W %
61. Pali 146 12 8.22 21 14.38 46 31.51 38 26.03 117 80.14 29 19.86
62. Sanskrit 55 4 7.27 - - 12 21.82 16 29.09 32 58.18 23 41.82
63. Arabic 754 188 24.93 48 6.37 79 10.48 164 21.75 479 63.53 275 36.47
64. Second Language (Sinhala) 12,274 230 1.87 574 4.68 1,900 15.48 3,151 25.67 5,855 47.70 6,419 52.30
65. Second Language (Tamil) 2,152 49 2.28 114 5.30 324 15.06 567 26.35 1,054 48.98 1,098 51.02
68. French 296 12 4.05 22 7.43 42 14.19 63 21.28 139 46.96 157 53.04
70. History 72,905 3,323 4.56 4,636 6.36 12,332 16.92 20,991 28.79 41,282 56.62 31,623 43.38
71. Geography 73,383 2,927 3.99 4,325 5.89 13,581 18.51 23,668 32.25 44,501 60.64 28,882 39.36
72. Development Studies 38,484 5,658 14.70 7,330 19.05 11,760 30.56 9,040 23.49 33,788 87.80 4,696 12.20
73. Health & Physical Education 182,403 34,292 18.80 35,896 19.68 56,794 31.14 39,242 21.51 166,224 91.13 16,179 8.87
75. Hindi 44 10 22.73 7 15.91 9 20.45 4 9.09 30 68.18 14 31.82
76. Japanese 381 53 13.91 26 6.82 34 8.92 60 15.75 173 45.41 208 54.59
77. German 27 6 22.22 2 7.41 1 3.70 1 3.70 10 37.04 17 62.96
78. Agriculture 96,671 8,942 9.25 9,867 10.21 24,393 25.23 27,843 28.80 71,045 73.49 25,626 26.51
79. Horticulture 6,479 1,449 22.36 928 14.32 1,567 24.19 1,459 22.52 5,403 83.39 1,076 16.61
81. Business & Accounting Studies 78,882 17,782 22.54 10,133 12.85 17,346 21.99 18,980 24.06 64,241 81.44 14,641 18.56
88. Marine Bio-Resources Technology 620 66 10.65 143 23.06 200 32.26 138 22.26 547 88.23 73 11.77
89. Food Science & Technology 130 20 15.38 28 21.54 37 28.46 30 23.08 115 88.46 15 11.54
90. Construction Technology 6,131 698 11.38 813 13.26 1,825 29.77 1,669 27.22 5,005 81.63 1,126 18.37
92. Shorthand & Type Writing (Sinhala) 192 45 23.44 12 6.25 15 7.81 9 4.69 81 42.19 111 57.81
93. Shorthand & Type Writing (Tamil) 16 1 6.25 5 31.25 3 18.75 5 31.25 14 87.50 2 12.50
95. Mechanical Technology 5,071 534 10.53 522 10.29 1,209 23.84 1,414 27.88 3,679 72.55 1,392 27.45
96. Arts & Crafts 3,564 319 8.95 476 13.36 948 26.60 1,036 29.07 2,779 77.97 785 22.03
97. Electricity & Electronics Technology 5,410 707 13.07 510 9.43 1,041 19.24 1,580 29.21 3,838 70.94 1,572 29.06
98. Home Economics 54,173 1,142 2.11 3,614 6.67 12,255 22.62 22,772 42.04 39,783 73.44 14,390 26.56
Results by Grades in Each Subject - School Candidates (Freshers)
G.C.E. (O.L.) Examination - 2006

- 41 -
- 40 -
Subject No. Sat A % B % C % S % A+B+C+S % W %
11. Buddhism 203,594 60,101 29.52 28,595 14.05 42,544 20.90 38,772 19.04 170,012 83.51 33,582 16.49
12. Saivism 29,233 8,505 29.09 4,450 15.22 7,023 24.02 6,002 20.53 25,980 88.87 3,253 11.13
14. Catholicism 17,854 4,218 23.62 3,659 20.49 5,090 28.51 3,732 20.90 16,699 93.53 1,155 6.47
15. Christianity 2,643 731 27.66 482 18.24 702 26.56 500 18.92 2,415 91.37 228 8.63
16. Islam 23,043 4,338 18.83 3,694 16.03 6,342 27.52 5,805 25.19 20,179 87.57 2,864 12.43
21. Sinhala Language & Literature 221,519 29,204 13.18 38,042 17.17 62,259 28.11 50,170 22.65 179,675 81.11 41,844 18.89
22. Tamil Language & Literature 55,211 6,915 12.52 7,471 13.53 14,830 26.86 15,040 27.24 44,256 80.16 10,955 19.84
31. English 275,995 35,533 12.87 14,233 5.16 24,486 8.87 35,975 13.03 110,227 39.94 165,768 60.06
32. Mathematics 276,126 28,570 10.35 17,386 6.30 35,313 12.79 52,784 19.12 134,053 48.55 142,073 51.45
34. Science & Technology 276,056 14,951 5.42 18,649 6.76 40,699 14.74 58,265 21.11 132,564 48.02 143,492 51.98
35. Construction Techniques 166 23 13.86 35 21.08 75 45.18 25 15.06 158 95.18 8 4.82
36. Electrical & Electronic Techniques 70 1 1.43 1 1.43 12 17.14 22 31.43 36 51.43 34 48.57
37. Mechanics & Mechanical Techniques 84 - - 1 1.19 10 11.90 33 39.29 44 52.38 40 47.62
38. Home Gardening Techniques 107 9 8.41 22 20.56 30 28.04 29 27.10 90 84.11 17 15.89
39. Creative Arts 41 27 65.85 10 24.39 1 2.44 3 7.32 41 100.00 - -
40. Food Proc. & Dress Desing. Tech. 72 - - 6 8.33 34 47.22 26 36.11 66 91.67 6 8.33
43. Social Studies & History 276,000 34,089 12.35 31,406 11.38 63,526 23.02 76,772 27.82 205,793 74.56 70,207 25.44
46. English Literature 16,630 1,795 10.79 2,406 14.47 3,899 23.45 4,078 24.52 12,178 73.23 4,452 26.77
47. Sinhala Literature 62,415 8,816 14.12 8,339 13.36 14,408 23.08 12,944 20.74 44,507 71.31 17,908 28.69
48. Tamil Literature 34,617 3,492 10.09 3,654 10.56 6,691 19.33 8,474 24.48 22,311 64.45 12,306 35.55
49. Arabic Literature 157 25 15.92 28 17.83 51 32.48 44 28.03 148 94.27 9 5.73
51. Art 116,255 3,517 3.03 5,613 4.83 20,016 17.22 47,233 40.63 76,379 65.70 39,876 34.30
52. Dancing (Sinhala) 55,372 7,482 13.51 7,129 12.87 12,504 22.58 16,652 30.07 43,767 79.04 11,605 20.96
53. Dancing (Bharatha) 2,493 1,034 41.48 368 14.76 353 14.16 525 21.06 2,280 91.46 213 8.54
54. Music (Sinhala) 50,067 4,371 8.73 4,011 8.01 8,441 16.86 14,440 28.84 31,263 62.44 18,804 37.56
55. Music (Carnatic) 11,771 2,319 19.70 1,423 12.09 2,184 18.55 3,032 25.76 8,958 76.10 2,813 23.90
56. Music (Western) 2,163 1,358 62.78 323 14.93 246 11.37 155 7.17 2,082 96.26 81 3.74
57. Drama and Theatre 16,626 3,335 20.06 3,376 20.31 5,046 30.35 3,664 22.04 15,421 92.75 1,205 7.25
Results by Grades in Each Subject - School Candidates (Freshers)
G.C.E. (O.L.) Examination - 2007
Subject No. Sat. A % B % C % S % A+B+C+S % W %
61. Pali 119 3 2.52 6 5.04 28 23.53 44 36.97 81 68.07 38 31.93
62. Sanskrit 50 2 4.00 1 2.00 8 16.00 22 44.00 33 66.00 17 34.00
63. Arabic 594 152 25.59 63 10.61 68 11.45 96 16.16 379 63.80 215 36.20
64. Second Language (Sinhala) 14,181 271 1.91 919 6.48 3,030 21.37 3,726 26.27 7,946 56.03 6,235 43.97
65. Second Language (Tamil) 2,474 176 7.11 301 12.17 475 19.20 544 21.99 1,496 60.47 978 39.53
68. French 297 40 13.47 21 7.07 35 11.78 43 14.48 139 46.80 158 53.20
70. History 73,495 6,915 9.41 6,458 8.79 14,716 20.02 20,765 28.25 48,854 66.47 24,641 33.53
71. Geography 73,054 3,098 4.24 5,458 7.47 15,894 21.76 24,108 33.00 48,558 66.47 24,496 33.53
72. Development Studies 43,694 5,005 11.45 6,358 14.55 12,667 28.99 12,338 28.24 36,368 83.23 7,326 16.77
73. Health & Physical Education 206,831 51,344 24.82 39,224 18.96 57,092 27.60 39,722 19.21 187,382 90.60 19,449 9.40
74. Communication & Mass Media 3,764 446 11.85 616 16.37 1,082 28.75 989 26.28 3,133 83.24 631 16.76
75. Hindi 131 13 9.92 8 6.11 15 11.45 22 16.79 58 44.27 73 55.73
76. Japanese 392 32 8.16 22 5.61 39 9.95 64 16.33 157 40.05 235 59.95
77. German 37 5 13.51 2 5.41 8 21.62 7 18.92 22 59.46 15 40.54
78. Agriculture 103,276 3,808 3.69 6,577 6.37 22,545 21.83 34,997 33.89 67,927 65.77 35,349 34.23
79. Horticulture 5,337 496 9.29 512 9.59 1,368 25.63 1,676 31.40 4,052 75.92 1,285 24.08
81. Business & Accounting Studies 70,306 10,976 15.61 8,296 11.80 15,555 22.12 19,335 27.50 54,162 77.04 16,144 22.96
88. Marine Bio-Resources Technology 677 22 3.25 84 12.41 280 41.36 189 27.92 575 84.93 102 15.07
89. Food Science & Technology 118 10 8.47 22 18.64 38 32.20 40 33.90 110 93.22 8 6.78
90. Construction Technology 5,847 435 7.44 565 9.66 1,640 28.50 1,878 32.12 4,518 77.27 1,329 22.73
92. Shorthand & Type Writing (Sinhala) 101 24 23.76 4 3.96 16 15.84 4 3.96 48 47.52 53 52.48
93. Shorthand & Type Writing (Tamil) 11 - - - - - - - - - - 11 100.00
95. Mechanical Technology 4,375 331 7.57 312 7.13 931 21.28 1,467 33.53 3,041 69.51 1,334 30.49
96. Arts & Crafts 3,568 496 13.90 709 19.87 1,182 33.13 829 23.23 3,216 90.13 352 9.87
97. Electricity & Electronics Technology 4,125 732 17.75 384 9.31 791 19.18 1,105 26.79 3,012 73.02 1,113 26.98
98. Home Economics 54,328 1,166 2.15 3,314 6.10 15,286 28.14 22,100 40.68 41,866 77.06 12,462 22.94
99.Information & Communition Technology 22,811 5,182 22.72 3,848 16.87 6,134 26.89 5,016 21.99 20,180 88.47 2,631 11.53
Results by Grades in Each Subject - School Candidates (Freshers)
G.C.E. (O.L.) Examination - 2007

- 43 -
- 42 -
No. % No. % No. %
No. Applied 378,762 377,703 399,257
No. Sat 345,729 91.28 343,008 90.81 368,886 92.39
No. Sat ( 5 or More Subjects) 307,771 89.02 296,393 86.41 312,299 84.66
Qualified for G.C.E.(A.L) 146,862 47.72 144,415 48.72 153,460 49.14
Obtained 8 A's 4,071 1.32 4,347 1.47 4,835 1.55
Passed in 6 or More with 1st Lang. & Maths 123,389 40.09 114,725 38.71 137,453 44.01
Passed in 8 Subjects 74,501 24.21 70,958 23.94 83,195 26.64
Passed in 7 Subjects 41,871 13.60 37,225 12.56 40,388 12.93
Passed in 6 Subjects 38,251 12.43 33,544 11.32 34,500 11.05
Passed in 5 Subjects 38,360 12.46 40,737 13.74 39,265 12.57
Passed in 4 Subjects 32,359 10.51 33,271 11.23 32,232 10.32
Passed in 3 Subjects 25,782 8.38 24,969 8.42 26,803 8.58
Passed in 2 Subjects 25,401 8.25 24,971 8.42 30,602 9.80
Passed in 1 Subject 35,596 11.57 40,156 13.55 47,711 15.28
Failed in All Subjects(Appeared in more than 6) 22,235 7.22 22,719 7.67 21,836 6.99
* Percentages Calculated on Number Sat for 5 or more Subjects
G.C.E. (O.L.) Examination 2005 - 2007
Performance of School Candidates
2006 20072005Description
No. % No. % No. %
No. Applied 526,856 524,004 529,389
No. Sat 445,679 84.59 439,478 83.87 456,898 86.31
No. Sat ( 5 or More Subjects) 328,449 73.70 316,413 72.00 333,562 73.01
Qualified for G.C.E.(A.L) 153,090 46.61 150,105 47.44 159,438 47.80
Obtained 8 A's 4,072 1.24 4,354 1.38 4,836 1.45
Passed in 6 or More with 1st Lang. & Maths 127,912 38.94 118,450 37.44 142,360 42.68
Passed in 8 Subjects 75,273 22.92 71,525 22.60 83,999 25.18
Passed in 7 Subjects 44,130 13.44 38,961 12.31 42,580 12.77
Passed in 6 Subjects 41,780 12.72 36,533 11.55 37,810 11.34
Passed in 5 Subjects 42,440 12.92 44,773 14.15 43,243 12.96
Passed in 4 Subjects 36,389 11.08 37,597 11.88 36,444 10.93
Passed in 3 Subjects 30,194 9.19 29,320 9.27 31,602 9.47
Passed in 2 Subjects 34,469 10.49 34,117 10.78 41,089 12.32
Passed in 1 Subject 88,416 26.92 88,669 28.02 89,184 26.74
Failed in All Subjects (Appeared in more than 6) 22,900 6.97 23,398 7.39 22,535 6.76
* Percentages Calculated on Number Sat for 5 or more Subjects
G.C.E. (O.L.) Examination 2005 - 2007
Performance of All Candidates
2005 2006 2007Description

- 45 -
- 44 -
-44-
G.C.E. (O.L.) Examination 2005 - 2007
Qualified for G.C.E. (A.L.)
0
5
10
15
20
25
30
35
40
45
50
55
60
2005 2006 2007
Year
Per
cen
tage
School Candidates
All Candidates
No. % No. % No. %
No. Sat ( 5 or More Subjects) 307,771 296,393 312,299
Qualified for G.C.E.(A.L) 146,862 47.72 144,415 48.72 153,460 49.14
Qulified for A.L with SBA Credit Level Pass and above 6,906 2.24 6,990 2.36 6,716 2.15
Total No. Qualified 153,768 49.96 151,405 51.08 160,176 51.29
G.C.E. (O.L.) Examination 2005 - 2007
Performance of School Candadates
Description20072005 2006
G.C.E. (O.L.) Examination 2005 - 2007
Qualified for G.C.E. (A.L.)
0
5
10
15
20
25
30
35
40
45
50
55
60
2005 2006 2007
Year
Per
cen
tage
Qulified for A.L
Qulified for A.L with SBA
Credit Level Pass and above

- 47 -
- 46 -
No. Sat No. Sat No. Sat
(5 or More (5 or More (5 or More
Subjects) No. % Subjects) No. % Subjects) No. %
1 Colombo 31,771 19,220 60.50 31,564 19,676 62.34 33,664 21,049 62.53
2 Gampaha 26,946 13,487 50.05 26,017 13,542 52.05 28,474 14,811 52.02
3 Kalutara 15,814 8,032 50.79 14,940 7,684 51.43 15,931 8,034 50.43
4 Kandy 24,182 12,218 50.53 22,815 11,047 48.42 24,580 12,013 48.87
5 Matale 8,313 3,333 40.09 7,886 3,206 40.65 7,946 3,302 41.55
6 Nuwara Eliya 12,563 4,239 33.74 11,958 3,958 33.10 13,133 4,406 33.55
7 Galle 18,072 8,938 49.46 17,694 9,065 51.23 18,382 9,336 50.79
8 Matara 14,794 6,986 47.22 14,269 6,991 48.99 14,371 7,153 49.77
9 Hambantota 11,076 4,808 43.41 10,945 4,977 45.47 10,842 4,868 44.89
10 Jaffna 13,154 5,877 44.68 11,510 5,457 47.41 12,140 5,678 46.77
11 Kilinochchi 2,471 714 28.90 2,145 725 33.80 2,382 964 40.49
12 Mannar 1,661 711 42.81 1,472 661 44.90 1,558 827 53.11
13 Vavuniya 2,577 1,361 52.81 2,594 1,399 53.93 2,757 1,541 55.91
14 Mullaitivu 2,070 657 31.74 1,697 593 34.94 2,015 834 41.41
15 Batticaloa 7,016 2,928 41.73 7,006 3,072 43.85 8,028 3,308 41.21
16 Ampara 11,157 4,776 42.81 11,286 4,865 43.11 12,504 5,153 41.21
17 Trincomalee 6,912 2,569 37.17 6,389 2,396 37.50 7,243 2,604 35.96
18 Kurunegala 27,444 13,608 49.58 26,213 13,538 51.65 26,199 14,108 53.85
19 Chilaw 10,200 4,440 43.53 10,033 4,552 45.37 10,616 4,838 45.58
20 Anuradhapura 15,475 6,437 41.60 14,169 5,537 39.08 15,210 6,222 40.91
21 Polonnaruwa 6,445 2,572 39.91 6,259 2,462 39.34 6,626 2,661 40.17
22 Badulla 15,116 6,163 40.77 15,259 6,239 40.89 16,047 6,801 42.38
23 Monaragala 9,007 3,394 37.68 8,806 3,046 34.59 9,049 3,159 34.91
24 Ratnapura 20,041 8,640 43.11 20,095 8,648 43.04 19,915 8,730 43.84
25 Kegalle 14,172 6,982 49.27 13,392 6,769 50.55 13,950 7,038 50.46
Total 328,449 153,090 46.61 316,413 150,105 47.44 333,562 159,438 47.80
2005 2006
G.C.E. (O.L.) Examination 2005 - 2007
Performance of All Candidates by District
2007
Qualified for
G.C.E.(A.L.) G.C.E.(A.L.)
Qualified forDistrict Qualified for
G.C.E.(A.L.)
No. Sat No. Sat No. Sat
(5 or More (5 or More (5 or More
Subjects) No. % Subjects) No. % Subjects) No. %
1 Colombo 30,593 18,839 61.58 30,388 19,256 63.37 32,399 20,624 63.66
2 Gampaha 26,050 13,216 50.73 25,122 13,278 52.85 27,487 14,513 52.80
3 Kalutara 15,379 7,905 51.40 14,564 7,558 51.90 15,553 7,934 51.01
4 Kandy 23,116 11,861 51.31 21,775 10,712 49.19 23,586 11,694 49.58
5 Matale 7,919 3,228 40.76 7,509 3,084 41.07 7,597 3,195 42.06
6 Nuwara Eliya 10,973 3,899 35.53 10,443 3,653 34.98 11,643 4,079 35.03
7 Galle 17,538 8,778 50.05 17,084 8,895 52.07 17,901 9,187 51.32
8 Matara 14,295 6,847 47.90 13,739 6,834 49.74 13,850 6,959 50.25
9 Hambantota 10,704 4,700 43.91 10,518 4,841 46.03 10,387 4,725 45.49
10 Jaffna 11,286 5,365 47.54 9,999 5,081 50.82 10,459 5,243 50.13
11 Kilinochchi 2,122 614 28.93 1,939 673 34.71 2,245 915 40.76
12 Mannar 1,411 661 46.85 1,327 624 47.02 1,385 785 56.68
13 Vavuniya 2,218 1,272 57.35 2,299 1,339 58.24 2,446 1,455 59.48
14 Mullaitivu 1,732 579 33.43 1,503 546 36.33 1,920 804 41.88
15 Batticaloa 5,727 2,609 45.56 5,855 2,786 47.58 6,491 2,963 45.65
16 Ampara 8,758 4,036 46.08 8,788 4,231 48.15 9,342 4,378 46.86
17 Trincomalee 5,405 2,147 39.72 4,803 2,013 41.91 5,319 2,161 40.63
18 Kurunegala 26,614 13,340 50.12 25,267 13,212 52.29 25,285 13,821 54.66
19 Chilaw 9,755 4,287 43.95 9,596 4,438 46.25 10,105 4,704 46.55
20 Anuradhapura 14,651 6,168 42.10 13,388 5,317 39.71 14,438 6,002 41.57
21 Polonnaruwa 6,220 2,514 40.42 6,028 2,403 39.86 6,384 2,596 40.66
22 Badulla 14,157 5,878 41.52 14,254 6,018 42.22 15,149 6,547 43.22
23 Monaragala 8,542 3,226 37.77 8,429 2,957 35.08 8,623 3,045 35.31
24 Ratnapura 19,311 8,410 43.55 19,333 8,378 43.34 19,195 8,513 44.35
25 Kegalle 13,295 6,483 48.76 12,443 6,288 50.53 13,110 6,618 50.48
Total 307,771 146,862 47.72 296,393 144,415 48.72 312,299 153,460 49.14
G.C.E.(A.L.)
Qualified for
G.C.E. (O.L.) Examination 2005 - 2007
Performance of School Candidates by District
District
2005 2006 2007
Qualified for Qualified for
G.C.E.(A.L.) G.C.E.(A.L.)

- 49 -
- 48 -
0
10
20
30
40
50
60
70
Col
ombo
Gam
paha
Kal
utara
Kan
dy
Mat
ale
Nuw
ara
Eliy
a
Gal
le
Mat
ara
Ham
banto
ta
Jaffna
Kili
nochch
i
Man
nar
Vavuniy
a
Mulla
itivu
Bat
tical
oa
Am
para
Trinco
mal
ee
Kuru
negal
a
Puttal
um
Anura
dhapura
Polon
naruw
a
Bad
ulla
Mon
arag
ala
Rat
napura
Keg
alle
Total
District
Per
cen
tag
e
G.C.E.(O.L.) Examination 2005
Percentage of School Candidates Qualified for G.C.E.(A.L.) by District
-49-
0
10
20
30
40
50
60
70
Col
ombo
Gam
paha
Kal
utara
Kan
dy
Mat
ale
Nuw
ara
Eliy
a
Gal
le
Mat
ara
Ham
banto
ta
Jaffna
Kili
nochch
i
Man
nar
Vavuniy
a
Mulla
itivu
Bat
tical
oa
Am
para
Trinco
mal
ee
Kuru
negal
a
Puttal
um
Anura
dhapura
Polon
naruw
a
Bad
ulla
Mon
arag
ala
Rat
napura
Keg
alle
Total
District
Percentage
G.C.E.(O.L.) Examination 2006
Percentage of School Candidates Qualified for G.C.E.(A.L.) by District

- 51 -
- 50 -
0
10
20
30
40
50
60
70
Col
ombo
Gam
paha
Kal
utara
Kan
dy
Mat
ale
Nuw
ara
Eliy
a
Gal
le
Mat
ara
Ham
banto
ta
Jaffna
Kili
nochch
i
Man
nar
Vavuniy
a
Mulla
itivu
Bat
tical
oa
Am
para
Trinco
mal
ee
Kuru
negal
a
Puttal
um
Anura
dhapura
Polon
naruw
a
Bad
ulla
Mon
arag
ala
Rat
napura
Keg
alle
Total
District
Per
cen
tag
e
G.C.E.(O.L.) Examination 2007
Percentage of School Candidates Qualified for G.C.E.(A.L.) by District
No % No % No % No % No %
1 Colombo 30,593 18,839 61.58 1,367 4.47 17,008 55.59 2,799 9.15 1,629 5.32
2 Gampaha 26,050 13,216 50.73 375 1.44 11,617 44.60 2,975 11.42 1,691 6.49
3 Kalutara 15,379 7,905 51.40 178 1.16 6,687 43.48 1,857 12.07 1,083 7.04
4 Kandy 23,116 11,861 51.31 413 1.79 9,622 41.62 2,796 12.10 1,540 6.66
5 Matale 7,919 3,228 40.76 70 0.88 2,577 32.54 930 11.74 866 10.94
6 Nuwara Eliya 10,973 3,899 35.53 28 0.26 3,112 28.36 1,411 12.86 1,000 9.11
7 Galle 17,538 8,778 50.05 321 1.83 7,620 43.45 2,067 11.79 1,365 7.78
8 Matara 14,295 6,847 47.90 199 1.39 5,895 41.24 1,802 12.61 1,238 8.66
9 Hambantota 10,704 4,700 43.91 70 0.65 3,726 34.81 1,414 13.21 912 8.52
10 Jaffna 11,286 5,365 47.54 81 0.72 4,825 42.75 1,311 11.62 510 4.52
11 Kilinochchi 2,122 614 28.93 3 0.14 510 24.03 244 11.50 128 6.03
12 Mannar 1,411 661 46.85 2 0.14 574 40.68 214 15.17 13 0.92
13 Vavuniya 2,218 1,272 57.35 23 1.04 1,037 46.75 317 14.29 42 1.89
14 Mullaitivu 1,732 579 33.43 5 0.29 463 26.73 210 12.12 133 7.68
15 Batticaloa 5,727 2,609 45.56 57 1.00 2,270 39.64 746 13.03 227 3.96
16 Ampara 8,758 4,036 46.08 43 0.49 3,541 40.43 1,281 14.63 454 5.18
17 Trincomalee 5,405 2,147 39.72 26 0.48 1,744 32.27 680 12.58 358 6.62
18 Kurunegala 26,614 13,340 50.12 292 1.10 10,773 40.48 3,573 13.43 1,614 6.06
19 Chilaw 9,755 4,287 43.95 85 0.87 3,444 35.30 1,189 12.19 551 5.65
20 Anuradhapura 14,651 6,168 42.10 58 0.40 4,882 33.32 2,002 13.66 1,328 9.06
21 Polonnaruwa 6,220 2,514 40.42 33 0.53 1,956 31.45 936 15.05 697 11.21
22 Badulla 14,157 5,878 41.52 88 0.62 4,914 34.71 1,899 13.41 1,017 7.18
23 Monaragala 8,542 3,226 37.77 25 0.29 2,520 29.50 1,147 13.43 1,066 12.48
24 Ratnapura 19,311 8,410 43.55 110 0.57 6,967 36.08 2,589 13.41 1,787 9.25
25 Kegalle 13,295 6,483 48.76 119 0.90 5,105 38.40 1,862 14.01 986 7.42
Island 307,771 146,862 47.72 4,071 1.32 123,389 40.09 38,251 12.43 22,235 7.22
* Percentages Calculated on Number Sat for 5 or more of each District
District
Passed in 6 or more
subjects with 1 st
Lan. & Maths
Passed in 6
Subjects
Performance of School Candidates by District
No. Sat. for
5 or more
Failed in All
(Appeared in 6
and above)
Qualified for
G.C.E.(A/L)Obtained 8 A's
G.C.E. (O.L.) Examination - 2005

- 53 -
- 52 -
No % No % No % No % No %
1 Colombo 30,388 19,256 63.37 1,287 4.24 16,712 55.00 2,697 8.88 1,539 5.06
2 Gampaha 25,122 13,278 52.85 397 1.58 10,931 43.51 2,647 10.54 1,677 6.68
3 Kalutara 14,564 7,558 51.90 203 1.39 5,956 40.90 1,641 11.27 1,080 7.42
4 Kandy 21,775 10,712 49.19 483 2.22 8,371 38.44 2,336 10.73 1,765 8.11
5 Matale 7,509 3,084 41.07 70 0.93 2,302 30.66 870 11.59 882 11.75
6 Nuwara Eliya 10,443 3,653 34.98 35 0.34 2,860 27.39 1,110 10.63 1,094 10.48
7 Galle 17,084 8,895 52.07 397 2.32 7,493 43.86 1,877 10.99 1,447 8.47
8 Matara 13,739 6,834 49.74 215 1.56 5,558 40.45 1,606 11.69 1,138 8.28
9 Hambantota 10,518 4,841 46.03 99 0.94 3,634 34.55 1,319 12.54 933 8.87
10 Jaffna 9,999 5,081 50.82 105 1.05 4,231 42.31 1,147 11.47 477 4.77
11 Kilinochchi 1,939 673 34.71 2 0.10 476 24.55 182 9.39 133 6.86
12 Mannar 1,327 624 47.02 6 0.45 454 34.21 191 14.39 13 0.98
13 Vavuniya 2,299 1,339 58.24 41 1.78 996 43.32 311 13.53 45 1.96
14 Mullaitivu 1,503 546 36.33 - - 366 24.35 170 11.31 94 6.25
15 Batticaloa 5,855 2,786 47.58 72 1.23 2,077 35.47 678 11.58 257 4.39
16 Ampara 8,788 4,231 48.15 67 0.76 3,303 37.59 1,160 13.20 431 4.90
17 Trincomalee 4,803 2,013 41.91 30 0.62 1,486 30.94 597 12.43 321 6.68
18 Kurunegala 25,267 13,212 52.29 250 0.99 9,892 39.15 3,136 12.41 1,585 6.27
19 Chilaw 9,596 4,438 46.25 78 0.81 3,427 35.71 1,112 11.59 535 5.58
20 Anuradhapura 13,388 5,317 39.71 81 0.61 4,108 30.68 1,642 12.26 1,373 10.26
21 Polonnaruwa 6,028 2,403 39.86 38 0.63 1,800 29.86 710 11.78 729 12.09
22 Badulla 14,254 6,018 42.22 68 0.48 4,656 32.66 1,628 11.42 1,143 8.02
23 Monaragala 8,429 2,957 35.08 23 0.27 2,190 25.98 982 11.65 1,243 14.75
24 Ratnapura 19,333 8,378 43.34 151 0.78 6,632 34.30 2,252 11.65 1,921 9.94
25 Kegalle 12,443 6,288 50.53 149 1.20 4,814 38.69 1,543 12.40 864 6.94
Island 296,393 144,415 48.72 4,347 1.47 114,725 38.71 33,544 11.32 22,719 7.67
* Percentages Calculated on Number Sat for 5 or more of each District
Passed in 6
SubjectsDistrictNo. Sat. for
5 or more
Qualified for
G.C.E.(A/L)Obtained 8 A's
G.C.E. (O.L.) Examination - 2006
Performance of School Candidates by District
Failed in All
(Appeared in 6
and above)
Passed in 6 or more
subjects with 1 st
Lan. & Maths
No. Sat. for
5 or more
No % No % No % No % No %
1 Colombo 32,399 20,624 63.66 1,433 4.42 19,005 58.66 2,916 9.00 1,536 4.74
2 Gampaha 27,487 14,513 52.80 499 1.82 13,251 48.21 2,722 9.90 1,798 6.54
3 Kalutara 15,553 7,934 51.01 249 1.60 7,178 46.15 1,610 8.50 1,092 5.77
4 Kandy 23,586 11,694 49.58 405 1.72 10,276 43.57 2,541 8.89 1,808 6.32
5 Matale 7,597 3,195 42.06 76 1.00 2,782 36.62 790 8.51 730 7.88
6 Nuwara Eliya 11,643 4,079 35.03 33 0.28 3,633 31.20 1,421 11.10 1,088 8.49
7 Galle 17,901 9,187 51.32 417 2.33 8,595 48.01 1,893 8.93 1,436 6.77
8 Matara 13,850 6,959 50.25 243 1.75 6,115 44.15 1,459 8.57 1,060 6.23
9 Hambantota 10,387 4,725 45.49 91 0.88 4,206 40.49 1,141 9.02 909 7.18
10 Jaffna 10,459 5,243 50.13 199 1.90 4,767 45.58 1,191 9.22 486 3.76
11 Kilinochchi 2,245 915 40.76 10 0.45 660 29.40 313 15.58 157 6.09
12 Mannar 1,385 785 56.68 17 1.23 671 48.45 225 14.66 18 1.17
13 Vavuniya 2,446 1,455 59.48 47 1.92 1,293 52.86 365 13.24 32 1.16
14 Mullaitivu 1,920 804 41.88 3 0.16 579 30.16 250 11.47 108 4.95
15 Batticaloa 6,491 2,963 45.65 64 0.99 2,579 39.73 784 10.97 214 2.99
16 Ampara 9,342 4,378 46.86 50 0.54 4,121 44.11 1,139 12.19 523 5.60
17 Trincomalee 5,319 2,161 40.63 41 0.77 1,873 35.21 610 10.33 351 5.94
18 Kurunegala 25,285 13,821 54.66 333 1.32 12,053 47.67 3,038 12.02 1,282 5.07
19 Chilaw 10,105 4,704 46.55 89 0.88 4,245 42.01 1,131 9.58 486 4.12
20 Anuradhapura 14,438 6,002 41.57 95 0.66 5,244 36.32 1,625 9.84 1,142 6.92
21 Polonnaruwa 6,384 2,596 40.66 42 0.66 2,154 33.74 742 9.84 605 8.03
22 Badulla 15,149 6,547 43.22 96 0.63 5,871 38.76 1,894 10.82 1,074 6.13
23 Monaragala 8,623 3,045 35.31 28 0.32 2,757 31.97 1,008 10.20 1,223 12.37
24 Ratnapura 19,195 8,513 44.35 141 0.73 7,751 40.38 2,214 9.68 1,825 7.98
25 Kegalle 13,110 6,618 50.48 134 1.02 5,794 44.20 1,478 9.26 853 5.35
Island 312,299 153,460 49.14 4,835 1.55 137,453 44.01 34,500 11.05 21,836 6.99
* Percentages Calculated on Number Sat for 5 or more of each District
G.C.E. (O.L.) Examination - 2007
Performance of School Candidates by District
DistrictQualified for Obtained 8 A's
Failed in AllPassed in 6 or Passed in 6
SubjectsG.C.E (A.L) 1 st Lan. & Maths
more Subjects with (Appeared in 6
and above)

- 55 -
- 54 -
Number % Number % Number % Number %
1 Colombo 13,778 9,797 71.11 1,117 8.11 9,199 66.77 657 4.77
2 Homagama 3,184 1,535 48.21 19 0.60 1,307 41.05 303 9.52
3 Jayawardanapura 6,076 3,686 60.66 149 2.45 3,176 52.27 284 4.67
4 Piliyandala 5,273 3,162 59.97 97 1.84 2,741 51.98 338 6.41
5 Gampaha 6,643 4,011 60.38 216 3.25 3,619 54.48 433 6.52
6 Minuwangoda 4,697 2,268 48.29 29 0.62 1,847 39.32 436 9.28
7 Negombo 6,267 3,078 49.11 69 1.10 2,728 43.53 363 5.79
8 Kelaniya 5,833 3,083 52.85 63 1.08 2,710 46.46 403 6.91
9 Kalutara 6,852 3,629 52.96 93 1.36 3,206 46.79 510 7.44
10 Matugama 2,967 1,469 49.51 25 0.84 1,221 41.15 310 10.45
11 Horana 4,043 2,299 56.86 63 1.56 1,865 46.13 240 5.94
12 Kandy 7,037 4,851 68.94 405 5.76 4,357 61.92 292 4.15
13 Denuwara 2,207 1,050 47.58 3 0.14 812 36.79 163 7.39
14 Gampola 3,289 1,372 41.71 3 0.09 1,152 35.03 366 11.13
15 Teldeniya 1,741 678 38.94 3 0.17 478 27.46 242 13.90
16 Wattegama 2,465 1,227 49.78 7 0.28 868 35.21 158 6.41
17 Katugastota 3,291 1,559 47.37 2 0.06 1,169 35.52 261 7.93
18 Matale 3,238 1,656 51.14 69 2.13 1,412 43.61 273 8.43
19 Galewela 2,265 765 33.77 2 0.09 537 23.71 355 15.67
20 Naula 567 188 33.16 0 0.00 161 28.40 82 14.46
21 Wilgamuwa 579 161 27.81 0 0.00 107 18.48 128 22.11
22 Nuwara Eliya 2,218 740 33.36 2 0.09 600 27.05 181 8.16
23 Kotmale 1,377 523 37.98 4 0.29 412 29.92 128 9.30
24 Hatton 2,397 778 32.46 6 0.25 686 28.62 209 8.72
25 Walapane 1,485 446 30.03 3 0.20 343 23.10 262 17.64
26 Hanguranketha 1,600 729 45.56 13 0.81 571 35.69 179 11.19
G.C.E. (O.L.) Examination - 2005
Performance of School Candidates (Freshers) by Zone
ZoneNumber Sat
for 5 or more
Obtained 8 A's
Passed in 6 or Failed in All
more Subjects with (Appeared in 6
1 st Lan. & Maths and above)
Qualified for
G.C.E (A.L)
Number % Number % Number % Number %
27 Galle 6,965 4,132 59.33 260 3.73 3,718 53.38 493 7.08
28 Elpitiya 3,132 1,389 44.35 5 0.16 1,129 36.05 264 8.43
29 Ambalangoda 3,446 1,764 51.19 55 1.60 1,632 47.36 351 10.19
30 Udugama 2,124 862 40.58 6 0.28 653 30.74 228 10.73
31 Matara 5,214 3,070 58.88 177 3.39 2,761 52.95 440 8.44
32 Akuressa 2,188 1,021 46.66 12 0.55 865 39.53 210 9.60
33 Mulatiyana 2,394 1,068 44.61 5 0.21 920 38.43 237 9.90
34 Morawaka 2,514 1,067 42.44 6 0.24 881 35.04 311 12.37
35 Tangalle 2,668 1,299 48.69 20 0.75 1,003 37.59 237 8.88
36 Hambantota 4,069 1,647 40.48 12 0.29 1,307 32.12 465 11.43
37 Walasmulla 2,776 1,368 49.28 38 1.37 1,112 40.06 190 6.84
38 Jaffna 3,492 2,058 58.93 53 1.52 1,928 55.21 136 3.89
39 Islands 552 192 34.78 2 0.36 182 32.97 34 6.16
40 Thenmarachchi 1,088 530 48.71 6 0.55 479 44.03 62 5.70
41 Valikamam 2,700 1,270 47.04 12 0.44 1,102 40.81 100 3.70
42 Vadamarachchy 1,776 846 47.64 9 0.51 775 43.64 143 8.05
43 Kilinochchi 1,608 482 29.98 3 0.19 407 25.31 110 6.84
44 Mannar 948 482 50.84 2 0.21 432 45.57 10 1.05
45 Madhu 197 72 36.55 0 0.00 45 22.84 1 0.51
46 Vavuniya 1,686 1,024 60.74 24 1.42 890 52.79 32 1.90
47 Vavuniya north 241 117 48.55 0 0.00 61 25.31 5 2.07
48 Mullativu 922 320 34.71 5 0.54 268 29.07 86 9.33
49 Thunukkai 409 149 36.43 1 0.24 120 29.34 35 8.56
more Subjects with (Appeared in 6
G.C.E. (O.L.) Examination - 2005
Performance of School Candidates (Freshers) by Zone
ZoneNumber Sat
for 5 or more
Qualified forObtained 8 A's
Passed in 6 or Failed in All
G.C.E (A.L) 1 st Lan. & Maths and above)

- 57 -
- 55 - - 56 -
Number % Number % Number % Number %
50 Batticaloa 2,026 1,047 51.68 38 1.88 939 46.35 91 4.49
51 Kalkudah 745 272 36.51 3 0.40 209 28.05 43 5.77
52 Paddirippu 1,151 457 39.70 7 0.61 374 32.49 62 5.39
53 Batticaloa Central 932 588 63.09 11 1.18 543 58.26 14 1.50
54 Ampara 2,153 1,030 47.84 7 0.33 822 38.18 139 6.46
55 Kalmunai 1,864 1,032 55.36 25 1.34 940 50.43 44 2.36
56 Sammanthurai 841 404 48.04 5 0.59 389 46.25 22 2.62
57 Mahaoya 523 132 25.24 1 0.19 119 22.75 79 15.11
58 Dehiattakandiya 957 327 34.17 0 0.00 264 27.59 120 12.54
59 Akkaraipattu 1,447 780 53.90 7 0.48 729 50.38 39 2.70
60 Trincomalee 1,682 844 50.18 23 1.37 763 45.36 97 5.77
61 Muthur 715 297 41.54 1 0.14 215 30.07 15 2.10
62 Kantale 1,204 418 34.72 1 0.08 326 27.08 129 10.71
63 Kinniya 1,003 348 34.70 2 0.20 272 27.12 104 10.37
64 Kurunegala 5,356 3,229 60.29 220 4.11 2,838 52.99 314 5.86
65 Kuliyapitiya 3,810 2,119 55.62 24 0.63 1,752 45.98 205 5.38
66 Nikaweratiya 3,023 1,532 50.68 9 0.30 1,182 39.10 169 5.59
67 Maho 4,023 1,688 41.96 7 0.17 1,269 31.54 369 9.17
68 Giriullla 3,895 2,086 53.56 22 0.56 1,735 44.54 232 5.96
69 Ibbagamuwa 3,126 1,412 45.17 12 0.38 1,108 35.44 278 8.89
70 Puttalam 4,081 1,568 38.42 13 0.32 1,164 28.52 317 7.77
71 Chilaw 4,724 2,375 50.28 72 1.52 2,023 42.82 220 4.66
Number Sat
for 5 or moreQualified for
Obtained 8 A's
Passed in 6 or
G.C.E (A.L) 1 st Lan. & Maths
(Appeared in 6
Failed in All
more Subjects withZone
Performance of School Candidates (Freshers) by Zone
G.C.E. (O.L.) Examination - 2005
and above)
Number % Number % Number % Number %
72 Anuradhapura 4,127 2,007 48.63 46 1.11 1,756 42.55 387 9.38
73 Thambuttegama 2,642 1,110 42.01 2 0.08 871 32.97 259 9.80
74 Kekirawa 2,495 981 39.32 6 0.24 719 28.82 325 13.03
75 Galenbidunuwewa 1,505 606 40.27 0 0.00 448 29.77 129 8.57
76 Kebithigollewa 1,813 698 38.50 5 0.28 542 29.90 192 10.59
77 Polonnaruwa 1,543 801 51.91 15 0.97 703 45.56 163 10.56
78 Hingurakgoda 2,474 959 38.76 18 0.73 742 29.99 338 13.66
79 Dimbulagala 1,417 471 33.24 0 0.00 314 22.16 178 12.56
80 Badulla 3,299 1,456 44.13 37 1.12 1,170 35.47 284 8.61
81 Bandarawela 2,961 1,517 51.23 45 1.52 1,337 45.15 163 5.50
82 Mahiyanganaya 1,821 646 35.48 4 0.22 496 27.24 238 13.07
83 Welimada 2,471 1,089 44.07 3 0.12 919 37.19 161 6.52
84 Passara 1,103 342 31.01 0 0.00 300 27.20 126 11.42
85 Monaragala 2,188 872 39.85 15 0.69 710 32.45 269 12.29
86 Wellawaya 3,126 1,174 37.56 5 0.16 923 29.53 446 14.27
87 Bibile 1,674 565 33.75 6 0.36 464 27.72 327 19.53
88 Ratnapura 6,102 3,105 50.88 87 1.43 2,737 44.85 492 8.06
89 Balangoda 3,145 1,345 42.77 9 0.29 1,092 34.72 302 9.60
90 Nivitigala 2,769 1,075 38.82 3 0.11 887 32.03 349 12.60
91 Embilipitiya 4,247 1,649 38.83 14 0.33 1,337 31.48 594 13.99
92 Kegalle 4,460 2,601 58.32 86 1.93 2,141 48.00 310 6.95
93 Mawanella 3,581 1,787 49.90 28 0.78 1,424 39.77 329 9.19
94 Dehiowita 3,389 1,435 42.34 7 0.21 1,086 32.04 303 8.94
Total 268,111 133,245 49.70 4,126 1.54 113,047 42.16 21,502 8.02
* Percentages Calculated on Number Sat for 5 or more of each zone
Performance of School Candidates (Freshers) by Zone
Obtained 8 A's
Passed in 6 or Failed in All
more Subjects with (Appeared in 6
1 st Lan. & Maths and above)Zone
Number Sat
for 5 or more
G.C.E. (O.L.) Examination - 2005
G.C.E (A.L)
Qualified for

- 59 -
- 58 -
Number % Number % Number % Number %
1 Colombo 13,833 9,928 71.77 1,024 7.40 9,036 65.32 616 4.45
2 Homagama 3,197 1,697 53.08 12 0.38 1,322 41.35 274 8.57
3 Jayawardanapura 6,000 3,839 63.98 145 2.42 3,166 52.77 317 5.28
4 Piliyandala 5,166 3,172 61.40 106 2.05 2,686 51.99 271 5.25
5 Gampaha 6,441 4,013 62.30 273 4.24 3,455 53.64 420 6.52
6 Minuwangoda 4,525 2,202 48.66 10 0.22 1,728 38.19 443 9.79
7 Negombo 6,124 3,303 53.94 64 1.05 2,715 44.33 349 5.70
8 Kelaniya 5,657 3,056 54.02 50 0.88 2,435 43.04 412 7.28
9 Kalutara 6,607 3,510 53.13 102 1.54 2,872 43.47 562 8.51
10 Matugama 2,736 1,348 49.27 29 1.06 1,044 38.16 269 9.83
11 Horana 3,744 2,219 59.27 72 1.92 1,701 45.43 221 5.90
12 Kandy 6,781 4,822 71.11 458 6.75 4,123 60.80 269 3.97
13 Denuwara 2,099 990 47.17 6 0.29 692 32.97 214 10.20
14 Gampola 3,210 1,294 40.31 8 0.25 965 30.06 416 12.96
15 Teldeniya 1,732 566 32.68 4 0.23 419 24.19 291 16.80
16 Wattegama 2,350 1,014 43.15 3 0.13 741 31.53 206 8.77
17 Katugastota 3,013 1,370 45.47 4 0.13 975 32.36 291 9.66
18 Matale 3,083 1,659 53.81 68 2.21 1,347 43.69 236 7.65
19 Galewela 2,141 784 36.62 2 0.09 513 23.96 378 17.66
20 Naula 479 178 37.16 0 0.00 136 28.39 51 10.65
21 Wilgamuwa 711 176 24.75 0 0.00 108 15.19 193 27.14
22 Nuwara Eliya 2,051 775 37.79 9 0.44 555 27.06 158 7.70
23 Kotmale 1,286 536 41.68 10 0.78 406 31.57 141 10.96
24 Hatton 2,355 838 35.58 5 0.21 728 30.91 223 9.47
25 Walapane 1,542 400 25.94 3 0.19 294 19.07 326 21.14
26 Hanguranketha 1,540 672 43.64 8 0.52 522 33.90 204 13.25
G.C.E (A.L)
Obtained 8 A's
Passed in 6 or
more Subjects withQualified forZone
Number Sat
for 5 or more
Failed in All
and above)1 st Lan. & Maths
(Appeared in 6
G.C.E. (O.L.) Examination - 2006
Performance of School Candidates (Freshers) by Zone
Number % Number % Number % Number %
27 Galle 6,793 4,223 62.17 285 4.20 3,665 53.95 461 6.79
28 Elpitiya 3,074 1,402 45.61 13 0.42 1,156 37.61 362 11.78
29 Ambalangoda 3,405 1,821 53.48 96 2.82 1,570 46.11 381 11.19
30 Udugama 1,903 887 46.61 3 0.16 640 33.63 203 10.67
31 Matara 5,050 3,064 60.67 184 3.64 2,640 52.28 354 7.01
32 Akuressa 2,139 1,050 49.09 16 0.75 885 41.37 182 8.51
33 Mulatiyana 2,361 1,120 47.44 7 0.30 838 35.49 270 11.44
34 Morawaka 2,457 1,057 43.02 8 0.33 785 31.95 304 12.37
35 Tangalle 2,604 1,362 52.30 38 1.46 960 36.87 230 8.83
36 Hambantota 3,975 1,656 41.66 17 0.43 1,235 31.07 503 12.65
37 Walasmulla 2,723 1,455 53.43 44 1.62 1,158 42.53 174 6.39
38 Jaffna 3,160 1,920 60.76 65 2.06 1,727 54.65 131 4.15
39 Islands 467 216 46.25 0 0.00 176 37.69 28 6.00
40 Thenmarachchi 946 466 49.26 8 0.85 361 38.16 65 6.87
41 Valikamam 2,448 1,299 53.06 15 0.61 1,029 42.03 101 4.13
42 Vadamarachchy 1,515 785 51.82 17 1.12 664 43.83 115 7.59
43 Kilinochchi 1,550 553 35.68 2 0.13 407 26.26 126 8.13
44 Mannar 884 484 54.75 6 0.68 373 42.19 9 1.02
45 Madhu 218 68 31.19 0 0.00 38 17.43 4 1.83
46 Vavuniya 1,766 1,090 61.72 41 2.32 856 48.47 36 2.04
47 Vavuniya north 274 153 55.84 0 0.00 84 30.66 7 2.55
48 Mullativu 903 355 39.31 0 0.00 251 27.80 59 6.53
49 Thunukkai 374 130 34.76 0 0.00 83 22.19 30 8.02
(Appeared in 6
1 st Lan. & Maths and above)
G.C.E. (O.L.) Examination - 2006
Performance of School Candidates (Freshers) by Zone
ZoneNumber Sat
for 5 or more
Qualified for Obtained 8 A's
Passed in 6 or Failed in All
more Subjects with
G.C.E (A.L)

- 61 -
- 60 -
Number % Number % Number % Number %
50 Batticaloa 2,073 1,065 51.37 47 2.27 892 43.03 106 5.11
51 Kalkudah 690 282 40.87 0 0.00 168 24.35 38 5.51
52 Paddirippu 1,300 558 42.92 5 0.38 407 31.31 72 5.54
53 Batticialoa Central 1,067 689 64.57 20 1.87 515 48.27 29 2.72
54 Ampara 2,151 1,075 49.98 14 0.65 810 37.66 134 6.23
55 Kalmunai 1,930 974 50.47 30 1.55 827 42.85 90 4.66
56 Sammanthurai 864 423 48.96 3 0.35 340 39.35 18 2.08
57 Mahaoya 459 147 32.03 0 0.00 109 23.75 53 11.55
58 Dehiattakandiya 967 419 43.33 2 0.21 250 25.85 81 8.38
59 Akkaraipattu 1,487 838 56.36 18 1.21 747 50.24 47 3.16
60 Trincomalee 1,465 801 54.68 28 1.91 693 47.30 74 5.05
61 Muthur 690 244 35.36 0 0.00 131 18.99 48 6.96
62 Kantale 1,010 363 35.94 1 0.10 258 25.54 120 11.88
63 Kinniya 992 411 41.43 1 0.10 276 27.82 67 6.75
64 Kurunegala 5,125 3,267 63.75 167 3.26 2,662 51.94 285 5.56
65 Kuliyapitiya 3,628 2,201 60.67 29 0.80 1,654 45.59 152 4.19
66 Nikaweratiya 2,825 1,505 53.27 9 0.32 1,062 37.59 168 5.95
67 Maho 3,636 1,497 41.17 8 0.22 1,096 30.14 381 10.48
68 Giriullla 3,664 2,054 56.06 23 0.63 1,589 43.37 221 6.03
69 Ibbagamuwa 2,952 1,381 46.78 14 0.47 964 32.66 325 11.01
70 Puttalam 4,000 1,613 40.33 16 0.40 1,161 29.03 298 7.45
71 Chilaw 4,665 2,512 53.85 62 1.33 2,061 44.18 225 4.82
(Appeared in 6
G.C.E. (O.L.) Examination - 2006
Performance of School Candidates (Freshers) by Zone
ZoneNumber Sat
for 5 or moreQualified for
Obtained 8 A's
Passed in 6 or Failed in All
more Subjects with
G.C.E (A.L) 1 st Lan. & Maths and above)
Number % Number % Number % Number %
72 Anuradhapura 3,745 1,835 49.00 72 1.92 1,578 42.14 416 11.11
73 Thambuttegama 2,309 877 37.98 2 0.09 644 27.89 280 12.13
74 Kekirawa 2,206 907 41.12 6 0.27 626 28.38 242 10.97
75 Galenbidunuwewa 1,520 515 33.88 0 0.00 377 24.80 184 12.11
76 Kebithigollewa 1,662 579 34.84 1 0.06 443 26.65 222 13.36
77 Polonnaruwa 1,591 812 51.04 30 1.89 665 41.80 154 9.68
78 Hingurakgoda 2,374 951 40.06 8 0.34 699 29.44 343 14.45
79 Dimbulagala 1,358 435 32.03 0 0.00 294 21.65 216 15.91
80 Badulla 3,519 1,609 45.72 26 0.74 1,228 34.90 308 8.75
81 Bandarawela 2,946 1,565 53.12 38 1.29 1,333 45.25 165 5.60
82 Mahiyanganaya 1,889 699 37.00 0 0.00 510 27.00 287 15.19
83 Welimada 2,479 1,015 40.94 0 0.00 772 31.14 236 9.52
84 Passara 1,061 378 35.63 4 0.38 280 26.39 105 9.90
85 Monaragala 2,221 813 36.61 12 0.54 609 27.42 385 17.33
86 Wellawaya 3,149 1,170 37.15 8 0.25 836 26.55 542 17.21
87 Bibile 1,643 554 33.72 3 0.18 448 27.27 270 16.43
88 Ratnapura 6,088 3,146 51.68 108 1.77 2,650 43.53 570 9.36
89 Balangoda 3,211 1,404 43.72 20 0.62 1,070 33.32 351 10.93
90 Nivitigala 2,787 1,070 38.39 8 0.29 862 30.93 343 12.31
91 Embilipitiya 4,178 1,713 41.00 15 0.36 1,307 31.28 595 14.24
92 Kegalle 4,224 2,623 62.10 119 2.82 2,107 49.88 263 6.23
93 Mawanella 3,464 1,788 51.62 26 0.75 1,386 40.01 276 7.97
94 Dehiowita 3,112 1,358 43.64 4 0.13 933 29.98 291 9.35
Total 259,768 133,112 51.24 4,347 1.67 106,594 41.03 21,962 8.45
* Percentages Calculated on Number Sat for 5 or more of each zone
Performance of School Candidates (Freshers) by Zone
Passed in 6 or Failed in All
G.C.E. (O.L.) Examination - 2006
ZoneNumber Sat
for 5 or more
Qualified for Obtained 8 A's more Subjects with (Appeared in 6
G.C.E (A.L) 1 st Lan. & Maths and above)

- 63 -
- 62 -
Number % Number % Number % Number %
1 Colombo 14,590 10,362 71.02 1,174 8.05 9,783 67.05 645 4.42
2 Homagama 3,442 1,814 52.70 18 0.52 1,564 45.44 267 7.76
3 Jayawardanapura 6,622 4,330 65.39 158 2.39 3,863 58.34 296 4.47
4 Piliyandala 5,580 3,459 61.99 113 2.03 3,190 57.17 283 5.07
5 Gampaha 7,181 4,505 62.73 268 3.73 4,144 57.71 440 6.13
6 Minuwangoda 4,735 2,370 50.05 26 0.55 2,080 43.93 450 9.50
7 Negombo 6,830 3,514 51.45 140 2.05 3,184 46.62 442 6.47
8 Kelaniya 6,435 3,470 53.92 75 1.17 3,179 49.40 402 6.25
9 Kalutara 7,237 3,882 53.64 125 1.73 3,545 48.98 552 7.63
10 Matugama 2,926 1,445 49.38 26 0.89 1,296 44.29 261 8.92
11 Horana 4,047 2,262 55.89 105 2.59 1,995 49.30 247 6.10
12 Kandy 7,276 4,936 67.84 396 5.44 4,608 63.33 340 4.67
13 Denuwara 2,397 1,140 47.56 4 0.17 963 40.18 227 9.47
14 Gampola 3,637 1,518 41.74 12 0.33 1,278 35.14 391 10.75
15 Teldeniya 1,832 689 37.61 1 0.05 575 31.39 296 16.16
16 Wattegama 2,532 1,128 44.55 5 0.20 934 36.89 229 9.04
17 Katugastota 3,228 1,553 48.11 6 0.19 1,304 40.40 260 8.05
18 Matale 3,364 1,763 52.41 78 2.32 1,597 47.47 230 6.84
19 Galewela 2,131 848 39.79 4 0.19 662 31.07 282 13.23
20 Naula 516 180 34.88 0 0.00 147 28.49 65 12.60
21 Wilgamuwa 597 138 23.12 0 0.00 113 18.93 133 22.28
22 Nuwara Eliya 2,401 802 33.40 5 0.21 698 29.07 222 9.25
23 Kotmale 1,335 536 40.15 3 0.22 491 36.78 137 10.26
24 Hatton 2,673 973 36.40 14 0.52 885 33.11 223 8.34
25 Walapane 1,670 464 27.78 1 0.06 400 23.95 257 15.39
26 Hanguranketha 1,786 736 41.21 13 0.73 653 36.56 225 12.60
Failed in All
more Subjects with (Appeared in 6
G.C.E (A.L) 1 st Lan. & Maths and above)
G.C.E. (O.L.) Examination - 2007
Performance of School Candidates (Freshers) by Zone
Zone
Number Sat
for 5 or
more
Qualified forObtained 8 A's
Passed in 6 or
Number % Number % Number % Number %
27 Galle 7,141 4,355 60.99 356 4.99 4,125 57.77 484 6.78
28 Elpitiya 3,407 1,666 48.90 10 0.29 1,472 43.21 317 9.30
29 Ambalangoda 3,658 1,886 51.56 61 1.67 1,806 49.37 347 9.49
30 Udugama 2,037 835 40.99 6 0.29 738 36.23 263 12.91
31 Matara 5,241 3,157 60.24 209 3.99 2,877 54.89 347 6.62
32 Akuressa 2,171 1,092 50.30 27 1.24 920 42.38 186 8.57
33 Mulatiyana 2,327 1,121 48.17 8 0.34 979 42.07 223 9.58
34 Morawaka 2,446 1,097 44.85 7 0.29 930 38.02 268 10.96
35 Tangalle 2,568 1,289 50.19 22 0.86 1,133 44.12 202 7.87
36 Hambantota 4,043 1,704 42.15 23 0.57 1,540 38.09 480 11.87
37 Walasmulla 2,718 1,466 53.94 49 1.80 1,248 45.92 201 7.40
38 Jaffna 3,302 1,959 59.33 141 4.27 1,845 55.88 125 3.79
39 Islands 546 201 36.81 0 0.00 195 35.71 35 6.41
40 Thenmarachchi 1,039 527 50.72 12 1.15 476 45.81 67 6.45
41 Valikamam 2,518 1,346 53.46 17 0.68 1,146 45.51 100 3.97
42 Vadamarachchy 1,591 834 52.42 34 2.14 778 48.90 124 7.79
43 Kilinochchi 1,814 757 41.73 11 0.61 551 30.37 150 8.27
44 Mannar 945 578 61.16 17 1.80 529 55.98 11 1.16
45 Madhu 231 88 38.10 0 0.00 60 25.97 5 2.16
46 Vavuniya 1,842 1,168 63.41 48 2.61 1,091 59.23 25 1.36
47 Vavuniya north 373 194 52.01 1 0.27 136 36.46 5 1.34
48 Mullativu 1,157 544 47.02 4 0.35 400 34.57 72 6.22
49 Thunukkai 498 179 35.94 0 0.00 122 24.50 33 6.63
G.C.E. (O.L.) Examination - 2007
Performance of School Candidates (Freshers) by Zone
Zone
Number Sat
for 5 or
more
Qualified forObtained 8 A's
Passed in 6 or Failed in All
more Subjects with (Appeared in 6
G.C.E (A.L) 1 st Lan. & Maths and above)

- 65 -
- 64 -
Number % Number % Number % Number %
50 Batticaloa 2,085 1,025 49.16 40 1.92 948 45.47 83 3.98
51 Kalkudah 806 296 36.72 2 0.25 208 25.81 52 6.45
52 Paddirippu 1,412 549 38.88 8 0.57 465 32.93 50 3.54
53 Batticaloa Central 1,238 822 66.40 14 1.13 731 59.05 20 1.62
54 Ampara 2,488 1,140 45.82 10 0.40 958 38.50 190 7.64
55 Kalmunai 1,860 982 52.80 24 1.29 957 51.45 68 3.66
56 Sammanthurai 853 416 48.77 2 0.23 459 53.81 23 2.70
57 Mahaoya 504 154 30.56 0 0.00 138 27.38 56 11.11
58 Dehiattakandiya 1,078 420 38.96 2 0.19 344 31.91 132 12.24
59 Akkaraipattu 1,703 991 58.19 12 0.70 988 58.02 34 2.00
60 Trincomalee 1,552 794 51.16 30 1.93 711 45.81 67 4.32
61 Muthur 680 265 38.97 6 0.88 218 32.06 45 6.62
62 Kantale 1,098 377 34.34 1 0.09 335 30.51 141 12.84
63 Kinniya 1,283 490 38.19 4 0.31 420 32.74 90 7.01
64 Kurunegala 5,350 3,411 63.76 209 3.91 3,057 57.14 306 5.72
65 Kuliyapitiya 3,584 2,166 60.44 54 1.51 1,908 53.24 126 3.52
66 Nikaweratiya 2,960 1,617 54.63 18 0.61 1,385 46.79 140 4.73
67 Maho 3,814 1,825 47.85 14 0.37 1,530 40.12 269 7.05
68 Giriullla 3,876 2,226 57.43 34 0.88 1,972 50.88 174 4.49
69 Ibbagamuwa 2,914 1,521 52.20 16 0.55 1,326 45.50 226 7.76
70 Puttalam 4,319 1,730 40.06 9 0.21 1,524 35.29 238 5.51
71 Chilaw 4,937 2,674 54.16 80 1.62 2,456 49.75 236 4.78
Qualified forObtained 8 A's
Passed in 6 or
and above)
G.C.E. (O.L.) Examination - 2007
Performance of School Candidates (Freshers) by Zone
Zone
Number Sat
for 5 or
more
Failed in All
more Subjects with (Appeared in 6
G.C.E (A.L) 1 st Lan. & Maths
Number % Number % Number % Number %
72 Anuradhapura 4,073 1,976 48.51 85 2.09 1,788 43.90 324 7.95
73 Thambuttegama 2,506 1,043 41.62 5 0.20 838 33.44 242 9.66
74 Kekirawa 2,450 1,028 41.96 2 0.08 878 35.84 210 8.57
75 Galenbidunuwewa 1,640 593 36.16 1 0.06 547 33.35 157 9.57
76 Kebithigollewa 1,715 653 38.08 4 0.23 541 31.55 177 10.32
77 Polonnaruwa 1,637 827 50.52 29 1.77 724 44.23 144 8.80
78 Hingurakgoda 2,461 997 40.51 12 0.49 791 32.14 290 11.78
79 Dimbulagala 1,539 520 33.79 1 0.06 407 26.45 155 10.07
80 Badulla 3,733 1,714 45.91 44 1.18 1,501 40.21 319 8.55
81 Bandarawela 3,060 1,722 56.27 47 1.54 1,523 49.77 131 4.28
82 Mahiyanganaya 2,019 742 36.75 5 0.25 677 33.53 262 12.98
83 Welimada 2,605 1,119 42.96 4 0.15 1,022 39.23 203 7.79
84 Passara 1,183 399 33.73 0 0.00 355 30.01 120 10.14
85 Monaragala 2,241 805 35.92 10 0.45 740 33.02 354 15.80
86 Wellawaya 3,109 1,138 36.60 9 0.29 1,011 32.52 529 17.02
87 Bibile 1,718 610 35.51 9 0.52 548 31.90 295 17.17
88 Ratnapura 6,116 3,178 51.96 99 1.62 2,912 47.61 552 9.03
89 Balangoda 3,096 1,420 45.87 12 0.39 1,260 40.70 279 9.01
90 Nivitigala 2,739 1,102 40.23 7 0.26 997 36.40 387 14.13
91 Embilipitiya 4,286 1,850 43.16 25 0.58 1,628 37.98 562 13.11
92 Kegalle 4,375 2,664 60.89 82 1.87 2,405 54.97 227 5.19
93 Mawanella 3,825 1,946 50.88 48 1.25 1,738 45.44 331 8.65
94 Dehiowita 3,389 1,518 44.79 7 0.21 1,247 36.80 256 7.55
Total 276,522 142,315 51.47 4,969 1.80 127,344 46.05 21,144 7.65
* Percentages Calculated on Number Sat for 5 or more of each zone
1 st Lan. & Maths and above)Zone
Number Sat
for 5 or
more
Qualified forObtained 8 A's
G.C.E (A.L)
more Subjects with (Appeared in 6
G.C.E. (O.L.) Examination - 2007
Passed in 6 or Failed in All
Performance of School Candidates (Freshers) by Zone

- 67 -
- 66 -
No. of
Schools NO. % NO. % NO. % NO. % NO. %
1 Colombo 378 68 17.99 79 20.90 125 33.07 80 21.16 26 6.88
2 Gampaha 391 31 7.93 77 19.69 195 49.87 73 18.67 15 3.84
3 Kalutara 302 23 7.62 76 25.17 134 44.37 49 16.23 20 6.62
4 Kandy 439 33 7.52 141 32.12 161 36.67 82 18.68 22 5.01
5 Matale 176 6 3.41 40 22.73 81 46.02 38 21.59 11 6.25
6 Nuwara Eliya 223 10 4.48 48 21.52 105 47.09 55 24.66 5 2.24
7 Galle 304 19 6.25 77 25.33 136 44.74 50 16.45 22 7.24
8 Matara 274 23 8.39 75 27.37 113 41.24 45 16.42 18 6.57
9 Hambantota 230 12 5.22 56 24.35 118 51.30 35 15.22 9 3.91
10 Jaffna 219 28 12.79 73 33.33 87 39.73 21 9.59 10 4.57
11 Kilinochchi 43 1 2.33 10 23.26 21 48.84 9 20.93 2 4.65
12 Mannar 37 6 16.22 16 43.24 12 32.43 3 8.11 - -
13 Vavuniya 50 12 24.00 27 54.00 8 16.00 - - 3 6.00
14 Mullaitivu 40 1 2.50 11 27.50 19 47.50 7 17.50 2 5.00
15 Batticaloa 109 16 14.68 30 27.52 48 44.04 13 11.93 2 1.83
16 Ampara 175 22 12.57 46 26.29 66 37.71 37 21.14 4 2.29
17 Trincomalee 135 9 6.67 35 25.93 64 47.41 23 17.04 4 2.96
18 Kurunegala 591 45 7.61 217 36.72 251 42.47 60 10.15 18 3.05
19 Chilaw 224 10 4.46 43 19.20 117 52.23 40 17.86 14 6.25
20 Anuradhapura 283 11 3.89 73 25.80 130 45.94 50 17.67 19 6.71
21 Polonnaruwa 134 5 3.73 32 23.88 61 45.52 27 20.15 9 6.72
22 Badulla 328 19 5.79 85 25.91 149 45.43 63 19.21 12 3.66
23 Monaragala 167 2 1.20 31 18.56 84 50.30 42 25.15 8 4.79
24 Ratnapura 339 13 3.83 80 23.60 178 52.51 48 14.16 20 5.90
25 Kegalle 316 23 7.28 99 31.33 127 40.19 41 12.97 26 8.23
Island 5,907 448 7.58 1,577 26.70 2,590 43.85 991 16.78 301 5.10
G.C.E. (O.L.) Examination - 2005
75% - 100% 50% - 74% 25% - 49% 01% - 24% 0%District
No. of Schools According to the Percentage of Candidates Qualified for G.C.E.(A.L.) - Freshers
No. of
Schools NO. % NO. % NO. % NO. % NO. %
1 Colombo 375 58 15.47 72 19.20 147 39.20 76 20.27 22 5.87
2 Gampaha 388 27 6.96 65 16.75 199 51.29 85 21.91 12 3.09
3 Kalutara 302 25 8.28 59 19.54 152 50.33 46 15.23 20 6.62
4 Kandy 432 29 6.71 108 25.00 171 39.58 97 22.45 27 6.25
5 Matale 184 7 3.80 42 22.83 77 41.85 51 27.72 7 3.80
6 Nuwara Eliya 235 7 2.98 36 15.32 95 40.43 90 38.30 7 2.98
7 Galle 310 18 5.81 62 20.00 134 43.23 68 21.94 28 9.03
8 Matara 275 15 5.45 64 23.27 135 49.09 45 16.36 16 5.82
9 Hambantota 230 5 2.17 51 22.17 120 52.17 43 18.70 11 4.78
10 Jaffna 223 19 8.52 55 24.66 92 41.26 41 18.39 16 7.17
11 Kilinochchi 44 - - 5 11.36 29 65.91 7 15.91 3 6.82
12 Mannar 38 3 7.89 11 28.95 17 44.74 3 7.89 4 10.53
13 Vavuniya 53 6 11.32 23 43.40 13 24.53 8 15.09 3 5.66
14 Mullaitivu 41 1 2.44 6 14.63 21 51.22 10 24.39 3 7.32
15 Batticaloa 113 14 12.39 21 18.58 46 40.71 23 20.35 9 7.96
16 Ampara 184 13 7.07 40 21.74 91 49.46 33 17.93 7 3.80
17 Trincomalee 136 8 5.88 29 21.32 48 35.29 32 23.53 19 13.97
18 Kurunegala 594 37 6.23 175 29.46 289 48.65 70 11.78 23 3.87
19 Chilaw 238 10 4.20 44 18.49 121 50.84 49 20.59 14 5.88
20 Anuradhapura 285 8 2.81 30 10.53 151 52.98 79 27.72 17 5.96
21 Polonnaruwa 139 3 2.16 26 18.71 60 43.17 34 24.46 16 11.51
22 Badulla 335 18 5.37 55 16.42 146 43.58 99 29.55 17 5.07
23 Monaragala 173 1 0.58 18 10.40 83 47.98 56 32.37 15 8.67
24 Ratnapura 347 13 3.75 43 12.39 181 52.16 87 25.07 23 6.63
25 Kegalle 309 19 6.15 85 27.51 136 44.01 53 17.15 16 5.18
Island 5,983 364 6.08 1,225 20.47 2,754 46.03 1,285 21.48 355 5.93
No. of Schools According to the Percentage of Candidates Qualified for G.C.E.(A.L.) - Freshers
District75% - 100% 50% - 74% 25% - 49% 01% - 24% 0%
G.C.E. (O.L.) Examination - 2006

- 69 -
- 68 -
No. of
Schools NO. % NO. % NO. % NO. % NO. %
1 Colombo 368 59 16.03 91 24.73 127 34.51 74 20.11 17 4.62
2 Gampaha 391 29 7.42 76 19.44 198 50.64 74 18.93 14 3.58
3 Kalutara 302 29 9.60 68 22.52 139 46.03 41 13.58 25 8.28
4 Kandy 434 31 7.14 87 20.05 192 44.24 100 23.04 24 5.53
5 Matale 180 6 3.33 32 17.78 74 41.11 56 31.11 12 6.67
6 Nuwara Eliya 231 4 1.73 38 16.45 93 40.26 83 35.93 13 5.63
7 Galle 312 14 4.49 64 20.51 153 49.04 62 19.87 19 6.09
8 Matara 275 17 6.18 58 21.09 135 49.09 46 16.73 19 6.91
9 Hambantota 231 10 4.33 54 23.38 113 48.92 45 19.48 9 3.90
10 Jaffna 225 24 10.67 56 24.89 89 39.56 43 19.11 13 5.78
11 Kilinochchi 43 2 4.65 9 20.93 22 51.16 8 18.60 2 4.65
12 Mannar 40 5 12.50 14 35.00 17 42.50 3 7.50 1 2.50
13 Vavuniya 57 8 14.04 21 36.84 19 33.33 4 7.02 5 8.77
14 Mullaitivu 42 1 2.38 8 19.05 23 54.76 7 16.67 3 7.14
15 Batticaloa 111 11 9.91 22 19.82 44 39.64 31 27.93 3 2.70
16 Ampara 185 12 6.49 39 21.08 83 44.86 42 22.70 9 4.86
17 Trincomalee 136 6 4.41 24 17.65 57 41.91 35 25.74 14 10.29
18 Kurunegala 600 45 7.50 211 35.17 255 42.50 59 9.83 30 5.00
19 Chilaw 238 10 4.20 43 18.07 128 53.78 50 21.01 7 2.94
20 Anuradhapura 289 8 2.77 41 14.19 140 48.44 82 28.37 18 6.23
21 Polonnaruwa 140 3 2.14 24 17.14 67 47.86 33 23.57 13 9.29
22 Badulla 340 16 4.71 70 20.59 158 46.47 80 23.53 16 4.71
23 Monaragala 178 1 0.56 19 10.67 89 50.00 54 30.34 15 8.43
24 Ratnapura 351 11 3.13 55 15.67 195 55.56 74 21.08 16 4.56
25 Kegalle 308 17 5.52 89 28.90 137 44.48 42 13.64 23 7.47
Island 6,007 379 6.31 1,313 21.86 2,747 45.73 1,228 20.44 340 5.66
0%
G.C.E. (O.L.) Examination - 2007
25% - 49% 01% - 24%75% - 100% 50% - 74%
No. of Schools According to the Percentage of Candidates Qualified for G.C.E.(A.L.) - Freshers
District
2005 2006 2007 2005 2006 2007
11. Buddhism 52.60 56.37 55.62 21.43 21.94 21.34
12. Saivism 47.40 54.74 56.88 20.44 19.15 18.88
13. Hinduism 57.71 47.21 52.77 17.21 19.39 17.46
14. Christianity R.C. 60.50 61.98 57.98 16.41 15.52 16.50
15. Christianity N.R.C. 55.26 56.93 56.73 16.08 17.25 17.65
16. Islam 52.73 54.50 53.27 18.37 18.68 17.79
21. Sinhala Language & Literature 48.90 48.46 49.34 17.74 17.75 18.08
22. Tamil Language & Literature 48.99 50.73 45.31 17.72 17.90 17.52
31. English 32.77 31.66 33.91 21.33 21.81 24.43
32. Mathematics 31.92 29.27 32.19 23.58 22.01 23.06
34. Science and Technology 36.51 34.06 33.42 18.29 17.39 17.26
35. Construction Techniques - 46.49 57.36 - 18.59 13.53
36. Electrical & Electronic Techniques - 38.81 35.04 - 17.70 13.71
37. Mechanics & Mechanical Techniques - 46.63 32.58 - 16.89 11.81
38. Home Gardening Techniques - 57.48 52.36 - 17.76 15.89
39. Creative Arts - 63.89 69.99 - 15.68 15.33
40. Food Proc. & Dress Desing. Tech. - 51.67 46.11 - 13.73 10.71
43. Social Studies & History 44.78 47.00 45.82 16.35 17.80 18.03
46. English Literature 41.08 42.75 43.52 21.34 20.62 21.44
47. Sianhala Literature 33.56 40.34 44.70 23.07 22.88 22.18
48. Tamil Literature 35.89 37.03 39.77 22.08 22.93 21.19
49. Arabic Literature 45.39 58.99 64.17 16.59 19.02 17.99
51. Art 33.49 35.52 38.42 14.70 11.33 14.07
52. Dancing (Sinhala) 52.16 50.94 47.63 17.48 18.71 18.64
53. Dancing (Bharatha) 45.38 47.32 58.80 20.06 20.41 21.37
54. Music (Sinlaha) 35.83 41.13 38.30 16.38 19.09 18.80
55. Music (Carnatic) 39.82 42.29 46.68 18.06 21.68 21.35
56. Music (Western) 58.02 69.12 77.54 22.79 24.48 19.12
MEAN S.D.
G.C.E. (O.L.) Examination 2005 - 2007
Means & Standard Deviations of All Subjects
Subject

- 71 -
- 70 -
2005 2006 2007 2005 2006 2007
57. Drama and Theatre 59.68 60.38 56.54 16.89 15.85 16.09
61. Pali 46.89 48.35 36.66 18.05 18.85 15.75
62. Sanskrit 35.26 34.28 39.01 22.56 22.88 20.35
63. Arabic 49.89 57.98 62.04 28.97 30.21 29.13
64. Second Language (Sinhala) 35.61 34.00 37.55 18.12 18.52 17.60
65. Second Language (Tamil) 30.15 34.95 40.59 19.02 18.50 20.16
68. French 43.15 36.03 42.84 23.32 22.04 27.01
69. Malay 69.48 81.67 - 16.67 12.47 -
70. History 35.26 37.48 41.75 17.85 17.06 18.80
71. Geography 33.29 38.69 40.26 13.96 16.14 16.00
72. Development. Studies 50.15 52.74 48.59 17.67 16.57 16.94
73. Health & Physical Education 58.25 55.79 56.58 17.27 16.28 17.76
74. Communication & Media Studies - - 50.03 - - 17.87
75. Hindi 45.60 60.55 46.30 28.95 24.07 25.99
76. Japanese 46.23 49.05 46.27 26.75 29.80 29.63
77. German 59.12 55.00 50.42 26.11 26.22 24.63
78. Agriculture 44.25 45.80 39.60 16.57 17.85 15.61
79. Horticulture 45.55 53.22 44.94 17.96 19.72 17.28
80. Animal Husbandry 45.62 47.67 40.87 16.76 12.89 20.65
81. Business & Accounting Studies 44.85 52.46 47.91 17.13 20.91 19.96
87. Inland Bio-Resources Technology 43.69 54.00 42.20 10.32 12.21 56.36
88. Marine Bio-Resources Technology 46.18 54.26 49.01 12.57 15.60 13.71
89. Food Science & Technology 46.98 53.77 47.37 16.31 16.01 15.73
90. Construction Technology 42.77 50.25 45.68 16.89 17.30 16.20
92. Shorthand & Type Writing (Sinhala) 36.69 44.17 42.89 33.89 34.35 34.12
93. Shorthand & Type Writing (Tamil) 43.56 58.25 30.44 42.69 24.89 32.48
94. Shorthand & Type Writing (English) 30.25 29.62 26.83 27.46 23.28 20.21
95. Mechanical Technology 48.14 44.77 41.06 19.76 19.02 17.14
96. Arts & Crafts 48.24 46.29 52.67 16.57 17.53 15.99
97. Electricity & Electronics Technology 42.89 43.60 45.77 20.86 20.22 21.12
98. Home Economics 16.71 41.35 41.97 12.75 13.64 13.41
99.Information & Communition Technology - - 56.44 - - 18.88
MEAN S.D.
G.C.E. (O.L) Examination 2005 - 2007
Means & Standard Deviations of All Subjects
Subject
G.C.E. (A.L.) EXAMINATION
2005 - 2007

- 72 -
No. % No. % No. %
Sinhala 164,020 82.39 35,068 17.61 199,088 81.03
Tamil 32,005 73.22 11,703 26.78 43,708 17.79
English 1,074 36.95 1,833 63.05 2,907 1.18
Total 197,099 48,604 245,703
Sinhala 164,205 82.36 35,174 17.64 199,379 81.07
Tamil 32,830 75.11 10,882 24.89 43,712 17.77
English 892 31.35 1,953 68.65 2,845 1.16
Total 197,927 48,009 245,936
Sinhala 158,336 82.28 34,104 17.72 192,440 81.85
Tamil 30,087 75.32 9,861 24.68 39,948 16.99
English 758 27.85 1,964 72.15 2,722 1.16
Total 189,181 45,929 235,110
2005
G.C.E. (A.L.) Examination 2005 - 2007
Number of Candidates Applied
Year MediumTotalPrivateSchool
2006
2007
- 71 -
G.C.E. (A.L.) Examination 2005 - 2007
Percentage of Candidates Applied by Medium
81.03 81.07 81.85
17.77 16.99
1.18 1.16 1.16
17.79
0
10
20
30
40
50
60
70
80
90
100
2005 2006 2007
Year
Per
cen
tage
Sinhala
Tamil
English
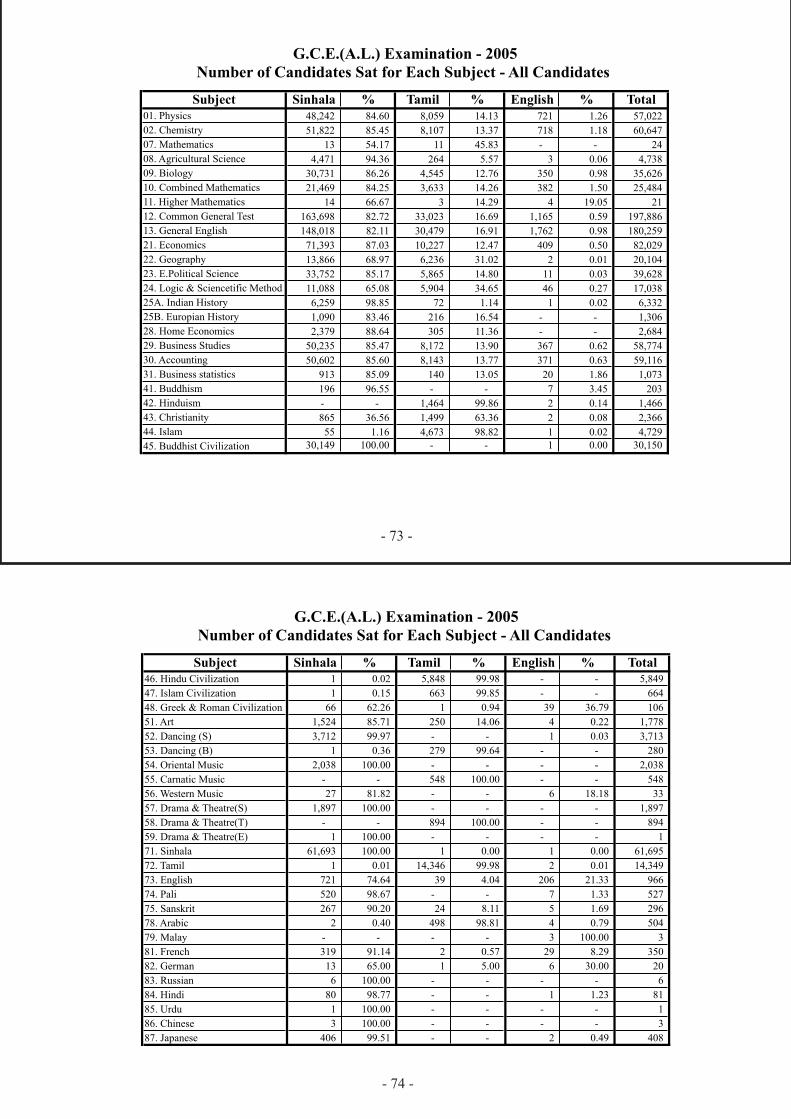
- 74 -
Subject Sinhala % Tamil % English % Total
01. Physics 48,242 84.60 8,059 14.13 721 1.26 57,022
02. Chemistry 51,822 85.45 8,107 13.37 718 1.18 60,647
07. Mathematics 13 54.17 11 45.83 - - 24
08. Agricultural Science 4,471 94.36 264 5.57 3 0.06 4,738
09. Biology 30,731 86.26 4,545 12.76 350 0.98 35,626
10. Combined Mathematics 21,469 84.25 3,633 14.26 382 1.50 25,484
11. Higher Mathematics 14 66.67 3 14.29 4 19.05 21
12. Common General Test 163,698 82.72 33,023 16.69 1,165 0.59 197,886
13. General English 148,018 82.11 30,479 16.91 1,762 0.98 180,259
21. Economics 71,393 87.03 10,227 12.47 409 0.50 82,029
22. Geography 13,866 68.97 6,236 31.02 2 0.01 20,104
23. E.Political Science 33,752 85.17 5,865 14.80 11 0.03 39,628
24. Logic & Sciencetific Method 11,088 65.08 5,904 34.65 46 0.27 17,038
25A. Indian History 6,259 98.85 72 1.14 1 0.02 6,332
25B. Europian History 1,090 83.46 216 16.54 - - 1,306
28. Home Economics 2,379 88.64 305 11.36 - - 2,684
29. Business Studies 50,235 85.47 8,172 13.90 367 0.62 58,774
30. Accounting 50,602 85.60 8,143 13.77 371 0.63 59,116
31. Business statistics 913 85.09 140 13.05 20 1.86 1,073
41. Buddhism 196 96.55 - - 7 3.45 203
42. Hinduism - - 1,464 99.86 2 0.14 1,466
43. Christianity 865 36.56 1,499 63.36 2 0.08 2,366
44. Islam 55 1.16 4,673 98.82 1 0.02 4,729
45. Buddhist Civilization 30,149 100.00 - - 1 0.00 30,150
G.C.E.(A.L.) Examination - 2005
Number of Candidates Sat for Each Subject - All Candidates
Subject Sinhala % Tamil % English % Total
46. Hindu Civilization 1 0.02 5,848 99.98 - - 5,849
47. Islam Civilization 1 0.15 663 99.85 - - 664
48. Greek & Roman Civilization 66 62.26 1 0.94 39 36.79 106
51. Art 1,524 85.71 250 14.06 4 0.22 1,778
52. Dancing (S) 3,712 99.97 - - 1 0.03 3,713
53. Dancing (B) 1 0.36 279 99.64 - - 280
54. Oriental Music 2,038 100.00 - - - - 2,038
55. Carnatic Music - - 548 100.00 - - 548
56. Western Music 27 81.82 - - 6 18.18 33
57. Drama & Theatre(S) 1,897 100.00 - - - - 1,897
58. Drama & Theatre(T) - - 894 100.00 - - 894
59. Drama & Theatre(E) 1 100.00 - - - - 1
71. Sinhala 61,693 100.00 1 0.00 1 0.00 61,695
72. Tamil 1 0.01 14,346 99.98 2 0.01 14,349
73. English 721 74.64 39 4.04 206 21.33 966
74. Pali 520 98.67 - - 7 1.33 527
75. Sanskrit 267 90.20 24 8.11 5 1.69 296
78. Arabic 2 0.40 498 98.81 4 0.79 504
79. Malay - - - - 3 100.00 3
81. French 319 91.14 2 0.57 29 8.29 350
82. German 13 65.00 1 5.00 6 30.00 20
83. Russian 6 100.00 - - - - 6
84. Hindi 80 98.77 - - 1 1.23 81
85. Urdu 1 100.00 - - - - 1
86. Chinese 3 100.00 - - - - 3
87. Japanese 406 99.51 - - 2 0.49 408
G.C.E.(A.L.) Examination - 2005
Number of Candidates Sat for Each Subject - All Candidates
- 73 -

- 76 -
Subject Sinhala % Tamil % English % Total
01. Physics 48,408 85.50 7,644 13.50 568 1.00 56,620
02. Chemistry 51,903 86.27 7,692 12.79 565 0.94 60,160
07. Mathematics 9 28.13 19 59.38 4 12.50 32
08. Agricultural Science 4,392 93.81 289 6.17 1 0.02 4,682
09. Biology 30,698 86.44 4,520 12.73 296 0.83 35,514
10. Combined Mathematics 21,543 85.96 3,241 12.93 277 1.11 25,061
11. Higher Mathematics 7 70.00 3 30.00 - - 10
12. Common General Test 163,253 82.80 32,880 16.68 1,042 0.53 197,175
13. General English 145,969 81.68 30,937 17.31 1,812 1.01 178,718
21. Economics 69,800 87.48 9,554 11.97 436 0.55 79,790
22. Geography 13,230 66.19 6,753 33.78 6 0.03 19,989
23. E.Political Science 33,329 84.15 6,273 15.84 7 0.02 39,609
24. Logic & Sciencetific Method 10,435 64.61 5,678 35.16 38 0.24 16,151
25A. Indian History 6,951 98.40 113 1.60 - - 7,064
25B. Europian History 994 76.64 300 23.13 3 0.23 1,297
28. Home Economics 2,095 79.39 544 20.61 - - 2,639
29. Business Studies (Old) 17,668 88.17 2,319 11.57 51 0.25 20,038
30. Accounting (Old) 17,870 88.44 2,284 11.30 51 0.25 20,205
31. Business statistics 888 78.58 230 20.35 12 1.06 1,130
32.Business Studies (New) 34,074 85.80 5,311 13.37 330 0.83 39,715
33.Accounting (New) 34,377 85.82 5,345 13.34 334 0.83 40,056
41. Buddhism 254 92.70 - - 20 7.30 274
42. Hinduism - - 1,214 100.00 - - 1,214
43. Christianity 890 36.73 1,528 63.06 5 0.21 2,423
44. Islam 46 0.99 4,602 98.82 9 0.19 4,657
45. Buddhist Civilization 28,376 100.00 - - 1 0.00 28,377
G.C.E.(A.L.) Examination - 2006
Number of Candidates Sat for Each Subject - All Candidates
Subject Sinhala % Tamil % English % Total
46. Hindu Civilization - - 5,683 100.00 - - 5,683
47. Islam Civilization 1 0.13 780 99.87 - - 781
48. Greek & Roman Civilization 85 59.86 5 3.52 52 36.62 142
51. Art 1,532 80.59 367 19.31 2 0.11 1,901
52. Dancing (S) 3,529 100.00 - - - - 3,529
53. Dancing (B) 1 0.38 264 99.62 - - 265
54. Oriental Music 1,815 100.00 - - - - 1,815
55. Carnatic Music - - 519 100.00 - - 519
56. Western Music 21 72.41 - - 8 27.59 29
57. Drama & Theatre(S) 1,779 100.00 - - - - 1,779
58. Drama & Theatre(T) - - 1,181 100.00 - - 1,181
59. Drama & Theatre(E) 1 20.00 - - 4 80.00 5
71. Sinhala 58,197 100.00 1 0.00 1 0.00 58,199
72. Tamil 3 0.02 14,823 99.98 - - 14,826
73. English 762 78.80 50 5.17 155 16.03 967
74. Pali 537 96.58 - - 19 3.42 556
75. Sanskrit 234 86.35 20 7.38 17 6.27 271
78. Arabic 3 0.56 532 98.52 5 0.93 540
81. French 393 89.93 10 2.29 34 7.78 437
82. German 14 77.78 - - 4 22.22 18
83. Russian 5 100.00 - - - - 5
84. Hindi 66 94.29 - - 4 5.71 70
85. Urdu - - 4 100.00 - - 4
86. Chinese 3 100.00 - - - - 3
87. Japanese 468 99.57 1 0.21 1 0.21 470
Number of Candidates Sat for Each Subject - All Candidates
G.C.E.(A.L.) Examination - 2006
- 75 -

- 78 -
Subject Sinhala % Tamil % English % Total01. Physics 48,121 86.46 7,131 12.81 405 0.73 55,657
02. Chemistry 52,266 87.33 7,180 12.00 404 0.68 59,850
07. Mathematics 10 19.23 39 75.00 3 5.77 52
08. Agricultural Science 5,356 92.50 433 7.48 1 0.02 5,790
09. Biology 31,664 87.26 4,408 12.15 215 0.59 36,287
10. Combined Mathematics 20,869 87.29 2,837 11.87 203 0.85 23,909
11. Higher Mathematics 4 66.67 2 33.33 - - 6
12. Common General Test 163,018 83.91 30,299 15.60 966 0.50 194,283
13. General English 148,331 82.80 28,916 16.14 1,903 1.06 179,150
14.Civil Technology 90 94.74 5 5.26 - - 95
15.Mechanical Technology 81 87.10 12 12.90 - - 93
16.Elect.& Info Technology 62 98.41 1 1.59 - - 63
17.Food Technology 23 69.70 10 30.30 - - 33
18.Agro Technology 14 100.00 - - - - 14
19.Bio Resource Technology 132 100.00 - - - - 132
21. Economics 67,605 88.50 8,268 10.82 515 0.67 76,388
22. Geography 12,851 67.02 6,321 32.96 3 0.02 19,175
23. E.Political Science 35,911 84.27 6,699 15.72 3 0.01 42,613
24. Logic & Sciencetific Method 11,661 68.15 5,415 31.64 36 0.21 17,112
25A. Indian History 7,596 98.48 117 1.52 - - 7,713
25B. European History 1,115 73.74 382 25.26 15 0.99 1,512
28. Home Economics 1,582 71.62 626 28.34 1 0.05 2,209
29. Business Studies (Old) 2,519 86.62 375 12.90 14 0.48 2,908
30. Accounting (Old) 2,555 88.26 330 11.40 10 0.35 2,895
31. Business statistics 836 78.20 200 18.71 33 3.09 1,069
32.Business Studies (New) 47,761 88.13 5,985 11.04 450 0.83 54,196
33.Accounting (New) 48,186 88.18 6,013 11.00 448 0.82 54,647
41. Buddhism 363 98.11 - - 7 1.89 370
42. Hinduism 1 0.11 877 99.89 - - 878
G.C.E.(A.L.) Examination - 2007
Number of Candidates Sat for Each Subject - All Candidates
Subject Sinhala % Tamil % English % Total43. Christianity 1,018 43.06 1,342 56.77 4 0.17 2,364
44. Islam 33 0.65 5,008 99.19 8 0.16 5,049
45. Buddhist Civilization 29,235 100.00 - - 1 0.00 29,236
46. Hindu Civilization - - 4,915 100.00 - - 4,915
47. Islam Civilization 13 1.41 909 98.38 2 0.22 924
48. Greek & Roman Civilization 96 58.18 5 3.03 64 38.79 165
51. Art 1,780 78.31 489 21.51 4 0.18 2,273
52. Dancing (S) 4,428 100.00 - - - - 4,428
53. Dancing (B) 1 0.46 217 99.54 - - 218
54. Oriental Music 1,833 100.00 - - - - 1,833
55. Carnatic Music - - 328 100.00 - - 328
56. Western Music 25 67.57 - - 12 32.43 37
57. Drama & Theatre(S) 2,345 100.00 - - - - 2,345
58. Drama & Theatre(T) - - 1,473 100.00 - - 1,473
59. Drama & Theatre(E) 1 25.00 - - 3 75.00 4
71. Sinhala 61,298 100.00 1 0.00 2 0.00 61,301
72. Tamil 3 0.02 14,206 99.98 - - 14,209
73. English 889 80.16 48 4.33 172 15.51 1,109
74. Pali 571 98.96 - - 6 1.04 577
75. Sanskrit 299 95.83 9 2.88 4 1.28 312
78. Arabic 6 0.94 623 97.65 9 1.41 638
79. Malay - - - - 1 100.00 1
81. French 435 87.17 5 1.00 59 11.82 499
82. German 16 76.19 - - 5 23.81 21
83. Russian 11 100.00 - - - - 11
84. Hindi 106 95.50 - - 5 4.50 111
85. Urdu - - 12 100.00 - - 12
86. Chinese 7 77.78 - - 2 22.22 9
87. Japanese 569 99.48 - - 3 0.52 572
G.C.E.(A.L.) Examination - 2007
Number of Candidates Sat for Each Subject - All Candidates
- 77 -

- 80 -
Subject No.Sat A % B % C % S % A+B+C+S % F %
46. Hindu Civilization 5,849 482 8.24 1,313 22.45 2,026 34.64 1,355 23.17 5,176 88.49 673 11.51
47. Islam Civilization 664 79 11.90 124 18.67 218 32.83 191 28.77 612 92.17 52 7.83
48. Greek & Roman Civilization 106 20 18.87 19 17.92 34 32.08 17 16.04 90 84.91 16 15.09
51. Art 1,778 177 9.96 303 17.04 577 32.45 496 27.90 1,553 87.35 225 12.65
52. Dancing (S) 3,713 619 16.67 1,001 26.96 1,204 32.43 454 12.23 3,278 88.28 435 11.72
53. Dancing (B) 280 17 6.07 43 15.36 99 35.36 66 23.57 225 80.36 55 19.64
54. Oriental Music 2,038 365 17.91 416 20.41 556 27.28 315 15.46 1,652 81.06 386 18.94
55. Carnatic Music 548 57 10.40 123 22.45 214 39.05 76 13.87 470 85.77 78 14.23
56. Western Music 33 6 18.18 3 9.09 10 30.30 5 15.15 24 72.73 9 27.27
57. Drama & Theatre(S) 1,897 220 11.60 432 22.77 576 30.36 454 23.93 1,682 88.67 215 11.33
58. Drama & Theatre(T) 894 55 6.15 224 25.06 332 37.14 231 25.84 842 94.18 52 5.82
59. Drama & Theatre(E) 1 - - 1 100.00 - - - - 1 100.00 - -
71. Sinhala 61,695 10,930 17.72 16,919 27.42 20,478 33.19 10,441 16.92 58,768 95.26 2,927 4.74
72. Tamil 14,349 632 4.40 1,974 13.76 4,707 32.80 4,598 32.04 11,911 83.01 2,438 16.99
73. English 966 11 1.14 36 3.73 98 10.14 266 27.54 411 42.55 555 57.45
74. Pali 527 21 3.98 61 11.57 151 28.65 190 36.05 423 80.27 104 19.73
75. Sanskrit 296 62 20.95 54 18.24 72 24.32 69 23.31 257 86.82 39 13.18
78. Arabic 504 137 27.18 204 40.48 111 22.02 42 8.33 494 98.02 10 1.98
79. Malay 3 3 100.00 - - - - - - 3 100.00 - -
81. French 350 7 2.00 22 6.29 93 26.57 138 39.43 260 74.29 90 25.71
82. German 20 4 20.00 3 15.00 4 20.00 4 20.00 15 75.00 5 25.00
83. Russian 6 3 50.00 2 33.33 1 16.67 - - 6 100.00 - -
84. Hindi 81 10 12.35 21 25.93 24 29.63 14 17.28 69 85.19 12 14.81
85. Urdu 1 - - - - 1 100.00 - - 1 100.00 - -
86. Chinese 3 1 33.33 - - 1 33.33 1 33.33 3 100.00 - -
87. Japanese 408 26 6.37 40 9.80 89 21.81 100 24.51 255 62.50 153 37.50
G.C.E.(A.L.) Examination - 2005 Results by Grades in Each Subject - All Candidates
- 79 -
Subject No.Sat A % B % C % S % A+B+C+S % F %
01. Physics 57,022 1,663 2.92 3,488 6.12 10,085 17.69 18,284 32.06 33,520 58.78 23,502 41.22
02. Chemistry 60,647 1,970 3.25 5,053 8.33 10,813 17.83 18,599 30.67 36,435 60.08 24,212 39.92
07. Mathematics 24 - - - - 4 16.67 5 20.83 9 37.50 15 62.50
08. Agriculture Science 4,738 126 2.66 810 17.10 1,934 40.82 1,316 27.78 4,186 88.35 552 11.65
09. Biology 35,626 1,820 5.11 4,329 12.15 10,353 29.06 11,279 31.66 27,781 77.98 7,845 22.02
10. Combined Mathematics 25,484 1,156 4.54 1,615 6.34 4,358 17.10 6,341 24.88 13,470 52.86 12,014 47.14
11. Higher Mathematics 21 - - 2 9.52 6 28.57 5 23.81 13 61.90 8 38.10
13. General English 180,259 3,968 2.20 5,019 2.78 13,170 7.31 22,602 12.54 44,759 24.83 135,500 75.17
21. Economics 82,029 4,010 4.89 9,275 11.31 21,879 26.67 29,759 36.28 64,923 79.15 17,106 20.85
22. Geography 20,104 695 3.46 2,823 14.04 7,738 38.49 6,584 32.75 17,840 88.74 2,264 11.26
23. E.Political Science 39,628 1,816 4.58 5,464 13.79 10,649 26.87 12,662 31.95 30,591 77.20 9,037 22.80
24. Logic & Scientific Method 17,038 2,703 15.86 2,653 15.57 3,917 22.99 3,688 21.65 12,961 76.07 4,077 23.93
25A. Indian History 6,332 958 15.13 1,248 19.71 1,743 27.53 1,666 26.31 5,615 88.68 717 11.32
25B. European History 1,306 200 15.31 242 18.53 345 26.42 320 24.50 1,107 84.76 199 15.24
28. Home Economics 2,684 59 2.20 397 14.79 1,170 43.59 96 3.58 1,722 64.16 962 35.84
29. Business Studies (old) 58,774 6,186 10.53 10,676 18.16 18,652 31.74 15,263 25.97 50,777 86.39 7,997 13.61
30. Accounting (old) 59,116 5,379 9.10 7,105 12.02 12,557 21.24 14,169 23.97 39,210 66.33 19,906 33.67
31. Business statistics 1,073 170 15.84 168 15.66 282 26.28 277 25.82 897 83.60 176 16.40
41. Buddhism 203 25 12.32 44 21.67 87 42.86 40 19.70 196 96.55 7 3.45
42. Hinduism 1,466 142 9.69 309 21.08 472 32.20 397 27.08 1,320 90.04 146 9.96
43. Christianity 2,366 472 19.95 692 29.25 811 34.28 362 15.30 2,337 98.77 29 1.23
44. Islam 4,729 499 10.55 1,313 27.76 1,804 38.15 874 18.48 4,490 94.95 239 5.05
45. Buddhist Civilization 30,150 2,697 8.95 4,945 16.40 10,760 35.69 7,374 24.46 25,776 85.49 4,374 14.51
G.C.E.(A.L.) Examination - 2005Results by Grades in Each Subject - All Candidates

- 82 -
- 81 -
Subject No.Sat A % B % C % S % A+B+C+S % F %
01. Physics 56,620 1,666 2.94 3,242 5.73 10,678 18.86 18,008 31.81 33,594 59.33 23,026 40.67
02. Chemistry 60,160 1,740 2.89 3,520 5.85 10,283 17.09 16,845 28.00 32,388 53.84 27,772 46.16
07. Mathematics 32 - - - - 6 18.75 7 21.88 13 40.63 19 59.38
08. Agricultural Science 4,682 143 3.05 833 17.79 2,108 45.02 1,075 22.96 4,159 88.83 523 11.17
09. Biology 35,514 1,670 4.70 4,620 13.01 10,342 29.12 11,332 31.91 27,964 78.74 7,550 21.26
10. Combined Mathematics 25,061 1,291 5.15 1,833 7.31 4,702 18.76 5,660 22.58 13,486 53.81 11,575 46.19
11. Higher Mathematics 10 2 20.00 - - - - 2 20.00 4 40.00 6 60.00
13. General English 178,715 3,366 1.88 4,645 2.60 13,165 7.37 23,810 13.32 44,986 25.17 133,729 74.83
21. Economics 79,790 4,106 5.15 8,287 10.39 19,629 24.60 26,340 33.01 58,362 73.14 21,428 26.86
22. Geography 19,989 573 2.87 2,303 11.52 8,253 41.29 6,623 33.13 17,752 88.81 2,237 11.19
23. E.Political Science 39,609 4,909 12.39 3,765 9.51 11,831 29.87 12,672 31.99 33,177 83.76 6,432 16.24
24. Logic & Scientific Method 16,151 1,608 9.96 2,398 14.85 3,282 20.32 4,241 26.26 11,529 71.38 4,622 28.62
25A. Indian History 7,064 845 11.96 1,347 19.07 1,956 27.69 1,921 27.19 6,069 85.91 995 14.09
25B. European History 1,297 137 10.56 272 20.97 366 28.22 334 25.75 1,109 85.51 188 14.49
28. Home Economics 2,639 66 2.50 424 16.07 1,231 46.65 22 0.83 1,743 66.05 896 33.95
29. Business Studies (Old) 20,038 2,807 14.01 3,836 19.14 6,120 30.54 5,311 26.50 18,074 90.20 1,964 9.80
30. Accounting (Old) 20,205 2,166 10.72 3,074 15.21 4,810 23.81 5,277 26.12 15,327 75.86 4,878 24.14
31. Business statistics 1,130 300 26.55 203 17.96 232 20.53 255 22.57 990 87.61 140 12.39
32. Business Studies (New) 39,715 4,121 10.38 5,763 14.51 12,885 32.44 12,001 30.22 34,770 87.55 4,945 12.45
33. Accounting (New) 40,055 4,167 10.40 4,189 10.46 9,165 22.88 10,704 26.72 28,225 70.47 11,830 29.53
41. Buddhism 274 35 12.77 54 19.71 117 42.70 56 20.44 262 95.62 12 4.38
42. Hinduism 1,214 173 14.25 287 23.64 362 29.82 283 23.31 1,105 91.02 109 8.98
43. Christianity 2,423 487 20.10 691 28.52 852 35.16 297 12.26 2,327 96.04 96 3.96
44. Islam 4,657 515 11.06 1,262 27.10 1,822 39.12 813 17.46 4,412 94.74 245 5.26
45. Buddhist Civilization 28,377 3,103 10.93 5,052 17.80 8,746 30.82 7,876 27.75 24,777 87.31 3,600 12.69
G.C.E.(A.L.) Examination - 2006Results by Grades in Each Subject - All Candidates
Subject No.Sat A % B % C % S % A+B+C+S % F %
46. Hindu Civilization 5,683 453 7.97 1,205 21.20 1,931 33.98 1,447 25.46 5,036 88.62 647 11.38
47. Islam Civilization 781 86 11.01 189 24.20 231 29.58 229 29.32 735 94.11 46 5.89
48. Greek & Roman Civilization 142 28 19.72 27 19.01 39 27.46 29 20.42 123 86.62 19 13.38
51. Art 1,901 211 11.10 374 19.67 642 33.77 525 27.62 1,752 92.16 149 7.84
52. Dancing (S) 3,529 574 16.27 1,015 28.76 1,110 31.45 381 10.80 3,080 87.28 449 12.72
53. Dancing (B) 265 18 6.79 53 20.00 106 40.00 39 14.72 216 81.51 49 18.49
54. Oriental Music 1,815 275 15.15 348 19.17 461 25.40 317 17.47 1,401 77.19 415 22.87
55. Carnatic Music 519 52 10.02 115 22.16 195 37.57 75 14.45 437 84.20 82 15.80
56. Western Music 29 9 31.03 7 24.14 6 20.69 5 17.24 27 93.10 2 6.90
57. Drama & Theatre(S) 1,779 297 16.69 432 24.28 519 29.17 356 20.01 1,604 90.16 175 9.84
58. Drama & Theatre(T) 1,181 155 13.12 398 33.70 465 39.37 139 11.77 1,157 97.97 24 2.03
59. Drama & Theatre(E) 5 1 20.00 2 40.00 2 40.00 - - 5 100.00 - -
71. Sinhala 58,199 8,190 14.07 14,989 25.75 20,633 35.45 11,166 19.19 54,978 94.47 3,221 5.53
72. Tamil 14,826 1,476 9.96 2,904 19.59 4,840 32.65 3,766 25.40 12,986 87.59 1,840 12.41
73. English 967 9 0.93 26 2.69 124 12.82 322 33.30 481 49.74 486 50.26
74. Pali 556 47 8.45 90 16.19 165 29.68 139 25.00 441 79.32 115 20.68
75. Sanskrit 271 53 19.56 43 15.87 57 21.03 70 25.83 223 82.29 48 17.71
78. Arabic 540 89 16.48 257 47.59 128 23.70 58 10.74 532 98.52 8 1.48
81. French 437 36 8.24 52 11.90 122 27.92 121 27.69 331 75.74 106 24.26
82. German 18 3 16.67 2 11.11 5 27.78 4 22.22 14 77.78 4 22.22
83. Russian 5 1 20.00 1 20.00 2 40.00 - - 4 80.00 1 20.00
84. Hindi 70 12 17.14 16 22.86 18 25.71 11 15.71 57 81.43 13 18.57
85. Urdu 4 3 75.00 1 25.00 - - - - 4 100.00 - -
86. Chinese 3 1 33.33 1 33.33 - - 1 33.33 3 100.00 - -
87. Japanese 470 30 6.38 44 9.36 75 15.96 102 21.70 251 53.40 219 46.60
Results by Grades in Each Subject - All Candidates G.C.E.(A.L.) Examination - 2006

- 84 -
Subject No.Sat A % B % C % S % A+B+C+S % F %
01. Physics 55,657 1,777 3.19 3,513 6.31 11,130 20.00 17,300 31.08 33,720 60.59 21,937 39.41
02. Chemistry 59,850 1,619 2.71 3,712 6.20 9,686 16.18 17,766 29.68 32,783 54.78 27,067 45.22
07. Mathematics 52 1 1.92 - - 6 11.54 14 26.92 21 40.38 31 59.62
08. Agricultural Science 5,790 356 6.15 1,439 24.85 2,482 42.87 1,147 19.81 5,424 93.68 366 6.32
09. Biology 36,291 1,242 3.42 4,530 12.48 11,044 30.43 11,841 32.63 28,657 78.96 7,634 21.04
10. Combined Mathematics 23,909 719 3.01 1,308 5.47 3,727 15.59 6,135 25.66 11,889 49.73 12,020 50.27
11. Higher Mathematics 6 - - - - - - 1 16.67 1 16.67 5 83.33
13. General English 179,150 4,748 2.65 6,324 3.53 16,696 9.32 27,311 15.24 55,079 30.74 124,071 69.26
14. Civil Technology 95 - - 7 7.37 52 54.74 34 35.79 93 97.89 2 2.11
15. Mechanical Technology 93 1 1.08 8 8.60 53 56.99 30 32.26 92 98.92 1 1.08
16. Elect. Info Technology 63 - - 5 7.94 27 42.86 30 47.62 62 98.41 1 1.59
17. Food Technology 33 - - 5 15.15 17 51.52 7 21.21 29 87.88 4 12.12
18. Agro Technology 14 1 7.14 2 14.29 4 28.57 7 50.00 14 100.00 - -
19. Bio Resource Technology 132 1 0.76 8 6.06 58 43.94 60 45.45 127 96.21 5 3.79
21. Economics 76,388 6,208 8.13 8,789 11.51 18,791 24.60 24,357 31.89 58,145 76.12 18,243 23.88
22. Geography 19,175 556 2.90 2,317 12.08 7,632 39.80 6,696 34.92 17,202 89.71 1,974 10.29
23. E.Political Science 42,613 2,675 6.28 5,720 13.42 11,102 26.05 13,106 30.76 32,603 76.51 10,010 23.49
24. Logic & Scientific Method 17,112 2,587 15.12 3,275 19.14 4,580 26.76 3,642 21.28 14,084 82.30 3,028 17.70
25A. Indian History 7,713 907 11.76 1,504 19.50 2,081 26.98 2,089 27.08 6,581 85.32 1,132 14.68
25B. European History 1,512 163 10.78 285 18.85 442 29.23 417 27.58 1,307 86.44 205 13.56
28. Home Economics 2,209 47 2.13 466 21.10 1,259 56.99 37 1.67 1,809 81.89 400 18.11
29. Business Studies (Old) 2,908 460 15.82 550 18.91 771 26.51 810 27.85 2,591 89.10 317 10.90
30. Accounting (Old) 2,895 94 3.25 357 12.33 595 20.55 656 22.66 1,702 58.79 1,193 41.21
31. Business statistics 1,069 275 25.72 246 23.01 198 18.52 209 19.55 928 86.81 141 13.19
32. Business Studies (New) 54,196 5,242 9.67 7,581 13.99 18,184 33.55 16,302 30.08 47,309 87.29 6,887 12.71
33. Accounting (New) 54,647 4,820 8.82 6,696 12.25 12,922 23.65 14,008 25.63 38,446 70.35 16,201 29.65
41. Buddhism 370 32 8.65 72 19.46 168 45.41 74 20.00 346 93.51 24 6.49
42. Hinduism 878 171 19.48 239 27.22 268 30.52 151 17.20 829 94.42 49 5.58
G.C.E.(A.L.) Examination - 2007Results by Grades in Each Subject - All Candidates
Subject No.Sat A % B % C % S % A+B+C+S % F %
43. Christianity 2,364 738 31.22 532 22.50 702 29.70 367 15.52 2,339 98.94 25 1.06
44. Islam 5,049 679 13.45 1,286 25.47 1,992 39.45 890 17.63 4,847 96.00 202 4.00
45. Buddhist Civilization 29,236 2,903 9.93 5,270 18.03 9,757 33.37 8,342 28.53 26,272 89.86 2,964 10.14
46. Hindu Civilization 4,915 484 9.85 1,316 26.78 1,721 35.02 1,007 20.49 4,528 92.13 387 7.87
47. Islam Civilization 924 106 11.47 220 23.81 272 29.44 222 24.03 820 88.74 104 11.26
48. Greek & Roman Civilization 165 29 17.58 37 22.42 47 28.48 36 21.82 149 90.30 16 9.70
51. Art 2,273 224 9.85 374 16.45 778 34.23 657 28.90 2,033 89.44 240 10.56
52. Dancing (S) 4,428 914 20.64 1,200 27.10 1,323 29.88 413 9.33 3,850 86.95 578 13.05
53. Dancing (B) 218 13 5.96 40 18.35 100 45.87 36 16.51 189 86.70 29 13.30
54. Oriental Music 1,833 361 19.69 371 20.24 520 28.37 247 13.48 1,499 81.78 334 18.22
55. Carnatic Music 328 26 7.93 71 21.65 123 37.50 55 16.77 275 83.84 53 16.16
56. Western Music 37 10 27.03 13 35.14 6 16.22 1 2.70 30 81.08 7 18.92
57. Drama & Theatre(S) 2,345 385 16.42 712 30.36 711 30.32 417 17.78 2,225 94.88 120 5.12
58. Drama & Theatre(T) 1,473 138 9.37 473 32.11 601 40.80 232 15.75 1,444 98.03 29 1.97
59. Drama & Theatre(E) 4 2 50.00 - - 1 25.00 - - 1 25.00 3 75.00
71. Sinhala 61,301 5,970 9.74 14,689 23.96 24,384 39.78 11,137 18.17 56,180 91.65 5,121 8.35
72. Tamil 14,209 725 5.10 2,510 17.66 5,157 36.29 3,384 23.82 11,776 82.88 2,433 17.12
73. English 1,109 6 0.54 24 2.16 97 8.75 354 31.92 481 43.37 628 56.63
74. Pali 577 33 5.72 83 14.38 175 30.33 191 33.10 482 83.54 95 16.46
75. Sanskrit 312 47 15.06 50 16.03 106 33.97 72 23.08 275 88.14 37 11.86
78. Arabic 638 177 27.74 243 38.09 133 20.85 78 12.23 631 98.90 7 1.10
79. Malay 1 1 100.00 - - - - - - 1 100.00 - -
81. French 499 38 7.62 76 15.23 119 23.85 115 23.05 348 69.74 151 30.26
82. German 21 5 23.81 3 14.29 6 28.57 5 23.81 19 90.48 2 9.52
83. Russian 11 4 36.36 5 45.45 2 18.18 - - 11 100.00 - -
84. Hindi 111 16 14.41 16 14.41 32 28.83 26 23.42 90 81.08 21 18.92
85. Urdu 12 4 33.33 2 16.67 4 33.33 - - 10 83.33 2 16.67
86. Chinese 9 6 66.67 1 11.11 1 11.11 - - 8 88.89 1 11.11
87. Japanese 572 63 11.01 53 9.27 71 12.41 117 20.45 304 53.15 268 46.85
Results by Grades in Each Subject - All Candidates G.C.E.(A.L.) Examination - 2007
- 83 -

- 86 -
Subject No.Sat A % B % C % S % A+B+C+S % F %
01. Physics 46,153 1,420 3.08 2,669 5.78 7,685 16.65 14,535 31.49 26,309 57.00 19,844 43.00
02. Chemistry 49,020 1,601 3.27 3,791 7.73 8,390 17.12 14,887 30.37 28,669 58.48 20,351 41.52
07. Mathematics 17 - - - - 3 17.65 2 11.76 5 29.41 12 70.59
08. Agriculture Science 3,602 90 2.50 603 16.74 1,456 40.42 1,049 29.12 3,198 88.78 404 11.22
09. Biology 28,540 1,364 4.78 3,121 10.94 8,018 28.09 9,281 32.52 21,784 76.33 6,756 23.67
10. Combined Mathematics 20,737 1,009 4.87 1,295 6.24 3,344 16.13 4,965 23.94 10,613 51.18 10,124 48.82
11. Higher Mathematics 11 - - 2 18.18 4 36.36 2 18.18 8 72.73 3 27.27
13. General English 157,363 3,396 2.16 4,354 2.77 11,056 7.03 18,897 12.01 37,703 23.96 119,660 76.04
21. Economics 74,709 3,665 4.91 8,473 11.34 20,186 27.02 27,341 36.60 59,665 79.86 15,044 20.14
22. Geography 17,654 625 3.54 2,559 14.50 6,976 39.52 5,715 32.37 15,875 89.92 1,779 10.08
23. E.Political Science 33,634 1,635 4.86 4,770 14.18 9,350 27.80 10,782 32.06 26,537 78.90 7,097 21.10
24. Logic & Scientific Method 13,899 2,364 17.01 2,258 16.25 3,235 23.28 2,985 21.48 10,842 78.01 3,057 21.99
25A. Indian History 5,357 836 15.61 1,101 20.55 1,501 28.02 1,379 25.74 4,817 89.92 540 10.08
25B. European History 1,088 173 15.90 200 18.38 299 27.48 268 24.63 940 86.40 148 13.60
28. Home Economics 2,236 46 2.06 335 14.98 1,012 45.26 86 3.85 1,479 66.14 757 33.86
29. Business Studies 53,803 5,757 10.70 9,791 18.20 17,260 32.08 13,948 25.92 46,756 86.90 7,047 13.10
30. Accounting 54,065 4,961 9.18 6,466 11.96 11,556 21.37 13,004 24.05 35,987 66.56 18,078 33.44
31. Business statistics 874 144 16.48 146 16.70 227 25.97 228 26.09 745 85.24 129 14.76
41. Buddhism 126 20 15.87 29 23.02 60 47.62 16 12.70 125 99.21 1 0.79
42. Hinduism 968 108 11.16 243 25.10 320 33.06 221 22.83 892 92.15 76 7.85
43. Christianity 1,854 409 22.06 577 31.12 624 33.66 231 12.46 1,841 99.30 13 0.70
44. Islam 3,461 417 12.05 1,049 30.31 1,347 38.92 531 15.34 3,344 96.62 117 3.38
45. Buddhist Civilization 25,367 2,281 8.99 4,213 16.61 9,213 36.32 6,187 24.39 21,894 86.31 3,473 13.69
G.C.E.(A.L.) Examination - 2005Results by Grades in Each Subject - School Candidates
Subject No.Sat A % B % C % S % A+B+C+S % F %
46. Hindu Civilization 4,695 443 9.44 1,158 24.66 1,668 35.53 999 21.28 4,268 90.91 427 9.09
47. Islamic Civilization 513 72 14.04 110 21.44 173 33.72 135 26.32 490 95.52 23 4.48
48. Greek & Roman Civilization 95 20 21.05 18 18.95 30 31.58 13 13.68 81 85.26 14 14.74
51. Art 1,447 154 10.64 265 18.31 482 33.31 405 27.99 1,306 90.26 141 9.74
52. Dancing (Sinhala) 3,166 545 17.21 871 27.51 1,038 32.79 376 11.88 2,830 89.39 336 10.61
53. Dancing (Baratha) 219 16 7.31 32 14.61 83 37.90 56 25.57 187 85.39 32 14.61
54. Oriental Music 1,713 316 18.45 351 20.49 473 27.61 264 15.41 1,404 81.96 309 18.04
55. Carnatic Music 459 55 11.98 105 22.88 188 40.96 64 13.94 412 89.76 47 10.24
56. Western Music 21 6 28.57 3 14.29 6 28.57 2 9.52 17 80.95 4 19.05
57. Drama & Theatre (Sinhala) 1,565 196 12.52 367 23.45 477 30.48 358 22.88 1,398 89.33 167 10.67
58. Drama & Theatre(Tamil) 644 40 6.21 171 26.55 253 39.29 151 23.45 615 95.50 29 4.50
59. Drama & Theatre(English) 1 - - 1 100.00 - - - - 1 100.00 - -
71. Sinhala 53,396 9,587 17.95 14,909 27.92 17,913 33.55 8,634 16.17 51,043 95.59 2,353 4.41
72. Tamil 11,391 594 5.21 1,804 15.84 4,056 35.61 3,486 30.60 9,940 87.26 1,451 12.74
73. English 686 11 1.60 36 5.25 90 13.12 213 31.05 350 51.02 336 48.98
74. Pali 432 16 3.70 55 12.73 131 30.32 152 35.19 354 81.94 78 18.06
75. Sanskrit 250 54 21.60 45 18.00 65 26.00 54 21.60 218 87.20 32 12.80
78. Arabic 163 70 42.94 63 38.65 26 15.95 4 2.45 163 100.00 - -
81. French 308 7 2.27 21 6.82 86 27.92 119 38.64 233 75.65 75 24.35
82. German 10 2 20.00 - - 2 20.00 2 20.00 6 60.00 4 40.00
83. Russian 5 2 40.00 2 40.00 1 20.00 - - 5 100.00 - -
84. Hindi 56 2 3.57 15 26.79 17 30.36 11 19.64 45 80.36 11 19.64
87. Japanese 348 23 6.61 36 10.34 82 23.56 87 25.00 228 65.52 120 34.48
G.C.E.(A.L.) Examination - 2005Results by Grades in Each Subject - School Candidates
- 85 -

- 88 -
Subject No.Sat A % B % C % S % A+B+C+S % F %
01. Physics 46,515 1,401 3.01 2,557 5.50 8,244 17.72 14,485 31.14 26,687 57.37 19,828 42.63
02. Chemistry 49,038 1,425 2.91 2,630 5.36 7,884 16.08 13,456 27.44 25,395 51.79 23,643 48.21
07. Mathematics 25 - - - - 6 24.00 5 20.00 11 44.00 14 56.00
08. Agriculture Science 3,324 88 2.65 545 16.40 1,481 44.55 810 24.37 2,924 87.97 400 12.03
09. Biology 27,875 1,239 4.44 3,351 12.02 7,787 27.94 9,136 32.77 21,513 77.18 6,362 22.82
10. Combined Mathematics 21,399 1,094 5.11 1,465 6.85 3,858 18.03 4,675 21.85 11,092 51.83 10,307 48.17
11. Higher Mathematics 4 2 50.00 - - - - 1 25.00 3 75.00 1 25.00
13. General English 156,673 2,965 1.89 3,987 2.54 11,038 7.05 19,836 12.66 37,826 24.14 118,847 75.86
21. Economics 72,467 3,691 5.09 7,383 10.19 17,966 24.79 24,248 33.46 53,288 73.53 19,179 26.47
22. Geography 17,372 501 2.88 2,041 11.75 7,341 42.26 5,775 33.24 15,658 90.13 1,714 9.87
23. E.Political Science 33,479 4,196 12.53 3,220 9.62 10,267 30.67 10,677 31.89 28,360 84.71 5,119 15.29
24. Logic & Scientific Method 13,447 1,420 10.56 2,038 15.16 2,827 21.02 3,555 26.44 9,840 73.18 3,607 26.82
25A. Indian History 5,981 716 11.97 1,188 19.86 1,698 28.39 1,632 27.29 5,234 87.51 747 12.49
25B. European History 1,067 118 11.06 220 20.62 312 29.24 268 25.12 918 86.04 149 13.96
28. Home Economics 2,232 59 2.64 371 16.62 1,085 48.61 16 0.72 1,531 68.59 701 31.41
29. Business Studies (Old) 16,022 2,169 13.54 3,130 19.54 5,048 31.51 4,296 26.81 14,643 91.39 1,379 8.61
30. Accounting (Old) 16,170 1,656 10.24 2,431 15.03 4,006 24.77 4,340 26.84 12,433 76.89 3,737 23.11
31. Business statistics 993 273 27.49 183 18.43 203 20.44 219 22.05 878 88.42 115 11.58
32. Business Studies (New) 38,794 4,079 10.51 5,674 14.63 12,667 32.65 11,712 30.19 34,132 87.98 4,662 12.02
33. Accounting (New) 39,169 4,127 10.54 4,140 10.57 9,023 23.04 10,499 26.80 27,789 70.95 11,380 29.05
41. Buddhism 177 28 15.82 44 24.86 76 42.94 26 14.69 174 98.31 3 1.69
42. Hinduism 910 160 17.58 243 26.70 280 30.77 179 19.67 862 94.73 48 5.27
43. Christianity 1,910 416 21.78 577 30.21 642 33.61 211 11.05 1,846 96.65 64 3.35
44. Islam 3,416 430 12.59 1,045 30.59 1,315 38.50 508 14.87 3,298 96.55 118 3.45
45. Buddhist Civilization 23,779 2,523 10.61 4,248 17.86 7,544 31.73 6,618 27.83 20,933 88.03 2,846 11.97
G.C.E.(A.L.) Examination - 2006Results by Grades in Each Subject - School Candidates
Subject No.Sat A % B % C % S % A+B+C+S % F %
46. Hindu Civilization 4,666 411 8.81 1,084 23.23 1,647 35.30 1,120 24.00 4,262 91.34 404 8.66
47. Islamic Civilization 571 67 11.73 140 24.52 183 32.05 157 27.50 547 95.80 24 4.20
48. Greek & Roman Civilization 124 26 20.97 25 20.16 33 26.61 24 19.35 108 87.10 16 12.90
51. Art 1,523 186 12.21 311 20.42 536 35.19 399 26.20 1,432 94.02 91 5.98
52. Dancing (Sinhala) 3,063 514 16.78 893 29.15 973 31.77 329 10.74 2,709 88.44 354 11.56
53. Dancing (Baratha) 217 16 7.37 49 22.58 90 41.47 28 12.90 183 84.33 34 15.67
54. Oriental Music 1,506 236 15.67 296 19.65 393 26.10 258 17.13 1,183 78.55 323 21.45
55. Carnatic Music 413 45 10.90 99 23.97 164 39.71 59 14.29 367 88.86 46 11.14
56. Western Music 16 6 37.50 7 43.75 2 12.50 1 6.25 16 100.00 - -
57. Drama & Theatre (Sinhala) 1,445 238 16.47 374 25.88 421 29.13 272 18.82 1,305 90.31 140 9.69
58. Drama & Theatre(Tamil) 884 130 14.71 323 36.54 330 37.33 86 9.73 869 98.30 15 1.70
59. Drama & Theatre(English) 2 - - 1 50.00 1 50.00 - - 2 100.00 - -
71. Sinhala 49,835 6,896 13.84 13,021 26.13 17,948 36.01 9,381 18.82 47,246 94.80 2,589 5.20
72. Tamil 12,093 1,370 11.33 2,606 21.55 4,190 34.65 2,902 24.00 11,068 91.52 1,025 8.48
73. English 742 8 1.08 24 3.23 115 15.50 272 36.66 419 56.47 323 43.53
74. Pali 462 45 9.74 84 18.18 138 29.87 106 22.94 373 80.74 89 19.26
75. Sanskrit 204 32 15.69 38 18.63 50 24.51 49 24.02 169 82.84 35 17.16
78. Arabic 147 18 12.24 97 65.99 29 19.73 3 2.04 147 100.00 - -
81. French 381 36 9.45 50 13.12 104 27.30 100 26.25 290 76.12 91 23.88
82. German 7 1 14.29 1 14.29 2 28.57 1 14.29 5 71.43 2 28.57
83. Russian 4 1 25.00 1 25.00 1 25.00 - - 3 75.00 1 25.00
84. Hindi 38 5 13.16 11 28.95 8 21.05 5 13.16 29 76.32 9 23.68
87. Japanese 395 26 6.58 38 9.62 63 15.95 84 21.27 211 53.42 184 46.58
G.C.E.(A.L.) Examination - 2006Results by Grades in Each Subject - School Candidates
- 87 -

- 90 -
Subject No.Sat A % B % C % S % A+B+C+S % F %
01. Physics 45,755 1,528 3.34 2,859 6.25 8,859 19.36 13,967 30.53 27,213 59.48 18,542 40.52
02. Chemistry 48,690 1,351 2.77 2,947 6.05 7,661 15.73 14,211 29.19 26,170 53.75 22,520 46.25
07. Mathematics 30 1 3.33 - - 4 13.33 11 36.67 16 53.33 14 46.67
08. Agriculture Science 4,024 239 5.94 955 23.73 1,692 42.05 872 21.67 3,758 93.39 266 6.61
09. Biology 28,724 976 3.40 3,407 11.86 8,480 29.52 9,418 32.79 22,281 77.57 6,443 22.43
10. Combined Mathematics 20,160 638 3.16 1,095 5.43 3,038 15.07 4,971 24.66 9,742 48.32 10,418 51.68
11. Higher Mathematics 1 - - - - - - - - - - 1 100.00
13. General English 155,657 4,212 2.71 5,412 3.48 13,952 8.96 22,775 14.63 46,351 29.78 109,306 70.22
14. Civil Technology 90 - - 7 7.78 50 55.56 31 34.44 88 97.78 2 2.22
15. Mechanical Technology 93 1 1.08 8 8.60 53 56.99 30 32.26 92 98.92 1 1.08
16. Elect. & Info Technology 62 - - 5 8.06 26 41.94 30 48.39 61 98.39 1 1.61
17. Food Technology 31 - - 5 16.13 16 51.61 7 22.58 28 90.32 3 9.68
18. Agro Technology 12 - - 2 16.67 4 33.33 6 50.00 12 100.00 - -
19. Bio Resource Technology 128 1 0.78 7 5.47 58 45.31 57 44.53 123 96.09 5 3.91
21. Economics 69,067 5,661 8.20 8,027 11.62 17,307 25.06 22,190 32.13 53,185 77.00 15,882 23.00
22. Geography 16,423 482 2.93 2,033 12.38 6,720 40.92 5,754 35.04 14,989 91.27 1,434 8.73
23. E.Political Science 35,453 2,308 6.51 4,954 13.97 9,553 26.95 10,912 30.78 27,727 78.21 7,726 21.79
24. Logic & Scientific Method 14,026 2,189 15.61 2,812 20.05 3,889 27.73 2,931 20.90 11,821 84.28 2,205 15.72
25A. Indian History 6,355 772 12.15 1,298 20.42 1,775 27.93 1,711 26.92 5,556 87.43 799 12.57
25B. European History 1,222 139 11.37 250 20.46 359 29.38 326 26.68 1,074 87.89 148 12.11
28. Home Economics 1,759 39 2.22 387 22.00 1,039 59.07 32 1.82 1,497 85.11 262 14.89
29. Business Studies (Old) 5 - - 1 20.00 4 80.00 - - 5 100.00 - -
30. Accounting (Old) 5 - - - - 1 20.00 3 60.00 4 80.00 1 20.00
31. Business statistics 910 254 27.91 221 24.29 171 18.79 164 18.02 810 89.01 100 10.99
32. Business Studies (New) 51,921 5,144 9.91 7,370 14.19 17,583 33.86 15,474 29.80 45,571 87.77 6,350 12.23
33. Accounting (New) 52,394 4,732 9.03 6,534 12.47 12,529 23.91 13,419 25.61 37,214 71.03 15,180 28.97
41. Buddhism 228 27 11.84 52 22.81 105 46.05 38 16.67 222 97.37 6 2.63
42. Hinduism 586 144 24.57 192 32.76 162 27.65 74 12.63 572 97.61 14 2.39
G.C.E.(A.L.) Examination - 2007Results by Grades in Each Subject - School Candidates
Subject No.Sat A % B % C % S % A+B+C+S % F %
43. Christianity 1,856 613 33.03 425 22.90 544 29.31 259 13.95 1,841 99.19 15 0.81
44. Islam 3,565 571 16.02 1,050 29.45 1,403 39.35 471 13.21 3,495 98.04 70 1.96
45. Buddhist Civilization 23,614 2,424 10.27 4,359 18.46 8,066 34.16 6,559 27.78 21,408 90.66 2,206 9.34
46. Hindu Civilization 3,955 430 10.87 1,175 29.71 1,423 35.98 727 18.38 3,755 94.94 200 5.06
47. Islamic Civilization 684 90 13.16 181 26.46 191 27.92 163 23.83 625 91.37 59 8.63
48. Greek & Roman Civilization 151 27 17.88 34 22.52 44 29.14 33 21.85 138 91.39 13 8.61
51. Art 1,780 200 11.24 315 17.70 656 36.85 481 27.02 1,652 92.81 128 7.19
52. Dancing (Sinhala) 3,821 815 21.33 1,065 27.87 1,180 30.88 349 9.13 3,409 89.22 412 10.78
53. Dancing (Baratha) 163 11 6.75 35 21.47 84 51.53 26 15.95 156 95.71 7 4.29
54. Oriental Music 1,544 313 20.27 329 21.31 445 28.82 208 13.47 1,295 83.87 249 16.13
55. Carnatic Music 241 22 9.13 62 25.73 95 39.42 36 14.94 215 89.21 26 10.79
56. Western Music 15 7 46.67 6 40.00 1 6.67 - - 14 93.33 1 6.67
57. Drama & Theatre (Sinhala) 1,876 330 17.59 586 31.24 542 28.89 329 17.54 1,787 95.26 89 4.74
58. Drama & Theatre(Tamil) 1,110 128 11.53 397 35.77 449 40.45 128 11.53 1,102 99.28 8 0.72
59. Drama & Theatre(English) 2 2 100.00 - - - - - - 2 100.00 - -
71. Sinhala 51,669 5,056 9.79 12,710 24.60 20,846 40.35 9,067 17.55 47,679 92.28 3,990 7.72
72. Tamil 11,489 689 6.00 2,286 19.90 4,447 38.71 2,626 22.86 10,048 87.46 1,441 12.54
73. English 860 6 0.70 21 2.44 87 10.12 306 35.58 420 48.84 440 51.16
74. Pali 418 25 5.98 71 16.99 133 31.82 139 33.25 368 88.04 50 11.96
75. Sanskrit 242 39 16.12 43 17.77 75 30.99 55 22.73 212 87.60 30 12.40
78. Arabic 165 64 38.79 77 46.67 14 8.48 10 6.06 165 100.00 - -
81. French 440 35 7.95 72 16.36 105 23.86 100 22.73 312 70.91 128 29.09
82. German 9 2 22.22 2 22.22 2 22.22 2 22.22 8 88.89 1 11.11
83. Russian 8 2 25.00 5 62.50 1 12.50 - - 8 100.00 - -
84. Hindi 77 12 15.58 12 15.58 18 23.38 19 24.68 61 79.22 16 20.78
87. Japanese 499 58 11.62 50 10.02 64 12.83 103 20.64 275 55.11 224 44.89
G.C.E.(A.L.) Examination - 2007Results by Grades in Each Subject - School Candidates
-89-

- 92 -
Male % Female % Total % Male % Female % Total %
Qualified for
University E.
1,951
135,055 196,929
173,731
1.69
Passed in 2
Passed in 1
Failed in All 7,454 6.45 19,904
3,229 1.86 1,584 1.80
242,344
51.60
85.52
3,535
88.22
10,728 14.14 6,113
No. Applied
No. Sat
Obtained 3 A's
Passed in 3
9,780 12.89 9,621
9.7716,841 9.69 12,450 14.126.25
12,112 10.49 23,449 9.83 19,401 11.17 11,337 12.86
17.14 36,457 17.90
11.51
60.08
14,659 19.33 16,414 16.77 31,073 17.89 16,666 18.90 19,791
1.90
39,908 52.62 65,545
1.741.82
66.96 105,453 60.70 46,598 52.84 75,779 65.61 122,377
115,500
107,289
73,268
75,848 88.97
65.09 59.20 45,502 102,854 63,714
88,188 82.20 84.05
58.31118,770 63.44
203,688
86,911 110,018
97,883
39,140
1,786 1,443
51.60
87.27
School Candidates All Candidates
G.C.E.(A.L.) Examination - 2005
Performance of Candidates
Description
Male % Female % Total % Male % Female % Total %
Qualified for
University E.
Passed in 1
Failed in All
24,255
10,693
13.55
14.38
16.66 34,436 16.33 29,375 17.05
No. Sat
Obtained 3 A's
Passed in 3
Passed in 2
9.816.45 17,004 9.87 12,124 14.12 7,624 6.60 19,748
17.10
12.0410.62 20,468 11.88 11,533 13.44 12,722 11.01
17.6915,980
10,394
6,311
75,533 64,949 66.36
19,248 15,188
104,389 60.6153.03
18.01
10,074
39,440
13,395
103,557 60.12 45,277
45,874
2.17 1,707 3,732 2.07
65.36 60.28
4,177
121,407 53.44
2.141.99 2,470 1,524 2.05 2,208 2.26
84.87 201,401
59.52
83.18
64.56 119,877 39,109 52.58 64,448 65.85 74,600 52.74
105,961
G.C.E.(A.L.) Examination - 2006
Performance of Candidates
No. Applied 86,765 110,866 197,631
School Candidates All CandidatesDescription
136,152 242,113
74,373 85.72 97,869 88.28 172,242 87.15 85,842 81.01 115,559
- 91 -

- 94 -
Male % Female % Total % Male % Female % Total %
Qualified for
University E.
Failed in All 11,244 15.41 5,522 5.68 16,766 9.85 12,911 15.18 6,917 5.95 19,828 9.85
2.23
77,069
3,858
Passed in 2
No. Sat
Passed in 3
13,018 17.84 15,738 16.20
Passed in 1
No. Applied
9.71
1,497
38,198 52.35 66,281 68.21
2.091,381 1.89 2,170
44,353
Obtained 3 A's
23,689 11.7719,303
3,551
9,871 13.53 9,432 10.3911.35 11,617 13.66 12,072
34,893
66.33 121,422 60.34
16.97 17.3428,756 16.90 15,176
104,479 61.41 44,353
17.85 19,717
61.41
52.16 77,069
1.921.76 2,361 2.03
86.93
38,198 52.35 66,281 68.21 104,479 66.33
201,229
60.34121,422 52.16
81,756 107,115 188,871 99,752
85.25 116,192 88.20
131,737 231,489
72,970 89.25 97,175 90.72 170,145 90.09 85,037
G.C.E.(A.L.) Examination - 2007
Performance of Candidates
School Candidates All CandidatesDescription
- 93 -
G.C.E. (A.L.) Examination 2005 - 2007
Percentage of Candidates Qualified for University Entrance
59.20 60.13 61.4158.31 59.52 60.34
0
10
20
30
40
50
60
70
2005 2006 2007
Year
Per
cen
tag
e
School Candidates All Candidates

- 96 -
No. % No. % No. % No. % No. % No. %1 Anuradhapura 6,571 3,671 55.87 57 0.87 3,760 57.22 1,246 18.96 845 12.86 678 10.32
2 Ampara 5,154 3,015 58.50 63 1.22 3,113 60.40 917 17.79 615 11.93 460 8.93
3 Badulla 7,570 4,366 57.68 89 1.18 4,502 59.47 1,361 17.98 911 12.03 757 10.00
4 Batticaloa 2,800 1,795 64.11 39 1.39 1,863 66.54 426 15.21 237 8.46 261 9.32
5 Colombo 22,603 13,026 57.63 733 3.24 13,202 58.41 4,194 18.56 2,603 11.52 2,484 10.99
6 Galle 11,124 6,811 61.23 376 3.38 6,932 62.32 1,882 16.92 1,134 10.19 1,104 9.92
7 Gampaha 14,836 8,107 54.64 211 1.42 8,282 55.82 2,891 19.49 1,799 12.13 1,775 11.96
8 Hambantota 5,974 3,383 56.63 113 1.89 3,449 57.73 1,096 18.35 683 11.43 698 11.68
9 Jaffna 6,909 4,300 62.24 84 1.22 4,508 65.25 946 13.69 664 9.61 761 11.01
10 Kandy 14,250 8,441 59.24 252 1.77 8,622 60.51 2,775 19.47 1,649 11.57 1,132 7.94
11 Kegalle 7,493 4,581 61.14 111 1.48 4,684 62.51 1,372 18.31 809 10.80 599 7.99
12 Kalutara 9,560 5,703 59.65 213 2.23 5,832 61.00 1,716 17.95 1,052 11.00 919 9.61
13 Kilinochchi 699 478 68.38 4 0.57 509 72.82 90 12.88 49 7.01 49 7.01
14 Kurunegala 16,149 9,864 61.08 322 1.99 10,106 62.58 2,978 18.44 1,763 10.92 1,228 7.60
15 Monaragala 3,037 1,667 54.89 26 0.86 1,725 56.80 607 19.99 387 12.74 291 9.58
16 Mannar 803 520 64.76 5 0.62 557 69.36 104 12.95 63 7.85 77 9.59
17 Matara 9,240 5,581 60.40 153 1.66 5,720 61.90 1,569 16.98 1,018 11.02 889 9.62
18 Matale 3,715 2,194 59.06 30 0.81 2,255 60.70 677 18.22 438 11.79 319 8.59
19 Mullaitivu 823 566 68.77 5 0.61 621 75.46 98 11.91 54 6.56 47 5.71
20 Nuwara Eliya 4,214 2,568 60.94 26 0.62 2,657 63.05 747 17.73 410 9.73 371 8.80
21 Puttalam 4,529 2,721 60.08 59 1.30 2,767 61.10 754 16.65 517 11.42 465 10.27
22 Polonnaruwa 2,859 1,532 53.59 32 1.12 1,577 55.16 567 19.83 363 12.70 334 11.68
23 Ratnapura 9,376 5,824 62.12 187 1.99 5,952 63.48 1,508 16.08 1,021 10.89 855 9.12
24 Trincomalee 2,301 1,406 61.10 21 0.91 1,486 64.58 391 16.99 215 9.34 185 8.04
25 Vavuniya 1,142 734 64.27 18 1.58 772 67.60 161 14.10 102 8.93 103 9.02
Island 173,731 102,854 59.20 3,229 1.86 105,453 60.70 31,073 17.89 19,401 11.17 16,841 9.69
* Percentages Calculated on Number Sat of each District
G.C.E. (A.L.) Examination - 2005
Performance of School Candidates by District
Qualified for U.E. Failed in All3 A's Passed in 2 Passed in 1District No. Sat
Passed in 3
- 95 -
0
10
20
30
40
50
60
70
80
90
Anu
radh
apur
a
Am
para
Bad
ulla
Bat
tical
oa
Col
ombo
Gal
le
Gam
paha
Ham
bant
ota
Jaffna
Kan
dy
Keg
alle
Kal
utar
a
Kili
noch
chi
Kur
uneg
ala
Mon
arag
ala
Man
nar
Mat
ara
Mat
ale
Mul
laiti
vu
Nuw
ara Eliy
a
Putta
lam
Polon
naru
wa
Rat
napu
ra
Trinco
mal
ee
Vavun
iya
Isla
nd
District
Per
cen
tag
e
G.C.E. (A.L.) Examination 2005
Percentage of School Candidates Qualified for University Entrance by District

- 98 -
- 97 -
No. % No. % No. % No. % No. % No. %1 Anuradhapura 6,387 3,659 57.29 104 1.63 3,693 57.82 1,171 18.33 814 12.74 641 10.04
2 Ampara 5,034 3,147 62.51 94 1.87 3,181 63.19 758 15.06 530 10.53 510 10.13
3 Badulla 7,648 4,359 57.00 105 1.37 4,399 57.52 1,414 18.49 990 12.94 804 10.51
4 Batticaloa 2,869 1,966 68.53 62 2.16 1,980 69.01 385 13.42 227 7.91 262 9.13
5 Colombo 22,425 12,921 57.62 766 3.42 13,005 57.99 3,729 16.63 2,931 13.07 2,637 11.76
6 Galle 10,956 6,886 62.85 418 3.82 6,930 63.25 1,771 16.16 1,103 10.07 1,092 9.97
7 Gampaha 14,977 8,102 54.10 236 1.58 8,168 54.54 2,813 18.78 2,080 13.89 1,812 12.10
8 Hambantota 5,943 3,365 56.62 119 2.00 3,393 57.09 1,092 18.37 806 13.56 607 10.21
9 Jaffna 6,890 4,606 66.85 100 1.45 4,673 67.82 970 14.08 568 8.24 648 9.40
10 Kandy 14,078 8,382 59.54 257 1.83 8,427 59.86 2,539 18.04 1,756 12.47 1,290 9.16
11 Kegalle 7,618 4,717 61.92 131 1.72 4,755 62.42 1,317 17.29 900 11.81 603 7.92
12 Kalutara 9,512 5,793 60.90 210 2.21 5,847 61.47 1,549 16.28 1,120 11.77 958 10.07
13 Kilinochchi 698 501 71.78 4 0.57 507 72.64 95 13.61 50 7.16 44 6.30
14 Kurunegala 15,416 9,511 61.70 359 2.33 9,576 62.12 2,757 17.88 1,794 11.64 1,231 7.99
15 Monaragala 2,879 1,712 59.47 33 1.15 1,728 60.02 533 18.51 349 12.12 252 8.75
16 Mannar 854 583 68.27 6 0.70 589 68.97 119 13.93 73 8.55 71 8.31
17 Matara 8,947 5,242 58.59 203 2.27 5,274 58.95 1,579 17.65 1,113 12.44 923 10.32
18 Matale 3,801 2,211 58.17 42 1.10 2,230 58.67 750 19.73 458 12.05 343 9.02
19 Mullativu 848 661 77.95 2 0.24 676 79.72 81 9.55 40 4.72 48 5.66
20 Nuwara Eliya 4,360 2,665 61.12 30 0.69 2,682 61.51 782 17.94 466 10.69 415 9.52
21 Puttalam 4,423 2,648 59.87 78 1.76 2,675 60.48 733 16.57 571 12.91 413 9.34
22 Polonnaruwa 2,772 1,547 55.81 37 1.33 1,554 56.06 495 17.86 362 13.06 335 12.09
23 Ratnapura 9,615 6,155 64.01 278 2.89 6,202 64.50 1,450 15.08 1,071 11.14 828 8.61
24 Trincomalee 2,154 1,399 64.95 25 1.16 1,416 65.74 341 15.83 213 9.89 166 7.71
25 Vavuniya 1,140 826 72.46 33 2.89 829 72.72 152 13.33 83 7.28 71 6.23
Island 172,244 103,564 60.13 3,732 2.17 104,389 60.61 29,375 17.05 20,468 11.88 17,004 9.87
* Percentages Calculated on Number Sat of each District
District No. SatQualified for U.E. 3 A's Passed in 1 Failed in All
G.C.E.(A.L.) Examination - 2006
Performance of School Candidates by District
Passed in 3 Passed in 2
0
10
20
30
40
50
60
70
80
90
Anu
radh
apur
a
Am
para
Bad
ulla
Bat
tical
oa
Col
ombo
Gal
le
Gam
paha
Ham
bant
ota
Jaffna
Kan
dy
Keg
alle
Kal
utar
a
Kili
noch
chi
Kur
uneg
ala
Mon
arag
ala
Man
nar
Mat
ara
Mat
ale
Mul
lativ
u
Nuw
ara Eliy
a
Putta
lam
Polon
naru
wa
Rat
napu
ra
Trinco
mal
ee
Vavun
iya
Isla
nd
District
Per
cen
tage
G.C.E. (A.L.) Examination 2006
Percentage of School Candidates Qualified for University Entrance by District

- 100 -
- 99 -
No. % No. % No. % No. % No. % No. %1 Anuradhapura 6,564 3,711 56.54 94 1.43 3,711 56.54 1,310 19.96 816 12.43 670 10.21 2 Ampara 4,922 3,135 63.69 50 1.02 3,135 63.69 778 15.81 544 11.05 432 8.78 3 Badulla 7,590 4,408 58.08 86 1.13 4,408 58.08 1,386 18.26 894 11.78 871 11.48 4 Batticaloa 2,813 1,920 68.25 42 1.49 1,920 68.25 393 13.97 266 9.46 219 7.79 5 Colombo 21,677 12,693 58.56 784 3.62 12,693 58.56 3,715 17.14 2,620 12.09 2,565 11.83 6 Galle 11,290 7,296 64.62 343 3.04 7,296 64.62 1,692 14.99 1,136 10.06 1,100 9.74 7 Gampaha 15,138 8,541 56.42 358 2.36 8,541 56.42 2,750 18.17 1,925 12.72 1,840 12.15 8 Hambantota 5,904 3,470 58.77 84 1.42 3,470 58.77 998 16.90 768 13.01 624 10.57 9 Jaffna 6,211 4,565 73.50 91 1.47 4,565 73.50 786 12.65 440 7.08 407 6.55
10 Kandy 14,099 8,658 61.41 249 1.77 8,658 61.41 2,485 17.63 1,652 11.72 1,236 8.77
11 Kegalle 7,790 4,897 62.86 143 1.84 4,897 62.86 1,319 16.93 915 11.75 628 8.06
12 Kalutara 9,150 5,609 61.30 204 2.23 5,609 61.30 1,498 16.37 1,034 11.30 972 10.62
13 Kilinochchi 373 236 63.27 2 0.54 236 63.27 64 17.16 37 9.92 34 9.12
14 Kurunegala 15,251 9,537 62.53 335 2.20 9,537 62.53 2,607 17.09 1,723 11.30 1,332 8.73
15 Monaragala 3,366 1,963 58.32 29 0.86 1,963 58.32 618 18.36 407 12.09 342 10.16
16 Mannar 666 506 75.98 4 0.60 506 75.98 68 10.21 44 6.61 48 7.21 17 Matara 9,208 5,533 60.09 205 2.23 5,533 60.09 1,635 17.76 1,076 11.69 916 9.95
18 Matale 3,848 2,327 60.47 27 0.70 2,327 60.47 705 18.32 452 11.75 345 8.97
19 Mullativu 306 224 73.20 2 0.65 224 73.20 44 14.38 21 6.86 13 4.25
20 Nuwara Eliya 4,514 2,751 60.94 26 0.58 2,751 60.94 755 16.73 510 11.30 478 10.59 21 Puttalam 4,441 2,793 62.89 81 1.82 2,793 62.89 707 15.92 495 11.15 426 9.59
22 Polonnaruwa 2,771 1,493 53.88 36 1.30 1,493 53.88 583 21.04 354 12.78 326 11.76
23 Ratnapura 9,250 6,082 65.75 244 2.64 6,082 65.75 1,420 15.35 954 10.31 745 8.05
24 Trincomalee 1,988 1,296 65.19 11 0.55 1,296 65.19 339 17.05 180 9.05 164 8.25
25 Vavuniya 1,015 835 82.27 21 2.07 835 82.27 101 9.95 40 3.94 33 3.25
Island 170,145 104,479 61.41 3,551 2.09 104,479 61.41 28,756 16.90 19,303 11.35 16,766 9.85
* Percentages Calculated on Number Sat of each District
District No. SatQualified for U.E. 3 A's Passed in 3 Passed in 2 Passed in 1 Failed in All
Performance of School Candidates by District
G.C.E.(A.L.) Examination - 2007
0
10
20
30
40
50
60
70
80
90
Anu
radh
apur
a
Am
para
Bad
ulla
Bat
tical
oa
Col
ombo
Gal
le
Gam
paha
Ham
bant
ota
Jaffna
Kan
dy
Keg
alle
Kal
utar
a
Kili
noch
chi
Kur
uneg
ala
Mon
arag
ala
Man
nar
Mat
ara
Mat
ale
Mul
lativ
u
Nuw
ara Eliy
a
Putta
lam
Polon
naru
wa
Rat
napu
ra
Trinco
mal
ee
Vavun
iya
Isla
nd
District
Per
cen
tag
e
G.C.E. (A.L.) Examination 2007
Percentage of School Candidates Qualified for University Entrance by District

- 102 -
- 101 -
No. % No. % No. % No. % No. % No. %
1 Anuradhapura 7,911 4,382 55.39 67 0.85 4,518 57.11 1,508 19.06 1,017 12.86 806 10.19
2 Ampara 6,535 3,599 55.07 66 1.01 3,751 57.40 1,186 18.15 824 12.61 647 9.90
3 Badulla 8,842 5,000 56.55 100 1.13 5,197 58.78 1,608 18.19 1,102 12.46 875 9.90
4 Batticaloa 3,704 2,180 58.86 40 1.08 2,281 61.58 609 16.44 402 10.85 376 10.15
5 Colombo 24,788 13,924 56.17 755 3.05 14,168 57.16 4,611 18.60 2,965 11.96 2,885 11.64
6 Galle 12,778 7,831 61.29 404 3.16 7,995 62.57 2,148 16.81 1,300 10.17 1,243 9.73
7 Gampaha 17,104 9,229 53.96 228 1.33 9,476 55.40 3,331 19.47 2,136 12.49 2,032 11.88
8 Hambantota 7,520 4,357 57.94 151 2.01 4,453 59.22 1,348 17.93 840 11.17 811 10.78
9 Jaffna 8,426 5,005 59.40 88 1.04 5,266 62.50 1,207 14.32 888 10.54 1,009 11.97
10 Kandy 16,274 9,469 58.18 269 1.65 9,722 59.74 3,191 19.61 1,935 11.89 1,326 8.15
11 Kegalle 8,849 5,379 60.79 125 1.41 5,521 62.39 1,615 18.25 966 10.92 706 7.98
12 Kalutara 11,217 6,630 59.11 243 2.17 6,808 60.69 2,012 17.94 1,262 11.25 1,068 9.52
13 Kilinochchi 891 583 65.43 5 0.56 622 69.81 127 14.25 71 7.97 65 7.30
14 Kurunegala 18,550 11,326 61.06 357 1.92 11,641 62.75 3,365 18.14 2,037 10.98 1,401 7.55
15 Monaragala 3,844 2,073 53.93 31 0.81 2,175 56.58 749 19.48 520 13.53 361 9.39
16 Mannar 986 607 61.56 5 0.51 652 66.13 134 13.59 98 9.94 95 9.63
17 Matara 10,925 6,694 61.27 179 1.64 6,881 62.98 1,782 16.31 1,194 10.93 997 9.13
18 Matale 4,455 2,607 58.52 35 0.79 2,697 60.54 815 18.29 528 11.85 379 8.51
19 Mullative 1,031 687 66.63 5 0.48 754 73.13 129 12.51 77 7.47 66 6.40
20 Nuwara Eliya 5,146 2,995 58.20 31 0.60 3,123 60.69 943 18.32 552 10.73 481 9.35
21 Puttalam 5,427 3,217 59.28 65 1.20 3,300 60.81 926 17.06 630 11.61 537 9.89
22 Polonnaruwa 3,310 1,763 53.26 36 1.09 1,823 55.08 637 19.24 442 13.35 384 11.60
23 Ratnapura 10,893 6,736 61.84 210 1.93 6,910 63.44 1,750 16.07 1,196 10.98 966 8.87
24 Trincomalee 2,942 1,681 57.14 21 0.71 1,786 60.71 526 17.88 319 10.84 264 8.97
25 Vavuniya 1,340 816 60.90 19 1.42 857 63.96 200 14.93 148 11.04 124 9.25
Island 203,688 118,770 58.31 3,535 1.74 122,377 60.08 36,457 17.90 23,449 11.51 19,904 9.77
DistrictQualified for U.E. 3 A's Passed in 3 Passed in 2 Passed in 1 Failed in All
No. Sat
Performance of All Candidates by District
G.C.E.(A.L.) Examination - 2005
No. % No. % No. % No. % No. % No. %
1 Anuradhapura 7,767 4,495 57.87 127 1.64 4,565 58.77 1,386 17.84 979 12.60 743 9.57
2 Ampara 6,297 3,749 59.54 102 1.62 3,821 60.68 978 15.53 710 11.28 643 10.21
3 Badulla 9,021 5,081 56.32 120 1.33 5,157 57.17 1,687 18.70 1,178 13.06 936 10.38
4 Batticaloa 3,628 2,296 63.29 64 1.76 2,323 64.03 543 14.97 353 9.73 360 9.92
5 Colombo 24,618 13,854 56.28 790 3.21 14,005 56.89 4,125 16.76 3,298 13.40 3,017 12.26
6 Galle 12,572 7,918 62.98 452 3.60 8,006 63.68 2,018 16.05 1,256 9.99 1,208 9.61
7 Gampaha 17,197 9,222 53.63 272 1.58 9,338 54.30 3,208 18.65 2,431 14.14 2,080 12.10
8 Hambantota 7,397 4,350 58.81 157 2.12 4,399 59.47 1,284 17.36 963 13.02 691 9.34
9 Jaffna 8,252 5,324 64.52 104 1.26 5,410 65.56 1,212 14.69 752 9.11 823 9.97
10 Kandy 16,085 9,376 58.29 280 1.74 9,469 58.87 2,944 18.30 2,079 12.93 1,499 9.32
11 Kegalle 8,949 5,504 61.50 153 1.71 5,566 62.20 1,568 17.52 1,061 11.86 700 7.82
12 Kalutara 10,925 6,611 60.51 234 2.14 6,696 61.29 1,805 16.52 1,292 11.83 1,065 9.75
13 Kilinochchi 883 614 69.54 5 0.57 626 70.89 120 13.59 79 8.95 54 6.12
14 Kurunegala 17,893 11,008 61.52 410 2.29 11,136 62.24 3,204 17.91 2,066 11.55 1,404 7.85
15 Monaragala 3,706 2,211 59.66 44 1.19 2,253 60.79 678 18.29 445 12.01 301 8.12
16 Mannar 1,030 669 64.95 6 0.58 680 66.02 156 15.15 104 10.10 84 8.16
17 Matara 10,776 6,429 59.66 256 2.38 6,491 60.24 1,848 17.15 1,309 12.15 1,055 9.79
18 Matale 4,510 2,625 58.20 53 1.18 2,657 58.91 882 19.56 547 12.13 393 8.71
19 Mullative 1,018 767 75.34 2 0.20 791 77.70 101 9.92 61 5.99 60 5.89
20 Nuwara Eliya 5,272 3,109 58.97 36 0.68 3,145 59.65 960 18.21 608 11.53 519 9.84
21 Puttalam 5,268 3,166 60.10 88 1.67 3,222 61.16 882 16.74 651 12.36 464 8.81 22 Polonnaruwa 3,244 1,806 55.67 39 1.20 1,828 56.35 575 17.73 429 13.22 382 11.78
23 Ratnapura 11,171 7,176 64.24 324 2.90 7,263 65.02 1,662 14.88 1,231 11.02 935 8.37
24 Trincomalee 2,639 1,638 62.07 26 0.99 1,671 63.32 427 16.18 275 10.42 240 9.09
25 Vavuniya 1,283 879 68.51 33 2.57 889 69.29 183 14.26 98 7.64 92 7.17
Island 201,401 119,877 59.52 4,177 2.07 121,407 60.28 34,436 17.10 24,255 12.04 19,748 9.81
Failed in AllQualified for U.E.District No. Sat
3 A's Passed in 3 Passed in 2 Passed in 1
G.C.E.(A.L.) Examination - 2006
Performance of All Candidates by District

- 104 -
- 103 -
Number % Number % Number % Number %
Bio Science 14,485 4,588 31.67 2,307 901 39.06 228 103 45.18 17,020 5,592 32.86
Physical Science 11,232 3,791 33.75 1,856 644 34.70 296 119 40.20 13,384 4,554 34.03
Commerce 34,105 19,064 55.90 5,672 3,355 59.15 261 161 61.69 40,038 22,580 56.40
Arts 39,979 23,353 58.41 9,648 6,698 69.42 56 34 60.71 49,683 30,085 60.55
Total 99,801 50,796 50.90 19,483 11,598 59.53 841 417 49.58 120,125 62,811 52.29
Bio Science 14,316 4,479 31.29 2,334 981 42.03 165 89 53.94 16,815 5,549 33.00
Physical Science 11,101 3,614 32.56 1,742 605 34.73 210 85 40.48 13,053 4,304 32.97
Commerce 35,028 21,592 61.64 5,492 3,568 64.97 243 175 72.02 40,763 25,335 62.15
Arts 38,023 22,913 60.26 10,693 7,772 72.68 66 54 81.82 48,782 30,739 63.01
Total 98,468 52,598 53.42 20,261 12,926 63.80 684 403 58.92 119,413 65,927 55.21
Bio Science 15,397 5,168 33.56 2,264 985 43.51 123 48 39.02 17,784 6,201 34.87
Physical Science 10,761 3,510 32.62 1,561 608 38.95 147 49 33.33 12,469 4,167 33.42
Commerce 33,404 20,258 60.65 4,694 3,037 64.70 278 205 73.74 38,376 23,500 61.24
Arts 41,850 26,404 63.09 10,515 7,792 74.10 92 62 67.39 52,457 34,258 65.31
Total 101,412 55,340 54.57 19,034 12,422 65.26 640 364 56.88 121,086 68,126 56.26
G.C.E.(A.L.) Examination - 2005 - 2007Performance of School Candidates (Freshers) - Streamwise by Medium
Year Stream
Sinhala Medium Tamil Medium
Number
Sat
Qualified for
University
Entrance
Total
Qualified for
University
Entrance
2005
Number
Sat
Qualified for
University
Entrance
Number
Sat
Number
Sat
English Medium
Qualified for
University
Entrance
2007
2006
No. % No. % No. % No. % No. % No. %
1 Anuradhapura 8,105 4,543 56.05 104 1.28 4,543 56.05 1,667 20.57 1,007 12.42 792 9.77
2 Ampara 6,429 3,879 60.34 55 0.86 3,879 60.34 1,070 16.64 775 12.05 601 9.35
3 Badulla 9,039 5,146 56.93 92 1.02 5,146 56.93 1,661 18.38 1,149 12.71 1,027 11.36
4 Batticaloa 3,588 2,250 62.71 43 1.20 2,250 62.71 553 15.41 411 11.45 314 8.75
5 Colombo 24,074 13,744 57.09 800 3.32 13,744 57.09 4,206 17.47 3,051 12.67 2,950 12.25
6 Galle 13,017 8,459 64.98 375 2.88 8,459 64.98 1,956 15.03 1,290 9.91 1,226 9.42
7 Gampaha 17,727 9,886 55.77 385 2.17 9,886 55.77 3,239 18.27 2,319 13.08 2,153 12.15
8 Hambantota 7,555 4,529 59.95 112 1.48 4,529 59.95 1,283 16.98 941 12.46 742 9.82
9 Jaffna 7,459 5,277 70.75 95 1.27 5,277 70.75 1,015 13.61 607 8.14 522 7.00
10 Kandy 16,206 9,703 59.87 261 1.61 9,703 59.87 2,967 18.31 2,004 12.37 1,430 8.82
11 Kegalle 9,203 5,733 62.29 165 1.79 5,733 62.29 1,602 17.41 1,084 11.78 732 7.95
12 Kalutara 10,696 6,471 60.50 228 2.13 6,471 60.50 1,795 16.78 1,233 11.53 1,140 10.66
13 Kilinochchi 470 282 60.00 3 0.64 282 60.00 86 18.30 50 10.64 49 10.43
14 Kurunegala 17,991 11,071 61.54 368 2.05 11,071 61.54 3,178 17.66 2,090 11.62 1,576 8.76
15 Monaragala 4,237 2,439 57.56 41 0.97 2,439 57.56 796 18.79 530 12.51 426 10.05
16 Mannar 774 563 72.74 4 0.52 563 72.74 84 10.85 68 8.79 58 7.49
17 Matara 10,977 6,630 60.40 234 2.13 6,630 60.40 1,947 17.74 1,295 11.80 1,046 9.53
18 Matale 4,613 2,725 59.07 34 0.74 2,725 59.07 896 19.42 552 11.97 409 8.87
19 Mullative 378 263 69.58 2 0.53 263 69.58 56 14.81 34 8.99 20 5.29
20 Nuwara Eliya 5,357 3,169 59.16 30 0.56 3,169 59.16 907 16.93 667 12.45 581 10.85
21 Puttalam 5,388 3,323 61.67 87 1.61 3,323 61.67 915 16.98 613 11.38 503 9.34
22 Polonnaruwa 3,262 1,757 53.86 37 1.13 1,757 53.86 687 21.06 435 13.34 361 11.07
23 Ratnapura 10,963 7,139 65.12 269 2.45 7,139 65.12 1,738 15.85 1,147 10.46 867 7.91
24 Trincomalee 2,564 1,545 60.26 13 0.51 1,545 60.26 459 17.90 271 10.57 248 9.67
25 Vavuniya 1,157 896 77.44 21 1.82 896 77.44 130 11.24 66 5.70 55 4.75
Island 201,229 121,422 60.34 3,858 1.92 121,422 60.34 34,893 17.34 23,689 11.77 19,828 9.85
Performance of All Candidates by District
District No. Sat3 A's Passed in 3 Failed in AllPassed in 2Qualified for U.E. Passed in 1
G.C.E.(A.L.) Examination - 2007

- 106 -
- 105 -
Number % Number % Number % Number %
1 Anuradhapura 664 159 23.95 328 93 28.35 1,200 559 46.58 2,226 1,239 55.66
2 Ampara 554 188 33.94 282 88 31.21 811 440 54.25 1,961 1,188 60.58
3 Badulla 679 162 23.86 370 112 30.27 1,568 803 51.21 2,463 1,541 62.57
4 Batticaloa 273 93 34.07 157 47 29.94 374 221 59.09 1,124 797 70.91
5 Colombo 2,647 1,235 46.66 3,264 1,362 41.73 7,940 4,786 60.28 3,073 1,706 55.52
6 Galle 1,024 390 38.09 1,023 361 35.29 2,393 1,339 55.95 2,909 1,850 63.60
7 Gampaha 1,377 454 32.97 1,349 398 29.50 5,019 2,741 54.61 3,296 1,815 55.07
8 Hambantota 810 183 22.59 410 102 24.88 1,066 535 50.19 1,674 850 50.78
9 Jaffna 515 225 43.69 709 268 37.80 1,018 632 62.08 2,227 1,418 63.67
10 Kandy 1,461 562 38.47 1,103 370 33.54 3,069 1,731 56.40 4,186 2,549 60.89
11 Kegalle 780 235 30.13 375 100 26.67 1,451 834 57.48 2,490 1,560 62.65
12 Kalutara 719 254 35.33 754 212 28.12 2,556 1,438 56.26 2,440 1,549 63.48
13 Kilinochchi 53 15 28.30 34 8 23.53 109 79 72.48 260 176 67.69
14 Kurunegala 1,457 385 26.42 902 315 34.92 2,793 1,674 59.94 5,736 3,410 59.45
15 Monaragala 372 75 20.16 120 27 22.50 725 339 46.76 1,074 588 54.75
16 Mannar 82 25 30.49 41 11 26.83 138 73 52.90 307 236 76.87
17 Matara 901 256 28.41 695 253 36.40 1,829 1,001 54.73 2,470 1,475 59.72
18 Matale 328 83 25.30 167 39 23.35 669 322 48.13 1,330 846 63.61
19 Mullative 57 20 35.09 25 6 24.00 119 73 61.34 296 212 71.62
20 Nuwara Eliya 397 124 31.23 196 60 30.61 985 544 55.23 1,508 954 63.26
21 Puttalam 467 122 26.12 335 98 29.25 1,135 670 59.03 1,359 903 66.45
22 Polonnaruwa 250 47 18.80 104 17 16.35 622 298 47.91 1,073 553 51.54
23 Ratnapura 870 221 25.40 464 143 30.82 1,829 1,099 60.09 2,823 1,753 62.10
24 Trincomalee 193 51 26.42 103 34 33.01 422 237 56.16 922 586 63.56
25 Vavuniya 90 28 31.11 74 30 40.54 198 112 56.57 456 331 72.59
Island 17,020 5,592 32.86 13,384 4,554 34.03 40,038 22,580 56.40 49,683 30,085 60.55
G.C.E. (A.L.) Examination - 2005Streamwise Performance of School Candidates (Freshers) - Qualified for University Entrance
Arts
Stream
Qualified for U.E.Number
Sat
Qualified for U.E. Number
Sat
Qualified for U.E.District
Number
Sat
Qualified for U.E. Number
Sat
Bio Science Physical Science Commerce
0
5,000
10,000
15,000
20,000
25,000
30,000
35,000
40,000
45,000
50,000
Bio Science Physical Science Commerce Arts
Stream
No.
of
Can
did
ate
s
2005
2006
2007
G.C.E. (A.L.) Examination 2005 - 2007
No. of School Candidates (Freshers) Qualified for University Entrance - by Streamwise

- 108 -
- 107-
Number % Number % Number % Number %
1 Anuradhapura 545 133 24.40 347 84 24.21 1,311 706 53.85 1,982 1,204 60.75
2 Ampara 555 173 31.17 231 60 25.97 670 381 56.87 2,037 1,322 64.90
3 Badulla 627 165 26.32 418 115 27.51 1,652 887 53.69 2,200 1,387 63.05
4 Batticaloa 274 96 35.04 114 48 42.11 372 253 68.01 1,323 1,022 77.25
5 Colombo 2,555 1,255 49.12 3,264 1,310 40.13 8,259 5,504 66.64 3,143 1,600 50.91
6 Galle 1,126 375 33.30 998 371 37.17 2,377 1,523 64.07 2,847 1,863 65.44
7 Gampaha 1,374 463 33.70 1,391 365 26.24 5,051 3,053 60.44 3,302 1,777 53.82
8 Hambantota 836 177 21.17 342 94 27.49 1,140 632 55.44 1,580 874 55.32
9 Jaffna 539 259 48.05 651 231 35.48 933 618 66.24 2,423 1,709 70.53
10 Kandy 1,391 462 33.21 927 318 34.30 3,149 1,893 60.11 4,043 2,580 63.81
11 Kegalle 798 230 28.82 434 135 31.11 1,489 975 65.48 2,455 1,625 66.19
12 Kalutara 791 272 34.39 738 229 31.03 2,567 1,652 64.36 2,387 1,508 63.18
13 Kilinochchi 42 11 26.19 34 12 35.29 127 71 55.91 309 244 78.96
14 Kurunegala 1,324 422 31.87 880 313 35.57 2,830 1,866 65.94 5,380 3,326 61.82
15 Monaragala 304 60 19.74 103 19 18.45 696 371 53.30 931 580 62.30
16 Mannar 88 32 36.36 31 8 25.81 152 92 60.53 326 266 81.60
17 Matara 1,005 286 28.46 719 217 30.18 1,922 1,127 58.64 2,272 1,332 58.63
18 Matale 400 96 24.00 162 39 24.07 696 376 54.02 1,335 846 63.37
19 Mullative 49 17 34.69 17 3 17.65 132 89 67.42 298 243 81.54
20 Nuwara Eliya 414 93 22.46 211 41 19.43 1,025 605 59.02 1,436 976 67.97
21 Puttalam 435 118 27.13 302 99 32.78 1,096 679 61.95 1,449 964 66.53
22 Polonnaruwa 248 45 18.15 117 18 15.38 540 297 55.00 978 544 55.62
23 Ratnapura 860 204 23.72 452 107 23.67 1,996 1,352 67.74 2,796 1,856 66.38
24 Trincomalee 167 63 37.72 91 35 38.46 375 203 54.13 1,019 677 66.44
25 Vavuniya 68 42 61.76 79 33 41.77 206 130 63.11 531 414 77.97
Island 16,815 5,549 33.00 13,053 4,304 32.97 40,763 25,335 62.15 48,782 30,739 63.01
District
Stream
Bio Science Physical Science Commerce Arts
Number
Sat
Qualified for U.E.Qualified for U.E. Number
Sat
Number
Sat
Qualified for U.E. Number
Sat
Qualified for U.E.
G.C.E. (A.L.) Examination - 2006Streamwise Performance of School Candidates (Freshers) - Qualified for University Entrance
Number % Number % Number % Number %
1 Anuradhapura 705 175 24.82 363 98 27.00 1,140 596 52.28 2,435 1,436 58.97
2 Ampara 566 183 32.33 263 78 29.66 677 437 64.55 1,962 1,329 67.74
3 Badulla 706 194 27.48 344 87 25.29 1,490 733 49.19 2,516 1,625 64.59
4 Batticaloa 275 121 44.00 121 50 41.32 381 230 60.37 1,310 983 75.04
5 Colombo 2,542 1,250 49.17 3,157 1,250 39.59 7,848 5,193 66.17 3,259 1,829 56.12
6 Galle 1,154 454 39.34 861 295 34.26 2,441 1,543 63.21 3,128 2,222 71.04
7 Gampaha 1,529 570 37.28 1,358 378 27.84 4,705 2,788 59.26 3,656 2,184 59.74
8 Hambantota 805 199 24.72 339 98 28.91 1,098 591 53.83 1,652 1,009 61.08
9 Jaffna 483 227 47.00 530 235 44.34 705 516 73.19 2,387 1,864 78.09
10 Kandy 1,533 578 37.70 964 333 34.54 2,942 1,830 62.20 4,515 2,927 64.83
11 Kegalle 876 270 30.82 416 128 30.77 1,458 907 62.21 2,670 1,808 67.72
12 Kalutara 813 291 35.79 662 187 28.25 2,416 1,512 62.58 2,743 1,751 63.84
13 Kilinochchi 58 11 18.97 25 5 20.00 99 36 36.36 289 110 38.06
14 Kurunegala 1,417 471 33.24 841 277 32.94 2,708 1,633 60.30 5,714 3,662 64.09
15 Monaragala 354 72 20.34 107 27 25.23 700 362 51.71 1,135 698 61.50
16 Mannar 58 23 39.66 29 10 34.48 80 52 65.00 303 256 84.49
17 Matara 1,012 290 28.66 672 230 34.23 1,923 1,065 55.38 2,558 1,604 62.71
18 Matale 407 108 26.54 163 48 29.45 653 329 50.38 1,361 912 67.01
19 Mullative 40 6 15.00 20 2 10.00 74 29 39.19 263 106 40.30
20 Nuwara Eliya 515 117 22.72 197 50 25.38 882 530 60.09 1,570 1,084 69.04
21 Puttalam 441 141 31.97 275 65 23.64 1,060 672 63.40 1,548 1,118 72.22
22 Polonnaruwa 271 70 25.83 137 27 19.71 608 323 53.13 1,004 570 56.77
23 Ratnapura 959 260 27.11 486 140 28.81 1,789 1,269 70.93 3,048 2,117 69.46
24 Trincomalee 188 79 42.02 67 28 41.79 349 201 57.59 844 561 66.47
25 Vavuniya 77 41 53.25 72 41 56.94 150 123 82.00 587 493 83.99
Island 17,784 6,201 34.87 12,469 4,167 33.42 38,376 23,500 61.24 52,457 34,258 65.31
District
Stream
G.C.E. (A.L.) Examination - 2007
Bio Science Physical Science
Streamwise Performance of School Candidates (Freshers) - Qualified for University Entrance
Commerce Arts
Number
Sat
Qualified for U.E. Number
Sat
Qualified for U.E. Number
Sat
Qualified for U.E. Number
Sat
Qualified for U.E.

- 110 -
2005 2006 2007 2005 2006 2007
01. Physics 36.56 35.80 41.07 17.14 15.80 15.98
02. Chemistry 36.17 35.05 36.93 15.61 16.16 15.95
07. Mathematics 28.70 31.18 28.75 15.65 16.23 15.17
08. Agriculture Science 52.26 53.82 56.82 13.57 12.52 12.95
09. Biology 48.08 46.46 44.05 15.58 15.58 14.33
10. Combined Mathematics 32.43 36.90 31.11 20.29 21.88 18.64
11. Higher Mathematics 38.00 34.90 16.40 20.41 22.71 7.32
12. Common General Test 48.22 51.94 48.64 11.04 10.43 10.43
13. General English 24.43 23.14 26.77 18.22 18.61 19.18
14. Civil Technology - - 47.64 - - 8.63
15. Mechanical Technology - - 52.82 - - 7.60
16. Elect. Info Technology - - 49.30 - - 7.85
17. Food Technology - - 49.76 - - 13.47
18. Agro Technology - - 49.00 - - 10.18
19. Bio Resource Technology - - 46.36 - - 8.77
21. Economics 49.31 45.56 47.70 16.57 16.26 16.85
22. Geography 51.06 49.25 50.63 13.28 12.19 12.56
23. E.Political Science 47.48 52.17 47.62 15.24 16.59 15.98
24. Logic & Sc. Method 50.64 45.87 52.86 20.70 19.31 19.00
25A. Indian History 54.82 53.09 52.91 15.90 15.81 15.97
25B. Europian History 53.86 53.08 52.88 16.97 16.34 15.54
28. Home Economics 42.96 44.67 52.74 22.70 22.64 18.63
29. Communi. & Media Studies - - - - - -
29. Business Studies (Old) 52.02 55.27 55.00 15.17 15.44 16.04
30. Accounting (Old) 44.27 48.77 39.69 21.04 19.08 19.19
31. Business statistics 53.19 57.88 59.36 18.51 19.34 20.37
32. Business Studies (New) - 48.29 50.16 - 15.89 15.74
33. Accounting (New) - 42.45 43.85 - 19.43 17.74
41. Buddhism 57.12 57.32 52.62 12.98 13.34 12.61
42. Hinduism 52.17 56.24 59.44 13.64 14.98 14.13
SubjectS.D.MEAN
G.C.E. (A.L) Examination 2005 - 2007
Means & Standard Deviations of All Subjects
2005 2006 2007 2005 2006 2007
43. Christianity 69.07 64.24 69.15 12.80 14.86 14.46
44. Islam 60.13 60.09 62.14 13.14 13.22 14.36
45. Buddhist Civilization 50.92 53.01 53.56 14.82 15.57 14.49
46. Hindu Civilization 52.57 51.98 55.65 14.35 14.59 14.28
47. Islam Civilization 63.52 65.49 58.66 15.77 15.63 17.82
48. Greek & Roman Civilization 56.00 57.56 63.04 19.35 18.97 20.88
51. Art 52.23 54.62 53.48 15.32 14.23 14.87
52. Dancing (S) 58.36 58.39 59.05 17.95 18.30 19.17
53. Dancing (B) 48.05 52.35 52.67 17.69 18.47 16.69
54. Oriental Music 54.09 50.93 55.34 22.12 22.33 22.01
55. Carnatic Music 55.04 53.81 52.76 18.03 18.87 18.71
56. Western Music 47.63 64.17 59.95 21.08 22.19 22.89
57. Drama & Theatre(S) 54.90 57.07 61.66 15.91 16.25 14.68
58. Drama & Theatre(T) 56.10 61.08 62.93 12.64 11.08 11.19
59. Drama & Theatre(E) 59.91 66.40 61.80 4.75 8.23 19.24
71. Sinhala 59.81 58.16 53.44 13.66 13.66 13.11
72. Tamil 48.61 53.08 48.21 14.83 15.59 14.46
73. English 28.28 30.45 28.33 15.70 14.66 14.32
74. Pali 46.78 50.10 49.43 15.12 17.18 15.12
75. Sanskrit 54.69 51.83 55.55 17.26 18.99 17.39
78. Arabic 79.08 74.92 75.97 12.84 11.42 13.36
79. Malay 95.00 - 76.00 1.41 - 0.00
80. Persian - - - - - -
81. French 38.67 46.04 44.89 15.13 21.16 21.79
82. German 52.60 52.22 59.20 21.82 20.89 18.84
83. Russian 77.50 53.40 71.82 9.56 14.00 7.43
84. Hindi 56.04 54.90 52.45 18.24 20.22 18.88
85. Urdu 59.00 75.75 63.00 11.24 7.29 18.06
86. Chinese 64.00 63.33 74.20 15.51 11.63 24.79
87. Japanese 41.73 36.65 37.95 21.09 22.94 23.58
Means & Standard Deviations of All Subjects
SubjectMEAN S.D.
G.C.E. (A.L) Examination 2005 - 2007
- 109 -

- 111 -
Name of
the Exam S T E Total S T E Total S T E Total
Grade 5 Scholarship 114 36 - 150 1,596 504 - 2,100 888,504 261,396 - 1,149,900
G.C.E. (O.L) 1,357 424 286 2,067 21,712 6,784 4,576 33,072 5,785,616 1,750,558 57,640 7,593,814
G.C.E. (A.L) 591 126 - 717 9,456 2,016 - 11,472 1,629,240 328,868 13,322 1,971,430
Grade 5 Scholarship 152 46 - 198 2,128 644 - 2,772 905,008 259,108 - 1,164,116
G.C.E. (O.L) 1,529 471 298 2,298 25,993 8,007 5,066 39,066 5,085,300 1,375,250 40,982 6,501,532
G.C.E. (A.L) 509 131 82 722 8,653 2,227 1,394 12,274 1,613,816 327,026 12,348 1,953,190
Grade 5 Scholarship 146 46 - 192 2,044 644 - 2,688 876,056 258,892 - 1,134,948
G.C.E. (O.L) 1,425 425 218 2,068 25,650 7,650 3,924 37,224 5,261,216 1,537,566 35,762 6,834,544
G.C.E. (A.L) 486 119 84 689 8,748 2,142 1,512 12,402 1,631,202 304,942 12,002 1,948,146
Evaluation of Answerscripts - School Examinations 2005 - 2007
2005
2006
2007
No. of Evaluation Boards No. of Examiners No. of Answer ScriptsYear
GENERAL
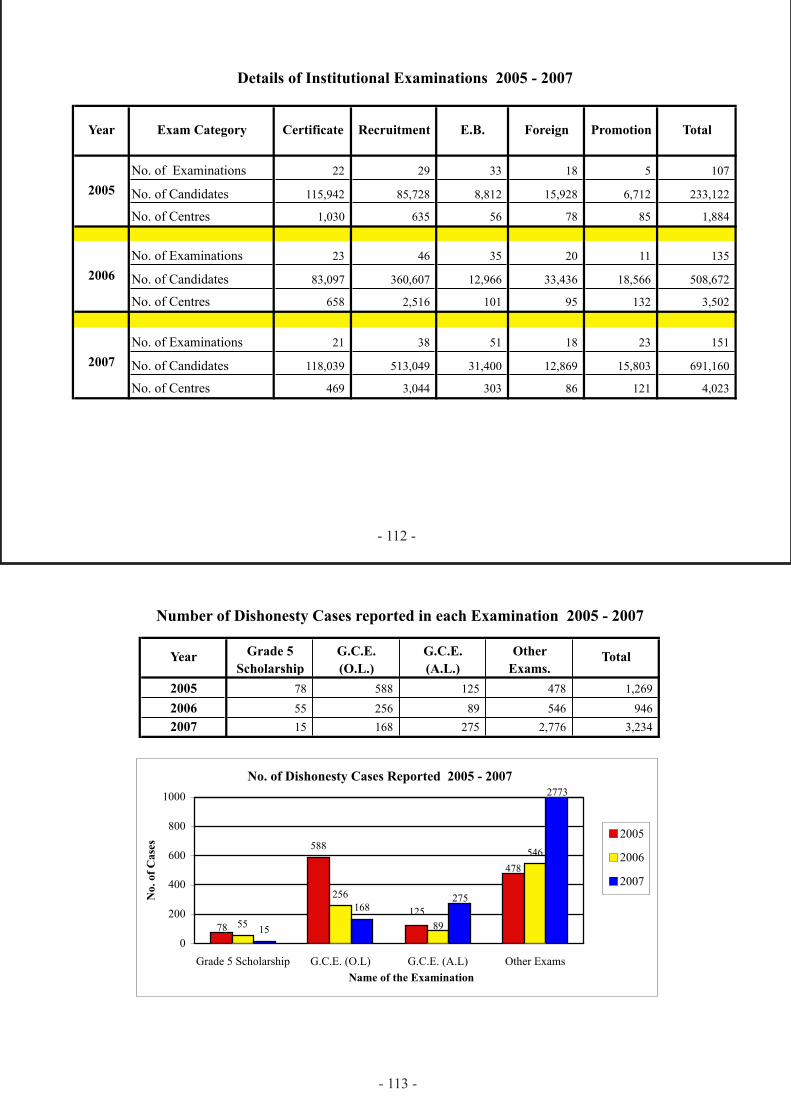
- 113 -
- 112 -
2005 78 588 125 478 1,269
2006 55 256 89 546 946
2007 15 168 275 2,776 3,234
Number of Dishonesty Cases reported in each Examination 2005 - 2007
Year Grade 5
Scholarship
G.C.E.
(O.L.)
G.C.E.
(A.L.)
Other
Exams.Total
No. of Dishonesty Cases Reported 2005 - 2007
588
55
256
15
168 125
478
78 89
546
275
2773
0
200
400
600
800
1000
Grade 5
Scholarship
G.C.E. (O.L) G.C.E. (A.L) Other Exams
Name of the Examination
No.
of
Case
s 2005
2006
2007
No. of Dishonesty Cases Reported 2005 - 2007
588
55
256
15
168 125
478
78 89
546
275
2773
0
200
400
600
800
1000
Grade 5 Scholarship G.C.E. (O.L) G.C.E. (A.L) Other Exams
Name of the Examination
No
. o
f C
ase
s
2005
2006
2007
No. of Examinations 22 29 33 18 5 107
No. of Candidates 115,942 85,728 8,812 15,928 6,712 233,122
No. of Centres 1,030 635 56 78 85 1,884
No. of Examinations 23 46 35 20 11 135
No. of Candidates 83,097 360,607 12,966 33,436 18,566 508,672
No. of Centres 658 2,516 101 95 132 3,502
No. of Examinations 21 38 51 18 23 151
No. of Candidates 118,039 513,049 31,400 12,869 15,803 691,160
No. of Centres 469 3,044 303 86 121 4,023
2007
2006
2005
Details of Institutional Examinations 2005 - 2007
Certificate Recruitment E.B. Foreign Promotion TotalYear Exam Category

- 115 -
School 378,762
Private 148,094 2005.12.12 - 2005.12.23 2006.04.27 125 Days
Total 526,856
School 377,703
Private 146,301 2006.12.11 - 2006.12.21 2007.04.02 102 Days
Total 524,004
School 399,257
Private 130,132 2007.12.10 - 2007.12.20 2008.04.01 101 Days
Total 529,389
2005 3911
2006 3945
2007 3988
G.C.E. (O.L.) Examination
YearNo. of
Centres
No. of Candidates
Applied
Duration of the
Examination
Date of Results
Released
No. of Days taken to
Release Results
- 114 -
2005 2614 302,668 2005.08.20 2005.10.11 52 Days
2006 2633 301,799 2006.08.12 2006.12.20 120 Days
2007 2624 295,321 2007.08.19 2007.09.22 35 Days
Grade Five Scholarship Examination
Date of Results
Released
No. of Days taken to
Release ResultsYear
No. of
Centres
No. of Candidates
Applied
Date of the
Examination

- 119 -
- 116 -
School 197,099
Private 48,604 2005.06.06 - 2005.07.01 2005.09.06 67 Days
Total 245,703
School 197,927
Private 48,009 2006.05.22 - 2006.06.15 2006.10.05 112 Days
Total 245,936
School 189,181
Private 45,929 2007.08.06 - 2007.08.31 2007.12.31 92 Days
Total 235,110
1771
YearNo. of
Centres
Date of Results
Released
No. of Days taken
to Release Results
2005 1785
2006 1813
2007
No. of Candidates
Applied
Duration of the
Examination
G.C.E. (A.L.) Examination
![MATRICULATION CERTIFICATE EXAMINATIONS … CERTIFICATE EXAMINATIONS 2016 Statistical Report MATSEC Examinations Board University of Malta [i] FOREWORD The year 2016 happens to …](https://cdn.vdocument.in/doc/165x107/5ad39ebb7f8b9aff738e430f/matriculation-certificate-examinations-certificate-examinations-2016-statistical.jpg)


