
95
Residual N03-N in the soil profile (Table 4) at the end of the 1994 growing season showed little difference betweenthe two nitrogen sources.
Table 4. Influence of nitrogen source on residual N03-N in the soil profile in November, 1994.
Profile Nitrogen SourceDepth Urea Dairy manureft . N03-N (Ib/A)
0-1 15.5(2.8)t 17.5(2.0)1-2 11.0(2.8) 8.9(0.8)
2-3 9.1 (2.0) 6.3 (0.8)3-4 9.7(1.2) 8.2(1.2)
4-5 11.0(1.2) 11.2(1.2)
5-6 11.8(1.2) 11.8(1.2)6-7 12.0(0.8) 11.4(1.2)
7-8 12.1 (0.8) 11.5(1.2)
Total (0-8') 92.2 86JJt Numbers in parentheses represent the standard error around the mean
Ortho phosphorus was not detected in any of the 51 water samples from dairy manure applied plots and 55 from ureafertilized plots (Table 5) indicating that manure application did not contribute to inorganic phosphorus losses in tilelines. However, 20% of the water samples from manured plots and 11 % from urea fertilized plots had detectableamounts of total phosphorus, averaging only 0.08 and 0.05 mg P/L.
Table 5. Ortho-phosphorus and total phosphorus detects in tile water samples in 1994.Ortho-P Total-P
Manure Urea Manure Urea
Number of samplesanalyzed 51 55 51 55Number of detects!' 0 0 10 6% of samples withdetects 0 0 20 11
Concentration range ofdetects (mg/L) - - 0.03-0.33 0.03-0.09Average concentration
among detects (mg/L) 0 0 0.08 0.05
-' Detection level is 0.04 mg/L for ortho-P and 0.02 mg/L for total P.
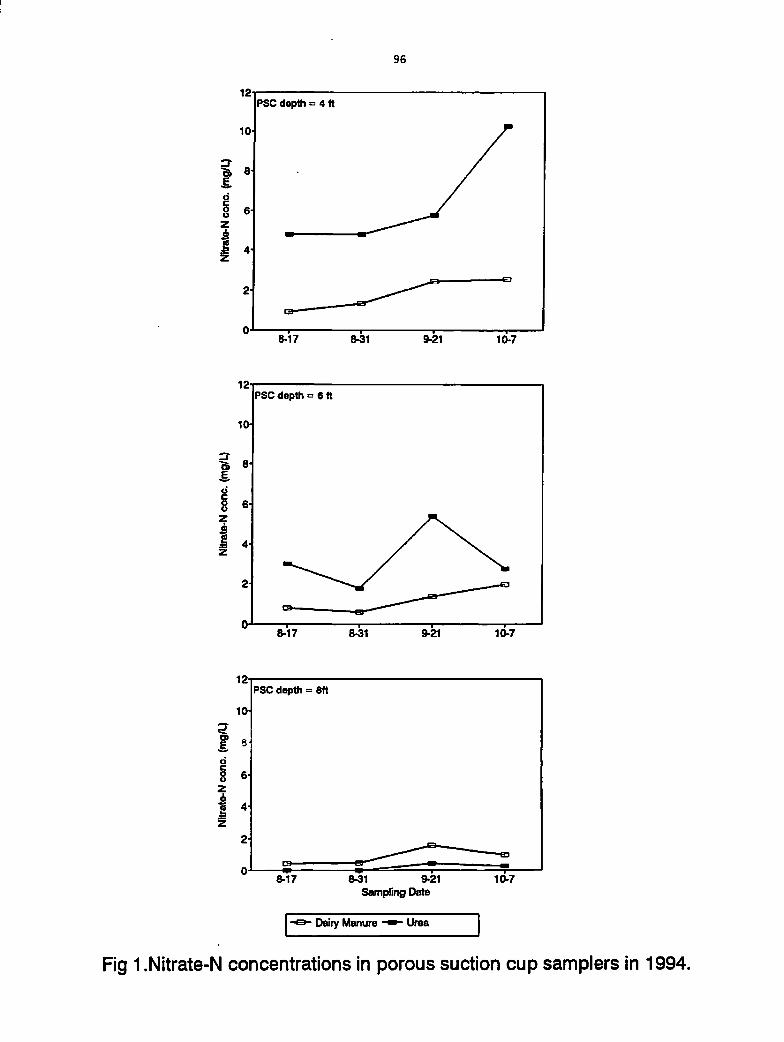
Nitrate-N concentrations in the PSC samplers at 4 and 6 ft depths were consistently greater at all four sampling datesin the plots that received urea compared to those that received dairy manure (Fig 1). Nitrate-N concentrations at the4-foot depth increased from August to October with both treatments, but was most dramatic with urea. At the 6-footdepth, NOj-N concentrations were highly variable and did not show this increase with time in the urea plots.Concentrations of N03-N at the 8-foot depth were very low (< 2 mg/L) for both treatments. Water samples were onlycollected twice from the piezometers in 1994. Water was found in 62% of the piezometers on the first sampling date(September 22) and in 96% of the piezometers on the second sampling date (October 7). During the two samplingdates, all the samples from 4-ft depth piezometers had detectable amounts of N03-N while about one-half ofpiezometers from both 6- and 8-ft depths had less than detectable amounts of N03-N.
g8
z
i1
8-17
8-17
8-17
96
S-31 9-21
8-31 9-21
8-31 9-21
Sampling Date
Dairy Manure -•»- Urea
10-7
10-7
10-7
Fig 1.Nitrate-N concentrations in porous suction cup samplers in 1994.
97
NITRATE LOSSES TO TILE DRANAGE AS AFFECTED BY NrTROGEN
FERTILIZATION OF CORN tM A CORN-SOYBEAN ROTATION^'
Waseca, 1994
G. W. Randall, J. A. Vetsch and G. L Malzer^
ABSTRACT: A study was conducted in 1994 to determine the influence of time of N application, N source, and nitrification inhibitor(Nl) on the uptake of N by com and the loss of N03to tiledrainage. Resultsfromthis firstyear showed significantyield improvementover the control with all N treatments. Fall application of N without Nl gave the lowest yields and N use efficiency of the Ntreatments. Yieldsand N use efficiency were not different among the fall + Nl,spring anhydrous ammonia (AA),and spring AA +N-Serve treatments. Highest yield was obtained with the pieplant urea treatment Tilelines flowed from mid-Aprilthrough mid-May,intermittently in August and in October. Tile flow averaged 5.89" for com and 4.82" for soybeans. Highest NCyN concentrationand losses in the com plots occurred with the fall application of N without Nl, while the highest concentration and losses undersoybean occurred with fall-applied AA + N-Serve applied to the previous com crop. Nitrate-N concentrations and losses fromcontinuous fallow plots that did not receive fertilizerN or a planted crop for eight years were 70% higher than from the fertilizedcom.This was due to soil mineralization and no crop uptake over this period.
Nitrogen (N) losses to tiledrainage water have been directly linkedto Nadditions, crop grown, and soil organic matter level. Research has beenconducted on N03 losses to tile water in Minnesota since 1972. This research has focused primarily on the effects of rates and timing offertilizerN application and tillage in a continuous com system. The purpose of this study is to determine the influence of time of N applicationand the use of a nitrification inhibitor on NO, movement and accumulation in the soil, NO, losses via tiledrainage, and yieldan N uptake bycom grown in a rotation with soybean.
EXPERIMENTAL PROCEDURES
Thirty-six individual tile line plots were installed on a poorly drained Webster clay loam at the Southern Experiment Station in 1976. Each 20x 30' plot is completely surrounded by plastic sheeting to a depth of 6' to prevent lateral flow and contains a tile line (4' deep) 5 feet from oneend. Alltiles drain to collection pits where flow rates can be measured and water samples collected for analyses. After completing a researchproject in 1983 using this tile facility, the plots were cropped to com with a blanket N rate in 1984 and 1985 to establish uniformity.
Beginning in 1986 com was planted on one-half of the experimental site while soybean was planted on the other half. Thirty two plots (16with com and 16 with soybean) with the most uniform drainage were selected from the 36 for the primary study. The experimental designconsists of a 4 x 4 Latinsquare where the rows and columns were based on the previous (1977-83) tile flow rates from each plot. The fourprimary N treatments (see Table 1) are applied to the com phase each year with the residual effects measured in the soybean phase. Threeadditional N treatments were replicated four times around the edge of the core 16-tile-plot area and were planted to com. These threetreatments were analyzed along with the other four as a completely randomized design.
Anhydrous ammonia was applied at a rate of 120 Ib/A for all N treatments. The nitrification inhibitor (XDE-474 in the fall and N-Serve in thespring) was applied at 0.5 Ib/A. Fall treatments were applied on October 25,1993. Average soil temperature at the 4" depth on that datewas 52°F with an average of 44°F over the following 10-day period. Spring preplant treatments were applied on May 11. The sidedresstreatment was applied at the V4 stage on June 16.
The com area (1993 soybean area) was field cultivated once before planting, while the soybean area (1993 com area) was fall chiseled andfield cultivated once prior to planting. Because of high soil P and K tests, no broadcast nor starter fertilizer was used.
Com (Pioneer3769) was planted at 24,000 seeds/acre (sprocket combination error)on May 11 with a JD Max-Emerge planter equipped withwaffle coulters. Com rootworm insecticide was not used. Weeds were chemically controlled with a preemergence application of Lasso (3.5Ib/A) plus Bladex (3 Ib/A) on May 18. Soybeans (Sturdy) were planted in 30" rows at 9 beans per foot of row on May 17. Weeds werechemically controlled with 3.0 Ib/ALasso preemergence (May 23) plus a post emergence application of Pursuit (4 oz/A) at the 1st trifoliatestage(June 22).
Two plots within each of the com and soybean areas were not planted and were fallowed all summer. These four fallow plot areas werelocated on those tile plots that showed greatest water flow variability (1977-83). The purposes of these plots were to check the NO^-Nconcentrations in the tile water in a fallow system and to utilizeall 36 of the tiled plots, even though these four historically showed the highestflow variability.
Stand counts were taken at the V-5 stage and plots were not thinned. Stover and grain samples were taken at physiological maturity by handharvesting 40' of row for stover yields and 60' of row for grain yields and moisture. Tile line flow rates were determined daily and wererecorded when flow exceeded 10 ml/minute (0.01"/day). Samples were collected for NCyN analysis on an every-other-day basis. Soilsamples for N03-Nanalysis were taken in 1-foot increments to a depth of 8 feet from the fallow plots on May 6 and from all plots on November4. Chemical analyses of plant, water, and soil were performed by the Research AnalyticalLaboratory, University of Minnesota.
-' Partial funding provided by Dow ChemicalU.S.A., Minnesota Agric. Exp. Stn., and Center for Agric. Impacts on Water Quality.v Professorand Assistant Scientist, So. Exp. Stn., Waseca; Professor, Dept of Soil Science, St. Paul.
98
RESULTS AND DISCUSSION
Rant
Stover N concentration at physiological maturity was significantly affected by fertilizer N but not by time of application (Table 1). Stover N wasincreased over the controlby all N treatmentswith no difference among the N treatments. Stover yield was increased over the control by allof the fertilizer N treatments (Table 1). Highest stover yields were obtained with the spring preplant applications of urea and AA + N-Serve.Stover yield was not influenced by fail vs spring application of AA. Similar to stover yield, N uptake in the stover was increased above thecontrol by all fertilizer N treatments (Table 1). Among the N treatments lowest N uptake in the stover occurred with the fall and preplant AAtreatments without a Nl and the sidedress AA treatment Final plant population was much lower than desired due to an error in sprocketselection but was not significantiy different among the treatments (Table 1).
Table 1. Influence of time of N application. N source and nitrification inhibitor on whole plant N. stover yield. N uptake, and final pntoiof com following soybeans.
N Application
Time Inhibitor
Primary trts
AA Fall No
AA Fall (10/25) Yes
'\APP(5/11) No
AAPPI5/11) Yes
Additional trts
Urea PP (5/11) No
AASDI6/16) No
Check (No N)
Latin square (Primary trts)
Significance Level (%)LSD (.05)
CV(%>
Completely randomized (7 trts)
Significance Level (%)LSD (.05)
CVI%)
Stover
N Yield N uptake
% TDM/A Ib/A
0.51 2.45 24.7
0.51 2.53 25.6
0.52 2.32 23.9
0.54 2.69 28.7
0.56 2.73 30.4
0.51 2.40 24.5
0.32 1.80
Statistical Analysis
11.5
21 90 97
- - 2.8
10.0 6.8 6.4
99 99 99
0.10 0.40 6.0
13.3 11.3 16.9
Final
Population
ppAxlO3
22.2
22.1
21.4
22.7
22.4
22.3
22.1
55
5.0
40
4.3
Grain and silage yields were increased significantly over the control by allof the N treatments (Table2). Fall application of N without Nl gaveconsistently lower grainand silageyields than the three other primarytreatments. Yields among the fail with Nland spring N treatments werenot different. Lowest grain moisture occurred with the check treatment, which is in contrast to previous years.
Grain N concentration was higher for all fertilizer N treatments compared to the control (Table 2). Among the four primary treatments,significantly higher grain N was found with the preplant AA + N-Serve treatment white the lowest grain N concentration occurred with thefall AA treatment without a Nl. Grain N concentrations tended to be higher with the spring AA + N-Serve and the urea treatments comparedto the fall and spring treatments without a Nl. Nitrogen uptake in the harvested grain was lowest with the fatl-applied N treatment withoutNl and highest for the spring urea treatment (Table 2). Total N uptake was increased over the control by 53.6 Ib/A (89%) for fall without aNl, 66.8 Ib/A (110%) for the fall + Nl, 68.5 ib/A (113%) for the spring preplant AA without Nl, 78.1 Ib/A (129%) for the preplant AA + N-Serve, 88.0 Ib/A (146%) for the preplant urea treatment, and 70.7 Ib/A (117%) for the sidedress AA treatment Among the four primarilytreatments, total N uptake was significantly lower for the fall AA without a Nl treatment and significantly higher for the spring preplant AA +N-Serve treatment.
The General LinearModel procedure in SAS*was used to "contrast" the fourprimarytreatments and determine if significantdifferences existed.The significance levels in Table 3 show an improvement in grainN concentration, grain yield, silage yield, grain N uptake, and silage N uptake(P =90% levell with an inhibitoradded to the fall-applied N. Spring applicationof N showed significant advantages over fall-applied N for grainN concentration, grain yield, silage yield, grain N uptake and silage N uptake. Adding N-Serve to spring preplant AA improved the grain Nconcentration, stover and silage yield, and total N uptake in the silage.
Water
Weather conditions during the 1994 growing season were very close to normal. Greatest tile flow occurred in April and October with muchless flow in May and August (Table 4). Drainage from the 16 com plots averaged 5.89" with 2.27" range among the four time/methodtreatments. Soybeans showed slightly less tile drainage compared to com with an average of 4.82" from the 16 plots and a range of 0.64"among the four time/methods. Ideally, drainage should be uniform among the time/method treatments, however, normal soil and drainagevariability exists in these plots and results in these unfortunate differences.
99
Table 2. Com grain and silageproduction as influenced bv time of application. N source, and nitrification inhibitor.
N application Grain SilageYield
Total N
Time Inhibitor Yield H?0 N N Uptake uptake
bu/A % % Ib/A TDM/A tb/A
Primary trts
AA Fell (10/25) No 161.5 25.9 1.17 89.3 6.27 114.0
AA Fell (10/25) Yes 170.4 27.4 1.26 101.6 6.56 127.2
AAPPC5/11) No 174.6 27.6 1.27 105.0 6.45 128.9
AAPP(5/11) Yes 174.6 26.1 1.33 109.7 6.82 138.5
Additional trts
Urea PP (5/11) No 183.6 29.5 1.36 118.0 7.07 148.4
AASDI6/16) No 173.3 27.9 1.30 106.7 6.50 131.1
Check (No N) -- 117.1 24.7 0.89
Statistical Analysis
48.9 4.57 60.4
Latin sauare (Primary trts] I
Significance Level (%) 99 74 99 99 97 99
LSD (.05) 7.4 - 0.05 6.9 0.33 7.7
CV(%) 2.5 5.0 2.3 3.9 3.0 3.5
Completely randomized (7 trts)Significance Level (%) 99 99 99 99 99 99
LSD (.05) 15.9 21 0.07 12.0 0.69 15.2
CV(%) 6.6 5.4 4.1 8.4 7.4 8.5
Table 3. Sonificance levels for differences amono the four primary treatments as determined bv contrast statistics.
Contrast
Fall w/o Inhibitor Fallvs Spring w/o InhibitorParameter vs Fall w/ Inhibitor Spring vs Spring w/ Inhibitor
Stover N Concentrationi 0 56 44
Grain N Concentration 99 99 97
Grain Moisture 84 17 83
Grain Yield 97 99 1
Stover Yield 47 11 98
Siege Yield 92 93 97
Final Population 14 17 86
Stover N Uptake 52 78 99
Grain N Uptake 99 99 86
Silage N Uptake 99 99 98
Monthly flow-weighted NCyN concentrations in the com plots showed little temporal variation throughout the year (Table 5). Nitrate-Nconcentrations remained high throughout the drainageseason for both the fall AA without Nl and spring preplant AA + N-Serve treatments.The only possible explanation for the high N03-N concentrations in April from the spring preplant AA + N-Serve treatment applied in May iscarryoverand accumulation of N03 in the 3 to 5" soilprofile from the split-applied N treatment appliedin 1992. Higher NCyN concentrationsfromthese plots also were found in 1993 when soybeans were grown, and the soybeans may not have scavenged all of the NfA, fromthisdepthinthe profile. Nitrate-N concentrations werequheuniform among all four replications. Ftow-wei(jhted NCyNconcentrations for the yearwere highest forthe fall treatment, lowest for the fall + Nland springAA treatments, and intermediateforthe springAA + N-ServetreaimentThese concentrationswere similar to those found in 1993. but lowerthan in previousyears. This was probably due to the high rainfall thatoccurred from 1991 through 1993. Thesedataclearly show the susceptibility of fall-applied Nwithouta Nlto lossof N03intile drainage watereven under normal growing season rainfall conditions.
In the soybean plots, where N had been applied either in the fall of 1992 or spring of 1993, NCyN concentrations were consistentlylowerthroughout the seasonandneveraveraged greater than 10 mg/L{Table 5). Highest flow-weighted NCyN concentrations were found withthefall AA + N-Serve treatment, especially earlyin the season. Nitrate-N concentration underan 8-yearcontinuous fallow system (no fertilizerN applied) were approximately 2 to 3 times higher than fromthe fertilized com and soybean plots.
100
Table 4. Tile water discharge from the com, soybean, and fallow plots in 1994.
N applicationTime
Fall (10/25)
Fall (10/25)Spring (5/11)Spring (5/11)
Fall (Oct.)'
Fall (Oct.)1Spring (April)'
Split'
NONE
Inhibitor
No
Yes
No
Yes
No
Yes
No
No
April May August Oct. Total
Com
2.75 0.22 0.19 2.85 6.01
3.27 0.35 0.29 3.19 7.10
2.57 0.33 0.26 2.46 5.62
2.22 0.08 0.29 2.24 4.83
Soybean
2.75 0.27 — 2.12 5.14
2.63 0.26 — 2.20 5.10
2.20 0.27 — 1.96 4.50
2.28 0.29
Fallow
1.97 4.54
2.28 0.22 0.17 2.04 4.71
N applied for the 1993 com crop at 135 lb N/A (See 1993 report for treatment descriptions).
Table 5. Flow-weighted NO,-N concentrations for each month from the com, soybean, and fallow plots in 1994.
N application
Time Inhibitor
Fall (10/25) No
Fail (10/25) Yes
Spring (5/11) No
Spring (5/11) Yes
Fall (Oct)' No
Fall (Oct.)' Yes
Spring (April)1 No
Split1 No
NONE
April May August Oct. Total
INCyN
Com
12.7 10.3 13.1 11.8 12.3
7.9 8.2 9.3 7.6 7.9
7.5 6.9 7.7 8.0 7.8
11.7 13.1 12.1 10.6 11.2
Soybeani
6.2 5.5 — 6.3 6.3
8.8 6.8 — 6.7 7.9
5.5 5.5 — 6.5 6.0
6.7 6.5
Fallow
7.0 6.8
21.1 19.8 21.3 19.0 20.2
1 N applied for the 1993 com crop at 135 lb N/A (See 1993 report for treatment descriptions).
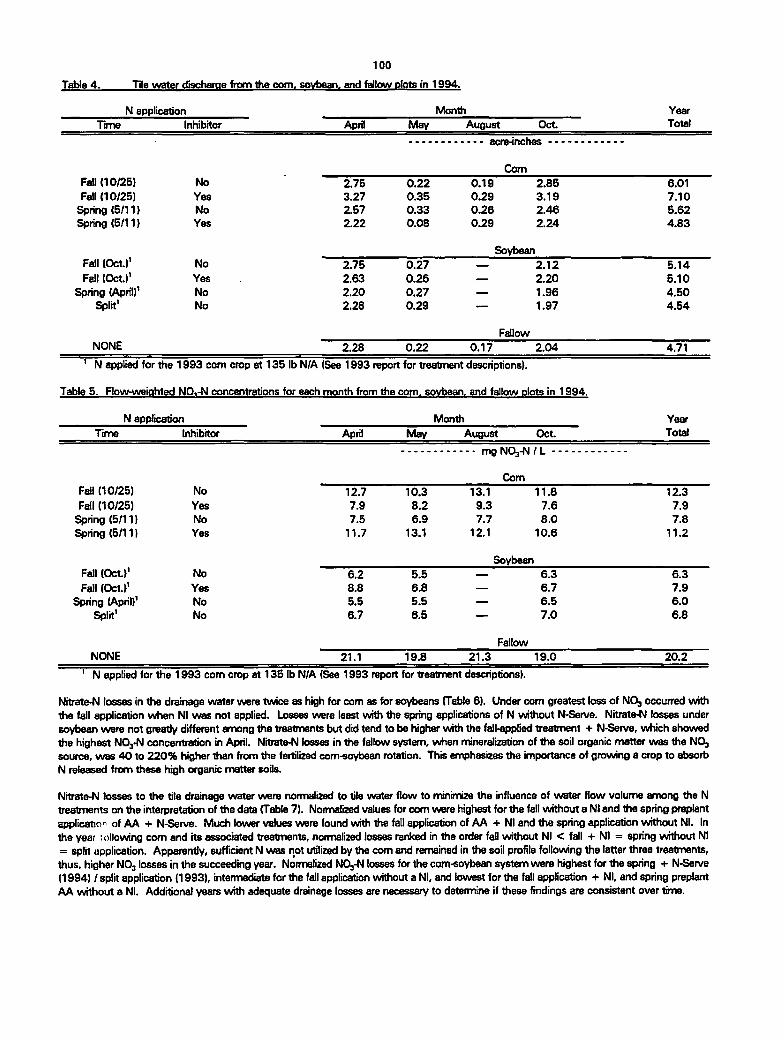
Nitrate-N losses in the drainage water were twice as high forcom as forsoybeans {Table 6). Undercom greatest loss of NO, occurredwiththe fall applicationwhen Nl was not applied. Losses were least with the spring applications of N without N-Serve. Nitrate-N losses undersoybean were not greatlydifferentamong the treatments but did tend to be higherwith the fall-applied treatment + N-Serve, which showedthe highest N03-N concentration in April. Nitrate-N losses inthe fallow system, when mineralization of the soil organic matter was the NO,source, was 40 to 220% higher than from the fertilized corn-soybean rotation. This emphasizes the importance of growing a crop to absorbN released from these high organic matter soils.
Nitrate-N tosses to the tile drainage water were normalized to tile water flow to minimize the influence of water flow volume among the Ntreatments on the interpretation of the data (Table 7). Normalized values for com were highest forthe fall without a Nland the springpreplantapplication of AA + N-Serve. Much lowervalues were found with the fall application of AA + Nland the springapplication without Nl. Inthe year following com and its associated treatments, normalized losses ranked in the order fell without Nl < fall + Nl = springwithout Nl= splitapplication. Apparently, sufficientN was not utilized by the com and remained in the soilprofile following the latterthree treatments,thus, higherN03losses inthe succeeding year. Normalized NCyN losses for the corn-soybean system were highestfor the spring + N-Serve(1994) / splitapplication (1993), intermediate forthe fall application without a Nl,and lowest for the fall application + Nl, and springpreplantAA without a Nl. Additional years with adequate drainage losses arenecessary to determineif these findings are consistent over time.

101
Nitrate-N toss for each month from the com, soybean, and fallow plots in 1994.Table 6.
N application Month Year
Time Inhibitor April May August Oct. Total
No
Yes
No
Yes
No
Yes
No
No
lb NOj-N/
Com
A
Fail (10/25)
Fall (10/25)
Spring (5/11)Spring (5/11)
7.2
5.6
4.3
6.0
0.5
0.6
0.5
0.2
0.5
0.5
0.4
0.8
Soybean
7.2
5.1
4.2
5.6
15.5
11.8
9.4
12.7
Fall (Oct.)'Fall (Oct.)'
Spring (April)'Split'
3.7
5.1
3.1
3.7
0.4
0.4
0.4
0.5
Fallow
2.7
3.1
3.5
3.2
6.7
8.6
7.2
7.3
NONE 10.8 1.0 0.8 8.8 21.4
1 N applied for the 1993 com crop at 135 lb N/A (See 1993 report for treatment descriptions).
Table 7. "Flow-normalized" NCv-N losses to tile drainage in a com-sovbean seauence in 1994.
Time/Method of N ApplicationCropSystem1 Fall No Inhibitor Fall Inhibitor Spring No Inhibitor Spring Inhibitor / Split
NCyN lost (Ib/A/inch of drainage)
1.66 1.67
1.69 1.60
1.68 1.64
Com
Soybean2
Com Soybean System
2.58
1.30
1.94
2.63
1.61
2.12
1 Continuous fallow (8 years without fertilizer N) = 4.542 N applied for the 1993 com cropat 135 lb N/A (See 1993 report for treatmentdescriptions).
Soil
Nitrate-N remainingin the 0-8' soil profile of the fallowsystem in late-April was about 65% highercompared to the spring of 1993 when NCyNaocumulationswere very low (Table 8). InNovember. NCyN levelsabove the tilebnes were similar to those in April,however, slightlyhigherNCyN eccwnulations were found below the tile lines. Although NCyN remaintng in the 8-ft soil profile after harvest for allof the N treatmentswas abghtiyabove the check, very bttledifference existed among the soc N treatments. Highest NCyN levels were found in the surface footwhde levels throughout the rest of the profile were very low.
Table 8. Nitrated1 in the soil profile of the lallow plots and all com plots as influenced by N treatment.
Fallow NOj-N N Treatment for Com
Profile depth Spnng Fall FailAA FallAA + NI PPAA PPAA*NI Urea SDAA Check (No N)
feet • •• Ib/A -•- --- Ib/A
0-1 17 21 28 22 25 23 24 21 25
1 •2 18 12 14 11 15 12 10 11 11
2 • 3 17 11 10 8 10 11 8 11 83 • 4 12 14 8 9 7 9 7 9 54 •5 14 23 12 11 7 10 10 10 55 6 18 25 13 11 8 12 8 9 76 7 16 17 12 10 9 12 10 8 9
7 8 15 20 14 11 11 14 9 9 9
Total in
0-5' profile 79 81 72 61 64 65 59 62 540-8' profile 129 143 111 93 92 103 86 88 79
102
NITROGEN FERTILIZATION OF ESTABUSHED REED CANARYGRASS
G. W. Randall, J. A. Vetsch, and M. P. Russelle2'
ABSTRACT: Recently developed low-alkaloid varieties of reed canarygrass are being considered as an alternative forage for dairyenterprises. The objectives of this 3-year study were to determine the effect of single early-season and split applications of fertilizerN on the yield and quality of reed canarygrass. Forage yields in 1994 were 1.2 T DM/A less than in previous years and yield wasoptimized at 200 lb N/A compared to 250 to 300 lb N/A in 1992 and 1993, respectively- Single applications of N were as effectiveas split applications for forage yield. Increasing fertilizer N rate significantly increased total N and NCyN concentrations in the forage.ForageNCyN concentration reached toxic levels with fertilizer rates greaterthan 350 lb N/A for the second harvest and 500 lb N/Afor the third harvest Apparent N recovery declined sharply when fertilizer N rate exceeded 200 lb N/A. The effects of splitapplication on N recovery were inconsistent. Recoveries were less than previous years. Residual soil NCyN (RSN) in Novemberaccumulated in the top 2 ft with rates less than or equal to 300 lb N/A, while at rates greater than 400 lb N/A RSN was found below3 ft. The residual effects of nitrogen application to reed canarygrass were measured from last year's site. Nitrogen treatments,applied in 1993, significantly affected forage yield, total N, plant NCyN, and N uptake in 1994. Nearly20% of 600 lb N/A appliedin 1993 was recovered in forage in 1994. This suggests that not all residual N will be lost to ground and surface water whenoptimum N rates are exceeded.
EXPERIMENTAL PROCEDURES
Twenty plots, measuring 20 ft by 40 ft were laid out on established reed canarygrass (variety Palaton) in April 1994 on a Webster clay loamsoil. Plots were fertilizedwith varying rates of N as ammonium nitrateon April 11. After the firstcutting the main plots were split into subplotsand again were fertilized with varying rates of N as ammonium nitrate on June 20 (Table 1). A randomized complete block design with fourreplicateswas used in the analysis of the first harvest (June 2). An unbalanced split-plot design was used for the second (July 18) and third(Sept 14) harvests. Yields were taken by harvesting a 3 ft by 38 ft swath (first cut) and a 3 ft by 19 ft swath (second and third cuts) fromeach plot Forage subsamples were taken and analyzed for moisture content, total Kjeldahl N, and plant NCyN concentration. The total Nanalyses were conducted by the Research Analytical Laboratory (RAD and the NCyN analyses by Dr. Russelle's Laboratory in St. Paul. Soilsamples, three cores per plot to a depth of 5 ft in 1 ft increments, were taken from selected treatments on November 9. All soil samples wereimmediately forced-air driedat 125° F, then ground and analyzed for NCyN by the RAL.
Yields were taken from selected plots (0,200,300,400,600 lb N/A) from the 1993 research area to determine residual N effects. The harvestmethods, harvest dates, and sample procedures were the same as those used in the 1994 study.
RESULTS AND DISCUSSION
Yield
First harvest dry matter yields increased significantiy from the early (April 11) applicationof N fertilizer compared to the control {zero N plots).Yields were not increased by rates > 150 lb N/A (Table 1). Second and third harvest yields were not affected solely by the Aprilapplicationof N. Second and third harvest yields increased significantly up to 100 lb N/A for the June application. A significant (April x June) interactionwas found for both the second and third harvest This interaction is explained by a 0.71 and 0.60 T DM/A yield increase for the second andthird harvests, respectively, when 150 lb N/A was applied in June and no N was applied in April compared to a 0.20 T DM/A yield decreasefor both second and third harvests with the same June rate applied to plots receiving 200 lb N/A in April. Moreover, the highest second cutyield (1.48 T DM/A) occurred with the 0 + 150 lb N/A (April + June) application rate, compared to 1.19 T DM/A when 150 lb N/A wasapplied in both April and June. The 0 + 150 (April + June), 50 + 150, and 100 + 150 lb N/A treatments produced equally high yields forthe third harvest.
Total drymatteryieldwas optimizedwith a totalof 200 lb N/A. An April application of 200 lb N/A producedyieldsequalto the splitapplicationof 100 + 100 end 50 + 150 lb N/A. The significant interaction for total dry matter yield is shown by the 1.31 T DM/A yield increase when150 lb N/A was applied in June to plots that received no N in April,compared to only a 0.61 T DM/A increase when the same June rate wasappliedto plots receiving 150 lb N/A in April. Also, yield decreased when 200 lb N/A was applied in June to plots receiving 200 lb N/A in April.Less fertilizer N (200 lb N/A compared to 250 lb N/A in 1992 and 300 lb N/A in 1993) was required to obtain optimum yield of reedcanarygrass in 1994. Total dry matter yields were significantly less (1.2 T DM/A), compared to 1992 and 1993. Decreased fertilizer N needslor 1994 were attributed partly to the lower yields.
N Concentration
Total N concentrationin the forage increased significantly with N application (both April and June) forall three harvests (Table 2). Inthe firstharvest forageN concentration increased significantiywith April rates up through 200 lb N/A. Also, nitrogen concentration in the forage fromsecond and third harvests increased significantly with June rates up to 200 lb N/A. Nitrogen concentration in the forage from the secondharvestwas very high forthe 0 + 150 lb N/A application, suggesting rapid uptake of N inthe 28-day period between application and harvest.Generally, June N affected N concentrationmore than April N for the second and third harvests. The treatment effects on N concentrationare consistent with the observed significant yield interaction between April and June applications.
!' Professor and Assistant Scientist, So. Exp. Stn., Waseca; Soil Scientist USDA-ARS-US DairyForage Research Center, St. Paul.

103
Table 1. Dry matter yield of Reed Canarygrass as influenced bv N fertilization at Waseca in 1994.
Rate/Time of ApplicationApril 11 June 20
0
0
0
0
50
50
50
50
100
100
100
100
150
150
150
150
200
200
200
200
300
300
300
300
•tbN/A •
Individual Factors
April N Rate
0
50
100
150
200
300
Significance level (%):BLSD (0.05):
June N Rate
0
50
100
150
200
300
Significance level (%):BLSD (0.05):
Interaction 'April x June'
Significance level (%):C.V. (%):
NC-N Concentration
0
50
100
150
0
50
100
150
0
50
100
150
0
50
100
150
0
50
150
200
0
150
200
300
Harvest Number and (Date)
1st (June 2) 2nd (July 18) 3rd (Sept. 14) Total
TDM/A -
1.09 0.77 0.43 2.30
1.26 0.74 3.09
1.41 0.94 3.43
1.48 1.03 3.61
1.46 0.84 0.50 2.80
1.23 0.73 3.42
1.30 0.93 3.69
1.34 1.07 3.87
1.46 0.90 0.64 2.94
1.17 0.74 3.31
1.42 0.94 3.77
1.30 1.08 3.78
1.60 0.86 0.63 3.05
1.15 0.76 3.51
1.15 0.83 3.57
1.19 0.88 3.66
1.81 1.13 0.99 3.92
1.04 0.88 3.74
0.93 0.79 3.52
1.03 0.64 3.48
1.83 1.04 0.89 3.75
0.96 0.70 3.49
0.90 0.77 3.51
1.07 0.72 3.61
1.09 1.23 0.78 3.11
1.46 1.18 0.80 3.45
1.46 1.19 0.85 3.51
1.60 1.09 0.77 3.46
1.80 1.03 0.82 3.66
1.80 0.99 0.77 3.59
99 85 39 99
0.32 0.26
0.92 0.68 3.14
1.17 0.77 3.42
1.32 0.91 3.63
1.20 0.92 3.67
0.97 0.70 3.49
1.07 0.72 3.61
99 99 99
0.11 0.11 0.17
99 99 99
7.4 12.0 17.0 6.1
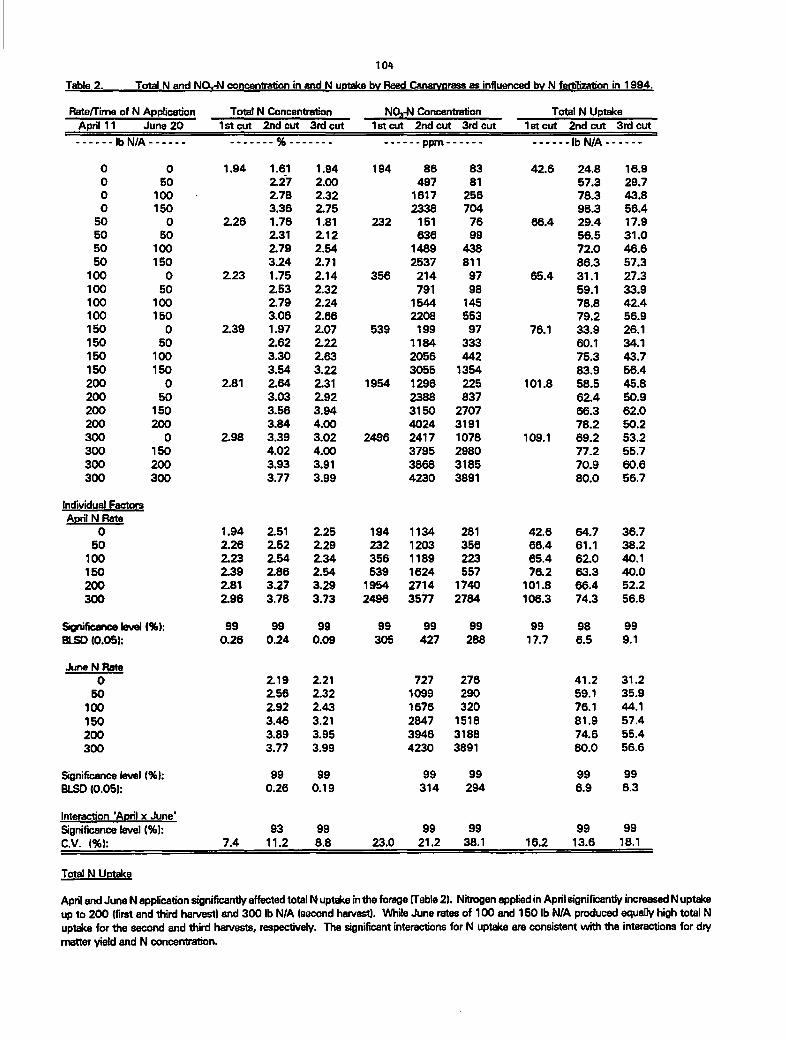
Fertilizer nitrogen application significantiy affected plant NCyN concentration (Table 2). Nitrate concentration in the forage increased withincreasing N rate for all harvests at allrates for both April and June applications. A significant interaction was found forboth the second andthird harvests. This interaction is shown by a 1400% increase in NCyNconcentration for the 150 + 150 lb N/A plots compared to 150 +0 lb N/A plots and only a60% increase for the300 + 150lbN/A plots compared to the300 + 0 lb N/A plots (second harvest). Forage N03-N reached toxic levels (> 3500 ppm) when total N applied was i 400 (second harvest) and = 600 lb N/A (third harvest).
104
Table 2. Total N and NCyN concentration in and N uptake bv Reed Canarygrass as influenced bv N fertilization in 1994.
Rate/Time of N ApplicationApril 11 June 20
-lbN/A -
0
0
0
O
50
50
50
50
100
100
100
100
150
150
150
150
200
200
200
200
300
300
300
300
0
50
100
150
0
50
100
150
0
50
100
150
0
50
100
150
0
50
150
200
0
150
200
300
Individual Factors
April N Rate
0
60
100
150
200
300
Significance level (%):BLSD (0.05):
June NRate
0
50
100
150
200
300
Significance level (%):BLSD (0.05):
Interaction 'April x June'
Significance level (%):C.V. (%):
Total N Concentration
1st cut 2nd cut 3rd cut
%
1.94
2.26
2.23
2.39
2.81
2.98
1.61
2.27
2.78
3.36
1.76
2.31
2.79
3.24
1.75
Z53
2.79
3.06
1.97
2.62
3.30
3.54
2.64
3.03
3.56
3.84
3.39
4.02
3.93
3.77
1.94
2.00
2.32
2.75
1.81
Z12
2.54
2.71
2.14
2.32
2.24
2.66
2.07
2.22
2.63
3.22
2.31
2.92
3.94
4.00
3.02
4.00
3.91
3.99
NCyN Concentration
1 st cut 2nd cut 3rd cut
194
232
356
539
1954
2496
-- - ppm -
86
497
1617
2338
151
636
1489
2537
214
791
1544
2208
199
1184
2056
3055
1296
2388
3150
4024
2417
3795
3868
4230
83
81
256
704
76
99
438
811
97
98
145
553
97
333
442
1354
225
837
2707
3191
1078
2980
3185
3891
Total N Uptake1 st cut 2nd cut 3rd cut
42.6
66.4
65.4
76.1
101.8
109.1
•lb N/A
24.8
57.3
78.3
98.3
29.4
56.5
72.0
86.3
31.1
59.1
78.8
79.2
33.9
60.1
75.3
83.9
58.5
62.4
66.3
78.2
69.2
77.2
70.9
80.0
16.9
29.7
43.8
56.4
17.9
31.0
46.6
57.3
27.3
33.9
42.4
56.9
26.1
34.1
43.7
56.4
45.8
50.9
62.0
50.2
53.2
55.7
60.6
56.7
1.94 Z51 2.25 194 1134 281 42.6 64.7 36.7
2.26 2.52 2.29 232 1203 356 66.4 61.1 38.2
Z23 2.54 Z34 356 1189 223 65.4 62.0 40.1
2.39 2.86 Z54 539 1624 557 76.2 63.3 40.0
2.81 3.27 3.29 1954 2714 1740 101.8 66.4 52.2
2.96 3.78 3.73 2496 3577 2784 106.3 74.3 56.6
99 99 99 99 99 99 99 98 99
0.26 0.24 0.09 305 427 288 17.7 6.5 9.1
Z19 2.21 727 276 41.2 31.2
2.56 2.32 1099 290 59.1 35.9
Z92 2.43 1676 320 76.1 44.1
3.46 3.21 2847 1518 81.9 57.4
3.89 3.95 3946 3188 74.6 55.4
3.77 3.99 4230 3891 80.0 56.6
99 99 99 99 99 99
0.26 0.19 314 294 6.9 6.3
93 99 99 99 99 99
7.4 11.2 8.8 23.0 21.2 38.1 16.2 13.6 18.1
Total N Uptake
April and June Napplication significantly affectedtotalNuptakeinthe forage (Table 2). Nitrogen applied in April significantiy increased Nuptakeup to 200 (first and third harvest) and 300 lb N/A (second harvest). While June rates of 100 and 150 lb N/A produced equally hightotalNuptake for the second and third harvests, respectively. The significant interactions for N uptake areconsistent with the interactions fordrymatter yield and N concentration.
105
Annual Uptake of Total N and NCvN and Apparent N Recovery
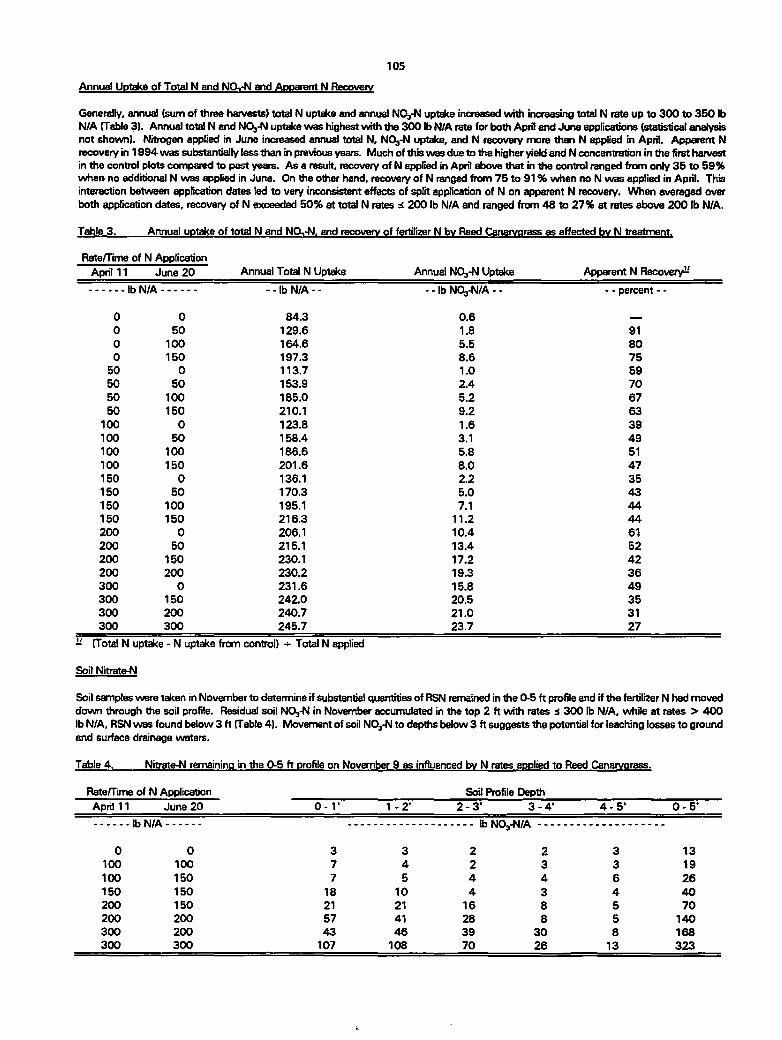
Generally, annual (sum of three harvests) total N uptake and annual NCyN uptake increasedwith increasingtotal N rate up to 300 to 350 lbN/A (Table3)- Annual total N and NCyN uptake was highest with the 300 lb N/A rate for both Apriland June applications (statistical analysisnot shown). Nitrogen applied in June increased annual total N, NCyN uptake, and N recovery more than N applied in April. Apparent Nrecovery in 1994 was substantially less than in previous years. Much of this was due to the higher yield and N concentration in the first harvestin the control plots compared to past years. As a result, recovery of N applied in April above that in the control ranged from only 35 to 59%when no additional N was applied in June. On the other hand, recovery of N ranged from 75 to 91 % when no N was applied in April. Thisinteraction between application dates led to very inconsistent effects of split application of N on apparent N recovery. When averaged overboth application dates, recovery of N exceeded 50% at total N rates 3 200 lb N/A and ranged from 48 to 27% at rates above 200 lb N/A.
Table 3. Annual uptake of total N and NOvN. and recovery of fertilizer N bv Reed Canarygrass as affected bv N treatment.
Rate/Time of N Application
April 11 June 20
- lb N/A -
0
0
0
50
50
50
50
100
100
100
100
150
150
150
150
200
200
200
200
300
300
300
300
50
100
150
0
50
100
150
0
50
100
150
0
50
100
150
0
50
150
200
0
150
200
300
Annual Total N Uptake
- lb N/A •
84.3
129.6
164.6
197.3
113.7
153.9
185.0
210.1
123.8
158.4
186.6
201.6
136.1
170.3
195.1
216.3
206.1
215.1
230.1
230.2
231.6
242.0
240.7
245.7
- (Total N uptake - N uptake from control) ->- Total N applied
Soil Nitrate-N
Annual NCyN Uptake
-lb NCyN/A -
0.6
1.8
5.5
8.6
1.0
2.4
5.2
9.2
1.6
3.1
5.8
8.0
2.2
5.0
7.1
11.2
10.4
13.4
17.2
19.3
15.8
20.5
21.0
23.7
ApparentN Recovery1-'
- - percent - -
91
80
75
59
70
67
63
39
49
51
47
35
43
44
44
61
52
42
36
49
35
31
27
Soil samples were taken in November to determine if substantial quantities of RSN remained in the 0-5 ft profileand if the fertilizer N had moveddown through the soil profile. Residual soil NCyN in November accumulated in the top 2 ft with rates 3 300 lb N/A, while at rates > 400lb N/A, RSN was found below 3 ft (Table 4). Movement of soilNCyN to depths below 3 ft suggests the potentialforleachinglosses to groundand surface drainage waters.
Table 4. Nitrate-N remaining in the 0-5 ft profile on November 9 as influenced bv N rates appliedto Reed Canarygrass
Rate/Tim*) of N Application
June 20
Soil Profile Depth
April 11 0-V 1-2' 2-3' 3-4' 4-5' 0-5'
lb N/A lb Mfl -N/A
0 0 3 3 2 2 3 13
100 100 7 4 2 3 3 19
100 150 7 5 4 4 6 26
150 150 18 10 4 3 4 40
200 150 21 21 16 8 5 70
200 200 57 41 28 8 5 140
300 200 43 46 39 30 8 168
300 300 107 108 70 26 13 323
106
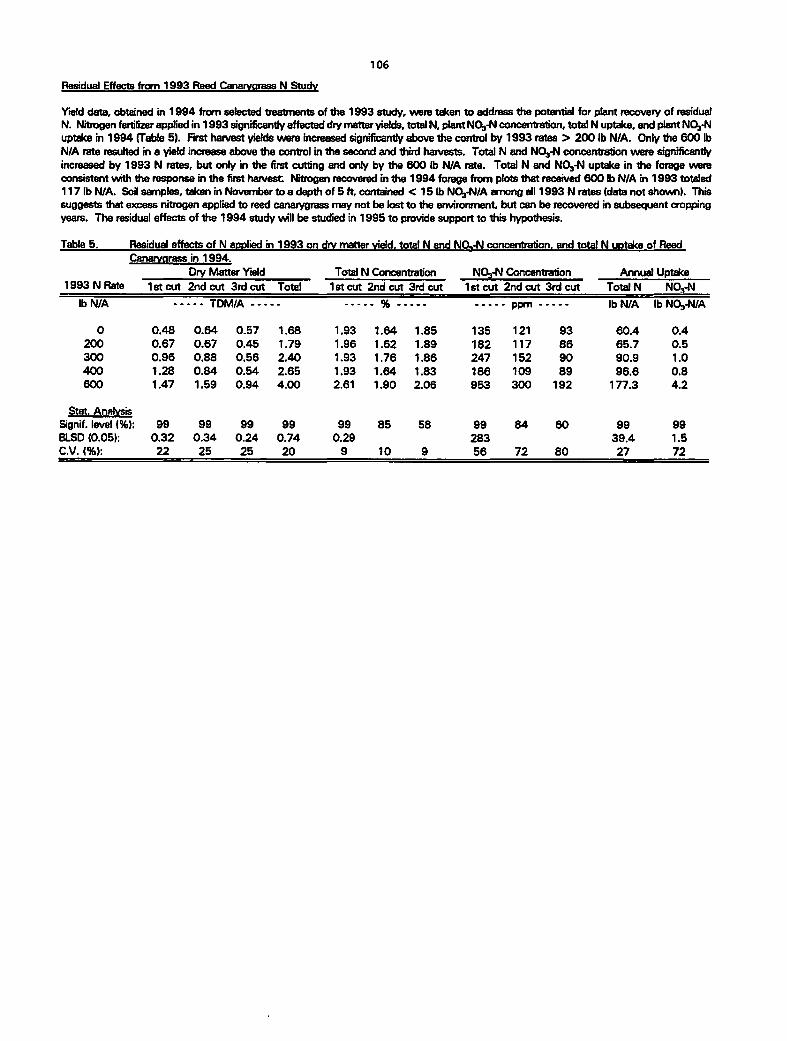
Residual Effects from 1993 Reed Canarygrass N Study
Yield data, obtained in 1994 from selected treatments of the 1993 study, were taken to address the potential for plant recovery of residualN. Nitrogen fertilizer applied in 1993 significantiyaffected dry matter yields, total N, plant NCyN concentration, total N uptake, and plant NCyNuptake in 1994 (Table 5). First harvest yields were increased significantly above the control by 1993 rates > 200 lb N/A. Only the 600 lbN/A rate resulted in a yield increase above the control in the second and third harvests. Total N and NCyN concentration were significantlyincreased by 1993 N rates, but only in the first cutting and only by the 600 lb N/A rate. Total N and NCyN uptake in the forage wereconsistent with the response in the first harvest Nitrogen recovered in the 1994 forage from plots that received 600 lb N/A in 1993 totaled117 lb N/A. Soil samples, taken in November to a depth of 5ft, contained < 15 lb NCyN/A among all1993 N rates (data not shown). Thissuggests that excess nitrogen applied to reed canarygrass may not be tost to the environment but can be recovered in subsequent croppingyears. The residualeffects of the 1994 study will be studied in 1995 to provide support to this hypothesis.
Table 5. Residualeffects of N appliedin 1993 on dry matter yield, total N and NCvN concentration, and total N uptake of ReedCanarygrass in 1994.
DryMatterYield Total N Concentration NCyN Concentration Annual Uptake1993 NRate 1st cut 2nd cut 3rd cut Total 1st cut 2nd cut 3rd cut 1 st cut 2nd cut 3rd cut Total N NCyN
lb N/A --- TDM/A --- • - % -• - ppm - lb N/A lb NCyN/A
0 0.48 0.64 0.57 1.68 1.93 1.64 1.85 135 121 93 60.4 0.4
200 0.67 0.67 0.45 1.79 1.96 1.62 1.89 182 117 86 65.7 0.5
300 0.96 0.88 0.56 2.40 1.93 1.76 1.86 247 152 90 90.9 1.0
400 1.28 0.84 0.54 2.65 1.93 1.64 1.83 186 109 89 96.6 0.8
600 1.47 1.59 0.94 4.00 2.61 1.90 2.06 953 300 192 177.3 4.2
Stat. Analysis
Signif. level <%): 99 99 99 99 99 85 58 99 84 60 99 99
BLSD (0.05): 0.32 0.34 0.24 0.74 0.29 283 39.4 1.5
C.V. (%): 22 25 25 20 9 10 9 56 72 80 27 72
107
FERTILIZER AND MANURE NITROGEN MANAGEMENT
IN SOUTHEASTERN MINNESOTA"
G. W. Randall and J. A. Vetsch*
1994
ABSTRACT: A 3-yr study has been conducted on a Port Byron sil in Olmsted Co. to develop best managementpractices (BMPs) for fertilizer Nand manure for com in southeastern Minnesota. Three-year results indicate com yieldsand profitability to be optimized at the 120-lb N rate applied in the spring prior to planting. Split and sidedress Napplications did not consistently increase yield or profitability above that from preplant applications. Nitrate-Nconcentrations in the soil and the soil water increased markedly with increasing fertilizer N rate and clearly indicate theenvironmental impact of over-application of both fertilizer N and manure. Although the high rate of manure appliedevery-other-year resulted in highest yields in the year of application, residual effects on yield in the year after applicationwere minimal while NCyN concentrations in the soil water at 7.5' were markedly higher compared to the annualapplications. Additional years will be needed to more clearly distinguish the long-term differences among treatmentsfor the establishment of more precise BMPs.
Management of nitrogen from both fertilizer and manure is vitally important to the economic profitabilityof southeastern Minnesotacrop producers and the environmental quality of this region's resources. The overall purpose of this study is to develop bestmanagement practices (BMPs) for fertilizer N and manure for com grown on well-drained, silt loam soils of southeastern Minnesota.Sub-objectives include determining: a) the optimum profitability associated with various rates and times of N application and b)the downward movement and distributionof nitrates through the soil profileas influenced by rates and times of N application andannual vs every-other-year application of dairy manure.
MATERIALS AND METHODS
A 5-year study (1987-91) at this site (Richard Lawler & Sons Farm) showed the optimum rate of fertilizer N to be between 75 and150 lb N/Aapplied in the spring prior to planting. Thus, this study was started in 1992 to determine more precisely the optimumrate of fertilizer N for continuous com and whether split or sidedress applications would be advantageous. The fertilizer treatmentswere applied as urea and were compared to liquid dairy manure treatments. The spring preplant fertilizer treatments werebroadcast-applied and field cultivated in while the sidedress treatments were knifed in about 4" deep. The nutrient analyses ofthe liquid dairy manure used each year are given in Table 1 while the nutrient amounts added each year are given in Table 2.The manure was sweep-injected about 4" deep prior to planting. All plots were chisel plowed each fall.
Com (Pioneer 3751 in 1992 and 1993 and Pioneer 3861 in 1994) was planted at 32000 plants per acre without starter fertilizer.Force was used to control com rootworm. Yields were taken by combine harvesting the center two rows in 1992 and 1994 andby hand-harvesting in 1993.
Soil water samples were obtained periodically throughout the season (May - Nov.) from porous cup samplers installed at the 5 and7.5' depths. Soil samples were taken to an 8-foot depth from each plot each fall.
RESULTS
Yields
Grain yields shown in Table 3 were rather low in 1992 and 1993 but were quite respectable in 1994. Optimum yield each yearand the greatest economic retum to the fertilizer was obtained with the 120-lb preplant N rate. Splitting the N applications intopreplant and sidedress application at the 7 to 8-leaf stage (com 12-15" tall) did not consistently improve the 3-yr yield or profit;although the split-applied 90-lb rate was 4 bu/A and S6/A better than the single preplant 90-lb rate. Applying all of the N at the8-leaf stage resulted in slightly poorer yields and about $5/A less profit compared to the same N rate applied preplant. Thisemphasizes the point that sidedress N needs to be applied before the V4 stage (6-leaf) in continuous com if yieldsand fertilizer efficiency are to be optimized.
In 1992, grain yield was 23 bu/A higher withthe 8650-gal manure treatment (no. 10) compared to the 3700-gal treatment (Table 3)However, the residual effect of the high manure rate was minimal in 1993 when yields were 19 bu/A lower than the annual average4100-gal rate (trt. no. 9). Three annual applications averaging 4400 gal/A (145 lbtotal N/A/yr) (trt. no. 9) produced 3-year averagecom yields which were similar to those from the 90-lb fertilizer N rate. Similar to 1992, the large every-other-year treatment(trt. no. 10) produced a yield in 1994 that was 23 bu/A higher than the annual rate of manure. This yield of 167 bu/A was similarto that obtained with the 120-lb fertilizer N rate, but silage production was 0.7 tons dry matter/A higher with the heavy manuretreatment (data not shown).
v Support for thisproject has been provided bythe Centerfor Agricultural Impacts on Water Quality and the Southern ExperimentStation.
v Professorand Asst Scientist, respectively, Southern Experiment Station, Waseca.
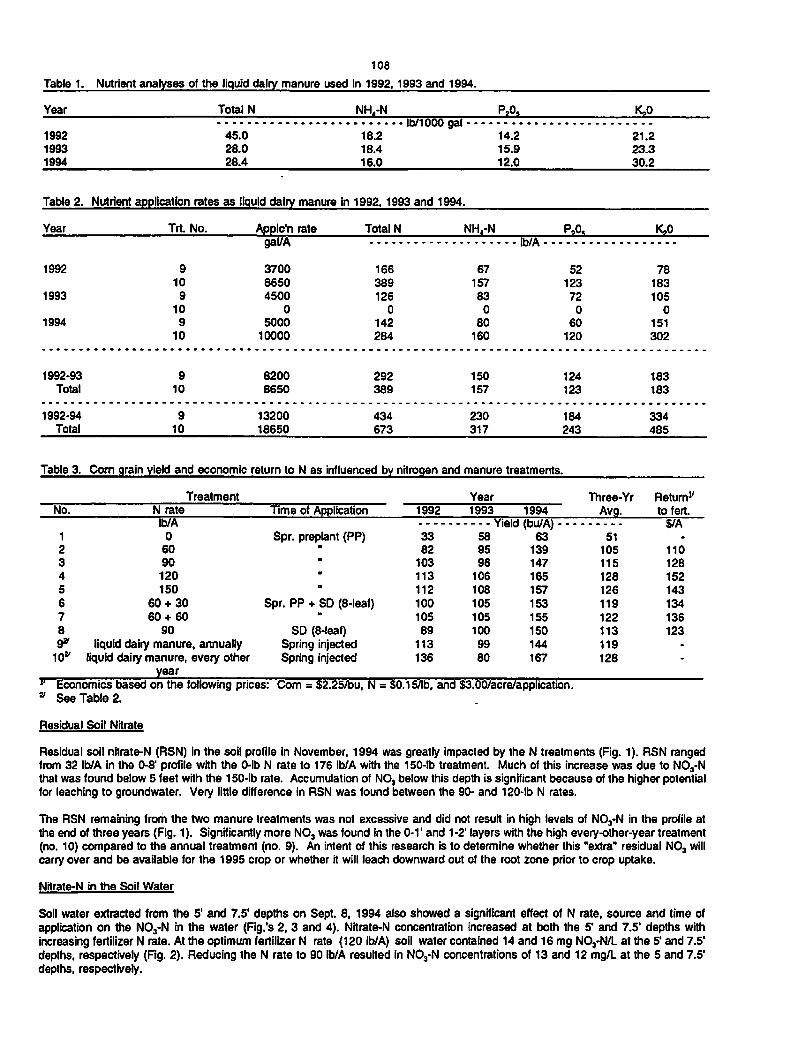
Table 1.
108
Nutrient analyses of the liquid dairy manure used in 1992,1993 and 1994.
Year Total N NH.-N PA K,0
1992
1993
1994
45.0 18.2
28.0 18.4
28.4 16.0
14.2
15.9
12.0
21.2
23.3
30.2
Table 2. Nutrient application rates as liquid dairy manure in 1992,1993 and 1994.
Year Trt. No. Applc'nrate Total N NH,-N PA K,0
1992
1993
1994
1992-93
Total
1992-94
Total
9
yai/r»
3700 166 67 52 78
10 8650 389 157 123 183
9 4500 126 83 72 105
10 0 0 0 0 0
9 5000 142 80 60 151
10 10000 284 160 120 302
9
10
9
10
8200
8650
13200
18650
292
389
434
673
150
157
230
317
124
123
184
243
183
183
334
485
Table 3. Com grain yield and economic return to N as influenced by nitrogen and manure treatments.
Treatment Year Three-Yr Return1'No. N rate Time of Application 1992 1993 1994 Avg. to fert.
Ib/A Yield (bu/A) $/A
1 0 Spr. preplant (PP) 33 58 63 51 -
2 60H
82 95 139 105 110
3 90H
103 96 147 115 128
4 120M
113 106 165 128 152
5 150II
112 108 157 126 143
6 60+30 Spr. PP + SD (8-leaf) 100 105 153 119 134
7 60 +60M
105 105 155 122 136
8 90 SD (8-leaf) 89 100 150 113 123
9* liquid dairy manure,, annually Spring injected 113 99 144 119 -
to" liquid dairy imanure, <
year
avery other Spring injected 136 80 167 128 -
11 Economics based on the following prices: Com = $2.25/bu, N ==SO.lS/lb. and S3.00/acre/application.* See Table 2.
-
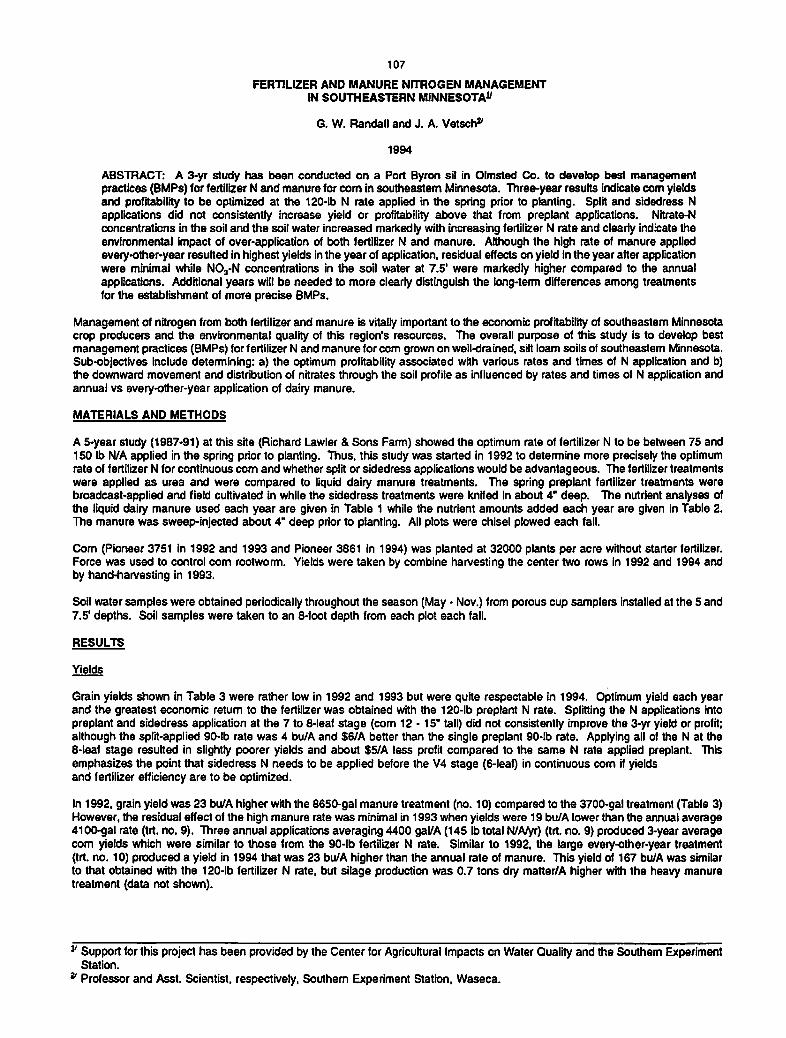
Residual Soil Nitrate
Residual soil nitrate-N (RSN) in the soil profile in November, 1994 was greatly impacted by the N treatments (Fig. 1). RSN rangedfrom 32 Ib/A in the 0-8' profile with the 0-lb N rate to 176 Ib/A with the 150-lb treatment. Much of this increase was due to NCyNthat was found below 5 feet with the 150-lb rate. Accumulation of NO, below this depth is significant because of the higher potentialfor leaching to groundwater. Very little difference in RSN was found between the 90- and 120-lb N rates.
The RSN remaining from the two manure treatments was not excessive and did not result in high levels of NCyN in the profile atthe end of three years (Fig. 1). Significantlymore NO, was found in the 0-1' and 1-2' layers with the high every-other-year treatment(no. 10) compared to the annual treatment (no. 9). An intent of this research is to determine whether thiscarry over and be available for the 1995 crop or whether it will leach downward out of the root zone prior to crop uptake.
extra" residual NO, will
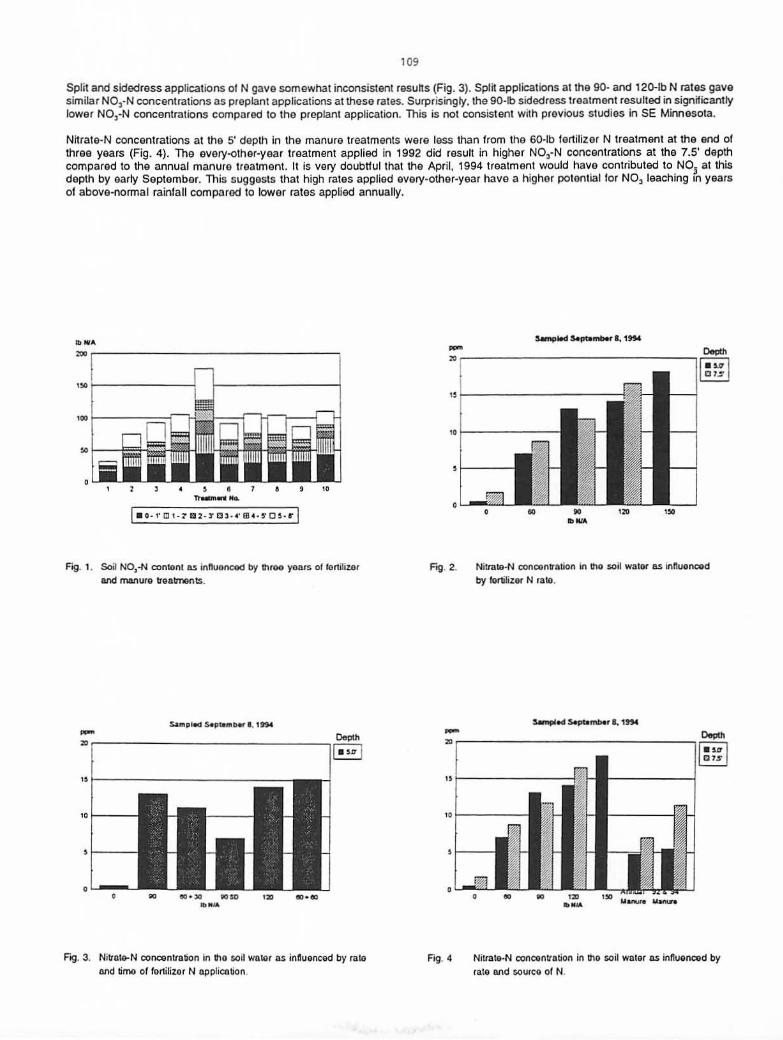
Nitrate-N in the Soil Water
Soil water extracted from the 5' and 7.5' depths on Sept. 8, 1994 also showed a significant effect of N rate, source and time ofapplication on the N03-N in the water (Fig.'s 2, 3 and 4). Nitrate-N concentration increased at both the 5' and 7.5' depths withincreasing fertilizer N rate. At the optimum fertilizer N rate (120 ib/A) soil water contained 14 and 16 mg NO,-N7L at the 5' and 7.5'depths, respectively (Fig. 2). Reducing the N rate to 90 Ib/A resulted in NO,-N concentrations of 13 and 12 mg/L at the 5 and 7.5*depths, respectively.
109
Split and sidedress applications ol N gave somewhat inconsistent results (Fig. 3). Split applications at the 90- and 120-lb N rates gavesimilar N03-Nconcentrations as preplant applications at these rates. Surprisingly, the 90-lb sidedress treatment resulted insignificantlylower NOj-N concentralions compared to the preplant application. This is not consistent with previous studies in SE Minnesota.
Nitrate-N concentrations at the 5' depth in the manure treatments were less than Irom the 60-lb lertilizer N treatment at the end olthree years (Fig. 4). The every-other-year treatment applied in 1992 did result in higher NCyN concentrations at the 7.5' depthcompared to the annual manure treatment. It is very doubtful that the April. 1994 treatment would have contributed to NO. at thisdepth by early September. This suggests that high rates applied every-other-year have a higher potential for NO, leaching in yearsol above-normal rainfall compared to lower rates applied annually.
IO-l'Dl.rB2-TQ3-4'ffl4-5-OS-r
Fig. 1. Soil NO,-N content as mtluoncod by throo years ol lertilizer
and manure treatments.
iinpiw SapumDM a 1334
Depth
Rg. 3. Nitroto-N concentration in tho soil water as influenced by rateand time of forlilizor N application
Sjmpted Stptambar 8.19S4
Fig 2 Ni'.raio-N conoontration in trio soil water as influenced
by fertilizer N ralo.
SamplKl Scptambtr 8. MM
ca ia isUinura Uimxa
Fig. 4 Nitrate-N concentration in trio soil water as influenced byrate and sourco of N

110
NITROGEN AND MANURE MANAGEMENT FOR CORN
AFTER ALFALFA IN WINONA COUNTY
Q. W. Randall and J. A. Vetsch
1994
ABSTRACT: Semi-solid dairy manure was applied at rates of 0,10, 20 and 30 T/A (wet basis) to a 3-yr old stand ofalfalfa In late October and chisel plowed in. Com was planted on this Seaton silt loam soil and a sidedress N treatmentof 75 lb N/A was applied at the V5 stage. Grain, stover and silage yields and grain N concentration were not affectedby the manure or fertilizer treatments. However, N removal by the grain, stover and whole plant (silage) was increasedby the manure treatments. Nitrate-N concentration in the soil water at the 5' depth was increased markedly by themanure treatments by July and by both the manure and fertilizertreatments by September. Nitrate-N concentrations inthe soil at the V1 and V4 stages, especially the top foot, were increased by the manure treatments. Increased plantuptake lowered the N03-N concentrations by the V9 and VT stages, but there was still a slight effect of the manure andfertilizer treatments. These data show no advantage to applying manure or fertilizer N for first year com after alfalfa.
Surveys of land owners InWinona County indicate a substantial acreage of com is planted following alfalfa. Previous studies haveshown little or no com yield response to fertilizer N for first-year com after alfalfa. Yet many farmers often add some fertilizer Nand dairy farmers without an adequate land base for manure often apply manure following alfalfa for com. The result of thesefertilizer and manure additions is an abundant supply of N, which is in excess of plant use and which can contribute significantlyto nitrates in the ground water. Surveys of private wells within the county document that nitrate-N concentrations are frequentlyfound to exceed the maximum contaminant level (MCL) for drinking water.
The purposes of this study were to determine: (1) the effect of dairy manure and fertilizer N applied following alfalfa on comproduction, nitrate-N in the soil profile, and nitrate-N in the soil water at the 5' and 7.5' depths and (2) the "available" N to comin an animal-based cropping system by evaluating various soil N tests from samples taken periodically during the season.
MATERIALS AND METHODS
The site is located on a Seaton silt loam at the Robert and Eugene Kalmes farm inWinona County. Alfalfa was companion seededwith oats in May 1991 following five years of continuous corn. After removing three cuttings of alfalfa in 1993, semi-solid dairymanure was applied on Oct. 27 at rates of 10,20, and 30 T/A (wet) to plots that were replicated four times. Three manure sampleswere taken and analyzed. Average values were: 18.7% dry matter, 10.8 lb total N/ton, 4.0 lb NH4-N7ton, 10.9 lb PA/ton, and14.4 lb KjO/ton. All plots were chisel plowed to an 8 - 9" depth within 6 hours.
Com (Pioneer 3861) was planted on May 6 after field cultivation. Weeds were controlled well with herbicides. No mechanicalcultivation was practiced. Urea was knifed in 4" deep midway between the rows at a rate of 75 lb N/A on June 14 to fouradditionalplots. The com was about 12" tall (V5 stage). Soil water samples were taken periodically during the season from porous cupsamplers installedat a depth of 5*. Grainand silage yields were taken by hand-harvesting 60' of row from each plot on Sept. 20.
RESULTS AND DISCUSSION
Grain yield, grain N content, and silage yield were not significantly different (Ps10% level) among the five treatments (Table 1).As a group, however, yields and N removal tended to be slightly higher with the manure treatments compared to the fertilizertreatment.
The negative impact of these manure and fertilizer N treatments can readily be seen in Table 2. Nitrate-N concentrations inthesoil solution waterat a 5' depth in July were increased by allthree manure treatments with no effect of the June-applied fertilizertreatment. By September, nitrate-N concentrations were 2X to 3X higher with allof the fertilizer and manuretreatments comparedto the control.
Nitrate-N concentrations in the 0-2' layer of all plots were considerably higher than in October '93 prior to chisel plowing andreflected mineralization which occurred from the alfalfa system (Table 3). Concentrations of NO,-N were slightlyhigher for themanure treatments than for the control throughout the season. At the V1 stage, NO,-N concentration did not exceed 15 ppm,which is belowthe sufficiency level of 19 ppm where no yield response is expected according to Minnesota's new soil N test.Because no yietd responsewas obtained, these data suggest that plant available N released from the alfalfa and manure is notbeing adequately identified and interpreted by the new soil nitrate test at this early sampling time. Under these conditions a 0-1'sample taken at the V4 stage using 21 ppm as the sufficiency level would have been a better test.
SUMMARY
• Although trends toward higher com yields (<4% grain yield increase) were evident when dairy manure was applied lor firstyearcom after alfalfa, the negative consequences of the manure were readily shown with NO,-N concentrations in the soilwater 2X to 3X above that found in the control.
• Sidedress applying 75 lb N/A to first year com after alfalfa did not increase com production but did increase NO,-Nconcentration in the soil water by over 3-foldthree months after application.
• Based onthese data, applying fertilizer ormanure for first year com after good alfalfa is not a recommended BMP.

111
Table 1. Grain, stover, and silage yields, grainand stover N content, and total N removal in the grain, stover and silageas affected by manure and fertilizer applied for com following alfalfa.
Treatments Yield N ConcentrationGrain Stover
N RemovalManure FertN. Grain Stover Silage Grain Stover SilageT/A (wet ) Ib/A bu/A TDM/A TDM/A % - - lb N/A - -
0
10
20
30
0
0
0
0
0
75
Treatment Statistical Analysis
Sign, level (%):LSD (0.05):LSD (0.10):C.V. (%):
Contrasts 'manure vs fertilizer'
Sign, level (%):
178.6
185.8
183.5
187.2
176.9
3.972
3.941
4.235
4.382
3.988
56 82
4.9 7.9
88 69
8.197
8.336
8.577
8.811
8.173
83
5.3
65
1.04
1.13
1.15
1.10
1.08
81
5.8
80
0.53
0.69
0.67
0.70
0.67
97
0.11
0.09
10.7
31
87.9
99.4
99.8
97.6
90.0
99
7.3
6.0
8.9
85
42.2
54.0
56.4
61.2
53.0
91
8.8
7.3
95
130.0
153.4
156.2
158.8
143.0
99
15.4
12.6
6.8
96
Table 2. Nitrate-N concentrations in the soil water at 5' in July and September, 1994 as affected by manure and fertilizerN applied for com after alfalfa.
Treatments Nitrate-N Cone, in Soil Water at 5'
Manure FertN. July Sept.T/A (wet)
0
10
20
30
0
Ib/A
0
0
0
0
75
mg/L
5 4
9 8
12 8
13 11
7 13
Table 3. Nitrate-N concentrations in the soil as affected by manure and fertilizer N applied for com after alfalfa.
Manure
T/A (wet)
10
20
30
Treatment
FertN
Ib/A
75
Depthfi
0-1
1-2
0-2
0-1
1-2
0-2
0-1
1-2
0-2
0-1
1-2
0-2
0-1
1-2
0-2
V1
13.77.1
10.4
16.9
8.2
12.6
20.4
8.7
14.6
19.9
9.7
14.8
V4
Growth StageV9
22.3
6.8
14.6
25.6
8.7
17.2
23.8
9.7
16.8
23.9
10.3
17.1
ppm
5.3
4.5
4.9
7.0
5.1
6.0
6.4
5.6
6.0
8.2
7.0
7.6
VT
3.5
1.8
2.6
3.6
2.2
2.9
5.2
3.1
4.2
6.8
5.8
6.3
8.2
5.4
6.8
112
EVALUATING SOIL N TEST METHODS ON FIELDSWITH A MANURE HISTORY1'
Gyles Randall, MichaelSchmitt, and Jeffrey Vetsch2'
ABSTRACT: Nitrogen can become available to the plant from previous applications of manure. The purpose of thisstudy was to evaluate various soil N test methods to see if Minnesota's new soil N test needs to be modified or anadditional test needs to be developed to more accurately predict soil N availability to crops in animal-based systems.Com yields were optimized with N rates of 0, 0, 60 and 120 lb N/A at the four sites and were related to the residualsoil N03-N (RSN) indicated by the new preplant soil N test. Using the test reduced N recommendations at three of thesites to more economicaland environmentally-sound rates of N. Fertilizer N was not under-recommendedat any siteby the new test. Although further soil N test research appears to be necessary formore accurate predictionofavailablesoil Nin these animal-based systems, use of the present N test will providegreater profit while reducing the potentialfor leaching of excess N to groundwater.
Manure is often appliedto the same fields each year by producers because of the proximity of the field to the livestock facility orbecause ofan inadequate land base to facilitate less frequentapplications. As a result, manure-N may accumulate over timeandcan then become availablethrough mineralization to succeedingcrops. The amount of Nbecoming available In any particular fieldis unknown. Thus, fertilizer N recommendations usually do not take into account these previous applications.
The purpose of this study is to evaluate various soil N tests in animal-based systems to see ifour present soil N test needs to bemodified ora new test developed to more accurately predict soil N availability to crops. To do this we must obtain experimentalsites with a long-term manure history, apply a series of fertilizer N rates, determine the yield response to the fertilizer, and thencalibrate this response or lack of response to soil N values obtained by various soil tests.
EXPERIMENTAL PROCEDURES
Four sites were selected for this study in 1994 (Table 1). Two were on fine-textured glacial till soils in south-central Minnesotaand two were on medium-textured loess soils in southeastern Minnesota. Three sites had a history of dairy manure and one hadhog manure. Manure was not applied after the fall of 1992 at any of the sites. The previous cropping history is also given inTable 1.
Table 1. Cooperator, field history, soil type, and parent material at each of the 1994 sites
Site (County)
Waseca Nicollet Olmsted Olmsted
Cooperator SES, U of M Leonard Pork Farms Elmer Borst & Sons Dan GriffinHistory:
Crop Com -1993 & 1992
Alfalfa -1989-91
Corn-1991 & 1993Soybean -1992
Continuous Corn Continuous com
Manure1' 10000 gal/A of liquid 9100 gal/A of liquid Dairy manure Dairy manuredairy manure in hog manure in applied annually applied annuallyOct '91 & Oct. '92 Oct. '92
Soil type: Webster cl LeSueur cl Mt. Carroll sil Port Byron silParent Material: Glacial till Glacial till Loess Loess
11 No manure applied after Fall, 1992.
Nitrogen as urea was broadcast-applied and incorporated at rates of 30,60, 90,120,150 and 180 lb N/A just before planting andwas compared to an unfertilized check pbt at each site. At the two glacial till sites, three split application treatments werecompared to the preplant treatments. Urea was knited-in 4 inches deep mid-way between the rows when com was 10 to 12" tallat rates of 30, 60 and 90 lb/A on plots that had received a 30-lb preplant N rate. Four replications were used at all sites. Pioneer3751 was planted and thinned to uniform populations at all sites. Weeds were controlled very well with a combination of herbicidesand cultivation.
Soil samples were taken from the control plots in 1-foot increments to a depth of three feet at three times during the season(preplant, emergence, and 10-12" tall com). After harvest, samples were taken to a 4-foot depth from the 0, 90 and 180-lbtreatments. Samples were analyzed for nitrate-N (NCyN), ammonium-N (NH4-N), and two forms of hydrolyzable N.
Partial funding provided by the Minnesota Legislature from the MN Future Resources Fund as recommended by LCMR.Appreciation is extended to Bruce Montgomery and others at the Minn. Dept. of Agriculture for their role in facilitating thisresearch project.Professor, Southern Experiment Station, Waseca; Assoc. Professor, Dept. of Soil Science, St. Paul; and Assistant Scientist,Southern Experiment Station, Waseca.

113
Grain yields were taken by combine harvesting 114' of row from each plot at the Waseca and Nicollet Co. sites and hand-harvesting 60' of row from each plot at the Olmsted Co. sites. Silage yields were determined from 20" of row in each plot at allsites.
RESULTS AND DISCUSSION
Com yields were excellent at all sites (Table 2). Statistical analysis showed no significant difference among the yields at bothOlmsted Co. sites but a highly significant response to N at the Waseca and Nicollet Co. sites. Yields were optimized at the 120and 60-lb N rates at these two sites, respectively.
Table 2. Com yields as influenced by Napplied to fields with a manure history in 1994.1'
N Treatment Site
Waseca Co. Nicollet Co. Olmsted Co. Olmsted Co.
Preplant Sidedress SES Leonard Borst Griffin- Ih N/A ....
0 0 116 161 196 175
30 0 135 177 201 179
60 0 154 187 207 183
90 0 159 179 208 185
120 0 166 181 205 180
150 0 169 182 203 179
180 0 160 184 211 181
30 30 159 190 - -
30 60 159 178 - -
30 90 162 178 - -
Statistical Signif. (%): 99 99 57 57
LSD (.05): 11 13 - -
CV (%): 4.8 4.9 4.8 3.3
v No manure applied after Fall, 1992.
Soil NOj-N analyses from samples taken early in the season show virtually no residual soil N03 (RSN) at the Waseca Co. siteregardless of sampling time (Table 3). At the Nicollet Co. site, modest amounts ol RSN were found at all sampling times,especially at the 2 to 3' depth. Modest amounts of RSN were also found at the Borst site in Olmsted Co. with little differenceamong times or depths of sampling. At the Griffin site in Olmsted Co., somewhat more soil NO,-N was found, especially in theemergence (V1) and 12" com (V4 to V5) stages and in the surface 1-foot layer. Rapid mineralization of organic N from priormanure applications with subsequent nitrification occurred at this site when the soil temperatures warmed.
Table 3. Soil NO,-N as influencedby time and depth of sampling in fields with a manure history in 1994.
Site
Sampling Waseca
SES
Nicollet
Leonard
Olmsted
Borst
Olmsted
Time Depth (ft) Griffin
Preplant1'
«
0-1
1-2
2-3
0-2
4.6
4.7
3.4
4.6
10.7
10.9
14.0
10.8
10.6
10.4
9.8
10.5
12.7
11.1
12.4
11.9
VI (emergence)M
M
•
0-1
1-2
2-3
0-2
4.5
4.3
3.8
4.4
10.4
12.8
16.4
11.6
10.3
9.9
8.2
10.1
21.1
14.0
10.7
17.6
V4-5 (12" com) 0-1
1-2
2-3
0-2
4.6
5.3
4.8
5.0
10.8
12.8
17.8
11.8
12.0
11.7
9.1
11.8
28.4
17.2
8.6
22.8
v Soil N03-N in the 0-4' profile totaled 65, 198, 161, and 214 Ib/A for the four sites, respectively.
Soil N credits determined by Minnesota's new preplantsoil N test indicate a credit of 0, 65, 65, and 65 lb N/A for the Waseca,Nicollet, Olmsted, and Olmsted Co. sites, respectively. Subtractingthis credit from our present recommendationof 150 lb N/A fora yield goal of 170 bu/A at these four sites provides N recommendations of 150, 85, 85, and 85 lb N/A, respectively. These

114
recommendations are closer to the optimum amounts of N needed as shown by the yields in Table 2, but they are not perfect.Even though N recommendations at three of these sites were reduced to more economical rates by our present N test, it appearsthat further refinement of the test may be needed in cropping systems with long-term manure histories.
Residual soil NO,-N in the 0-4' profile after harvest was greatly different among the foursites (Table 4). At the Waseca site, wheregrain yield responded to the 120-lb N rate, RSN did not accumulate above that in the control until the applied N rate clearlyexceeded the optimum N rate. In Nicollet Co., where 9100 gal of liquid hog manure had been applied in 1992 and where grainyields only responded to the 60-lb N rate, substantial amounts of RSN were found in all treatments. This was especially true forthe 180-lb N rate and in the 3 to 4' depth. Apparently RSN had leached to this depth in the 24 months since application of themanure and much of it had not been taken up by the plants. Some accumulation of excess RSN occurred at the Borst site,especially at the 180-lb N rate. Excess RSN was also found at the Griffin site, where no yield response to N fertilizer was found.These data clearly show how high levels of RSN can accumulate in soils when N from previous manure applications becomesavailable and fertilizer N is applied, even when very high yields are produced.
Table 4. Residualsoil NO,-N (RSN) afterharvest at the four sites.
Site
N rate Depth Waseca Nicollet Borst Griffin
Ib/A
0
ft
0-1 16 57 32 38
1-2 14 46 18 27
2-3 10 34 15 22
3-4 11 61 22 26
0-4 51 198 87 113
90 0-1 16 49 36 50
1-2 14 60 22 46
2-3 11 57 20 36
3-4 12 86 28 35
0-4 53 252 106 167
180 0-1 51 98 44 45
1-2 38 106 50 66
2-3 27 88 47 66
3-4 20 83 42 43
0-4 136 375 183 225
SUMMARY
The response to fertilizer N by continuous corn was related to the RSN indicated by the new preplant soil N test in thesefields with a long-term manure history.
The present soil N test recommended a 65-lb credit (reduction in fertilizer N rate) at three of the sites, which was much closerto the optimum economic rate than if one had not used the test in these fields. Thus, the test paid economic dividends eventhough it was not perfect.
The potential for NO- leaching to the groundwater is greatly increased by high levels of RSN accumulating in soils whenfertilizer N is added without taking into account the release of N from previously applied manure.
Further soil N test research appears to be necessary to more accurately predict the N availability in fields with a long-termmanure history.
115
IMPACT OF ADDING WHEAT TO A TRADITIONAL CORN-SOYBEAN STRIP SYSTEM
ON CROP YIELDS AND EROSION CONTROL1'
T. K. Iragavarapu and G. W. Randall2'
1994
ABSTRACT: Four single crop production components (ridge tillage; 3-crop wheat-corn-soybeanrotation; narrow, alternate strips (15' wide); and legume interseeding) were integrated into acomplete cropping system. Studies were started in 1991 at two locations in southern Minnesotaon Webster clay loam soil. The rotations compared were: a) continuous corn; b) corn-soybean;
c)corn-soybean-wheat with and without interseeded legumes (Nitro alfalfa or hairy vetch). Each cornstrip following wheat and soybeans was fertilized at four N rates (0, 40, 80, and 120 lb N/A) todetermine N contribution of legumes. Results from the last 4 years indicate that the narrow-alternate strips of corn, soybean, and wheat in a ridge-till system provide excellent surface residuecoverage and satisfy erosion control goals. While corn yields were enhanced (1 and 9% in E-W andN-S row orientation, respectively) and soybean yields decreased slightly (5% in both E-W and N-Srows), wheat yields were unaffected in the narrow strips compared to conventional systems. Wheatintroduced into the traditional corn-soybean strip system reduced the negative border effects of cornon soybeans. Results from this study suggest that these 3-crop systems be planted in N-Sorientation to optimize production.
Narrow, alternate strip cropping systems heve been receiving much attention in the farm press the last few years. Theseaesthetically pleasing cropping systems are touted as sustainable systems that reduce chemical inputs and pest activity whileimproving net profit and erosion control.
Studies show that in traditional corn-soybean strip crop systems improved corn yields in the border rows are offset by reducedsoybean yields. Adding wheat to this 2-crop strip system should reduce border effects on soybeans without sacrificing wheatyields. Wheat planted north of corn and south of soybeans in east-west rows will allow adequate sunlight for soybeans. Wheat,a cool-season crop, will not be shaded as it heads out before corn gets tall enough to shade it. Addition of wheat to the corn-soybean system will not only facilitate interseeding of legumes that provide nitrogen to the following corn, but also will breakcorn root worm diapause and reduce soybean cyst nematode infestation.
The objective of this study was to evaluate the potential of a 3-crop (wheat-corn-soybean) system on crop yields and erosioncontrol.
PROCEDURE
Studies were started in 1991 at the Southern Experiment Station with east-west rows and on the Lynn Sorenson farm inFreeborn Co. with north-south rows. Soybean strips were located on the south side and wheat strips on the north side of cornin E-W rows. In N-S rows, wheat was located on the east side and soybean on the west side of the corn strips. All crops wereplanted in 15' wide by 120' long strips on ridges. Corn (Pioneer 3751) was planted in 30" rows at a rate of 30,200 plants/Ain rows 2-5 and 36,000 ppA in the outside rows (1&6). Nitrogen as ammonium nitrate was broadcast-applied by hand at ratesof 0, 40, 80, and 120 lb N/A to plots measuring 6 rows widex 30' long in each strip. Weeds were controlled with a 16* bend-application of Lasso (3 lb ai/A) and Bladex (2.5 lb ai/A) and ridge till cultivation. Hand-harvest grain yields were obtained froma 25-foot section within each row of each plot.
Soybean (Sturdy) was planted at a rate of 9 to 10 beans/foot of row in 30" rows. Weeds were controlled with a preemergence,15" band-application of Lasso (3 lb ai/A), and postemergence, 15" band-application of Pursuit (4 oz ai/A), and by ridgecultivation. Each individual row was harvested with a plot combine.
Spring wheat (Grandin) was planted at a rate of 94 Ib/A with a minimum-till drill in 8" rows. Broadleaf weeds, when present,were controlled with a broadcast-application of Bromoxynil. Nitrogen as ammonium nitrate was preplant-applied at 50 lb N/A.
RESULTS
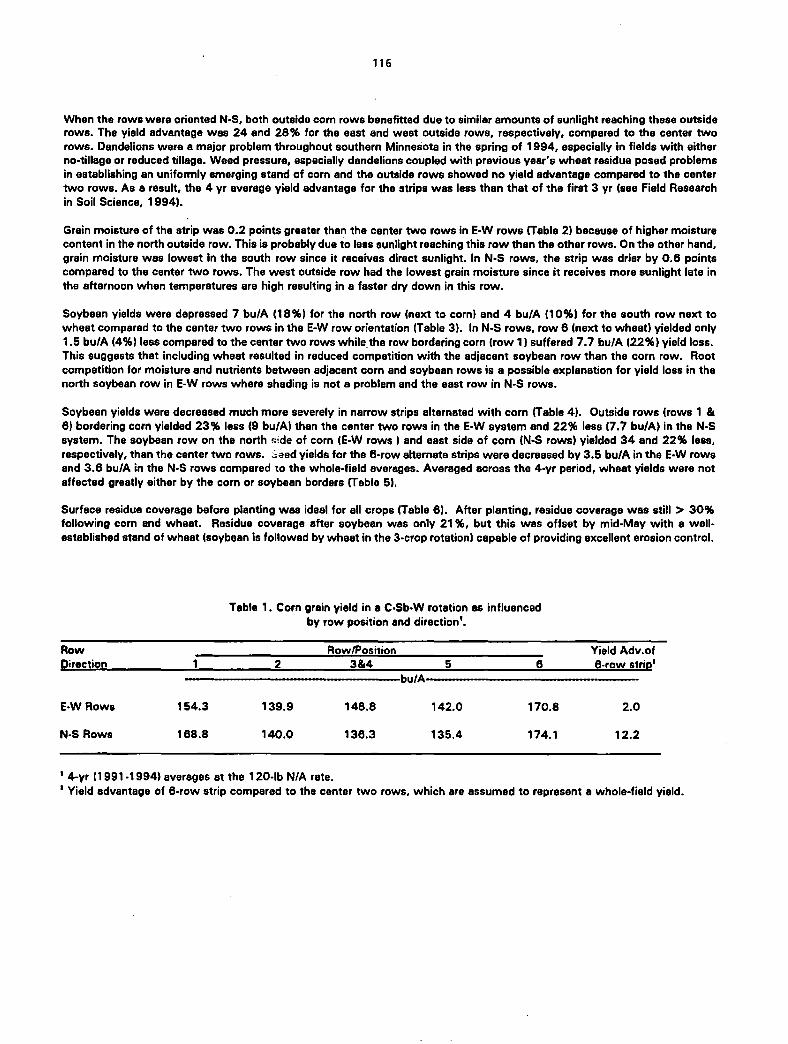
The yield advantage of the narrow strips for corn in the 3-crop (wheat-corn-soybean) rotation was 2.0 bu/A (1 %) in the E-Wsystem and 12.2 bu/A (9%) in the N-S row orientation compared to the whole-field averages when averaged across the 4 yrperiod (Table 1). In the E-W rows, the north row (next to wheat) and the south row (next to soybeans) yielded 4 and 15%higher, respectively, compared to the average of the center two rows, which were assumed to represent whole field production.The reason for the south row yielding more than the north is it receives more direct sunlight than the north row.
" Funding provided by USDA-LISA and Minnesota Department of Agriculture.21 Post-doctoral Research Associate and Professor, respectively, Univ. of Minnesota.
116
When the rows were oriented N-S, both outside corn rows benefitted due to similar amounts of sunlight reaching these outsiderows. The yield advantage was 24 and 28% for the east and west outside rows, respectively, compared to the center tworows. Dandelions were a major problem throughout southern Minnesota in the spring of 1994, especially in fields with eitherno-tillage or reduced tillage. Weed pressure, especially dandelions coupled with previous year's wheat residue posed problemsin establishing an uniformly emerging stand of corn and the outside rows showed no yield advantage compared to the centertwo rows. As a result, the 4 yr average yield advantage for the strips was less than that of the first 3 yr (see Field Researchin Soil Science, 1994).
Grain moisture of the strip was 0.2 points greater than the center two rows in E-W rows (Table 2) because of higher moisturecontent in the north outside row. This is probably due to less sunlight reaching this row than the other rows. On the other hand,grain moisture was lowest in the south row since it receives direct sunlight. In N-S rows, the strip was drier by 0.6 pointscompared to the center two rows. The west outside row had the lowest grain moisture since it receives more sunlight late inthe afternoon when temperatures are high resulting in a faster dry down in this row.
Soybean yields were depressed 7 bu/A (18%) for the north row (next to corn) and 4 bu/A (10%) for the south row next towheat compared to the center two rows in the E-W row orientation (Table 3). In N-S rows, row 6 (next to wheat) yielded only1.5 bu/A (4%) less compared to the center two rows while the row bordering corn (row 1) suffered 7.7 bu/A (22%) yield loss.This suggests that including wheat resulted in reduced competition with the adjacent soybean row than the corn row. Rootcompetition for moisture and nutrients between adjacent corn and soybean rows is a possible explanation for yield loss in thenorth soybean row in E-W rows where shading is not a problem and the east row in N-S rows.
Soybean yields were decreased much more severely in narrow strips alternated with corn (Table 4). Outside rows (rows 1 &6) bordering corn yielded 23% less (9 bu/A) than the center two rows in the E-W system and 22% less (7.7 bu/A) in the N-Ssystem. The soybean row on the north side of corn (E-W rows ) and east side of corn {N-S rows) yielded 34 and 22% less,respectively, than the center two rows, oeed yields for the 6-row alternate strips were decreased by 3.5 bu/A in the E-W rowsand 3.6 bu/A in the N-S rows compared to the whole-field averages. Averaged across the 4-yr period, wheat yields were notaffected greatly either by the corn or soybean borders (Table 5),
Surface residue coverage before planting was ideal for all crops (Table 6). After planting, residue coverage was still > 30%following corn and wheat. Residue coverage after soybean was only 21%, but this was offset by mid-May with a well-established stand of wheat (soybean is followed by wheat in the 3-crop rotation) capable of providing excellent erosion control.
Table 1. Corn grain yield in a C-Sb-W rotation as influencedby row position and direction'.
Row Row/Position Yield Adv.of
Direction 1 2 38.4 5 6 6-row strip1
-bu/A
E-W Rows 154.3 139.9 148.8 142.0 170.8 2.0
N-S Rows 168.8 140.0 136.3 135.4 174.1 12.2
' 4-yr (1991-1994) averages at the 120-lb N/A rate.1Yield advantage of 6-row strip compared to the center two rows, which are assumed to represent a whole-field yield.
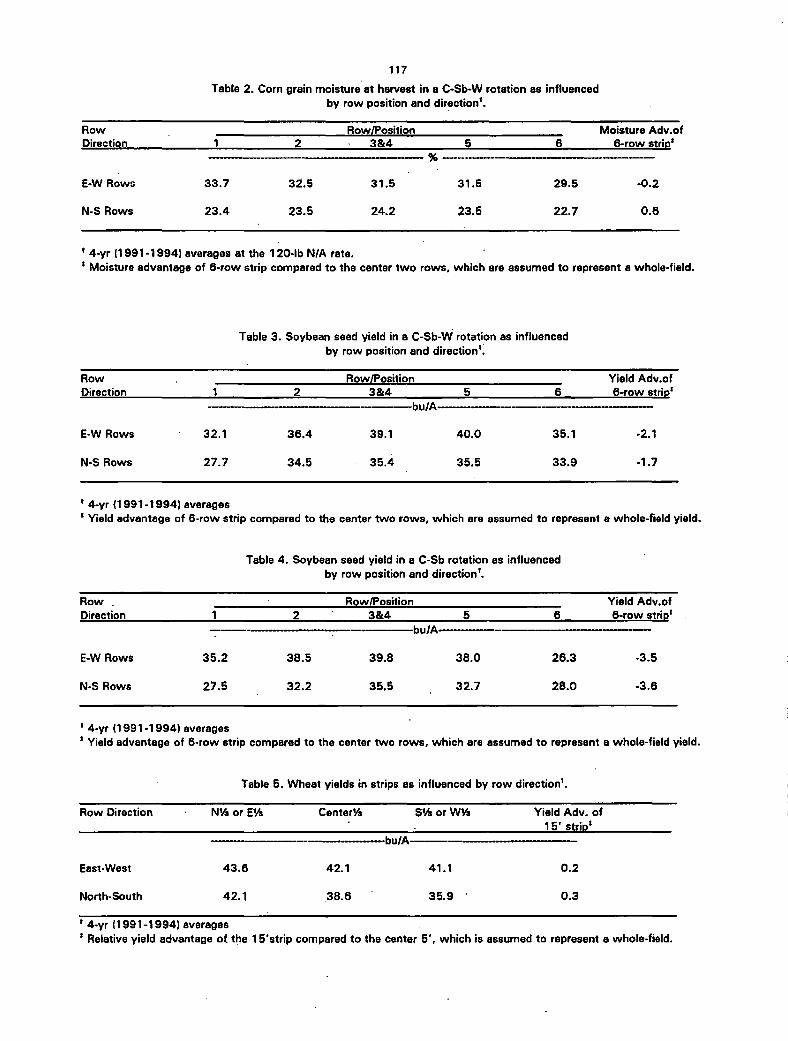
117
Table 2. Corn grain moisture at harvest in a C-Sb-W rotation as influencedby row position and direction*.
Row Row/Position Moisture Adv.of
Direction 1 2 3&4 5 6 6-row strip'
•%-
E-W Rows 33.7 32.5 31.5 31.5 29.5 -0.2
N-S Rows 23.4 23.5 24.2 23.5 22.7 0.6
' 4-yr (1991-1994) averages at the 120-lb N/A rate.' Moisture advantage of 6-row strip compared to the center two rows, which are assumed to represent a whole-field.
Table 3. Soybean seed yield in a C-Sb-W rotation as influencedby row position and direction'.
Row Row/Position Yield Adv.of
Direction 1 2 3&4 5 6 6-row striD*bu/A~
E-W Rows 32.1 36.4 39.1 40.0 35.1 -2.1
N-S Rows 27.7 34.5 35.4 35.5 33.9 -1.7
* 4-yr (1991 -1994) averages' Yield advantage of 6-row strip compared to the center two rows, which are essumed to represent a whole-field yield.
Table 4. Soybean seed yield in a C-Sb rotation as influencedby row position and direction'.
Row . Row/Position Yield Adv.of
Direction 1 2 3&4 5 6 6-row strio'
bu/A-
E-W Rows 35.2 38.5 39.8 38.0 26.3 -3.5
N-S Rows 27.5 32.2 35.5 32.7 28.0 -3.6
1 4-yr (1991-1994) averages' Yield advantage of 6-row strip compared to the center two rows, which are assumed to represent a whole-field yield.
Table 5. Wheat yields in strips as influenced by row direction1.
Row Direction NV4 or E'A Center^ Stt or W% Yield Adv. of
15' strip'—bu/A
East-West 43.6 42.1 41.1 0.2
North-South 42.1 38.6 35.9 0.3
1 4-yr (1991 -1994) averages' Relative yield advantage of. the 15'strip compared to the center 5', which is assumed to represent a whole-field.
Previous crop
Corn
SoybeanWheat
Wheat + Alf.
Wheat + Vetch
' 1992-1994 averages
118
Table 6. Surface residue coverage (3-yearaverage)' asinfluenced by previous crop at Freeborn Co.
Before planting
63
51
83
88
90
-%-.
After planting
37
21
35
56
48
CONCLUSIONS
1. Incorporating awheat strip between corn and soybean strips resulted in reduced negative border effects on soybeanwithout affecting wheat yields.
2. Corn benefitted more in N-S strips than in E-W strips due to greater yield advantage for the strip and less grain moistureat harvest compared to the whole-field averages.
3. Narrow alternate strips of corn, soybean, and wheat satisfy erosion control goals.
4. Economic analyses of all inputs and outputs from these cropping systems are needed before we can compare theprofitability of these narrow strip systems to conventional systems.
O
O
r>

119
NITROGEN SOURCE. ROW CLEANER, AND STARTER FERTILIZER EFFECTSIN NO-TILL CORN PRODUCTION ON A WEBSTER CLAY LOAM SOIL.^
J.A. Vetsch end G.W. Randall
ABSTRACT: Previous research has shown decreased corn yields in long-term, continuous no-till corn. This researchstudy was initiated in 1994 to evaluate the effects of N source, row cleaners, and starter fertilizer on corn productionin continuous corn and a corn-soybean rotation. Only data from the corn setup area will be presented in this initialyear. Anhydrous ammonia (AA) increased grain yield by 4.3 bu/A as compared to urea ammonium-nitrate (UAN)applied with a point-injector. Row cleaner treatments encouraged early plant growth and provided a 3.7 bu/A yieldadvantage as compared to non row cleaner plots. Starter fertilizer increased early plant growth but resulted in a 5.1bu/A yield reduction as compared to non starter plots.
INTRODUCTION
Long-term, continuous no-till corn production has decreased grain yields in some years on wet, poorly-drained clay loam soilsin southern Minnesota. A research study was initiated in 1994 to evaluate the long-term effects and interactions of N source,(AA vs. UAN), row cleaners (RC), and starter fertilizer (SF) on corn grain production in continuous corn and a corn-soybeanrotation.
EXPERIMENTAL PROCEDURES
A research site was established in the spring of 1994 at the Southern Experiment Station on a Webster clay loam soil. Thearea was cropped to corn in 1993 and was left unfilled for 1994. In the spring of 1994 the area was split into three sections.One section will be maintained long-term, contnuous no-till corn. The second was no-till drilled to soybean in 1994 and willbe planted to corn in 1995 to establish a corn-soybean rotation. A third section was planted to corn in 1994 and will beplanted to soybean in 1995.
Treatments were based on current "on farm" management options for no-till. Individual plots were 10 ft wide by 115 ft long.The treatment combinations were arranged as a complete (23l factorial in a randomized complete block design with fourreplicates. Nitrogen source (AA or UAN), row cleaner (with or without at planting), and starter fertilizer (with or without atplanting) were the three treatment main effects (2x2x2 = 8 treatments). A treatment was added to compare an early-season,broadcast application of UAN to e point-injector banded application at the V1 stage. Anhydrous ammonia was injected 15in. from the row and 7 in. deep with a 5-knife applicator. UAN was injected 3 in. from the row to a depth of 4 in. with a 4-wheel point-injector. Both AA and UAN treatments were applied at V1. Dawn9 row cleaners were used on a John Deere Maxi-merge 7100 planter for the RC treatments. Ten gallons of a 10-34-0 liquid starter were applied with the seed on the SFtreatments. All corn plots were planted with the same planter. Anhydrous ammonia and UAN were applied at 150 lb N/A tothe corn plots. A 10-lb N/A credit was given to plots that received SF, thus, only 140 lb N/A were applied to SF plots.
Corn (Pioneer 3578) was planted on May 16. Weeds were controlled with a pre-emergence application (May 18) of Lasso (3.0qt. /A) and Bladex (2.5 qt. /A). The early-season broadcast application of UAN was applied on May 13. The AA and UANpoint-injector treatments were applied on June 3. Plant emergence counts were taken on RC and non RC treatments bycounting plants emerged in 50 ft of row. Plant heights were measured by taking extended leaf heights of 10 consecutive plantsin each plot on June 20. Corn grain was combine harvested from two rows each 112 ft in length on October 26. Grain yieldwas calculated from plot weight and grain moisture measured in the combine. A subsample of the grain was saved, dried,ground and analyzed for total N content at the University of Minnesota Research Analytical Laboratory (UMRAL).
Soil samples were taken in the spring of 1994 to characterize the P and K fertility of the plot area. Nine soil cores (8 in. deep)were taken and composited from each replication. The samples were analyzed for pH, Bray P, and exchangeable K by theUMRAL. Soil tests for P and K were high to very high in all replications. The continuous corn area for 1994 averaged 28 and190 ppm for Bray P and K, respectively, and had a pH of 6.7.
RESULTS AND DISCUSSION
Nitrogen source significantly affected grain yield, grain moisture, grain N removal, and final plant population. Grain moistureat harvest was 0.6 percent higher with AA (Table 1). Anhydrous ammonia treatments resulted in 4.3 bu/A greater corn grainyields and 4.9 lb more N in the grain compared to UAN treatments. Slight N deficiencies were evident during the growingseason in some UAN plots. Greater N efficiency or less loss of AA could explain the yield advantage to AA.
Row cleaners significantly affected early plant growth and grain yield. Plant emergence reached 80% of total one day earlierin RC plots (Table 2). Plant heights, measured 35 days after planting, averaged 32.1 and 29.6 in. for the RC and non RC plots,respectively (Teble 1). Row cleeners produced 3.7 bu/A greater yield as compared to non RC plots. As observed by otherresearchers in earlier studies, row cleaners hasten emergence and increase early plant growth and grain yield on cool wet soils.
- Funding provided by the University of Minnesota, Southern Experiment Station.- Assistant Scientist and Professor, respectively. University of Minnesota, Southern Experiment Station.

120
Table 1. The effect of N source, method of application, row cleaner, and starter fertilizer on grain yield, grainmoisture, grain N concentration, grain N removal, final plant population and early plant growth.
Treatments
N-source Row Cl.
UAN
AA
UAN
AA
UAN
AA
UAN
AA
UAN Bdct
No
No
No
No
Yes
Yes
Yes
Yes
Yes
Starter
No
No
Yes
Yes
No
No
Yes
Yes
No
Grain
H,Q Yield N Cone. N removal
% bu/A % lb N/A
24.1 146.2 1.28 90.9
25.2 150.0 1.32 95.8
24.3 139.7 1.32 90.0
24.2 144.8 1.36 94.5
24.3 147.3 1.29 93.0
24.8 154.8 1.30 99.0
23.4 146.4 1.30 93.6
24.0 147.2 1.37 98.2
24.2 146.8 1.26 90.6
Statistical analysis of main effects for 23 factorial design (8 treatments).N source
AA 24.6 149.2 1.34 96.8
UAN 24.0 144.9 1.30 91.9
N source Sign, level (%) 99 99 90 95
Row cleaner
Yes
No
Row cleaner Sign, level (%)
Starter fertilizer
Yes
No
Starter Fertilizer Sign, level %)
24.2
24.4
89
24.0
24.6
99
148.9
145.2
99
144.5
149.6
99
1.31
1.32
26
1.34
1.30
87
96.0
92.8
81
94.1
94.7
20
Statistical analysis of interaction effects for 23 factorial design (8 treatments).N-source x Row cl. (%) 15 9 10 9
N-source x Starter (%) 85 64 44 15Row cl. x Starter (%) 78 45 6 17
N-source x Row cl."Starter (%) 93 84 54 8
C.V. (%) 2.6 3.8 5.2 7.0
Final
Plant Pop.Plant
Height
Ax1000 inch
32.5 27.8
32.3 26.5
32.6 33.2
31.7 31.3
32.3 31.0
31.7 29.6
32.8 34.2
32.1 33.9
32.1 34.2
31.9
32.5
98
32.2
32.3
22
32.3
32.2
26
13
62
85
49
3.0
30.3
31.5
87
32.1
29.6
99
33.1
28.7
99
36
13
60
40
7.1
Statistical analysis of treatment effect for randomized complete block design (9 treatments).
Sign, level (%) 99 99 63 48 67 99LSD (0.05) 0.6 5.4 3.1
C.V. (%) 2J3 3^7 5^ 7JZ 3;0 6.9
Starter fertilizer significantly affected early plant growth (plant height), grain moisture, and grain yield. Plots that received SFaveraged 33.1 in. tall 35 days after planting as compared to 28.7 in. for plots without SF (Table 1). Starter fertilizer plots hadlower grain moisture but produced 5.1 bu/A less grain than plots without SF.
Table 2. The effect of row cleaners on plant emergence in continuous no-till corn.
Date Measured
Row cl. 23-May 24-May 25-May 26-May 27-May 28-May 31-May 3-June
1
1
No
Yes
5
13
26
44
44 62
65 78
79
86
97
98
100
100
There were no statistically significant interaction terms among the main effects at the 95% level (Table 1). Analysis of all 9treatments in a randomized complete block design showed no significant difference between an injected application of UANat the VI stage as compared to an early-season broadcast application of UAN.

121
Impact of Turkey Manure Application on Com Productionand Potential Water Quality Concerns Westport MN 1994.'
G.L. Malzer, and T. Graff2
Abstract
A field study was continued at Westport, MN (begun in 1991) to study the impact of turkey manure application on irrigated comand soybean production and nitrate-N movement below an Estherville sandy loam. Treatments included two rates of commercialfertilizer (70 and 140 lb N/a), and two rates of turkey manure (4 and 8 tons/A-wet weight basis) and an untreated check. Manurerates were computed to provide an estimated equivalent amount of available N per acre as fertilizer treatments. Treatments wereplanted to com in 1994 following a previous crop of com. Plant samples were collected at 8 leaf, silking, and physiologicalmaturity. Plant samples obtained at physiological maturity were separated into grain and stover. Total dry matter production,N concentration and total N uptake were determined for each sampling. Water percolation, and movement of nitrate-N below theroot zone was monitored utilizing 30 closed bottom non-weighing drainage lysimeters. Excess percolation was to be removedfrom the bottom of each lysimeter after each leaching event Lysimeters were drained priorto planting, but since there were nolarge rainfall events in 1994 at Westport there was no excess water to collect during the growing season. Soil samples werecollected from the soil profile priorto planting and at harvest time and analyzed for nitrate and ammonium N. Grain yields wereexcellent in 1994. Grain yields and N uptake were significantly higher with the higher rate of turkey manure application than withthe highest rate of fertilizer. Grain yields and N uptake were increased substantially due to previously applied manure.
Introduction
Turkey production in Minnesota is ranked second in the nation (Minnesota Statistics. 1990). In 1990, Minnesota's turkey farmersboosted their output to a new record of 43.6 million turkeys. A large portion of the turkey production is concentrated in the WestCentral and Northwest regions of the state, where many turkey producers have limited land areas available to them for manuredisposal. As production increases improved manure management skills will be required to meet the agronomic need and minimizegroundwater contamination.
Increased emphasis on protection of surface water and ground water, and the farmers desire to reduce fertilizer cost haveincreased the need to evaluate the use of turkey manure. Turkey manure is rich in several nutrients. A survey conducted byMoncrief et al.(1991 unpublished data at the University of Minnesota) revealed that the nutrient composition of poultry manureon a dry weight basis is 5.1% N, 2.2% P and 2.3% K respectively. The 860,000 tons (dry wt.) of turkey manure produced peryear in Minnesota could supply approximately 87.7, 86.7 and 47.5 million pounds of N, P205 and KjO respectively for cropproduction.
The objective of this field study was to compare two rates of turkey manure (4 and 8 T/A on wet weight basis) and two ratesof fertilizer N (70 and 140 lb N/A) on dry matter production, N uptake, grain yields, and leaching losses of NO,-N within a corn-corn-soybean rotation.
Materials and Methods
In 1975. 30 non-weighing lysimeters were installed on the Rosholt farm near Westport, Minnesota. Each lysimeter was 5.75 ftin diameter.and 4 feet deep and constructed of 12-gauge galvanized steel coated with coal tar epoxy enamel. At the bottom ofeach lysimeter a sintered stainless filter candle was installed and connected to the soil surface by polyethylene tubing. Eachlysimeter was placed in the center of 30' x 30' plots. Soil at the experimental site was an Estherville sandy loam (Typic Hapludoll)and the lysimeters were backfilled with that soil by depth. Selected chemical and physical properties of the soil are presentedin Table 1.
Prior to 1991 this site did not have a history of manure application. Cropping history was com following com in a com-com-soybean rotation, and in 1990 com was grown at this site without any fertilizers. This study was initiated in 1991 and com wasgrown with urea fertilizer and manure treatments. In 1992 soybeans were grown with manure treatments only and in 1993 and1994 com again was planted into the experimental area with both fertilizer and manure treatments.
1 Appreciation is expressed to the University of Minnesota Experiment Station, Wes-Min RCD, Pope Co. SWCD, andPioneer Hi-Bred International for supplying seed.
2. Professor, and Assistant Scientist respectively. Dept. of Soil Science, University of Minnesota.
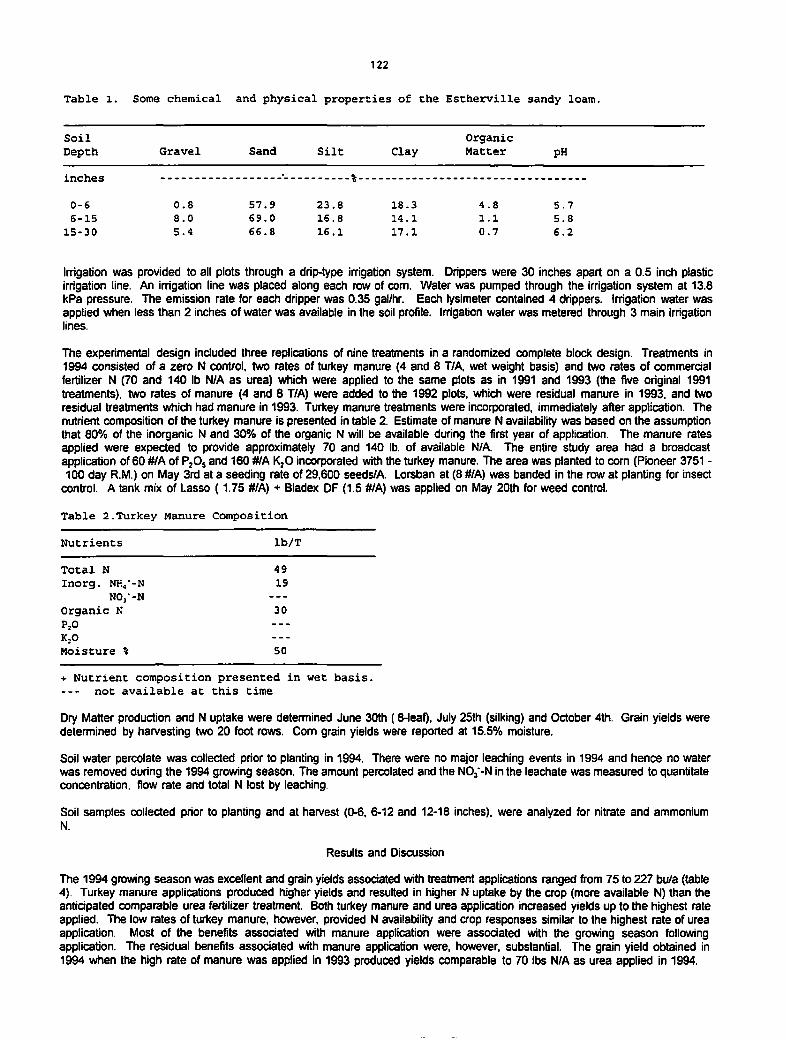
122
Table 1. Some chemical and physical properties of the Estherville sandy loam.
Soil Organic
Depth Gravel Sand Silt Clay Matter pH
mcnes
0-6 0.8 57.9 23.8 18.3 4.8 5.7
6-15 8.0 69.0 16.8 14.1 1.1 5.8
15-30 5.4 66.8 1S.1 17.1 0.7 6.2
Irrigation was provided to all plots through a drip-type irrigation system. Drippers were 30 inches apart on a 0.5 inch plasticirrigation line. An irrigation line was placed along each row of com. Water was pumped through the irrigation system at 13.8kPa pressure. The emission rate for each dripper was 0.35 gal/hr. Each lysimeter contained 4 drippers. Irrigation water wasapplied when less than 2 inches of water was available in the soil profile. Irrigation water was metered through 3 main irrigationlines.
The experimental design included three replications of nine treatments in a randomized complete block design. Treatments in1994 consisted of a zero N control, two rates of turkey manure (4 and 8 T/A, wet weight basis) and two rates of commercialfertilizer N (70 and 140 lb N/A as urea) which were applied to the same plots as in 1991 and 1993 (the five original 1991treatments), two rates of manure (4 and 8 T/A) were added to the 1992 plots, which were residual manure in 1993. and tworesidual treatments which had manure in 1993. Turkey manure treatments were incorporated, immediately after application. Thenutrient composition of the turkey manure is presented in table 2. Estimate of manure N availability was based on the assumptionthat 80% of the inorganic N and 30% of the organic N will be available during the first year of application. The manure ratesapplied were expected to provide approximately 70 and 140 lb. of available N/A. The entire study area had a broadcastapplication of 60 #/A of P20, and 160 #/A K:0 incorporated with the turkey manure. The area was planted to com (Pioneer 3751 -100 day R.M.) on May 3rd at a seeding rate of 29,600 seeds/A. Lorsban at (8 #/A) was banded in the row at planting for insect
control. A tank mix of Lasso (1.75 #/A) + Bladex DF (1.5 #/A) was applied on May 20th for weed control.
Table 2.Turkey Manure Composition
Nutrients lb/T
Total N 49
Inorg. NK,*-N 19NO/-N
Organic K 30P20
K20
Moisture % SO
+ Nutrient composition presented in wet basis.— not available at this time
Dry Matter production and N uptake were determined June 30th (8-leaf), July 25th (silking) and October 4th. Grain yields weredetermined by harvesting two 20 foot rows. Com grain yields were reported at 15.5% moisture.
Soil water percolate was collected prior to planting in 1994. There were no major leaching events in 1994 and hence no waterwas removed during the 1994 growing season. The amount percolated and the NO,'-N in the leachate was measured to quantitateconcentration, flow rate and total N lost by leaching.
Soil samples collected prior to planting and at harvest (0-6, 6-12 and 12-18 inches), were analyzed for nitrate and ammoniumN.
Results and Discussion
The 1994 growing season was excellent and grain yields associated with treatment applications ranged from 75 to 227 bu/a (table4). Turkey manure applications produced higher yields and resulted in higher N uptake by the crop (more available N) than theanticipated comparable urea fertilizer treatment. Both turkey manure and urea application increased yields up to the highest rateapplied. The low rates of turkey manure, however, provided N availability and crop responses similar to the highest rate of ureaapplication. Most of the benefits associated with manure application were associated with the growing season followingapplication. The residual benefits associated with manure application were, however, substantial. The grain yield obtained in1994 when the high rate of manure was applied in 1993 produced yields comparable to 70 lbs N/A as urea applied in 1994.

123
The only water drained from the lysimeters in 1994 took place priorto planting. The results presented in Table 5, therefore, wouldnot reflect the impact of 1994 treatments, but rather a reflection of what was present at the end of the 1993 growing season. Notreatment effects were detected regarding the amount of water, nitrate concentration, and total loss of nitrate-N in the percolatewater. All concentrations of nitrate-N in the percolate water (including the check) exceeded the EPA drinking water standard of10 mg/L. Nitrate-N concentrations in the soil at planting time indicated that high turkey manure applications made in 1993 resultedin elevated concentrations of residual nitrate-N in the soil profile. This nitrate N could be leached to the shallow surface aquiferif the precipitation is excessive enough to cause leaching.
Table 3. Dry matter production, and N utilization as influenced by turkey manure,fertilizer and residual manure treatments - 1994.
Dry Matter N-Concentration N Uptake
Treatments 8-leaf silking 8-leaf silking 8-leaf silking
•T/A % N -----lb/A
Control 0.64 2.33 2.05 0.79 26 37
70 lb N/A in V91,'93,'94 1.07 4.60 3.03 1.08 65 99
140 lb N/A in '!91,'93,'94 1.02 4.41 3.48 1.72 71 151
TM 4 T/A in'91, '93,'94 1.17 4.76 2.96 1.29 69 122
TM 8 T/A in'91, '93,'94 1.45 5.71 3.27 1.50 94 170
TM 4 T/A TM'92, '94 1.07 4.66 2.88 1.18 61 109
TM 8 T/A TM'92, •94 1.42 5.36 3.07 1.52 87 162
TM 4 T/A in '93 ,none '94 0.76 3.36 2.05 0.90 31 61
TM 8 T/A in '93 ,none'94 0.97 3.53 1.99 0.98 38 69
Statistical Analysis
N-Rate x Manaaement
N-Rate
Low Fertility 1.01 4.34 2.73 1.11 56 98
High Fertility 1.21 4.75 2.95 1.43 72 138
P-Valve 99 99 99 99 99 99
Manaaement
Fertilizer Annually 1.04 4.50 3.25 1.40 67 125
Manure Annually 1.31 5.23 3.11 1.39 82 146
Manure Biannual 1.24 5.01 2.97 1.34 74 136
Manure Residual 0.86 3.44 2.02 0.94 35 65
P-Valve 99 99 99 99 99 99
LSD (0.05) 0.12 0.33 0.16 0.09 5 8
Rate X Management 98 98 96 99 99 99
TM is turkey manure.
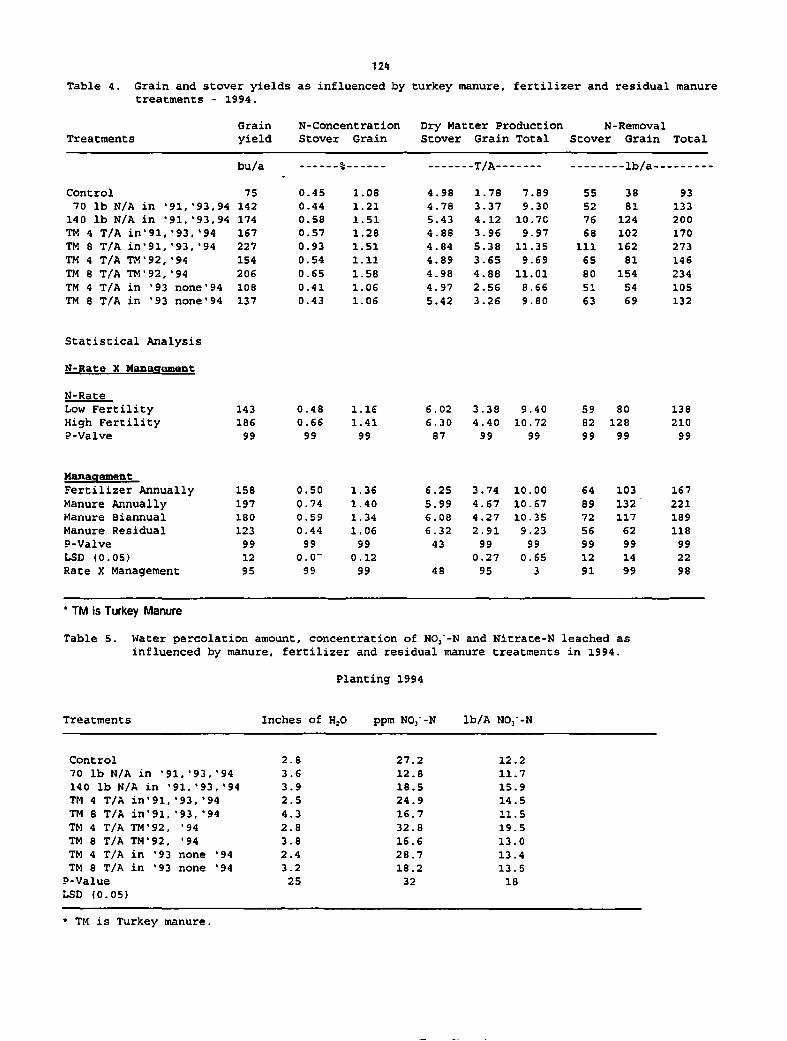
12<»
Table 4. Grain and stover yields as influenced by turkey manure, fertilizer and residual manuretreatments - 1994.
Treatments
Grain N-Concentration
yield Stover GrainDry Matter Production N-RemovalStover Grain Total Stover Grain Total
bu/a
Control 75
70 lb N/A in '91,'93.94 142
140 lb N/A in '91,'93,94 174
TM 4 T/A in'91,'93,'94 167
TM 8 T/A in'91,'93,'94 227
TM 4 T/A TM'92,'94 154
TM 8 T/A TM'92,'94 206
TM 4 T/A in '93 none"94 108
TM 8 T/A in '93 none'94 137
Statistical Analysis
N-Rate X Management
0.45
0.44
0.58
57
93
54
65
0.41
0.43
1.08
1.21
1.51
1.28
1.51
1.11
1.58
1.06
1.06
4.98
4.78
5.43
88
84
89
98
97
-T/A-
78
37
12
96
38
65
88
56
5.42 3.26
7.89
9.30
10.70
9.97
11.35
9.69
11.01
8.66
9.80
55
52
76
68
111
65
80
51
63
-lb/a-
38
81
124
102
162
81
154
54
69
93
133
200
170
273
146
234
105
132
N-Rate
Low Fertility 143 0.48 1.16 6.02 3.38 9.40 59 80 138
High Fertility 186 0.66 1.41 6.30 4.40 10.72 82 128 210
P-Valve 99 99 99 87 99 99 99 99 99
Manaqeme&t
Fertilizer Annually 158 0.50 1.36 6.25 3.74 10.00 64 103 167
Manure Annually 197 0.74 1.40 5.99 4.67 10.67 89 132 221
Manure Biannual 180 0.59 1.34 6.08 4.27 10.35 72 117 189
Manure Residual 123 0.44 1.06 6.32 2.91 9.23 56 62 118
P-Valve 99 99 99 43 99 99 99 99 99
LSD (0.05) 12 0.0" 0.12 0.27 0.65 12 14 22
Rate X Management 95 99 99 48 95 3 91 99 98
• TM is Turkey Manure
Table 5. Water percolation amount, concentration of N03'-N and Nitrate-N leached asinfluenced by manure, fertilizer and residual manure treatments in 1994.
Planting 1994
Treatments
Control
70 lb N/A in '91,'93,"94
140 lb N/A in '91,'93,"94
TM 4 T/A in'91,*93,'94
TM 8 T/A in'91, "93, '94
TM 4 T/A TM'92, '94
TM 8 T/A TM'92, '94
TM 4 T/A in '93 none "94
TM 8 T/A in '93 none '94
P-Value
LSD (0.05)
TM is Turkey manure.
Inches Of HjO ppm NOj'-N ]Lb/A N0,--N
2.8 27.2 12.2
3.6 12.8 11.7
3.9 18.5 15.9
2.5 24.9 14.5
4.3 16.7 11.5
2.8 32.8 19.5
3.8 16.6 13.0
2.4 28.7 13.4
3.2 18.2 13.5
25 32 18

125
Table 6. Soil N levels sampled before planting and at harvest 1994.
Treatments
Ammonium Nitrate Total Inorg.Depth Planting Harvest Planting Harvest Planting Harvest
PPm PPm- -PP"Control 1 " 3.2 2.5 7.1 5.0 10.3 7.5
2 2.2 2.7 3.6 2.9 5.8 S.6
3 0.8 2.7 2.9 2.7 3.7 5.4
70 lb N/A in '91,'93,'94 1 2.3 3.0 11.1 5.9 13.4 8.9
2 2.7 1.7 5.3 3.7 8.0 9.7
3 2.3 2.3 2.6 3.2 4.9 7.2
140 lb N/A in '91,'93,'94 1 3.2 3.0 9.2 6.5 12.4 9.5
2 1.7 1.2 4.2 4.2 5.9 5.4
3 1.7 1.3 5.0 5.1 6.7 6.4
TM 4 T/A in'91,'93,'94 1 2.5 2.0 10.4 7.6 12.9 9.6
2 1.7 2.2 5.2 5.2 6.9 8.8
3 1.4 1.5 4.6 2.3 5.9 3.8
TM 8 T/A in'91,'93,'94 1 3.1 3.6 28.5 12.8 31.6 16.4
2 2.5 1.4 14.9 6.8 17.3 18.7
3 2.8 3.5 12.6 7.4 15.4 10.9
TM 4 T/A TM'92,'94 1 1.8 2.5 10.1 4.5 11.8 7.0
2 1.2 1.8 4.2 2.4 5.5 4.2
3 1.1 1.5 3.1 1.0 4.2 2.5
TM 8 T/A TM'92,'94 1 2.6 3.3 12.4 4.5 15.0 7.8
2 1.9 1.0 6.0 3.3 7.9 4.3
3 2.5 2.9 3.3 3.4 5.8 6.3
TM 4 T/A in '93,none'94 1 3.1 6.8 12.2 1.8 15.3 8.6
2 2.5 2.8 5.2 8.7 7.7 11.5
3 2.3 1.8 5.4 2.9 7.7 4.7
TM 8 T/A in '93,none'94 1 2.5 6.3 22.7 7.0 25.2 13.3
2 2.3 2.3 13.5 2.1 15.8 4.4
3 2.1 1.6 9.4 1.0 11.5 2.6
TM is turkey manure. Depth 1 ,2 and 3 (0-6), (6-12), and (12-18) inches.

126
LAND SPREADING OF YARD WASTE - 19941
Carl Rosen, Thomas Halbach, Dave Birong, and Jennifer Weiszel*
ABSTRACT: The third year of a field experiment at the Sand Plain Research Farm inBecker, Minn, was conducted to determine the residual effects of land applied yardwaste, primarily tree leaves, on corn production and soil nitrate movement. Fouryard waste treatments (0, 20, 40, and 80 dry T/A) were applied during the fall of1991. In 1994, treatments included the four rates of yard waste that were appliedin 1991 with 0, 100, and 200 lbs N/A applied during the growing season. During thefirst year of the study, 1992, yard waste application initially inhibited growth anddepressed tissue nitrogen concentration in the corn plants. The inhibitory effectdiminished by the middle of the 1992 growing season and final grain yields weresimilar to 0 T/A yard waste treatment (with 200 lb N/A) when 200 lb N/A was appliedto the yard waste treatments. During the second year of the study, 1993, increasesin growth and yield were greater with increasing yard waste application rates thanwith applied fertilizer N. Results in 1994 were similar to those in 1993. About 2lbs of N per dry ton were supplied by the yard waste. Highest yields were obtainedwith the yard waste applications plus 200 lb N/A. Nitrate leaching tended toincrease with fertilizer N application than with yard waste application. Residualsoil nitrate-N increased with increasing yard waste application but not fertilizerN application. These results suggest: 1) Soil N was initially immobilized during thefirst year after yard waste application; and 2) Yard waste decomposition increasedavailable N during the second and third year after application. This study needs tobe continued to determine nitrogen release rates from residual yard waste insubsequent years.
Until recently, yard wastes (tree leaves and grass clippings) accounted for 15-20% of the bulk in landfills.In 1990 (metro counties) and in 1992 (greater Minnesota), regulations were passed that prohibited dumpingof yard wastes in landfills. Because of this legislation, alternatives to landfilling yard waste needimmediate atter.^.on. Some options for using or recycling the yard waste include: 1) backyard composting andapplication of trie compost to gardens; 2) municipal composting followed by land application of the compost,-and 3) direct land application of noncomposted yard waste. While backyard composting is a desirable way tohandle yard waste, not all homeowners desire to compost their own yard waste. Several problems withmunicipal yard waste composting include finding an acceptable site, controlling nutrient runoff, andcontrolling odors. Direct land application of noncomposted yard waste may be more efficient than compostingand does not have the same problems associatedwith composting. Land application of yard waste may requirean adjustment of nitrogen requirements, because of its high carbon to nitrogen ratio. The effects of nitrogenapplication on crop production also needs to be ascertained. Therefore, the objectives of this study wereto: 1) Determine the residual effects of direct application and incorporation of noncomposted yard waste(primarily tree leaves), with and without fertilizer nitrogen, on the productivity of irrigated field com,and 2) Characterize nitrogen release from the yard waste during the growing season in terms of availabilityfor crop needs and movement through the soil profile.
PROCEDURES
The experiment was conducted at the Sand Plain Research Farm in Becker, MN on a Hubbard loamy sand soil. Thiswas the third year of the study, to determine the residual effects of applied yardwaste. The yard waste wascollected and applied to 15' x 35' plots with a front end loader in October of 1991. The yard wasteprimarily consisted of tree leaves, although somegarden plants andgrass clippings were also present. Twelvetreatments were tested: 0, 20, 40, and 80 dry tons/A yard waste with 0, 100, and 200 lbs N/A. Theexperimental design was a randomized complete block with 4 replications.
The field was plowed to a depth of 8-10 inches two days prior to planting. In addition, 200 lbs/A 0-0-22and 210 lbs/A 0-0-60 were broadcast and incorporated prior to planting. Pioneer hybrid 3751 (100 daymaturity) was planted on May 9, 1994 at a population of 32,000 seeds/A (2.S ft. between rows). At planting,starter fertilizer was banded 2 inches to the side and 2 inches below the seed at a rate of 185 lbs/A 0-14-42. The nitrogen treated plots received split N applications as urea with half of the N applied on May 25and the remainder on June 17, 1994. Irrigation was used to supplement rainfall (Figure 1).
'Funding for this project was provided by the Legislative Commission for Minnesota Resources2Extension Soil Scientist, Extension Waste Management Specialist, Assistant Scientist, andSenior Research Plot Technician respectively, Department of Soil, Water and Climate.
127
Suction tubes with ceramic cups were installed in the row at a depth of 4 feet in three replications of eachtreatment, Water samples were collected, after significant irrigation or precipitation events (greater than0.5 inches), and analyzed for nitrate. Whole plant samples (4 per plot) were collected at the 8-12 leafstage on June 22 after all fertilizer N was applied. Ear leaf samples were collected on July 20 at 50%silking. TVo, 20 foot rows were harvested for grain and stover yield from each plot on September 29 andOctober 6, respectively. Subsamples-of stover and grain plus cob were taken for moisture determinations andnitrogen analyses. Plant tissue samples were dried and then ground through a 30 mesh screen. Dried sampleswere digested in concentrated sulfuric acid and Kjeldahl nitrogen was determined using conductimetricprocedures. After harvest, soil samples were collected from 0-6, 6-12, 12-24 and 24-36 inch depths. Soilnitrate was determined using 2 N KCl extracts.
RESULTS
Corn Growth and Yield: Initial corn growth increased with increasing rates of yard waste (Table 1). Theaddition of nitrogen also increased initial growth. At the 6-12 leaf stage, the greatest growth was foundin treatments with the highest yard waste rates and highest nitrogen rates. The addition of yard waste alsoincreased total yield indicating a significant release of nutrients during the second year afterincorporation. Corn growth and yield displayed a greater response to yard waste application when nitrogenfertilizer was not applied; although 200 lb N/A plus 40 or 80 T/A yard waste resulted in the highest yields.At all N rates, addition of yard waste significantly increased grain yield. Neither nitrogen applicationnor yard waste amendment affected the final stand count. Kernel moisture at harvest decreased with theaddition of yard waste and nitrogen.
Tissue Nitrogen Concentrations and Total Nitrogen Uptake: At the 8-12 leaf stage, yard waste applicationdid not create a significant difference in tissue nitrogen concentration (Table 2). By the silking stage,yard waste amendment increased ear leaf N concentrations with greatest increases occurring at the 0 and 100lb N/A treatments. Nitrogen uptake increased with increased rates of yard waste. Yard waste applicationsupplied approximately 2 lbs N/dry ton over the growing season to the corn crop. The addition of Nfertilizer also increased N uptake although the contribution from yard waste was about the same regardlessof N rate. Differences in tissue N concentration were observed at all growth stages with the application
of fertilizer nitrogen.
Soil Nitrate-Nitrogen Content: Yard waste application increased residual nitrate-N in the soil (Table 3).The 80 T/A yard waste amendment, with or without fertilizer N, resulted in the highest residual nitrate-Ncontent in the upper 3 ft of the soil. Fertilizer N application had minimal effects on residual nitrate-Ncontent in the soil. With leaching rainfall or over-irrigation the higher residual nitrate N content in the
yard waste treatments may result in higher nitrate leaching losses.
Soil Water Nitrate Concentrations: Concentrations of nitrate-N in soil water, as affected by treatments, arepresented in figures 2-13. In all treatments, peak nitrate-N concentrations at the four foot depthoccurred at about 7-8 weeks after planting. Yard waste application tended to increase nitrate-Nconcentrations in soil water at the four foot depth when fertilizer N was not applied. Variation in nitrate-N concentration within treatments, became more pronounced as fertilizer application rates increased.Fertilizer application had a greater effect on increasing nitrate-N concentrations than yard wasteapplication. Yard waste applications with 0 or 100 lb N/A applied resulted in less nitrate leaching thanno yard waste applied with 200 lb N/A. Nitrate leaching in the treatments receiving yard waste and 200 lbN/A was similar to that in the 200 lb N/A treatment without yard waste. Although residual nitrate-N in thesoil was higher with increasing yard waste application, overall nitrate movement was not greatly affectedby yard waste application as measured with suction tubes. This lack of movement may have been due to thefact that 1994 was a relatively low leaching year.
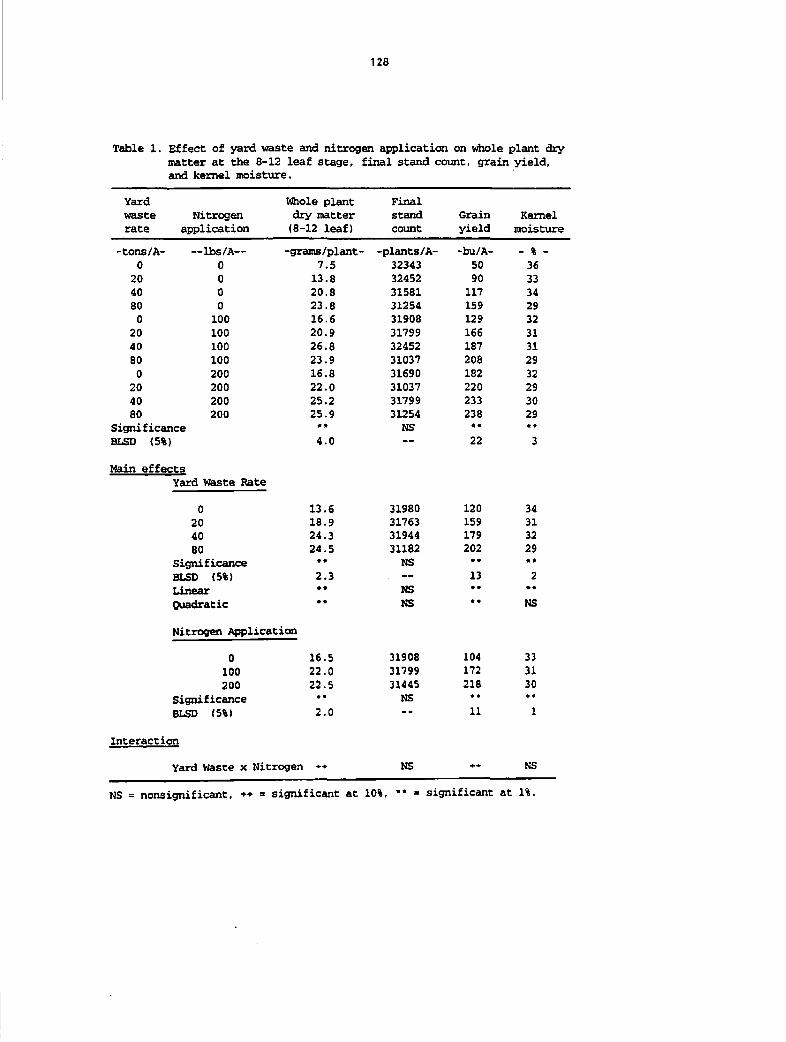
128
Table 1. Effect of yard waste and nitrogen application on whole plant drymatter at the 8-12 leaf stage, final stand count, grain yield,and kernel moisture.
Yard Whole plant Final
waste Nitrogen dry matter stand Grain Kernel
rate application (8-12 leaf) count yield moisture
-tons/A- --lbs/A-- -grams/plant- -plants/A- -bu/A- - % -
0 0 7.5 32343 50 36
20 0 13.8 32452 90 33
40 0 20.8 31581 117 34
80 0 23.8 31254 159 29
0 100 16.6 31908 129 32
20 100 20.9 31799 166 31
40 100 26.8 32452 187 31
80 100 23.9 31037 208 29
0 200 16.8 31690 182 32
20 200 22.0 31037 220 29
40 200 25.2 31799 233 30
80 200 25.9 31254 238 29
Significance • • NS ** *•
BLSD (5%) 4.0 — 22 3
Main effects
Yard Waste Rate
0 13.6 31980 120 34
20 18.9 31763 159 31
40 24.3 31944 179 32
80 24.5 31182 202 29
Significance • • NS • • *•
BLSD (5%) 2.3 — 13 2
Linear • * NS • • • *
Quadratic • • NS • • NS
Nitrogen Application
0 16.5 31908 104 33
100 22.0 31799 172 31
200 22.5 31445 218 30
Significance • « NS • • • •
BLSD (5%) 2.0 -- 11 1
Interaction
Yard Waste x Nitrogen *♦ NS +•+ NS
NS = nonsignificant, ++ = significant at 10%, ** = significant at 1%.

Table 2. Effect of yard waste and nitrogen application on nitrogen concentrations, dry matter accumulation, and nitrogen content.
Yard Whole plant N Ear leaf N Nitrogen
waste Nitrogen
application
8-12 leaf
stage
silking
stage
Concentration Dry Mass ]Nitrogen Content
rate Cob Stover Grain Cob Stover Grain Total Cob Stover Grain Total
-tons/A- —lbs/A— — % Nitrogen rWH 1H XT/71
0 0 2.20 1.10 0.71 0.44 0.89 0.14 1.33 1.40 2.87 2.0 11.9 24.9 38.8
20 0 2.07 1.19 0.57 0.41 0.91 0.23 1.92 2.52 4.67 2.5 15.8 46.0 64.3
40 0 2.20 1.41 0.55 0.40 0.90 0.31 2.36 3.28 5.95 3.4 18.8 59.4 81.6
80 0 2.36 1.69 0.48 0.45 0.98 0.38 3.24 4.46 8.08 3.6 30.4 87.5 121.5
0 100 3.17 1.83 0.56 0.34 0.88 0.39 2.79 3.61 6.79 4.3 19.0 64.1 87.4
20 100 3.20 2.14 0.47 0.44 0.95 0.45 3.73 4.65 8.83 4.2 32.6 89.3 126.1
40 100 3.00 2.27 0.43 0.45 0.99 0.54 3.97 5.22 9.73 4.7 36.1 103.7 144.5
80 100 3.09 2.47 0.44 0.61 1.12 0.59 3.68 5.82 10.09 5.1 44.4 130.5 180.0
0 200 3.62 2.62 0.39 0.46 1.09 0.54 3.26 5.09 8.89 4.2 30.2 111.3 145.7
20 200 3.32 2.75 0.39 0.55 1.18 0.62 3.89 6.17 10.68 4.9 42.7 145.5 193.1
40 200 3.40 2.76 0.38 0.60 1.20 0.65 4.36 6.54 11.55 5.0 52 il 157.6 214.7
80 200 3.38 2.73 0.40 0.69 1.32 0.72 3.76 6.67 11.15 5.7 52.4 176.2 234.3
Significance * * * * ft * ** * * * * ** * * * * ft* ** * * **
BLSD (5%) 0.22 0.21 0.09 0.10 0.06 0.06 0.52 0.61 1.00 0.8 10.6 15.5 21.4
Main effects
Yard Waste Rate
0 2.99 1.85 0.56 0.41 0.95 0.36 2.46 3.37 6.19 3.5 20.4 66.8 90.7
20 2.87 2.03 0.48 0.47 1.01 0.44 3.18 4.44 8.06 3.9 30.3 93.6 127.8
40 2.86 2.15 0.46 0.48 1.03 0.50 3.56 5.01 9.07 4.3 35.7 106.9 146.9
80 2.94 2.30 0.44 0.58 1.14 0.56 3.56 5.65 9.77 4.8 42.4 131.4 178.6
Significance NS ft ft * ft ft* ** • • * • • • ft * ** ** • • ft*
BLSD (5%) — 0.13 0.05 0.06 0.03 0.04 0.30 0.35 0.58 0.4 6.1 9.0 12.3
Linear NS * * ft* ** * * ** • * ** ** ** *# *• **
Quadratic * NSft NS NS ft * ft * * * * NS ++ * *
Nitroqen Application
0 2.21 1.35 0.58 0.43 0.92 0.26 2.21 2.92 5.39 2.9 19.2 54.5 76.6
100 3.12 2.18 0.48 0.46 0.99 0.49 3.54 4.83 8.86 4.6 33.0 96.9 134.5
200 3.43 2.71 0.39 0.57 1.20 0.63 3.81 6.12 10.56 4.9 44.4 147.7 197.0
Significance * * ** ** ** ** ** ft* ft* ** ** ** ** **
BLSD (5%) 0.11 0.11 0.04 0.05 0.03 0.03 0.26 0.30 0.49 0.4 5.1 7.7 10.6
Interaction
Yard Waste x Nitrogen NS * * * * NS ** ++ * * NS NS NS NS
NS nonsignificant, ++ = significant at 10%. * = significant at 5%, significant at 1%.
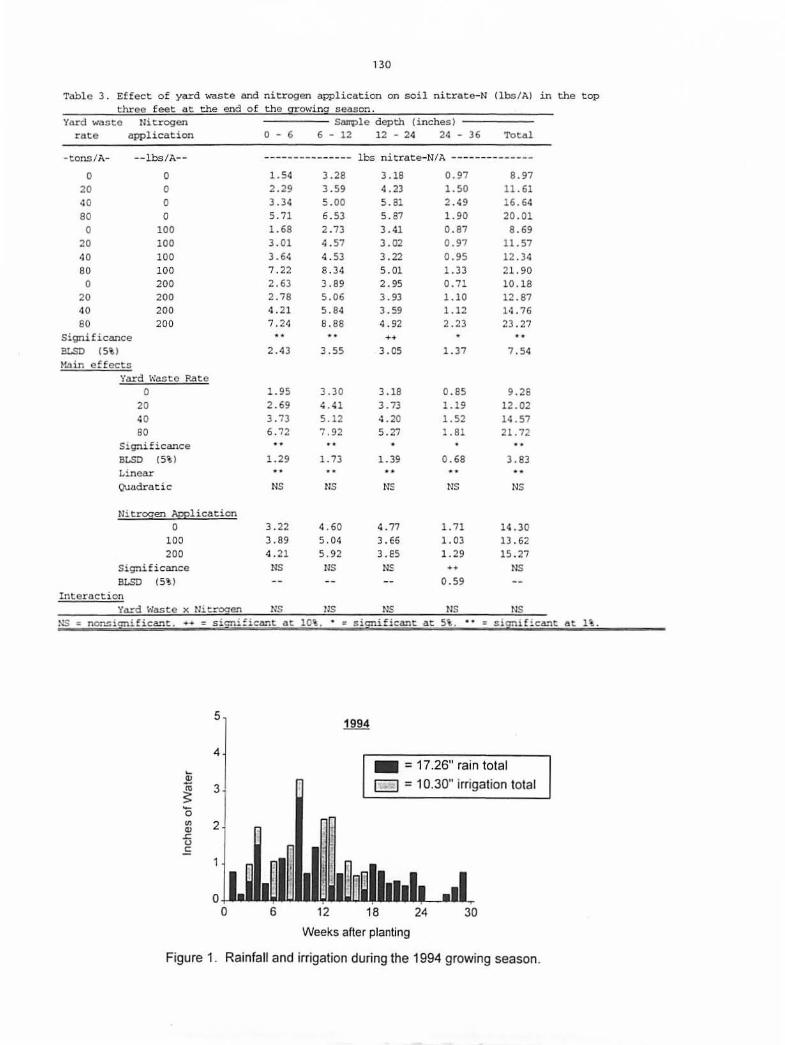
130
Table 3. Effect of yard waste and nitrogen application on soil nitrate-N (lbs/A) in the top
three feet at the end of the growing season.Yard waste Nitrogen
rate application
Sanple depth (inches)
0-6 6-12 12-24 24-36 Total
-tons/A-
0
20
40
BO
0
20
40
80
0
20
40
80
Significance
BLSD (5%)
Main effects
Yard Waste Rate
0
20
40
80
Significance
BLSD (5%)
Linear
CMudratic
'•'itrocen Amplication
0
100
200
Significance
BLSD (5%)
Interaction
Yard Waste x Nitrogen
—lbs/A—
0
0
0
0
100
100
100
100
200
200
200
200
lbs nitrate-N/A
1.54 3.28 3. IB 0.97 8.97
2.29 3.59 4.23 1.50 11.61
3.34 5.00 5.81 2.49 16.64
5.71 6.53 5.87 1.90 20.01
1.68 2.73 3.41 0.87 8.69
3.01 4.57 3.02 0.97 11.57
3.64 4.53 3.22 0.95 12.34
7.22 8.34 5.01 1.33 21.90
2.63 3.89 2.95 0.71 10.18
2.78 5.06 3.93 1.10 12.87
4.21 5.84 3.59 1.12 14.76
7.24 8.88 4.92 2.23 23.27
2.43 3.55 3.05
1.95 3.30 3.18
2.69 4.41 3.73
3.73 5.12 4.20
6.72 7.92 5.27
1.29
NS
3.22
3.89
4.21
NS
NS
1.73
:.-
4.60
5.04
5.92
NS
US
1.39
N£
4.77
3.66
3.85
NS
NS
1.37 7.54
0.85 9.28
1.19 12.02
1.52 14.57
1.81 21.72
0.68
NS
1.71
1.03
1.29
•»*
0.59
NS
3.83
NS
14.30
13.62
15.27
NS
NS
NS » nonsignificant. ■»♦ = significant at 10%. * = significant at 5%. = significant at 1%.
5
44
£n
£o
c
1.
0 111 II
.1994
•I = 17.26" rain total| | = 10.30" irrigation total
Ulllllll_..l0 6 12 18 24 30
Weeks after planting
Figure 1. Rainfall and irrigation during the 1994 growing season.
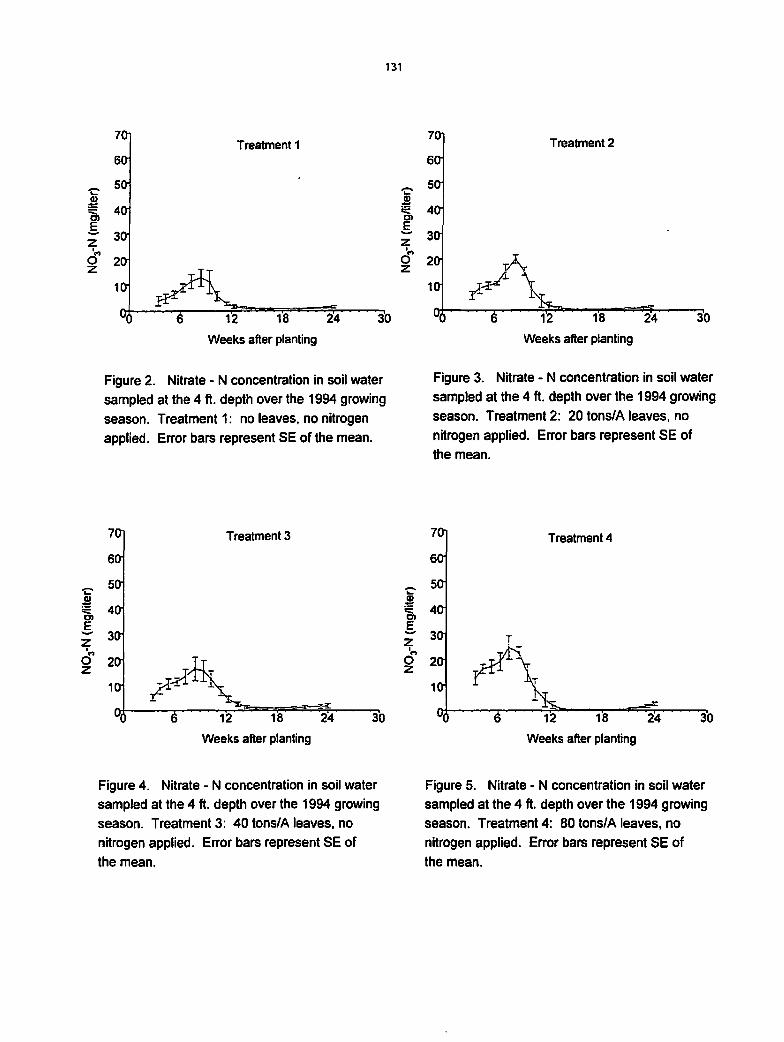
131
CO
E.z
V.o
7a
6a
sa
4a
3a
2a
ia
Oi
Treatment 1
E
Oz
12 18 24
Weeks after planting
30
70Treatment 2
60
50
40
3a
2a f y
ia y±<t_
4) 6 1'2 18 24 3'0
en
E
Oz
Figure 2. Nitrate - N concentration in soil water
sampled at the 4 ft. depth over the 1994 growing
season. Treatment 1: no leaves, no nitrogen
applied. Error bars represent SE of the mean.
7a
60
50
40
30
20
ia
Oi
Treatment 3
12 18 24
Weeks after planting
30
Figure 4. Nitrate - N concentration in soil water
sampled at the 4 ft. depth over the 1994 growing
season. Treatment 3: 40 tons/A leaves, no
nitrogen applied. Error bars represent SE of
the mean.
Weeks after planting
Figure 3. Nitrate - N concentration in soil water
sampled at the 4 ft. depth over the 1994 growing
season. Treatment 2: 20 tons/A leaves, no
nitrogen applied. Error bars represent SE ofthe mean.
/a Treatment 4
ea
50h.
w
<S 40on
E
z3a
u*•» t/Pvo ?a tJ>T Av-z x**1 \
ia1
V ,1 6 12 18 24
Weeks after planting
30
Figure 5. Nitrate - N concentration in soil water
sampled at the 4 ft. depth over the 1994 growing
season. Treatment 4: 80 tons/A leaves, no
nitrogen applied. Error bars represent SE of
the mean.

en
E
Oz
O)
E
Oz
132
70
6a
so
4a
3a
2a
ia
o;
Treatment 5
12 18 24
Weeks after planting
30
Figure 6. Nitrate - N concentration in soil water
sampled at the 4 ft. depth over the 1994 growing
season. Treatment 5: no leaves, 100 lbs/A
nitrogen applied during the growing season.
Error bars represent SE of the mean.
T" 12 18 24
Weeks after planting
Treatment 7
Figure 8. Nitrate - N concentration in soilwatersampled at the 4 ft. depth over the 1994 growing
season. Treatment 7: 40 tons/A leaves,
100 lbs/A nitrogen applied during the growing
season. Error bars represent SE of the mean.
6^ 12 18 24
Weeks after planting
Treatment 6
30
Figure 7. Nitrate - N concentration in soil water
sampled at the 4 ft. depth over the 1994 growing
season. Treatment 6: 20 tons/A leaves,
100 lbs/A nitrogen applied during the growing
season. Error bars represent SE of the mean.
7a
6a
~. 5aSe 4aCO
E
z ™o 2a
ia
Oil
Treatment 8
A,—6—
££&12 18 24
Weeks after planting
30
Figure 9. Nitrate - N concentration in soil water
sampled at the 4 ft. depth over the 1994 growing
season. Treatment 8: 80 tons/A leaves,
100 lbs/A nitrogen applied during the growing
season. Error bars represent SE of the mean.

133
Treatment 9 Treatment 10
E
70
60
50
40
3a
2a
ia
o;
E
70
60
50
40
3a
2a
ia
oi
Oz
=-*-J12 18 24
Weeks after planting
Oz
30
Figure 10. Nitrate - N concentration in soil water
sampled at the 4 ft. depth over the 1994 growing
season. Treatment 9: no leaves, 200 lbs/A
nitrogen applied during the growing season.
Error bars represent SE of the mean.
Treatment 11
12 18 24
Weeks after planting
30
Figure 11. Nitrate - N concentration in soil water
sampled at the 4 ft. depth over the 1994 growing
season. Treatment 10: 20 tons/A leaves,
200 lbs/A nitrogen applied during the growing
season. Error bars represent SE of the mean.
Treatment 12
Cf>
E
70
60
50
40
30
20
ia
Oi
o
E
70
60
50
40
30
20
ia
0;
Oz
5-51
6 12 18 24
Weeks after planting
30
Oz
Figure 12. Nitrate • N concentration in soil water
sampled at the 4 ft. depth over the 1994 growing
season. Treatment 11: 40 tons/A leaves,
200 lbs/A nitrogen applied during the growing
season. Error bars represent SE of the mean.
:w12 18 24
Weeks after planting
30
Figure 13. Nitrate - N concentration in soil water
sampled at the 4 ft. depth over the 1994 growing
season. Treatment 12: 80 tons/A leaves,
200 lbs/A nitrogen applied during the growingseason. Error bars represent SE of the mean.
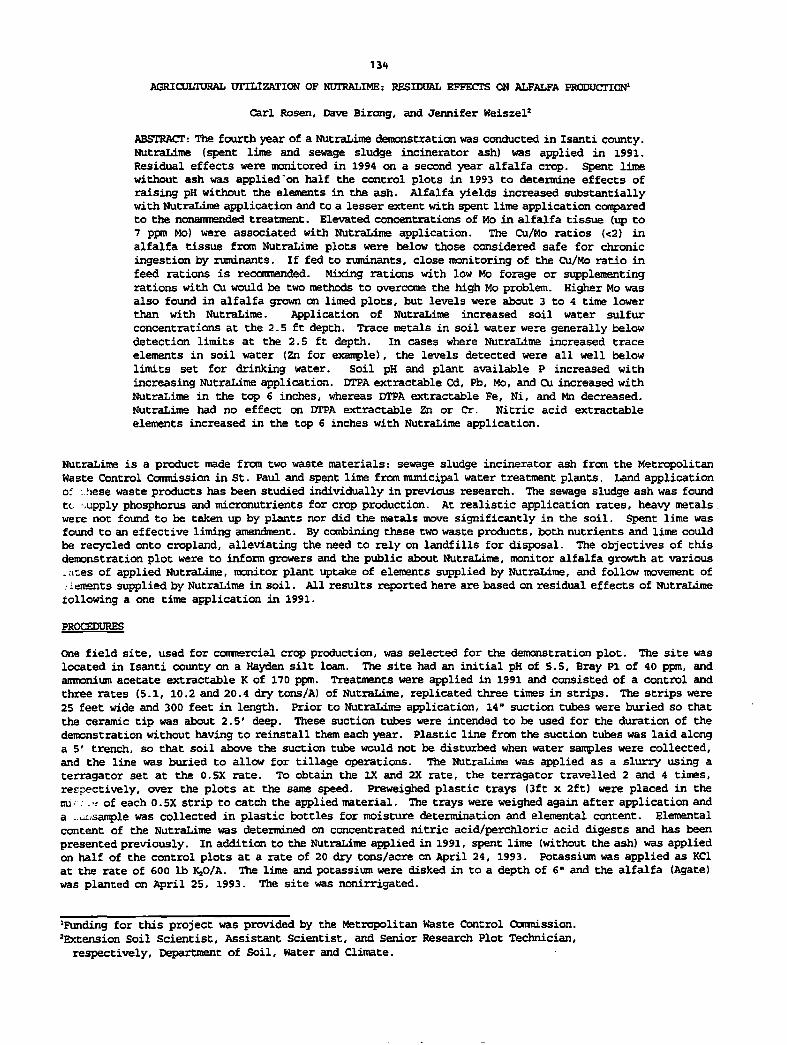
13*
AGRICULTURAL UTILIZATION OF NUTRALIME: RESIDUAL EFFECTS ON ALFALFA PRODUC^ON,
Carl Rosen, Dave Birong, and Jennifer Keiszel2
ABSTRACT: The fourth yearof a NutraLime demonstration was conducted in Isanti county.NutraLime (spent lime and sewage sludge incinerator ash) was applied in 1991.Residual effects were monitored in 1994 on a second year alfalfa crop. Spent limewithout ash was applied'on half the control plots in 1993 to determine effects ofraising pH without the elements in the ash. Alfalfa yields increased substantiallywithNutraLime application and toa lesser extent with spent lime application comparedto the nonammended treatment. Elevated concentrations of Mo in alfalfa tissue (up to7 ppm Mo) were associated with NutraLime application. The Cu/Mo ratios <<2) inalfalfa tissue from NutraLime plots were below those considered safe for chronicingestion by ruminants. If fed to ruminants, close monitoring of the Cu/Mo ratio infeed rations is reconmended. Mixing rations with low Mo forage or supplementingrations with Cu would be two methods to overcome the high Mo problem. Higher Mo wasalso found in alfalfa grown on limed plots, but levels were about 3 to 4 time lowerthan with NutraLime. Application of NutraLime increased soil water sulfurconcentrations at the 2.5 ft depth. Trace metals in soil water were generally belowdetection limits at the 2.5 ft depth. In cases where NutraLime increased traceelements in soil water (Zn for example), the levels detected were all well belowlimits set for drinking water. Soil pH and plant available P increased withincreasing NutraLime application. DTPA extractable Cd, Pb, Mo, and Cu increased withNutraLime in the top 6 inches, whereas DTPA extractable Fe, Ni, and Mn decreased.
NutraLime had no effect on DTPA extractable Zn or Cr. Nitric acid extractable
elements increased in the top 6 inches with NutraLime application.
NutraLime is a product made from two waste materials: sewage sludge incinerator ash from the MetropolitanWaste Control Commission in St. Paul and spent lime from municipal water treatment plants. Land applicationof -..hese waste products has been studied individually in previous research. The sewage sludge ash was foundtc supply phosphorus and micronutrients for crop production. At realistic application rates, heavy metalswere not found to be taken up by plants nor did the metals move significantly in the soil. Spent lime wasfound to an effective liming amendment. By combining these two waste products, both nutrients and lime couldbe recycled onto cropland, alleviating the need to rely on landfills for disposal. The objectives of thisdemonstration plot were to informgrowers and the public about NutraLime, monitor alfalfa growth at variousrates of applied NutraLime, monitor plant uptake of elements supplied by NutraLime, and follow movement of•iements supplied by NutraLime in soil. All results reported here are based on residual effects of NutraLimefollowing a one time application in 1991.
PROCEDURES
One field site, used for commercial crop production, was selected for the demonstration plot. The site waslocated in Isanti county on a Hayden silt loam. The site had an initial pH of 5.5, Bray PI of 40 ppm, andammonium acetate extractable K of 170 ppm. Treatments were applied in 1991 and consisted of a control andthree rates (5.1, 10.2 and 20.4 dry tons/A) of NutraLime, replicated three times in strips. The strips were25 feet wide and 300 feet in length. Prior to NutraLime application, 14" suction tubes were buried so thatthe ceramic tip was about 2.5' deep. These suction tubes were intended to be used for the duration of thedemonstration without having to reinstall them each year. Plastic line from the suction tubes was laid alonga 5' trench, so that soil above the suction tube would not be disturbed when water samples were collected,and the line was buried to allow for tillage operations. The NutraLime was applied as a slurry using aterragator set at the 0.5X rate. To obtain the IX and 2X rate, the terragator travelled 2 and 4 times,respectively, over the plots at the same speed. Preweighed plastic trays (3ft x 2ft) were placed in thertu< •- of each 0.5X strip to catch the appliedmaterial. The trays were weighed again after application anda „a.sample was collected in plastic bottles for moisture determination and elemental content. Elementalcontent of the NutraLime was determined on concentrated nitric acid/perchloric acid digests and has beenpresented previously. In addition to the NutraLime applied in 1991, spent lime (without the ash) was appliedon half of the control plots at a rate of 20 dry tons/acre on April 24, 1993. Potassium was applied as KClat the rate of 600 lb KjO/A. The lime and potassium were disked in to a depth of 6" and the alfalfa (Agate)was planted on April 25, 1993. The site was nonirrigated.
'Funding for this project was provided by the Metropolitan Waste Control Commission.'Extension Soil Scientist, Assistant Scientist, and Senior Research Plot Technician,
respectively, Department of Soil, Water and Climate.
135
Soil water samples were collected two times during the growing season at each site. Multiple elements weredetermined in water samples using ICP procedures. Alfalfa was harvested four times in 1994: June 3, July 13,August 24 and October 17. Harvested area included 6 square feet per replication. Samples were driedat 60 C, and then the samples were ground to pass through a 30 mesh screen. Samples were ashed, dissolvedin 1 N HC1 and then analyzed for elemental contentusing ICP procedures. Tissue nitrogen concentrations weredetermined following Kjeldahl digestion using conductimetric procedures. Soil samples were collected in thespring and fall; within each replication, eight subsamples were combined down to a depth of 6 inches.Samples were air dried and then ground. Multiple elements were determined on IN nitric acid extracts. Otheranalyses included soil pH and soluble salts (1:1 soil:water), ammonium acetate extractable cations, and DTPAextractable metals.
RESULTS
Plant growth and yield. Effects of NutraLime on alfalfa growth are presented in Table 1. Except for thefirst cutting where no differences among treatments were recorded, NutraLime increased alfalfa yieldsubstantially compared to the nonlimed control. Yield with NutraLime also tended to be greater than yieldwith the limed control. This comparison is somewhat biased toward the NutraLime treatment since the limeapplication was recently applied andonly disked inprior to planting. The yield data from 1994 indicate thatwhen applied at realistic rates, NutraLime can have a beneficial effect on plant growth.
Elemental Concentrations in Soil Water. Concentrations of AI, B, Cd, Cr, Cu, Fe, K, Mo, Ni, P, and Pb insoil water at the 2.5 ft depth were generally below detection limits (Table 2). Concentrations of Ca, Mg,Mn, Na, and Zn were not consistently affected by NutraLime application. Concentrations of S increased withincreasing NutraLime at both sampling dates.
Elemental Concentrations in Soil. Soluble salts, soil pH, Bray and Olsen P, ammonium acetate extractablecations and DTPA extractable metals in the spring and fall of 1994 are presented in Tables 3 and 4,respectively. In general, few changes occurred between the spring and fall sampling dates. Soil pH wassubstantially higher (1-2 units) in the top 6 inches with NutraLime application compared to the control.Lime application resulted in similar pH changes as the NutraLime. Soluble salts in the top6 inches generallyincreased withNutraLime application rate,- however, none of thesoluble salt levels were ina range consideredto be high enough to cause salt toxicity. Lime application resulted in higher salt levels than the controland similar to those for NutraLime. Bray and Olsen P increased with NutraLime application in the top 6inches. Lime application resulted in similar extractable P levels as the control. Extractable K decreasedwith NutraLime application rate. Extractable Ca and Mg increased with NutraLime application in the top 6inches. DTPA extractable Fe, Mn, and Ni decreased with NutraLime application in the top 6 inches. DTPAextractable Cd, Cu, Pb, and Mo increased in the top 6 inches. DTPA extractable Zn in the top 6 inches wasnot affected by NutraLime application. DTPA extractable Cr was not affected by NutraLime application, withmost concentrations below detection limits of the spectrophotometer. Lime treatment generally decreasedavailability of Mn, Pb, Ni, Cu and Cd in the top 6".
Nitric acid extractable soil elements are presented in Tables 5 and 6. All elements tested, except Kincreased with NutraLime application in the top 6 inches. The lime treatment resulted in higher levels ofnitric acid extractable AI, B, Ca, Fe, Mg, Mn, and S in the 0-6" depth relative to the nonlimed treatment andlower levels of all elements except for Ca, Mg, Fe, K, and S relative to the NutraLime treatments.
Elemental Concentrations in Plant Tissue. Elemental concentrations in alfalfa tissue at the four harvests
are presented in Tables 7-10. In the first harvest, concentrations of N, P, Ca, Mg, Na, AI, Cu, and Moincreased and Mn, Zn, and Ni decreased with increasing NutraLime. Spent lime applications increased Mocompared to the nonlimed treatment. In the other harvests, the most consistent trend was increased levelsof P and Mo with NutraLime application. Alfalfa tissue concentrations of Mo relative to tissue Cu inNutraLime amended plots were at a level where molybdenosis could be a problem. The Cu/Mo ratio should begreater than 2 to ensure that molybdenosis does not occur. The Cu/Mo ratios in tissue from the IX and 2XNutraLime plots were less than 2 at all harvest dates. In contrast to 1993, concentrations of Mo in thealfalfa tissue actually increased over the season. As discussed in previous years when soybean was grown,legumes have a high demand for Mo and seem to accumulate this element in foliage and grain. The amount ofMo applied with the 10 dry ton NutraLime rate was 0.5 lb/A. Based on the yields obtained in this study, thealfalfa crop removes about 0.065 lb Mo per year which means that about 7 to 8 years would be required toremove the Mo applied with NutraLime from alfalfa production. Although the lime treatment also increased Moconcentrations, the level was below that considered a problem for ruminants. For all harvests, Cd, Cr, andPb were either not affected by NutraLime treatment or were below detection limits.
GENERAL SUMMARY
NutraLime application significantly increased alfalfa yield, but tissue Mo increased to levels wheremolybdenosis could be a problem if the forage was chronically ingested. The implication for using NutraLime
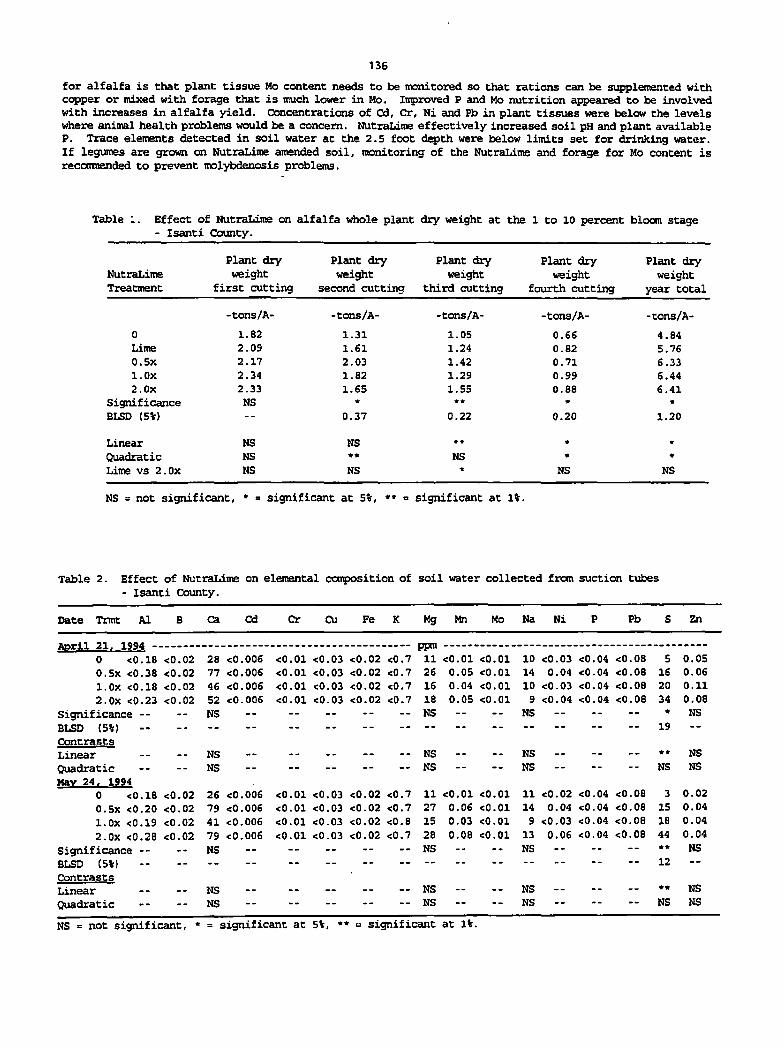
136
for alfalfa is that plant tissue Mo content needs to be monitored so that rations can be supplemented withcopper or mixed with forage that is much lower in Mo. Improved P and Mo nutrition appeared to be involvedwith increases in alfalfa yield. Concentrations of Cd, Cr, Ni and Pb in plant tissues were below the levelswhere animal health problems would be a concern. NutraLime effectively increased soil pH andplant availableP. Trace elements detected in soil water at the 2.5 foot depth were below limits set for drinking water.If legumes are grown on NutraLime amended soil, monitoring of the NutraLime and forage for Mo content isrecommended to prevent molybdenosis problems.
Table 1. Effect of NutraLime on alfalfa whole plant dry weight at the 1 to 10 percent bloom stage- Isanti County.
Plant dry Plant dry Plant dry Plant dry Plant dryNutraLime weight weight weight weight weightTreatment first cutting second cutting third cutting fourth cutting year total
-tons/A- -tons/A- -tons/A- -tons/A- -tons/A-
0 1.82 1.31 1.05 0.66 4.84
Lime 2.09 1.61 1.24 0.82 5.76
0.5x 2.17 2.03 1.42 0.71 6.33
l.OX 2.34 1.82 1.29 0.99 6.44
2.Ox 2.33 1.65 1.55 0.88 6.41
Significance NS * ** * *
BLSD (5%) -- 0.37 0.22 0.20 1.20
Linear NS NS ** • *
Quadratic NS ** NS * *
Lime vs 2.Ox NS NS * NS NS
NS = not significant, significant at 5%, significant at 1%.
Table 2. Effect of NutraLime on elemental composition of soil water collected from suction tubes- Isanti County.
Date Trmt AI B Ca Cd Cr Cu Fe Mg Mn Mo Na Ni Pb Zn
April 21, 1994
0 <0.18 <0.02
O.Sx <0.38 <0.02
l.OX <0.18 <0.02
2.Ox <0.23 <0.02
Significance --BLSD (5%)
Contrasts
Linear
Quadratic
May 24, 1994
0 <0.18
0.5X <0.20 <0.02
l.OX <0.19 <0.02
2.Ox <0.28 <0.02
Significance --BLSD (5%)
Contrasts
Linear
Quadratic
ppm
28 <0.006 <0.01 <0.03 <0.02 <0.7 11 <0.01 <0.01
77 <0.006 <0.01 <0.03 <0.02 <0.7 26 0.05 <0.01
46 <0.006 <0.01 <0.03 <0.02 <0.7 16 0.04 <0.01
52 <0.006 <0.01 «0.03 <0.02 <0.7 18 0.05 <0.01
NS NS
NS
NS
NS
NS
10 <0.03 <0.04 <0.08
14 0.04 <0.04 <0.08
10 <0.03 <0.04 <0.08
<0.04 <0.04 <0.089
NS
NS
NS
5 0.05
16 0.06
20 0.11
34 0.08
* NS
19 --
*# NS
NS NS
0.02 26 <0.006 <0.01 <0.03 <0.02 <0.7 11 <0.01 <0.01 11 <0.02 <0.04 <0.08 3 0.02
NS
79 <0.006 <0.01 <0.03 <0.02 <0.7 27 0.06 <0.01
41 <0.006 <0.01 <0.03 <0.02 <0.8 15 0.03 <0.01
79 <0.006 <0.01 <0.03 <0.02 <0.7 28 0.08 <0.01
NS NS -
NS
NS
NS
NS
not significant, * = significant at 5%, ** = significant at 1%.
14 0.04 <0.04 <0.08 15 0.04
9 <0.03 <0.04 <0.08 18 0.04
13 0.06 <0.04 <0.08 44 0.04
NS ** NS
12
NS
NS NS
NS
NS

137
Table 3. Efffeet of NutraLime on soil pH, soluble salts. Bray P, Olsen P, ammonium acetate extractable
cations and DTPA extractable metals - Aoril 21 . 1994
NH.OAC Extractable
Soluble Bray OlsenDTPA Extractable
Depth Trmt pH Salts P P • K Ca Mg Na Fe Mn Zn Cu Pb Ni Cd Cr MO
ppm -
0-6" 0 6.9 0.10 26 11 240 751 70 4.1 61 28.9 1.3 0.5 0.8 0.8 0.06 <0.03 <0.02
Lime 7.9 0.37 24 15 209 3472 225 5.0 44 14.4 1.0 0.6 0.7 0.6 0.06 <0.03 <0.02
0.5X 8.1 0.20 106 31 212 1856 114 5.0 29 10.1 1.2 2.7 0.9 0.5 0.11 <0.03 0.03
l.OX 8.2 0.20 127 33 213 2171 125 4.9 28 9.4 1.2 3.1 0.9 0.5 0.11 <0.03 0.04
2.OX 8.2 0.20 143 37 186 2491 136 5.3 28 9.1 1.3 3.7 1.0 0.5 0.12 <0.03 0.04
Significance #* ** ** ** NS ** * NS ** ** NS ** ** * *«—
*
BLSD (5%) 0.2 0.10 29 8 -- 860 92 — 13 5.7 -- 0.9 0.1 0.2 0.02 -- 0.01
Contrasts
Linear ** NS »* • * * *# NS » ** *# NS ** ** * *»--
**
Quadratic ** NS ** ** NS NS NS NS ** ** NS ** NS * **-- NS
Lime vs 2.Ox NS ** ** «# NS * « NS * NS NS *« *# NS **—
**
NS = not significant, * = significant at 5%, ** = significant at 1%.
Table 4. Effect of NutraLime on soil pH, soluble salts, Bray PI, Olsen P, ammonium acetate extractablecations, and DTPA extractable metals - October 17, 1994
Soluble Bray Olsen
NH.OAc Extractable DTPA Extractable
Depth Trmt pH Salts P P K Ca Mg Na Fe Mn Zn Cu Pb Ni Cd Cr
mmhos/cm - PI»»
0 - 6» 0 6.1 0.10 23 9 155 731 66 4.2 66 17.1 1.1 0.5 0.7 0.7 0.05 0.03
Lime 8.1 0.27 17 12 144 4112 230 5.2 37 6.9 0.8 0.5 0.4 0.4 0.04 0.03
0.5x 8.0 0.20 112 29 117 1774 98 5.0 24 5.1 1.1 2.7 0.7 0.6 0.11 0.03
l.OX 8.1 0.17 135 34 108 2377 110 5.2 23 4.3 1.1 3.3 0.8 0.3 0.12 0.03
2.Ox 8.0 0.17 152 39 106 2603 126 5.5 25 4.2 1.3 3.7 1.0 0.7 0.11 0.03
Significance NS ** *# NS ** NS
BLSD (S%> 0.2 0.09 30 7 40 607 34 0.8 16 3.4 -- 0.8 0.2 -- 0.02 --
Contrasts
Linear « • NS NS • • * NS ** NS
Quadratic V • NS • • ** NS • NS NS • * • • NS *• NS • • NS
Lime vs 2. Ox NS • »* ***
** »* NS NS NS * ** *• * ** NS
NS - not significant. significant at 5%, ** = significant at IV.
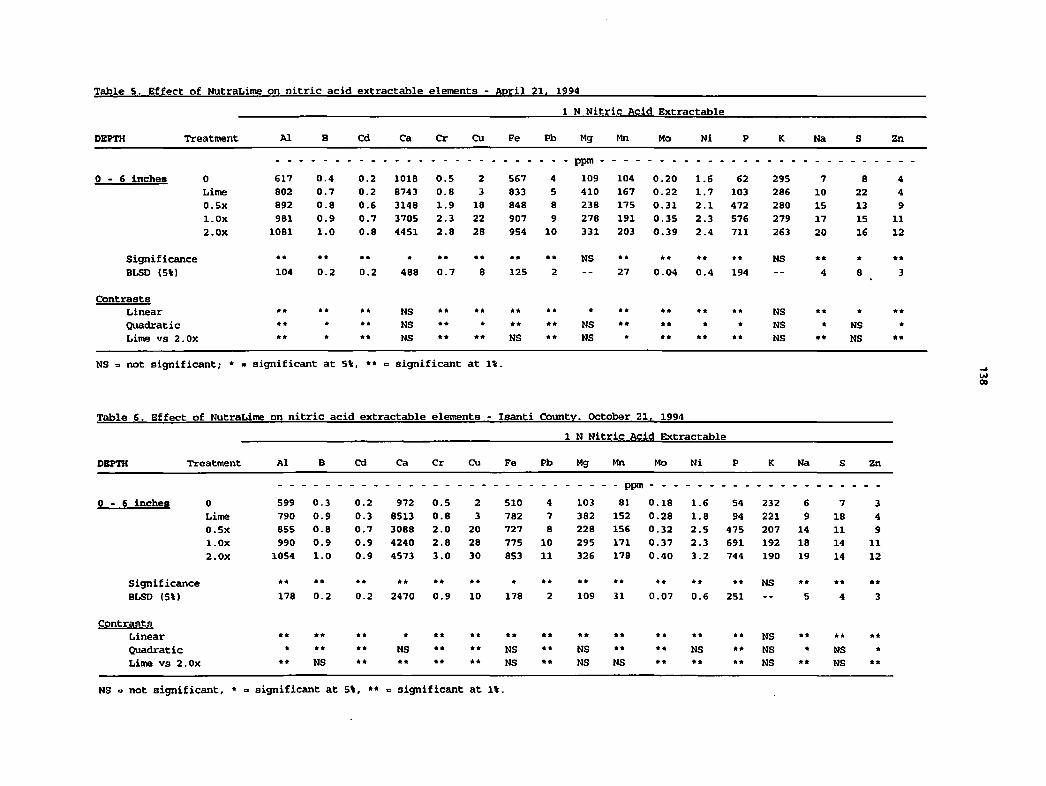
Table 5. Effect of NutraLime on nitric acid extractable elements - April 21. 1994
Tr«
1 N Nitric Acid Extractable
DEPTH satment AI B Cd Ca Cr Cu Fe Pb Mg Mn Mo Ni P K Na S Zn
0-6 inches 0 617 0.4 0.2 101B 0.5 2 567 4 109 104 0.20 1.6 62 295 7 8 4
Lime 802 0.7 0.2 8743 0.8 3 833 5 410 167 0.22 1.7 103 286 10 22 4
O.Sx 892 0.8 0.6 3148 1.9 18 848 8 238 175 0.31 2.1 472 280 15 13 9
l.Ox 981 0.9 0.7 3705 2.3 22 907 9 278 191 0.35 2.3 576 279 17 15 11
2.Ox 10B1 1.0 0.8 4451 2.8 28 954 10 331 203 0.39 2.4 711 263 20 16 12
Significance ** ** ** * ** ** ** ** NS ** ** * * ** NS ** * **
BLSD (5%) 104 0.2 0.2 4B8 0.7 8 125 2—
27 0.04 0.4 194-- 4 8 3
Contrasts
Linear *• ** ** NS ** ** ** ** * ** ** ** ** NS ** * **
Quadratic ** * ** NS • * * ** ** NS ** ** * * NS * NS *
Lime vs 2 .Ox ** * ** NS ** ** NS ** NS * ** ft* • * NS ** NS **
NS = not significant; * = significant at 5%, •* = significant at 14.
Table 6. Effect of NutraLime on nitric acid extractable elements - Isanti County. October 21, 1994
1 N Nitric Acid Extractable
DEPTH
0-6 Inches
Treatment
0
Lime
O.Sx
l.Ox
2.Ox
Significance
BLSD (SI)
Contrasts
Linear
Quadratic
Lime vs 2.Ox
AI Cd Ca Cr Cu Fe Pb Mg Mn Mo Ni Na Zn
599 0.3 0.2 972 0.5 2 510 4 103 81 0.18 1.6 54 232 6 7 3
790 0.9 0.3 8513 0.8 3 782 7 382 152 0.28 1.8 94 221 9 18 4
855 0.8 0.7 3088 2.0 20 727 a 228 156 0.32 2.5 475 207 14 11 9
990 0.9 0.9 4240 2.8 28 775 10 295 171 0.37 2.3 691 192 18 14 11
10S4 1.0 0.9 4573 3.0 30 853 n 326 178 0.40 3.2 744 190 19 14 12
** ** ** ** ** ** * ** ** ** ** ** ** NS ** ** **
178 0.2 0.2 2470 0.9 10 178 2 109 31 0.07 0.6 251--
5 4 3
** ** ** * ** ** ** ** ** ** ** • * ** NS ** ** **
* ** ** NS ** ** NS ** NS ** ** NS ** NS * NS *
** NS ** ft* ** ** NS ** NS NS ** ** ** NS ** NS **
NS o not significant, * = significant at 5%, ** = significant at IV.
oo

Table 7. Effect of NutraLime on the elemental composition of alfalfa samples, June 3, 1994 - Isanti county.
Treatment
Lime
0.5x
l.Ox
2.Ox
Significance
BLSD <5V)
Contrasts
Linear
Quadratic
Lime vs 2.Ox
Ca Mg
2.45 0.21 3.25 1.03 0.17
2.71 0.22 3.39 1.16 0.17
2.8S 0.25 3.36 1.2S 0.18
2.93 0.27 J.49 1.30 0.19
3.13 0.27 J.25 1.38 0.20
0.30 0.02
NS
NS
NS
NS
NS
0.18 0.02
NS NS
AI Fe Na Mn Zn Cu Pb Ni Cr Cd Mo
25 54 53 44 22.4 6.5 17.9 <1.68 1.91 <0.30 <0.12 <0.26
26 58 67 32 20.2 6.8 16.3 <1.68 2.12 <0.30 <0.12 0.78
32 63 86 23 17.9 7.3 16.2 <1.68 1.75 0.32 <0.12 2.78
37 68 102 24 18.1 7.3 17.4 <1.68 1.82 0.35 <0.12 4.01
45 75 108 25 17.9 7.S 19.0 <1.68 1.41 <0.41 <0.12 4.29
NS NS * NS ** * NS -- NS -- --**
-- -- 38 -- 1.6 0.6 1.36
* * - ** NS ** * NS ..
NS „ **
NS NS NS * • * NS NS -- NS -- --**
* * * NS ** * NS --*
-- --**
NS nonsignificant, • = significant at 5%, ** • significant at IV.
Table 8. Effect of HutraUme on the elemental composition of alfalfa samples. July 13. 1994 - Isanti county.
Treatment N P K Ca Mg AI Fe Na Mn Zn cu B Pb Ni Cr Cd Mo
... % .. - ppm
0 3.08 0.26 2.91 1.10 0.18 36 80 77 S4 24.6 9.8 21.0 <1.68 2.82 <0.32 <0.12 <0.22
Lime 2.6S 0 2fi 2.R6 1.01 0.16 28 73 74 41 21.5 9.6 15.3 <1.68 3.25 <0.30 <0.12 0.92
0.5x 2.89 0.30 2.76 1.21 0.17 38 77 124 40 19.7 8.9 16.5 <1.68 2.69 0.34 <0.12 3.26
l.Ox 2.79 0.30 2.61 1.21 o.ie 42 79 152 35 18.7 8.7 17.6 <1.68 2.40 0.35 <0.12 5.57
2. Ox 2.80 0.30 2.47 1.19 0.19 45 78 184 32 18.3 8.9 16.9 <1.68 2.60 0.41 <0.12 6.38
Significance NS • • * • NS NS NS NS * NS ** ft* ft*-- NS -- --
**
BLSD (SV)-- 0.02 0.22 -- -- -- -- 84 -- 2.5 0.6 2.0 1.79
Contrasts
Linear NS ** • * NS NS NS NS * * ** * **-- NS -- NS **
Quadratic NS • * NS NS NS NS NS NS NS ** ** *-- NS -- NS **
Lime vs 2. Ox NS * • * « NS NS NS NS * NS * * NS — NS -- NS **
NS => nonsignificant, * = significant at 5%, ** = significant at IV.
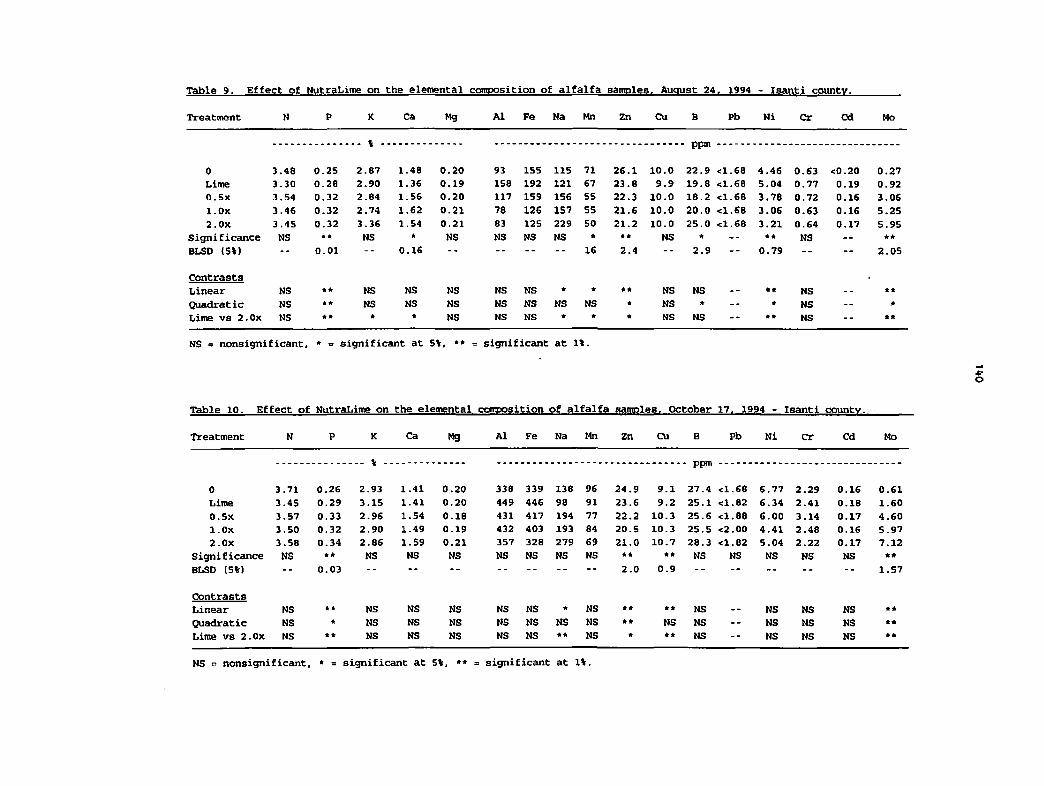
Table 9. Effect of NutraLime on the elemental composition of alfalfa samples. August 24. 1994 - Isanti county.
Treatment N P K Ca Mg AI Fe Na Mn Zn Cu B Pb Ni Cr Cd Mo
... * ..
0 3.48 0.25 2.87 1.48 0.20 93 155 115 71 26.1 10.0 22.9 <1.68 4.46 0.63 <0.20 0.27
Lime 3.30 0.28 2.90 1.36 0.19 158 192 121 67 23.8 9.9 19.8 <1.68 5.04 0.77 0.19 0.92
O.Sx 3.54 0.32 2.84 1.56 0.20 117 159 156 55 22.3 10.0 18.2 <1.68 3.78 0.72 0.16 3.06
l.Ox 3.46 0.32 2.74 1.62 0.21 78 126 157 55 21.6 10.0 20.0 <1.68 3.06 0.63 0.16 S.25
2. Ox 3.45 0.32 3.36 1.54 0.21 83 125 229 50 21.2 10.0 25.0 el.68 3.21 0.64 0.17 5.95
Significance NS • * NS * NS NS NS NS * ** NS *--
** NS --**
BLSD (SV) --0.01 --
0.16-- -- -- -- 16 2.4 -- 2.9
-- 0.79-- -- 2.05
Contrasts
Linear NS ft* NS NS NS NS NS * * ** NS NS --** NS --
**
Quadratic NS ft* NS NS NS NS NS NS NS * NS *--
* NS --
*
Lime vs 2. Ox NS ft* * * NS NS NS * * * NS NS --
«* NS --
**
NS = nonsignificant, * = significant at 5V, ** = significant at 1*.
Table 10. Effect of NutraLime on the elemental composition off alfalfa samples, October 17. 1994 - Isanti county.
Treatment N P K Ca Mg AI Fe Na Mn Zn Cu B Pb Ni cr Cd Mo
... «. .. - ppm
0 3.71 0.26 2.93 1.41 0.20 338 339 138 96 24.9 9.1 27.4 <1.68 6.77 2.29 0.16 0.61
Lime 3.4S 0.29 3.15 1.41 0.20 449 446 98 91 23.6 9.2 25.1 <1.82 6.34 2.41 0.18 1.60
0.5x 3.57 0.33 2.96 1.54 0.18 431 417 194 77 22.2 10.3 25.6 <1.88 6.00 3.14 0.17 4.60
l.Ox 3.50 0.32 2.90 1.49 0.19 432 403 193 84 20. S 10.3 25.5 <2.00 4.41 2.48 0.16 5.97
2.Ox 3.SB 0.34 2.86 1.59 0.21 357 328 279 69 21.0 10.7 28.3 <1.82 S.04 2.22 0.17 7.12
Significance NS ** NS NS NS NS NS NS NS ** ft* NS NS NS NS NS **
BLSD (5V) -- 0.03 -- -- -- 2.0 0.9 1.57
Contrasts
Linear NS ** NS NS NS NS NS * NS ** ** NS -- NS NS NS **
Quadratic NS * NS NS NS NS NS NS NS ** NS NS -- NS NS NS **
Lime vs 2. Ox NS ** NS NS NS NS NS ** NS * ** NS -- NS NS NS **
NS = nonsignificant, * = significant at 5V, ** = significant at IV.
o
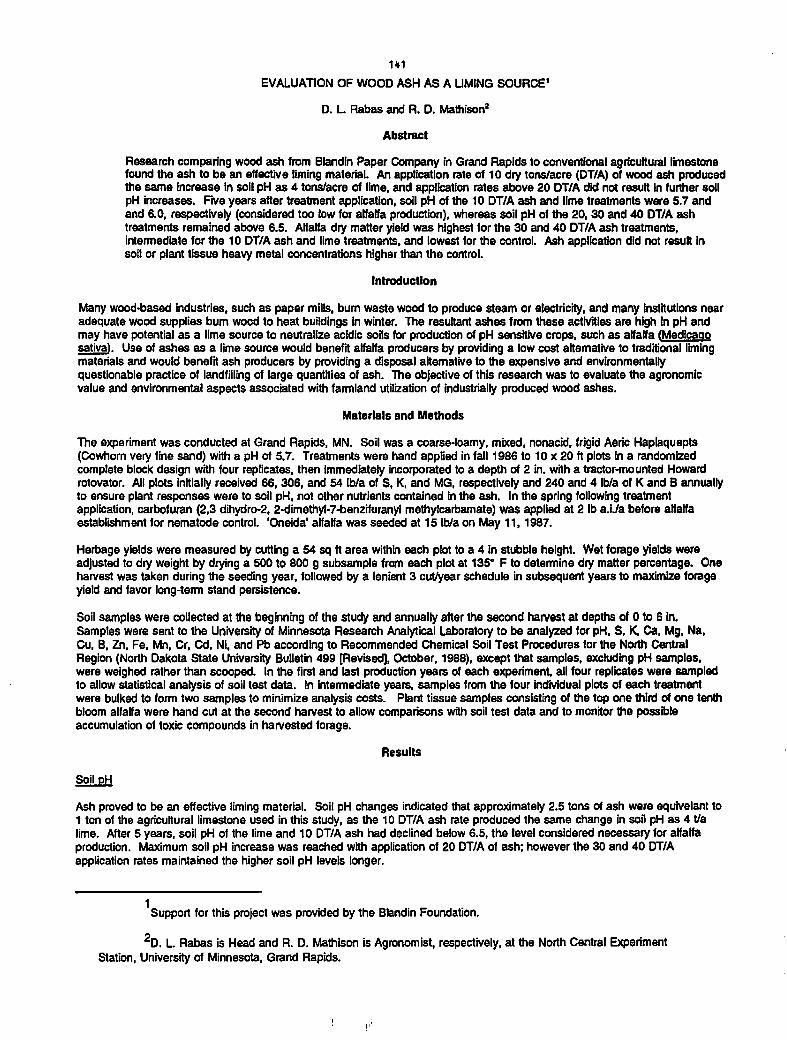
141
EVALUATION OF WOOD ASH AS A LIMING SOURCE1
D. L. Rabas and R. D. Mathison2
Abstract
Research comparing wood ash from Blandin Paper Company in Grand Rapids to conventional agricultural limestonefound the ash to be an effective liming material. An application rate of 10 dry tons/acre (DT/A) of wood ash producedthe same increase in soil pH as 4 tons/acre of lime, and application rates above 20 DT/A did not result in further soilpH increases. Five years after treatment application, soil pH of the 10 DT/A ash and lime treatments were 5.7 andand 6.0, respectively (considered too low for alfalfa production), whereas soil pH of the 20,30 and 40 DT/A ashtreatments remained above 6.5. Alfalfa dry matter yield was highest for the 30 and 40 DT/A ash treatments,intermediate for the 10 DT/A ash and lime treatments, and lowest for the control. Ash application did not result insoil or plant tissue heavy metal concentrations higher than the control.
Introduction
Many wood-based industries, such as paper mills, burn waste wood to produce steam or electricity,and many Institutions nearadequate wood supplies bum wood to heat buildings in winter. The resultant ashes from these activities are high In pH andmay have potential as a lime source to neutralize acidic soils for production of pH sensitive crops, such as alfalfa (Medicagosativa). Use ofashes as a lime source would benefit alfalfa producers byproviding a low cost alternative totraditional limingmaterials and would benefit ash producers by providing a disposal alternative to the expensive and environmentallyquestionable practice of landfilling of large quantities of ash. The objective of this research was to evaluate the agronomicvalue and environmental aspects associated with farmland utilization of industrially produced wood ashes.
Materials and Methods
The experiment was conducted at Grand Rapids, MN. Soil was a coarse-loamy, mixed, nonacid, frigid Aerie Haplaquepts(Cowhorn very fine sand) with a pH of 5.7. Treatments were hand applied in fall 1986 to 10 x 20 ft plots in a randomizedcomplete block design with four replicates, then immediately incorporated to a depth of 2 in. with a tractor-mounted Howardrotovator. All plots initially received 66,306, and 54 lb/a of S, K, and MG, respectively and 240 and 4 Ib/aof K and B annuallyto ensure plant responses were to soil pH, not other nutrients contained in the ash. In the spring following treatmentapplication, carbofuran (2,3 dihydro-2, 2-dimethyl-7-benzifuranyl methylcarbamate) was applied at 2 lb a.i./a before alfalfaestablishment for nematode control. 'Oneida' alfalfawas seeded at 15 lb/a on May 11,1987.
Herbage yields were measured by cutting a 54 sq ft area within each plot to a 4 in stubble height. Wet forage yields wereadjusted to dry weight by drying a 500 to 800 g subsample from each plot at 135° F to determine dry matter percentage. Oneharvest was taken during the seeding year, followed by a lenient 3 cut/year schedule in subsequent years to maximize forageyield and favor long-term stand persistence.
Soil samples were collected at the beginning of the study and annuallyafterthe second harvestat depths of 0 to 6 in.Samples were sent to the University of Minnesota Research Analytical Laboratory to be analyzed for pH, S, K, Ca, Mg, Na,Cu, B, Zn, Fe, Mn, Cr, Cd, Ni, and Pb according to Recommended Chemical Soil Test Procedures for the North CentralRegion (North Dakota State University Bulletin 499 [Revised], October, 1988), except that samples, excluding pH samples,were weighed rather than scooped. In the first and last production years of each experiment, all four replicates were sampledto allow statistical analysis of soil test data. In intermediate years, samples from the four Individual plots of each treatmentwere bulked to form two samples to minimize analysis costs. Planttissue samples consisting of the top one third of one tenthbloom alfalfa were hand cut at the second harvest to allow comparisons with soil test data and to monitor the possibleaccumulation of toxic compounds in harvested forage.
Results
SoilpH
Ash proved to be an effective liming material. Soil pH changes indicated that approximately 2.5 tons of ash were equivelant to1 ton of the agricultural limestone used in this study, as the 10 DT/A ash rate produced the same change in soil pH as 4 t/alime. After 5 years, soil pH of the lime and 10 DT/A ash had declined below 6.5, the level considered necessary for alfalfaproduction. Maximum soil pH increase was reached with application of 20 DT/Aof ash; however the 30 and 40 DT/Aapplication rates maintained the higher soil pH levels longer.
Support for this project was provided by the Blandin Foundation.
2D. L Rabas is Head and R. D. Mathison is Agronomist, respectively, at the North Central ExperimentStation, University of Minnesota, Grand Rapids.

142
Forage yield
Forage dry matter yield was increased with the addition of lime, as expected. Ash application also resulted in increasedforage dry matter yield, with the 10 and 20 DT/A ash application rates resulting in dry matter yield increases similarto the aglime treatment, and the 30 and 40 DT/A application rates yielding significantiy more. The reason for the dry matter yieldincrease associated with the two higher ash rates is not readilyapparent, as sufficient fertilizer was added annually as part ofthe experimental procedure to attempt to eliminate soil fertility as a variable in this study. Comparison of soil and plant tissueelemental analysis suggests differences in soil K levels may have been partially responsible for the observed yield differencesbecause treatments with the highest dry matter yield had significantly higher soil and plant tissue K levels. Similarly,differences in S levels may have also been partially responsible for the observed differences in dry matter yield.
Table 1. Effect of treatment application on forage dry matter yield3and plant tissue elemental analysis4
Yield Plant Tissue
Treatment so4 K Mg B Pb Ni Cd Cr
TDM/A
6.32
%
0.24Check 17,971 2660 89
PPm-
<2.16 2.33 <0.32 <0.22
Ag lime, 4T/A 7.87 0.28 16,386 3174 78 <2.16 1.99 <0.33 <0.22
Ash,10 TDM/A 7.78 0.29 18,568 2546 86 <2.16 <2.09 <0.40 <0.24
Ash,20 TDM/A 8.36 0.31 20,207 2440 80 <2.16 <1.81 <0.39 <0.24
Ash,30 TDM/A 8.93 0.33 22254 2298 81 <2.16 1.62 <0.32 <0,30
Ash,40 TDM/A 8.93 0.35 22,338 2283 89 <2.16 2.25 <0.28 <0.23
LSD (0.05) 0.74 0.04 2335 230 NS NS NS NS NS
Table 2. Effect of treatment application on soil pH and elemental analysis5
SoilPH
Treatment 1987 1990 K Mg so4 B Pb Ni Cd Cr
PP'" " •••
Check 5.7 5.2 81 60 7 1.3 3.06 0.53 0.04 <0.02
Ag lime. 4 T/A 6.5 6.0 61 140I 8 1.5 3.56 0.38 0.05 <0.03
Ash.10 TDM/A 6.5 5.7 73 63 6 2.1 3.15 0.43 0.07 <0.02
Ash.20 TDM/A 7.3 6.6 88 64 8 2.4 2.38 0.27 0.06 <0.02
Ash,30 TDM/A 7.3 7.1 112 73 9 2.5 2.95 0.33 0.04 <0.02
Ash,40 TDM/A 7.5 7.2 114 78 10 3.3 3.91 0.26 0.04 <0.02
LSD (0.05) 0.5 0.3 27 20 2 0.7 NS 0.13 NS <0.004
^otal forage dry matter yield for 1988 through 1990.
'Top one third of earlhy bloom aflalfa taken at the second harvest.
'0 to 6 in. sampling depth, collected after the second harvest.


