Design and synthesis of polysaccharides/(co)polymers based amphiphilic conetwork gels for biomedical applications
CSIR-CSMCRI
CSIR-SRF (GATE) Assessment/DAC-II Presentation
Arvind Kumar Singh Chandel
Enrolment no: 10BB14J16016
Under the guidance of
Reverse Osmosis (Membrane) Division
CSIR- Central Salt & Marine Chemicals Research Institute
Bhavnagar, Gujarat-364002
Dr. Suresh K. Jewrajka
Co-supervisior
Dr. Soumya Haldar
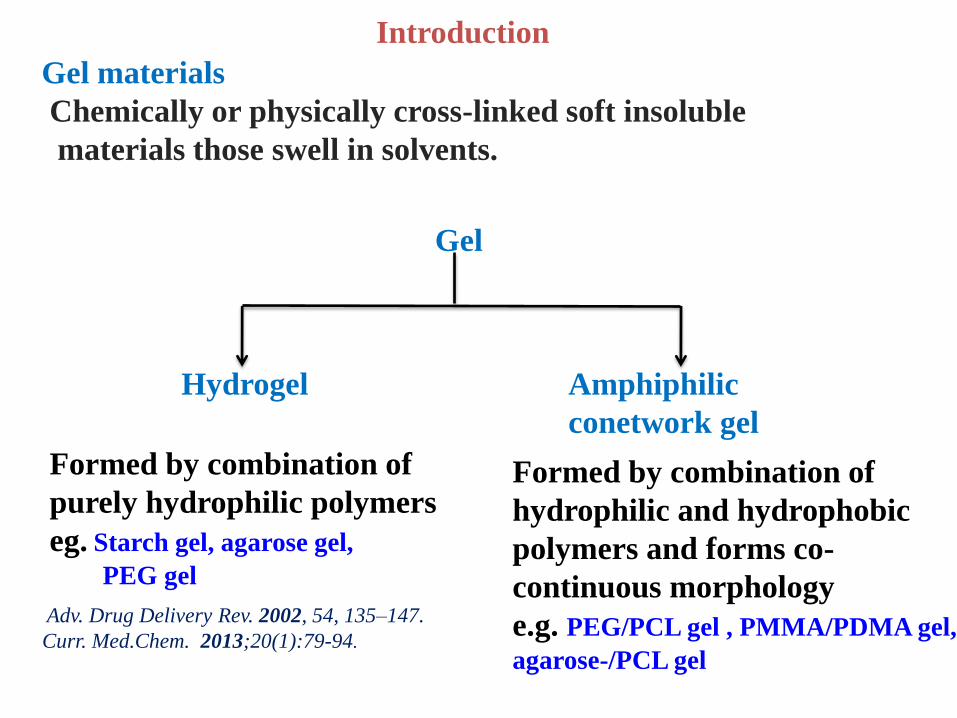
Introduction
Gel materials
Chemically or physically cross-linked soft insoluble
materials those swell in solvents.
Gel
Hydrogel Amphiphilic
conetwork gel
Formed by combination of
purely hydrophilic polymers
eg. Starch gel, agarose gel,
PEG gel
Formed by combination of
hydrophilic and hydrophobic
polymers and forms co-
continuous morphology
e.g. PEG/PCL gel , PMMA/PDMA gel,
agarose-/PCL gel
Adv. Drug Delivery Rev. 2002, 54, 135–147.
Curr. Med.Chem. 2013;20(1):79-94.

Introduction
• Polysaccharide-based hydrogels are mostly reported in the literature.
Advantage of amphiphilic gel (APG) over simple hydrogel (HG)
1. APGs exhibit high loading capacity of both hydrophobic and hydrophilic drugs whereas
encapsulation of hydrophilic drug by HG is difficult.
2. Higher degree of tissue adherence by APG compared to that of simple HG.
3. Higher mechanical properties of APG compared to that of HG.
4. Controlling of hydrophilic to hydrophobic ratio in the APGs provide controlled fabrication
APGs for particular application.
APGs made up of FDA approved biodegradable/biocompatible hydrophilic polysaccharides and
hydrophobic polycaprolactone (PCL) is highly desirable for safe use in biomedical applications.
Need
Biomacromolecules 2005, 6, 653−662; Biomacromolecules 2005, 6, 3227−37; Chemosphere
2013, 93, 2854−8; Biomacromolecules 2014, 08, 15
Reported materials
• There is no report of polysaccharides/PCL amphiphilic gel for drug delivery applications.
PCL grafted with zwitterionic polymer for the enhancement of surface hemocompatibility.
(Langmuir 2011, 27, 11575–11581)
Enzymatic degradable PEG/PCL APG was synthesized. (Biomacromolecules 2006, 7, 1968-1975)
Degradable poly(2-hydroxyethyl methacrylate)-co-PCL APG was synthesized by ATRP.
(Biomacromolecules 2008, 9, 3370–3377).
Examples
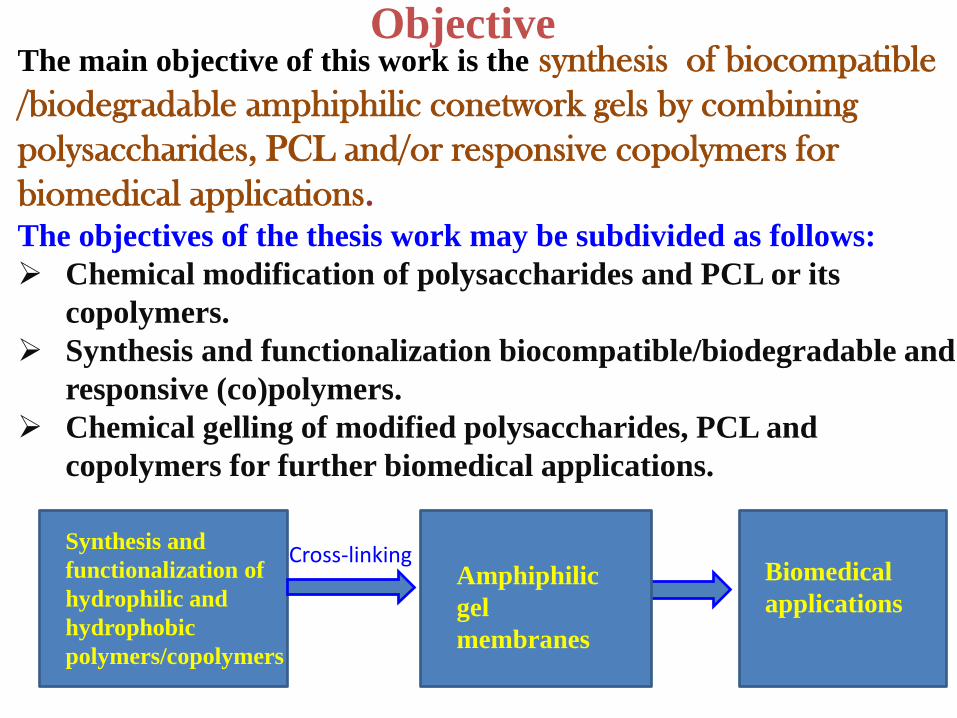
Objective The main objective of this work is the synthesis of biocompatible
/biodegradable amphiphilic conetwork gels by combining
polysaccharides, PCL and/or responsive copolymers for
biomedical applications.
The objectives of the thesis work may be subdivided as follows:
Chemical modification of polysaccharides and PCL or its
copolymers.
Synthesis and functionalization biocompatible/biodegradable and
responsive (co)polymers.
Chemical gelling of modified polysaccharides, PCL and
copolymers for further biomedical applications.
Synthesis and
functionalization of
hydrophilic and
hydrophobic
polymers/copolymers
Cross-linking Amphiphilic
gel
membranes
Biomedical
applications
Polycaprolactone diolCl
ClO
OO
O
O
OH
O
HO
n n
Et3N/ 24 h
room temperature
OO
O
OO
O
OOO
Cl
OO
O
Cl
On n
(C)
ClCH2-Ph-PCL-Ph-CH2Cl
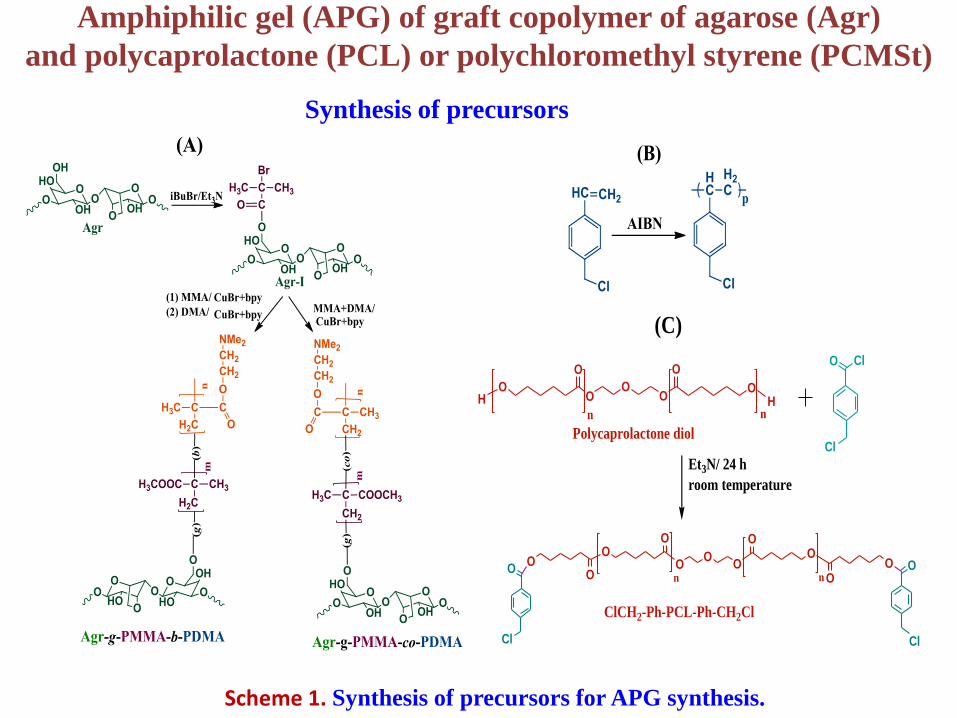
Amphiphilic gel (APG) of graft copolymer of agarose (Agr)
and polycaprolactone (PCL) or polychloromethyl styrene (PCMSt)
Synthesis of precursors
Scheme 1. Synthesis of precursors for APG synthesis.

APGs of graft copolymer of Agr and PCL or PCMSt
Amphiphilic gel of Agr-g-PMMA-b-PDMA and PCL.
Synthesis of APGs
Amphiphilic gel of Agr-g-PMMA-b-PDMA and PCMSt.
Scheme 2.

Injectability of APG particles
Agr-NMe2
+ Cl-PCL-b-PEG-b-PCL-Cl
Gel particles of size ~160 m was obtained by mechanical milling of liquid nitrogen
frozen APG films and filtering the particles through 160 mesh sieves. The
particles remain dispersed in water for about 10 min and are injectable through
hypodermic syringe of needle size 20-G.
Mechanical
milling
APG
Membrane
Scheme 1. Injectability of APG particles.
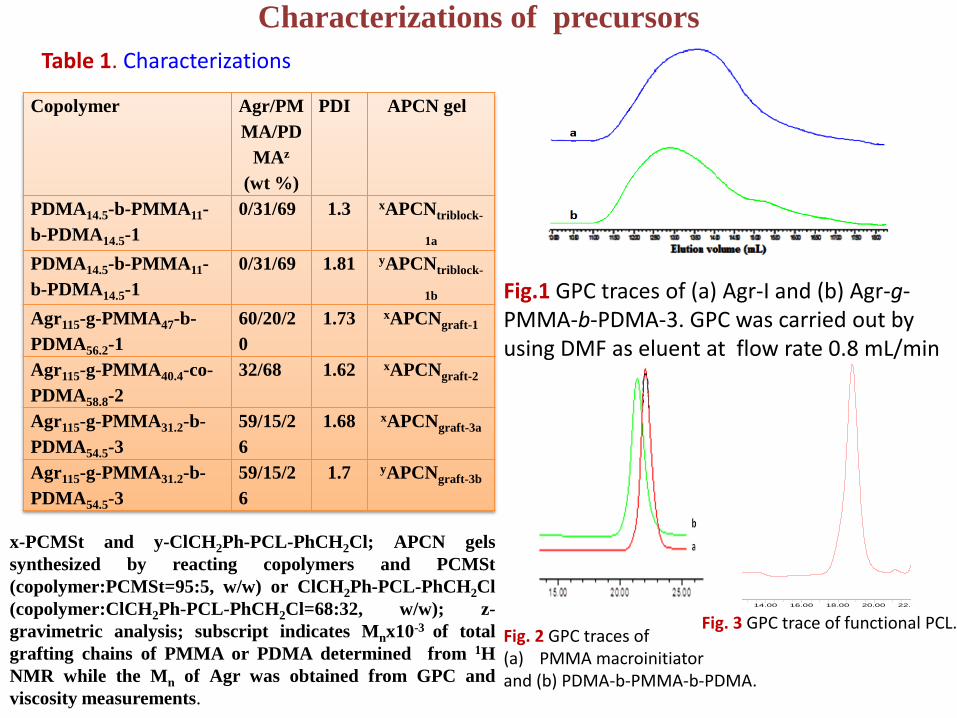
Characterizations of precursors
Copolymer Agr/PM
MA/PD
MAz
(wt %)
PDI
APCN gel
PDMA14.5-b-PMMA11-
b-PDMA14.5-1
0/31/69 1.3 xAPCNtriblock-
1a
PDMA14.5-b-PMMA11-
b-PDMA14.5-1
0/31/69 1.81 yAPCNtriblock-
1b
Agr115-g-PMMA47-b-
PDMA56.2-1
60/20/2
0
1.73 xAPCNgraft-1
Agr115-g-PMMA40.4-co-
PDMA58.8-2
32/68 1.62 xAPCNgraft-2
Agr115-g-PMMA31.2-b-
PDMA54.5-3
59/15/2
6
1.68 xAPCNgraft-3a
Agr115-g-PMMA31.2-b-
PDMA54.5-3
59/15/2
6
1.7 yAPCNgraft-3b
x-PCMSt and y-ClCH2Ph-PCL-PhCH2Cl; APCN gels
synthesized by reacting copolymers and PCMSt
(copolymer:PCMSt=95:5, w/w) or ClCH2Ph-PCL-PhCH2Cl
(copolymer:ClCH2Ph-PCL-PhCH2Cl=68:32, w/w); z-
gravimetric analysis; subscript indicates Mnx10-3 of total
grafting chains of PMMA or PDMA determined from 1H
NMR while the Mn of Agr was obtained from GPC and
viscosity measurements.
Fig.1 GPC traces of (a) Agr-I and (b) Agr-g-PMMA-b-PDMA-3. GPC was carried out by using DMF as eluent at flow rate 0.8 mL/min
Overlay Report
Project Name: POLY STYRENE THFReported by User: CSMCRI (CSMCRI)
Report Method: Overlay Report Date Printed:
5723 6/30/2015Report Method ID: 5723
12:34:35 PM Asia/Calcutta
CHANDEL 06; Date Acquired: 6/17/2015 1:17:13 AM IST; Vial: 23; Inj #: 1; Channel:
MV
-100.00
0.00
100.00
200.00
300.00
400.00
500.00
600.00
700.00
800.00
900.00
1000.00
1100.00
Minutes
0.00 2.00 4.00 6.00 8.00 10.00 12.00 14.00 16.00 18.00 20.00 22.00 24.00 26.00 28.00 30.00
Fig. 2 GPC traces of (a) PMMA macroinitiator and (b) PDMA-b-PMMA-b-PDMA.
Fig. 3 GPC trace of functional PCL.
Table 1. Characterizations
APCN APG Composition
(wt %)
E (%) Swelling (%)
Water
(Sw)
Toluene
(St) Agr PDMA PMMA PCMSt/
PCL
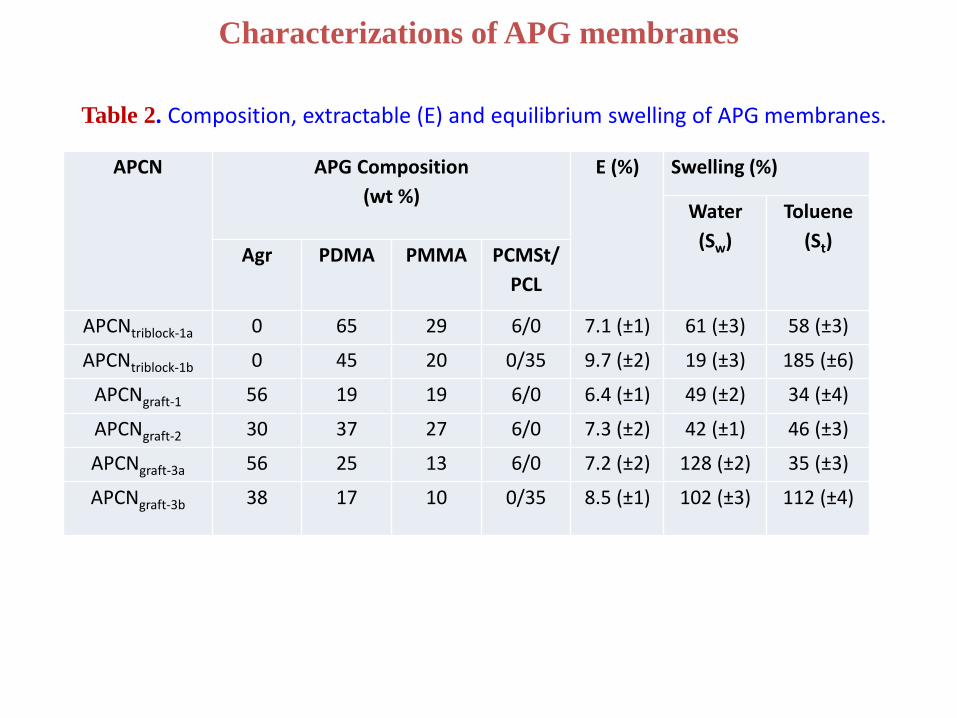
APCNtriblock-1a 0 65 29 6/0 7.1 (±1) 61 (±3) 58 (±3)
APCNtriblock-1b 0 45 20 0/35 9.7 (±2) 19 (±3) 185 (±6)
APCNgraft-1 56 19 19 6/0 6.4 (±1) 49 (±2) 34 (±4)
APCNgraft-2 30 37 27 6/0 7.3 (±2) 42 (±1) 46 (±3)
APCNgraft-3a 56 25 13 6/0 7.2 (±2) 128 (±2) 35 (±3)
APCNgraft-3b 38 17 10 0/35 8.5 (±1) 102 (±3) 112 (±4)
Characterizations of APG membranes
Table 2. Composition, extractable (E) and equilibrium swelling of APG membranes.
F D
E C A
B
G
H
I K
J L
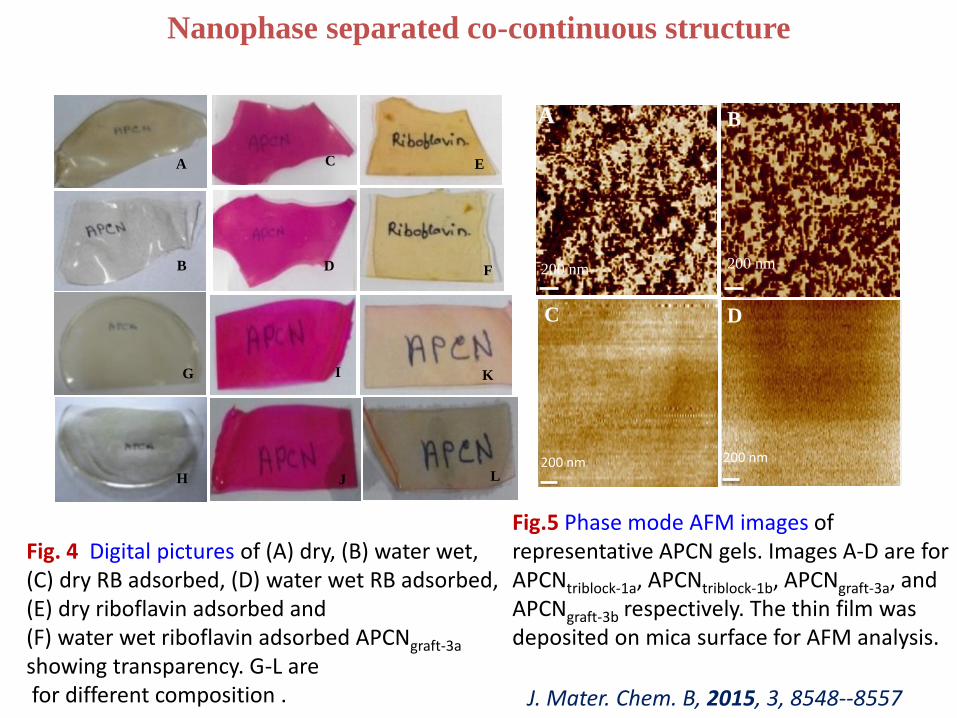
Fig. 4 Digital pictures of (A) dry, (B) water wet, (C) dry RB adsorbed, (D) water wet RB adsorbed, (E) dry riboflavin adsorbed and (F) water wet riboflavin adsorbed APCNgraft-3a showing transparency. G-L are for different composition .
Nanophase separated co-continuous structure
200 nm
D
200 nm
C
A
200 nm 200 nm
B
Fig.5 Phase mode AFM images of representative APCN gels. Images A-D are for APCNtriblock-1a, APCNtriblock-1b, APCNgraft-3a, and
APCNgraft-3b respectively. The thin film was deposited on mica surface for AFM analysis.
J. Mater. Chem. B, 2015, 3, 8548--8557
20 30 40 50 60 70 80 90 100 110 120 130
c'
c
b
a'
a
Hea
t fl
ow
(en
do)
Temparature (oC)
GraftPCL
TriblockPCL
tria
graft1
graft3a
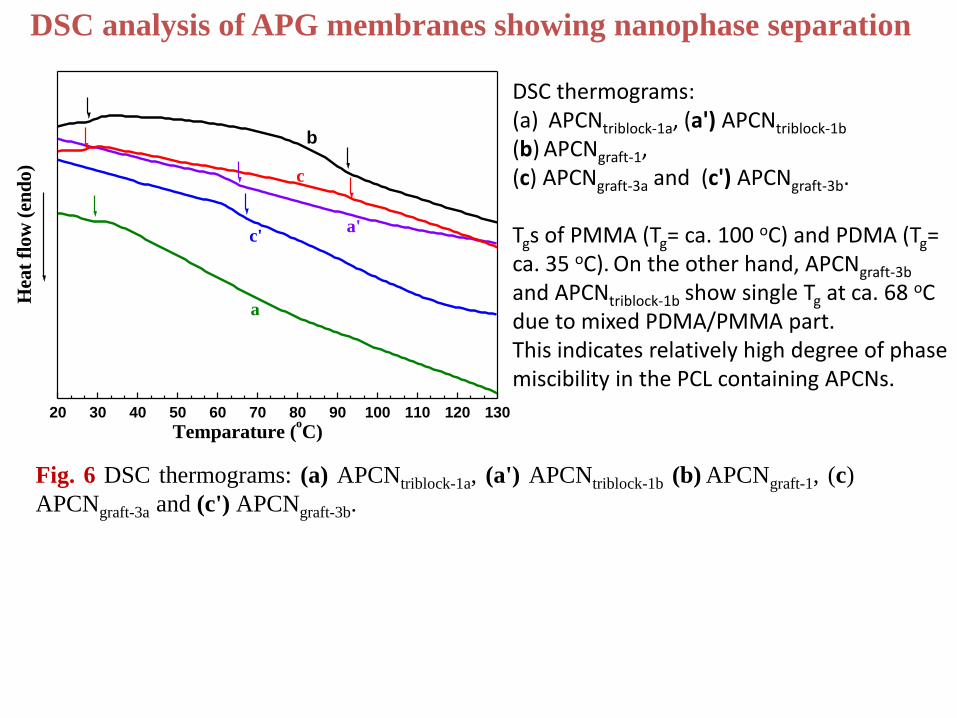
Fig. 6 DSC thermograms: (a) APCNtriblock-1a, (a') APCNtriblock-1b (b) APCNgraft-1, (c)
APCNgraft-3a and (c') APCNgraft-3b.
DSC analysis of APG membranes showing nanophase separation
DSC thermograms: (a) APCNtriblock-1a, (a') APCNtriblock-1b (b) APCNgraft-1, (c) APCNgraft-3a and (c') APCNgraft-3b. Tgs of PMMA (Tg= ca. 100 oC) and PDMA (Tg= ca. 35 oC). On the other hand, APCNgraft-3b and APCNtriblock-1b show single Tg at ca. 68 oC due to mixed PDMA/PMMA part. This indicates relatively high degree of phase miscibility in the PCL containing APCNs.
Tensile stress-strain property of APCN membranes
0 10 20 30 40 50 60 70 80 900
1
2
3
4
5
6
7
c'
ca
a'
co15
co41
triblock
PCLgraftco
Grfattri
b
Ten
sile
str
ess
(MP
a)
Strain (%)
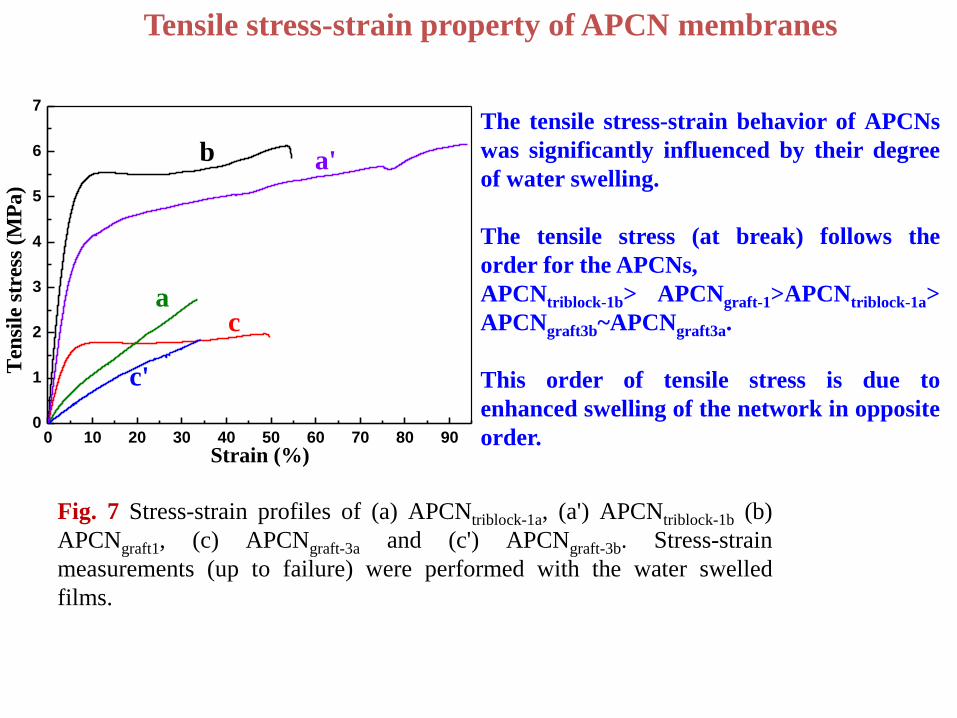
Fig. 7 Stress-strain profiles of (a) APCNtriblock-1a, (a') APCNtriblock-1b (b)
APCNgraft1, (c) APCNgraft-3a and (c') APCNgraft-3b. Stress-strain
measurements (up to failure) were performed with the water swelled
films.
The tensile stress-strain behavior of APCNs
was significantly influenced by their degree
of water swelling.
The tensile stress (at break) follows the
order for the APCNs,
APCNtriblock-1b> APCNgraft-1>APCNtriblock-1a>
APCNgraft3b~APCNgraft3a.
This order of tensile stress is due to
enhanced swelling of the network in opposite
order.
Degradation behavior of APGs
0 10 20 3070
75
80
85
90
95
100
Rem
ain
ing w
eigh
t (%
)
Hydrolytic time (day)
APCNgraft-3a
at pH=5
APCNgraft-3b
at pH=7.4
APCNgraft-3b
at pH=5
APCNgraft-3b
at pH=7.5
Characterizations of species formed by degradation of APGs
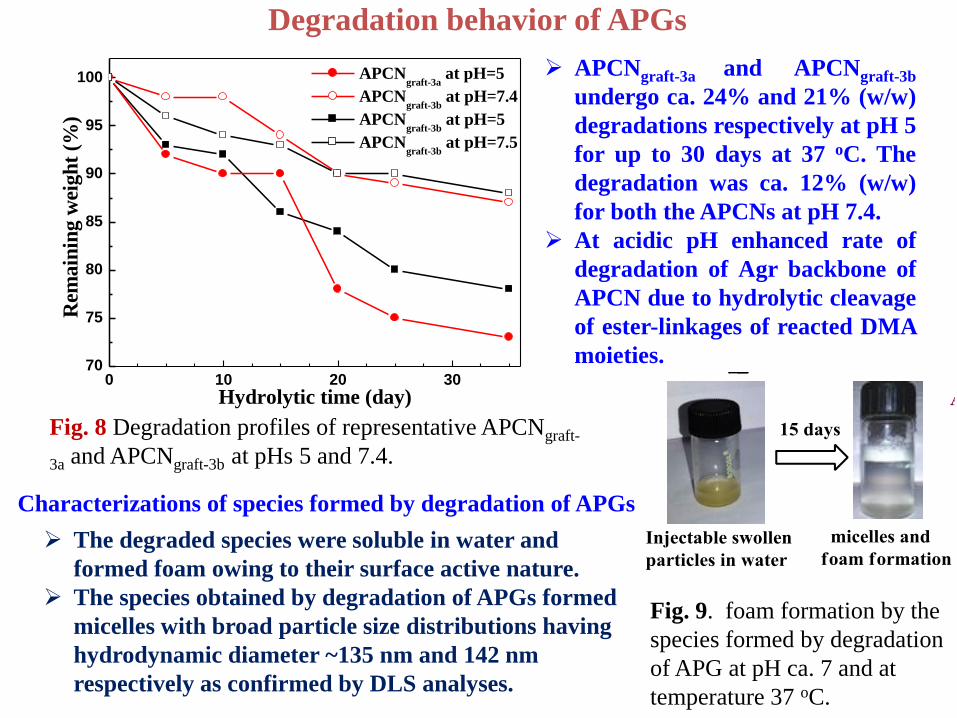
Fig. 8 Degradation profiles of representative APCNgraft-
3a and APCNgraft-3b at pHs 5 and 7.4.
APCNgraft-3a and APCNgraft-3b
undergo ca. 24% and 21% (w/w)
degradations respectively at pH 5
for up to 30 days at 37 oC. The
degradation was ca. 12% (w/w)
for both the APCNs at pH 7.4.
At acidic pH enhanced rate of
degradation of Agr backbone of
APCN due to hydrolytic cleavage
of ester-linkages of reacted DMA
moieties.
The degraded species were soluble in water and
formed foam owing to their surface active nature.
The species obtained by degradation of APGs formed
micelles with broad particle size distributions having
hydrodynamic diameter ~135 nm and 142 nm
respectively as confirmed by DLS analyses.
Fig. 9. foam formation by the
species formed by degradation
of APG at pH ca. 7 and at
temperature 37 oC.
Drug Release from APGs
0 20 40 60 80 100 120 140 160 1800
20
40
60
80
Cu
mu
lati
ve
rele
ase
(%
)
Time (h)
pH=5
pH=7.4
0 100 200 300 4000
10
20
30
40
50
60
Cu
mu
lati
ve
rele
ase
(%
)
Time (h)
pH 5
pH 7.4 5-fluorouracil
APCNgraft 3a
5-fluorouracil
APCNgraft-3a
0 50 100 150 200 250 300 350 400
20
40
60
Time (h)
Cum
ulat
ive
rele
ase
(%)
A
pH 5
pH 7.4
0 50 100 150 200 250 300 350 4001.5
2.0
2.5
3.0
3.5
4.0
4.5
5.0
5.5
B
Dru
g r
elea
se (
mg
)
Time (h)
pH 5
pH 7.4
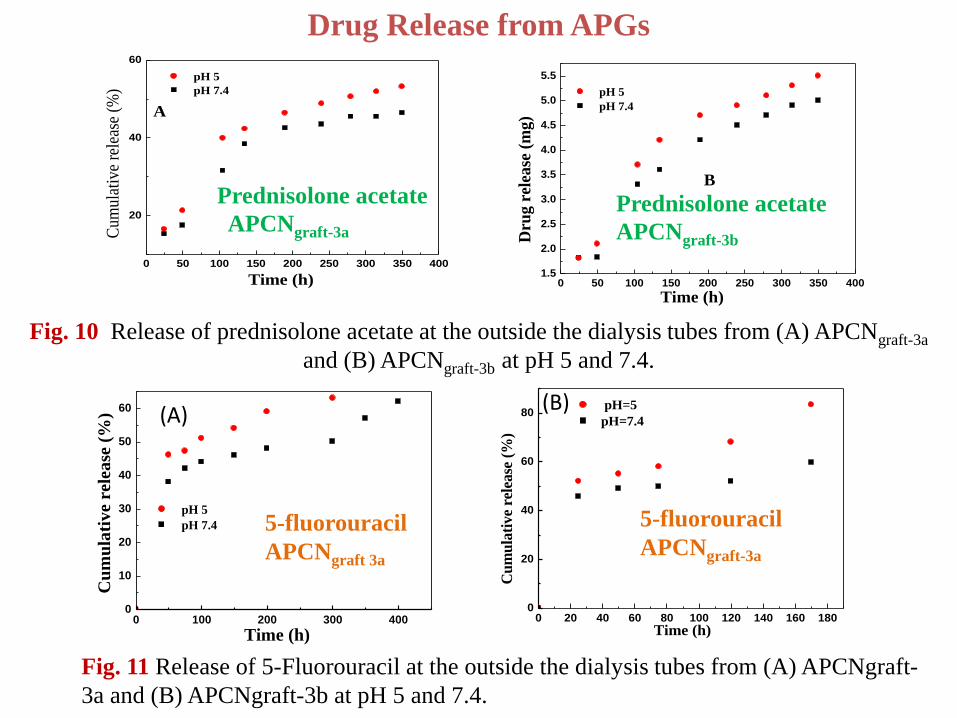
Fig. 10 Release of prednisolone acetate at the outside the dialysis tubes from (A) APCNgraft-3a
and (B) APCNgraft-3b at pH 5 and 7.4.
Prednisolone acetate
APCNgraft-3a Prednisolone acetate
APCNgraft-3b
Fig. 11 Release of 5-Fluorouracil at the outside the dialysis tubes from (A) APCNgraft-
3a and (B) APCNgraft-3b at pH 5 and 7.4.
.
(A) (B)

0.0
0.2
0.4
0.6
0.8
1.0
1.2
1.4 A
Con
trol
Deg
rad
ed s
pec
ies
of
AP
CN
gra
ft-3
a
AP
CN
trib
lock
-1b
AP
CN
trib
lock
-1a
AP
CN
gra
ft-3
b
AP
CN
gra
ft-3
a
Sample
Cel
l v
iab
ilit
y
B
E
H
K
N
Q
0
1
2
3
4
5
6
7B
Sample
Hem
oly
sis
(%)
Deg
rad
ed s
pec
ies
of
AP
CN
gra
ft-3
a
AP
CN
gra
ft-3
b
AP
CN
gra
ft-3
a
AP
CN
trib
lock
-1b
AP
CN
trib
lock
-1a
B
E
Cytocompatibility and blood compatibility of APGs
Fig. 12 Viability of HeLa cells after 24 h of
incubation with APGs and species formed by
degradation of APCNgraft-3a at 37 oC.
Fig. 13 Hemocompatibility of APGs and degraded
species of APCNgraft-3a after incubation with blood
cells for 1 h at 37 oC.
The cytocompatibility of APGs and species formed
by degradation of a APGs was determined by MTT
assay using the HeLa cell line.
MTT assay indicated a high degree of cell viability
after treating HeLa cells with various APGs and
their degraded species.
Hemolysis of RBCs in presence of various
APGs and their degraded species were
examined using triton-X and 0.9% NaCl
solutions as positive and negative control
respectively .
Low hemolysis (5-6%) indicated high degree
of hemocompatibility of APGs and their
degraded species.

Synthesis of APGs from agarose amine and
halide terminated polycaprolactone
Synthesis of precursors
Synthesis of Amphiphilic gel
Scheme 4 Synthesis of APGs from Agr-amine and halide terminated PCL-b-PEG-b-PCL copolymer.
Characterization of precursors
a b
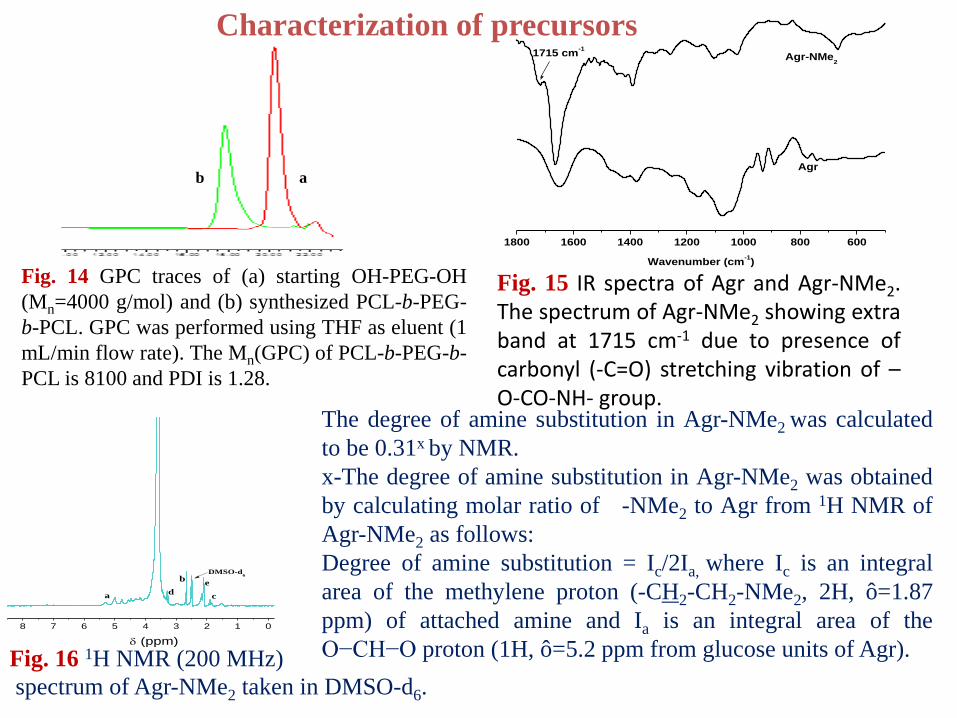
Fig. 14 GPC traces of (a) starting OH-PEG-OH
(Mn=4000 g/mol) and (b) synthesized PCL-b-PEG-
b-PCL. GPC was performed using THF as eluent (1
mL/min flow rate). The Mn(GPC) of PCL-b-PEG-b-
PCL is 8100 and PDI is 1.28.
1800 1600 1400 1200 1000 800 600
Agr
Wavenumber (cm-1)
1715 cm-1
Agr-NMe2
Fig. 15 IR spectra of Agr and Agr-NMe2. The spectrum of Agr-NMe2 showing extra band at 1715 cm-1 due to presence of carbonyl (-C=O) stretching vibration of –O-CO-NH- group.
8 7 6 5 4 3 2 1 0
(ppm)
d
be
DMSO-d6
ca
b
The degree of amine substitution in Agr-NMe2 was calculated
to be 0.31x by NMR.
x-The degree of amine substitution in Agr-NMe2 was obtained
by calculating molar ratio of -NMe2 to Agr from 1H NMR of
Agr-NMe2 as follows:
Degree of amine substitution = Ic/2Ia, where Ic is an integral
area of the methylene proton (-CH2-CH2-NMe2, 2H, ô=1.87
ppm) of attached amine and Ia is an integral area of the
O−CH−O proton (1H, ô=5.2 ppm from glucose units of Agr). Fig. 16 1H NMR (200 MHz)
spectrum of Agr-NMe2 taken in DMSO-d6.

APG Agr/PCL or Agr/PCL-PEG-
PCLa
(%, w/w)
Actual amount in APGc
(%, w/w)
Reaction
mixture
Actual
compositionb
Agr PCL PEG
Agr-PEG-
PCL(1:1)
1:1 1:0.55 65 23 12
Agr-PEG-
PCL(5:2)
1:0.4 1:0.21 83 11 6
Agr-PCL(1:1) 1:1 1:0.35 74 26 0
Agr-PCL(5:2) 1:0.4 1:0.15 86 14 0
Characterization of APGs
Table 3 Compositions of APGs.
a-functional polymers and copolymers; b-calculated from two step (acetone and DMF)
extraction process and c-from two step extraction and composition of PCL-b-PEG-b-PCL
copolymer.
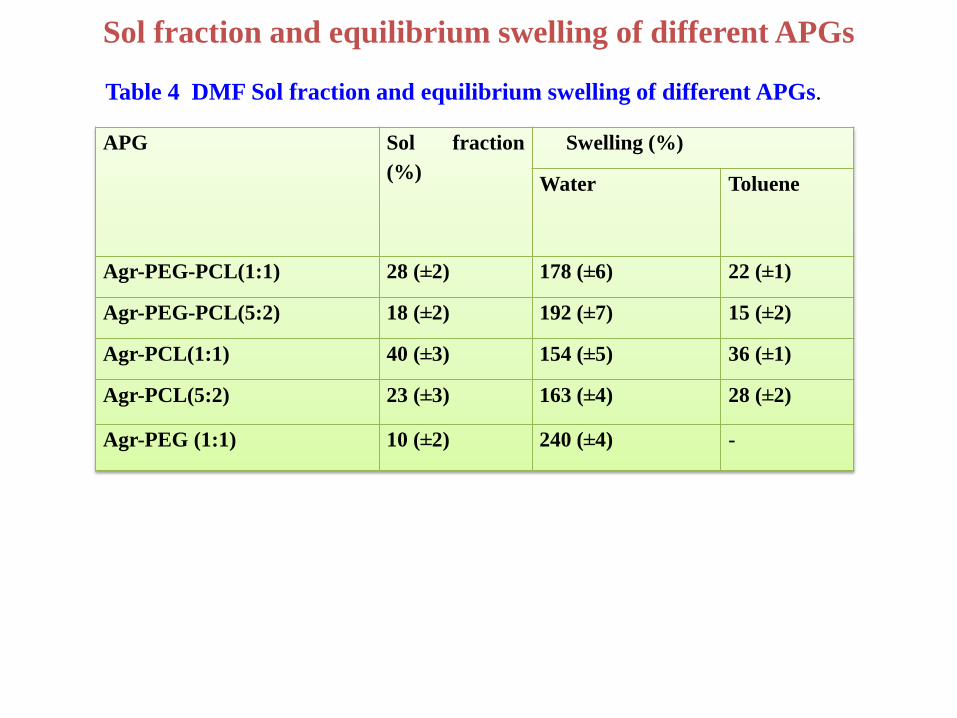
Sol fraction and equilibrium swelling of different APGs
APG Sol fraction
(%)
Swelling (%)
Water Toluene
Agr-PEG-PCL(1:1) 28 (±2) 178 (±6) 22 (±1)
Agr-PEG-PCL(5:2) 18 (±2) 192 (±7) 15 (±2)
Agr-PCL(1:1) 40 (±3) 154 (±5) 36 (±1)
Agr-PCL(5:2) 23 (±3) 163 (±4) 28 (±2)
Agr-PEG (1:1) 10 (±2) 240 (±4) -
Table 4 DMF Sol fraction and equilibrium swelling of different APGs.

A D
B E
G H
F C
J
I
Fig. 17 Digital pictures of APGs films showing
comparative transparency. Pictures: A (dry), B
(water swelled) and C (toluene swelled) Agr-PEG-
PCL(1:1) films. Pictures D (dry), E (water swelled)
and F (toluene swelled) Agr-PCL(1:1) films.
Pictures G and H are for RB adsorbed Agr-PEG-
PCL(1:1) and Agr-PCL(1:1).
Nanophase separated co-continuous structure of APGs
Fig. 18 Images I and J are for phase mode AFM
images (5x5 µ) of Agr-PEG-PCL(1:1) and Agr-
PCL(1:1) respectively. The thin film was
deposited on mica surface for AFM analysis.

Phase separation behavior of APGs
by DSC analysis
-50 0 50 100 150
(e)
(d)
(c)
(b)
(a)
A
H
eat
flow
(en
do)
40 0
C
82 0
C
74 0
C
Temperature (oC)
Agr-PCL(1:1)
Agr-PEG-PCL(1:1)
Agr
Agr+PCL(1:1)
PCL
-70 -68 -66 -64 -62 -60
d
b
a
-690C
B
Fig. 19 Curves a-e are DSC thermograms of Agr-PCL(1:1), Agr-PEG-
PCL(1:1), neat Agr, neat PCL and mechanical mixture of Agr+PCL (1:1,
w/w) respectively, (B) extended scale DSC thermograms

-50 0 50 100 1500
200
400
600
800
1000
1200
1400
1600
1800
2000
2200
2400
2600A
-70 oC
-62 oC
65 oC
Agr-PEG-PCL(1:1)
Agr-PCL(1:1)
Sto
rag
e m
od
ulu
s (
MP
a)
Temperature (o C)
Fig. 20 Storage modulus (A) and tan delta vs. temperature (B) plots of representative Agr-PCL(1:1) and Agr-PEG-PCL(1:1) showing glass transition regions and temperature dependent mechanical property.
Mechanical property and phase separation behavior of
APGs
-50 0 50 100 150
0.08
0.10
0.12
0.14
0.16
0.18
0.20
0.22
0.24
Agr-PCL(1:1)
Agr-PEG-PCL(1:1)
B
55 oC
43 oC
Tan
delt
a (
MP
a)
Temperature (oC)
0 20 40 60 80 1000.0
0.2
0.4
0.6
0.8
1.0
(a) Agr-PCL (5:2)
(b) Agr-PCL (1:1)
(c) Agr-PEG-PCL (5:2)
(d) Agr-PEG-PCL (1:1)
(a)
(b)
(c)
(d)
Str
ess (
MP
a)
Strain (%)
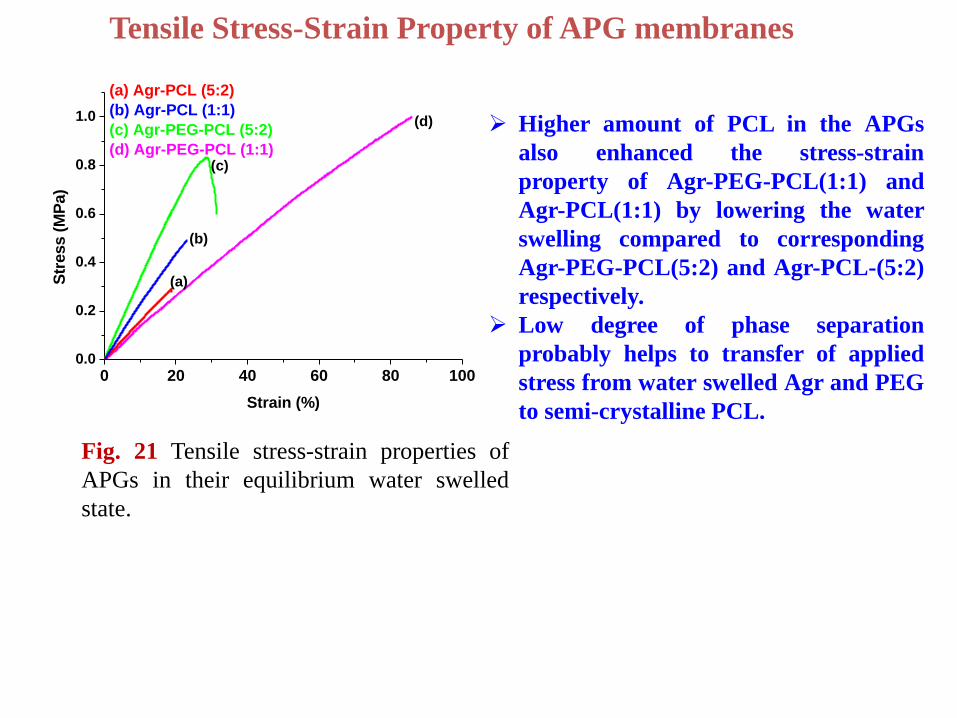
Tensile Stress-Strain Property of APG membranes
Fig. 21 Tensile stress-strain properties of
APGs in their equilibrium water swelled
state.
Higher amount of PCL in the APGs
also enhanced the stress-strain
property of Agr-PEG-PCL(1:1) and
Agr-PCL(1:1) by lowering the water
swelling compared to corresponding
Agr-PEG-PCL(5:2) and Agr-PCL-(5:2)
respectively.
Low degree of phase separation
probably helps to transfer of applied
stress from water swelled Agr and PEG
to semi-crystalline PCL.
0 10 20 30 40 50 600
5
10
15
20
25
30
Agr-PCL(1:1), pH=7.4
Agr-PEG-PCL(1:1), pH=7.4
Agr-PCL (1:1), Lipase, pH=7.4
Agr-PEG-PCL (1:1), Lipase, pH=7.4
Agr-PCL (1:1), pH=5
Agr-PEG-PCL (1:1), pH=5
Deg
rad
ati
on
(%
, w
/w)
Time (Day)
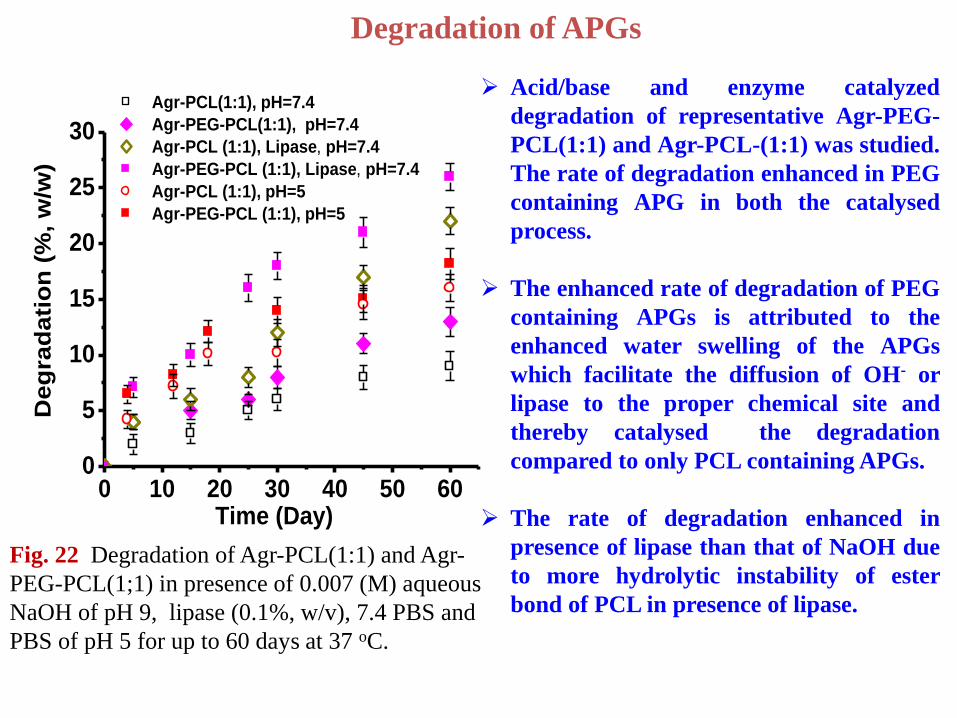
Degradation of APGs
Fig. 22 Degradation of Agr-PCL(1:1) and Agr-
PEG-PCL(1;1) in presence of 0.007 (M) aqueous
NaOH of pH 9, lipase (0.1%, w/v), 7.4 PBS and
PBS of pH 5 for up to 60 days at 37 oC.
Acid/base and enzyme catalyzed
degradation of representative Agr-PEG-
PCL(1:1) and Agr-PCL-(1:1) was studied.
The rate of degradation enhanced in PEG
containing APG in both the catalysed
process.
The enhanced rate of degradation of PEG
containing APGs is attributed to the
enhanced water swelling of the APGs
which facilitate the diffusion of OH- or
lipase to the proper chemical site and
thereby catalysed the degradation
compared to only PCL containing APGs.
The rate of degradation enhanced in
presence of lipase than that of NaOH due
to more hydrolytic instability of ester
bond of PCL in presence of lipase.
a
a'
b
b' c'
c d
d'
0 10 20 30 40 500
5
10
15
20
25
30
35
40 A
Lo
ad
ing
cap
asit
y (
%)
Time (h)
Agr-PEG-PCL(1:1)
Agr-PCL(1:1)
Agr-PEG-PCL(5:2)
Agr-PCL(5:2)
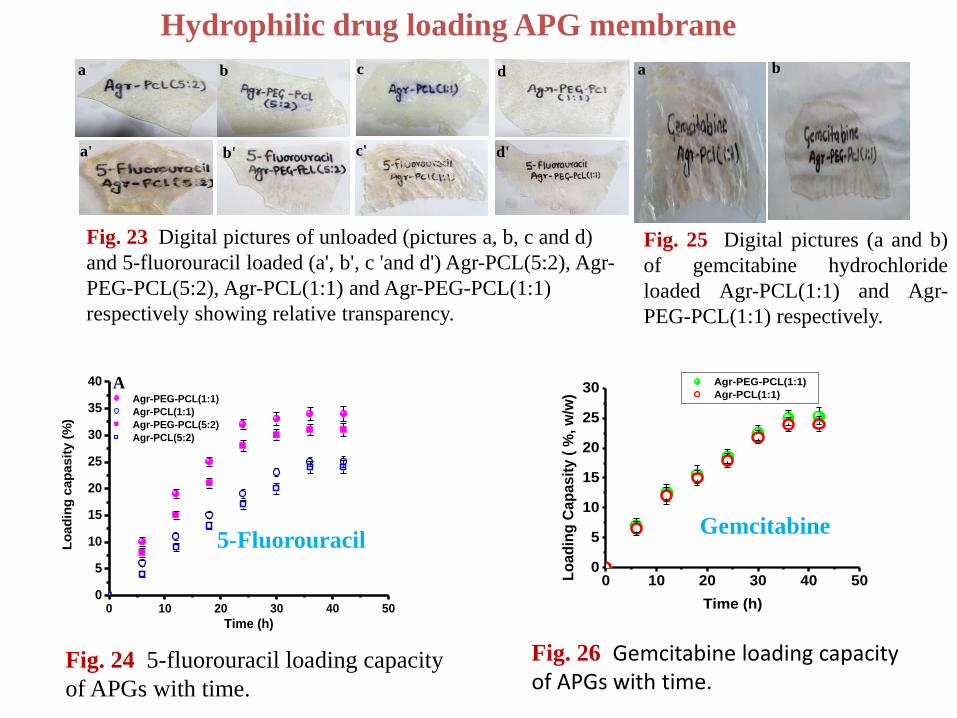
Hydrophilic drug loading APG membrane
5-Fluorouracil
Fig. 23 Digital pictures of unloaded (pictures a, b, c and d)
and 5-fluorouracil loaded (a', b', c 'and d') Agr-PCL(5:2), Agr-
PEG-PCL(5:2), Agr-PCL(1:1) and Agr-PEG-PCL(1:1)
respectively showing relative transparency.
Fig. 24 5-fluorouracil loading capacity
of APGs with time.
a b
0 10 20 30 40 500
5
10
15
20
25
30
Lo
ad
ing
Cap
asit
y (
%, w
/w)
Time (h)
Agr-PEG-PCL(1:1)
Agr-PCL(1:1)
Fig. 26 Gemcitabine loading capacity of APGs with time.
Fig. 25 Digital pictures (a and b)
of gemcitabine hydrochloride
loaded Agr-PCL(1:1) and Agr-
PEG-PCL(1:1) respectively.
Gemcitabine
Hydrophobic drug (Prednisolone acetate ) loading capacity
0 10 20 30 40 500
5
10
15
20
25
30
35
40A
Lo
ad
ing
cap
asit
y (
%)
Time (h)
Agr-PEG-PCL (1:1)
Agr-PCL (1:1)
Agr-PEG-PCL (5:2)
Agr-PCL (5:2)
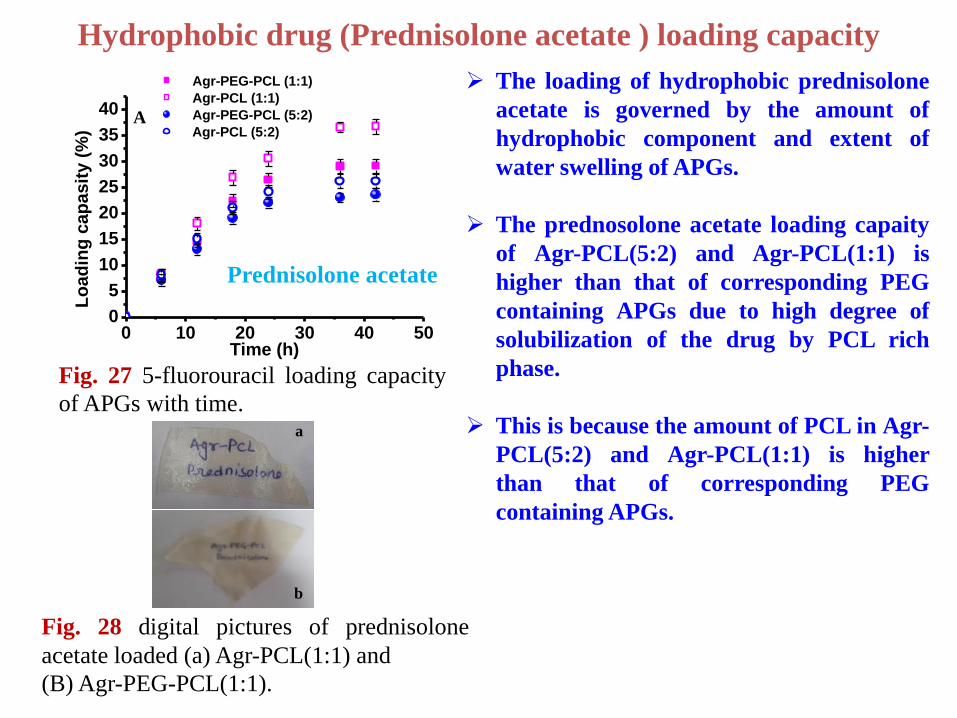
Prednisolone acetate
Fig. 27 5-fluorouracil loading capacity
of APGs with time.
b
a
The loading of hydrophobic prednisolone
acetate is governed by the amount of
hydrophobic component and extent of
water swelling of APGs.
The prednosolone acetate loading capaity
of Agr-PCL(5:2) and Agr-PCL(1:1) is
higher than that of corresponding PEG
containing APGs due to high degree of
solubilization of the drug by PCL rich
phase.
This is because the amount of PCL in Agr-
PCL(5:2) and Agr-PCL(1:1) is higher
than that of corresponding PEG
containing APGs.
Fig. 28 digital pictures of prednisolone
acetate loaded (a) Agr-PCL(1:1) and
(B) Agr-PEG-PCL(1:1).
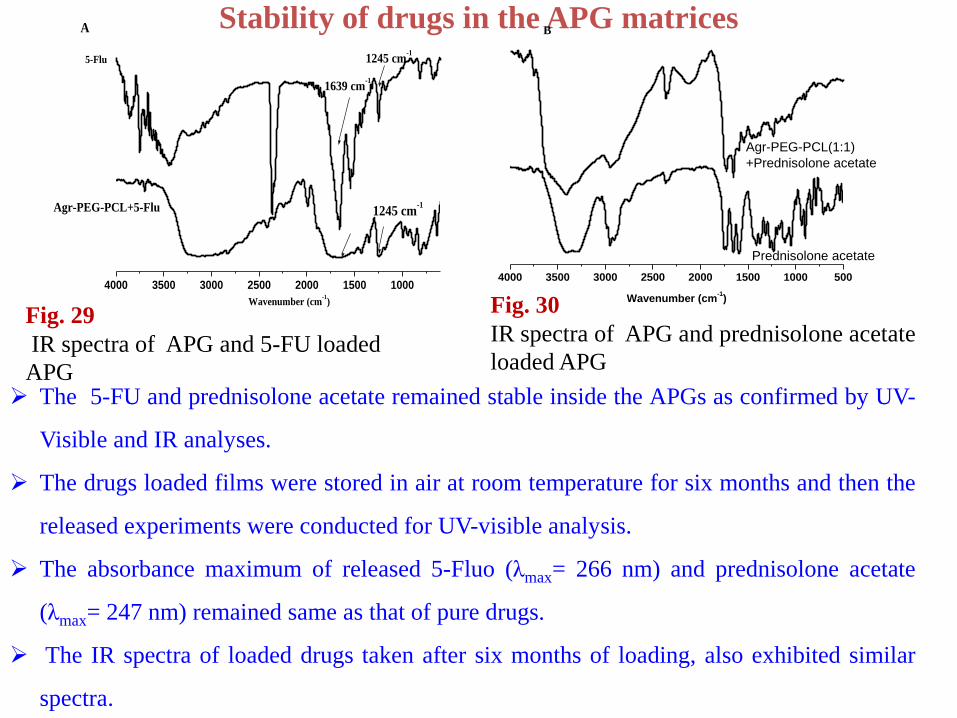
Stability of drugs in the APG matrices
The 5-FU and prednisolone acetate remained stable inside the APGs as confirmed by UV-
Visible and IR analyses.
The drugs loaded films were stored in air at room temperature for six months and then the
released experiments were conducted for UV-visible analysis.
The absorbance maximum of released 5-Fluo (λmax= 266 nm) and prednisolone acetate
(λmax= 247 nm) remained same as that of pure drugs.
The IR spectra of loaded drugs taken after six months of loading, also exhibited similar
spectra.
Fig. 29
IR spectra of APG and 5-FU loaded
APG
4000 3500 3000 2500 2000 1500 1000
Wavenumber (cm-1)
1245 cm-1
A
Agr-PEG-PCL+5-Flu
5-Flu 1245 cm-1
1639 cm-1
4000 3500 3000 2500 2000 1500 1000 500
Agr-PEG-PCL(1:1)
+Prednisolone acetate
Prednisolone acetate
Wavenumber (cm-1)
B
Fig. 30
IR spectra of APG and prednisolone acetate
loaded APG

0 50 100 150 200 250 300 3500
5
10
15
20
25
30
35B
Cu
mm
ula
tiv
e r
ele
as
e (
%)
Time (h)
Agr-PCL(5:2), pH 7.4
Agr-PEG-PCL(5:2), pH 7.4
0 50 100 150 200 250 300 3500
10
20
30
40
50
60
70 C
Cu
mm
ula
tiv
e r
ele
as
e (
%,
w/w
)
Time (h)
Agr-PCL(1:1) Film, pH 7.4
Agr-PCL(1:1) Powder, PH 7.4
Agr-PCL(1:1), pH 5
Agr-PCL(1:1), Lipase, pH 7.4
Agr-PEG-PCL(1:1) Film, pH 7.4
Agr-PEG-PCL(1:1) Powder, pH 7.4
Agr-PEG-PCL(1:1), pH 5
Agr-PEG-PCL(1:1), Lipase pH 7.4
Controlled release of hydrophilic drugs (5-FU)
Fig. 31 The cumulative release of 5-FU with time from (A) Agr PCL(5:2) and Agr-PEG-
PCL(5:2) at pH 7.4 and (B) Agr-PEG-PCL(1:1), and Agr-PCL(1:1) at pH 5 and 7.4 and in
presence of Lipase.
Much slower release of 5-FU from Agr-PEG-PCL(1:1 ) compared to Agr-
PCL(1:1) due to the solubilizing effect of PEG.
PEG enhanced the phase mixing and solubility of hydrophilic drug which also
restrict the release of 5-FU.
Release of 5-FU in presence lipase is higher due to degradation of ester
linkage of PCL in the APGs.

Interaction of PEG with 5-FU
Fig. 32 UV-Visible spectra of 5-FU in water
and in water containing PEG respectively.
200 250 300 350
0.0
0.1
0.2
0.3
0.4
0.5
0.6
0.7
0.8
max
5-fluorouracil+water
5-fluorouracil+water+PEG solution
Ab
so
rban
ce
Wavelength (nm)0 2 4 6 8 10
0
20
40
60
80
100
Cu
mm
ula
tiv
e R
ele
as
e (
%)
Time (h)
Drug in water
Drug in PEG solution
100 150 200 250 300
-0.7
-0.6
-0.5
-0.4
-0.3
-0.2
-0.1
0.0
0.1
0.2
0.3
0.4
0.5
0.6
0.7
Cp= 3.20 J/(g*K)
Cp= 4.247 J/(g*K)
Agr-PEG-PCL(1:1)/5-Flu
Agr-PCL(1:1)/5-Flu
Heat
flo
w (
mW
/mg
)
Temperature (o C)
5-fluorouracil solubilizing effect of PEG
Fig. 34 5-FU release from water and PEG
solution.
Fig. 33 DSC of APG with 5-FU Fig. 35 Relative transparency of APG membrane
in presence of 5-FU.
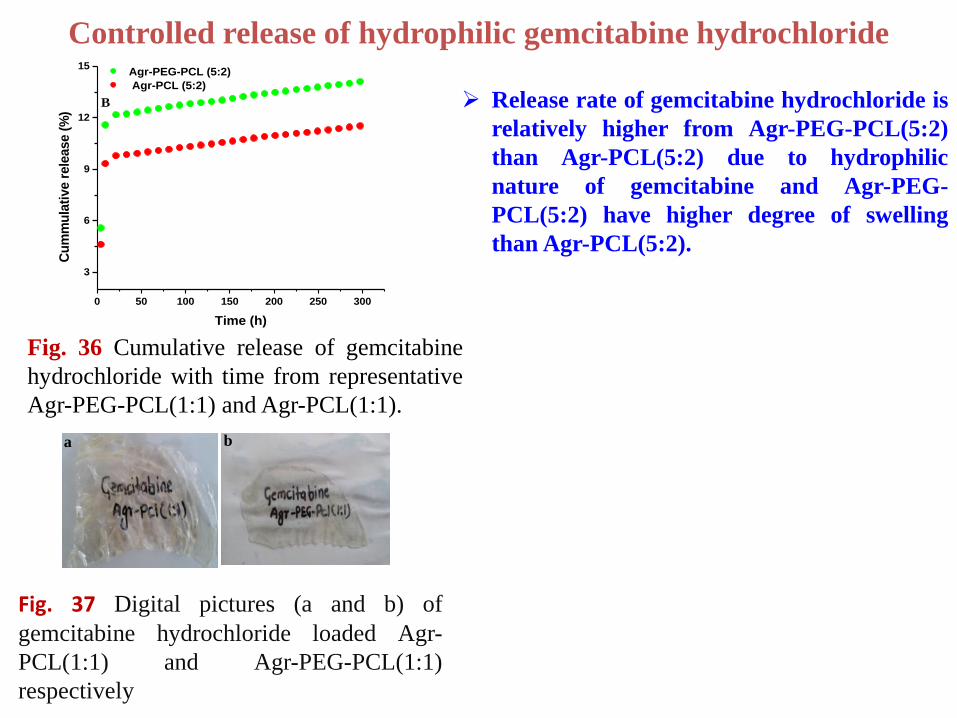
Controlled release of hydrophilic gemcitabine hydrochloride
0 50 100 150 200 250 300
3
6
9
12
15
B
Cu
mm
ula
tive r
ele
ase (
%)
Time (h)
Agr-PEG-PCL (5:2)
Agr-PCL (5:2)
a b
Fig. 36 Cumulative release of gemcitabine
hydrochloride with time from representative
Agr-PEG-PCL(1:1) and Agr-PCL(1:1).
Fig. 37 Digital pictures (a and b) of
gemcitabine hydrochloride loaded Agr-
PCL(1:1) and Agr-PEG-PCL(1:1)
respectively
Release rate of gemcitabine hydrochloride is
relatively higher from Agr-PEG-PCL(5:2)
than Agr-PCL(5:2) due to hydrophilic
nature of gemcitabine and Agr-PEG-
PCL(5:2) have higher degree of swelling
than Agr-PCL(5:2).
0 50 100 150 200 250 300 3500
10
20
30
40
50
60
70C
Cu
mm
ula
tive r
ele
ase (
%)
Time (h)
Agr-PCL(1:1), pH 7.4
Agr-PCL(1:1), pH 5
Agr-PCL(1:1), Lipase, pH7.4
Agr-PEG-PCL(1:1), pH 7.4
Agr-PEG-PCL(1:1), pH 5
Agr-PEG-PCL(1:1), Lipase, pH 7.4
0 50 100 150 200 250 3000
5
10
15
20
25
30
35B
Cu
mm
ula
tiv
e r
ele
as
e (
%)
Time (h)
Agr-PCL(5:2), pH 7.4
Agr-PEG-PCL(5:2), pH 7.4
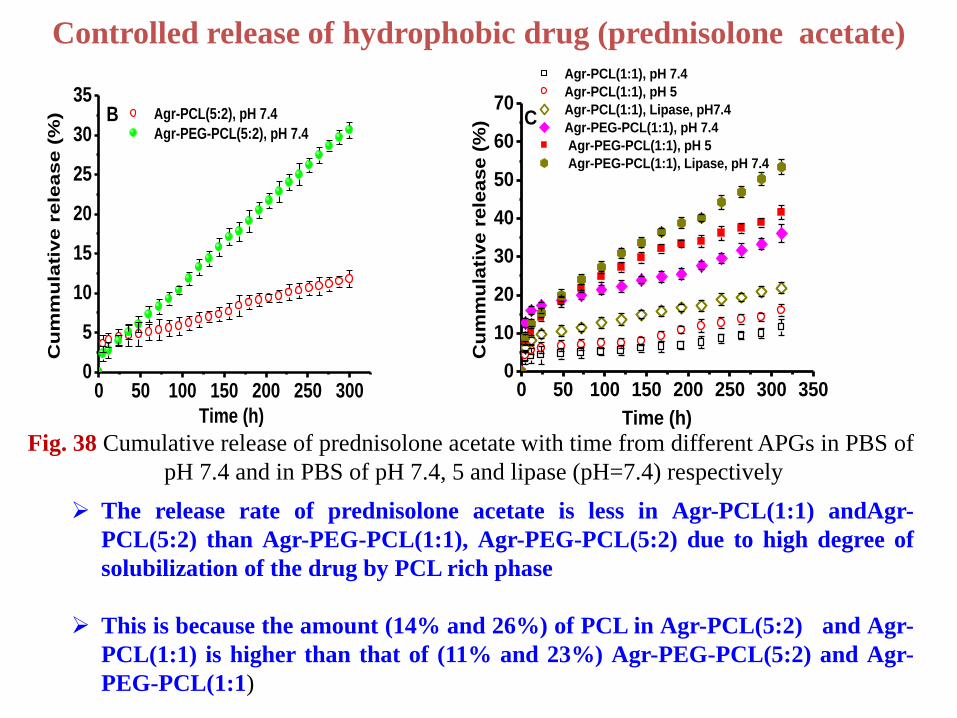
Controlled release of hydrophobic drug (prednisolone acetate)
Fig. 38 Cumulative release of prednisolone acetate with time from different APGs in PBS of
pH 7.4 and in PBS of pH 7.4, 5 and lipase (pH=7.4) respectively
The release rate of prednisolone acetate is less in Agr-PCL(1:1) andAgr-
PCL(5:2) than Agr-PEG-PCL(1:1), Agr-PEG-PCL(5:2) due to high degree of
solubilization of the drug by PCL rich phase
This is because the amount (14% and 26%) of PCL in Agr-PCL(5:2) and Agr-
PCL(1:1) is higher than that of (11% and 23%) Agr-PEG-PCL(5:2) and Agr-
PEG-PCL(1:1)
Drug release kinetics
After the initial burst release from all three types of drugs, the regression
coefficient values (R2) obtained from the zero order kinetic model were
greater than those from the first order kinetic model.
The diffusion exponent (n) values obtained from the Korsmeyer−Peppas
Model are between 0.63-0.64 which indicates that non-Fickian diffusion
mechanism; i.e., combination of diffusion and erosion of the matrix
predominate. The R2 values obtained with Hixson−Crowell Modelare
greater than that of Higuchi model.
Int. J. Pharm. 1983, 15, 25−35.
Ind. Eng. Chem. 1931, 23, 923−931.
J. Pharm. Sci. 1961, 50, 874−875.
Cytocompatibility and blood compatibility assay
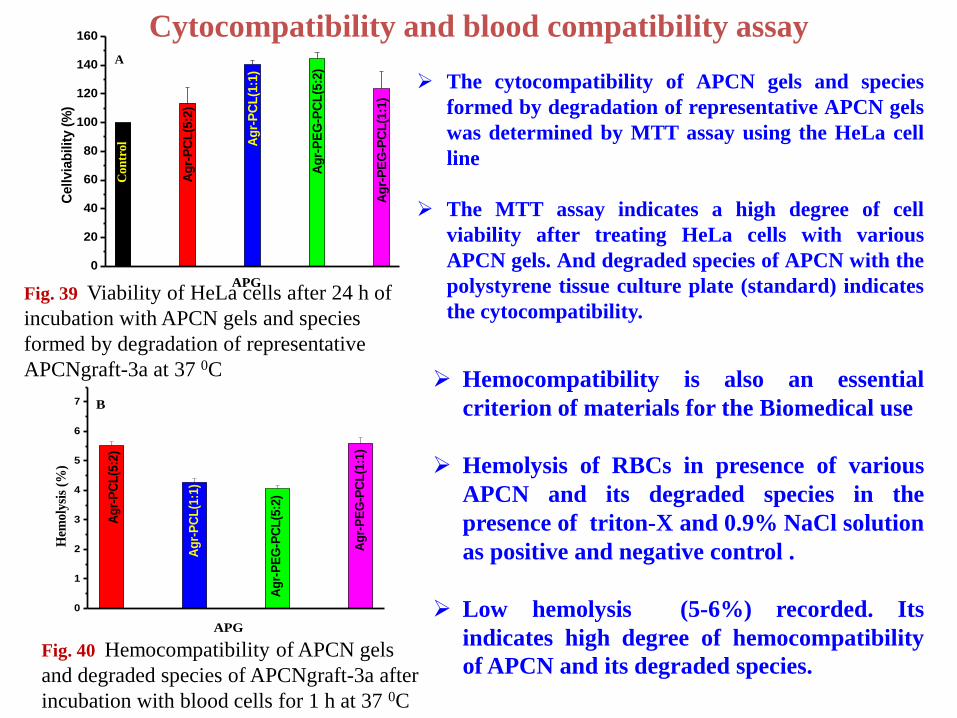
Fig. 39 Viability of HeLa cells after 24 h of
incubation with APCN gels and species
formed by degradation of representative
APCNgraft-3a at 37 0C
Fig. 40 Hemocompatibility of APCN gels
and degraded species of APCNgraft-3a after
incubation with blood cells for 1 h at 37 0C
The cytocompatibility of APCN gels and species
formed by degradation of representative APCN gels
was determined by MTT assay using the HeLa cell
line
The MTT assay indicates a high degree of cell
viability after treating HeLa cells with various
APCN gels. And degraded species of APCN with the
polystyrene tissue culture plate (standard) indicates
the cytocompatibility.
Hemocompatibility is also an essential
criterion of materials for the Biomedical use
Hemolysis of RBCs in presence of various
APCN and its degraded species in the
presence of triton-X and 0.9% NaCl solution
as positive and negative control .
Low hemolysis (5-6%) recorded. Its
indicates high degree of hemocompatibility
of APCN and its degraded species.
0
20
40
60
80
100
120
140
160
AC
ellvia
bilit
y (
%)
Ag
r-P
EG
-PC
L(1
:1)
Ag
r-P
EG
-PC
L(5
:2)
Ag
r-P
CL
(1:1
)
Ag
r-P
CL
(5:2
)
Con
trol
APG
B
E
0
1
2
3
4
5
6
7 B
Ag
r-P
EG
-PC
L(1
:1)
Ag
r-P
EG
-PC
L(5
:2)
Ag
r-P
CL
(1:1
)
Ag
r-P
CL
(5:2
)
Hem
oly
sis
(%)
APG
Conclusion
• Amphiphilic gels composed of Agr, PCL and PEG have been successfully accomplisehd.
• All the amphiphilic gels wxhibited high degree of blood compatibility and cytocompatibility
as confirmed by hemolysis experiment and MTT assay.
• These amphiphilic gels are biodegradable and removable from the system.
• All the amphiphilic gels showed nanophase separated morphology and reasonable
mechanical property which is suitable for biomedical applications (tissue engineering).
• High loading capacity and controlled delivery of both hydrophobic and hydrophilic
drug have been achieved.
• Milled particles of these amphiphilic gels are injectable through hypodermic syringe
of needle size 20-G.
Problem
Lack of precise control of composition of amphiphilic gels synthesized by Agr and PCL
due to incompatibility of Agr and PCL during chemical reaction.

Future work plan
1. Precise synthesis of PCL and Agr or Dex based amphiphilic gel
with controlled compositions by the use of reactive compatibilizers.
2. Synthesis of both pH and temperature responsive amphiphilic
gels.
3. Synthesis of amphiphilic Agr and PCL-based porous APG
membranes for tissue culture application.
4. Development of injectable amphiphilic gel system for growth
factor delivery.

Publications
Effect of Polyethylene glycol on Properties and Drug Encapsulation-Release Performance of Biodegradable/Cytocompatible Agarose-Polyethylene glycol-Polycaprolactone Amphiphilic Gels Arvind k. Singh Chandel, Chinta Uday Kumar and bSuresh K. Jewrajka*
Communicated for publication

Thank
You….


