
U.S. Department of the InteriorU.S. Geological Survey
Prepared in cooperation with the Coachella Valley Water District
Detection and Measurement of Land Subsidence Using Global Positioning System Surveying and Interferometric Synthetic Aperture Radar, Coachella Valley, California, 1996–2005
Scientific Investigations Report 2007–5251Version 2.0, June 2013

ii
Detection and Measurement of Land Subsidence Using Global Positioning System Surveying and Interferometric Synthetic Aperture Radar, Coachella Valley, California, 1996–2005
By Michelle Sneed and Justin T. Brandt
Prepared in cooperation with Coachella Valley Water District
Scientific Investigations Report 2007–5251Version 2.0, June 2013
U.S. Department of the InteriorU.S. Geological Survey

iii
U.S. Department of the InteriorDIRK KEMPTHORNE, Secretary
U.S. Geological SurveyMark D. Myers, Director
U.S. Geological Survey, Reston, Virginia: 2007Revised: 2013
For product and ordering information: World Wide Web: http://www.usgs.gov/pubprod Telephone: 1-888-ASK-USGS
For more information on the USGS--the Federal source for science about the Earth, its natural and living resources, natural hazards, and the environment: World Wide Web: http://www.usgs.gov Telephone: 1-888-ASK-USGS
Any use of trade, product, or firm names is for descriptive purposes only and does not imply endorsement by the U.S. Government.
Although this report is in the public domain, permission must be secured from the individual copyright owners to reproduce any copyrighted materials contained within this report.
Suggested reference:Sneed, Michelle, and Brandt, Justin, 2007, Detection and Measurement of Land Subsidence Using Global Positioning System Surveying and Interferometric Synthetic Aperture Radar, Coachella Valley, California, 1996–2005: U.S. Geological Survey Scientific Investigations Report 2007–5251, 30 p.
iv
Contents
Abstract ..........................................................................................................................................................1Introduction ....................................................................................................................................................2
Purpose and Scope ..............................................................................................................................2Description of Study Area ...................................................................................................................2Previous Land-Subsidence Studies ...................................................................................................4
Geohydrologic Setting...................................................................................................................................4Mechanics of Pumping-Induced Land Subsidence .................................................................................6Global Positioning System (GPS) Surveys .................................................................................................6
Land-Subsidence Monitoring Network .............................................................................................6Determination of Ellipsoid Heights ....................................................................................................8
1996 GPS Survey ..........................................................................................................................81998 GPS Survey ..........................................................................................................................82000 GPS Survey ..........................................................................................................................92005 GPS Survey ..........................................................................................................................9
GPS Results............................................................................................................................................9Ground-Water Levels .........................................................................................................................14
InSAR Methodology.....................................................................................................................................14InSAR Results ......................................................................................................................................22
Land Subsidence in the Palm Desert Area (Area 1) ............................................................22Land Subsidence in the Indian Wells Area (Area 2) ............................................................24Land Subsidence in the La Quinta Area (Area 3) .................................................................24Deformation in the Indio-Coachella Area ..............................................................................24Ground-Water Levels ................................................................................................................25
Comparison of InSAR and GPS Results ...................................................................................................25Future Monitoring ........................................................................................................................................28Summary........................................................................................................................................................28Acknowledgments ......................................................................................................................................29References ....................................................................................................................................................29

v
FiguresFigure 1. Map showing location of study area and of six Continuous Global Positioning
System (CGPS) stations in or near Coachella Valley, California. ………………… 3Figure 2. Map showing generalized geology of the Coachella Valley, California. …………… 5Figure 3. Map showing network of Global Positioning System (GPS) stations and wells
used to monitor vertical changes in land surface and ground-water levels, respectively, in the southern Coachella Valley, California. ……………………… 7
Figure 4. Hydrographs showing (A) water-surface elevations for selected wells (between 1995 and 2005), and ellipsoid-height changes (relative to the first measurement) for geodetic monuments measured at least twice, and (B) water-surface elevations for a subset of the wells in A for 1925-2005. …………………………… 11
Figure 5. Image showing land-surface features, consolidated rock, Global Positioning System (GPS) stations, two Continuous Global Positioning System (CGPS) stations, three areas of subsidence, and selected roads and production wells, Coachella Valley, California. ……………………………………………………… 15
Figure 6. Areas of subsidence, linearities at subsidence margins, consolidated rock, GPS stations, and two CGPS stations in the Coachella Valley, California, for November 30, 2003, through May 23, 2004, (A) as shown on the interferogram, and (B) as shown by subsidence contours interpreted from the interferogram in A. ………… 16
Figure 7. Areas of subsidence, consolidated rock, GPS stations, and two CGPS stations in the Coachella Valley, California, for August 1, 2004, through September 5, 2004, (A) as shown on the interferogram, and (B) as shown by subsidence contours interpreted from the interferogram in A. ………………………………………… 18
Figure 8. Areas of subsidence, consolidated rock, GPS stations, and two CGPS stations in the Coachella Valley, California, for October 26, 2003, through June 12, 2005, (A) as shown on the interferogram, and (B) as shown by subsidence contours interpreted from the interferogram in A. ………………………………………… 20
Figure 9. Hydrographs showing (A) water-surface elevations for selected production wells, and InSAR timeseries showing land subsidence for 5/7/2003–9/25/2005, and (B) water-surface elevations for the same production wells for 1970–2005 in the three InSAR-detected land subsidence areas in the Coachella Valley, California. ………………………………………………………………………… 26
TablesTable 1. Horizontal positions and ellipsoid heights for 1996, 1998, 2000, and 2005, and
ellipsoid-height changes relative to the first measurement of geodetic monuments in the Coachella Valley, California. …………………………………… 10
Table 2. Vertical change measured using interferometric synthetic aperture radar (InSAR) for 3 areas in the Coachella Valley, California, 2003–2005. ……………… 23

vi
Conversion Factors
SI to Inch/PoundMultiply By To obtain
Lengthcentimeter (cm) 0.3937 inch (in)millimeter (mm) 0.03937 inch (in)meter (m) 3.281 foot (ft) kilometer (km) 0.6214 mile (mi)
Areasquare kilometer (km2) 0.3861 square mile (mi2)
Ratemeter per day (m/d) 3.281 foot per day (ft/d)meter per year (m/yr) 3.281 foot per year (ft/yr) millimeter per day (mm/d) 0.003281 foot per day (ft/d)millimeter per month (mm/mo) 0.003281 foot per month (ft/mo)millimeter per year (mm/yr) 0.03937 inch per year (in/yr) kilometer per hour (km/h) 0.6214 mile per hour (mi/h)
Temperature in degrees Celsius (°C) may be converted to degrees Fahrenheit (°F) as follows:
°F=(1.8×°C)+32
Vertical displacements determined by InSAR and coordinates determined by Global Positioning System (GPS) surveying generally are reported in metric units. The industry standard for GPS usage is that field measurements and subsequent computations, including standard error determinations, are done in the metric system. The use of dual units in this report is intended to facilitate application of the data by maintaining the integrity of the original units of measurement for GPS surveying.
Sea level: In this report, “sea level” refers to the National Geodetic Vertical Datum of 1929 (NGVD of 1929)—a geodetic datum derived from a general adjustment of the first-order level nets of both the United Sates and Canada, formerly called Sea Level Datum of 1929.
Ellipsoid heights: In this report, Global Positioning System (GPS) measurements of horizontal coordinates and ellipsoid heights are based on the North American Datum of 1983 (NAD83).
vii
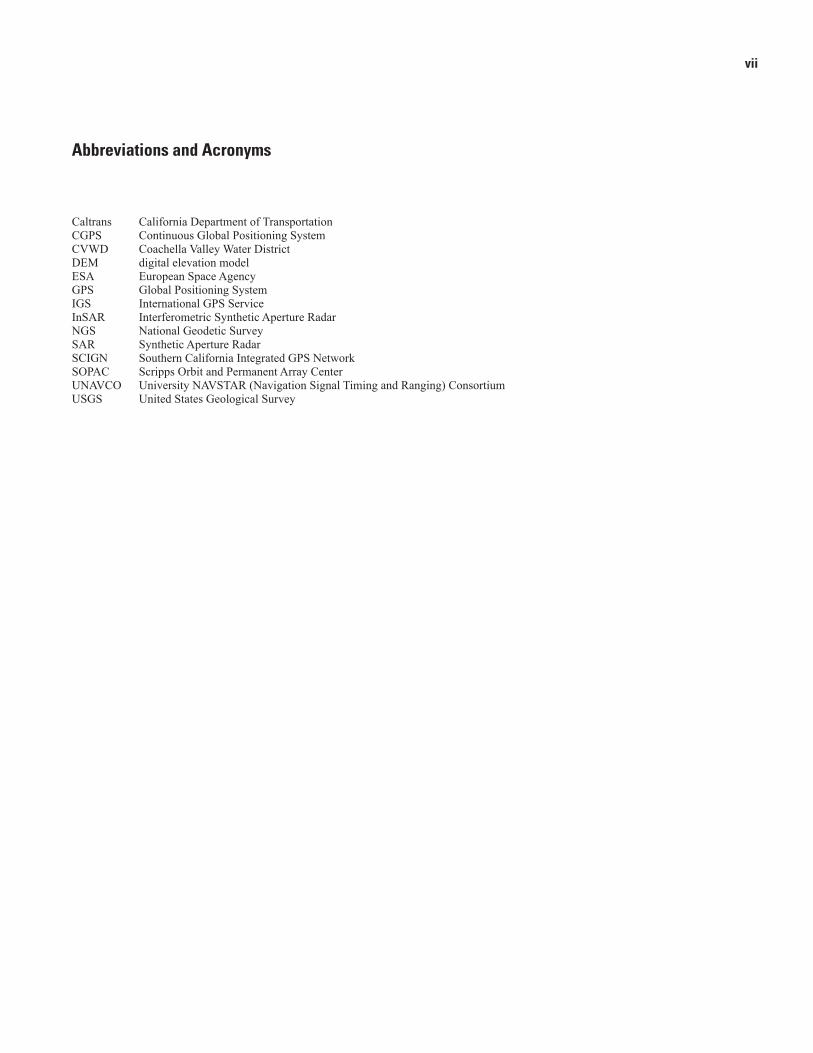
Abbreviations and Acronyms
Caltrans California Department of TransportationCGPS Continuous Global Positioning SystemCVWD Coachella Valley Water DistrictDEM digital elevation modelESA European Space AgencyGPS Global Positioning SystemIGS International GPS ServiceInSAR Interferometric Synthetic Aperture RadarNGS National Geodetic SurveySAR Synthetic Aperture RadarSCIGN Southern California Integrated GPS NetworkSOPAC Scripps Orbit and Permanent Array CenterUNAVCO University NAVSTAR (Navigation Signal Timing and Ranging) ConsortiumUSGS United States Geological Survey
viii
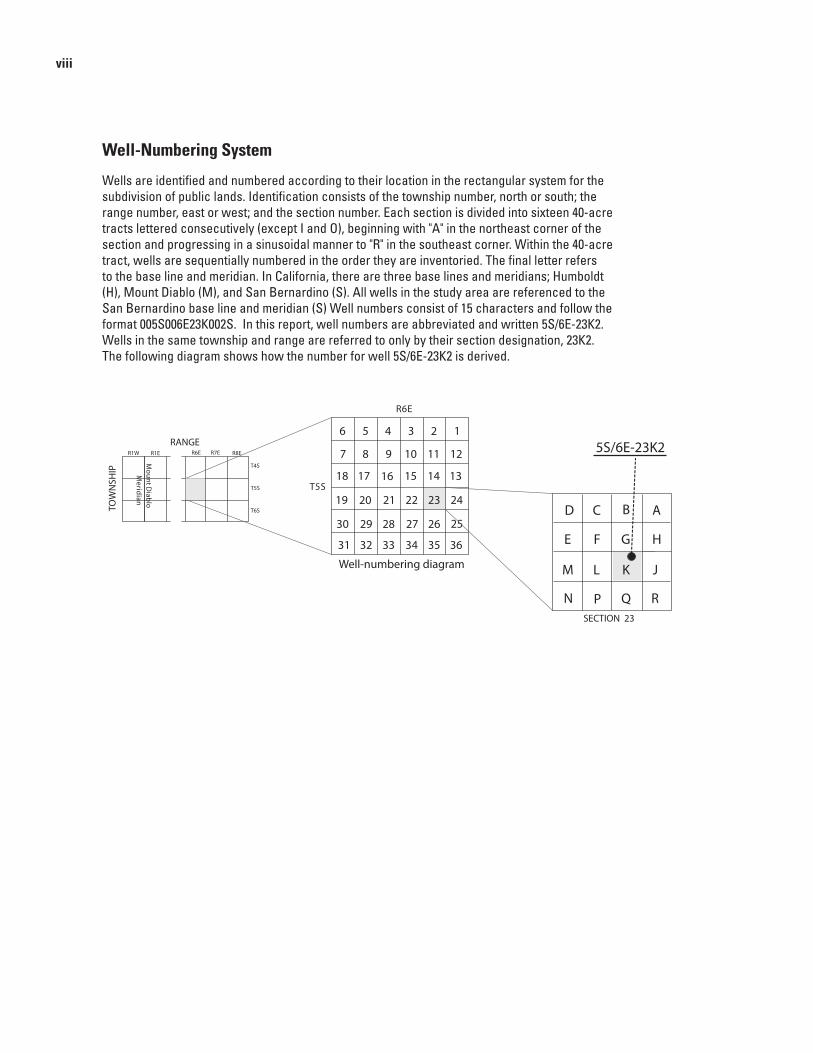
Well-Numbering System
Wells are identified and numbered according to their location in the rectangular system for the subdivision of public lands. Identification consists of the township number, north or south; the range number, east or west; and the section number. Each section is divided into sixteen 40-acre tracts lettered consecutively (except I and O), beginning with "A" in the northeast corner of the section and progressing in a sinusoidal manner to "R" in the southeast corner. Within the 40-acre tract, wells are sequentially numbered in the order they are inventoried. The final letter refers to the base line and meridian. In California, there are three base lines and meridians; Humboldt (H), Mount Diablo (M), and San Bernardino (S). All wells in the study area are referenced to the San Bernardino base line and meridian (S) Well numbers consist of 15 characters and follow the format 005S006E23K002S. In this report, well numbers are abbreviated and written 5S/6E-23K2. Wells in the same township and range are referred to only by their section designation, 23K2. The following diagram shows how the number for well 5S/6E-23K2 is derived.
R7ER6E R8E
nai
dire
Mol
bai
D tnu
oM
T4S
T5S
T6S
RANGE
PIHS
NW
OT
R1W R1E
27
R6E
T5S
Well-numbering diagram
123456
7
1318
8 9 10 11 12
14151617
19 24
2530
31 36
20 21 22 23
262829
32 33 34 35
SECTION 23
ACD
E F G H
JKLM
N P Q R
B
5S/6E-23K2

ix
This page intentionally left blank.
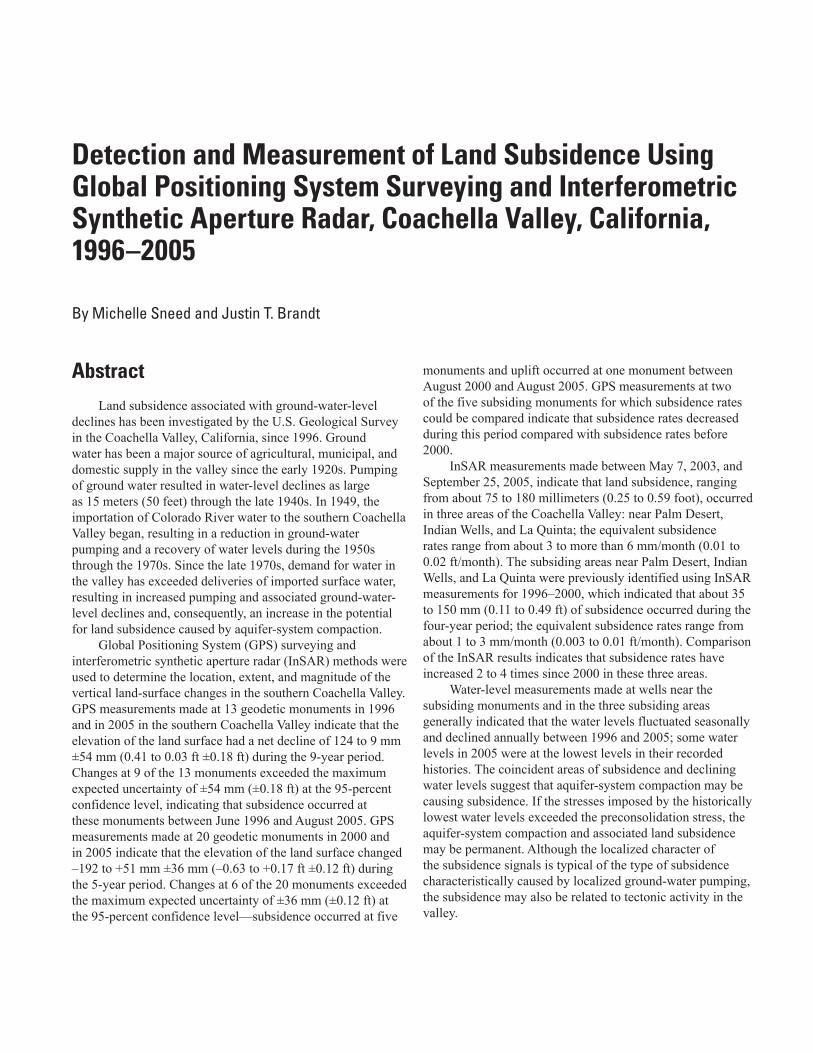
Abstract Land subsidence associated with ground-water-level
declines has been investigated by the U.S. Geological Survey in the Coachella Valley, California, since 1996. Ground water has been a major source of agricultural, municipal, and domestic supply in the valley since the early 1920s. Pumping of ground water resulted in water-level declines as large as 15 meters (50 feet) through the late 1940s. In 1949, the importation of Colorado River water to the southern Coachella Valley began, resulting in a reduction in ground-water pumping and a recovery of water levels during the 1950s through the 1970s. Since the late 1970s, demand for water in the valley has exceeded deliveries of imported surface water, resulting in increased pumping and associated ground-water-level declines and, consequently, an increase in the potential for land subsidence caused by aquifer-system compaction.
Global Positioning System (GPS) surveying and interferometric synthetic aperture radar (InSAR) methods were used to determine the location, extent, and magnitude of the vertical land-surface changes in the southern Coachella Valley. GPS measurements made at 13 geodetic monuments in 1996 and in 2005 in the southern Coachella Valley indicate that the elevation of the land surface had a net decline of 124 to 9 mm ±54 mm (0.41 to 0.03 ft ±0.18 ft) during the 9-year period. Changes at 9 of the 13 monuments exceeded the maximum expected uncertainty of ±54 mm (±0.18 ft) at the 95-percent confidence level, indicating that subsidence occurred at these monuments between June 1996 and August 2005. GPS measurements made at 20 geodetic monuments in 2000 and in 2005 indicate that the elevation of the land surface changed –192 to +51 mm ±36 mm (–0.63 to +0.17 ft ±0.12 ft) during the 5-year period. Changes at 6 of the 20 monuments exceeded the maximum expected uncertainty of ±36 mm (±0.12 ft) at the 95-percent confidence level—subsidence occurred at five
monuments and uplift occurred at one monument between August 2000 and August 2005. GPS measurements at two of the five subsiding monuments for which subsidence rates could be compared indicate that subsidence rates decreased during this period compared with subsidence rates before 2000.
InSAR measurements made between May 7, 2003, and September 25, 2005, indicate that land subsidence, ranging from about 75 to 180 millimeters (0.25 to 0.59 foot), occurred in three areas of the Coachella Valley: near Palm Desert, Indian Wells, and La Quinta; the equivalent subsidence rates range from about 3 to more than 6 mm/month (0.01 to 0.02 ft/month). The subsiding areas near Palm Desert, Indian Wells, and La Quinta were previously identified using InSAR measurements for 1996–2000, which indicated that about 35 to 150 mm (0.11 to 0.49 ft) of subsidence occurred during the four-year period; the equivalent subsidence rates range from about 1 to 3 mm/month (0.003 to 0.01 ft/month). Comparison of the InSAR results indicates that subsidence rates have increased 2 to 4 times since 2000 in these three areas.
Water-level measurements made at wells near the subsiding monuments and in the three subsiding areas generally indicated that the water levels fluctuated seasonally and declined annually between 1996 and 2005; some water levels in 2005 were at the lowest levels in their recorded histories. The coincident areas of subsidence and declining water levels suggest that aquifer-system compaction may be causing subsidence. If the stresses imposed by the historically lowest water levels exceeded the preconsolidation stress, the aquifer-system compaction and associated land subsidence may be permanent. Although the localized character of the subsidence signals is typical of the type of subsidence characteristically caused by localized ground-water pumping, the subsidence may also be related to tectonic activity in the valley.
Detection and Measurement of Land Subsidence Using Global Positioning System Surveying and Interferometric Synthetic Aperture Radar, Coachella Valley, California, 1996–2005
By Michelle Sneed and Justin T. Brandt
2 Detection and Measurement of Land Subsidence Using GPS and InSAR, Coachella Valley, California, 1996–2005
Introduction Ground water has been a major source of agricultural,
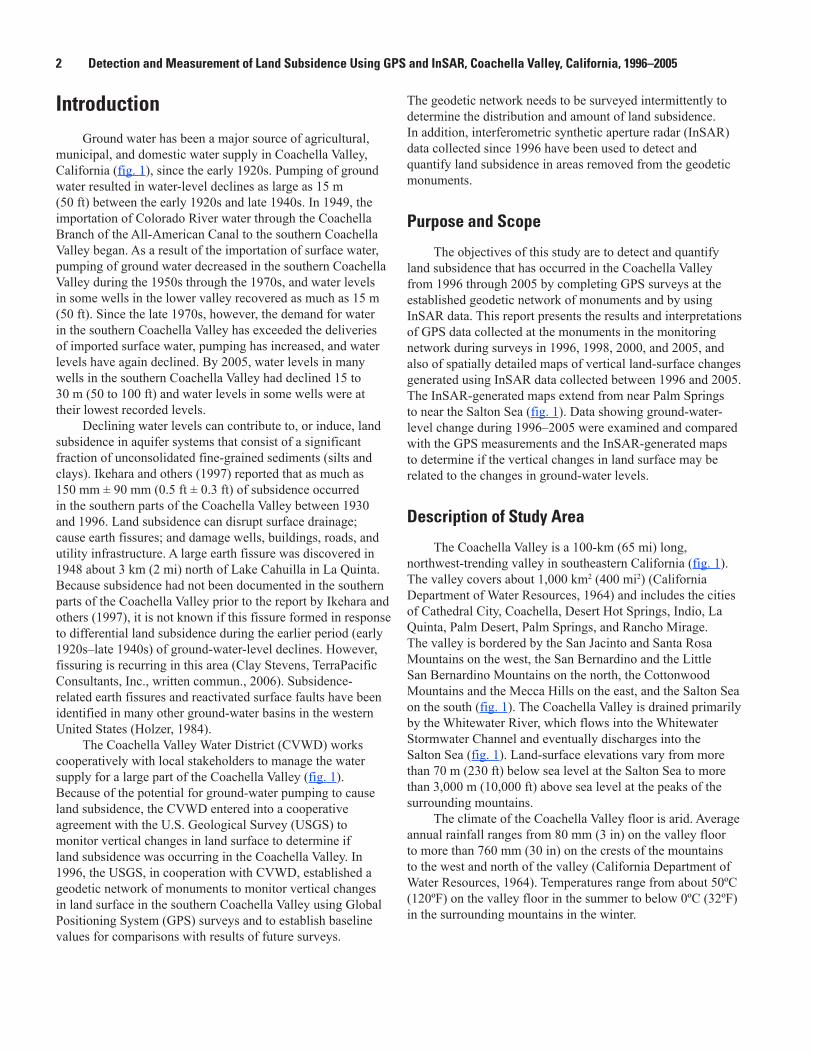
municipal, and domestic water supply in Coachella Valley, California (fig. 1), since the early 1920s. Pumping of ground water resulted in water-level declines as large as 15 m (50 ft) between the early 1920s and late 1940s. In 1949, the importation of Colorado River water through the Coachella Branch of the All-American Canal to the southern Coachella Valley began. As a result of the importation of surface water, pumping of ground water decreased in the southern Coachella Valley during the 1950s through the 1970s, and water levels in some wells in the lower valley recovered as much as 15 m (50 ft). Since the late 1970s, however, the demand for water in the southern Coachella Valley has exceeded the deliveries of imported surface water, pumping has increased, and water levels have again declined. By 2005, water levels in many wells in the southern Coachella Valley had declined 15 to 30 m (50 to 100 ft) and water levels in some wells were at their lowest recorded levels.
Declining water levels can contribute to, or induce, land subsidence in aquifer systems that consist of a significant fraction of unconsolidated fine-grained sediments (silts and clays). Ikehara and others (1997) reported that as much as 150 mm ± 90 mm (0.5 ft ± 0.3 ft) of subsidence occurred in the southern parts of the Coachella Valley between 1930 and 1996. Land subsidence can disrupt surface drainage; cause earth fissures; and damage wells, buildings, roads, and utility infrastructure. A large earth fissure was discovered in 1948 about 3 km (2 mi) north of Lake Cahuilla in La Quinta. Because subsidence had not been documented in the southern parts of the Coachella Valley prior to the report by Ikehara and others (1997), it is not known if this fissure formed in response to differential land subsidence during the earlier period (early 1920s–late 1940s) of ground-water-level declines. However, fissuring is recurring in this area (Clay Stevens, TerraPacific Consultants, Inc., written commun., 2006). Subsidence-related earth fissures and reactivated surface faults have been identified in many other ground-water basins in the western United States (Holzer, 1984).
The Coachella Valley Water District (CVWD) works cooperatively with local stakeholders to manage the water supply for a large part of the Coachella Valley (fig. 1). Because of the potential for ground-water pumping to cause land subsidence, the CVWD entered into a cooperative agreement with the U.S. Geological Survey (USGS) to monitor vertical changes in land surface to determine if land subsidence was occurring in the Coachella Valley. In 1996, the USGS, in cooperation with CVWD, established a geodetic network of monuments to monitor vertical changes in land surface in the southern Coachella Valley using Global Positioning System (GPS) surveys and to establish baseline values for comparisons with results of future surveys.
The geodetic network needs to be surveyed intermittently to determine the distribution and amount of land subsidence. In addition, interferometric synthetic aperture radar (InSAR) data collected since 1996 have been used to detect and quantify land subsidence in areas removed from the geodetic monuments.
Purpose and Scope
The objectives of this study are to detect and quantify land subsidence that has occurred in the Coachella Valley from 1996 through 2005 by completing GPS surveys at the established geodetic network of monuments and by using InSAR data. This report presents the results and interpretations of GPS data collected at the monuments in the monitoring network during surveys in 1996, 1998, 2000, and 2005, and also of spatially detailed maps of vertical land-surface changes generated using InSAR data collected between 1996 and 2005. The InSAR-generated maps extend from near Palm Springs to near the Salton Sea (fig. 1). Data showing ground-water-level change during 1996–2005 were examined and compared with the GPS measurements and the InSAR-generated maps to determine if the vertical changes in land surface may be related to the changes in ground-water levels.
Description of Study Area
The Coachella Valley is a 100-km (65 mi) long, northwest-trending valley in southeastern California (fig. 1). The valley covers about 1,000 km2 (400 mi2) (California Department of Water Resources, 1964) and includes the cities of Cathedral City, Coachella, Desert Hot Springs, Indio, La Quinta, Palm Desert, Palm Springs, and Rancho Mirage. The valley is bordered by the San Jacinto and Santa Rosa Mountains on the west, the San Bernardino and the Little San Bernardino Mountains on the north, the Cottonwood Mountains and the Mecca Hills on the east, and the Salton Sea on the south (fig. 1). The Coachella Valley is drained primarily by the Whitewater River, which flows into the Whitewater Stormwater Channel and eventually discharges into the Salton Sea (fig. 1). Land-surface elevations vary from more than 70 m (230 ft) below sea level at the Salton Sea to more than 3,000 m (10,000 ft) above sea level at the peaks of the surrounding mountains.
The climate of the Coachella Valley floor is arid. Average annual rainfall ranges from 80 mm (3 in) on the valley floor to more than 760 mm (30 in) on the crests of the mountains to the west and north of the valley (California Department of Water Resources, 1964). Temperatures range from about 50ºC (120ºF) on the valley floor in the summer to below 0ºC (32ºF) in the surrounding mountains in the winter.
Introduction 3
Figure 1. Map showing location of study area and of six Continuous Global Positioning System (CGPS) stations in or near Coachella Valley, California.
SanFrancisco
LosAngeles
EXPLANATION
Continuous Global Positioning System (CGPS) station and name
Area of enlargement
Colorado River
Cottonwood Mts
San Jacinto Mts
Little San Bernardino Mts
San Bernardino Mts
San Gorgonio Pass
PIN1
COTD
Point Happy
COACHELLA BRANCH OFTHE ALL-AMERICAN CANAL
WHITEWATERSTORMWATERCHANNEL
Yucaipa
Indio
Durmid
DHLG
TMAP
DHLG
Salton Sea
Base prepared by U.S. Geological Survey from digital elevation data, 1:1,000,000, 1987 North American Datum 1927
0
0
50 MILES
50 KILOMETERS
Coachella ValleyWater District boundary
Lake Cahuilla
117°00' 116°30' 116°00' 115°30'
33°00'
33°30'
34°00'
C A L I F O R N I A
111
Santa Rosa Mts
PalmSprings
Indian Wells
Thermal
10
Whitewater River
Palm Desert
Cathedral City Coachella
Mecca Hills
WIDC
La Quinta
Coachella
Valley
CRFP
Desert Hot Springs
Rancho Mirage 10
111
111
Mecca
86
86
Indio Hills

4 Detection and Measurement of Land Subsidence Using GPS and InSAR, Coachella Valley, California, 1996–2005
Previous Land-Subsidence Studies
This study is the fourth in a series of Coachella Valley land-subsidence studies that have been completed by the USGS in cooperation with CVWD. Ikehara and others (1997) documented the development of the geodetic monitoring network and areas of possible land subsidence in Coachella Valley by comparing historical leveling measurements with GPS surveying measurements made in 1996. The vertical changes in land surface between 1996 and the earliest measurements at monuments in the monitoring network do not exceed 150 mm (0.5 ft) (Ikehara and others, 1997). The range of uncertainty (±90 mm or ±0.3 ft) of these calculated vertical changes in land surface, however, is large because the historical leveling surveys were done at different times and sometimes by different agencies using different methods. Furthermore, the methods used for the leveling surveys had different standards of accuracy and the networks were of different geographic extents (Ikehara and others, 1997). Sneed and others (2001) reported that GPS measurements indicated small amounts of subsidence between 1996 and 1998 at some monuments in the monitoring network; Sneed and others (2002) reported that GPS measurements indicated most monuments were fairly stable between 1998 and 2000. Sneed and others (2001, 2002) also used InSAR to detect and quantify land subsidence throughout much of the Coachella Valley. InSAR measurements made between 1996 and 2000 indicated that as much as 150 mm (0.49 ft) of land subsidence occurred in areas near Palm Desert, Indian Wells, and La Quinta (Sneed, 2001, 2002).
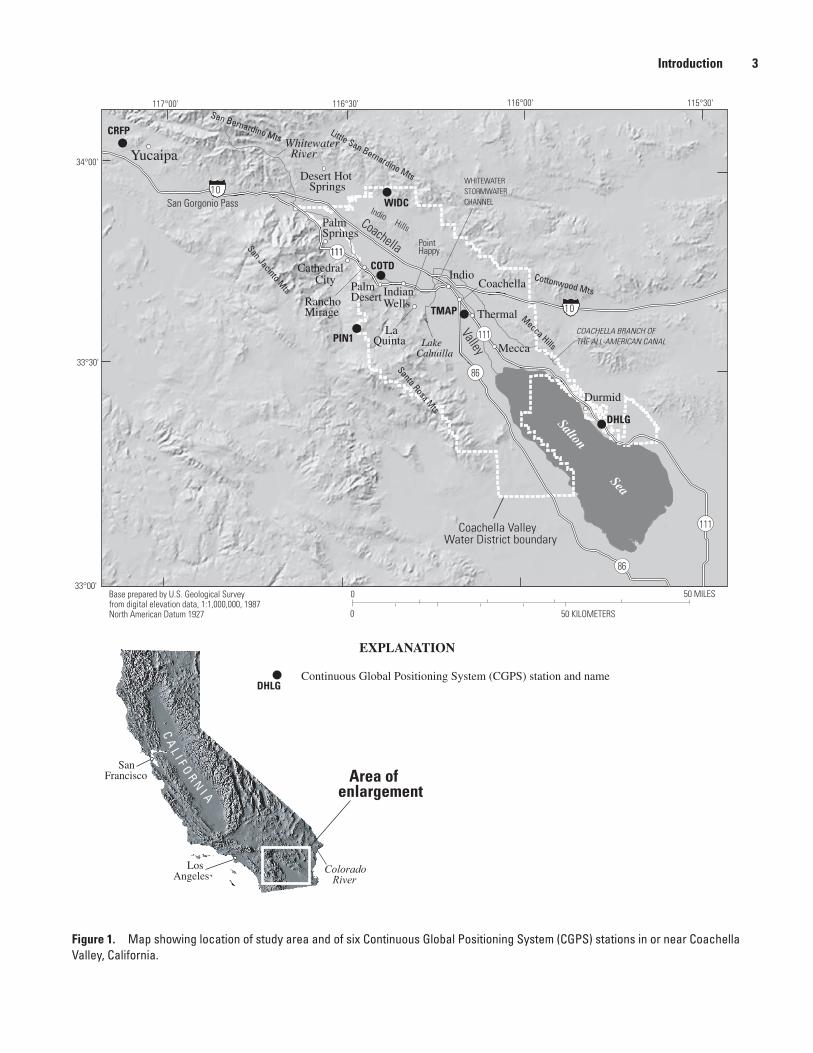
Geohydrologic SettingThe Coachella Valley is the northernmost extent of
the Salton Trough, which is the landward extension of a ridge/transform fault system (the East Pacific Rise) of the Gulf of California (McKibben, 1993). Near the end of the Miocene epoch, a spreading center separating the western Farallon plate from the eastern Pacific plate was obliquely subducted under the North American continent (McKibben, 1993). The modern Gulf of California and the Salton Trough formed about 12 million years ago during a period when subduction ceased and when the formation of an inland belt of east-west extension, alkali basalt volcanism, and crustal-spreading-induced subsidence and basin sedimentation began (McKibben, 1993). Prior to about 6 million years ago, the shear zone constituting the principal tectonic boundary between the Pacific and North American plates appears to have shifted about 250 km (155 mi) inland into this belt, initiating the formation of the modern Gulf of California and
the Salton Trough (McKibben, 1993). As the Salton Trough opened, it was filled with sediment from the delta of the Colorado River. The river has been building its delta from the east into the trough since about 5 million years ago, and sedimentation has apparently kept pace with the crustal-spreading induced subsidence (McKibben, 1993). The relation between subsidence that has occurred on a geologic time scale, and vertical land-subsidence changes measured during this study are unknown.
The Coachella Valley is filled with as much as 3,700 m (12,000 ft) of sediments; the upper 610 m (2,000 ft) are water-bearing (California Department of Water Resources, 1979). In this report, the water-bearing deposits are referred to as the aquifer system, which consists of a complex unconsolidated to partly consolidated assemblage of gravel, sand, silt, and clay of alluvial and lacustrine origins (fig. 2). Sediments tend to be finer grained (contain more silt and clay) in the southern part of the valley than in the northern part because of the greater depositional distance from mountain runoff and from lacustrine deposition from ancient Lake Cahuilla. In the southern Coachella Valley, the aquifer system consists of, from top to bottom: a semiperched zone that is fairly persistent southeast of Indio; an upper aquifer; a confining layer; and a lower aquifer (California Department of Water Resources, 1964, 1979).
The near-surface semiperched zone overlies the upper aquifer southeast of Indio and consists of silts, clays, and fine sand. The semiperched zone is as much as 30 m (100 ft) thick and generally is an effective barrier to deep percolation (California Department of Water Resources, 1964, 1979). The upper aquifer is present throughout the Coachella Valley and consists of unconsolidated and partly consolidated silty sands and gravels with interbeds of silt and clay. In general, the upper aquifer is 45 to 90 m (150 to 300 ft) thick. The aquifer is unconfined except where it is overlain by the semiperched zone, southeast of Indio. In the southern Coachella Valley, the upper aquifer is separated from the lower aquifer by a confining layer of silt and clay that is 30 to 60 m (100 to 200 ft) thick. The lower aquifer is the most productive source of ground water in the southern Coachella Valley; it consists of unconsolidated and partly consolidated silty sands and gravels with interbeds of silt and clay. The top of the lower aquifer is about 90 to 180 m (300 to 600 ft) below land surface. Available data indicate that the lower aquifer is at least 150 m (500 ft) thick and may be as much as 600 m (2,000 ft) thick (California Department of Water Resources, 1964, 1979).
Geologic structures in the Coachella Valley have a marked influence on the occurrence and movement of ground water. The principal structural features of Coachella Valley are faults and fault-related drag and compressional folds. The most notable fault system is the northwest-trending San Andreas Fault Zone that flanks
Geohydrologic Setting 5
the eastern side of the valley (fig. 2). Although movement within the San Andreas Fault Zone is predominantly right lateral (across the fault, movement is to the right), vertical displacement has downdropped the southwest block (California Department of Water Resources, 1964). The faults have either juxtaposed consolidated rocks against partly consolidated or unconsolidated water-bearing deposits or
displaced preferential flow paths in the partly consolidated or unconsolidated water-bearing deposits. This juxtaposition and displacement, in conjunction with cementation, compaction, and extreme deformation of water-bearing deposits adjacent to faults, can create low-permeability zones that can act as barriers to ground-water flow.
Figure 2. Map showing generalized geology of the Coachella Valley, California.
0 5
0 5 10 KILOMETERS
10 MILES
SanFrancisco
LosAngeles
SALTON SEA
Unconsolidated deposits
Fault
Partly consolidated deposits
Consolidated rock
EXPLANATION
SAN JACINTO MOUNTAINS
SAN BERNARDINO MOUNTAINS
SANTA ROSA MOUNTAINS
LITTLE SAN BERNARDINO MOUNTAINS
C O A C H E L L A V A L L E Y
116°45'
34°00'
33°45'
33°30'
116°30'
116°15'
116°00'
PalmDesert
PalmSprings
LaQuinta
Indio
Mecca
Coachella
Thermal
COACHELLA BRANCH OF THE ALL-AMERICAN CANAL
Aquifer system
Indian Wells
Lake Cahuilla
86
111
111
San Andreas Fault Zone
10
INDIO HILLS
6 Detection and Measurement of Land Subsidence Using GPS and InSAR, Coachella Valley, California, 1996–2005
Mechanics of Pumping-Induced Land Subsidence
Land subsidence is known to occur in valleys containing aquifer systems that are, at least in part, made up of fine-grained sediments and that have undergone extensive ground-water development. The pore structure of a sedimentary aquifer system is supported by the granular skeleton of the aquifer system and the pore-fluid pressure of the ground water that fills the intergranular pore space (Meinzer, 1928). When ground water is withdrawn in quantities that result in reduced pore-fluid pressures and water-level declines, the reduction of the pore-fluid-pressure support increases the intergranular stress, or effective stress, on the skeleton. A change in effective stress deforms the skeleton—an increase in effective stress compresses it and a decrease in effective stress causes it to expand. The vertical component of this compression sometimes results in nonrecoverable compaction of the aquifer system and land subsidence. An aquifer-system skeleton that primarily consists of fine-grained sediments, such as silt and clay, is much more compressible than one that primarily consists of coarse-grained sediments, such as sand and gravel. Inelastic (nonrecoverable) compaction of coarse-grained sediment is negligible.
Aquifer-system deformation is elastic (recoverable) if the effective stress imposed on the skeleton is smaller than any previous effective stress (Leake and Prudic, 1991). The largest historical effective stress imposed on an aquifer system—sometimes as a result of the lowest ground-water level—is the “preconsolidation stress.” If a stress imposed on the skeleton is greater than the preconsolidation stress, the pore structure of the granular matrix of the fine-grained sediments is rearranged; this new configuration results in a reduction of pore volume and, thus, inelastic (largely irreversible) compaction of the aquifer system. Furthermore, the compressibility of the fine-grained sediments, and any resulting compaction under stresses greater than the preconsolidation stress, are 20 to more than 100 times greater than they are under stresses less than the preconsolidation stress (Riley, 1998).
For an aquifer-system skeleton that contains an appreciable thickness of fine-grained sediments, a significant part of the total compaction may be residual compaction (delayed compaction that occurs in thick fine-grained interbeds and confining layers while heads equilibrate with heads in the adjacent aquifers [Terzaghi, 1925]). Depending on the thickness and the vertical hydraulic diffusivity of a confining layer, pressure equilibration—and thus compaction—lags behind pressure, or head, changes in the adjacent aquifers. For a more complete description of aquifer-system compaction, see Poland (1984), and for a review and selected case studies of land subsidence caused by aquifer-system compaction in the United States, see Galloway and others (1999).
Global Positioning System (GPS) Surveys
GPS is a U.S. Department of Defense satellite-based navigation system designed to provide continuous worldwide positioning and navigation capability. For this study, GPS surveys were done to determine the three-dimensional position of monuments in the geodetic monitoring network. The network was established in 1996 by the USGS to determine changes in land-surface elevations in the network (Ikehara and others, 1997) and to establish baseline values for comparisons with results of future surveys.
Land-Subsidence Monitoring Network
The geodetic monitoring network, henceforth referred to as the land-subsidence monitoring network, consists of geodetic monuments used as GPS stations (fig. 3). Most geodetic monuments are flat metal disks that are anchored in the ground or to a structure and that can be used in making repeated surveying measurements of horizontal and (or) vertical positions. During the 1996 study by Ikehara and others (1997), historical data for monuments in the southern Coachella Valley were compiled and reviewed to determine the location and the quality of the vertical-control data. Sources of the data include NOAA’s (National Oceanic and Atmospheric Administration) National Geodetic Survey (NGS [formerly the U.S. Coast and Geodetic Survey]), the California Department of Transportation (Caltrans), the U.S. Bureau of Reclamation, and the CVWD (Ikehara and others, 1997). The geodetic monuments were examined before each of the GPS surveys in 1996, 1998, 2000, and 2005 to determine whether any had been damaged or destroyed and to evaluate their suitability for GPS observations.
The original subsidence monitoring network in the southern Coachella Valley was established in 1996 and consisted of 17 geodetic monuments. The network was modified for the 1998 GPS survey by replacing two monuments that had been destroyed (D1299 Tie [D12T] and Caltrans 14.3 Reset 1994 [C143]) with two nearby monuments (G70 1928 [G70] and Caltrans 13.2 1986 [C132]) (fig. 3). The network was again modified for the 2000 GPS survey because monument 54JA was horizontally unstable; the replacement monument (JA54) was installed about 6 m (20 ft) northwest of monument 54JA (fig. 3). In addition, four new monuments—MAGF, MANI, OSDO, and DEEP—were constructed and added in the Palm Desert and Indian Wells areas for the 2000 GPS survey (fig. 3) because the InSAR maps processed for 1996–2000 showed subsidence in these areas (Sneed and others, 2001, 2002). The monument SWC was destroyed by flooding in the Whitewater Stormwater Channel in early 2005, and thus could not be included in the 2005 survey (fig. 3). The spacing between the monuments meets the generalized network design criterion established by Zilkoski and others (1997), which requires that the distance between local network points not exceed 10 km (6 mi).

Global Positioning System (GPS) Surveys 7
Figure 3. Map showing network of Global Positioning System (GPS) stations and wells used to monitor vertical changes in land surface and ground-water levels, respectively, in the southern Coachella Valley, California.
Salton
Sea
EXPLANATION
0 5 10 MILES
0 5 10 KILOMETERS
Destroyed or abandoned GPS station and identifier
GPS station and identifier
Geodetic monuments
Well and identifier
GPS control station for one or more of the GPS surveys
Destroyed GPS control station and identifier
Continuous Global Positioning System (CGPS) station and identifier
111
86
111
10
10
Coachella
Indian Wells
PalmDesert
10' 115°50'20'116°30'
45'
33°50'
33°30'
40'
35'
116°00'
COTD5S/7E-9F1
5S/7E-8Q1
5S/8E-17N15S/8E-20C2
6S/7E-23D3
6S/8E-19D1
6S/8E-5P16S/8E-5R2
6S/8E-2D1
6S/8E-2F1
6S/8E-12Q1
6S/8E-27C1
6S/8E-32R17S/7E-1C1 7S/9E-7H2
7S/9E-17K1
7S/9E-23N17S/9E-30M1
7S/8E-20H1 7S/8E-22K1
7S/8E-28G1
7S/8E-34G18S/8E-11A4
8S/8E-24A18S/8E-24L1
8S/8E-24L1
7S/10E-27A1
San Andreas Fault Zone
5S/6E-17E1
5S/6E-23M1
5S/6E-24M1
DUNECOCH
R70R
JA54 54JA 5211
CAHUS753
C132
PAIN
K572
JOHN
C101
C101
C427
C427
P572SWC
K70
54JA
G70
C143
D12T
D12T
COTD
MAGF
DEEP
OSDOMANI
8 Detection and Measurement of Land Subsidence Using GPS and InSAR, Coachella Valley, California, 1996–2005
Determination of Ellipsoid Heights
GPS measurements were made at the geodetic monuments to determine their horizontal positions and ellipsoid heights. Ellipsoid height is the vertical coordinate relative to a geodetically defined reference ellipse; the ellipsoid that closely approximates the Earth’s shape in the study area is the North American Datum of 1983 (NAD83). To determine changes in ellipsoid heights, the heights from successive GPS surveys are compared; then, the differences in the heights are used to determine the location and magnitude of any vertical land-surface changes. The GPS surveying in 1996, 1998, 2000, and 2005 was done in accordance with “Guidelines for Establishing GPS-Derived Ellipsoid Height” by Zilkoski and others (1997) with one minor variation common to all 4 GPS surveys: single baseline, rather than multi-baseline, processing software was used for postprocessing. There are no known conclusive tests that objectively evaluate the effect of using single-baseline, rather than multi-baseline, processing software (Craymer and Beck, 1992). Other variations to the guidelines are specific to particular surveys and are described in the following sections. All of the GPS survey data were recomputed during this current study to eliminate the effects of variable processing methodologies used by assorted software and to standardize processing procedures for an improved comparison of three-dimensional positions derived from data collected during each GPS survey. Software used for the baseline and least-squares adjustment computations was Trimble Geomatics Office version 1.63.
1996 GPS SurveyGPS measurements for the 1996 survey were made using
six dual-frequency, half-wavelength P-code GPS receivers (Ashtech LD-XII and Ashtech MD-XII) and choke-ring antennas (Dorne-Margolin) at the 17 geodetic monuments between June 3 and 14, 1996, to determine horizontal positions and ellipsoid heights (Ikehara and others, 1997). For this survey, the duration of the GPS measurements was nearly tripled compared with the duration specified by Zilkoski and others (1997) to compensate for using half-wavelength GPS receivers rather than the full-wavelength GPS receivers (Ikehara and others, 1997). GPS measurements were made at the 17 geodetic monuments on at least 2 different days, and data were recorded during 2.5- to 3-hour observation periods (Ikehara and others, 1997). Six of the 17 geodetic monuments—C101, CAHU, COCH, PAIN, D12T, and DUNE (fig. 3)—also were network control stations; GPS measurements were made at these six stations on 3 additional days, and data were recorded during 6-hour observation periods.
Determining the ellipsoid heights of the 17 geodetic monuments in the network involved two phases of least-squares adjustments. During the first phase of least-squares adjustments, the horizontal coordinates and ellipsoid heights
for the six Coachella Valley network control monuments were determined by processing the GPS measurements made at these monuments with measurements made simultaneously at three Continuous Global Positioning System (CGPS) stations (DHLG, PIN1, and CRFP) in southern California (fig. 1), and by using precise satellite orbital data and accurate coordinates of the CGPS stations produced by the International GPS Service (IGS) and the Scripps Orbit and Permanent Array Center (SOPAC), respectively. The GPS observations of the CGPS stations were recorded continually (at 30-second intervals), and were archived by SOPAC, a member of the Southern California Integrated GPS network (SCIGN). The network control monuments were selected on the basis of geographic distribution; they are at the perimeters of the monitoring network. During the second phase of least-squares adjustments, the positions of the six Coachella Valley network control monuments were held fixed at the positions determined during the first phase, and the horizontal coordinates and ellipsoid heights for the other 11 monuments were determined. The level of uncertainty for these heights is ±50 mm (±0.16 ft) at the 95-percent confidence level.
1998 GPS SurveyGPS measurements for the 1998 survey were made using
five dual-frequency, full-wavelength P-code GPS receivers (Ashtech MD-XII) and choke-ring antennas (Dorne-Margolin) at the 17 geodetic monuments between October 5 and 9, 1998, to determine horizontal positions and ellipsoid heights. GPS measurements were made at the 17 geodetic monuments on at least 2 different days, and data were recorded during 45-minute observation periods. Five of the 17 geodetic monuments—COCH, CAHU, PAIN, C101, and G70 (fig. 3)—also were network control stations; GPS measurements were made at these five stations on 3 additional days, and data were recorded during 4.5-hour observation periods.
Determining the ellipsoid heights of the 17 geodetic monuments in the network involved two phases of least-squares adjustments. During the first phase of least-squares adjustments, horizontal coordinates and ellipsoid heights for the five Coachella Valley network control monuments were determined by processing the GPS measurements made at these monuments using measurements made simultaneously at three CGPS stations (DHLG, PIN1, and WIDC) in southern California (fig. 1), and by using precise satellite orbital data and accurate coordinates of the CGPS stations produced by IGS and SOPAC, respectively. The GPS observations of the CGPS stations were recorded continually (at 30-second intervals) and were archived by SOPAC. During the second phase of least-squares adjustments, the positions of the five Coachella Valley network control monuments were held fixed at the positions determined during the first phase, and the horizontal coordinates and ellipsoid heights for the other 12 monuments were determined. The level of uncertainty for these heights is ±20 mm (±0.07 ft) at a 95-percent confidence level.

Global Positioning System (GPS) Surveys 9
2000 GPS SurveyGPS measurements for the 2000 survey were made
using six dual-frequency, full-wavelength, P-code GPS receivers (5 Trimble 4000SSIs and 1 Trimble 4000SSE) and compact L1/L2 Trimble antennas (with ground plane) at the 21 geodetic monuments between August 28 and September 1, 2000, to determine horizontal positions and ellipsoid heights. GPS measurements were made at the monuments on at least 2 different days, and data were recorded during 35-minute observation periods. Six of the 21 geodetic monuments were used as network control stations—COCH, DEEP, CAHU, PAIN, C101, and G70 (fig. 3). GPS measurements were made at these six stations on 3 additional days, and data were recorded during 5-hour observation periods.
Determining the ellipsoid heights of the 21 geodetic monuments in the network involved two phases of least-squares adjustments. During the first phase of least-squares adjustments, horizontal coordinates and ellipsoid heights of the six Coachella Valley network control monuments were determined by processing the GPS measurements made at these monuments with measurements made simultaneously at the same three CGPS stations (DHLG, PIN1, and WIDC) used in processing the 1998 GPS survey data (fig. 1), and by using precise satellite orbital data and accurate coordinates of the CGPS stations produced by IGS and SOPAC, respectively. The GPS observation frequency of the CGPS stations was set at 30 seconds, and the observations were archived by SOPAC. During the second phase of least-squares adjustments, the positions of the six network control monuments were held fixed at the positions determined during the first phase, and the horizontal coordinates and ellipsoid heights for the other 15 monuments were determined. The accuracy of these ellipsoid heights is ±20 mm (±0.07 ft) at the 95-percent confidence level.
2005 GPS SurveyGPS measurements for the 2005 survey were made using
six dual-frequency, full-wavelength, P-code GPS receivers (Topcon GB1000) and compact antennas (with ground plane) (Topcon PG-A1 Geodetic) at the 20 geodetic monuments between August 15 and 19, 2005, to determine horizontal positions and ellipsoid heights. GPS measurements were made at the monuments on at least 2 different days, and data were recorded during 1-hour observation periods. Six of the 20 geodetic monuments were used as network control stations—COCH, DEEP, CAHU, PAIN, C101, and G70 (fig. 3); GPS measurements were made at these six stations on 3 additional days, and data were recorded during 6.5-hour observation periods.
Determining the ellipsoid heights of the 20 geodetic monuments in the network involved two phases of least-squares adjustments. During the first phase of least-squares adjustments, horizontal coordinates and ellipsoid heights of the six Coachella Valley network control monuments were
determined by processing the GPS measurements made at these monuments using measurements made simultaneously at the same three CGPS stations (DHLG, PIN1, and WIDC) used in processing both the 1998 and 2000 GPS survey data, and by using precise satellite orbital data and accurate coordinates of the CGPS stations produced by IGS and SOPAC, respectively. The GPS observation frequency of the CGPS stations was set at 30 seconds, and the observations were archived by SOPAC. During the second phase of least-squares adjustments, the positions of the six network control monuments were held fixed at the positions determined during the first phase, and the horizontal coordinates and ellipsoid heights for the other 14 monuments were determined. The accuracy of these ellipsoid heights is ±20 mm (±0.07 ft) at the 95-percent confidence level.
GPS Results
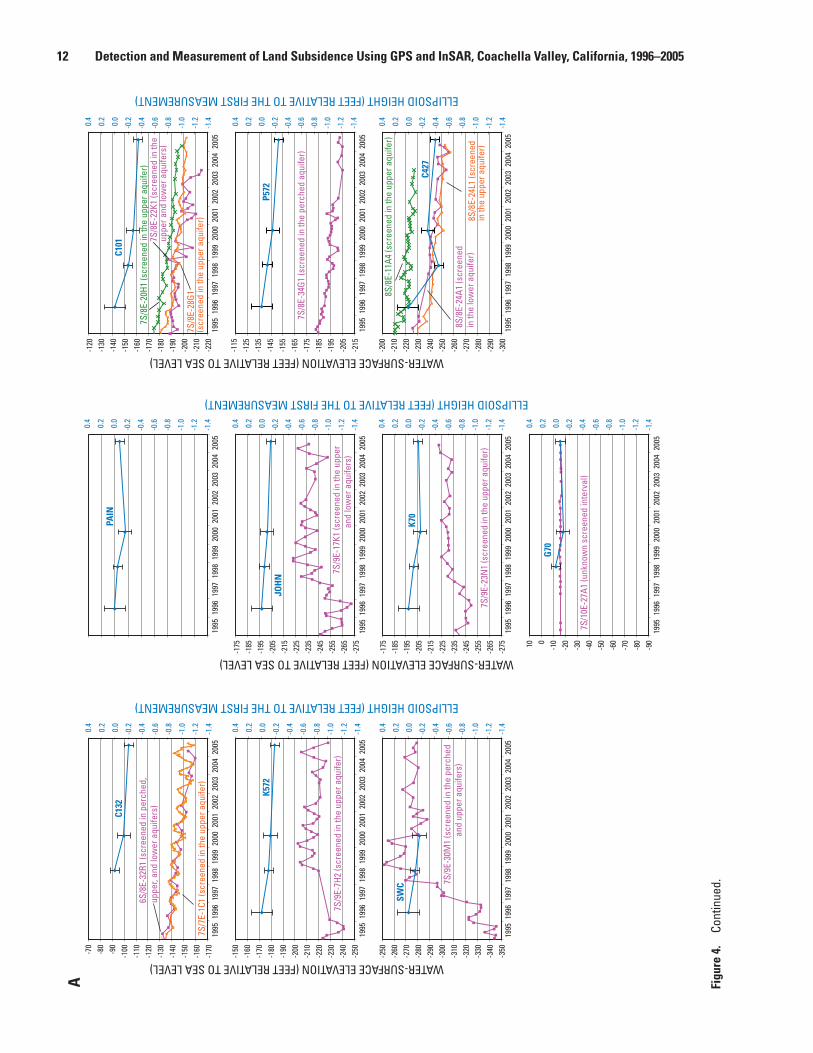
The horizontal coordinates and the ellipsoid heights of the monuments determined from each of the four GPS surveys were compared to determine the magnitude of horizontal and vertical land-surface changes at the monuments, respectively. The horizontal changes at the monuments were consistent with the northwest movement of the Pacific Plate (with respect to the North American plate) (Shen, Z.-K. and others, 2003). The ellipsoid heights are given in table 1, and ellipsoid-height changes, adjusted to show ellipsoid height values relative to the first GPS measurement for a particular monument (that is, the first measurement was set to equal 0), are given in table 1 and shown in figure 4A.
Comparison of GPS measurements made at the 13 geodetic monuments surveyed in 1996 and in 2005 in the southern Coachella Valley indicate that the elevation of the land surface had a net decline of 124 to 9 mm ±54 mm (0.41 to 0.03 ft ±0.18 ft) during the 9-year period (table 1). Changes at 9 of the 13 monuments (DUNE, R70R, 5211, CAHU, S753, K572, C101, P572, and C427) exceeded the maximum expected uncertainty of ±54 mm (±0.18 ft) at the 95-percent confidence level, indicating that subsidence occurred at these monuments between June 1996 and August 2005. Changes at 4 of the 13 monuments (COCH, PAIN, JOHN, and K70) did not exceed the maximum expected uncertainty of ±54 mm (±0.18 ft) at the 95-percent confidence level, indicating that the vertical positions of these monuments in June 1996 and in August 2005 were similar.
Comparisons of GPS measurements made at 20 geodetic monuments in 2000 and in 2005 indicate that the elevation of the land surface changed –192 to +51 mm ±36 mm (–0.63 to +0.17 ft ±0.12 ft) during the 5-year period (table 1). Changes at 6 of the 20 monuments (MANI, MAGF, OSDO, R70R, JA54, and COCH) exceeded the maximum expected uncertainty of ±36 mm (±0.12 ft) at the 95-percent confidence level—subsidence occurred at five of these monuments (MANI, MAGF, OSDO, R70R, and JA54) and uplift occurred at COCH between August 2000 and August 2005. Changes at 14 of the 20 monuments (DEEP, DUNE, 5211, CAHU, S753,

10 Detection and Measurement of Land Subsidence Using GPS and InSAR, Coachella Valley, California, 1996–2005
GPS
St
atio
nM
onum
ent n
ame
Latit
ude
Long
itude
Ellip
soid
hei
ght (
m)
Ellip
soid
-hei
ght c
hang
e fr
om 1
st
mea
sure
men
t (m
m)
Ellip
soid
-hei
ght c
hang
e fr
om 1
st
mea
sure
men
t (ft)
1996
(±
0.05
m)
1998
(±
0.02
m)
2000
(±
0.03
m)
2005
(±
0.02
m)
1996
1998
2000
2005
1996
1998
2000
2005
DU
NE
DU
NEP
ORT
Azi
mut
h33
°44’
46”
116°
16’1
0”–1
7.35
4–1
7.37
1–1
7.40
7–1
7.43
60
–17
–53
–82
0–0
.056
–0.1
74–0
.269
CO
CH
CO
AC
H 1
931
33°4
4’25
”11
6°09
’30”
33.4
2733
.436
33.3
6733
.418
09
–60
–90
0.03
0–0
.197
–0.0
30M
AG
FM
agne
sium
Fal
ls D
rive
33°4
4’11
”11
6°23
’27”
——
27.7
4227
.604
——
0–1
38—
—0
–0.4
53M
AN
IM
anito
u D
rive
33°4
3’11
”11
6°19
’03”
——
2.96
22.
916
——
0–4
6—
—0
–0.1
51O
SDO
Osa
ge T
rail/
ElD
orad
o D
rive
33°4
3’06
”11
6°20
’19”
——
13.4
8413
.292
——
0–1
92—
—0
–0.6
30R
70R
R70
Res
et 1
958
33°4
0’49
”11
6°10
’26”
–54.
402
–54.
433
–54.
471
–54.
509
0–3
1–6
9–1
070
–0.1
02–0
.226
–0.3
51D
EEP
Dee
p C
anyo
n33
°40’
21”
116°
22’3
4”—
—19
0.40
919
0.40
2—
—0
–7—
—0
–0.0
2352
11U
SBR
52.
1133
°40’
17”
116°
06’4
3”–3
2.68
2–3
2.69
8–3
2.74
0–3
2.73
70
–16
–58
–55
0–0
.052
–0.1
90–0
.180
54JA
Ave
54 a
nd Ja
ckso
n (o
ld)
33°3
9’24
”11
6°13
’00”
–46.
348
–46.
392
——
0–4
4—
—0
–0.1
44—
—JA
54Ja
ckso
n an
d Av
e 54
(new
)33
°39’
24”
116°
13’0
0”—
—–4
6.90
7–4
6.99
1—
—0
–84
——
0–0
.276
CA
HU
Lake
Cah
uilla
33°3
8’19
”11
6°16
’25”
–30.
738
–30.
778
–30.
815
–30.
822
0–4
0–7
7–8
40
–0.1
31–0
.253
–0.2
76S7
53S7
53 1
945
33°3
8’13
”11
6°09
’49”
–68.
190
–68.
231
–68.
276
–68.
268
0–4
1–8
6–7
80
–0.1
35–0
.282
–0.2
56PA
INPa
inte
d C
anyo
n33
°36’
43”
116°
00’3
0”93
.365
93.3
5293
.318
93.3
430
–13
–47
–22
0–0
.043
–0.1
54–0
.072
C14
3C
altra
ns 1
4.3
rese
t 199
433
°35’
54”
116°
10’5
2”–7
2.02
5—
——
0—
——
0—
——
C13
2C
altra
ns 1
3.2
1986
33°3
4’59
”11
6°10
’54”
—–7
4.00
1–7
4.04
3–7
4.06
5—
0–4
2–6
4—
0–0
.138
–0.2
10K
572
K57
2 19
3933
°34’
09”
116°
05’4
2”–9
1.48
4–9
1.51
5–9
1.52
3–9
1.54
00
–31
–39
–56
0–0
.102
–0.1
28–0
.184
JOH
NJo
hnso
n33
°33’
03”
116°
03’1
8”–9
4.14
6–9
4.15
8–9
4.17
0–9
4.18
40
–12
–24
–38
0–0
.039
–0.0
79–0
.125
C10
1C
altra
ns 1
0.1
1986
33°3
2’44
”11
6°09
’16”
–50.
336
–50.
396
–50.
419
–50.
443
0–6
0–8
3–1
070
–0.1
97–0
.272
–0.3
52K
70K
70 1
928
33°3
2’09
”11
6°00
’21”
–91.
483
–91.
507
–91.
536
–91.
525
0–2
4–5
3–4
20
–0.0
79–0
.174
–0.1
38P5
72P5
72 1
939
33°3
1’32
”11
6°06
’46”
–91.
233
–91.
259
–91.
283
–91.
311
0–2
6–5
0–7
80
–0.0
85–0
.164
–0.2
56SW
CSt
orm
wat
er C
hann
el33
°31’
27”
116°
04’4
2”–1
00.2
50–1
00.2
80–1
00.3
00—
0–3
0–5
0—
0–0
.098
–0.1
64—
D12
TD
1299
Tie
33°3
0’42
”11
5°55
’11”
–93.
664
——
—0
——
—0
——
—G
70G
70 1
928
33°3
0’27
”11
5°54
’51”
—–9
3.07
8–9
3.11
1–9
3.09
8—
0–3
3–2
0—
0–0
.108
–0.0
66C
427
Cal
trans
4.2
7 19
8733
°28’
25”
116°
06’2
7”–7
3.18
3–7
3.32
3–7
3.27
2–7
3.30
70
–140
–89
–124
0–0
.459
–0.2
92–0
.407
Tabl
e 1.
Ho
rizon
tal p
ositi
ons
and
ellip
soid
hei
ghts
for 1
996,
199
8, 2
000,
and
200
5, a
nd e
llips
oid-
heig
ht c
hang
es re
lativ
e to
the
first
mea
sure
men
t of g
eode
tic m
onum
ents
in th
e Co
ache
lla V
alle
y, C
alifo
rnia
.
[Lat
itude
, lon
gitu
de, a
nd e
llips
oid
heig
ht a
re re
fere
nced
to th
e N
orth
Am
eric
an D
atum
of 1
983.
Neg
ativ
e va
lues
for e
llips
oid–
heig
ht c
hang
e in
dica
te su
bsid
ence
. m, m
eter
, mm
, mill
imet
er; f
t, fo
ot; –
–, n
o da
ta]

Global Positioning System (GPS) Surveys 11
Figu
re 4
. Hy
drog
raph
s sh
owin
g (A
) wat
er-s
urfa
ce e
leva
tions
for s
elec
ted
wel
ls (b
etw
een
1995
and
200
5), a
nd e
llips
oid-
heig
ht c
hang
es (r
elat
ive
to th
e fir
st m
easu
rem
ent)
for
geod
etic
mon
umen
ts m
easu
red
at le
ast t
wic
e, a
nd (B
) wat
er-s
urfa
ce e
leva
tions
for a
sub
set o
f the
wel
ls in
A fo
r 192
5-20
05. (
See
figur
e 3
for w
ell l
ocat
ions
.)
CA-3
408_
fig 0
4a_P
age
1
-1.4
-1.2
-1.0
-0.8
-0.6
-0.4
-0.20.0
0.2
0.4
-50
-40
-30
-20
-1001020304050
-1.4
-1.2
-1.0
-0.8
-0.6
-0.4
-0.20.0
0.2
0.4
-110
-100-90
-80
-70
-60
-50
-40
-30
-20
-10
-1.4
-1.2
-1.0
-0.8
-0.6
-0.4
-0.20.0
0.2
0.4
-30
-20
-10010203040506070
-1.4
-1.2
-1.0
-0.8
-0.6
-0.4
-0.20.0
0.2
0.4
-100-90
-80
-70
-60
-50
-40
-30
-20
-100
-1.4
-1.2
-1.0
-0.8
-0.6
-0.4
-0.20.0
0.2
0.4
-150
-140
-130
-120
-110
-100-90
-80
-70
-60
-50
-1.4
-1.2
-1.0
-0.8
-0.6
-0.4
-0.20.0
0.2
0.4
-150
-140
-130
-120
-110
-100-90
-80
-70
-60
-50
-1.4
-1.2
-1.0
-0.8
-0.6
-0.4
-0.20.0
0.2
0.4
-170
-160
-150
-140
-130
-120
-110
-100-90
-80
-70
-1.4
-1.2
-1.0
-0.8
-0.6
-0.4
-0.20.0
0.2
0.4
-170
-160
-150
-140
-130
-120
-110
-100-90
-80
-70
-1.4
-1.2
-1.0
-0.8
-0.6
-0.4
-0.20.0
0.2
0.4
-1. 4
-1.2
-1.0
-0.8
-0.6
-0.4
-0.20.0
0.2
0.4
-180
-170
-160
-150
-140
-130
-120
-110
-100-9
0-8
0
-1.4
-1.2
-1.0
-0.8
-0.6
-0.4
-0.20.0
0.2
0.4
-100-90
-80
-70
-60
-50
-40
-30
-20
-100
-1.4
-1.2
-1.0
-0.8
-0.6
-0.4
-0.20.0
0.2
0.4
1995
1996
1997
1998
1999
2000
2001
2002
2003
2004
2005
1995
1996
1997
1998
1999
2000
2001
2002
2003
2004
2005
1995
1996
1997
1998
1999
2000
2001
2002
2003
2004
2005
1995
1996
1997
1998
1999
2000
2001
2002
2003
2004
2005
1995
1996
1997
1998
1999
2000
2001
2002
2003
2004
2005
1995
1996
1997
1998
1999
2000
2001
2002
2003
2004
2005
1995
1996
1997
1998
1999
2000
2001
2002
2003
2004
2005
1995
1996
1997
1998
1999
2000
2001
2002
2003
2004
2005
1995
1996
1997
1998
1999
2000
2001
2002
2003
2004
2005
1995
1996
1997
1998
1999
2000
2001
2002
2003
2004
2005
1995
1996
1997
1998
1999
2000
2001
2002
2003
2004
2005
1995
1996
1997
1998
1999
2000
2001
2002
2003
2004
2005
ELLIPSOID HEIGHT (FEET RELATIVE TO THE FIRST MEASUREMENT)
WATER-SURFACE ELEVATION (FEET RELATIVE TO SEA LEVEL)
5S/6
E-17
E1 (s
cree
ned
in th
e lo
wer
aqu
ifer)
5S/7
E-8Q
1 (s
cree
ned
in
the
uppe
r aqu
ifer)
5S/7
E-9F
1 (s
cree
ned
in th
e pe
rche
d an
d up
per a
quife
rs)
DU
NE
5S/8
E-17
N1
(scr
eene
d in
the
u
pper
aqu
ifer)
COCH
5S/6
E-23
M1
(scr
eene
d in
the
uppe
r
and
low
er a
quife
rs)OSD
O
5S/6
E-24
M1
(scr
eene
d in
the
uppe
r
and
low
er a
quife
rs)
MA
NI
6S/8
E-5P
1 (s
cree
ned
in
the
perc
hed
aqui
fer)
6S/8
E-5R
2 (s
cree
ned
in th
e up
per a
quife
r)
R70R
6S/8
E-2D
1 (s
cree
ned
in th
e up
per a
quife
r)6S
/8E-
12Q1
(scr
eene
d in
the
uppe
r aqu
ifer)
5211
JA54
(new
)
6S/7
E-23
D3 (s
cree
ned
in th
e up
per a
quife
r)
6S/8
E-19
D1 (s
cree
ned
in th
e lo
wer
aqu
ifer)
6S/7
E-23
D3 (s
cree
ned
in th
e up
per a
quife
r)
6S/8
E-19
D1 (s
cree
ned
in th
e lo
wer
aqu
ifer)
54JA
(old
)CA
HU
6S/8
E-19
D1 (s
cree
ned
in th
e lo
wer
aqu
ifer)
6S/8
E-27
C1 (s
cree
ned
in th
e up
per a
nd lo
wer
aqu
ifers
)
S753
6S/8
E-2F
1 (s
cree
ned
in th
e up
per a
nd lo
wer
aqu
ifers
)
DEE
P
WATER-SURFACE ELEVATION (FEET RELATIVE TO SEA LEVEL)
WATER-SURFACE ELEVATION (FEET RELATIVE TO SEA LEVEL)
ELLIPSOID HEIGHT (FEET RELATIVE TO THE FIRST MEASUREMENT)
ELLIPSOID HEIGHT (FEET RELATIVE TO THE FIRST MEASUREMENT)
5S/8
E-20
C2 (s
cree
ned
in th
e up
per a
quife
r)
MA
GF
A
12 Detection and Measurement of Land Subsidence Using GPS and InSAR, Coachella Valley, California, 1996–2005
CA-3
408_
fig 0
4a_P
age
2
-1.4
-1.2
-1.0
-0.8
-0.6
-0.4
-0.20.0
0.2
0.4
-1.4
-1.2
-1.0
-0.8
-0.6
-0.4
-0.20.0
0.2
0.4
-220
-210
-200
-190
-180
-170
-160
-150
-140
-130
-120
-1.4
-1.2
-1.0
-0.8
-0.6
-0.4
-0.20.0
0.2
0.4
-250
-240
-230
-220
-210
-200
-190
-180
-170
-160
-150
-1.4
-1.2
-1.0
-0.8
-0.6
-0.4
-0.20.0
0.2
0.4
-215
-205
-195
-185
-175
-165
-155
-145
-135
-125
-115
-1.4
-1.2
-1.0
-0.8
-0.6
-0.4
-0.20.0
0.2
0.4
-350
-340
-330
-320
-310
-300
-290
-280
-270
-260
-250
-1.4
-1.2
-1.0
-0.8
-0.6
-0.4
-0.20.0
0.2
0.4
-275
-265
-255
-245
-235
-225
-215
-205
-195
-185
-175
-1.4
-1.2
-1.0
-0.8
-0.6
-0.4
-0.20.0
0.2
0.4
-300
-290
-280
-270
-260
-250
-240
-230
-220
-210
-200
-1.4
-1.2
-1.0
-0.8
-0.6
-0.4
-0.20.0
0.2
0.4
-90
-80
-70
-60
-50
-40
-30
-20
-10010
-1. 4
-1.2
-1.0
-0.8
-0.6
-0.4
-0.20.0
0.2
0.4
-170
-160
-150
-140
-130
-120
-110
-100-9
0-8
0-7
0
-1.4
-1.2
-1.0
-0.8
-0.6
-0.4
-0.20.0
0.2
0.4
-275
-265
-255
-245
-235
-225
-215
-205
-195
-185
-175
1995
1996
1997
1998
1999
2000
2001
2002
2003
2004
2005
1995
1996
1997
1998
1999
2000
2001
2002
2003
2004
2005
1995
1996
1997
1998
1999
2000
2001
2002
2003
2004
2005
1995
1996
1997
1998
1999
2000
2001
2002
2003
2004
2005
1995
1996
1997
1998
1999
2000
2001
2002
2003
2004
2005
1995
1996
1997
1998
1999
2000
2001
2002
2003
2004
2005
1995
1996
1997
1998
1999
2000
2001
2002
2003
2004
2005
1995
1996
1997
1998
1999
2000
2001
2002
2003
2004
2005
1995
1996
1997
1998
1999
2000
2001
2002
2003
2004
2005
1995
1996
1997
1998
1999
2000
2001
2002
2003
2004
2005
6S/8
E-32
R1 (s
cree
ned
in p
erch
ed,
uppe
r, an
d lo
wer
aqu
ifers
)
7S/7
E-1C
1 (s
cree
ned
in th
e up
per a
quife
r)
C132
PAIN
7S/9
E-7H
2 (s
cree
ned
in th
e up
per a
quife
r)
K572
7S/9
E-17
K1 (s
cree
ned
in th
e up
per
a
nd lo
wer
aqu
ifers
)
JOH
N
7S/9
E-30
M1
(scr
eene
d in
the
perc
hed
a
nd u
pper
aqu
ifers
)
SWC
7S/8
E-22
K1 (s
cree
ned
in th
e up
per a
nd lo
wer
aqu
ifers
)
7S/8
E-28
G1
(scr
eene
d in
the
uppe
r aqu
ifer)
7S/8
E-20
H1 (s
cree
ned
in th
e up
per a
quife
r)
C101
P572
7S/8
E-34
G1 (s
cree
ned
in th
e pe
rche
d aq
uife
r)
7S/9
E-23
N1
(scr
eene
d in
the
uppe
r aqu
ifer)
K70
8S/8
E-24
A1 (s
cree
ned
in th
e lo
wer
aqu
ifer)
8S/8
E-24
L1 (s
cree
ned
in th
e up
per a
quife
r)
8S/8
E-11
A4 (s
cree
ned
in th
e up
per a
quife
r)
C427
7S/1
0E-2
7A1
(unk
now
n sc
reen
ed in
terv
al)
G70
ELLIPSOID HEIGHT (FEET RELATIVE TO THE FIRST MEASUREMENT)
WATER-SURFACE ELEVATION (FEET RELATIVE TO SEA LEVEL)
WATER-SURFACE ELEVATION (FEET RELATIVE TO SEA LEVEL)
WATER-SURFACE ELEVATION (FEET RELATIVE TO SEA LEVEL)
ELLIPSOID HEIGHT (FEET RELATIVE TO THE FIRST MEASUREMENT)
ELLIPSOID HEIGHT (FEET RELATIVE TO THE FIRST MEASUREMENT)
A Figu
re 4
. Co
ntin
ued.

Global Positioning System (GPS) Surveys 13
Figure 4. Continued.
WAT
ER-S
URFA
CE E
LEVA
TION
(FEE
T RE
LATI
VE T
O SE
A LE
VEL)
YEAR
-180
-160-140
-120
-100-80
-60
-40
-20
0
20
4060
80
-320
-300
-280
-260
-240
-220
-200
-180
-160
-140
-120
-100
-80
-60
1925 1935 1945 1955 1965 1975 1985 1995 2005
6S/8E-2D1 (screened in the upper aquifer)
6S/8E-27C1 (screened in the upper and lower aquifers)
6S/8E-19D1 (screened in the lower aquifer)
5S/8E-17N1 (screened in the upper aquifer)
5S/6E-23M1 (screened in the upper and lower aquifers)
5S/7E-9F1 (screened in the perched and upper aquifers)
7S/8E-34G1 (screened in the perched aquifer)
7S/9E-7H2 (screened in the upper aquifer)
8S/8E-24L1 (screened in the upper aquifer)
7S/9E-23N1 (screened in the upper aquifer)
B
PAIN, C132, K572, JOHN, C101, K70, P572, G70, and C427) did not exceed the maximum expected uncertainty of ±36 mm (±0.12 ft) at the 95-percent confidence level, indicating that the vertical positions of these monuments in August 2000 and in August 2005 were similar.
GPS measurements were made at 16 geodetic monuments (DUNE, COCH, R70R, 5211, CAHU, S753, C132, PAIN, C101, K572, JOHN, P572, SWC, K70, C427, and G70) during at least 3 of the 4 surveys, thus permitting calculations and comparisons of subsidence rates. A seventeenth monument, 54JA, was surveyed in 1996 and 1998 and was then replaced with monument JA54 (about 6 m [20 ft] northwest from 54JA) for the 2000 and 2005 surveys; although the monument location was changed slightly, rates of subsidence were compared. Because GPS data indicated that the heights of PAIN, JOHN, K70, SWC, and G70 were fairly stable (fig. 4A), the subsidence rates of the other 12 monuments are discussed. Eleven of the twelve monuments (DUNE, COCH, R70R, 5211, 54JA/JA54, CAHU, S753, C132, C101, K572,
and P572) show decreased subsidence rates between 2000 and 2005 compared with the subsidence rates between 1998 and 2000, a period when the largest rates were computed at these 11 monuments (fig. 4A). The most marked subsidence-rate decreases between these two periods occurred at monuments COCH, 5211, CAHU, and S753, and the least marked subsidence-rate changes occurred at 54JA/JA54. Subsidence rates between 2000 and 2005 at DUNE, R70R, and P572 decreased by factors ranging from 2 to 3, and C132 decreased by a factor of about 5, compared to rates between 1998 and 2000. Calculated subsidence rates at monuments C101 and K572 continually decreased during 1996–2005. GPS results for the twelfth monument—C427— indicated subsidence between 1996 and 1998 and between 2000 and 2005, and uplift between 1998 and 2000, resulting in insignificant vertical position differences between 1998 and 2005. A power pole adjacent to C427 may have degraded the quality of the GPS observations; it is suspected that GPS observations at C427 had higher-than-expected errors.
14 Detection and Measurement of Land Subsidence Using GPS and InSAR, Coachella Valley, California, 1996–2005
Ground-Water Levels
In the northwestern part of the geodetic network (near MANI, MAGF, OSDO, R70R, and JA54), where significant land subsidence was measured by 2005, and near DUNE, where small amounts of subsidence were measured by 2005, water levels generally showed seasonal fluctuations superimposed on longer-term water-level declines during 1995–2005 (fig. 4A). In the northeastern part of the network, at COCH, where significant uplift was measured by 2005, water levels in nearby wells also showed seasonal fluctuations superimposed on longer-term water-level declines during 1995–2005 (fig. 4A). However, wells 5S/8E-17N1 and 5S/8E-20C2, in which water levels were measured near COCH, are on the west side of the San Andreas Fault (fig. 4A) and the geodetic monument COCH is on the east side of the fault (fig. 3); thus, hydrologic conditions in the two wells probably do not represent hydrologic conditions at COCH.
In the southwestern part of the network near monuments C101, C132, P572, S753, and C427, where small amounts of subsidence were measured by 2005, water levels showed seasonal fluctuations superimposed on longer-term water-level declines during 1995–2005 (fig. 4A).
In the southeastern part of the network near K572, JOHN, K70, and G70, and in the northeastern part of the network near 5211, where small or insignificant changes in elevation occurred, water levels generally showed seasonal variability superimposed on fairly stable or rising water levels during 1995 and 2005 (fig. 4A).
The relationship between ground-water-level changes and concurrent vertical changes at the geodetic monuments is not clearly defined. Complications that contribute to the difficulty in deciphering the relationship include the low frequency of both GPS and water-level measurements, and the complex, often significantly delayed mechanical responses of the aquifer system to ground-water-level changes. However, the locations of the monuments that subsided between 1996 and 2005 are coincident with areas where water levels generally declined during this period and during most of the last century (fig. 4). Similarly, the locations of the monuments that were fairly stable between 1996 and 2005 are coincident with areas where water levels generally were stable or recovered during this period. The coincident areas of subsidence and declining water levels, and of elevation stability and stable or recovering water levels, indicate that aquifer-system compaction may be causing subsidence. In the areas of subsidence, if water levels have declined sufficiently such that the effective stresses exceeded the preconsolidation stresses as is suggested by the historically low water levels shown in figure 4B, the subsidence may be permanent. Although this longer term relationship seems more straightforward, tectonically-induced subsidence also occurs on longer time scales. However, the CGPS stations used as constraints for each of the GPS datasets were fairly stable between 1996 and 2005, indicating that tectonic-induced vertical crustal motion was not included in the subsidence measurements at the geodetic monuments in the network.
InSAR MethodologyUsing Interferometric Synthetic Aperture Radar (InSAR)
is an effective way to measure vertical changes of land surface. InSAR is a satellite-based remote sensing technique that can detect centimeter-level ground-surface deformation over a 100 km2 area with a spatial resolution of 90 m or less. Synthetic Aperture Radar (SAR) imagery is produced by reflecting radar signals off a target area and measuring the two-way travel time between the target area and the satellite. InSAR uses two SAR scenes of the same area taken at different times and “interferes” (differences) them, resulting in maps called interferograms that show line-of-sight ground-surface displacement (range change) between the two time periods. The generation of an interferogram produces two components, amplitude and phase. The amplitude is the measure of the radar signal intensity returned to the satellite and shows roads, mountains, and other reflective features (similar to the image shown in fig. 5); the phase component is proportional to range change and shows the coherent displacements imaged by the radar (figs. 6A, 7A, 8A). If the ground has moved away from (subsidence) or towards (uplift) the satellite between the times of the two acquisitions (the “timeline”), a slightly different portion of the wavelength is reflected back to the satellite resulting in a measurable phase shift that is proportional to range change. The map of phase shifts, or interferogram, is depicted with a repeating color scale that shows relative range change between the first and the second acquisitions. In this report, one complete color cycle (fringe) represents 28.3 mm (0.09 ft) of range change. Assuming all the motion is vertical, the indicated range change is about 90- to 95-percent of true vertical ground motion, depending on the satellite look angle and the location of the target area. The direction of change—subsidence or uplift—is indicated by the color progression of the fringe(s) from the outer edge of a deforming feature toward its center. For interferograms in this report, the color-fringe progression of yellow-green-blue-pink indicates subsidence; the opposite progression indicates uplift.
InSAR signal quality depends partly on satellite position, atmospheric effects, ground cover, land-use practices, and timeline of the interferogram. Strict orbital control is required to precisely control the look angle and position of the satellite. Successful application of the InSAR technique is contingent on looking at the same point on the ground from the same position in space so that the horizontal distance between each satellite pass, or perpendicular baseline, is minimized. Perpendicular baselines generally greater than about 200 m (656 ft) usually produce excessive topographic effects (parallax) that can mask the deformation signal. Phase shifts can be caused by varying atmospheric mass that is associated with different elevations. A digital elevation model (DEM) is used in the interferogram generation process to reduce the atmospheric effects caused by elevation differences (and also to georeference the image). Phase shifts also can be caused by

InSAR Methodology 15
Lake
Cah
uilla
Coac
hella
Bra
nch
of th
e All-
Amer
ican
Can
al
! (111
! (111
! (74
§̈ ¦10
Palm
Des
ert (
Are
a 1)
Indi
an W
ells
(Are
a 2)
La
Qui
nta
(Are
a 3)
48th
St
60th
St
Monroe St
Cou
ntry
Clu
b D
r
Cook St
Bob Hope DrFr
ank
Sin
atra
Dr
Monterey Ave
Cla
ncy
Ln
Fred
War
ing
Dr
Mou
ntai
n C
ove
Dr
Mon
tere
y Av
e
Ran
cho
Pal
mer
as D
r
Jefferson St
Clu
b D
r
Indi
an W
ells
Ln
Whi
tew
ater
Riv
er
TMA
P
CO
TD
5S/6
E-7
M1
5S/6
E-1
7M2
6S/7
E-6
B1
6S/7
E-2
1D1
6S/7
E-1
6R2
6S/7
E-1
6A2
5S/6
E-2
3K2
5S/7
E-3
1Q2
5S/6
E-8
N3
5S/6
E-2
5A1
5S/6
E-2
3N1
5S/6
E-1
6M1
5S/6
E-2
2B1
5S/6
E-5
Q1
5S/6
E-2
4F1
Indi
o
Coa
chel
laD
EEP
OSD
OM
AN
I
MA
GF
C13
2
C14
3
S753
54JA
/JA
54
CA
HU
R70
R
CO
CH
DU
NE
Sant
a Ros
a Mou
ntain
s
Indi
o Hi
lls
San Ja
cinto M
ountains
33°4
5'
33°3
7'
20
Mile
s
20
Kilo
met
ers
Cons
olid
ated
Roc
k or
Pa
rtly
Cons
olid
ated
Dep
osits
GPS
stat
ion
and
iden
tifie
rO
SDO
Wel
l and
iden
tifie
r5S
/7E
-31Q
2
CGPS
sta
tion
and
iden
tifie
rC
OTD
116°
7'11
6°15
'11
6°22
'
Figu
re 5
. Im
age
show
ing
land
-sur
face
feat
ures
, con
solid
ated
rock
, Glo
bal P
ositi
onin
g Sy
stem
(GPS
) sta
tions
, tw
o Co
ntin
uous
Glo
bal P
ositi
onin
g Sy
stem
(CGP
S)
stat
ions
, thr
ee a
reas
of s
ubsi
denc
e, a
nd s
elec
ted
road
s an
d pr
oduc
tion
wel
ls, C
oach
ella
Val
ley,
Cal
iforn
ia.
(Hyd
rogr
aphs
for p
rodu
ctio
n w
ells
are
sho
wn
in fi
gure
9.)

16 Detection and Measurement of Land Subsidence Using GPS and InSAR, Coachella Valley, California, 1996–2005
Figu
re 6
. Ar
eas
of s
ubsi
denc
e, li
near
ities
at s
ubsi
denc
e m
argi
ns, c
onso
lidat
ed ro
ck, G
PS s
tatio
ns, a
nd tw
o CG
PS s
tatio
ns in
the
Coac
hella
Val
ley,
Cal
iforn
ia, f
or
Nov
embe
r 30,
200
3, th
roug
h M
ay 2
3, 2
004,
(A) a
s sh
own
on th
e in
terfe
rogr
am, a
nd (B
) as
show
n by
sub
side
nce
cont
ours
inte
rpre
ted
from
the
inte
rfero
gram
in A
.
Coac
hella
Bra
nch
of th
e All-
Amer
ican
Can
al
Sant
a Ros
a Mou
ntain
s
San Ja
cinto M
ountains
Indi
o Hi
lls
Nov
30,
200
3 - M
ay 2
3, 2
004
! (111
! (111
! (74
§̈ ¦10
Palm
Des
ert (
Are
a 1)
Indi
an W
ells
(Are
a 2)
La
Qui
nta
(Are
a 3)
TMA
P
CO
TD
Indi
o
Coa
chel
laD
EEP
OSD
OM
AN
IM
AG
F
C13
2
C14
3
S753
54JA
/JA
54
CA
HU
R70
R
CO
CH
DU
NE
Trac
e of
line
ariti
es a
t sub
side
nce
mar
gins
0-2
8 m
m+2
8 m
m
rela
tive
subs
iden
ceup
lift
20
Mile
s
20
Kilo
met
ers
Cons
olid
ated
Roc
k or
Pa
rtly
Cons
olid
ated
Dep
osits
GPS
stat
ion
and
iden
tifie
rO
SDO
CGPS
sta
tion
and
iden
tifie
rC
OTD
33°4
5'
33°3
7'
116°
7'11
6°15
'11
6°22
'A

InSAR Methodology 17
Nov
30,
200
3 - M
ay 2
3, 2
004
TMA
P
CO
TD
Indi
o
Coa
chel
la
Sant
a Ros
a Mou
ntain
s
San Ja
cinto M
ountains
Indi
o Hi
lls
33°4
5'
33°3
7'
! (111
! (111
! (74
§̈ ¦10
20
Mile
s
20
Kilo
met
ers
Cons
olid
ated
Roc
k or
Pa
rtly
Cons
olid
ated
Dep
osits
Subs
iden
ce C
onto
ur-In
terv
al 1
0 m
m
GPS
stat
ion
and
iden
tifie
rO
SDO
CGPS
sta
tion
and
iden
tifie
rC
OTD
DEE
P
OSD
OM
AN
IM
AG
F
C13
2
C14
3
S753
54JA
/JA
54
CA
HU
R70
R
CO
CH
DU
NE
116°
7'11
6°15
'11
6°22
'
30
10
30
30
20
20
10
10
1020
20
3020
20
10
20
20
2020
20
Indi
an W
ells
(Are
a 2)
La
Qui
nta
(Are
a 3)
Palm
Des
ert (
Are
a 1)
Coac
hella
Bra
nch
of th
e All-
Amer
ican
Can
al
B Figu
re 6
. Co
ntin
ued.
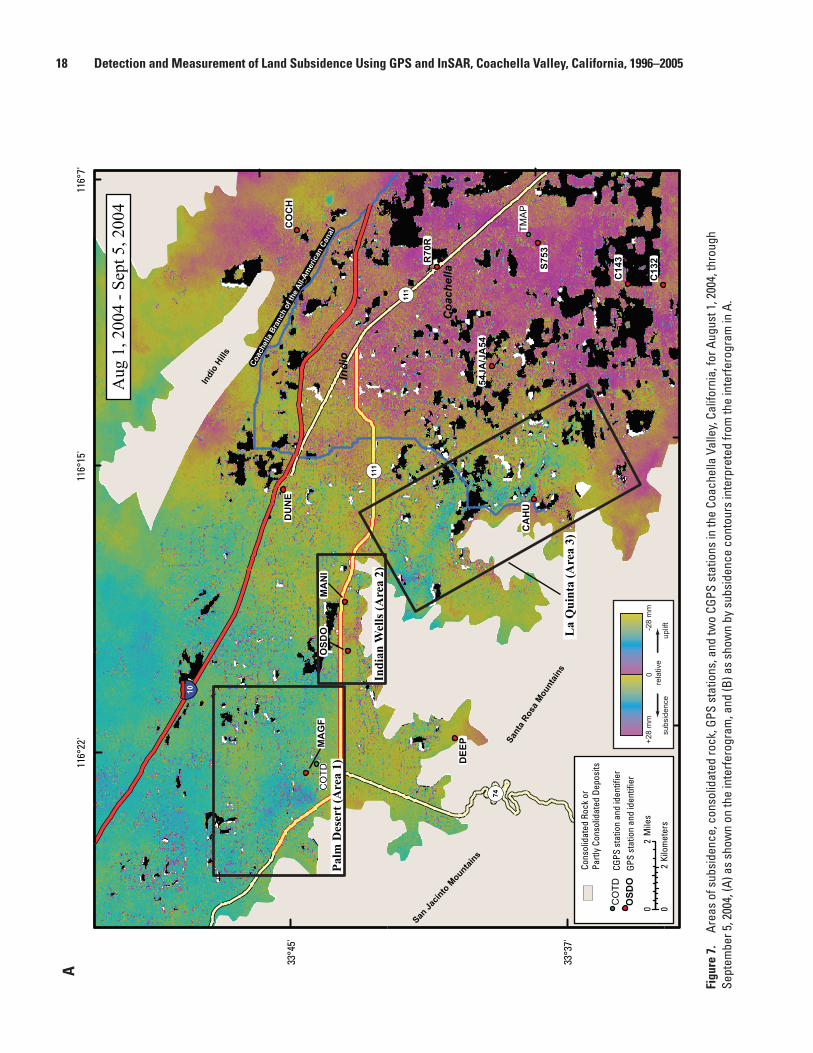
18 Detection and Measurement of Land Subsidence Using GPS and InSAR, Coachella Valley, California, 1996–2005
33°4
5'
33°3
7'
Coac
hella
Bra
nch
of th
e All-
Amer
ican
Can
al
Sant
a Ros
a Mou
ntain
s
San Ja
cinto M
ountains
Indi
o Hi
lls
Aug
1, 2
004
- Sep
t 5, 2
004
! (111
! (111
! (74
§̈ ¦10
Palm
Des
ert (
Are
a 1)
Indi
an W
ells
(Are
a 2)
La
Qui
nta
(Are
a 3)
TMA
P
CO
TD
Indi
o
Coa
chel
laD
EEP
OSD
OM
AN
IM
AG
F
C13
2
C14
3
S753
54JA
/JA
54
CA
HU
R70
R
CO
CH
DU
NE
0-2
8 m
m+2
8 m
m
rela
tive
subs
iden
ceup
lift
20
Mile
s
20
Kilo
met
ers
Cons
olid
ated
Roc
k or
Pa
rtly
Cons
olid
ated
Dep
osits
GPS
stat
ion
and
iden
tifie
rO
SDO
CGPS
sta
tion
and
iden
tifie
rC
OTD
116°
7'11
6°15
'11
6°22
'A
Figu
re 7
. Ar
eas
of s
ubsi
denc
e, c
onso
lidat
ed ro
ck, G
PS s
tatio
ns, a
nd tw
o CG
PS s
tatio
ns in
the
Coac
hella
Val
ley,
Cal
iforn
ia, f
or A
ugus
t 1, 2
004,
thro
ugh
Sept
embe
r 5, 2
004,
(A) a
s sh
own
on th
e in
terfe
rogr
am, a
nd (B
) as
show
n by
sub
side
nce
cont
ours
inte
rpre
ted
from
the
inte
rfero
gram
in A
.

InSAR Methodology 19
Figu
re 7
. Co
ntin
ued.
33°4
5'
33°3
7'
Coac
hella
Bra
nch
of th
e All-
Amer
ican
Can
al
Sant
a Ros
a Mou
ntain
s
San Ja
cinto M
ountains
Indi
o Hi
lls
Aug
1, 2
004
- Sep
t 5, 2
004
! (111
! (111
! (74
§̈ ¦10
Palm
Des
ert (
Are
a 1)
Indi
an W
ells
(Are
a 2)
La
Qui
nta
(Are
a 3)
TMA
P
CO
TD
Indi
o
Coa
chel
laD
EEP
OSD
OM
AN
IM
AG
F
C13
2
C14
3
S753
54JA
/JA
54
CA
HU
R70
R
CO
CH
DU
NE
$2
Mile
s2
Kilo
met
ers
Con
solid
ated
Roc
k or
P
artly
Con
solid
ated
Dep
osits
GP
S s
tatio
n an
d id
entif
ier
OSD
O
CG
PS
sta
tion
and
iden
tifie
rC
OTD
Sub
side
nce
Con
tour
-In
terv
al 1
0 m
m
20
Mile
s
20
Kilo
met
ers
Cons
olid
ated
Roc
k or
Pa
rtly
Cons
olid
ated
Dep
osits
Subs
iden
ce C
onto
ur-In
terv
al 1
0 m
m
GPS
stat
ion
and
iden
tifie
rO
SDO
CGPS
sta
tion
and
iden
tifie
rC
OTD
10
10
B11
6°7'
116°
15'
116°
22'

20 Detection and Measurement of Land Subsidence Using GPS and InSAR, Coachella Valley, California, 1996–2005
Figu
re 8
. Ar
eas
of s
ubsi
denc
e, c
onso
lidat
ed ro
ck, G
PS s
tatio
ns, a
nd tw
o CG
PS s
tatio
ns in
the
Coac
hella
Val
ley,
Cal
iforn
ia, f
or O
ctob
er 2
6, 2
003,
thro
ugh
June
12,
200
5, (A
) as
show
n on
the
inte
rfero
gram
, and
(B) a
s sh
own
by s
ubsi
denc
e co
ntou
rs in
terp
rete
d fro
m th
e in
terfe
rogr
am in
A.
33°4
5'
33°3
7'
116°
7'11
6°15
'11
6°22
'
Coac
hella
Bra
nch
of th
e All-
Amer
ican
Can
al
Sant
a Ros
a Mou
ntain
s
San Ja
cinto M
ountains
Indi
o Hi
lls
Oct
26,
200
3 - J
une
12, 2
005
! (111
! (111
! (74
§̈ ¦10
Palm
Des
ert (
Are
a 1)
Indi
an W
ells
(Are
a 2)
La
Qui
nta
(Are
a 3)
TMA
P
CO
TD
Indi
o
Coa
chel
laD
EEP
OSD
OM
AN
IM
AG
F
C13
2
C14
3
S753
54JA
/JA
54
CA
HU
R70
R
CO
CH
DU
NE
$2
Mile
s2
Kilo
met
ers
Con
solid
ated
Roc
k or
P
artly
Con
solid
ated
Dep
osits
GP
S s
tatio
n an
d id
entif
ier
OSD
O
CG
PS
sta
tion
and
iden
tifie
rC
OTD
0-2
8 m
m+2
8 m
m
rela
tive
subs
iden
ceup
lift
20
Mile
s
20
Kilo
met
ers
Cons
olid
ated
Roc
k or
Pa
rtly
Cons
olid
ated
Dep
osits
GPS
stat
ion
and
iden
tifie
rO
SDO
CGPS
sta
tion
and
iden
tifie
rC
OTD
A
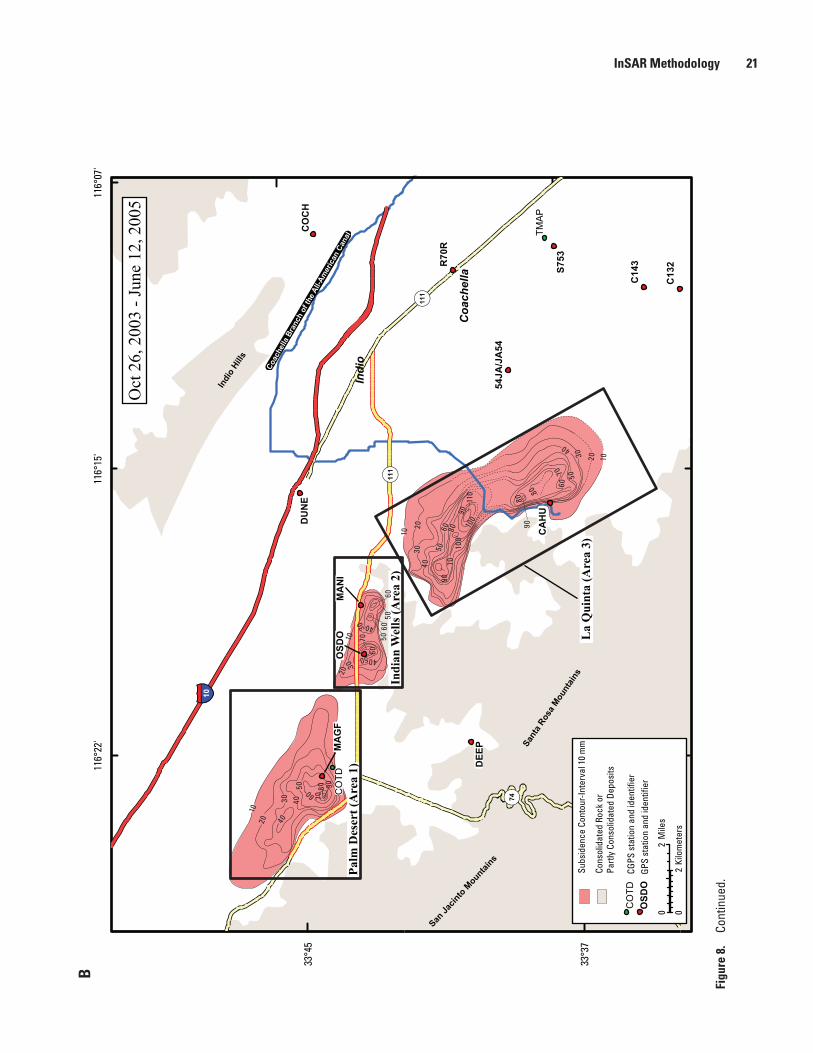
InSAR Methodology 21
Figu
re 8
. Co
ntin
ued.
33°4
5'
33°3
7'
116°
07'
116°
15'
116°
22'
Coac
hella
Bra
nch
of th
e All-
Amer
ican
Can
al
Sant
a Ros
a Mou
ntain
s
San Ja
cinto M
ountains
Indi
o Hi
lls
Oct
26,
200
3 - J
une
12, 2
005
! (111
! (111
! (74
§̈ ¦10
Palm
Des
ert (
Are
a 1)
Indi
an W
ells
(Are
a 2)
La
Qui
nta
(Are
a 3)
TMA
P
CO
TD
Indi
o
Coa
chel
laD
EEP
OSD
OM
AN
IM
AG
F
C13
2
C14
3
S753
54JA
/JA
54
CA
HU
R70
R
CO
CH
DU
NE
20
Mile
s
20
Kilo
met
ers
Cons
olid
ated
Roc
k or
Pa
rtly
Cons
olid
ated
Dep
osits
Subs
iden
ce C
onto
ur-In
terv
al 1
0 m
m
GPS
stat
ion
and
iden
tifie
rO
SDO
CGPS
sta
tion
and
iden
tifie
rC
OTD
10
10
10
1020
60
30
80
70
80
50
40
2030
40
5060 80
9070
30
30 40
4050 6060
5060
50
70
20
20
30 4050
6070
80 90
40
90
90
100
110
100
B
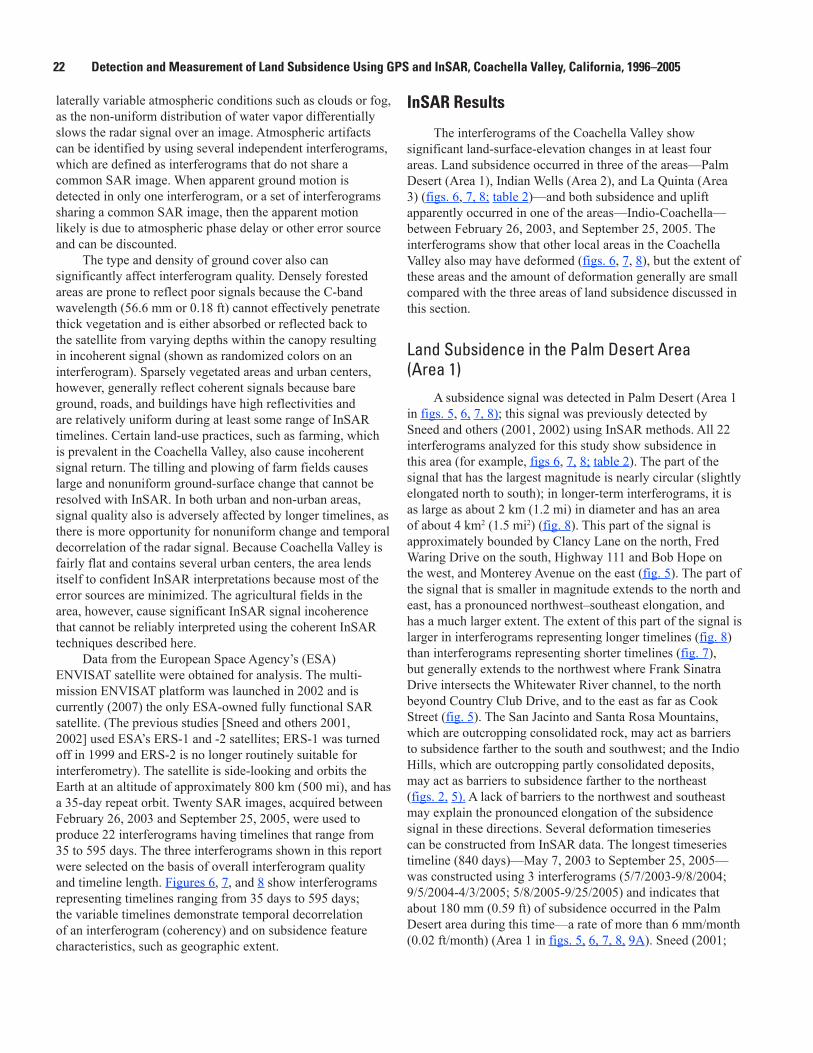
laterally variable atmospheric conditions such as clouds or fog, as the non-uniform distribution of water vapor differentially slows the radar signal over an image. Atmospheric artifacts can be identified by using several independent interferograms, which are defined as interferograms that do not share a common SAR image. When apparent ground motion is detected in only one interferogram, or a set of interferograms sharing a common SAR image, then the apparent motion likely is due to atmospheric phase delay or other error source and can be discounted.
The type and density of ground cover also can significantly affect interferogram quality. Densely forested areas are prone to reflect poor signals because the C-band wavelength (56.6 mm or 0.18 ft) cannot effectively penetrate thick vegetation and is either absorbed or reflected back to the satellite from varying depths within the canopy resulting in incoherent signal (shown as randomized colors on an interferogram). Sparsely vegetated areas and urban centers, however, generally reflect coherent signals because bare ground, roads, and buildings have high reflectivities and are relatively uniform during at least some range of InSAR timelines. Certain land-use practices, such as farming, which is prevalent in the Coachella Valley, also cause incoherent signal return. The tilling and plowing of farm fields causes large and nonuniform ground-surface change that cannot be resolved with InSAR. In both urban and non-urban areas, signal quality also is adversely affected by longer timelines, as there is more opportunity for nonuniform change and temporal decorrelation of the radar signal. Because Coachella Valley is fairly flat and contains several urban centers, the area lends itself to confident InSAR interpretations because most of the error sources are minimized. The agricultural fields in the area, however, cause significant InSAR signal incoherence that cannot be reliably interpreted using the coherent InSAR techniques described here.
Data from the European Space Agency’s (ESA) ENVISAT satellite were obtained for analysis. The multi-mission ENVISAT platform was launched in 2002 and is currently (2007) the only ESA-owned fully functional SAR satellite. (The previous studies [Sneed and others 2001, 2002] used ESA’s ERS-1 and -2 satellites; ERS-1 was turned off in 1999 and ERS-2 is no longer routinely suitable for interferometry). The satellite is side-looking and orbits the Earth at an altitude of approximately 800 km (500 mi), and has a 35-day repeat orbit. Twenty SAR images, acquired between February 26, 2003 and September 25, 2005, were used to produce 22 interferograms having timelines that range from 35 to 595 days. The three interferograms shown in this report were selected on the basis of overall interferogram quality and timeline length. Figures 6, 7, and 8 show interferograms representing timelines ranging from 35 days to 595 days; the variable timelines demonstrate temporal decorrelation of an interferogram (coherency) and on subsidence feature characteristics, such as geographic extent.
InSAR Results
The interferograms of the Coachella Valley show significant land-surface-elevation changes in at least four areas. Land subsidence occurred in three of the areas—Palm Desert (Area 1), Indian Wells (Area 2), and La Quinta (Area 3) (figs. 6, 7, 8; table 2)—and both subsidence and uplift apparently occurred in one of the areas—Indio-Coachella—between February 26, 2003, and September 25, 2005. The interferograms show that other local areas in the Coachella Valley also may have deformed (figs. 6, 7, 8), but the extent of these areas and the amount of deformation generally are small compared with the three areas of land subsidence discussed in this section.
Land Subsidence in the Palm Desert Area (Area 1)
A subsidence signal was detected in Palm Desert (Area 1 in figs. 5, 6, 7, 8); this signal was previously detected by Sneed and others (2001, 2002) using InSAR methods. All 22 interferograms analyzed for this study show subsidence in this area (for example, figs 6, 7, 8; table 2). The part of the signal that has the largest magnitude is nearly circular (slightly elongated north to south); in longer-term interferograms, it is as large as about 2 km (1.2 mi) in diameter and has an area of about 4 km2 (1.5 mi2) (fig. 8). This part of the signal is approximately bounded by Clancy Lane on the north, Fred Waring Drive on the south, Highway 111 and Bob Hope on the west, and Monterey Avenue on the east (fig. 5). The part of the signal that is smaller in magnitude extends to the north and east, has a pronounced northwest–southeast elongation, and has a much larger extent. The extent of this part of the signal is larger in interferograms representing longer timelines (fig. 8) than interferograms representing shorter timelines (fig. 7), but generally extends to the northwest where Frank Sinatra Drive intersects the Whitewater River channel, to the north beyond Country Club Drive, and to the east as far as Cook Street (fig. 5). The San Jacinto and Santa Rosa Mountains, which are outcropping consolidated rock, may act as barriers to subsidence farther to the south and southwest; and the Indio Hills, which are outcropping partly consolidated deposits, may act as barriers to subsidence farther to the northeast (figs. 2, 5). A lack of barriers to the northwest and southeast may explain the pronounced elongation of the subsidence signal in these directions. Several deformation timeseries can be constructed from InSAR data. The longest timeseries timeline (840 days)—May 7, 2003 to September 25, 2005—was constructed using 3 interferograms (5/7/2003-9/8/2004; 9/5/2004-4/3/2005; 5/8/2005-9/25/2005) and indicates that about 180 mm (0.59 ft) of subsidence occurred in the Palm Desert area during this time—a rate of more than 6 mm/month (0.02 ft/month) (Area 1 in figs. 5, 6, 7, 8, 9A). Sneed (2001;
22 Detection and Measurement of Land Subsidence Using GPS and InSAR, Coachella Valley, California, 1996–2005

Acq
uisi
tion
date
sPa
lm D
eser
t (A
rea
1)In
dian
Wel
ls (A
rea
2)La
Qui
nta
(Are
a 3)
Wes
t bow
lEa
st b
owl
Nor
thCe
ntra
lSo
uth
star
t dat
e-en
d da
tetim
e-lin
e
(day
s)
mag
nitu
de
(mm
)m
agni
tude
(ft
)m
agni
tude
(m
m)
mag
nitu
de
(ft)
mag
nitu
de
(mm
)m
agni
tude
(ft
)m
agni
tude
(m
m)
mag
nitu
de
(ft)
mag
nitu
de
(mm
)m
agni
tude
(ft
)m
agni
tude
(m
m)
mag
nitu
de
(ft)
2/26
/200
3–6/
11/2
003
105
–20
–0.0
7–5
–0.0
20
0i
ii
ii
i5/
7/20
03–9
/8/2
004
490
–90
–0.3
0–6
0–0
.20
–50
–0.1
6–9
0–0
.30
–120
–0.3
9–6
0–0
.20
9/24
/200
3–8/
4/20
0431
5–8
0–0
.26
–30
–0.1
0–3
0–0
.10
–50
–0.1
6–6
0–0
.20
–60
–0.2
010
/26/
2003
–6/2
7/20
0424
5–4
5–0
.15
–25
–0.0
8–2
5–0
.08
–30
–0.1
0–4
5–0
.15
ii
10/2
6/20
03–1
1/14
/200
438
5–7
0–0
.23
–40
–0.1
3–3
5–0
.11
–40
–0.1
3–8
0–0
.26
–50
–0.1
610
/26/
2003
–2/2
7/20
0549
0–6
0–0
.20
–40
–0.1
3–4
0–0
.13
–60
–0.2
0–7
0–0
.23
–60
–0.2
010
/26/
2003
–6/1
2/20
0559
5–9
0–0
.30
–70
–0.2
3–6
0–0
.20
–90
–0.3
0–1
10–0
.36
–90
–0.3
011
/30/
2003
–5/2
3/20
0417
5–3
5–0
.11
–20
–0.0
7–2
0–0
.07
–30
–0.1
0–3
0–0
.10
–30
–0.1
011
/30/
2003
–7/1
7/20
0559
5–9
0–0
.30
–40
–0.1
3–4
0–0
.13
–70
–0.2
310
00.
33–6
0–0
.20
5/23
/200
4–1/
23/2
005
245
–60
–0.2
0–3
0–0
.10
–25
–0.0
8–7
0–0
.23
–50
–0.1
6–6
0–0
.20
5/23
/200
4–7/
17/2
005
420
–90
–0.3
0–5
0–0
.16
–40
–0.1
3–7
0–0
.23
–90
–0.3
0–6
0–0
.20
6/27
/200
4–11
/14/
2004
140
–40
–0.1
3–2
0–0
.07
–15
–0.0
5–4
0–0
.13
–40
–0.1
3–5
0–0
.16
8/1/
2004
–9/5
/200
435
–15
–0.0
50
00
0–1
5–0
.05
–10
–0.0
3–1
0–0
.03
8/1/
2004
–4/3
/200
524
5–5
0–0
.16
–30
–0.1
0–2
0–0
.07
–40
–0.1
3–4
0–0
.13
–50
–0.1
69/
5/20
04–4
/3/2
005
210
–50
–0.1
6–2
5–0
.08
–15
–0.0
5–4
0–0
.13
–30
–0.1
0–3
0–0
.10
11/1
4/20
04–1
2/19
/200
435
–10
–0.0
30
00
0–5
–0.0
20
05
0.02
11/1
4/20
04–2
/27/
2005
105
–25
–0.0
8–1
5–0
.05
–10
–0.0
3–2
0–0
.07
00
100.
0312
/19/
2004
–2/2
7/20
0570
–15
–0.0
5–1
0–0
.03
–5–0
.02
–15
–0.0
5–1
0–0
.03
–10
–0.0
31/
23/2
005–
7/17
/200
517
5–3
0–0
.10
–20
–0.0
7–1
0–0
.03
–30
–0.1
0–4
0–0
.13
–30
–0.1
02/
27/2
005–
6/12
/200
510
5–2
0–0
.07
–15
–0.0
5–5
–0.0
2–1
0–0
.03
–20
–0.0
7–2
5–0
.08
5/8/
2005
–9/2
5/20
0514
0–4
0–0
.13
–20
–0.0
7–1
0–0
.03
–30
–0.1
0–2
5–0
.08
–30
–0.1
07/
17/2
005–
9/25
/200
570
–15
–0.0
5–1
5–0
.05
–5–0
.02
–20
–0.0
7–1
5–0
.05
–15
–0.0
5
Tabl
e 2.
Ve
rtica
l cha
nge
mea
sure
d us
ing
inte
rfero
met
ric s
ynth
etic
ape
rture
rada
r (In
SAR)
for 3
are
as in
the
Coac
hella
Val
ley,
Cal
iforn
ia, 2
003–
2005
.
[Neg
ativ
e va
lues
for m
agni
tude
indi
cate
subs
iden
ce. B
old
type
indi
cate
s con
serv
ativ
e va
lue
owin
g to
incr
ease
d in
cohe
renc
y as
soci
ated
with
long
er ti
mel
ines
. Sha
ding
: Gre
en sh
ade
indi
cate
s tha
t the
in
terf
erog
ram
is sh
own
in fi
gure
6A
; bro
wn
shad
e in
dica
tes t
hat t
he in
terf
erog
ram
is sh
own
in fi
gure
7A
; and
pin
k sh
ade
indi
cate
s tha
t the
inte
rfer
ogra
m is
show
n in
figu
re 8
A. f
t, fo
ot; i
, inc
oher
ent;
mm
, m
illim
eter
]
InSAR Methodology 23

2002) reported that about 150 mm (0.49 ft) of subsidence occurred in this area during 1,541 days between 1996 and 2000, which is equivalent to a rate of about 3 mm/month (0.1 ft/month). These data indicate that subsidence rates have doubled since 2000.
Land Subsidence in the Indian Wells Area (Area 2)
In the Indian Wells area, two distinct subsidence signals were detected, termed the western bowl and the eastern bowl (Area 2 in figs. 5, 6, 7, 8). Sneed and others (2002) discussed a possible additional subsidence signal as suspect about 1 km (0.6 mi) southeast of the eastern subsidence bowl because of the proximity of this area to steep topographic terrain. The shorter timelines and multiple interferograms analyzed during this current study show that it is an extension of the eastern subsidence bowl (for example, fig. 6). Twenty of the 22 interferograms analyzed for this study show the western bowl and 19 show the eastern bowl (for example, figs 6, 8; table 2). The two interferograms with the shortest timelines (35 days) do not show either the western or eastern subsidence bowl (for example, fig. 7) and one interferogram of relatively low quality (not shown) with a 105-day timeline does not show the eastern bowl (table 2). The western subsidence bowl is approximately bounded by Fred Waring Drive on the north, the Santa Rosa Mountains on the south, Rancho Palmeras Drive on the west, and Indian Wells Lane on the east (fig. 5). The eastern subsidence bowl is approximately bounded by Highway 111 on the north, the Santa Rosa Mountains on the south, Club Drive on the west, and Mountain Cove Drive on the east (fig. 5). Distinct northwest-southeast linearities shown near the northern margins of the pair of subsiding bowls suggest the presence of barriers to ground-water flow or abrupt changes in lithology that control the northern extent of subsidence (fig. 6). The western bowl, which is elongated northwest–southeast, is as large as about 2.3 km (1.4 mi) long and about 1.8 km (1.1 mi) wide (northeast–southwest) and has an area of about 4.1 km2 (1.6 mi2) in longer-term interferograms. The eastern bowl, which also is elongated northwest–southeast, is as large as about 2.3 km (1.4 mi) long and ranges from about 0.3 to 0.8 km (0.2 to 0.5 mi) wide (northeast–southwest) and has an area of 1.2 km2 (0.5 mi2) (Area 2 in figures 6 and 8). The maximum subsidence for the western bowl was about 105 mm (0.34 ft) and for the eastern bowl was about 75 mm (0.25 ft) from May 7, 2003 to September 25, 2005 (fig. 9A); the equivalent rates are nearly 4 mm/month (0.013 ft/month) and nearly 3 mm/month (0.01 ft/month) for the western and eastern bowls, respectively. Sneed (2001; 2002) reported that about 80 mm (0.26 ft) of subsidence occurred in each bowl between 1996 and 2000; the equivalent rate is about 1.6 mm/month (0.005 ft/month). These data indicate that subsidence rates have doubled since 2000.
Land Subsidence in the La Quinta Area (Area 3)
A third area of subsidence was detected in the La Quinta area (Area 3 in figs. 5, 6, 7, 8). All 22 interferograms analyzed for this study show subsidence in this area (for example, figs. 6, 7, 8; table 2). Sneed and others (2002) analyzed 2 interferograms with timelines of 315 and 350 days and suggested Area 3 consisted of two separate areas of subsidence—termed the La Quinta and the Lake Cahuilla areas of subsidence—because the interferograms were not coherent throughout the area. Similarly for the interferograms analyzed for this current study, the longer-term interferograms were incoherent near the central part of the subsiding area (for example, figs. 6 and 8); however, the shorter-term interferograms show that this subsidence area likely is continuous, and is termed the La Quinta subsidence area for this report (for example, fig. 7A). The La Quinta subsidence area is about 10 km (6 mi) in length (northwest-southeast) and is as much as 3 km (1.9 mi) in width. The area is approximately bounded by 48th Street (if extended westward) on the north, 60th Street (if extended westward) on the south, the Santa Rosa Mountains on the west, and streets varying from Jefferson Street to Monroe Street on the east (because the subsidence area trends northwest-southeast) (fig. 5). Different portions of this elongate subsidence bowl are subsiding at different rates; for May 7, 2003 to September 25, 2005, subsidence was 160 mm (0.52 ft) in the northern part, 175 mm (0.57 ft) in the central part, and 120 mm (0.39 ft) in the southern part (fig. 9A); equivalent subsidence rates are about 6 mm/month (0.02 ft/month) for the northern and central parts and more than 4 mm/month (0.013 ft/month) for the southern part. Sneed (2002) reported that about 80 mm (0.26 ft) of subsidence occurred in the northern part between 1998 and 2000 and is equivalent to a subsidence rate of more than 3 mm/month (0.01 ft/month). Sneed (2001; 2002) reported that about 35 mm (0.11 ft) of subsidence occurred in the southern part between 1996 and 2000 and is equivalent to a subsidence rate of nearly 1 mm/month (0.003 ft/month). These data indicate that subsidence rates have doubled in the northern part and increased by about a factor of 4 in the southern part since 2000.
Deformation in the Indio-Coachella AreaIndio-Coachella has not been previously discussed
as an area of deformation. The shorter timelines of InSAR data presented in this report as opposed to those presented in Sneed and others, 2001 and Sneed and others 2002, show land-surface-elevation changes in the Indio-Coachella area which appear to mostly be uplift or stable; however, the apparent deformation is suspect. As was mentioned in the InSAR Methodology section, interferograms show relative deformation, not absolute deformation. Because much of the
24 Detection and Measurement of Land Subsidence Using GPS and InSAR, Coachella Valley, California, 1996–2005

basin is subsiding as is shown by the GPS results, it is likely that the Indio-Coachella area only appears to be uplifting as proximal areas in the basin are subsiding around it. The Indio-Coachella area could actually be subsiding at slower rates than proximal areas of the basin, which would appear as relative uplift in an interferogram. Because the deformation interpretations are suspect, this area is not discussed further in this report.
Ground-Water LevelsAll the areas where significant subsidence was detected
using InSAR—Palm Desert, Indian Wells, and La Quinta—coincide with or are near areas where ground-water pumping generally caused ground-water levels to decline. Available water-level data indicate that water levels measured in 2005 in many wells in the Palm Desert, Indian Wells, and La Quinta areas were at the lowest levels in their recorded histories (fig. 9B). The coincident areas of the subsidence signals and the declining water levels, and the localized character of the subsidence signals typical of subsidence caused by localized pumping, strongly suggest a relation between subsidence and ground-water-level declines. The stresses imposed by the declining water levels and the significant subsidence at the three areas revealed by InSAR indicate that the water levels may have exceeded the preconsolidation stress, and if so, the subsidence may be permanent.
While ground-water-level data are too sparse to evaluate the short-term effect on vertical land-surface changes shown by the InSAR results, the available ground-water-level and InSAR data can be used to draw some inferences about the affected aquifer system. In Palm Desert (Area 1 in figs. 6, 7, 8), the area of maximum subsidence is concentric. Although water-level data are measured infrequently and are not available within the area of the concentric InSAR signal, data for the surrounding region indicate that water-level declines have been fairly uniform. The concentric subsidence shape suggests that the stress primarily causing the subsidence is near the center of the concentric shape and that sediments constituting the aquifer system in the area are fairly homogenous as the sediments responded uniformly to similar water-level declines in areas surrounding the center of the subsidence bowl.
In Indian Wells, the areas of subsidence form two separate elongated shapes—one parallel to and one perpendicular to the mountain front. The available water-level data indicate fairly uniform water-level declines in the area, suggesting that the aquifer system is heterogeneous in this part of the valley because sediments responded dissimilarly to similar water-level declines, as exhibited by the irregular shapes of the subsidence areas. Additional evidence of aquifer heterogeneity in the area is given by the distinct northwest-southeast linearity shown on the northern margins of the pair of subsiding bowls, suggesting the presence of barriers to
ground-water flow or abrupt changes in lithology that control the northern extent of subsidence (Area 2 in fig. 6).
In La Quinta, water-level data are too sparse to relate to the aquifer-system response, but the northwestern part of the subsiding area has an irregular shape that appears to be related to the contact between the alluvial aquifer and the bedrock basement complex that defines the extent of the aquifer system (Area 3 in figs. 6, 7, 8).
Comparison of InSAR and GPS ResultsGPS and InSAR measurements can be compared at
monuments MAGF, MANI, and OSDO, and at the CGPS station COTD in Palm Desert (figs. 3, 5, 6, 7, 8). InSAR data are uninterpretable at the other monuments in the land-subsidence monitoring network and at CGPS station TMAP (near S753) because they are in and near agriculturally active areas (which degrades the InSAR data). Because SAR data and GPS data for MAGF, MANI, and OSDO were not collected simultaneously, magnitudes of land subsidence measured by the two methods could not be compared; instead, rates of subsidence were compared at these monuments. Rates of land subsidence that were derived from GPS data measured at GPS monuments were calculated by differencing the ellipsoid heights computed from the GPS surveys in 2000 and 2005 and dividing by 1,813 days—the number of days between August 30, 2000 and August 17, 2005. Rates of land subsidence derived from InSAR data for the locations of GPS monuments were computed by determining the magnitude of land subsidence for each interferogram near each monument, then dividing that magnitude by the number of days that the interferogram spans; 22 subsidence rates (between February 26, 2003 and September 25, 2005) were calculated from the 22 interferograms analyzed. At COTD, absolute magnitudes of subsidence derived from GPS data and InSAR data were compared because continuously collected GPS data permits computation of a position for any day of interest.
At MAGF, 138 mm (0.45 ft) of subsidence was calculated from the GPS data, resulting in a calculated subsidence rate of 0.08 mm/d (2.6 x 10⁻⁴ ft/d). The subsidence rates calculated from InSAR data ranged from 0.06 mm/d to 0.14 mm/d (2.0 x 10⁻⁴ ft/d to 4.6 x 10⁻⁴ ft/d); the average calculated subsidence rate was 0.08 mm/d (2.6 x 10⁻⁴ ft/d) and the standard deviation was 0.03 mm/d (9.8 x 10⁻⁵ ft/d). At MANI, 46 mm (0.15 ft) of subsidence was calculated from the GPS data, resulting in a calculated subsidence rate of 0.03 mm/d (9.8 x 10⁻⁵ ft/d); the calculated subsidence rates derived from InSAR data ranged from 0 mm/d (0 ft/d) to 0.07 mm/d (2.3 x 10⁻⁴ ft/d); the average and standard deviation were 0.02 mm/d (6.6 x 10⁻⁵ ft/d). At OSDO, 192 mm (0.63 ft) of subsidence was calculated from the GPS data, resulting in a calculated subsidence rate of 0.11 mm/d (3.6 x 10⁻⁴ ft/d); the calculated subsidence rates derived from InSAR data
InSAR Methodology 25

Figure 9. Hydrographs showing (A) water-surface elevations for selected production wells, and InSAR timeseries showing land subsidence for 5/7/2003–9/25/2005, and (B) water-surface elevations for the same production wells for 1970–2005 in the three InSAR-detected land subsidence areas in the Coachella Valley, California. (See figure 5 for well locations.)
La Quinta (Area 3)
Indian Wells (Area 2)
WAT
ER-S
URFA
CE E
LEVA
TION
(FEE
T RE
LATI
VE T
O SE
A LE
VEL)
YEAR
Palm Desert (Area 1)
LAN
D SU
BSID
ENCE
, IN
FEE
T
WAT
ER-S
URFA
CE E
LEVA
TION
(MET
ERS
RELA
TIVE
TO
SEA
LEVE
L)
-90-80-70-60-50-40-30-20-10
0102030405060 0
0.1
0.2
0.3
0.4
0.5
0.6
0
0.1
0.2
0.3
0.4
0.5
0.6-50-40-30-20-10
0102030405060708090
100
0
10
20
30
5
15
25
-5
-10
-15
0
10
5
15
-5
-10
-15
-20
-25
-180-170-160-150-140-130-120-110-100
-90-80-70-60-50-40-30 0
0.1
0.2
0.3
0.4
0.5
0.62003 2004 2005
5S/6E-16M1
5S/6E-5Q1
5S/6E-17M2
5S/6E-7M1
5S/6E-8N3
Land subsidence (InSAR timeseries)
5S/6E-23K2
5S/6E-23N1
5S/6E-25A15S/6E-24F1
5S/6E-22B1
Western bowl land subsidence (InSAR timeseries)
Eastern bowl land subsidence (InSAR timeseries)
6S/7E-6B15S/7E-31Q2
6S/7E-16A2
6S/7E-16R2
6S/7E-21D1
North land subsidence (InSAR timeseries)
Central land subsidence (InSAR timeseries)
South land subsidence (InSAR timeseries)
-20
-10
-15
-25
-30
-35
-40
-45
-50
-55
LAN
D SU
BSID
ENCE
, IN
MIL
LIM
ETER
S
0
30
60
90
120
150
180
0
30
60
90
120
150
180
0
30
60
90
120
150
180
A
26 Detection and Measurement of Land Subsidence Using GPS and InSAR, Coachella Valley, California, 1996–2005
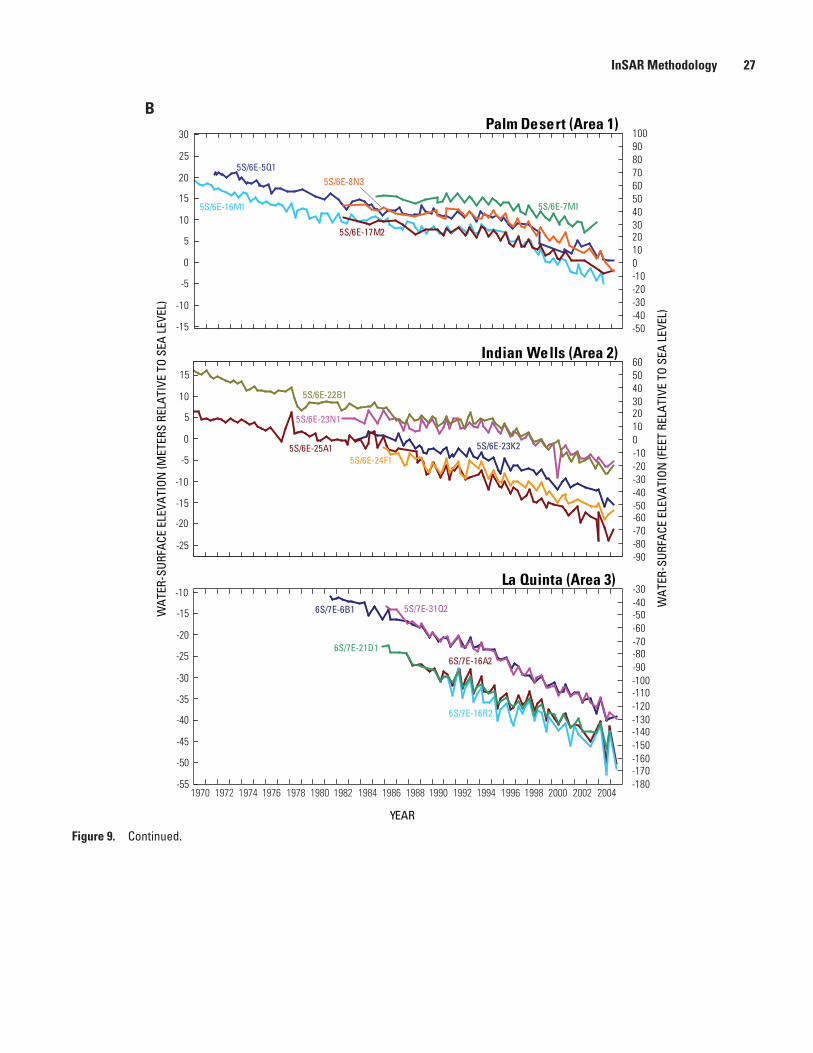
La Quinta (Area 3)
Indian Wells (Area 2)
Palm Desert (Area 1)
-50-40-30-20-100102030405060708090100
-180-170-160-150-140-130-120-110-100-90-80-70-60-50-40-30
-90-80-70-60-50-40-30-20-100102030405060
WAT
ER-S
URFA
CE E
LEVA
TION
(FEE
T RE
LATI
VE T
O SE
A LE
VEL)
YEAR
1972 19821980 1984 1986 19881970 197819761974 1992 20022000 20041990 199819961994
5S/6E-16M1
5S/6E-5Q1
5S/6E-17M2
5S/6E-7M1
5S/6E-8N3
5S/6E-23K2
5S/6E-23N1
5S/6E-25A15S/6E-24F1
5S/6E-22B1
6S/7E-6B1 5S/7E-31Q2
6S/7E-16A2
6S/7E-16R2
6S/7E-21D1
WAT
ER-S
URFA
CE E
LEVA
TION
(MET
ERS
RELA
TIVE
TO
SEA
LEVE
L)
0
10
20
30
5
15
25
-5
-10
-15
0
10
5
15
-5
-10
-15
-20
-25
-20
-10
-15
-25
-30
-35
-40
-45
-50
-55
B
Figure 9. Continued.
InSAR Methodology 27

ranged from 0.05 mm/d to 0.21 mm/d (1.6 x 10⁻⁴ ft/d to 6.9 x 10⁻⁴ ft/d); the average was 0.11 mm/d (3.6 x 10⁻⁴ ft/d) and the standard deviation was 0.05 mm/d (1.6 x 10⁻⁴ ft/d).
The coordinates for CGPS station COTD were computed by SOPAC for the dates May 7, 2003, and September 25, 2005, and were compared to the InSAR time series that spans those same dates. GPS observations indicated 24 mm (0.08 ft) of subsidence, while InSAR measurements indicated 25 mm (0.08 ft).
The calculated subsidence rates for monuments MAGF, MANI, OSDO, and the subsidence magnitude at COTD calculated using both GPS data and InSAR data compare favorably, thereby improving confidence in results derived from both methods. The favorable comparison of data for these monuments lends credibility to the GPS data collected at the other monuments in the network where InSAR data is unusable because of incoherence caused by agricultural land use.
Future MonitoringContinued monitoring in the southern Coachella
Valley is warranted because ground-water levels continue to decline to record-low levels in some areas of the valley and, therefore, the significant amounts and rising rates of land subsidence documented by this study are expected to increase. Most of the changes in the vertical positions of the GPS network monuments measured in 1996, 1998, and 2000 were within the measurement errors, indicating that a longer period of time would have been needed to see significant changes. Comparing the land-surface-elevation changes of the monuments in the GPS network in 2005 with those of the previous three surveys did show changes greater than the anticipated GPS measurement errors. As a result, GPS surveys completed every 3-5 years would be sufficient to monitor subsidence rates. Spatially detailed InSAR-derived maps of ground displacements, however, could continue to be processed annually or more frequently depending on data availability, because InSAR can detect relative changes in vertical position as small as 5 mm (0.02 ft) (Hoffmann and others, 2001). Because InSAR-detected areas of subsidence spatially overlap the GPS network, future monitoring of the GPS network could provide ground truth for the more spatially detailed and higher resolution InSAR measurements, as was done during this study. Furthermore, as InSAR technology matures, it is likely that some InSAR measurements made in agriculturally active areas, such as those in the southern Coachella Valley, could result in improved spatial detail of displacement in these areas.
The frequency of water-level measurements in wells in the Coachella Valley is too low to permit meaningful interpretations of the aquifer-system response to water-level changes, particularly when paired with the more frequent InSAR measurements. Furthermore, the wells generally have long or multiple screens such that the water-level
measurement is a composite measurement representing a large thickness of the aquifer system. Increasing the measurement frequency of ground-water levels in just a few piezometers (wells constructed with short screens and small diameters for monitoring purposes)—both in areas of known subsidence and in areas of relative stability—would significantly improve analysis of the relationship between changes in water levels and in land-surface elevations. In concert with more frequent water-level measurements, more frequent and high-resolution measurements of aquifer-system compaction, such as those derived from a borehole extensometer, would improve the analysis of aquifer-system response. The information derived from such a monitoring site(s) would be useful in estimating aquifer-system hydraulic parameters that govern ground-water flow and land subsidence. This information could be used to construct a numerical model of ground-water flow and aquifer-system compaction to refine estimates of governing parameters and to predict potential aquifer-system compaction which could be used by CVWD to manage water resources while considering land subsidence.
SummaryGround water has been a major source of agricultural,
municipal, and domestic water supply in the Coachella Valley since the early 1920s. Ground-water levels declined throughout the Coachella Valley from the 1920s until 1949. In 1949, the importation of surface water from the Colorado River to the southern Coachella Valley began, resulting in decreased pumping and a recovery of water levels in some areas. Since the 1970s, the demand for water in the southern Coachella Valley has exceeded the deliveries of the imported surface water, and water levels have again declined. The declining water levels have the potential to induce or renew land subsidence in the Coachella Valley. Results of previous studies by the U.S. Geological Survey indicate that land subsidence may have been as much as about 150 mm (0.5 ft) in the southern parts of the valley between about 1930 and 1996 (Ikehara and others, 1997).
The location and magnitude of vertical land-surface changes during 1996–2005 were determined using GPS and InSAR techniques. The GPS measurements and the images processed for the InSAR measurements described in this report span the area from Palm Desert on the north to the Salton Sea on the south. GPS measurements were more useful than InSAR measurements for determining vertical land-surface changes in agricultural areas, and InSAR measurements were more useful for determining spatially detailed changes in nonagricultural areas. GPS measurements made at 13 geodetic monuments in 1996 and 2005 in the southern Coachella Valley indicate that the elevation of the land surface had a net decline of 124 to 9 mm ±54 mm (0.41 to 0.03 ft ±0.18 ft) during the 9-year period. Changes at 9 of the 13 monuments exceeded the maximum expected uncertainty of ±54 mm (±0.18 ft) at the 95-percent confidence
28 Detection and Measurement of Land Subsidence Using GPS and InSAR, Coachella Valley, California, 1996–2005

Summary 29
level, indicating that subsidence occurred at these monuments between June 1996 and August 2005. GPS measurements made at 20 geodetic monuments in 2000 and in 2005 indicate that the land-surface elevation changed –192 to +51 mm ±36 mm (–0.63 to +0.17 ft ±0.12 ft) during the 5-year period. Changes at 6 of the 20 monuments exceeded the maximum expected uncertainty of ±36 mm (±0.12 ft) at the 95-percent confidence level—subsidence occurred at five monuments and uplift occurred at one monument between August 2000 and August 2005. Data from two of the five subsiding monuments for which subsidence rates could be compared indicate that subsidence rates decreased during this period compared with subsidence rates before 2000.
Results of the InSAR measurements made between May 7, 2003, and September 25, 2005, indicate that land subsided about 75 to 180 mm (0.25 to 0.59 ft) in three areas of the Coachella Valley: near Palm Desert, Indian Wells, and La Quinta; the equivalent subsidence rates range from about 3 to more than 6 mm/month (0.01 to 0.02 ft/month). The subsiding areas near these locations were previously identified using InSAR measurements for 1996–2000, which indicated that land subsided about 35 to 150 mm (0.11 to 0.49 ft) during the four-year period; the equivalent subsidence rates range from about 1 to 3 mm/month (0.003 to 0.01 ft/month). Comparison of the InSAR results indicates that subsidence rates have increased by 2 to 4 times since 2000 in these three areas.
Water-level measurements made at wells near the subsiding GPS monuments and near the areas of subsidence shown by InSAR generally indicate that water levels declined during 1996-2005. The relation between declining water levels and significant subsidence may indicate that the water levels have exceeded the preconsolidation stress and that the resulting subsidence may be permanent (inelastic). Continued monitoring in the southern Coachella Valley is warranted because ground-water levels continue to decline to record-low levels in some areas of the valley and, therefore, the significant amounts and increasing rates of land subsidence documented by this study are expected to continue.
Acknowledgments This study was done in cooperation with the CVWD;
the authors gratefully acknowledge the CVWD for their support and assistance during this study. We acknowledge the SCIGN and its sponsors, the W.M. Keck Foundation, the National Aeronautics and Space Administration, the National Science Foundation, the USGS, and the Southern California Earthquake Center for providing data used in this study. We thank the University NAVSTAR Consortium (UNAVCO) for providing GPS equipment and exceptional technical support for the 2005 GPS Survey. Radar data used to produce the interferograms shown in this report were obtained from the European Space Agency for purposes of research and development.
References
Amelung, Falk, Galloway, D.L., Bell, J.W., Zebker, H.A., and Laczniak, R.J., 1999, Sensing the ups and downs of Las Vegas: InSAR reveals structural control of land subsidence and aquifer-system deformation: Geology, v. 27, no. 6, p. 483–486.
California Department of Water Resources, 1964, Coachella Valley Investigation: California Department of Water Resources, Bulletin 108, 145 p.
California Department of Water Resources, 1979, Coachella Valley area well standards investigation: Los Angeles, California Department of Water Resources, Southern District, 40 p.
Craymer, M.R., and Beck, N., 1992, Session versus baseline GPS processing, in the Proceedings of the 5th International Technical Meeting of the Institute of Navigation: Albuquerque, New Mexico, Institute of Navigation GPS-92, September 16–18, 1992.
Fielding, E.J., Blom, R.G., and Goldstein, R.M., 1998, Rapid subsidence over oil fields measured by SAR interferometry: Geophysical Research Letters, v. 25, p. 3215.
Galloway, D.L., Hudnut, K.W., Ingebritsen, S.E., Phillips, S.P., Peltzer, G., Rogez, F., and Rosen, P.A., 1998, InSAR detection of aquifer system compaction and land subsidence, Antelope Valley, Mojave Desert, California: Water Resources Research, v. 34, p. 2573–2585.
Galloway, D.L., Jones, D.R., and Ingebritsen, S.E., 1999, Land subsidence in the United States: U.S. Geological Survey Circular 1182, 175 p.
Galloway, D.L., Jones, D.R., and Ingebritsen, S.E., 2000, Measuring land subsidence from space: U.S. Geological Survey Fact Sheet 051-00, 4 p.
Hoffmann, J., Zebker H.A., Galloway, D.L., and Amelung, F., 2001, Seasonal subsidence and rebound in Las Vegas Valley, Nevada, observed by synthetic aperture radar interferometry: Water Resources Research, v. 37, no. 6, p. 1551–1566.
Holzer, T.L., 1984, Ground failure induced by ground-water withdrawal from unconsolidated sediment: Reviews in Engineering Geology, v. 6, p. 67–105.
Ikehara, M.E., Predmore, S.K., and Swope, D.J., 1997, Geodetic network to evaluate historical elevation changes and to monitor land subsidence in Lower Coachella Valley, California, 1996: U.S. Geological Survey Water-Resources Investigations Report 97-4237, scale 1:63,000, 1 sheet [folded in envelope].
30 Detection and Measurement of Land Subsidence Using GPS and InSAR, Coachella Valley, California, 1996–2005
Leake, S.A., and Prudic, D.E., 1991, Documentation of a computer program to simulate aquifer-system compaction using the modular finite-difference ground-water flow model: U.S. Geological Survey Techniques of Water-Resources Investigations, book 6, chap A2, 68 p.
Massonnet, D., Briole, P., and Arnaud, A., 1995, Deflation of Mount Etna monitored by spaceborne radar interferometry: Nature, v. 375, p. 567–570.
Massonnet, D., Holzer, T., and Vadon, H., 1997, Land subsidence caused by the East Mesa geothermal field, California, observed using SAR interferometry: Geophysical Research Letters, v. 24, p. 901–904.
Massonnet, D., Rossi, M., Carmona, C., Adragna, F., Peltzer, G., Feigl, K., and Rabaute, T., 1993, The displacement field of the Landers earthquake mapped by radar interferometry: Nature, v. 364, p. 138–142.
McKibben, M.A., 1993, The Salton Trough rift, in Reynolds, R.E., and Reynolds, Jennifer, eds., Ashes, faults and basins: San Bernardino County Museum Association Special Publication, v. 93-1, p. 76–80.
Meinzer, O.E., 1928, Compressibility and elasticity of artesian aquifers: Economic Geology, v. 23, no. 3, p. 263–291.
Poland, J.F., ed., 1984, Guidebook to studies of land subsidence due to ground-water withdrawal, v. 40 of UNESCO Studies and Reports in Hydrology: Paris, France, United Nations Educational, Scientific and Cultural Organization, 305 p., 5 appendixes.
Riley, F.S., 1998, Mechanics of aquifer systems—The scientific legacy of Joseph F. Poland, in Borchers, J., ed., Land subsidence—Case Studies and Current Research: Proceedings of the Dr. Joseph F. Poland Symposium on Land subsidence, Association of Engineering Geologists Special Publication 8, p. 13–227.
Rosen, P.A., Hensley, Scott, Joughin, I.R., Li, F.L., Madsen, S.N., Rodriguez, Ernesto, and Goldstein, R.M., 2000, Synthetic aperture radar interferometry: Proceedings of the of Civil Engineers, v. 88, no. 3, p. 333–382.
Shen, Z.-K., Agnew, D.C., King, R.W., Dong, D., Herring, T.A., Wang, M., Johnson, H., Anderson, G., Nikolaidis, R., van Domselaar, M., Hudnut, K.W., and Jackson, D.D., 2003, The SCEC crustal motion map, Version 3.0, http://epicenter.usc.edu/cmm3, accessed April 19, 2007.
Sneed, Michelle, Ikehara, M.E., Galloway, D.L., and Amelung, Falk, 2001, Detection and measurement of land subsidence using global positioning system and interferometric synthetic aperture radar, Coachella Valley, California, 1996–98: U.S. Geological Survey Water-Resources Investigations Report 01-4193, 26 p.
Sneed, Michelle, Stork, S.V., and Ikehara, M.E. 2002, Detection and measurement of land subsidence using global positioning system and interferometric synthetic aperture radar, Coachella Valley, California, 1998–2000: U.S. Geological Survey Water-Resources Investigations Report 02–4239, 29 p.
Terzaghi, Karl, 1925, Principles of soil mechanics, IV—Settlement and consolidation of clay: Engineering News-Record, 95 (3), p. 874–878.
Tyley, S.J., 1971, Analog model study of the ground-water basin of the upper Coachella Valley, California: U.S. Geological Survey Open-File Report, 89 p.
Zebker, H.A., Rosen, P.A., and Hensley, S., 1997, Atmospheric effects in interferometric synthetic aperture radar surface deformation and topographic maps: Journal of Geophysical Research, v. 102, p. 7547–7563.
Zilkoski, D.B., D’Onofrio, J.D., and Frakes, S.J., 1997, Guidelines for establishing GPS-derived ellipsoid heights, (Standards: 2 cm and 5 cm) version 4.3: Silver Spring, Md., National Geodetic Survey, 10 p, 3 appendices.


![Land Subsidence Modelling Using Particle Swarm Optimization … · [9] Detection of land subsidence in Semarang ... [10] Modeling alluvial aquifer using ... December 08, 2019](https://cdn.vdocument.in/doc/165x107/610848f4e09ef8046839856a/land-subsidence-modelling-using-particle-swarm-optimization-9-detection-of-land.jpg)

