001
Detection of dairy cow behaviour changes associated with claw horn lesions using biosensors Z E Barker
1, H R Hodges
1, J A Vazquez Diosdado
2, N J Bell
3, E A Codling
2, D P Croft
4, J R Amory
1
1Writtle College, Chelmsford, Essex, UK,
2University of Essex, Colchester, UK,
3RVC, Potters Bar, Hertfordshire, UK,
4University of Exeter, Devon, UK
Application Differences in dairy cow feeding behaviour detected by sensors may offer a method of predicting lameness on
farms.
Introduction Recent technological developments in biosensors offer the potential for automatic real-time monitoring of
animals. Early detection and therefore prompt treatment of lameness case reduces severity and duration of cases (Leach et
al., 2012). Observational studies have shown that changes in behaviour often precede clinical signs of disease and may
therefore be useful predictors of disease (e.g. Gonzalez et al., 2008). This study investigates the potential for a sensor
combining location, activity and orientation to detect changes in time budget associated with lameness.
Material and methods All cows from a group of 120 high yielding dairy cows were fitted with neck collars mounted with
Omnisense 500 ® sensors between July and December 2014. A support vector machine was used to classify cows as
standing, lying or feeding similar to the method described by Vazquez Diosdado et al, (2015). Cows were mobility scored
every 2 weeks using the DairyCo. mobility score (score 2 or 3 were classified as clinically lame). ZB observed all trimming
sessions by the foot trimmer and all lesions treated by the farm staff were recorded by the researcher in a weekly interview.
The 7 days prior to lesion treatment were used in the analyses for cows clinically lame with sole ulcers (SU) or white line
disease (WL). Cows with no lesions and no lame scores during the study period were classified as non-lame. Standing,
lying and feeding behaviour variables were compared for SU, WL and Non-lame cows using a one-way ANOVA (Genstat
v17).
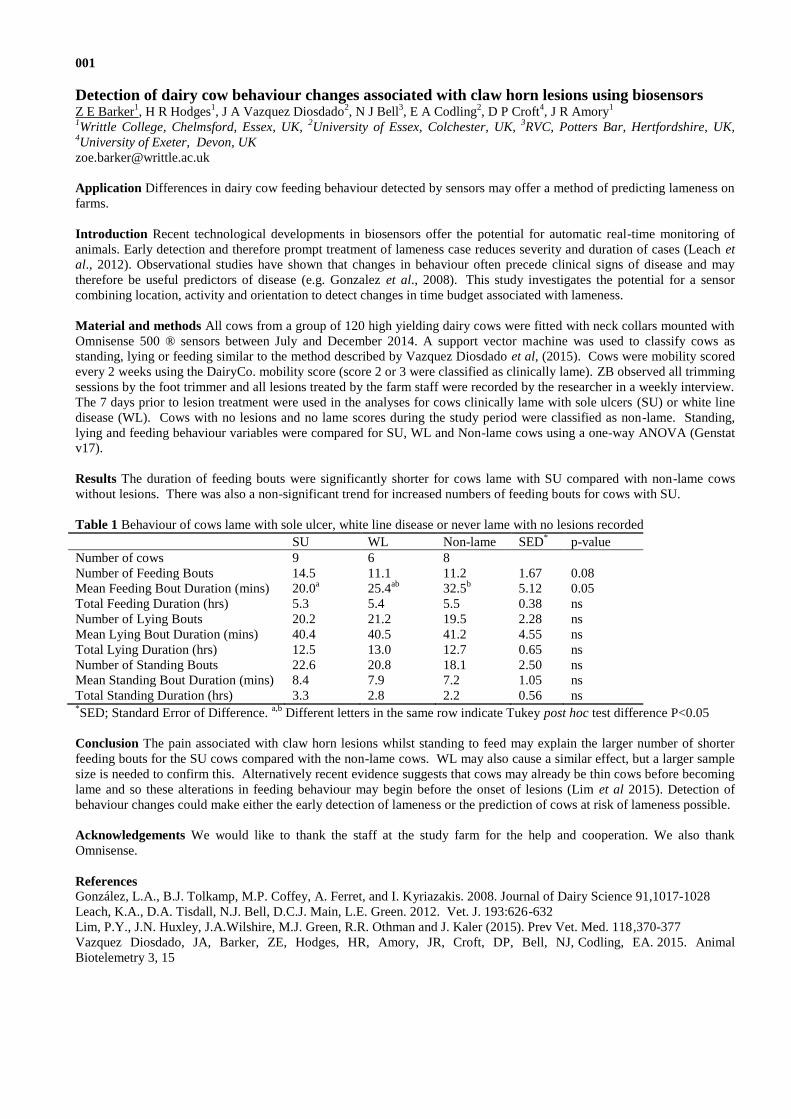
Results The duration of feeding bouts were significantly shorter for cows lame with SU compared with non-lame cows
without lesions. There was also a non-significant trend for increased numbers of feeding bouts for cows with SU.
Table 1 Behaviour of cows lame with sole ulcer, white line disease or never lame with no lesions recorded
SU WL Non-lame SED* p-value
Number of cows 9 6 8
Number of Feeding Bouts 14.5 11.1 11.2 1.67 0.08
Mean Feeding Bout Duration (mins) 20.0a 25.4
ab 32.5
b 5.12 0.05
Total Feeding Duration (hrs) 5.3 5.4 5.5 0.38 ns
Number of Lying Bouts 20.2 21.2 19.5 2.28 ns
Mean Lying Bout Duration (mins) 40.4 40.5 41.2 4.55 ns
Total Lying Duration (hrs) 12.5 13.0 12.7 0.65 ns
Number of Standing Bouts 22.6 20.8 18.1 2.50 ns
Mean Standing Bout Duration (mins) 8.4 7.9 7.2 1.05 ns
Total Standing Duration (hrs) 3.3 2.8 2.2 0.56 ns *SED; Standard Error of Difference.
a,b Different letters in the same row indicate Tukey post hoc test difference P<0.05
Conclusion The pain associated with claw horn lesions whilst standing to feed may explain the larger number of shorter
feeding bouts for the SU cows compared with the non-lame cows. WL may also cause a similar effect, but a larger sample
size is needed to confirm this. Alternatively recent evidence suggests that cows may already be thin cows before becoming
lame and so these alterations in feeding behaviour may begin before the onset of lesions (Lim et al 2015). Detection of
behaviour changes could make either the early detection of lameness or the prediction of cows at risk of lameness possible.
Acknowledgements We would like to thank the staff at the study farm for the help and cooperation. We also thank
Omnisense.
References
González, L.A., B.J. Tolkamp, M.P. Coffey, A. Ferret, and I. Kyriazakis. 2008. Journal of Dairy Science 91,1017-1028
Leach, K.A., D.A. Tisdall, N.J. Bell, D.C.J. Main, L.E. Green. 2012. Vet. J. 193:626-632
Lim, P.Y., J.N. Huxley, J.A.Wilshire, M.J. Green, R.R. Othman and J. Kaler (2015). Prev Vet. Med. 118,370-377
Vazquez Diosdado, JA, Barker, ZE, Hodges, HR, Amory, JR, Croft, DP, Bell, NJ, Codling, EA. 2015. Animal
Biotelemetry 3, 15

002
A new system for automatic weighing of beef cattle D W Ross
1, S M Troy
1, C-A Duthie
1, J J Hyslop
2, R Ritchie
3
1SRUC Research, Midlothian, UK,
2SAC Consulting, Midlothian, UK,
3David Ritchie (Implements) Ltd, Angus, UK
Application A configuration that allows automatic weighing of livestock at a water trough. Integrated with electronic
identification this could provide a valuable management tool for monitoring growing and finishing cattle, and provide a
platform for complimentary technologies.
Introduction Growth rate is an important measure in assessing individual beef animal finishing performance, and is a key
variable in assessing feed efficiency, an economically important trait of beef cattle (Nkrumah et al., 2007). Average daily
gain (ADG) systems are available that integrate at feed points (e.g. Growsafe Beef Feedlot), or as walkover systems (e.g.
Fullwood WS). This embodiment validates the watering point position, in combination with individual electronic
identification (EID). The objectives were to develop and test a passive recording system (in the form of an open ended-
crate construct) designed for use by multiple animals, at a common watering point.
Material and methods 78 steers of various breeds were split into two adjoining pens (n=39) and offered ad libitum one of
two contrasting finishing diets: (i) forage-based diet (Mixed, 500 g concentrate / kg DM), or a high concentrate diet (Conc,
920 g concentrate / kg DM). Within each pen a BeefMonitor (BM) weight recording station was positioned at a water
trough to automatically weigh each animal at every drinking event, using EID tags to identify the animal. Once per week
the steers were also removed from their pens prior to receiving fresh feed and weighed using a calibrated weighing
platform (Tepari Cattlemaster “Titan”). The steers remained on the trial for a minimum of 5 weeks, after which time they
were sent for slaughter in 4 groups over a period of 8 weeks. Daily BM weights were calculated by averaging the individual
animal BM weights collected over a 24 hour period. ADG (kg/day) for both the BM and crush weights were calculated by
regressing weight against days on trial. ADGs for both weigh stations were analysed using general linear models with
fixed effects of diet and weigh station.
Results ADG did not differ between weigh stations (P>0.05; BM: 1.3±0.04 kg/day, Crush: 1.3±0.04 kg/day). Steers
receiving the Conc diet grew at a faster rate than those steers receiving the Mixed diet (P<0.0001; Conc: 1.5±0.04 kg/day,
Mixed: 1.1±0.03 kg/day).
Diet Mixed Conc Significance
Weigh Station BM Crush BM Crush Weigh Station Diet Weight Station * Diet
ADG (kg/day) 1.1 1.1 1.5 1.4 NS *** NS
Conclusion The is no difference in ADG gain values calculated from weights gathered automatic using a weighing station
positioned at a water trough and from weekly weights measured in a weighing system integrated into a handling system.
All animals adapted to the physical BM system arrangement.
Acknowledgements This project was co-funded by Innovate UK.
References
Nkrumah J.D., Basarab J.A., Wang Z., Li C., Price M.A., Okine E.K., Crews D.H., Moore S.S., 2007. Genetic and
phenotypic relationships of feed intake and measures of efficiency with growth and carcass merit of beef cattle. Journal of
Animal Science 85, 2711–2720
500
520
540
560
580
600
620
640
660
42219 42233 42247 42261 42275 42289 42303
Crush Weight
BM Weight
003
Effect of oestrous synchronisation programme and season on pregnancy rate to timed artificial
insemination in beef cows F Randi
1,2, P Lonergan
2, M H Parr
1, F Lively
3, M G Diskin
1, D A Kenny
1,2
1Teagasc, Grange, Dunsany, Co. Meath, Ireland,
2University College Dublin, Belfield, Dubin 4., Ireland,
3AFBINI,
Hillsborough, Co. Down, Ireland
Application Artificial insemination (AI) is the most used and valuable reproductive biotechnology for genetic
improvement in beef cattle. Timed AI (TAI) based programmes are required to reduce labour requirements and the
necessity for heat detection.
Introduction The use of AI in the Irish beef industry is limited with typically only ~20% of calves born to beef cows sired
by an AI bull. One of the principal reasons for the poor penetration of the technology is the challenge of detecting animals
in oestrus. In particular, small herd size with resultant lower incidence of oestrus-related activity, land fragmentation and
the part-time nature of the enterprise mitigate the use of AI, where heat detection is required. Oestrous synchronisation
protocols which facilitate the use of timed AI (TAI) provide the opportunity to dramatically increase the use of AI on beef
cows (Bó and Baruselli, 2014), but must be both labour efficient and effective. The aim of this study was to evaluate the
use of three TAI protocols on pregnancy rate of beef cows under field conditions.
Material and methods A total of 1410 suckled cows located on 61 farms throughout the island of Ireland were enrolled on
the study, which was replicated in spring (S; n=703 cows) and autumn (A; n=707 cows) of 2014. A voluntary waiting
period of 35 days post partum was employed. Body condition score (BCS) was assessed and ovarian ultrasonography was
conducted to determine the presence of a corpus luteum (CL). Cows were randomly assigned to receive a 7 day
progesterone-releasing intravaginal device (PRID) without (Group 1) or with (Group 2) administration of gonadotropin
releasing hormone (GnRH) analogue at PRID insertion and a luteolytic dose of prostaglandin F2α was given at PRID
removal. A third group of cows (Group 3) received 400 IU equine chorionic gonadotropin (eCG) at PRID removal. GnRH
was administered at TAI 72 h after PRID removal. Pregnancy diagnosis by transrectal ultrasonography was conducted 35-
40 days after FTAI. Data were analyzed using the GENMOD procedure of SAS, appropriate to the 2 (seasons) x 3
(treatments) factorial design employed.
Results Mean BCS was 2.75 and 2.92 for S and A cows respectively and was not different between treatments. Overall
BCS was positively associated with pregnancy rate (P=0.003). Presence of a CL at treatment initiation increased pregnancy
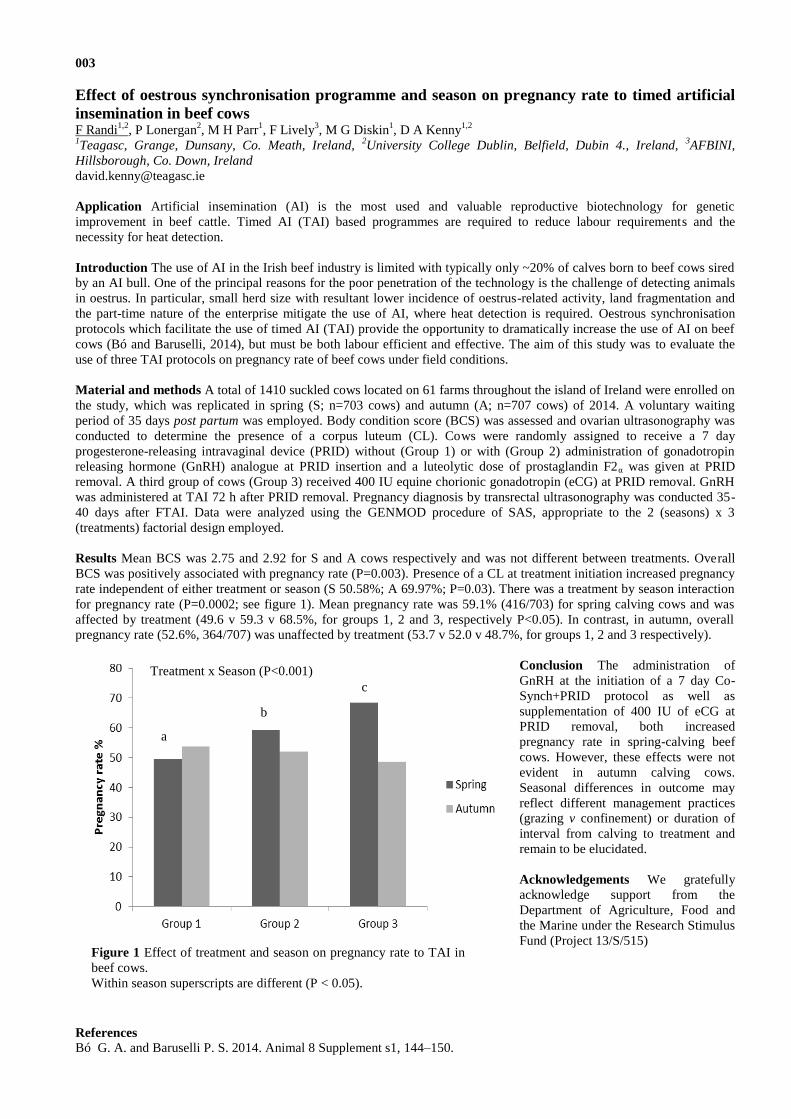
rate independent of either treatment or season (S 50.58%; A 69.97%; P=0.03). There was a treatment by season interaction
for pregnancy rate (P=0.0002; see figure 1). Mean pregnancy rate was 59.1% (416/703) for spring calving cows and was
affected by treatment (49.6 v 59.3 v 68.5%, for groups 1, 2 and 3, respectively P<0.05). In contrast, in autumn, overall
pregnancy rate (52.6%, 364/707) was unaffected by treatment (53.7 v 52.0 v 48.7%, for groups 1, 2 and 3 respectively).
Conclusion The administration of
GnRH at the initiation of a 7 day Co-
Synch+PRID protocol as well as
supplementation of 400 IU of eCG at
PRID removal, both increased
pregnancy rate in spring-calving beef
cows. However, these effects were not
evident in autumn calving cows.
Seasonal differences in outcome may
reflect different management practices
(grazing v confinement) or duration of
interval from calving to treatment and
remain to be elucidated.
Acknowledgements We gratefully
acknowledge support from the
Department of Agriculture, Food and
the Marine under the Research Stimulus
Fund (Project 13/S/515)
References
Bó G. A. and Baruselli P. S. 2014. Animal 8 Supplement s1, 144–150.
Figure 1 Effect of treatment and season on pregnancy rate to TAI in
beef cows.
Within season superscripts are different (P < 0.05).
a
c
b
Treatment x Season (P<0.001)
004
Comparative live weight, body condition score at breeding and reproductive performance of
high and low replacement index beef cows S McCabe
1,2, N McHugh
3, N E O'Connell
2, R Prendiville
1
1Teagasc Grange, Dunsany, Co. Meath, Ireland,
2Queen’s University Belfast, UK,
3Teagasc Moorepark, Fermoy, Co.
Cork, Ireland
Application Replacement index is used to identify animals suitable for breeding or selecting replacements on the basis of
their genetic merit
Introduction Producing a live calf every spring in a defined calving period is critical to achieving a profitable suckler
system in Ireland (Crosson et al., 2009). However, current industry figures show that cows are producing 0.82 calves per
year with a calving interval of 407 days (ICBF, 2015). With the inception of a replacement index by ICBF in 2012,
availability of maternal genetic evaluations should enable breeders to improve current industry performance and ultimately
improve maternal efficiency of the beef sector. Therefore, the objective of this study was to compare the live weight, body
condition score (BCS) at breeding and reproductive performance of high and low replacement index cows.
Material and methods Data were available from 179 cows over two consecutive calving seasons; 101 and 78 cows of high
and low index, respectively. Animals were selected from high reliability (>70%) Aberdeen Angus and Limousin sires. The
replacement index was €119 and €50 for high and low index cows, respectively. Cows were targeted to calve for the first
time at 24 months of age. Live weight and BCS (0 to 5) were recorded every three weeks. Breeding commenced in late
April in 2014 and 2015 and lasted 13 weeks. Tail paint and vasectomised bulls were used as aids for heat detection. Cows
were artificially inseminated for six weeks in 2014, nine weeks in 2015 and stock bulls thereafter. Reproductive variables
included: calving to service interval, 24 day submission rate, pregnancy rate to first service, six week in-calf rate, final in-
calf rate, calving to conception interval and the number of services per cow. All pregnancy traits were defined based on
trans-rectal ultrasound imaging (Aloka 210D * ΙΙ, 7.5 MH3) 70 days after the end of the breeding season. The effects of
cow genotype on cow live-weight, BCS and reproductive performance was analysed using mixed models in PROC
HPMIXED (SAS Inst. Inc., Cary, NC). Sire of the cow was included as the random effect. Analysis of binary fertility data
was undertaken using PROC GENMOD assuming a logit link function. Fixed effects included in all models were genotype
of cow, year, parity and heterosis and recombination loss of the cow.
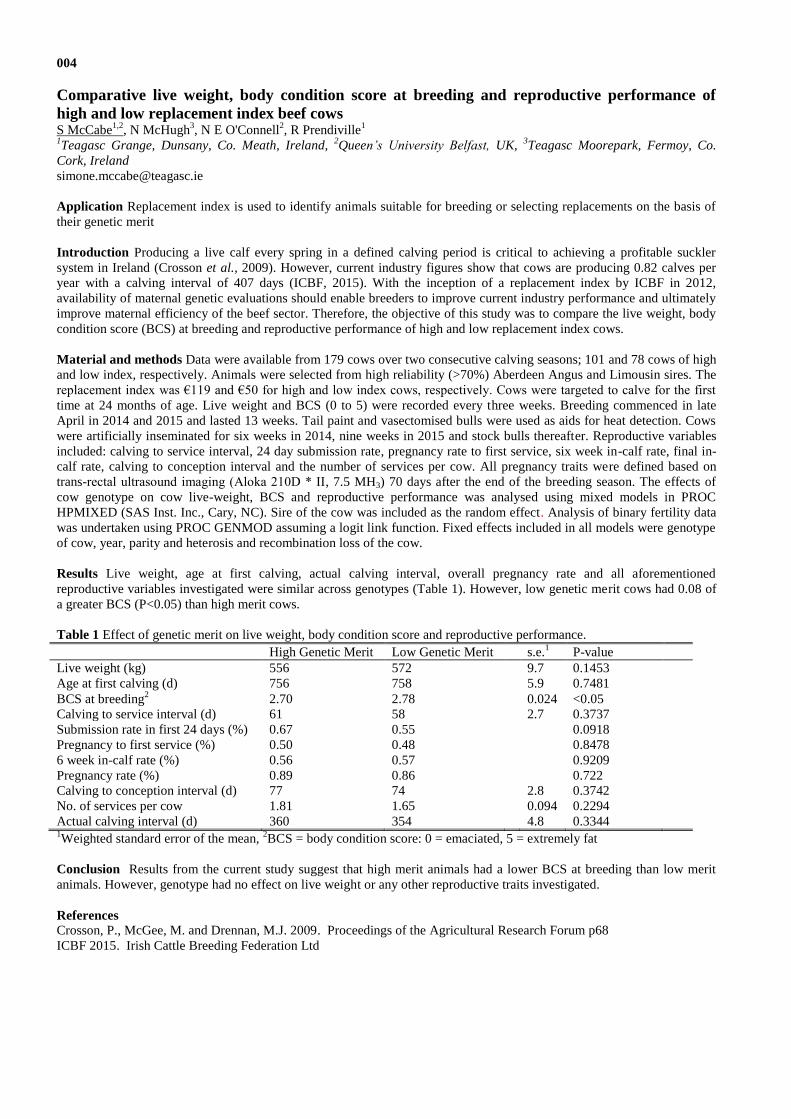
Results Live weight, age at first calving, actual calving interval, overall pregnancy rate and all aforementioned
reproductive variables investigated were similar across genotypes (Table 1). However, low genetic merit cows had 0.08 of
a greater BCS (P<0.05) than high merit cows.
Table 1 Effect of genetic merit on live weight, body condition score and reproductive performance.
High Genetic Merit Low Genetic Merit s.e.1 P-value
Live weight (kg) 556 572 9.7 0.1453
Age at first calving (d) 756 758 5.9 0.7481
BCS at breeding2
2.70 2.78 0.024 <0.05
Calving to service interval (d) 61 58 2.7 0.3737
Submission rate in first 24 days (%) 0.67 0.55 0.0918
Pregnancy to first service (%) 0.50 0.48 0.8478
6 week in-calf rate (%) 0.56 0.57 0.9209
Pregnancy rate (%) 0.89 0.86 0.722
Calving to conception interval (d) 77 74 2.8 0.3742
No. of services per cow 1.81 1.65 0.094 0.2294
Actual calving interval (d) 360 354 4.8 0.3344 1Weighted standard error of the mean,
2BCS = body condition score: 0 = emaciated, 5 = extremely fat
Conclusion Results from the current study suggest that high merit animals had a lower BCS at breeding than low merit
animals. However, genotype had no effect on live weight or any other reproductive traits investigated.
References
Crosson, P., McGee, M. and Drennan, M.J. 2009. Proceedings of the Agricultural Research Forum p68
ICBF 2015. Irish Cattle Breeding Federation Ltd

005
Effect of altering plane of nutrition during the first and second six months of life on age at
puberty onset in Holstein Friesian bulls C Byrne
1,2, A-M English
1,3, S Fair
3, P Lonergan
2, D A Kenny
1
1Animal & Grassland Research and Innovation Centre, Teagasc, Dunsany, Co. Meath, Ireland,
2School of Agriculture and
Food Science, University College Dublin, Belfield, Dublin 4, Ireland, 3Department of Life Sciences, University of Limerick,
Limerick, Ireland [email protected]
Application Earlier onset of puberty in young genomically-selected high genetic merit dairy bulls will advance the
availability of semen, shorten the generation interval and accelerate the rate of genetic improvement. Our data demonstrate
that increasing the plane of nutrition during calf-hood advances the age at which puberty occurs.
Introduction With the advent of genomic selection, dairy bulls can now be identified as sires for use in artificial
insemination much earlier than was previously possible, creating demand for semen from young sires as early as possible.
Data from beef (Brito et al., 2007) and dairy (Dance et al., 2015) bulls show that offering bulls a high plane of nutrition in
early life can hasten puberty onset. However, whether suboptimal performance in early life can be mitigated through
improving plane of nutrition during the pre-pubertal period is unclear. The aim of this study was to examine the effects of
plane of nutrition during the first and second 6 months of life on bull performance, scrotal circumference and age at
puberty.
Material and methods Autumn-born Holstein-Friesian bull calves (n=83) with a mean (±S.D.) age and bodyweight of 17
(±4.4) days and 52 (±6.2) kg, respectively, were blocked on age, bodyweight and sire and assigned to a high [H] or low [L]
plane of nutrition for the first 6 months of life. Calves were individually offered milk replacer and concentrate using an
electronic feeder. After five days acclimatisation H (n=37) and L (n=46) calves received 1200 g or 450 g of milk replacer,
respectively. H calves were offered concentrate ad libitum while L animals received a maximum of 1 kg concentrates daily.
Calves were weaned when consuming a minimum of 1 kg concentrates for 3 consecutive days, at a mean age (±S.D.) of 78
(4.4) days in H and 79 (5.8) days in L calves. Following weaning, H calves were offered ad libitum concentrates while L
calves received 1 kg of concentrate daily. All calves had ad libitum access to hay. At 24 weeks of age, calves were re-
assigned, within treatment, to either remain on their existing plane of nutrition or to change to the opposite diet, until
puberty. This resulted in four groups: HH; HL; LL and LH (n=19, 18, 22 and 24, respectively). Animals were turned out to
pasture at 26 weeks of age where HH and LH calves received grass and concentrate ad libitum while LL and HL calves
received grass to appetite plus 0.5 kg concentrate daily. Animals were weighed weekly pre-weaning and fortnightly post-
weaning. Scrotal circumference (SC) was measured every two weeks beginning at 15 weeks of age and electro-ejaculation
commenced when a SC of 24 cm was reached. Puberty was defined as an ejaculate containing 50 million sperm cells with
>10% motility. Data were analysed using mixed models ANOVA and orthogonal contrasts (SAS, version 9.3).
Results H bulls grew faster than L bulls during the first 6 months of life (P<0.001; Table 1). There was a pre x post 6
months diet interaction for average daily gain; growth slowed in bulls moved from H to L and accelerated in those moved
from L to H. Diet affected weight at puberty during the second 6 months of life with HH and LH being heavier than either
LL or HL (P<0.001). Bulls offered HH had a larger SC than LL at puberty (P<0.05). There was a tendency towards an
interaction of diets pre and post 6 months, as bulls offered a H plane of nutrition during the first 6 months of life reached
puberty 30 days earlier than L bulls (P<0.001) irrespective of diet post 6 months. There was no effect of plane of nutrition
during the second 6 months of life on age at puberty (P= 0.35).
Table 1 Effect of plane of nutrition (PON) on growth and age at puberty in Holstein-Friesian bulls
PON pre 6 months High Low Significance1
PON post 6 months High Low Low High Pre Post Pre*Post
ADG Pre 6 months2 0.96 (0.03)
a 0.96 (0.04)
a 0.59 (0.03)
b 0.60 (0.05)
b
*** NS NS
ADG Post 6 months2 1.60 (0.03)
a 0.70 (0.05)
b 0.96 (0.03)
c 1.60 (0.03)
a
*** *** ***
ADG Overall2 1.24 (0.02)
a 0.84 (0.02)
b 0.57 (0.03)
c 0.96 (0.03)
b
*** *** NS
Weight at puberty (kg) 404 (11.8)a 287 (6.52)
b 269 (5.52)
b 374 (15.0)
a
NS *** NS
SC at puberty (cm) 31 (0.52)a 29 (0.34)
ab 28 (0.39)
b 29 (0.74)
ab
* 0.06 NS
Age at puberty (days) 298 (6.3)a 283 (5.6)
a 319 (3.9)
b 323 (6.5)
b
*** NS 0.09
1*=P<0.05, ***=P<0.001.
2kg/day
a, b= values within row with different superscripts differ significantly. ADG = average
daily gain; SC = scrotal circumference
Conclusion Feeding an increased plane of nutrition pre 6 months of age hastens puberty onset in dairy bulls. Bulls offered
a high plane of nutrition post 6 months did not reach puberty earlier than bulls restricted throughout life, despite having an
improved growth rate and reaching live weights similar to those of unrestricted bulls.
Acknowledgements We acknowledge funding from the Department of Agriculture, Food and Marine. (Project 11/S/116)
References
Brito, L.F., Barth, A.D., Rawlings, N.C., Wilde, R.E., Crews, D.H., Jr. Mir, P.S. Kastelic, J.P. 2007. Domestic Animal
Endocrinology 33, 460-469
Dance, A., Thundathil, J., Wilde, R., Blondin, P., Kastelic, J. 2015. Journal of Dairy Science 98, 987-998.

006
The effect of early life plane of nutrition on testicular development of Holstein Friesian bull
calves A-M English
1,2, C Byrne
1,3, J Cassidy
3, D A Kenny
1,3, S Fair
1
1Teagasc Grange, Dunsany, Co. Meath, Ireland,
2University of Limerick, Ireland,
3University College Dublin, Ireland
Application It is desirable for potential A.I bulls to reach puberty as early as possible and to have the capability of
producing high volumes of good quality semen early in life, which is dependent on early testicular development. This study
demonstrates that early calfhood nutrition can advance testicular development in Holstein Friesian bull calves.
Introduction Developing sperm cells in the testes are supported by Sertoli cells; which are laid down in utero and from
birth to puberty. Sertoli cell numbers are directly correlated with adult testicular size and the rate of daily sperm production
post puberty (Curtis and Amann, 1981). A high plane of nutrition during early calfhood has been shown to advance puberty
in both dairy (Dance et al., 2015) and beef (Brito et al., 2007) bulls. The aim of this study was to examine the effect of
plane of nutrition during the first 18 weeks of life on testicular development in Holstein Friesian bull calves.
Materials and Methods Holstein-Friesian (HF) bull calves with a mean (±S.D.) age and bodyweight of 19 (±8.2) days
and 47.5 (±5.3) kg, respectively, were sourced from commercial dairy farms blocked on breed, age, sire and liveweight and
subsequently assigned to either a high (H; n=10) or low (L; n=10) plane of nutrition. Calves were individually fed milk
replacer and concentrates using an electronic feeding system. After five days acclimatisation, H calves received 1200 g of
milk replacer daily, with concentrate ad libitum. L calves were allocated 450 g of milk replacer plus a maximum of 1 kg of
concentrates daily. All bulls were weaned when consuming a minimum of 1 kg of concentrate for 3 consecutive days, at a
mean age (±S.D.) of 82 (±3.9) days. After weaning, H calves were offered ad libitum concentrates, while L calves received
1 kg of concentrates daily. All bulls had daily access to approximately 0.5 kg of hay and ad libitum access to fresh water.
At 126 days of age, the bulls were euthanized using an intravenous overdose of sodium pentobarbitone and testes were
excised. The epididymides were removed and testes were weighed. Two sections of the parenchyma were dissected from
each testis and fixed in formalin. Sections (5-µm thick) were stained using periodic acid-Schiff and assessed for outer
seminiferous tubule (ST) diameter and stage of spermatogenesis. The outer ST diameters were quantified using an eyepiece
micrometer at x400 magnification. Measurements were made on 20 different round tubules, selected at random from each
testis. The sections were analysed for the most advanced stage of spermatogenesis at x1000 magnification. In the cross-
sections of 20 ST per testis, the most mature sperm type was established using the methods of Curtis and Amann (1981).
Results H bulls grew faster and had a greater seminiferous tubule diameter than L bulls (Table 1). H bulls had a higher
percentage of spermatogonia denoted as the most mature cell type in spermatogenesis than L bulls. L bulls had a higher
percentage of gonocytes and prespermatogonia.
Table 1 Effect of plane of nutrition on calf performance and testes development
Low High S.E.M. Significance1
Pre weaning ADG (kg) 0.43 0.73 0.04 ***
Post weaning ADG (kg) 0.57 1.46 0.11 ***
Slaughter weight (kg) 107.1 160.9 6.54 ***
Paired testes weight (g) 31.4 55.4 3.41 ***
Seminiferous tubule diameter (µm) 72.5 85.4 2.72 **
Gonocyte and prespermatogonia (%)2 57 31.5 ***
Spermatogonia (%)2 43 68.5 ***
ADG: Average Daily Gain 1** P<0.01; ***P<0.001; S.E.M: standard error of the mean.
2% seminiferous tubules with the
most advanced stage
Conclusion HF bull calves fed a H plane of nutrition from 2 to 18 weeks of age had greater testicular seminiferous tubule
diameter and a greater percentage of seminiferous tubules with spermatogonia compared to calves fed a L plane of
nutrition.
Acknowledgements We acknowledge funding from the Irish Research Council (Project GOIPG/2013/1391) and the
Department of Agriculture, Food and the Marine (Project 11\S\116).
References
Brito, L.F., Barth, A.D., Rawlings, N.C., Wilde, R.E., Crews, D.H., Jr. Mir, P.S. and Kastelic, J.P. 2007. Domestic Animal
Endocrinology 33, 460-469
Curtis, S.K. and Amann, R.P. 1981. Journal of Animal Science 53, 1645-57
Dance, A., Thundathil, J., Wilde, R., Blondin, P. and Kastelic, J. 2015. Journal of Dairy Science 98, 987-998

007
Sero prevalence of reproductively important pathogens in beef cows on the island of Ireland M H Parr
1, P Doolan
1, F Randi
1,2, F Lively
3, M G Diskin
4, D Barrett
5, D A Kenny
1
1Teagasc, Grange, Co.Meath, Ireland,
2University College Dublin, Ireland,
3Agri-Food and Biosciences Institute,
Hillborough, Belfast, UK, 4Teagasc, Athenry, Co.Galway, Ireland,
5Department of Agriculture, Food and Marine,
Co.Sligo, Ireland
Application Sero prevalence of reproductively important pathogens such as leptospirosis, bovine viral-diarrhoea, infectious
bovine rhinotracheitis and neosporosis were determined for the first time in beef cows on the island of Ireland.
Introduction Numerous bacterial, viral and protozoan pathogens have been associated with poor fertility and abortion in
cattle. Leptospirosis (hardjo-bovis and -prajitno genotypes), bovine viral-diarrhoea (caused by bovine viral-diarrhoea virus;
BVDV), infectious bovine rhinotracheitis (IBR) (caused by bovine herpesvirus-1) and neosporosis (caused by Neospora
caninum) are all transmissible diseases that are considered to be of economic importance in the international trade of
animals and animal products. Each of these pathogens can lead to clinical disease that can have both direct and indirect
effects on productive (Tiwari et al., 2007) and reproductive (Van Leeuwen et al., 2010) efficiency. Therefore the aim of the
study was to quantify the sero prevalence of the above listed pathogens in both vaccinated and non-vaccinated herds across
the island of Ireland.
Material and methods In the months of May through August of 2014 and 2015, a total of 5554 cows from 155 spring
calving suckler cow herds across the island of Ireland were blood sampled to measure the sero-prevalence of the above
diseases. All cows were body condition scored (BCS) and were blood sampled from a coccygeal vessel with serum and
plasma stored until subsequent laboratory analyses. All serum samples were tested for antibodies against the above listed
pathogens using commercially available diagnostic tests at the Department of Agriculture, Food and Marine in the Republic
of Ireland. Additionally a short questionnaire was carried with the herd owners to determine if cows were routinely, or had
been previously vaccinated for leptospirosis, BVDV or IBR. There are currently no vaccines available for neosporosis in
Ireland or Northern Ireland.
Results Percentage sero prevalence of leptospirosis, BVDV and IBR in both vaccinated and non-vaccinated suckler cow
herds sampled across the island of Ireland are shown in Table 1. Sero prevalence of leptospirosis, BVDV and IBR was
88%, 92% and 33% respectively in vaccinated herds. Sero prevalence of leptospirosis, BVDV and IBR was 71%, 78% and
44% respectively in non-vaccinated herds. Sero prevalence of neosporosis was 5% (289/5554) with a within-herd
prevalence range of between 0 – 29%. Mean BCS ± s.e.m was 2.57 ± 0.01 for all cows sampled.
Conclusion The results from this study indicate, for the first time, the sero prevalence to leptospirosis, BVDV, IBR, and
neosporosis in both vaccinated and non-vaccinated beef cow herds on the island of Ireland. Further investigation will be
required to determine the effect of these pathogens on reproductive and performance measures in these herds.
Table 1 Percentage sero prevalence of leptospirosis, Bovine viral-diarrhoea (BVDV) and infectious bovine rhinotracheitis
(IBR) in both vaccinated and non-vaccinated herds
Acknowledgements We gratefully acknowledge support from the Department of Agriculture, Food and the Marine under
the Research Stimulus Fund (Project 13/S/515)
References
Tiwari, A., Van Leeuwen, J. A., Dohoo, I. R., Keefe, G. P., Haddad, J. P., Tremblay R., Scott, H. M., Whiting T. 2007.
Journal of Dairy Science, 659-669
Van Leeuwen, J.A., Haddad, J.P., Dohoo, I.R., Keefe, G.P., Tiwari, A, Tremblay R. 2010. Preventative Veterinary
Medicine, 54-64
Pathogen Sero-
prevalence
%
No. of herds
Vaccinated
Within - herd
Range
%
Sero-prevalence
%
No. of herds
Non-
vaccinated
Within-herd
Range
%
Leptospirosis 88%
(2685/3041)
76 0-100% 71%
(1779/2513)
79 0–100%
BVDV 92%
(2134/2314)
54 43-100% 78%
(2518/3240)
101 0-100%
IBR 33%
(454/1380)
27 0–84% 44%
(1847/4174)
128 0–100%
008
Bovine viral diarrhoea virus infection alters uterine prostaglandin profiles and inhibits
interferon tau initiated pregnancy recognition in cows Z Cheng
1, R Ellis
1, A Abudureyimu
2, F C Oguejiofor
1, D C Wathes
1
1Royal Veterinary College, Hertfordshire, UK,
2Life Science and Engineering College, Northwest University for
Nationalities, Lanzhou, China
Application A high rate of early embryonic mortality leads to poor fertility in lactating dairy cows, which is, at least in
part, due to failed pregnancy recognition (PR). The situation is even worse if the cows are infected with the bovine viral
diarrhoea virus (BVDV), which is currently highly prevalent in the UK dairy population. Understanding the mechanisms
how BVDV interrupts PR will help prevent PR failure.
Introduction Poor reproductive performance, of which early embryonic mortality is a major component, causes significant
economic loss to the dairy industry. Embryonic mortality rates in cattle can be as high as 40%, with 70-80% of losses
occurring before day 16 of gestation (Diskin et al. 2011). Evidence has shown that early embryonic mortality in cows can
be caused by failed PR and BVDV infection (Grooms 2014). Prostaglandins (PG) play important roles in many
reproductive processes, including luteolysis, pregnancy recognition and implantation. The aims of the present study were to
investigate the effect of BVDV infection on uterine PG production and PR using an in vitro endometrial PR model.
Material and methods Fresh and apparently healthy uteri from 10 BVDV free cows in the early luteal phase of the
oestrous cycle were collected at the local abattoir. Uterine endometrial cells (a mixture of primary epithelial and stromal
cells) were isolated and cultured and half the cultures were infected with non-cytopathic BVDV (ncpBVDV) for 4 days
following the methods described previously (Oguejiofor et al. 2015). Four days after infection the cells were treated with 0
or 100 ng/ml interferon-tau (IFNT) for 24 h. PGF2α and PGE2 concentrations in the spent medium were measured using
radioimmunoassays. Data were expressed as mean ± SE. Statistical analysis was carried out using analysis of variance with
repeated measure via a linear mixed effect model built in SPSS version 23.
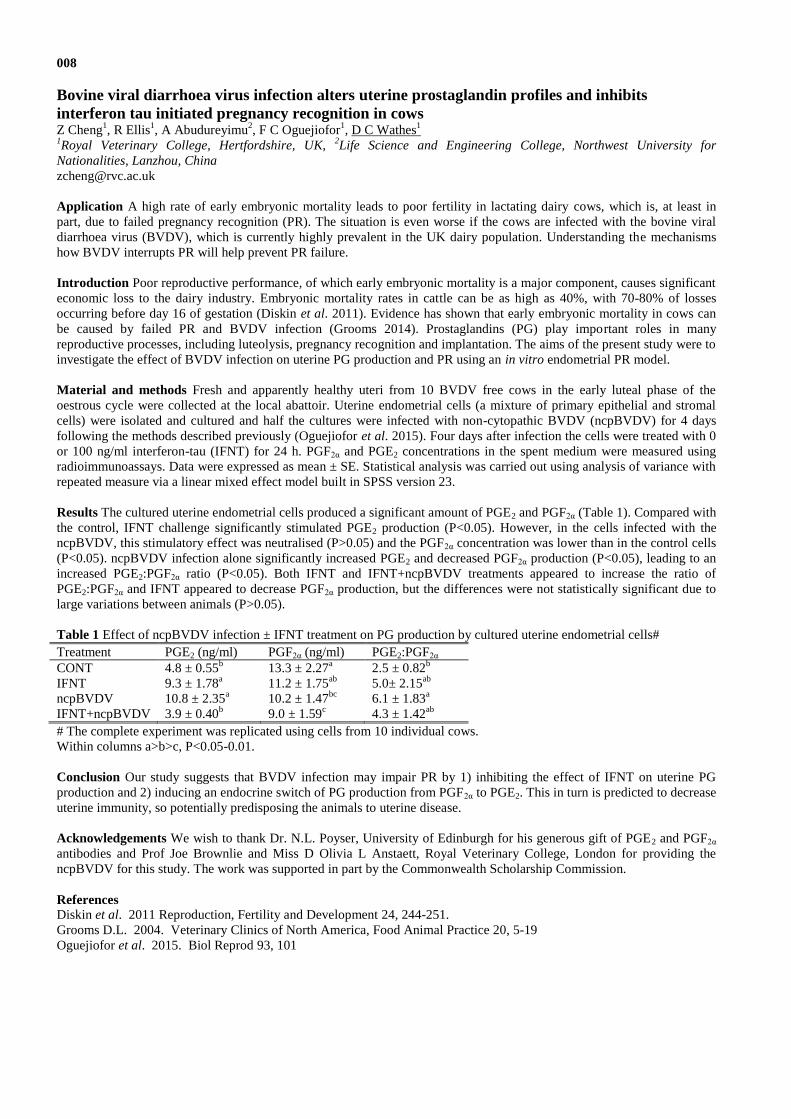
Results The cultured uterine endometrial cells produced a significant amount of PGE2 and PGF2α (Table 1). Compared with
the control, IFNT challenge significantly stimulated PGE2 production (P<0.05). However, in the cells infected with the
ncpBVDV, this stimulatory effect was neutralised (P>0.05) and the PGF2α concentration was lower than in the control cells
(P<0.05). ncpBVDV infection alone significantly increased PGE2 and decreased PGF2α production (P<0.05), leading to an
increased PGE2:PGF2α ratio (P<0.05). Both IFNT and IFNT+ncpBVDV treatments appeared to increase the ratio of
PGE2:PGF2α and IFNT appeared to decrease PGF2α production, but the differences were not statistically significant due to
large variations between animals (P>0.05).
Table 1 Effect of ncpBVDV infection ± IFNT treatment on PG production by cultured uterine endometrial cells#
Treatment PGE2 (ng/ml) PGF2α (ng/ml) PGE2:PGF2α
CONT 4.8 ± 0.55b 13.3 ± 2.27
a 2.5 ± 0.82
b
IFNT 9.3 ± 1.78a 11.2 ± 1.75
ab 5.0± 2.15
ab
ncpBVDV 10.8 ± 2.35a 10.2 ± 1.47
bc 6.1 ± 1.83
a
IFNT+ncpBVDV 3.9 ± 0.40b 9.0 ± 1.59
c 4.3 ± 1.42
ab
# The complete experiment was replicated using cells from 10 individual cows.
Within columns a>b>c, P<0.05-0.01.
Conclusion Our study suggests that BVDV infection may impair PR by 1) inhibiting the effect of IFNT on uterine PG
production and 2) inducing an endocrine switch of PG production from PGF2α to PGE2. This in turn is predicted to decrease
uterine immunity, so potentially predisposing the animals to uterine disease.
Acknowledgements We wish to thank Dr. N.L. Poyser, University of Edinburgh for his generous gift of PGE2 and PGF2α
antibodies and Prof Joe Brownlie and Miss D Olivia L Anstaett, Royal Veterinary College, London for providing the
ncpBVDV for this study. The work was supported in part by the Commonwealth Scholarship Commission.
References
Diskin et al. 2011 Reproduction, Fertility and Development 24, 244-251.
Grooms D.L. 2004. Veterinary Clinics of North America, Food Animal Practice 20, 5-19
Oguejiofor et al. 2015. Biol Reprod 93, 101

009
Interaction of preimplantation factor with the bovine global endometrial transcriptome R E Clamp
1, C Creevey
1, M Natoli
1, E R Barnea
2,3, D Nash
1, M T Rose
1
1IBERS, Aberystwyth University, Ceredigion, UK,
2SIEP The Society for the Investigation of Early Pregnancy, Cherry Hill,
New Jersey, USA, 3BioIncept LLC, Cherry Hill, New Jersey, USA
Application This is the first study to show that preimplantation factor (PIF) interacts with the bovine endometrial
transcriptome, paving the way for future research to investigate the importance of PIF in bovine pregnancy.
Introduction Preimplantation factor (PIF) is a novel peptide secreted from viable embryos as early as the 2 cell stage.
Synthetic PIF (sPIF) has been shown to interact with human endometrial stromal cells in culture through three distinct
pathways relating to the implantation and acceptance of the embryo by the maternal immune system (Paidas et al., 2010).
There is limited knowledge related to bovine PIF, although it has been determined that the peptide is secreted by viable
embryos and detectable in maternal serum (Ramu et al., 2013; Stamatkin et al., 2011). The present preliminary study aimed
to improve the current knowledge on the interaction of sPIF with the bovine endometrium through RNA-sequencing.
Material and methods Endometrium from bovine heifer uteri (n=4), in the follicular stage of the oestrous cycle, were
sampled and intercaruncular tissue explants from each replicate were cultured with or without sPIF (100 nM) for 24 hours.
Medium was replaced with fresh medium containing sPIF (100 nM) for a further 6 hours. At the end of the incubation,
tissue was stored in RNA later and total RNA subsequently extracted and quality assessed. Extracted RNA that was of a
suitable quality was subjected to library preparation for RNA sequencing on the Illumina HiSeq 2500 platform. Following
sequencing, a previously described data analysis workflow was adapted for the sample set to determine differentially
expressed genes (DEG) and biological pathways modulated by sPIF treatment (McCabe et al., 2012). A p-adjusted value of
less than 0.1 was used to determine statistically significant differential expression in the transcript data set.
Results A total of 60 DEG were identified, with 16 down-regulated and 44 up-regulated following treatment with sPIF;
however, none showed greater than 2 fold change in expression. There was a strong influence of animal replicates on the
data variance, with the native gene expression differing between animals. sPIF treatment up-regulated several genes shown
to be important in the endometrium, such as OXTR (oxytocin receptor); PTGER2 (prostaglandin E receptor 2) and IL6R
(IL-6 receptor). Furthermore, LEF1 (lymphoid enhancer-binding factor 1) and ITGA2 (integrin alpha-2), shown to be up-
regulated in human endometrium following sPIF treatment were also upregulated in the bovine samples. Six biological
pathways were over represented in the set of DEG following sPIF treatment (P<0.01) such as the ‘Immunoregulatory
interactions between a lymphoid and a non-lymphoid cell’. The KEGG pathway ‘Biosynthesis of unsaturated fatty acids’
was also over represented following sPIF treatment, through upregulation of genes coding for the enzymes fatty acid
desaturase 1 and 2.
Conclusion This preliminary study showed that sPIF interacts with the bovine endometrial transcriptome, although the
response appears to be relatively weak compared to that identified in humans. Bovine homologs of genes altered by sPIF in
the human endometrium were upregulated, however only 2 genes of the 60 DEGs were in that set. The tissue used in the
present study was non decidualized endometrial tissue, sPIF may have a greater effect on the pregnancy primed bovine
endometrium and future work will reveal if it may show a more similar response to that observed in human studies.
Acknowledgements The authors gratefully acknowledge Aberystwyth University for DCDS studentship funding and
Randall Parker Foods for sample collection.
References
McCabe, M., Waters, S., Morris, D., Kenny, D., Lynn, D. and Creevey, C. 2012. BMC Genomics 13, 193.
Paidas, M. J., Krikun, G., Huang, S. J., Jones, R., Romano, M., Annunziato, J. and Barnea, E. R. 2010. American Journal of
Obstetrics and Gynecology 202, 459 e1-8.
Ramu, S., Stamatkin, C., Timms, L., Ruble, M., Roussev, R.G. and Barnea, E.R. (2013). Reproductive Biology and
Endocrinology 11, 105.
Stamatkin, C. W., Roussev, R. G., Stout, M., Absalon-Medina, V., Ramu, S., Goodman, C., Coulam, C. B., Gilbert, R. O.,
Godke, R. A. and Barnea, E. R. 2011. Reproductive Biology and Endocrinology 9, 63.

010
The effect of dietary omega-6 and omega-3 fatty acid supplementation on semen volume and
quality in young post-pubertal dairy bulls C Byrne
1, A-M English
1,3, S Fair
3, P Lonergan
2, D A Kenny
1
1Animal & Grassland Research and Innovation Centre, Teagasc Grange, Dunsany, Ireland,
2School of Agriculture and
Food Science, UCD, Ireland, 3Department of Life Sciences, University of Limerick, Ireland [email protected]
Application Supplementation with dietary polyunsaturated fatty acids does not lead to an improvement in gross in vitro
semen quality parameters.
Introduction Sperm utilise polyunsaturated fatty acids (PUFA), in particular n-3 and n-6 PUFA, to maintain normal cell
membrane function (Wathes et al., 2007). As ruminants lack the desaturase enzymes which allow de novo synthesis of such
fatty acids, they require dietary supplementation (Mattos et al., 2000). Recent work has shown some positive effects of
dietary supplementation of n-3 PUFA on semen quality in rams (Fair et al., 2014) and bulls (Gurler et al., 2015); however,
published data on bulls are limited. The aim of this study was to examine the effects of dietary supplementation with both
n-3 and n-6 PUFA on semen volume and aspects of semen quality in young post-pubertal dairy bulls.
Material and methods Holstein-Friesian (n=43) and Jersey (n=7) bulls with a mean ± s.e.m. age and bodyweight of 420.1
± 5.86 days and 382 ± 8.94 kg, respectively, were blocked on breed, weight, age and semen quality (motility and
concentration per ml; based on two pre-trial ejaculates) and randomly assigned to one of three diets, namely (i) a non-
supplemented control (CTL, n=15), (ii) rumen protected safflower (n-6 PUFA, n=15), or (iii) rumen-protected n-3 PUFA-
enriched fish oil (n-3 PUFA, n=20). Both fats were added at 2% of dietary dry matter (DM) and all three diets were
isonitrogenous (160g/kg crude protein). Diets included: 25% rolled barley, 20% maize, 15% soyabean, 17% beet pulp, 12%
soy hulls, 4% oil, 2% minerals, 5% molasses. Animals were housed in a slatted-floored shed and fed individually, for the
initial 6 weeks, using an electronic feeding system (Calan Inc., Northwood, New Hampshire). Animals were allowed two
weeks acclimatisation to the facility followed by ten days acclimatisation to the diets, and were then offered diets ad
libitum for 12 weeks. All animals were offered 5 kg (fresh weight) of grass silage daily. Semen was collected via electro-
ejaculation (Pulsator, Lanes, CO, USA) at weeks -2, -1, 0, 10, 11 and 12 relative to the beginning of the trial period (week
0). On collection, semen volume and progressive linear motility (PLM), assessed using a phase contrast microscope with a
heated stage, were recorded. Sperm concentration was measured using a photometer (Minitub, Germany) calibrated for
bovine semen. Semen was then diluted to 80x106 sperm per ml in Bioxcell (IMV, L'Aigle, France) and loaded into 0.25 ml
straws (IMV, L'Aigle, France). Straws were cooled gradually from room temperature to 4˚C over a period of 90 min and
allowed to equilibrate at 4˚C for 3 h. They were then frozen to -140˚C over 9 min (-15.5˚C/min) in a programmable freezer
(Planar, Birmingham, UK) followed by immersion and storage in liquid nitrogen until use. Post-thaw PLM (n=1 straw per
collection for each bull) was assessed as described earlier, after thawing by immersion into a beaker of water at 37˚C. Data
were analysed by repeated measures ANOVA (PROC MIXED, SAS, version 9.3). Fixed terms for diet and week along
with their interactions, where appropriate, were included in the model. Week was included in the analysis as a repeated
term.
Results All values represent mean ± s.e.m. Concentrate intake across the three diets did not differ with bulls on the CTL, n-
6 PUFA and n-3 PUFA diets consuming; 9.54 ± 0.37 kg, 9.54 ± 0.31 kg, 9.34 ± 0.35 kg DM respectively. The average
daily gain between diets was also similar, with CTL, n-6 PUFA, n-3 PUFA bulls gaining 1.4 ± 0.19, 1.4 ± 0.17 and 1.6 ±
0.29 kg per day, respectively. No effect of week was detected after 70 days feeding; therefore, these data (three successive
collections beginning on week 10), were pooled. There was no effect of diet (P>0.05) on semen concentration, PLM or
drop in post-thaw PLM (Table 1.). Throughout the trial period, the average volume of semen collected at each ejaculation
did not differ between diets (P>0.05).
Table 1 Effect of dietary treatment on semen volume and quality after 10 weeks feeding (average of three collections)
Treatment
CTL n-6 PUFA n-3 PUFA SEM P-value
Volume (ml) 42438 42434 42435 0.15 0.64
Concentration (x106) 1069.3 1139.3 1132.7 40.65 0.83
PLM (%) 28703 29983 28550 1.32 0.39
Drop in PLM post- thawing (%) 20.0 42513 42417 1.85 0.50
Conclusion Dietary supplementation with either n-3 or n-6 PUFA to young post-pubertal bulls had no effect on semen
volume or gross measurements of semen quality. Further investigation into post-thaw in-vitro quality parameters of sperm
from these treatment groups is on-going.
Acknowledgements We gratefully acknowledge support from the Department of Agriculture, Food and the Marine under
the Research Stimulus Fund (Project 11/S/116)
References
Fair, S. Doyle, D.N. Diskin, M.G. Hennessy, A.A., Kenny, D.A. 2014. Theriogenology 81, 210-219.
Gürler, H. Calisici, O. Calisici, D. Bollwein, H. 2015. Animal Reproduction Science 160, 97-104.
Mattos, R. Staples, C.R. Thatcher, W.W. 2000. Review of Reproduction 5 (1), 38-45.
Wathes, D.C. Abayasekara, D.R. & Aitken, J.R. 2007. Biology of Reproduction 77, 190-201.
011
The development of a UK national terminal combined breed genetic evaluation K L Moore
1, S Boon
2, K Kaseja
1
1SRUC, Bush Estate, UK,
2Signet Breeding Services, Kenilworth, UK
Application The development of a UK terminal combined breed genetic evaluation (CBGE) will enable, for the first time,
accurate genetic evaluations for cross bred animals. In addition, it will provide an improved service to the UK sheep
industry allowing more frequent genetic evaluations. Both these aspects will help to engage farmers, resulting in increased
use of Estimated Breeding values (EBVs) and ultimately improving the genetic progress of the UK sheep industry.
Introduction UK genetic evaluations of sheep have traditionally been undertaken within breeds. However, the UK sheep
industry is a mostly stratified system with approximately 56% of ewes in the national flock being crossbred. This represents
a 6% increase in the past decade (Pollott et al (2012); Pollott and Stone (2003)). This shift has also been noticed in the rams
that are used in the national flock. The recent sheep census found that 5% of rams used in the national flock were crossbred.
Increasingly, breeders are incorporating crossbred sheep into genetic improvement systems, and it is then not surprising
that requests for combined breed EBVs from these cross-breeding flocks have also increased. CBGE allows multiple breeds
of sheep to be evaluated simultaneously and animals from different breeds to be compared directly via the resulting EBVs.
The benefits of CBGE are that they can accelerate genetic improvement as they increase the accuracy of EBVs (more data
is included in the analysis) and allow more intense selection (as the gene-pool to select the next generation can be
substantially widened as a result of CBGE and the increased EBV accuracy). Rates of genetic improvement can also be
increased indirectly by the ability to provide a more efficient service. At the moment, genetic evaluations are run 3-4 times
a year for individual breeds. In a combined-breed scenario only 1 genetic evaluation is required to service many breeds.
Therefore, it will be possible to provide up-to-date genetic evaluations more frequently, meaning that breeders always have
up-to-date information when they are making their selection decisions. This will help to engage more farmers in
performance recording and result in farmers making better use of EBVs, ultimately improving the genetic progress of the
national sheep industry.
Material and methods To enable CBGE accurate knowledge of the breed make up is required and full details of this are
reported in Kaseja et al (2016). The biggest changes to the genetic evaluation system were genetic groups, genetic
parameters and the inclusion of heterosis and recombination coefficients to account for hybrid vigour. Previously genetic
groups were defined based on gender and year of birth, and varied depending on the breed. In the new system a breed
element was incorporated to allow animals of different breeds to be separated. Initially, the genetic group definitions have
remained the same as those used in the within breed evaluations. Previously each within breed evaluation had their own set
of genetic parameters, however in the CBGE we can only use one set of parameters and a ‘best-fit’set of parameters was
determined after considering the individual parameters from the within breed evaluations and phenotypes scaled based on
the different phenotypic variances. As heterosis/recombination coefficients between all breeds are impractical for
computational reasons, two approaches are being considered. The first is to group individual breeds into 3 breed types;
European terminal, British terminal and non-terminal, and estimate coefficients for the different breed type combinations.
The second is to determine the coefficients on an individual breed basis, but assume the heterosis/recombination effects are
the same regardless of breed, and sum the coefficients into a single term.
Results Twelve common terminal breeds were combined to make up the terminal CBGE; Texel, Suffolk, Charollais,
Meatlinc, Hampshire Down, Beltex, Dorset, Shropshire, Blue Texel, Blue du Maine, Vendeen and Southdown. The
terminal CBGE runs in approximately 22 hours from extraction, to analysis and then post processing ready for publication.
Given it would take approximately 48 hours to run all 12 breeds individually, this represents a saving of 104 hours in a
year, assuming all breeds are run 4 times a year. This can result in an extra 4-5 CBGE in the year without using any more
resources. Initial quality assurance of the results produced from the terminal CBGE has shown between 0.7-0.95%
correlation in EBVs when comparing purebred animals, although the most benefit will come from having EBVs for cross
bred animals which were previously unavailable.
Conclusion The system for CBGE has been developed and it is planned to run the within and combined breed systems in
parallel in 2016 before fully implementing the CBGE for terminal breeds in 2017.
Acknowledgements The authors gratefully acknowledge AHDB Beef and Lamb for funding and Signet performance
recording for the use of the data.
References
Kaseja, K., Boon S. Moore, K.L. 2016. Advances in Animal Biosciences 7(1), 13.
Pollott G. et al 2012. AHDB report
Pollott, G.E and Stone 2003. DEFRA report
012
Gene pool fishing by out-crossing and back-crossing cycles to accelerate genetic improvement in
carcass traits of sheep L Bunger
1, G Fell
2, K McLean
1, J Gordon
1, K L Moore
1, N R Lambe
1
1SRUC, Edinburgh, UK,
2MeatLinc, West Grange, Thorganby, York, UK
Application The enormous potential of outcrossing and composite breeding is currently mostly unused in the UK sheep
industry, largely due to the shackles of breeding society rules. However, its exploitation could have a large impact on the
economy of the UK sheep industry, as it brings the best of breeds together, increases genetic variance and heterozygosity
and thereby accelerates genetic progress. This project is a blueprint and a cost-efficient demonstration for employing
genetic progress made in other breeds to further enhance the performance of a developed terminal sire breed on a
reasonable budget.
Introduction There are ~90 recognised breeds of sheep in the UK (Pollott, 2014), which represent a vast gene pool. The
wide genetic variation between breeds is largely under-exploited. Improvements in the productivity of sheep are needed,
and out-crossing using composite breeding provides solutions with a large impact, bringing the best of breeds together,
increasing genetic variance and heterozygosity and accelerating genetic progress. The UK’s many sheep breeds and their
variation allows the introduction of valuable alleles from one breed into another (target breed) where these alleles do not
segregate or do so at very low frequencies. This can be done using molecular genetic methods, e.g. marker assisted
selection. However, this is usually expensive and requires knowledge of the trait relevant genes/QTL. Also, there are too
few known genes and these explain only small proportions of the genetic variance, a situation that will not change in the
next few years by the use of SNP chips or sequencing. A cost effective approach to improve a target breed using unknown
genes is using a system of out-crossing followed by backcrossing (to re-establish the typical breed characteristics), whilst
keeping useful alleles from the ‘donor’ breeds. The main focus in terminal sire (TS) breeds is on muscle growth and -shape.
Material and methods An open composite breeding system with outcrossing to Charollais (CH) and Texels (TX) followed
by repeated backcrossing has been used to further develop a terminal sire breed (MeatLinc, ML) to become superior to
other TS Breeds. This genetic approach, paired with the exploitation of computer tomography (CT), will retain the newly
captured muscling alleles. Additional CT traits (not presently available as selection traits via SIGNET) for TS, e.g.
muscling, spine traits, killing out % and lean meat %) have also been measured on all male selection candidates, with the
potential to include these traits in future selection. The initial outcross (F1), was followed by a cross of the two crossbred
types (F2, MLxTX and MLxCH), an inter-se mating between these (F3) and a backcross to ML ewes (F4, lambs born
2015). All available ram lambs (n=43; expected gene contribution 75% ML, 12.5% TX, 12.5% CH) were scanned
ultrasonically and using CT at about 132d and 155d, respectively. To shorten the generation interval in the newML line,
ewe lambs and ram lambs were used for breeding. In 2015, in both the new and oldML lines, mature ML ewes served as
mothers, allowing a initial comparison, which was somewhat restricted, since ram lambs from the oldML were strongly pre-
selected to go forward to CT scanning, whereas all available ram lambs from the newML were used. ProcGLM from SAS
was used for the statistical analysis. Data were adjusted for live weight.
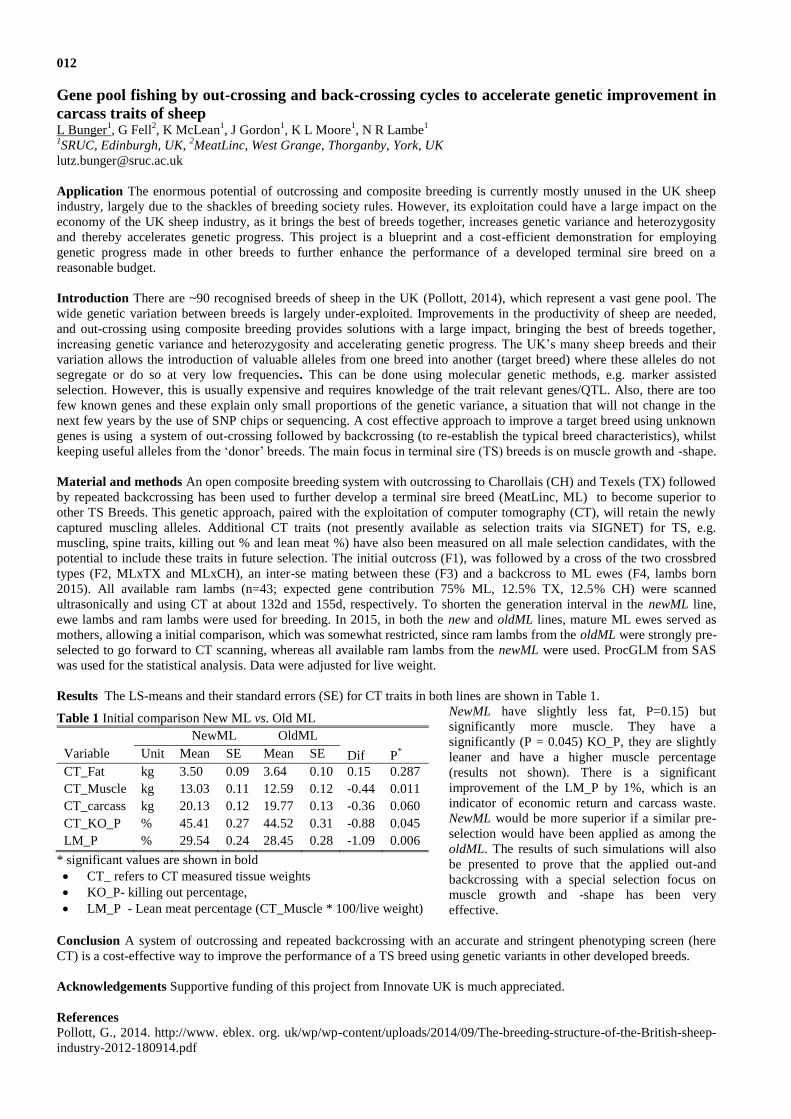
Results The LS-means and their standard errors (SE) for CT traits in both lines are shown in Table 1.
NewML have slightly less fat, P=0.15) but
significantly more muscle. They have a
significantly (P = 0.045) KO_P, they are slightly
leaner and have a higher muscle percentage
(results not shown). There is a significant
improvement of the LM_P by 1%, which is an
indicator of economic return and carcass waste.
NewML would be more superior if a similar pre-
selection would have been applied as among the
oldML. The results of such simulations will also
be presented to prove that the applied out-and
backcrossing with a special selection focus on
muscle growth and -shape has been very
effective.
Conclusion A system of outcrossing and repeated backcrossing with an accurate and stringent phenotyping screen (here
CT) is a cost-effective way to improve the performance of a TS breed using genetic variants in other developed breeds.
Acknowledgements Supportive funding of this project from Innovate UK is much appreciated.
References
Pollott, G., 2014. http://www. eblex. org. uk/wp/wp-content/uploads/2014/09/The-breeding-structure-of-the-British-sheep-
industry-2012-180914.pdf
Table 1 Initial comparison New ML vs. Old ML
NewML OldML
Dif P* Variable Unit Mean SE Mean SE
CT_Fat kg 3.50 0.09 3.64 0.10 0.15 0.287
CT_Muscle kg 13.03 0.11 12.59 0.12 -0.44 0.011
CT_carcass kg 20.13 0.12 19.77 0.13 -0.36 0.060
CT_KO_P % 45.41 0.27 44.52 0.31 -0.88 0.045
LM_P % 29.54 0.24 28.45 0.28 -1.09 0.006
* significant values are shown in bold
CT_ refers to CT measured tissue weights
KO_P- killing out percentage,
LM_P - Lean meat percentage (CT_Muscle * 100/live weight)

013
Determining accurate proportion of breed make up of UK sheep to enable combined breed
genetic evaluations K Kaseja
1, S Boon
2, K L Moore
1
1SRUC, Bush estate, UK,
2Signet Breeding Services, Kenilworth, UK
Implications Creating the Proportion of Breed (PEB) value for each sheep allows to calculate accurate EBVs (Estimated
Breeding Values) from a terminal combined breed genetic evaluation, which will satisfy the increasing appetite for
combined breed evaluations as a result of the increasing levels of cross breeding in the UK sheep industry.
Introduction The UK sheep industry has a stratified structure with specific breed types and crosses; i.e. hill breeds in the
uplands and terminal breeds in the lowlands. Pollott (2012) reported that the amount of cross breeding is increasing
indicating that about 56% of all ewes in the national UK flock were crossbred. This along with increased pressure from
breeders who performance record has meant that development of a combined breed analysis is required for the national
genetic evaluations. In order to provide a national combined breed evaluations accurate knowledge of the breed makeup is
required to enable heterosis and recombination coefficients to be calculated and fitted in the model, resulting accurate
EBVs of cross bred animals.
Material and methods The UK National genetic evaluation system for sheep has traditionally been undertaken on a within
breed basis. A fundamental step to produce EBVs for the combined breed genetic evaluation is correct knowledge of the
animals breed make up. Currently, in the BASCO (Beef and Sheep Company) database, an animals breed is recorded as
‘breed 16ths’ and can include up to 4 different breeds. The composition of all 4 breeds must sum up to 16. This record is
not suitable for the combined breed analysis as it does not allow precise recording of the breed make up or allow additional
breeds as animals become increasingly crossbred. Consequently, EGENES created a system to calculate a PEB value for
every animal. The PEB values sum to 100% and currently contains between 1 (for pure breed animals) and up to 12
(although more is possible) different breeds for each animal. The procedure of obtaining the PEB values is fully automated,
with the values calculated each day as a part of a snapshot taken from the BASCO database. PEB are obtained by a cycle of
iterations starting with the oldest animals iterating to the youngest, where at the end all animals have a PEB value. For all
animals the PEB is calculated as half the PEB of the sire + half the PEB of the genetic dam. However, where both or one
parents are not known some assumptions are applied. If both parents are unknown, then providing a valid breed 16th is
supplied then the PEB will be based on the breed 16ths, alternatively the animal will be assumed to be 100% of the breed
code associated with that animal. In the case on one parent known and the other unknown, then again the breed 16th
value
of the animal, if valid, will be adjusted to subtract the PEB of the known parent and then used to determine the breed of the
unknown parent. For example, if the breed 16th is 8 Suffolk and 8 Texel, the animal is a Suffolk*Texel cross, if the known
parent has a PEB of 100% Texel then we can deduce that the unknown parent must have been 100% Suffolk. Alternatively
if the breed 16th
is not available, then the unknown parent is assumed to be 100% of the breed code associated with the
animal.
Results Considering performance recorded animals born 2010-2014, the
largest purebred (PEB>87.5% of breed) terminal breeds were Texel, Suffolk,
Charollais and Hampshire Down with 49%, 20%, 17% and 4% of purebred
animals recorded in BASCO coming from these breeds, respectively. The
remaining 10% of purebred terminal animals came from 13 other breeds.
Animals were assumed to be a terminal first cross if the PEB were
approximately 50:50%. The most numerous first crosses are shown in Table
1. As can be seen, majority of 1st cross animals are Texel*Charollais and
Texel*Suffolk, namely the crosses between the biggest recorded breeds. A
further 21% of first cross terminal animals are included in a further 58 first
cross combinations indicating the large diversity of cross breeds in the UK sheep industry.
Conclusion The breed make up in the current national sheep population support the need for combined breed genetic
evaluations. This new method of determining PEB will provide more accurate EBVs and enable better selection decisions
to be made when choosing crosses and the animals mated for crossing. Moreover, the frequency of evaluations could
increase from 3-4 per breed per season to monthly for all recorded animals, which undoubtedly will be the benefit to all
breeders.
Acknowledgements The authors gratefully acknowledge AHDB Beef and Lamb for funding and Signet performance
recording for the use of the data.
References Pollott G. et al 2012. The breeding structure of the British sheep industry
Table 1 Percentage of 1st cross animals
BreedA BreedB % of total
Texel Charollais 27
Texel Suffolk 21
Suffolk Charollais 8
Texel Shropshire 5
Suffolk Dorset Down 5
Oxford Down Oldenburg 4
Meatlinc Ile De France 3
014
A comparison of the reproductive performance of Lleyn and Scottish Blackface ewes mated to
same-breed rams and managed together post-mating in a Scottish hill farm P Zhou
1,2, N Sargison
2, N R Lambe
1, C Morgan-Davies
1, T McEvoy
1
1SRUC, Edinburgh, UK,
2University of Edinburgh, UK
Application The aim of this work is to investigate breed substitution versus breed improvement in a hill sheep system.
Lleyn ewes producing pure-bred Lleyn lambs could potentially improve output and profitability of hill sheep enterprises.
Introduction One of the major constraints of hill sheep breeds such as the Scottish Blackface (BF), is low productivity,
and most hill sheep farming systems are not financially viable without support. Lleyn sheep, a more prolific
lowland/upland breed, might improve output and profitability of hill sheep enterprises. However, harsh hill environments
and poor nutritional supply in such conditions could compromise their reproductive performance, leading to high barren
rates and low lamb birth weights, the latter a key factor for lamb survival (Dwyer, 2008). The aim of the current study was
to investigate the effects of a harsh hill environment on the reproductive performance of Lleyn ewes, comparing lambing
outcomes with those of BF sheep (2 lines) in the same environment.
Material and methods This 2014-2015 study was part of an ongoing project at SRUC’s Hill & Mountain Research Centre
(56⁰N, 4⁰W; elevation: 200 to 1025 m; mean annual rainfall: 2528 mm). The flock comprised approximately 150 control
line BF ewes, 150 selection line BF ewes (Conington et al., 2006) and 150 Lleyn ewes. One management system was
applied to all ewes, with winter feeding levels tailored to individual weight changes. Lleyn x Lleyn & within-line BF x BF
mating was from mid-November for two oestrous cycles; ewes were ultrasound-scanned in mid-February and ewe live
weights (LWT) and body condition scores (BCS) recorded pre-mating and at scanning. Two supplementary feeding levels
(low/high) were applied from January 8th
to lambing, initially on the basis of LWT change (versus a target LWT change
adjusted for pre-mating LWT and BCS) and, after scanning, number of foetuses carried. Lambing data recorded included
litter size and weight, lamb weight and gender. Data analysis used a Generalized Linear Model (GenStat 16; VSNi). Terms
in the model for analysis of ewe litter weight data were genotype, ewe scanning LWT, feeding level and ewe age.
Results Barren rates among control BF, selection BF and Lleyn ewes were proportionately 0.17, 0.12 and 0.06,
respectively. Among ewes lambing, control BF had the highest incidence of singletons (0.60) while selection BF had the
highest incidence of twins (0.54). Litter weights, as recorded, are in Table 1. In the analysis, litter weight was influenced by
ewe genotype (P<0.001), ewe age (P=0.016) and post-scanning feed level (P<0.001). Litter weight was positively
associated with LWT at scanning (P<0.001). Of lambs born to control BF, selection BF and Lleyn ewes, proportionately
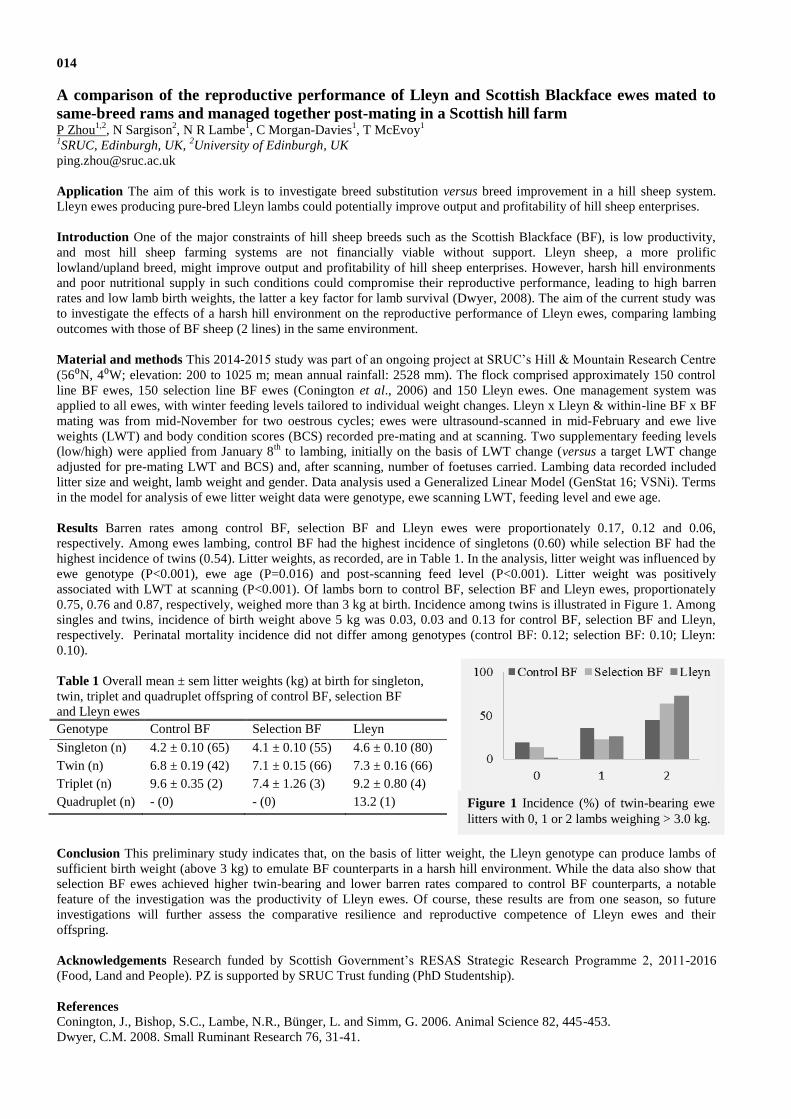
0.75, 0.76 and 0.87, respectively, weighed more than 3 kg at birth. Incidence among twins is illustrated in Figure 1. Among
singles and twins, incidence of birth weight above 5 kg was 0.03, 0.03 and 0.13 for control BF, selection BF and Lleyn,
respectively. Perinatal mortality incidence did not differ among genotypes (control BF: 0.12; selection BF: 0.10; Lleyn:
0.10).
Table 1 Overall mean ± sem litter weights (kg) at birth for singleton,
twin, triplet and quadruplet offspring of control BF, selection BF
and Lleyn ewes
Genotype Control BF Selection BF Lleyn
Singleton (n) 4.2 ± 0.10 (65) 4.1 ± 0.10 (55) 4.6 ± 0.10 (80)
Twin (n) 6.8 ± 0.19 (42) 7.1 ± 0.15 (66) 7.3 ± 0.16 (66)
Triplet (n) 9.6 ± 0.35 (2) 7.4 ± 1.26 (3) 9.2 ± 0.80 (4)
Quadruplet (n) - (0) - (0) 13.2 (1)
Conclusion This preliminary study indicates that, on the basis of litter weight, the Lleyn genotype can produce lambs of
sufficient birth weight (above 3 kg) to emulate BF counterparts in a harsh hill environment. While the data also show that
selection BF ewes achieved higher twin-bearing and lower barren rates compared to control BF counterparts, a notable
feature of the investigation was the productivity of Lleyn ewes. Of course, these results are from one season, so future
investigations will further assess the comparative resilience and reproductive competence of Lleyn ewes and their
offspring.
Acknowledgements Research funded by Scottish Government’s RESAS Strategic Research Programme 2, 2011-2016
(Food, Land and People). PZ is supported by SRUC Trust funding (PhD Studentship).
References Conington, J., Bishop, S.C., Lambe, N.R., Bünger, L. and Simm, G. 2006. Animal Science 82, 445-453.
Dwyer, C.M. 2008. Small Ruminant Research 76, 31-41.
Figure 1 Incidence (%) of twin-bearing ewe
litters with 0, 1 or 2 lambs weighing > 3.0 kg.

015
Investigating the measurement of feed efficiency in sheep N R Lambe, L Bunger, J Conington, K L Moore, M P Coffey
SRUC, Edinburgh, UK
Application Recording feed intake in sheep could enable feed efficiency to be included as a goal in UK breeding
programmes. This could lower production costs, or allow more sheep meat to be produced from a given area of land.
Introduction Sheep produce meat from grazing land that is often marginal and unsuitable for other agricultural production.
High quality grazing is limited in most systems, at least seasonally, and supplementary feed is provided at key times. Feed
and forage are the most significant costs across different UK sheep production systems. Producing sheep that use feed more
efficiently for growth and reproduction could lower feed costs, or allow more sheep to graze per hectare of land. Livestock
feed efficiency (FE) impacts on land use and methane emissions, as well as productivity and profitability. Genetic
improvements in FE are expected to help meet these challenges, but many knowledge gaps exist in the best methodology to
enable this. To allow genetic selection, genetic parameters must be estimated in a relevant breed. However, there is no
current method to measure individual feed intake at pasture with sufficient accuracy for use in a breeding programme.
Technological advances in electronic identification of animals and computer-controlled feeding equipment present an
opportunity to measure individual feed intake during performance trials in growing lambs. However, the best methodology
to use such equipment to allow full expression of feeding behaviour in sheep should be investigated in a relevant system
and breed. Relationships with feed intake on pasture and feed intake in mature ewes should also be examined. The
objective of this study was to investigate the best way to record feed efficiency in sheep for use in future genetic selection.
Material and methods A desk-based review was undertaken, to assess available technical solutions and methodological
approaches to measure and select for FE in sheep. A literature review on FE in sheep (and beef cattle) was produced,
concentrating on the use of automated feeders to record feed intake. Other information sources included reports from visits
by academic and industry representatives to relevant companies in the USA and Netherlands, and e-mail communications
with a research group in New Zealand that is designing a similar experiment in a maternal sheep breed. The resulting
review summarised current knowledge and published research, considering installation of recording equipment, recording
of feed intake and related traits, and incorporation of FE into a sheep breeding programme.
Results Evidence exists in the literature of variation in FE traits
in sheep (Table 1). Moderate heritabilities have been estimated
for FE traits in growing sheep (Pulina et al., 2013), as in cattle.
Methodological recommendations for using automated feeders
to record lamb feed intake include: 9-11 lambs/feeder; 1-2 week
adaptation period; 6-8 weeks on test; a forage-based diet. This
information could provide a relevant starting point for UK
trials. To incorporate FE into a breeding programme, individual
feed intake records would be required from 1000-2000 animals
at the same stage of development, for robust genetic parameter
estimation. Selection for (residual) feed intake should only be
Table 1 On-test differences between groups of growing
lambs identified as high or low for residual feed intake
(RFI)
Study Feed intake Live weight
gain
Redden et al. 2013 17% NS
Cockram et al. 2013 30% NS
Johnson et al. 2015 20% NS
NS = not significantly different (P>0.05)
considered as part of a multi-trait selection index, since evidence suggests that selection for FE could reduce fatness and
may delay maturity. Findings from cattle studies suggest that selection for FE in young growing animals (using automated
feeders and a pelleted diet) affects growth and FE on pasture and FE of mature females (Herd et al., 1998).
Conclusion Potential exists to record feed efficiency in individual sheep. Metrological research is required to refine feed
intake measurement methods, to allow FE to be assessed in sufficiently powerful samples of relevant UK sheep breeds
from grass-based systems. Genetic relationships with other important traits should be investigated to allow
recommendations for the incorporation of FE in UK sheep breeding programmes. This is likely to require industry-wide
collaboration.
Acknowledgements SRUC received funding from the Scottish Funding Council and Scottish Government.
References
Archer J.A., Reverter A., Herd R.M., Johnston D. and Arthur P. 2002. Proc. 7th
WCGALP, Montpellier 221-225
Cockram, R.R., Stobart, R.H., Lake, S.L. and Cammack, K.M. 2013. Small Ruminant Research 113, 313-322
Herd R.M., Richardson, E.C., Hegarty R.S., Woodgate, R., Archer J.A. and Arthur P.F. 1998. Proc. Australian Society of
Animal Production 22, 137-140
Johnson P.L., Miller S.P. and Knowler K. 2015. Proc. AAABG, Lorne, Victoria, Australia
Pulina G., Avondo M., Molle G., Francesconi A., Atzori A. and Cannas A. 2013. Rev. Bras. Zootecn. 42, 675-690
Redden R.R., Surber, L.M.M., Grove, A.V. and Kott, R.W. 2013. Small Ruminant Research 114, 214-219
016
Ewe body condition scoring (BCS) as a key performance indicator on commercial sheep flocks:
lamb performance to weaning N Wright
1,2, K Sinclair
2, N Kendall
2, L Stubbings
3, E Genever
1
1AHDB Beef & Lamb, Warwickshire, UK,
2The University of Nottingham, UK,
3LSSC Ltd, Northamptonshire, UK
Application Improving ewe BCS has a positive impact on the weight of weaned lamb per ewe per year.
Introduction Ewe BCS is a highly repeatable management tool farmers can use to assess flock condition at key times
during the annual production cycle. Identifying the stages of the ewe’s annual production cycle where BCS has the greatest
impact on litter size and lamb growth rate to weaning is a key objective of this research.
Material and methods This is interim data from a four year project utilising data collected from three commercial farms
(total ~3,000 ewes) in England. Ewe BCS and live weight data were collected on the farm using digital weight scales and
trained BCS assessor. Data were collected at weaning, mating, scanning, lambing (BCS only at lambing) and 8 weeks post
lambing. Lamb weights were recorded at 8 weeks post lambing and at weaning (12 weeks) on all farms and birthweight
recorded on one farm. All ewes were identified with an electronic identification tag (EID) in their ears enabling the BCS
score and weight to be linked to each ewe. Lambs were tagged with EID at birth and linked to their dams. All data were
collected and entered into an EID reader, synchronised to an EID software computer programme by Bluetooth. A summary
of the data was downloaded from the EID software programme into Excel. Data were checked and analysed for the of
effect of ewe BCS and live weight on litter size at scanning, lamb weight at 8 weeks and lamb weight at weaning using
Gentstat statistical software. Data were analysed on an annual basis (weaning to weaning) and comparisons made with
previous years’ results. At the end of the project, the four year dataset will be analysed to look at longer term trends of BCS
on lamb weight to weaning.
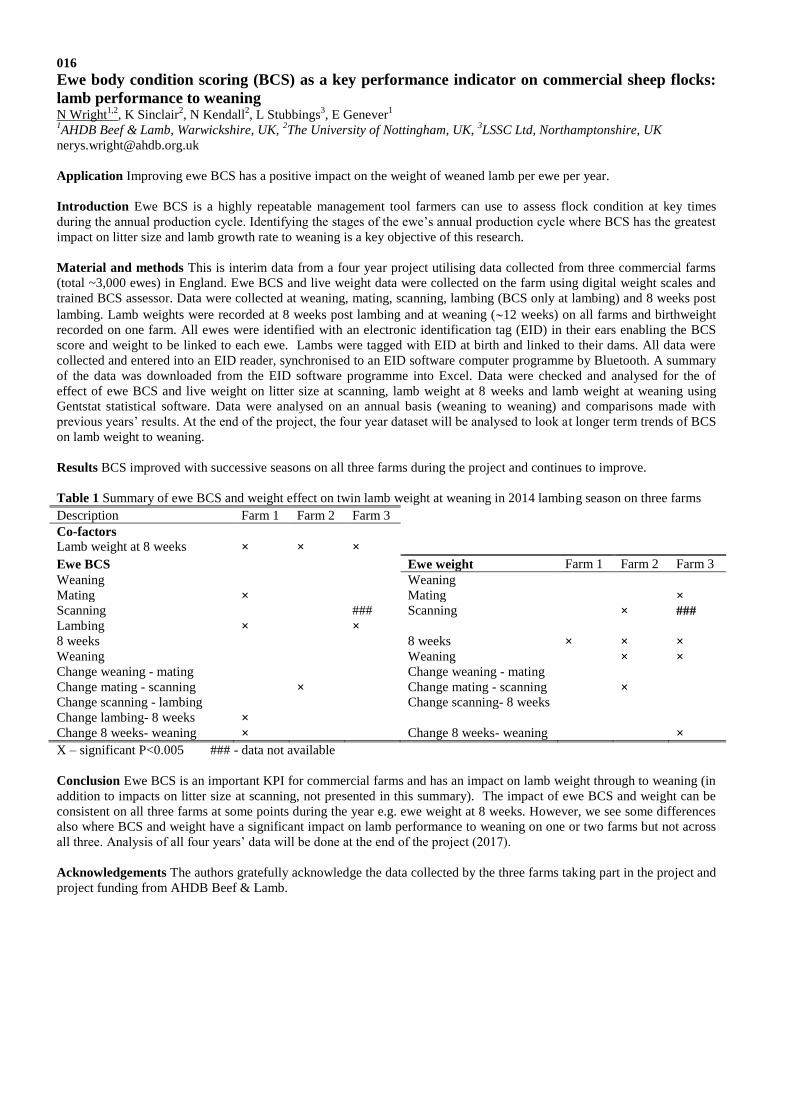
Results BCS improved with successive seasons on all three farms during the project and continues to improve.
Table 1 Summary of ewe BCS and weight effect on twin lamb weight at weaning in 2014 lambing season on three farms
Description Farm 1 Farm 2 Farm 3
Co-factors
Lamb weight at 8 weeks × × ×
Ewe BCS Ewe weight Farm 1 Farm 2 Farm 3
Weaning Weaning
Mating × Mating × Scanning ### Scanning × ### Lambing × ×
8 weeks 8 weeks × × × Weaning Weaning × × Change weaning - mating Change weaning - mating
Change mating - scanning × Change mating - scanning ×
Change scanning - lambing Change scanning- 8 weeks
Change lambing- 8 weeks ×
Change 8 weeks- weaning × Change 8 weeks- weaning ×
X – significant P<0.005 ### - data not available
Conclusion Ewe BCS is an important KPI for commercial farms and has an impact on lamb weight through to weaning (in
addition to impacts on litter size at scanning, not presented in this summary). The impact of ewe BCS and weight can be
consistent on all three farms at some points during the year e.g. ewe weight at 8 weeks. However, we see some differences
also where BCS and weight have a significant impact on lamb performance to weaning on one or two farms but not across
all three. Analysis of all four years’ data will be done at the end of the project (2017).
Acknowledgements The authors gratefully acknowledge the data collected by the three farms taking part in the project and
project funding from AHDB Beef & Lamb.

017
Effect of nutritional restriction in mid-pregnancy on the response of ewes to additional protein
supply in late-pregnancy and lactation R G Wilkinson, N Naylor, A M Mackenzie, S E Pattinson, J Donaldson
Harper Adams University, Newport, Shropshire, UK
Application Ewes with a low BCS show the greatest response to additional MP supply in late pregnancy and lactation.
Introduction Over the last few years genetic selection for higher productivity has increased lamb birth weight and milk
production, such that current feeding standards (AFRC, 1993) may underestimate MP requirements (Robinson, 2001).
Various studies have investigated the effect of additional MP supply, above requirements, on ewe and lamb performance.
However, limited benefits have been demonstrated. In most studies, ewes were in good body condition score (BCS) when
the study commenced, and body reserves may have provided a ‘nutrient reservoir’ to ensure that foetal growth and milk
production were not compromised. A greater response to additional MP supply might be expected if ewes are in poorer
condition (Dawson, et al., 1999). The objectives of the study were to investigate the effect of nutritional restriction in mid-
pregnancy on the response of ewes to additional MP supply in late pregnancy and early lactation.
Material and methods 48 twin-bearing (Suffolk x Mule) ewes (LW 77.5 kg; BCS 3.00) were allocated by parity, LW and
BCS at day 70 of gestation into two groups, and fed to achieve a mean BCS of either < 2.5 (L) or > 3.0 (H) prior to
housing. All ewes were individually housed from week -6 pre-partum to week +4 post-partum and offered straw ad-
libitum, together with one of two concentrates formulated to supply either a low (LP) or high (HP) level of MP. Both
concentrates were formulated to supply similar levels of ME, FME and ERDP, but different levels of CP and DUP.
Concentrate LP supplied 180 and 28 g/kg DM CP and DUP, whereas concentrate HP supplied 212 and 56 g/kg DM CP and
DUP. Concentrates were fed to provide a rising plane of nutrition in late pregnancy and 3.0 litres of milk in lactation
(AFRC, 1993), with the LP diets supplying 1.0 and 0.8 of MP, and HP diets supplying 1.25 and 1.0 of MP requirements
during pregnancy and lactation. Ewe LW and BCS were recorded weekly, with colostrum and milk yield being estimated at
16 hours and 21 days post-partum. Lambs were separated from the ewes, which were injected with 1 ml oxytocin and
machine milked until the udder was empty. The procedure was then repeated 4 hours later and secretion rate calculated.
Litter weight and litter growth rate were recorded. From week +4 post-partum ewes were group housed within each
treatment and performance monitored until week +8 post-partum. The experiment was analysed by ANOVA as a 2 x 2
factorial design.
Results Pre-partum, ewes on treatments L had a higher BCS loss than those on treatment H, and ewes offered concentrates
HP had higher LW gains than those offered concentrates LP. Post-partum, ewes on treatments H had a higher BCS loss and
higher litter growth rates than those on treatments L. Ewes offered concentrates HP had higher colostrum yields, litter
weights and litter growth rates than those offered concentrates LP (Table 1).
Table 1 Effect of nutritional restriction in mid-pregnancy and level of protein supply on ewe and lamb performance.
Low CS (L) High CS (H) SED Probability
LP HP LP HP BCS Protein Int
Pre-partum (-6 to -2)
LW change (kg) 10.10 13.20 9.50 11.30 1.250 NS 0.008 NS
BCS change -0.60 -0.54 -0.40 -0.21 0.159 0.020 NS NS
Post-partum (0 to +8)
LW change (kg) -9.02 -9.55 -10.06 -10.18 1.867 NS NS NS
BCS change -0.90 -0.71 -0.96 -0.95 0.104 0.050 NS NS
Colostrum (l/day) 2.46 3.59 2.65 3.16 0.414 NS 0.009 NS
Milk (l/day) 2.89 3.26 3.05 3.19 0.243 NS NS NS
Litter weight (kg) 9.26 10.44 9.26 9.74 0.505 NS 0.027 NS
Litter gain (g/day) 495 579 545 619 20.4 0.004 <0.001 NS
Conclusion Nutritional restriction had no effect on litter weights, but reduced litter growth rates. Additional MP increased
litter weights and litter growth rates. The response to additional MP was greatest in ewes subjected to nutritional restriction.
Acknowledgements The authors gratefully acknowledge financial support from AHDB (Beef and Lamb).
References
AFRC. 1993. Energy and protein requirements of ruminants. Wallingford, CAB Publishing.
Dawson, L.E.R., Carson, A.F. and Kilpatrick, D.J. 1999. Animal Feed Science and Technology 82, 21-36.
Robinson, J.J. 2001. Review of nutritional standards for sheep. BSAS Publication.
018
Interactive effects of by-pass protein supplementation and parasitism on ewe performance J G M Houdijk
1, A van der Heiden
1, Y Trienes
1, J E Vipond
2
1SRUC, Edinburgh, UK,
2SAC Consultancy, Edinburgh, UK [email protected]
Application Periparturient supplementation of ewes with digestible undegradable protein (DUP) may temporarily
increase ewe body weight and boost lamb weaning weight in the presence of parasite challenge.
Introduction There is a large body of evidence supporting the view that periparturient DUP supplementation increases
ewe performance and reduces the level of parasitism (Houdijk et al., 2012). However, it was recently observed that in the
absence of parasite challenge, DUP supplementation did not increase litter weight gain (Houdijk et al., 2015). This lead to
the hypothesis here tested that DUP supplementation and parasite challenge interact on ewe performance.
Material and methods Twin-bearing Dorsett-mated Dorsett crosses, with mean body weight (BW) of 59.6±0.8 kg and
condition score (CS) of 3.14±0.05 at day-48 (day0 is parturition), were housed individually and dewormed. Then, half of the
ewes were dosed until turnout (day12) with 10,000 Teladorsagia circumcincta larvae every Mon-Wed-Fri (Par) and the
other half with water (Sham), whilst feeding ad libitum hay and 100 g/day commercial concentrates (n=24). From day-21
until day12, ewes were fed at 0.9 times energy requirements (AFRC, 1993) a 30:70 hay:concentrate ration. A 1:1 mixture of
xylose-treated rapeseed meal (RaPass®) and soya bean meal (SoyPass
®) was used in the concentrates to increase DUP
levels from 25 (LP) to 52 (HP) g/kg (n=24). From day12, ewes grazed one of eight 0.5 ha previously-grazed grass-clover
pastures (six ewes and their 12 lambs each), where HP ewes were supplemented with a high DUP pellet (45% RaPass® and
45% SoyPass®) at 400 g/head/day until day57. Housed ewes were assessed regularly for BW, CS, and serum BOHB. Lambs
were weighed at birth and day12. During grazing, ewes and lamb BW, and ewe CS and faecal egg counts (FEC), were taken
on day36, day57 and day105 (weaning). Data were analysed using 2×2 ANOVA, with ewes and plots as experimental units
before and after day12, respectively.
Results Experimental parasite exposure reduced ewe BW until turn out but led to increased ewe BW at weaning (Table
1), which coincided with lower FEC in Par ewes than Sham counterparts at day57 and weaning. Treatments did not affect
CS, which gradually reduced to 2.30±0.06 at turn out and then increased to 2.91±0.12 at day105. Both DUP supplementation
and parasite exposure increased serum BOHB at day-12 (Table 1). DUP supplementation increased periparturient ewe BW
throughout supplementation and litter weight at turnout through weaning, though more pronounced for Sham ewes (Table
1). The FEC of Par ewes was greater than that of Sham ewes on day36 (P<0.001), but smaller on day57 (P<0.001) and day105
(P=0.071). DUP supplementation reduced Par geometric FEC by ~40% on day36, but this interaction was directional at best
(P=0.130).
Table 1 Experimental treatment effects on ewe BOHB, ewe and litter body weight, and ewe FEC post turnout.
Treatment combinations P-values
Day Par/LP Par/HP
Sham/LP
Sham/HP
s.e.d. Parasitism Feeding Interaction
Ewe BOHB (mmol/l) -12 0.65 0.76 0.48 0.58 0.07 0.001 0.033 1.000
Ewe BW (kg) - 4 63.9 64.4 65.2 65.2 0.76 0.038 0.554 0.510
0 54.3 55.2 56.4 55.5 1.10 0.117 0.925 0.251
12 55.6 56.9 57.3 58.8 1.11 0.027 0.079 0.963
36 54.4 57.5 55.2 58.2 1.69 0.551 0.015 0.963
57 54.8 56.8 54.9 56.5 1.56 0.920 0.100 0.858
105 51.2 51.6 50.1 48.4 1.75 0.089 0.595 0.398
Litter BW (kg) 0 7.8 7.7 7.8 7.5 0.33 0.341 0.740 0.844
12 14.0 15.1 14.2 15.2 0.44 0.760 0.002 0.903
36 27.2 26.7 24.4 30.4 1.28 0.623 0.004 <.001
57 37.7 37.7 34.4 41.4 1.50 0.771 0.002 0.002
105 52.9 53.1 50.7 57.3 1.92 0.449 0.017 0.023
Ewe FEC (log epg) 36 2.57 2.37 1.82 1.99 0.16 <.001 0.885 0.130
57 1.60 1.77 2.29 2.31 0.23 <.001 0.565 0.635
105 0.97 1.59 1.57 1.78 0.30 0.071 0.059 0.332
Conclusion This data support the view that in the presence of worm challenge, DUP supplementation may boost ewe
performance. The unexpected temporal effects of experimental challenge on ewe BW and FEC indicate that ewes were
exposed to natural infection post turnout, and that previous worm exposure may assist a faster return to immunity as
lactation progresses.
Acknowledgements We thank many SRUC technicians for their help. This research was funded by AHDB Beef and
Lamb. SRUC receives financial support from Scottish Government (RESAS).
References
Houdijk, J.G.M., Smith, L.A., Vipond, J.E., 2015. Advances in Animal Biosciences 6, 162.
Houdijk, J.G.M., Kyriazakis, I., Kidane, A., Athanasiadou, S., 2012. Veterinary Parasitology 186, 38-50.
019
The sheep skeletal muscle proteome: the effect of weight loss in three ovine breeds of different
origin using label free proteomics A Ferreira
1,2, P Nanni
3, T Kilminster
4, T Scanlon
4, J Milton
5, C Oldham
4, J Greef
4, A M Almeida
2,6
1Instituto de Tecnologia Quimica e Biologica da UNL, Oeiras, Portugal,
2IBET – Instituto de Biologia Experimental e
Tecnológica, Oeiras, Portugal, 3Functional Genomics Center Zurich, ETH/UZH, Zurich, Switzerland,
4Department of
Agriculture and Food Western Australia, Perth (WA), Australia, 5University of Western Australia, Perth (WA), Australia,
6Ross University School of Veterinary Medicine, Basseterre, Saint Kitts and Nevis
Application Several proteins (apolipoprotein A-IV, immunoglobulin V lambda chain, ferritin heavy polypeptide 1, and
serpin peptidase inhibitor clade H member 1) were proposed as putative biomarkers of tolerance to SWL. The expression of
these proteins can serve as an indicator of individual tolerance levels to SWL and used in sheep selection strategies in
drought prone regions.
Introduction Seasonal Weight Loss (SWL) is the most pressing issue in animal production in the tropics. To counter SWL,
farmers use supplementation with commercial feeds, expensive and difficult to implement or use animals that have an
ability to withstand pasture scarcity, such as the Damara (Almeida, 2011). Identification of markers of tolerance to SWL
through proteomics will lead to increased stock productivity being of relevant interest to animal production. With this
work, we aim to establish protein markers of tolerance to SWL in meat producing sheep from 3 breeds that lose weight and
condition to different extents during SWL periods and hence with different levels of tolerance to SWL: Merino (not
tolerant), Damara (tolerant) and Dorper (intermediate).
Material and methods Samples of gastrocnemius muscle were collected from the carcasses of animals used in an animal
assay, in which there were two nutritional groups per breed: underfed and control groups, as described (Scanlon et al.,
2013). Nine samples per category, fifty-four samples from 54 different animals in total (9*6 categories) were used. One
hundred milligrams of muscle samples were added to 500 µl of ammonium bicarbonate (AMBIC) 50 mM, urea 8M,
thiourea 2M buffer, containing 1 tablet Complete Mini EDTA-free cocktail and homogenized. The samples were
centrifuged and supernatant removed. Per sample, 15 µg of proteins were digested with trypsin using a filter aided sample
preparation protocol (FASP) (Wisniewski et al., 2009), and desalted. Peptides were analysed on an LTQ-Orbitrap Velos
mass spectrometer. Protein identification and label free quantification analysis were performed using Mascot and
Progenesis software. In total 685 proteins were identified and used for quantification. For protein quantification, 4
experimental designs were used: : A) Damara Control group vs Restricted group (9 vs 9 samples); B) Merino Control group
vs Restricted group 2 (9 vs 9 samples); Dorper Control group vs Restricted group (9 vs 9 samples); D) Control groups vs
Restricted groups (27 vs 27 samples). Per comparison, a protein was considered as differentially expressed if a minimum
two peptides per protein were quantified, the ANOVA p value was below 0.05 and the fold change was higher than 2.
Results Data analysis resulted in 685 proteins identified with ≥ 2 peptides (FDR: 3.5%). Looking at the comparisons
between groups, we identified as differentially expressed the following number proteins for each of the experimental
designs: A) two proteins; B) seven proteins; C) five proteins; D) four proteins. To our knowledge, this is the first
description of sheep muscle proteome. Moreover, we compare, within three sheep breeds, two experimental nutritional
conditions: control group vs. restricted groups. In a global comparison of Control vs. Restricted we identified four
differently expressed proteins. Within each breed several proteins were found. Interestingly, in the Dorper breed, three of
the five proteins are in the global comparison independently of breed. For the Merino two of the seven proteins are also in
that list, and for Damara one of the two is also in that list.
Conclusion Results suggest that the four proteins we identified in D experimental design - apolipoprotein A-IV,
immunoglobulin V lambda chain, ferritin heavy polypeptide 1, and serpin peptidase inhibitor clade H member 1 - might be
interesting candidates as markers of tolerance to SWL. Apo A-IV is known to play a role in the regulation of food intake;
immunoglobulin V lambda chain is involved in inflammation; ferritin heavy polypeptide 1 is the major intracellular iron
storage protein in prokaryotes and eukaryotes. serpin peptidase inhibitor clade H member 1 is a heat shock protein that
plays a role in collagen biosynthesis as a collagen-specific molecular chaperone.
Acknowledgements Project funded by PRIME-XS proposal #0000241 - The sheep (Ovis aries) muscle proteome:
decoding the mechanisms of tolerance to Seasonal Weight Loss. AM Ferreira is financed by FCT grant
SFRH/BPD/69655/2010.
References
Almeida, A.M. 2011. The Damara in the context of Southern Africa fat tailed sheep breeds. Tropical Animal Health and
Production 43, 1427-1441.
Scanlon T.T., Almeida, A. M.,, van Burgel, A., Kilminster, T., Greeff, J.C., Oldham, C. 2013. Live weight parameters in
Dorper, Damara and Australian Merino lambs subjected to restricted feeding. Small Ruminant Research 109, 101-106.
Wiśniewski JR, Zougman A, Nagaraj N, Mann M 2009. Universal sample preparation-method for proteome analysis. Nat
Methods 6, 359-62.
020
Understanding the development of ovine footrot R Clifton, L E Green, K J Purdy
University of Warwick, Coventry, UK
Application Footrot is reported to account for over 80% of lameness in sheep in the UK and is a major welfare concern. In
addition the disease is economically significant, costing the UK sheep industry approximately £80 million per annum.
Introduction Footrot is an infectious dermatitis of the ovine interdigital skin caused by Dichelobacter nodosus.
Fusobacterium necrophorum is closely associated with footrot but its role in disease initiation and persistence is not fully
understood. F. necrophorum is assumed to be present in sheep faeces and on pasture, but there is little evidence for the
continuous presence of F. necrophorum at either site. It has however been detected on healthy feet and in mouths of sheep.
The aim of this study is to determine at which sites in the environment of sheep F. necrophorum can be detected, and how
changes in load of F. necrophorum at these sites are associated with health and disease in feet.
Material and methods Two longitudinal observational trials were conducted sampling sheep (feet, mouth and faeces) and
their environment (soil and grass) over time. In the first trial (Trial A) a subset of 5 ewes and 5 lambs were sampled every 2
weeks for 4 visits. At each visit the feet of each animal were examined and scored for both interdigital dermatitis (ID) and
footrot on a scale from 0-4. Each foot and the mouth of the animal were swabbed. Soil (n=22), grass (n=6) and faeces
(n=10) samples were collected from the pasture grazed by the animals. Local climate data for the trial period was also
obtained. DNA was extracted from samples and quantitative PCR (qPCR) used to measure load of F. necrophorum. In the
second trial (Trial B) a group of 40 healthy ewe lambs were sampled weekly over a period of 20 weeks. The methodology
was similar to Trial A, except that faeces samples were collected directly from sheep rather than from pasture, soil
temperature and soil moisture were measured at each visit, and soil and grass were also sampled 10 days before the start of
the trial. A subset of 878 samples from Trial B was analysed initially using an F. necrophorum specific qPCR. This
included all soil and grass samples (n=640), plus samples from 3 sheep which had footrot and 2 sheep which only had
healthy feet throughout Trial B. These were 172 foot swabs, 43 mouth swabs and 43 faecal samples. Preliminary statistical
analysis was conducted using a Chi square test (P<0.05).
Results F. necrophorum was detected in feet, mouths, soil and grass on at least one occasion but not in faeces collected
directly from sheep (Table 1). The distribution of positive samples was not random (P<0.01); there were more positive
samples than expected by chance in feet and mouths in Trial A, and in feet in Trial B. The detection levels of F.
necrophorum in feet, mouths, soil and grass also differed significantly between the two trials (P<0.01). Further statistical
analysis will be conducted following completion of laboratory analysis of further samples.
Table 1 Frequency of detection of F. necrophorum in different sample types in Trial A and Trial B
Samples with detectable F. necrophorum
Sample type Trial A Trial B
Foot swabs 50% (n=152) 25% (n=172)
Mouth swabs 80% (n=38) 5% (n=43)
Faeces 2.5% (n=40) 0% (n=43)
Soil 8% (n=88) 1% (n=462)
Grass 4% (n=24) 0% (n=178)
Conclusion The prevalence of F. necrophorum appears to vary between the two trials, potentially due to different levels of
disease in the flocks, and different climatic conditions. F. necrophorum is detected on sheep pasture at low frequency.
Contrary to prior belief, the faeces of sheep were not a significant reservoir of F. necrophorum. Investigation of the patterns
of detection over time will inform on when in the disease process feet, mouths and the environment become positive.
Acknowledgements The authors gratefully acknowledge funding from NERC, AHDB Beef & Lamb and MSD Animal
Health Ruminant Research Bursary
References
Kaler, J. and Green, L. E. 2008. Preventive Veterinary Medicine, 83, 52-64.
Wassink, G. J., King, E. M., Grogono-Thomas, R., Brown, J. C., Moore, L. J. and Green, L. E. 2010. Preventive Veterinary
Medicine 96, 93-103.
Witcomb, L. A., Green, L. E., Kaler, J., Ul-Hassan, A., Calvo-Bado, L. A., Medley, G. F., Grogono-Thomas, R. and
Wellington, E. M. H. 2014. Preventive Veterinary Medicine 115, 48-55.

021
A longitudinal study of factors associated with acute and chronic mastitis and their impact on
lamb growth rate on 10 suckler sheep flocks in Great Britain C Grant, E M Smith, L E Green
University of Warwick, Coventry, UK
Application The results from this study provide evidence that acute and chronic mastitis impact productivity and should
help inform flock management decisions in relation to reducing mastitis. The study also suggests areas for further research.
Introduction Acute mastitis (AM) in ewes can lead to sudden death, loss of an affected udder half, chronic intra-mammary
infection detected as intra-mammary masses (IMM), raised somatic cell count or full recovery. AM has economic costs for
farmers in treatment costs, costs of replacement ewes and reduced income from loss of lambs or poor growing lambs. AM
is also a significant welfare concern as it is a painful disease. Studies in suckler sheep have reported larger litter size and
previous mastitis among the risk factors for AM (Waage and Vatn, 2008) while work in dairy sheep has included looking at
udder conformation in relation to udder health (Casu et al., 2010). A common practice among suckler sheep farmers is to
check the udder of each ewe at the end of lactation or before the start of the breeding season and ewes with IMM may be
culled. The impact of this practice is unknown; possible hypotheses include that it reduces onward transmission of bacterial
strains causing mastitis and reduces the number of slow growing lambs in a flock The aim of this study was to investigate
ewe risks for and inter-relationships between AM, IMM and udder conformation and their impact on lamb growth rate.
Material and methods A 2-year prospective, longitudinal study of 10 suckler sheep flocks in Great Britain was run to
identify factors associated with acute mastitis (AM) and chronic mastitis, and their impact on lamb growth rate. Data
collection occurred from November 2012 to July 2014. Each flock was visited twice each year, approximately 4 weeks
before lambing and approximately 9 weeks into lactation, for two years and all ewes present at a visit were examined.
There were 7021 examinations in total. At the examinations, data were collected on intramammary masses (IMM; a
marker for chronic mastitis), udder conformation, teat lesions and body condition. Data on cases of AM, ewe nutrition,
litter size, lamb weight and general flock management were obtained from farm records and interviews. Factors associated
with AM, IMM in pregnant and lactating ewes, and lamb daily live weight gain were explored using mixed effect
multivariable models.
Results AM was reported in 2 – 3% of ewes each year and IMM were detected in 4.74% of ewes in pregnancy and 10.92%
of ewes in lactation. Key factors associated with an increased risk of AM are presented in table 1. Further results on IMM
and lamb daily live weight gain will be presented.
Table 1 Key factors associated with increased risk of acute mastitis.
Variable Category OR Lower 95% CI Upper 95% CI
Pregnancy protein Adequate Ref
Underfed 4.05 1.44 11.35
Non-traumatic teat lesions None Ref.
At least 1 teat 2.09 1.07 4.09
No. lambs rearing 1 Ref.
≥ 2 2.65 1.49 4.72
Teat angle 5 Ref
4 3.99 2.05 7.79
3 – 1 4.68 1.36 16.16
Litter DLWG 0.03 0.01 0.18
Conclusion We conclude that inadequate nutrition is an important cause of mastitis in suckler ewes. AM, IMM, poor udder
conformation and teat lesions all reduce lamb daily live weight gain and so impact on productivity.
Acknowledgements This study was funded by ADHB Beef & Lamb. We thank the farmers for access to their sheep.
ADAS analysed the nutritional data. We thank Leslie Stubbings and Kate Phillips for interesting discussion on nutrition.
References
Waage, S., Vatn, S., 2008. Individual animal risk factors for clinical mastitis in meat sheep in Norway. Preventative
Veterinary Med Medicine 87,229-243.
Casu, S., Sechi, S., Salaris, S.L., Carta, A., 2010. Phenotypic and genetic relationships between udder morphology and
udder health in dairy ewes. Small Rumin. Res. 88, 77 –83.
022
Teat-end hyperkeratosis in dairy ewes and its predisposing factors S Vouraki, S A Termatzidou, P Kazana, A I Gelasakis, G E Valergakis, G Arsenos
School of Veterinary Medicine, Faculty of Health Sciences, Aristotle University of Thessaloniki, Greece
Application Vacuum level was directly related to the prevalence and severity of teat-end hyperkeratosis in dairy ewes. The
use of lower vacuum levels could help towards the reduction of teat-end hyperkeratosis prevalence in dairy sheep flocks.
Introduction Although teat-end hyperkeratosis is a condition well known and described in dairy cows, relative information
is scarce in dairy ewes. The objective of the present study was to assess teat-end hyperkeratosis in dairy ewes raised under
Mediterranean conditions.
Material and methods A random sample of 28 dairy sheep flocks was used. The average flock comprised 229±146.0
milking ewes with an average milk yield of ca 273±71.7 kg/lactation period. All flocks were visited by the same
veterinarians that assessed milking procedure using a designated recording sheet. Records included use of gloves by
milkers, pre-stripping, clusters removal after vacuum cessation and post-milking disinfection. Technical characteristics of
the milking parlour and relative equipment were also assessed in terms of their functionality and general condition. A
designated equipment (Exendis Milking System Analyser, PTV) was used to measure vacuum level at teat-end, pulsation
rate and pulsation ratio in 3 randomly selected milking units of the milking parlour. The vacuum level in the vacuum pump
was also recorded; the difference of vacuum level between clusters and vacuum pump was calculated. In each flock, a
random sample of 20% of the milking ewes was subjected to a detailed teat-end examination for the assessment of
hyperkeratosis using the 4-scale evaluation method described by Mein et al. (2001). Evaluation was performed
immediately after cluster removal. The problem was considered serious when scores 3+4 and/or 4 were above 20% and
10%, respectively. Data were analysed using univariate analysis of variance with SPSS 22, statistical software. Vacuum
level, difference of vacuum level between clusters and vacuum pump, pulsation rate, pulsation ratio and clusters removal
after vacuum cessation were transformed into categorical variables and used as fixed effects.
Results Average prevalence of hyperkeratosis score, at teat-level, is shown in Table 1. The analyses at flock level showed
that 39% of the flocks (11/28) had a serious problem of teat-end hyperkeratosis. In 5 out of the 11 flocks scores 3+4 were
assigned to 30.2% of teat-ends; from them in 14.5% of cases the hyperkeratosis score was equal to 4. The other 5 flocks
had scores 3+4 assigned to 23.9%, whereas in 1 flock, score 4 was assigned to 12.5% of teat-ends. The effect of vacuum
level on teat-end hyperkeratosis is shown in Table 2. In flocks where the vacuum level of the milking parlour was >40 kPa
a significantly (P<0.05) higher percentage of teat-ends scored 3+4 was found. The effects of other factors assessed were not
significant.
Table 1 Prevalence (%) of hyperkeratosis score Table 2 Vacuum level (kPa) effect on teat-ends (%) scored
3+4
Conclusion A high prevalence of teat-end hyperkeratosis in dairy ewes was observed; nearly 40% of the examined flocks
had a serious problem. In most cases, the higher percentage of teat-ends scored 3+4 was observed in flocks milked with
higher vacuum level. The latter suggested that teat-end hyperkeratosis in dairy ewes may be closely related to the
functionality of the milking parlour, particularly to the level of vacuum applied.
Acknowledgements The authors gratefully acknowledge the milking parlour company “Milkplan”, for funding the study
and providing the equipment with which the technical characteristics of the milking parlours were measured.
References
Mein, G.A., Neijenhuis, F., Morgan, W.F., Reinemann, D.J., Hillerton, J.E., Baines, J.R., Ohnstad, I., Rasmussen, M.D.,
Timms, L., Britt, J.S., Farnsworth, R., Cook N., and Hemling, T. 2001. Proceedings of the 2nd
International Symposium on
Mastitis and Milk Quality.
Vacuum level
≤40 >40 s.e.d. P
7.8 17.5 4.39 0.038
Score Mean min max
1 69.3 41.7 94.7
2 15.2 3.8 37.5
3 9.9 0.9 25.0
4 5.2 0 18.8

023
Introducing a Targeted Selective Treatment worming approach on a hill farm using Electronic
Identification of lambs C Morgan-Davies
1, N R Lambe
1, F Kenyon
2, D McBean
2, H Wishart
1, D McCracken
1
1Scotland's Rural College (SRUC), Hill & Mountain Research Centre, Crianlarich, Scotland, UK,
2Moredun Research
Institute, Penicuik, Scotland, UK
Application Targeted worming of lambs can reduce risk of anthelmintic resistance in hill sheep farming without
compromising productivity. It is also a worthy application of the use of compulsory electronic identification in lambs.
Introduction There is growing concern about anthelmintic resistance on sheep farms, as previous worming strategies are
increasingly failing. Although resistance more commonly occurs on lowland farms, hill areas are also affected. TST is a
refugia-based approach to lamb worming, where only a proportion of animals are treated, based on their actual vs expected
weight change. This approach relies on individual identification of animals, which is possible using electronic identification
(EID) tags, which were made compulsory in 2010 for UK sheep. Such an approach could potentially turn what was often
considered as a burden to farmers into a valuable management tool. The TST approach has been successfully tested on
lowland farms by Moredun Research Institute (Busin et al., 2014). The aim of this study was to investigate the feasibility of
a TST approach using EID technology in a hill farming environment, where animals are weighed and monitored less often.
Material and methods This research was based at SRUC’s Hill & Mountain Research Centre, Kirkton/Auchtertyre hill
farms in the western Highlands of Scotland, over 3 consecutive years (2013-2015). The farms carry 1200 hill ewes and 22
hill cattle, on 2200 ha. Most of the land is rough grazing, with only 230 ha of improved and semi-improved pastures. In this
study, 900 hill ewes (600 Scottish Blackface and 300 Lleyn) have been allocated to two management systems balanced for
age, live weight, litter size and sire. The first group were managed conventionally (control – CON), the other with a
Precision Livestock Farming (PLF) management protocol, around the use of EID technology. In the PLF management
approach, all lambs (n=1183 over 3 years) were subject to the TST. Lambs were weighed monthly after 8 weeks of age
(June) – namely in July, August and September - and drenched only if they did not reach their individual target weight,
which was calculated using the “Happy Factor” algorithm developed by Greer et al. (2009), based on pasture availability.
Wormer doses were also based on animal weight (to the nearest 10 kg). The treatment stopped once the lambs left the
pasture for finishing indoors (October). Lambs in the CON system (n=1129 over 3 years) were wormed using a whole flock
approach, based on pooled faecal samples, by litter size groups. If the faecal egg count (FEC) was >500 eggs/g, all lambs in
that group were wormed (based on the heaviest animals in that group); if the count was lower, the lambs were not wormed..
Final (September) lamb weight data were analysed in Genstat (16th
edition) using a Linear Mixed Model analysis with
breed, sex, management system and littersize as fixed effects (year as random effect). Proportion of lambs dosed was
analysed with a chi-square test.
Results Over the three years, the proportion of lambs dosed during the summer months was significantly (P<0.001) lower
in the PLF than in the CON (0.40 versus 0.77). This equated to a 44% saving in the amount of wormer used over the three
years between the PLF and the CON (16.5 litres versus 29.6 litres respectively). For 100 lambs, the average worming costs
per year over the three years were £13 for the PLF and £71 for the CON (which included the FEC costs). Although breed,
littersize and sex had significant effects on final lamb weights, with the Lleyn (P=0.03), the twins (P<0.001) and the male
lambs (P<0.001) being heavier, the management systems did not (P=0.08).
Conclusion It is feasible to introduce a TST approach in a hill farm environment; it reduced the amount of anthelmintic
products used on hill lambs without compromising lamb final weights. TST has the potential to slow down anthelmintic
resistance in hill sheep flocks, and avoid all the associated negative impacts on farm economics and efficiency and the
environment. Provided hill farmers have access to an automated EID reader on a weigh crate, the TST approach could also
greatly reduce farm labour.
Acknowledgements SRUC and MRI receive financial support from the Scottish Government’s RESAS 2011-2016
Strategic Research Programme 2 (Food, Land and People).
References
Busin, V., Kenyon, F., Parkin, T., McBean, D., Laing, N., Sargison, N.D., and Ellis, K. 2014. The Veterinary Journal 200,
248-252
Greer, A. W., Kenyon, F., Bartley, D.J., Jackson, E.B., Gordon, Y., Donnan, A.A., McBean, D.W., and Jackson, F. 2009.
Veterinary Parasitology 164, 12-20.
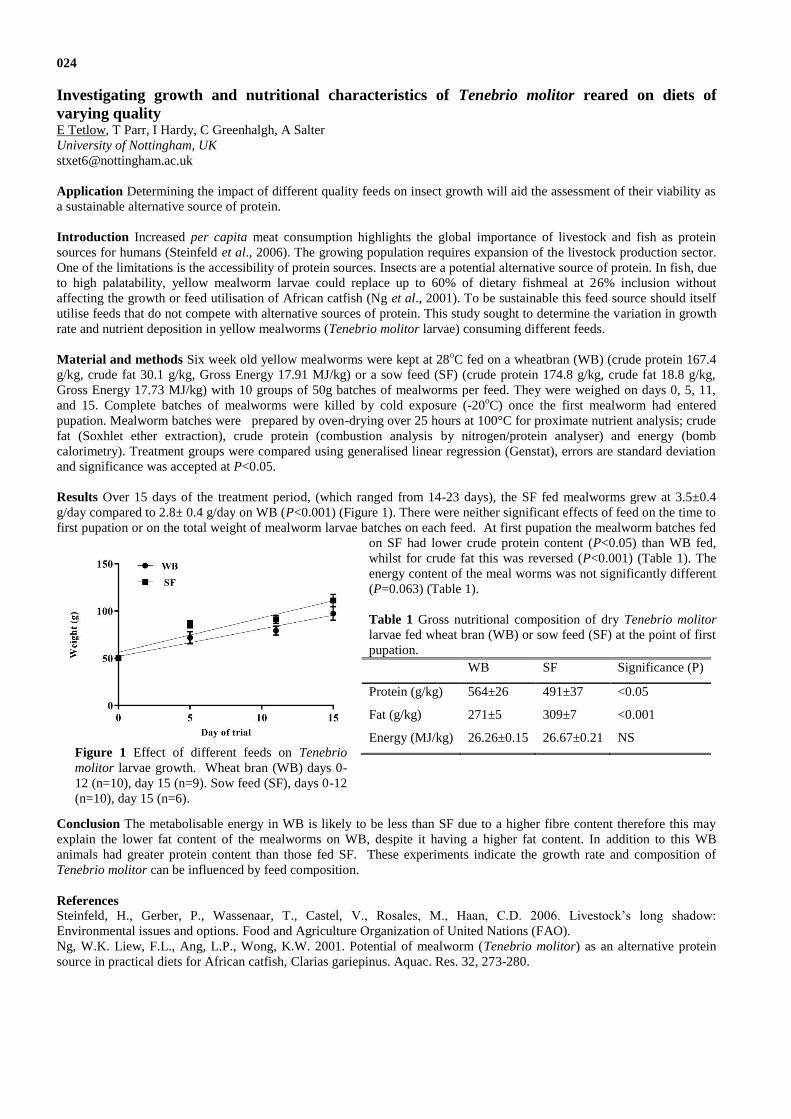
024
Investigating growth and nutritional characteristics of Tenebrio molitor reared on diets of
varying quality E Tetlow, T Parr, I Hardy, C Greenhalgh, A Salter
University of Nottingham, UK
Application Determining the impact of different quality feeds on insect growth will aid the assessment of their viability as
a sustainable alternative source of protein.
Introduction Increased per capita meat consumption highlights the global importance of livestock and fish as protein
sources for humans (Steinfeld et al., 2006). The growing population requires expansion of the livestock production sector.
One of the limitations is the accessibility of protein sources. Insects are a potential alternative source of protein. In fish, due
to high palatability, yellow mealworm larvae could replace up to 60% of dietary fishmeal at 26% inclusion without
affecting the growth or feed utilisation of African catfish (Ng et al., 2001). To be sustainable this feed source should itself
utilise feeds that do not compete with alternative sources of protein. This study sought to determine the variation in growth
rate and nutrient deposition in yellow mealworms (Tenebrio molitor larvae) consuming different feeds.
Material and methods Six week old yellow mealworms were kept at 28oC fed on a wheatbran (WB) (crude protein 167.4
g/kg, crude fat 30.1 g/kg, Gross Energy 17.91 MJ/kg) or a sow feed (SF) (crude protein 174.8 g/kg, crude fat 18.8 g/kg,
Gross Energy 17.73 MJ/kg) with 10 groups of 50g batches of mealworms per feed. They were weighed on days 0, 5, 11,
and 15. Complete batches of mealworms were killed by cold exposure (-20oC) once the first mealworm had entered
pupation. Mealworm batches were prepared by oven-drying over 25 hours at 100°C for proximate nutrient analysis; crude
fat (Soxhlet ether extraction), crude protein (combustion analysis by nitrogen/protein analyser) and energy (bomb
calorimetry). Treatment groups were compared using generalised linear regression (Genstat), errors are standard deviation
and significance was accepted at P<0.05.
Results Over 15 days of the treatment period, (which ranged from 14-23 days), the SF fed mealworms grew at 3.5±0.4
g/day compared to 2.8± 0.4 g/day on WB (P<0.001) (Figure 1). There were neither significant effects of feed on the time to
first pupation or on the total weight of mealworm larvae batches on each feed. At first pupation the mealworm batches fed
on SF had lower crude protein content (P<0.05) than WB fed,
whilst for crude fat this was reversed (P<0.001) (Table 1). The
energy content of the meal worms was not significantly different
(P=0.063) (Table 1).
Table 1 Gross nutritional composition of dry Tenebrio molitor
larvae fed wheat bran (WB) or sow feed (SF) at the point of first
pupation.
WB SF Significance (P)
Protein (g/kg) 564±26 491±37 <0.05
Fat (g/kg) 271±5 309±7 <0.001
Energy (MJ/kg) 26.26±0.15 26.67±0.21 NS
Conclusion The metabolisable energy in WB is likely to be less than SF due to a higher fibre content therefore this may
explain the lower fat content of the mealworms on WB, despite it having a higher fat content. In addition to this WB
animals had greater protein content than those fed SF. These experiments indicate the growth rate and composition of
Tenebrio molitor can be influenced by feed composition.
References
Steinfeld, H., Gerber, P., Wassenaar, T., Castel, V., Rosales, M., Haan, C.D. 2006. Livestock’s long shadow:
Environmental issues and options. Food and Agriculture Organization of United Nations (FAO).
Ng, W.K. Liew, F.L., Ang, L.P., Wong, K.W. 2001. Potential of mealworm (Tenebrio molitor) as an alternative protein
source in practical diets for African catfish, Clarias gariepinus. Aquac. Res. 32, 273-280.
Figure 1 Effect of different feeds on Tenebrio
molitor larvae growth. Wheat bran (WB) days 0-
12 (n=10), day 15 (n=9). Sow feed (SF), days 0-12
(n=10), day 15 (n=6).

025
Heavy metal uptake and DNA integrity in Cyprinus carpio as biomarkers of freshwater pollution F Jabeen
1, A S Chaudhry
2
1Government College University Faisalabad, Punjab, Pakistan,
2Newcastle University, Newcastle Upon Tyne, UK
Application The results of this study could form the basis to bio-monitor freshwater pollution by using heavy metal and
Comet Assays in aquatic organisms such as fish.
Introduction Fish is one of the most common aquatic organisms worldwide with superior nutritional significance.
Enhanced fish production can be one strategy to fulfil the nutritional requirements of a rapidly growing human global
population. In developing countries many river systems have been contaminated with the mixture of domestic effluents
and industrial discharges along with other pollutants which have been adversely affecting human health and aquatic
ecosystems. Thus heavy metal contamination may have devastating effects on the ecological balance of the recipient
environment and diversity of aquatic organisms. As pollution related stress can alter DNA integrity, it is important to assess
this to establish the consequences of pollutant exposure on organisms. Therefore, this study aimed to explore the genotoxic
influence of heavy metals on the liver of Cyprinus carpio sampled from the River Indus in Mianwali district, Pakistan by
using single cell gel electrophoresis (SCGE =Comet assay).
Material and methods This completely randomised study involved two polluted sites (Shabaz Khel= S2 and Ballo Khel=
S3) and a relatively less polluted site (Kukranwala=S1 as the control) that were about 30 kilometers apart from each other
along the River Indus in Mianwali. A total of 81 samples of Cyprinus carpio were collected by using nine fish samples of
similar size (approx. 1000g) as replicates from three locations of each site. Replicated water samples were also collected
from each of these three sites. The concentration of selected heavy metals (As, Cr, Cu, Mn and Pb) in water and fish livers
were analysed by using a Varian Vista-MPX CCD Simultaneous ICP-AES machine (Varian Inc, Australia). The DNA
integrity in fish liver was assessed using Comet assay. The cells were scored by Comet Assay IV software (Perceptive
Instruments Ltd). The data were statistically analysed by using ANOVA in Minitab software version 17 to test the effect of
sampling sites on the metal uptake and DNA integrity of fish livers. Tukey’s post-hoc test was used to compare the means
for different sites at P<0.05.
Results Table1 shows that the heavy metal concentrations in river water were within the safe limits except arsenic.
However, the heavy metal concentrations in fish liver were many folds higher than the WHO recommended levels for food
fish. Table 2 shows more DNA damage at polluted sites indicating the oxidative stress in fish species (P<0.05) due to
heavy metal accumulation. The order of heavy metals and DNA damage was S3>S2>S1.
Table 1 Mean concentration of heavy metals in fish liver (mg/kg), river water (mg/l), maximum permissible levels (MPL)
of heavy metals in food fish and water suitable for aquatic life according to WHO (2006) and P-values.
S1 S2 S3
WHO MPL
in Fish
WHO PML
in Water
P-Value
Liver Water Liver Water Liver Water
As 1.83 0.011 2.66 0.014 2.76 0.015 0.1 0.01 0.001
Cr 0.24 0.001 5.19 0.001 5.52 0.002 0.05 0.05 0.001
Cu 41.16 0.013 76.96 0.025 81.24 0.053 30 2 0.001
Mn 3.95 0.006 6.56 0.008 10.11 0.009 0.01 0.5 0.001
Pb 8.14 0.003 23.49 0.006 35.57 0.008 2.0 0.01 0.001
Table 2 Comet Assay based means ± SD of head and tail length (µm), head and tail intensity (%) and extent tail moment
(arbitrary units) in fish.
Sites Head Length Tail Length Head
Intensity
Tail Intensity Extent Tail Moment
S1 21.5±1.68a 10.3±0.6
c 88.8±3.5
a 1.7±0.21
c 15.1±1.2
c
S2 21.0±1.7a 19.4±2.1
b 74.1±3.1
b 25.9±2.1
b 367.5±33.8
b
S3 17.1±1.4b 75.1±5.6
a 44.2±4.2
c 41.5±5.2
a 4236.7±110.6
a
(mean with different letters in the same column differ significantly)
Conclusion This study suggests that the fish in the study area were living in a stressful and genotoxic environment as
evident by the DNA damage and elevated levels of heavy metals in fish tissues. This is a cause of concern.
Acknowledgements to HEC Pakistan and British Council for funding the INSPIRE project SP-174 (2011-2016).

026
Do puppies from “puppy farms” show more temperament and behavioural problems than if
acquired from other sources? Using CBARQ to assess R Gray
1, C Douglas
1, S Butler
1, J Serpell
2
1Newcastle University, Newcastle upon Tyne, UK,
2University of Pennsylvania, Philadelphia, USA
Application The information can be used to educate potential owners and discourage them from acquiring puppies from
sources where the puppies’ welfare is not paramount.
Introduction Puppies purchased from on-line or commercial breeding establishments (UK “puppy farms”) may have
increased morbidity and mortality (Kennel Club, 2013; McMillan et al, 2013), but there is no research into the effect on
subsequent behaviour. Our aim was to explore the effect of source on puppies’ temperament and behaviour as an adult
dog.
Materials and methods We used the validated Canine Behaviour And Research Questionnaire: CBARQTM
(see Hsu and
Serpell, 2003) developed for owners / behaviourists to report typical responses of their dogs to common stimuli in their
natural environment. Answers to CBARQ questions (Likert scales e.g. 0 never – 4 always) were used to produce a mean
score for a behavioural category e.g. owner-directed aggression; separation-related behaviour.
The first survey included 101 questions to generate CBARQ behavioural categories and 38 questions on health and
indicators of a “less responsible breeder”. This was distributed via internet dog forums for owners of any breed to
complete.
The second survey focused on 3 popular small breeds: Pugs, Jack Russells and Chihuahuas, fewer behavioural categories
and eleven questions relating to where the puppy was acquired to give an indication of the responsibility of the breeder (age
puppy was purchased; where the puppy was purchased [e.g. small breeder, pet store, puppy farm]; was the mother seen;
were there any concerns for the mother/puppies; how many litters of puppies were available; was the owner responsible and
caring towards the dogs; were the puppies housed in suitable accommodation; were the puppies in the owner’s house; were
the puppies with the mother; were health/pedigree documents seen). These were categorised as responsible (R) or less
responsible (LR) depending on the response (e.g. if puppies were sold at less than 7 weeks this was LR). An overall
categorisation was given where if more than 4/11 responses to the above questions were LR the overall categorisation was
LR. The survey was distributed via internet breed forums, dog charity tweets and conforms to British Psychological
Society ethical guidelines for internet research. All data was tested for normality (Shapiro Wilk) and homogeneity of
variance (Levene’s test). Differences in behavioural categories were analysed using Mann-Whitney U tests for non-
parametric data and independent samples t-test for parametric data.
Results and discussion Survey 1 (67 usable questionnaires) reported that 93% of respondents were able to see the dam, but
16% did not see dam-puppies interaction, this had been proposed as an indicator of whether the puppy came from a
commercial breeding establishment. The only significant finding for the CBARQ behavioural categories was where
respondents reported concern for the puppies’ welfare at the source, their dogs subsequently had increased stranger directed
aggression (n=6; mean 1.04; SE 0.61 compared to where no concern was reported n=54: mean 0.26 SE 0.09 P<0.05).
The second survey had 307R and 163IR usable questionnaires Amalgamated breed data showed dogs from R sources had
significantly lower (better) median behaviour scores than IR for most behavioural categories: Stranger Directed Aggression
0.3, 0.6 P<0.001; Owner Directed Aggression 0, 0.13 P<0.001; Dog Directed Aggression 0.5, 1.13 P<0.001; Dog Directed
Fear 0.75, 1.0 P<0.05; Chasing 1.7, 2 P<0.01; Stranger Directed Fear 0.3; 0.8 P<0.05; Non Social Fear 0.67, 0.83 P<0.01;
Separation Related Problems 0.5, 0.8 P<0.001; Touch Sensitivity 0.5, 0.8 P<0.001; Excitability 2, 2.3 P<0.01. There was
no difference in Attachment 2.3, 2.5 P=0.31 or Energy 2, 2.5 P=0.21. For Trainability IR was slightly but significantly
better than R (2.13, 2.25 P<0.01). Further analysis is required by breed and full analysis by breed for individual indicators
of responsible breeders. Asking about behaviour before source may reduce potential bias in future surveys.
Conclusion Dogs from less responsible breeders do not score as well in reported behavioural categories as dogs acquired
from sources which had more indicators of being a responsible breeder.
References Hsu, Y. and Serpell, J. 2003. Journal of the American Veterinary Medical Association 9, 1293-1300.
Kennel Club. 2013. Puppy welfare crisis: one in five social media and internet pups die before six months. Retrieved on 25
January 2016 from http://www.thekennelclub.org.uk/press-releases/2013/september/puppy-welfare-crisis-one-in-five-
social-media-and-internet-pups-die-before-six-months-old/
McMillan, F., Serpell, J., Duffy, D., Masaoud, E. and Dohoo, I. 2013. Journal of the American Veterinary Medical
Association 242, 1359-1363
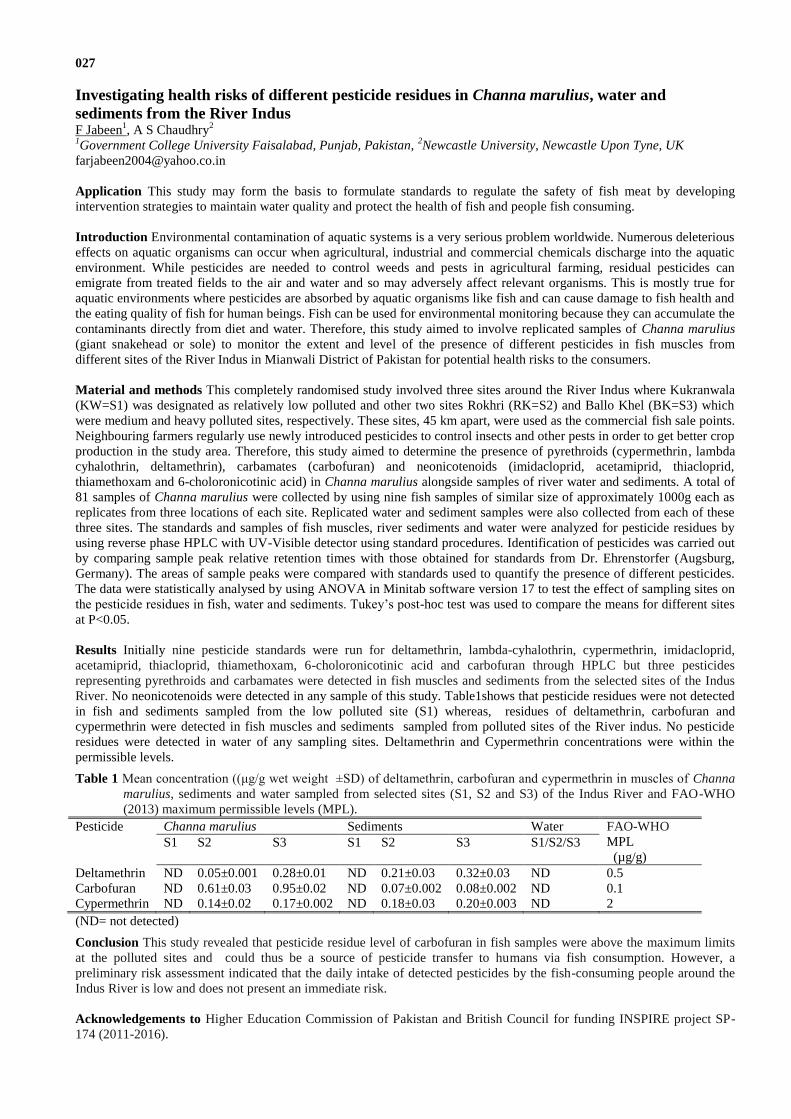
027
Investigating health risks of different pesticide residues in Channa marulius, water and
sediments from the River Indus F Jabeen
1, A S Chaudhry
2
1Government College University Faisalabad, Punjab, Pakistan,
2Newcastle University, Newcastle Upon Tyne, UK
Application This study may form the basis to formulate standards to regulate the safety of fish meat by developing
intervention strategies to maintain water quality and protect the health of fish and people fish consuming.
Introduction Environmental contamination of aquatic systems is a very serious problem worldwide. Numerous deleterious
effects on aquatic organisms can occur when agricultural, industrial and commercial chemicals discharge into the aquatic
environment. While pesticides are needed to control weeds and pests in agricultural farming, residual pesticides can
emigrate from treated fields to the air and water and so may adversely affect relevant organisms. This is mostly true for
aquatic environments where pesticides are absorbed by aquatic organisms like fish and can cause damage to fish health and
the eating quality of fish for human beings. Fish can be used for environmental monitoring because they can accumulate the
contaminants directly from diet and water. Therefore, this study aimed to involve replicated samples of Channa marulius
(giant snakehead or sole) to monitor the extent and level of the presence of different pesticides in fish muscles from
different sites of the River Indus in Mianwali District of Pakistan for potential health risks to the consumers.
Material and methods This completely randomised study involved three sites around the River Indus where Kukranwala
(KW=S1) was designated as relatively low polluted and other two sites Rokhri (RK=S2) and Ballo Khel (BK=S3) which
were medium and heavy polluted sites, respectively. These sites, 45 km apart, were used as the commercial fish sale points.
Neighbouring farmers regularly use newly introduced pesticides to control insects and other pests in order to get better crop
production in the study area. Therefore, this study aimed to determine the presence of pyrethroids (cypermethrin, lambda
cyhalothrin, deltamethrin), carbamates (carbofuran) and neonicotenoids (imidacloprid, acetamiprid, thiacloprid,
thiamethoxam and 6-choloronicotinic acid) in Channa marulius alongside samples of river water and sediments. A total of
81 samples of Channa marulius were collected by using nine fish samples of similar size of approximately 1000g each as
replicates from three locations of each site. Replicated water and sediment samples were also collected from each of these
three sites. The standards and samples of fish muscles, river sediments and water were analyzed for pesticide residues by
using reverse phase HPLC with UV-Visible detector using standard procedures. Identification of pesticides was carried out
by comparing sample peak relative retention times with those obtained for standards from Dr. Ehrenstorfer (Augsburg,
Germany). The areas of sample peaks were compared with standards used to quantify the presence of different pesticides.
The data were statistically analysed by using ANOVA in Minitab software version 17 to test the effect of sampling sites on
the pesticide residues in fish, water and sediments. Tukey’s post-hoc test was used to compare the means for different sites
at P<0.05.
Results Initially nine pesticide standards were run for deltamethrin, lambda-cyhalothrin, cypermethrin, imidacloprid,
acetamiprid, thiacloprid, thiamethoxam, 6-choloronicotinic acid and carbofuran through HPLC but three pesticides
representing pyrethroids and carbamates were detected in fish muscles and sediments from the selected sites of the Indus
River. No neonicotenoids were detected in any sample of this study. Table1shows that pesticide residues were not detected
in fish and sediments sampled from the low polluted site (S1) whereas, residues of deltamethrin, carbofuran and
cypermethrin were detected in fish muscles and sediments sampled from polluted sites of the River indus. No pesticide
residues were detected in water of any sampling sites. Deltamethrin and Cypermethrin concentrations were within the
permissible levels.
Table 1 Mean concentration ((μg/g wet weight ±SD) of deltamethrin, carbofuran and cypermethrin in muscles of Channa
marulius, sediments and water sampled from selected sites (S1, S2 and S3) of the Indus River and FAO-WHO
(2013) maximum permissible levels (MPL).
Pesticide Channa marulius Sediments Water FAO-WHO
MPL
(µg/g) S1 S2 S3 S1 S2 S3 S1/S2/S3
Deltamethrin ND 0.05±0.001 0.28±0.01 ND 0.21±0.03 0.32±0.03 ND 0.5
Carbofuran ND 0.61±0.03 0.95±0.02 ND 0.07±0.002 0.08±0.002 ND 0.1
Cypermethrin ND 0.14±0.02 0.17±0.002 ND 0.18±0.03 0.20±0.003 ND 2
(ND= not detected)
Conclusion This study revealed that pesticide residue level of carbofuran in fish samples were above the maximum limits
at the polluted sites and could thus be a source of pesticide transfer to humans via fish consumption. However, a
preliminary risk assessment indicated that the daily intake of detected pesticides by the fish-consuming people around the
Indus River is low and does not present an immediate risk.
Acknowledgements to Higher Education Commission of Pakistan and British Council for funding INSPIRE project SP-
174 (2011-2016).

Table 1 Frustrated behaviours in week 1 correlated
to DIA scores of control group (Spearman Rank)
Table 2 Scores correlated (Pearson)
028
Does self-control training in puppy classes influence subsequent impulsivity in dogs? A Korzeniowski, C Douglas
Newcastle University, Newcastle upon Tyne, UK
Application Dog trainers and behaviourists can assist in managing impulsivity and thus some behavioural problems in
dogs by providing early intervention to owners with potentially highly impulsive puppies.
Introduction Impulsivity in domestic dogs is an underlying trait of many behaviour problems, including aggression (Zulch
and Mills, 2012). Human research supports self-control training to improve self-control (e.g. in anger management), but
there is no canine research on its efficacy despite existing training programmes (e.g. tasks where dogs are trained to wait
patiently for food) and anecdotal evidence. This study aimed to determine whether a self-control training programme in
puppies had an effect on their impulsivity using the Dog Impulsivity Assessment Scale (DIAS, Wright et al., 2011), an
owner-reported psychometric tool validated for puppies over 27weeks old. The DIAS has a total score and scores for
Factors 1: self-control (F1); 2: aggression due to impulsivity (F2) and 3: responsiveness to the environment linked to
trainability (F3). For F1 and 2, a high score indicates undesirable high impulsivity whereas a high Factor 3 score indicates
the dog is more responsive and trainable.
Material and methods Puppies (n=58) of various breeds were six cohorts of a puppy training/socialisation course, (age
<20weeks at the start). The course was 1hr/week for six weeks (full attendance was not always achieved), indoors, with
owners present, comprising basic obedience exercises (using positive reinforcement). Each cohort was randomly assigned
to either control (C) (n= 10, 8, 10) or treatment (T) (n= 10, 10, 10). On week one the puppies’ frustrated behaviours were
recorded (barking and pulling on the lead towards other puppies or people) using scan zero-one sampling every two
minutes for 60 minutes (total scores were a proportion of all sample intervals). Groups had an intervention on weeks two,
three, four and five: controls were taught a trick (bow; crawl; spin; play dead) and treatment taught “self-control” exercises
(floating food bowl; ignore what is on the floor; manners at the door; ignore that dog). After the course owners were posted
and emailed a DIAS questionnaire when puppies reached 27 weeks old. Informed consent was obtained. The study adheres
to ASAB Guidelines (2012). Differences between treatment groups were analysed using independent samples T-tests. Tests
of association between behaviours in week 1 of the course and subsequent DIAS score used Spearman Rank correlation;
Pearson correlation was used to compare associations between scores for DIAS Factors (SPSS 21).
Results No differences in barking and pulling in week 1 between treatment groups (T: 0.2 [SE 0.04] C: 0.17 [0.03] NS)
suggest puppies had been randomly assigned. Only 26 usable questionnaires were returned (13 T; 13 C; puppies attending
follow-on classes with self control activities were excluded from the main analysis). There were no overall differences in
total DIAS (T: 0.54, C: 0.55); F1 (T:0.51, C:0.52); F2 (T:0.32, C:0.31) suggesting no effect of the treatment on self-control
or impulsivity-related aggression. Factor 3 is approaching significance (T:0.75, C:0.67, P=0.09) with the treatment group
reportedly more responsive and trainable. Not all puppies received 4 self-control interventions due to attendance.
Exploratory scatterplots suggest that DIAS score improved with increasing self-control interventions during the 6 weeks
course. When DIAS data was included from puppies attending the follow-on classes it did not alter the DIAS score,
suggesting early intervention may be more effective. Table 1 shows significant correlations with barking and pulling in
week 1 with subsequent DIAS score. Table 2 reflects Wright et al, (2011) within-DIAS correlations, providing further
validity of the DIAS tool.
Conclusion These results provide initial support that self-control training in puppy classes might prove beneficial for
assisting impulsive individuals enhance self-control. Barking or pulling on the lead in a frustrating situation for puppies
may be early proxies for high impulsivity and as such enable behaviourists to suggest early interventions to build self-
control, thus avoiding later problem behaviours developing. Number of self-control tasks may be associated with better
self-control and early intervention (first puppy classes) may be better than later (follow-on puppy classes), but further
research is recommended to confirm these suggestions.
References
ASAB. 2012. Animal Behaviour 83, 301–309
Wright, H.F., Mills, D.S., and Pollux, P.M.J. 2011. International Journal of Comparative Psychology 24, 210-225
Zulch, H and Mills, D.S. 2012. Life Skills for Puppies. Dorchester: Veloce Publishing
Factor/Total F1 F2 F3
DIAS 0.89*** 0.35* -0.15
Factor 1 0.43* -0.36*
Factor 2 -0.34*
n=35; *P<0.05; ***P<0.001
Factor/Total DIAS F1 F2 F3
Pulling 0.20 0.31 0.12 -0.58*
Barking 0.43 0.55Ť 0.07 -0.33
n=12 Ť
P<0.10; *P<0.05
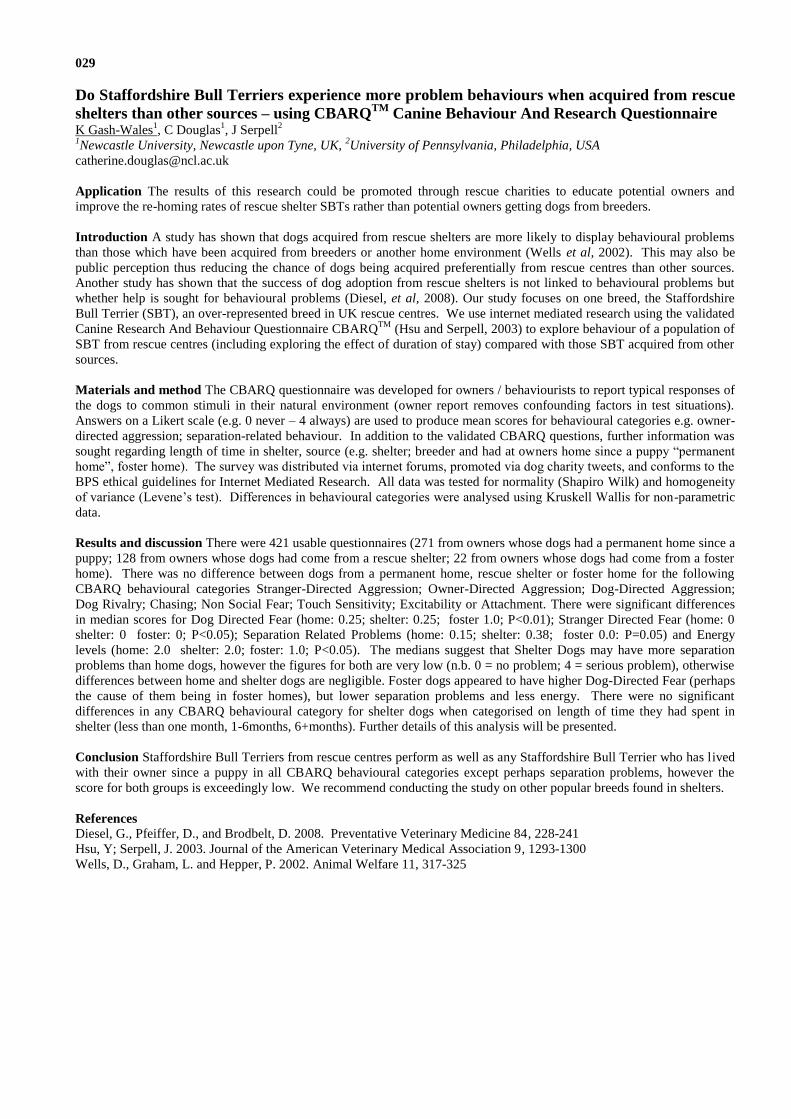
029
Do Staffordshire Bull Terriers experience more problem behaviours when acquired from rescue
shelters than other sources – using CBARQTM
Canine Behaviour And Research Questionnaire K Gash-Wales
1, C Douglas
1, J Serpell
2
1Newcastle University, Newcastle upon Tyne, UK,
2University of Pennsylvania, Philadelphia, USA
Application The results of this research could be promoted through rescue charities to educate potential owners and
improve the re-homing rates of rescue shelter SBTs rather than potential owners getting dogs from breeders.
Introduction A study has shown that dogs acquired from rescue shelters are more likely to display behavioural problems
than those which have been acquired from breeders or another home environment (Wells et al, 2002). This may also be
public perception thus reducing the chance of dogs being acquired preferentially from rescue centres than other sources.
Another study has shown that the success of dog adoption from rescue shelters is not linked to behavioural problems but
whether help is sought for behavioural problems (Diesel, et al, 2008). Our study focuses on one breed, the Staffordshire
Bull Terrier (SBT), an over-represented breed in UK rescue centres. We use internet mediated research using the validated
Canine Research And Behaviour Questionnaire CBARQTM
(Hsu and Serpell, 2003) to explore behaviour of a population of
SBT from rescue centres (including exploring the effect of duration of stay) compared with those SBT acquired from other
sources.
Materials and method The CBARQ questionnaire was developed for owners / behaviourists to report typical responses of
the dogs to common stimuli in their natural environment (owner report removes confounding factors in test situations).
Answers on a Likert scale (e.g. 0 never – 4 always) are used to produce mean scores for behavioural categories e.g. owner-
directed aggression; separation-related behaviour. In addition to the validated CBARQ questions, further information was
sought regarding length of time in shelter, source (e.g. shelter; breeder and had at owners home since a puppy “permanent
home”, foster home). The survey was distributed via internet forums, promoted via dog charity tweets, and conforms to the
BPS ethical guidelines for Internet Mediated Research. All data was tested for normality (Shapiro Wilk) and homogeneity
of variance (Levene’s test). Differences in behavioural categories were analysed using Kruskell Wallis for non-parametric
data.
Results and discussion There were 421 usable questionnaires (271 from owners whose dogs had a permanent home since a
puppy; 128 from owners whose dogs had come from a rescue shelter; 22 from owners whose dogs had come from a foster
home). There was no difference between dogs from a permanent home, rescue shelter or foster home for the following
CBARQ behavioural categories Stranger-Directed Aggression; Owner-Directed Aggression; Dog-Directed Aggression;
Dog Rivalry; Chasing; Non Social Fear; Touch Sensitivity; Excitability or Attachment. There were significant differences
in median scores for Dog Directed Fear (home: 0.25; shelter: 0.25; foster 1.0; P<0.01); Stranger Directed Fear (home: 0
shelter: 0 foster: 0; P<0.05); Separation Related Problems (home: 0.15; shelter: 0.38; foster 0.0: P=0.05) and Energy
levels (home: 2.0 shelter: 2.0; foster: 1.0; P<0.05). The medians suggest that Shelter Dogs may have more separation
problems than home dogs, however the figures for both are very low (n.b. 0 = no problem; 4 = serious problem), otherwise
differences between home and shelter dogs are negligible. Foster dogs appeared to have higher Dog-Directed Fear (perhaps
the cause of them being in foster homes), but lower separation problems and less energy. There were no significant
differences in any CBARQ behavioural category for shelter dogs when categorised on length of time they had spent in
shelter (less than one month, 1-6months, 6+months). Further details of this analysis will be presented.
Conclusion Staffordshire Bull Terriers from rescue centres perform as well as any Staffordshire Bull Terrier who has lived
with their owner since a puppy in all CBARQ behavioural categories except perhaps separation problems, however the
score for both groups is exceedingly low. We recommend conducting the study on other popular breeds found in shelters.
References Diesel, G., Pfeiffer, D., and Brodbelt, D. 2008. Preventative Veterinary Medicine 84, 228-241
Hsu, Y; Serpell, J. 2003. Journal of the American Veterinary Medical Association 9, 1293-1300
Wells, D., Graham, L. and Hepper, P. 2002. Animal Welfare 11, 317-325

030
Can activity assessment be used to detect oestrus in captive felids? C J Andrews, M A Potter, D G Thomas
Massey University, Palmerston North, New Zealand
Application Observational studies suggest that subtle changes in activity in felid species may be associated with oestrus.
However, there is a lack of quantitative data from any felid species indicating that this occurs, and a number of potential
confounding environmental variables have not been investigated. Research of felid activity may ultimately offer a method
to improve oestrus detection and thus reproductive success in captive felids.
Introduction Oestrus is often difficult to detect in felids, but it can be associated with subtle increases in the expression of
behaviours such as grooming, allogrooming, rubbing, rolling, scent-marking, vocalising, and locomotion. These
behaviours appear to correlate with an increase in overall physical activity (OPA). Thus it may be possible to improve
oestrus detection in felids by monitoring changes in the OPA associated with oestrus remotely via accelerometry.
Accelerometers have been validated for monitoring the OPA of individual cats, and have since been used to study feline
behaviour and daily activity patterns (Andrews et al. 2015; Lascelles et al. 2008; Piccione et al. 2013; Watanabe et al.
2005). The present study aimed to examine the relationship between OPA and reproductive state (anoestrus or oestrus) in
outdoor colony-housed domestic cats (Felis catus), while also assessing the impact of environmental variables on OPA.
Material and methods Actical® ‘MiniMitter’ accelerometers (MiniMitter, Bend, OR, USA) were attached to the existing
collars of 10 entire female domestic cats (1.8-10.1 years of age) at the Massey University Centre for Feline Nutrition (Lat.
175° 38’ E Long: 40° 22’ S Palmerston North, New Zealand). Activity data were collected from each cat over 34 - 43
consecutive days, during which time the behaviour of the cats was monitored daily to determine their reproductive state
(anoestrus or oestrus). The activity data of the cats were then compared against concurrent temperature (°C), rainfall (mm)
and humidity (%) data using analysis of variance (ANOVA). Seasonal changes in temperature were adjusted by calculating
the difference between the observed and expected temperatures per day (i.e. residual temperature), with expected
temperatures determined from regression analysis of temperatures versus date. The effects of reproductive state and day-
of-the-week (given there was a reduced staff presence in the colony at weekends) on the activity of the cats, as a group and
individually, were also examined using ANOVA. Regression analyses were then conducted to assess the relationship
between the mean activity counts of the cats and binned residual temperature, rainfall and humidity. In addition, the effects
of these environmental factors on the activity of individual cats were examined.
Results A total of 414 days of activity data were collected from the 10 cats, comprising 135 and 279 days of anoestrous
and oestrous activity data respectively. Reproductive state consistently affected the activity of the cats (P < 0.001), with
the cats being significantly more active during oestrus. The OPA of the cats was also significantly affected by temperature
(P = 0.014), rainfall (P < 0.006) and humidity (P < 0.05). While there was considerably more variation between cats in
response to these environmental factors, the results showed that OPA decreased with increasing residual temperature (P =
0.015), rainfall (P = 0.010; most pronounced when above 8 mm/day) and humidity (P = 0.008; most pronounced when
above 80% rh). Day of the week did not appear to influence the OPA of the cats (P = 0.214).
Conclusion The most significant finding of this study is the influence of reproductive state on the OPA of cats, providing
the first quantitative support for anecdotal observations that cats are typically more active during oestrus. Consequently,
there is potential for accelerometry and activity assessment to be used to improve the real-time detection of oestrus in cats.
While this may be of limited value for domestic cats, it is the first step towards developing this methodology for use on
endangered non-domestic felids in which oestrus is difficult to detect behaviourally. Environmental factors such as
residual temperature, rainfall and humidity also affected the OPA of colony-housed cats, but did so in a highly variable and
complex manner that precludes a simple correction factor when assessing accelerometer data.
Acknowledgements We thank the staff at the Massey University Centre for Feline Nutrition for their assistance with
conducting this study that was conducted under Massey University Animal Ethics Committee approval MUAEC Protocol
13/44.
References
Andrews, C.J., Potter, M.A. and Thomas, D.G. 2015. Applied Animal Behavioural Science 173, 17-21.
Lascelles, B.D.X., Hansen, B.D., Thomson, A., Pierce, C.C., Boland, E. and Smith, E.S. 2008. Veterinary Anaesthesia and
Analgesia 35, 173-183.
Piccione, G., Marafioti, S., Giannetto, C., Panzera, M. and Fazio, F. 2013. Journal of Veterinary Behavior: Clinical
Applications and Research 8, 189-194.
Watanabe, S., Izawa, M., Kato, A., Ropert-Coudert, Y., Naito, Y. 2005. Applied Animal Behavioural Science 94, 117-131.
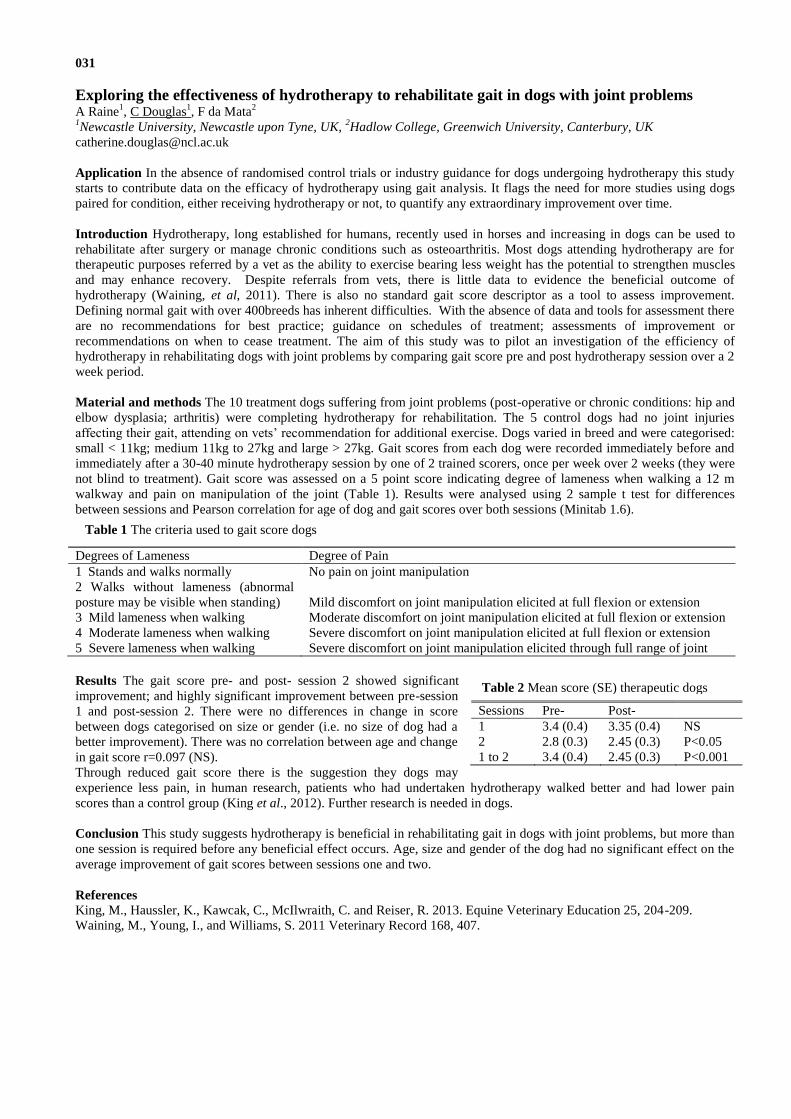
Table 2 Mean score (SE) therapeutic dogs
031
Exploring the effectiveness of hydrotherapy to rehabilitate gait in dogs with joint problems A Raine
1, C Douglas
1, F da Mata
2
1Newcastle University, Newcastle upon Tyne, UK,
2Hadlow College, Greenwich University, Canterbury, UK
Application In the absence of randomised control trials or industry guidance for dogs undergoing hydrotherapy this study
starts to contribute data on the efficacy of hydrotherapy using gait analysis. It flags the need for more studies using dogs
paired for condition, either receiving hydrotherapy or not, to quantify any extraordinary improvement over time.
Introduction Hydrotherapy, long established for humans, recently used in horses and increasing in dogs can be used to
rehabilitate after surgery or manage chronic conditions such as osteoarthritis. Most dogs attending hydrotherapy are for
therapeutic purposes referred by a vet as the ability to exercise bearing less weight has the potential to strengthen muscles
and may enhance recovery. Despite referrals from vets, there is little data to evidence the beneficial outcome of
hydrotherapy (Waining, et al, 2011). There is also no standard gait score descriptor as a tool to assess improvement.
Defining normal gait with over 400breeds has inherent difficulties. With the absence of data and tools for assessment there
are no recommendations for best practice; guidance on schedules of treatment; assessments of improvement or
recommendations on when to cease treatment. The aim of this study was to pilot an investigation of the efficiency of
hydrotherapy in rehabilitating dogs with joint problems by comparing gait score pre and post hydrotherapy session over a 2
week period.
Material and methods The 10 treatment dogs suffering from joint problems (post-operative or chronic conditions: hip and
elbow dysplasia; arthritis) were completing hydrotherapy for rehabilitation. The 5 control dogs had no joint injuries
affecting their gait, attending on vets’ recommendation for additional exercise. Dogs varied in breed and were categorised:
small < 11kg; medium 11kg to 27kg and large > 27kg. Gait scores from each dog were recorded immediately before and
immediately after a 30-40 minute hydrotherapy session by one of 2 trained scorers, once per week over 2 weeks (they were
not blind to treatment). Gait score was assessed on a 5 point score indicating degree of lameness when walking a 12 m
walkway and pain on manipulation of the joint (Table 1). Results were analysed using 2 sample t test for differences
between sessions and Pearson correlation for age of dog and gait scores over both sessions (Minitab 1.6).
Results The gait score pre- and post- session 2 showed significant
improvement; and highly significant improvement between pre-session
1 and post-session 2. There were no differences in change in score
between dogs categorised on size or gender (i.e. no size of dog had a
better improvement). There was no correlation between age and change
in gait score r=0.097 (NS).
Through reduced gait score there is the suggestion they dogs may
experience less pain, in human research, patients who had undertaken hydrotherapy walked better and had lower pain
scores than a control group (King et al., 2012). Further research is needed in dogs.
Conclusion This study suggests hydrotherapy is beneficial in rehabilitating gait in dogs with joint problems, but more than
one session is required before any beneficial effect occurs. Age, size and gender of the dog had no significant effect on the
average improvement of gait scores between sessions one and two.
References
King, M., Haussler, K., Kawcak, C., McIlwraith, C. and Reiser, R. 2013. Equine Veterinary Education 25, 204-209.
Waining, M., Young, I., and Williams, S. 2011 Veterinary Record 168, 407.
Degrees of Lameness Degree of Pain
1 Stands and walks normally No pain on joint manipulation
2 Walks without lameness (abnormal
posture may be visible when standing)
Mild discomfort on joint manipulation elicited at full flexion or extension
3 Mild lameness when walking Moderate discomfort on joint manipulation elicited at full flexion or extension
4 Moderate lameness when walking Severe discomfort on joint manipulation elicited at full flexion or extension
5 Severe lameness when walking Severe discomfort on joint manipulation elicited through full range of joint
Sessions Pre- Post-
1 3.4 (0.4) 3.35 (0.4) NS
2 2.8 (0.3) 2.45 (0.3) P<0.05
1 to 2 3.4 (0.4) 2.45 (0.3) P<0.001
Table 1 The criteria used to gait score dogs
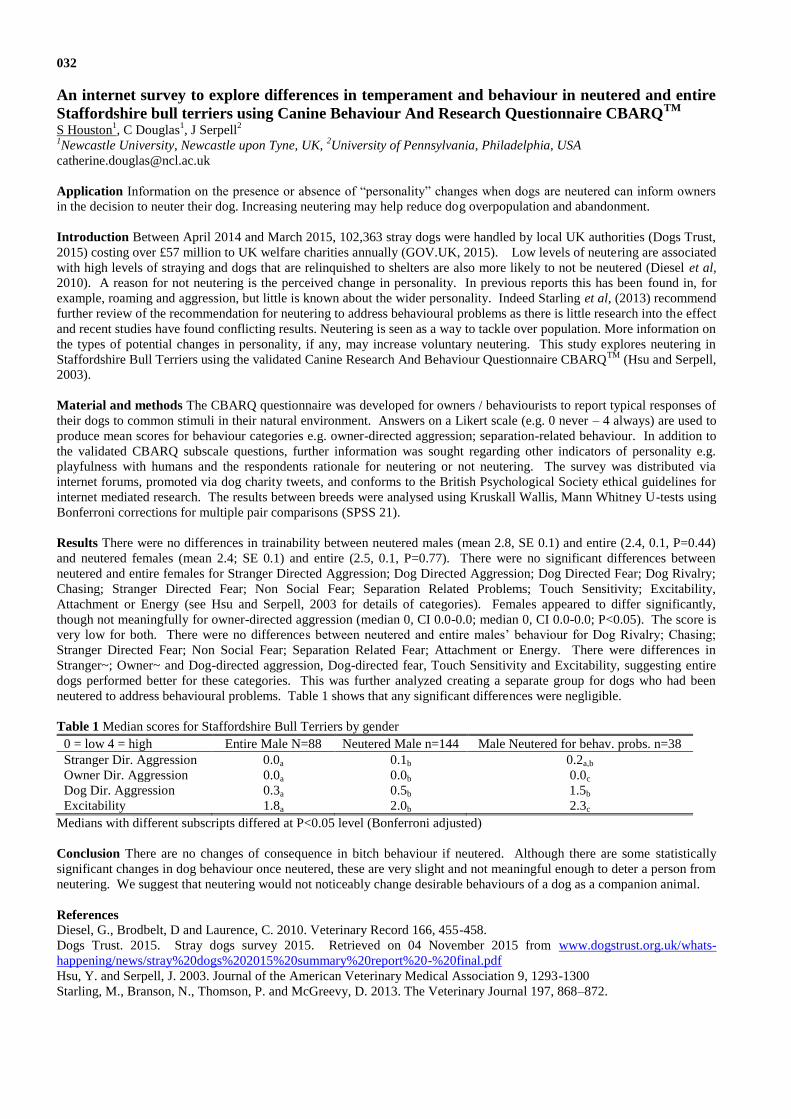
032
An internet survey to explore differences in temperament and behaviour in neutered and entire
Staffordshire bull terriers using Canine Behaviour And Research Questionnaire CBARQTM
S Houston
1, C Douglas
1, J Serpell
2
1Newcastle University, Newcastle upon Tyne, UK,
2University of Pennsylvania, Philadelphia, USA
Application Information on the presence or absence of “personality” changes when dogs are neutered can inform owners
in the decision to neuter their dog. Increasing neutering may help reduce dog overpopulation and abandonment.
Introduction Between April 2014 and March 2015, 102,363 stray dogs were handled by local UK authorities (Dogs Trust,
2015) costing over £57 million to UK welfare charities annually (GOV.UK, 2015). Low levels of neutering are associated
with high levels of straying and dogs that are relinquished to shelters are also more likely to not be neutered (Diesel et al,
2010). A reason for not neutering is the perceived change in personality. In previous reports this has been found in, for
example, roaming and aggression, but little is known about the wider personality. Indeed Starling et al, (2013) recommend
further review of the recommendation for neutering to address behavioural problems as there is little research into the effect
and recent studies have found conflicting results. Neutering is seen as a way to tackle over population. More information on
the types of potential changes in personality, if any, may increase voluntary neutering. This study explores neutering in
Staffordshire Bull Terriers using the validated Canine Research And Behaviour Questionnaire CBARQTM
(Hsu and Serpell,
2003).
Material and methods The CBARQ questionnaire was developed for owners / behaviourists to report typical responses of
their dogs to common stimuli in their natural environment. Answers on a Likert scale (e.g. 0 never – 4 always) are used to
produce mean scores for behaviour categories e.g. owner-directed aggression; separation-related behaviour. In addition to
the validated CBARQ subscale questions, further information was sought regarding other indicators of personality e.g.
playfulness with humans and the respondents rationale for neutering or not neutering. The survey was distributed via
internet forums, promoted via dog charity tweets, and conforms to the British Psychological Society ethical guidelines for
internet mediated research. The results between breeds were analysed using Kruskall Wallis, Mann Whitney U-tests using
Bonferroni corrections for multiple pair comparisons (SPSS 21).
Results There were no differences in trainability between neutered males (mean 2.8, SE 0.1) and entire (2.4, 0.1, P=0.44)
and neutered females (mean 2.4; SE 0.1) and entire (2.5, 0.1, P=0.77). There were no significant differences between
neutered and entire females for Stranger Directed Aggression; Dog Directed Aggression; Dog Directed Fear; Dog Rivalry;
Chasing; Stranger Directed Fear; Non Social Fear; Separation Related Problems; Touch Sensitivity; Excitability,
Attachment or Energy (see Hsu and Serpell, 2003 for details of categories). Females appeared to differ significantly,
though not meaningfully for owner-directed aggression (median 0, CI 0.0-0.0; median 0, CI 0.0-0.0; P<0.05). The score is
very low for both. There were no differences between neutered and entire males’ behaviour for Dog Rivalry; Chasing;
Stranger Directed Fear; Non Social Fear; Separation Related Fear; Attachment or Energy. There were differences in
Stranger~; Owner~ and Dog-directed aggression, Dog-directed fear, Touch Sensitivity and Excitability, suggesting entire
dogs performed better for these categories. This was further analyzed creating a separate group for dogs who had been
neutered to address behavioural problems. Table 1 shows that any significant differences were negligible.
Table 1 Median scores for Staffordshire Bull Terriers by gender
0 = low 4 = high Entire Male N=88 Neutered Male n=144 Male Neutered for behav. probs. n=38
Stranger Dir. Aggression 0.0a 0.1b 0.2a,b
Owner Dir. Aggression 0.0a 0.0b 0.0c
Dog Dir. Aggression 0.3a 0.5b 1.5b
Excitability 1.8a 2.0b 2.3c
Medians with different subscripts differed at P<0.05 level (Bonferroni adjusted)
Conclusion There are no changes of consequence in bitch behaviour if neutered. Although there are some statistically
significant changes in dog behaviour once neutered, these are very slight and not meaningful enough to deter a person from
neutering. We suggest that neutering would not noticeably change desirable behaviours of a dog as a companion animal.
References Diesel, G., Brodbelt, D and Laurence, C. 2010. Veterinary Record 166, 455-458.
Dogs Trust. 2015. Stray dogs survey 2015. Retrieved on 04 November 2015 from www.dogstrust.org.uk/whats-
happening/news/stray%20dogs%202015%20summary%20report%20-%20final.pdf
Hsu, Y. and Serpell, J. 2003. Journal of the American Veterinary Medical Association 9, 1293-1300
Starling, M., Branson, N., Thomson, P. and McGreevy, D. 2013. The Veterinary Journal 197, 868–872.

033
Comparing welfare of dogs in rescue shelters and owner homes using a pragmatic location-based
cognitive bias task A East, C Douglas
Newcastle University, Newcastle upon Tyne, UK
Application This pragmatic test could be used for assessing cognitive bias in dogs and maybe other species.
Introduction Cognitive bias tasks, originating in human psychology, have been used to indicate welfare in rats, starlings,
sheep, pigs, rabbits, and with difficulties in dogs (Burman et al., 2008). It is an expanding research area as it measures the
presence of positive emotional states. Quality of life is becoming recognised as important in animal welfare assessment.
The rationale is that affective (emotional) state can influence cognitive processing: positive states associated with
‘optimistic’ biases; negative with ‘pessimistic’. Measuring an animals’ classification of ambiguous stimuli gives an
indication of its affective state. The aim of the study was to determine whether dogs could be trained and assessed in a
simple location-based cognitive bias task, and whether this could be used to compare affective state in dogs housed in
rescue shelters and owner-homes. The hypothesis was that rescue shelter dogs would have more pessimistic bias.
Method Rescue shelter dogs (n=10) or owned dogs (n=10) varying in breed,
age, sex, time in environment were trained on a “go/no-go” task using a small
set of 3 drawers. Each dog had 1 hour training per day (two 15min sessions
morning and afternoon). Figure 1 shows the dog was 6 metres from an assistant
who opened the top drawer of a portable set of drawers. The experimenter (the
same for each dog) said “go”, if the dog approached the top drawer within 60sec
it received a food reward (5 repetitions per session i.e. 20/d). Latency of
approach was recorded. The dog was considered successfully trained when it
approached 16/20 occasions (binominal test, P<0.05). The unrewarded bottom
drawer cue was then introduced: 4 sessions per day as above but with 10 random
cue presentations per session (rewarded or unrewarded sequence determined by
tossing a coin until 10 of each cue). The top cue continued to be rewarded, opening the bottom cue was not rewarded. A
“go” response was a pull on the lead to move forwards. The dog was considered able to discriminate when it reached 16/20
correct responses in the random sequence (“go” to top cues and “no-go” to bottom cues). The dog’s go/no-go and latency
was then tested with a single ambiguous cue (opening the middle drawer, no reward). Dogs were trained and tested
individually in a familiar field belonging to the shelter, or owners’ garden. Independent samples T-tests compared latency
to respond to rewarded and unrewarded cues and time to reach training success criterion. Pearson correlation was used for
associations between age and latency to approach; chi-square was used to determine differences in response to the
ambiguous stimuli.
Results There was no difference in latency to approach the rewarded cue (rescue
12.5sec SE 2.4; owned 14sec SE 2.3 P=0.66). Rescue dogs took longer to reach
training criteria for the rewarded cue (mean 10days, SE 0.7) than owned (7days, SE
0.5 p<0.001) and took longer to train to discriminate between rewarded and
unrewarded cues (rescue mean 19.6days SE 0.3; owned mean 17.2, SE 0.7 p<0.01).
Table 1 shows no significant differences were found between the housing groups in
interpretation of the ambiguous stimuli. Supporting this there was no significant
difference between the groups in latency to approach the ambiguous stimuli (rescue
mean 16sec, SE 3.5; owned 21, SE 3.7). Analysis using both groups found that
older dogs took longer to approach the ambiguous cue (r=0.56 p<0.001). We
suggest that either the shelter environment promotes a similar affective state to a
home environment (in this shelter dogs have their own space, daily conspecific
social contact and 1-3 walks per day) or the test situation is stimulating a positive
affective state.
Conclusion Dogs can be trained to this pragmatic cognitive bias task, as such it has potential for use in cognitive bias
studies in dogs and perhaps other animals. The benefits include limited equipment, limited movement of animal or
handling of animals. Refinements could include testing dogs in the first few days after arrival at a shelter (the hypothesis
being they are more stressed), this could explore the sensitivity of the test. Further refinements include testing in the dog’s
home pens or house and automating the training to remove any associations (positive or negative) with humans.
References Burman, O., McGowan, R., Mendl, M., Norling, Y., Paul, E., Rehn, T., and Keeling, L. 2011. Applied Animal Behaviour
Science 132, 160-168.
go no-go
Owned
observed 4 6
expected 5.5 4.5
Shelter
observed 7 3
expected 5.5 4.5
Chi-squared 0.91 p<0.27
Table 1 The dogs’ classification
of the ambiguous stimuli

Table 1 Median CBARQ scores for parent breeds and NRCBD (with 95% CI)
034
Comparing the temperament of Newly Recognised Cross-Breed Dogs (Labradoodles and
Cockapoos) and parent breeds using Canine Behaviour And Research Questionnaire A Bradley
1, C Douglas
1, J Serpell
2
1Newcastle University, Newcastle upon Tyne, UK,
2University of Pennsylvania, Philedelphia, USA
Application Standardised temperament profiles for both Newly Recognised Cross-Breed Dogs (NRCBD) and existing
breeds, such as those generated via the Canine Behaviour And Research Questionnaire (CBARQTM
) will help align owners’
desired temperament in a canine companion with that of a suitable breed.
Introduction Kennel Club (KC) breeds have “breed standards” defining aspects of appearance and temperament, thus
potential owners can choose a breed based on a likely temperament. There are no such breed standards for NRCBD for
breeders to breed towards and no temperament research has been conducted despite their increasing popularity. Behaviour
perceived as a problem by the owner is a major reason for relinquishing dogs, when it may represent a misalignment
between typical breed behaviour and naïve owner expectation. Some NRCBD have received negative media publicity, but
there is no research to support or refute claims. It could also be argued that breed standards contain invalidated descriptors
which make it impossible to compare breeds (‘intelligent, biddable, a will to please, affectionate, full of life, exuberance,
gay-spirited” are a selection from various KC breed standards). This study explores differences between Labradoodles and
Cockapoos with their parent breeds. It uses the validated CBARQTM
(Hsu and Serpell, 2003) developed for owners /
behaviourists to report typical responses of the dogs to common stimuli in their natural environment, for example
separation-related behaviour, thus removing confounding factors in test situations.
Material and methods The link to the 101 question CBARQ (for details of this survey, its validation, reliability and
calculations of behavioural category scores, see Hsu and Serpell, 2003) was distributed on-line via 14 breed-specific dog
forums, generating 215 usable questionnaires. Answers were on Likert scales (0 never performs a behaviour to 4 always).
The CBARQ tool generated behavioural category scores from related questions (see Table 1 for examples of categories).
Differences in behavioural category scores between NRCBD and parent breeds were analysed using Kruskall Wallis and
Mann Whitney U tests (only Bonferroni corrected significances are reported e.g. P<0.017 or P<0.025 is equivalent to
significance at the P<0.05 level, SPSS 21). The study was approved by the University’s Animal Welfare Ethical Review
Board and adheres to British Psychological Society’s ethical guidelines for internet mediated research.
Results Table 1 is a summary of
medians for all breeds where
significant differences were
found. Only the comparisons
below between NRCBD and their
parent breeds were significantly
different: Poodles was more
trainable than Labradoodles
(P<0.017). Labradoodles had
higher familiar dog
aggression/rivalry (P<0.017) and
were more excitable than
Labradors (P<0.025). Labradors
engaged in copraphagia more
than Labradoodles (P<0.017).
Labradoodles lead pull
(P<0.017), bark more (P<0.017)
and escape/roam more (P<0.017)
than Poodles. Cockapoos
performed better than Cocker
Spaniels for trainability; owner
directed aggression; begging;
food stealing; lead pulling;
(P<0.017), escaping/roaming
(P<0.025), but chased more than
Poodles (P<0.017).
Conclusion Only small statistically significant differences were observed. When looking at the medians and CIs it can be
seen that none of these traits would be problematic at an applied level and all breeds are potentially well-behaved
companions, unlikely to indicate innate problem behaviours in an applied context. Generating standardised subscale
reports for all breeds and NRCBDs would help owner decisions when considering acquiring one breed relative to another,
as the invalidated emotive descriptors published by the breed clubs are not helpful when comparing breeds and CBARQ
would be a useful tool for this.
References Hsu, Y. and Serpell, J. 2003. Journal of the American Veterinary Medical Association 9, 1293-1300
0 = low Poodle labrador C.Spaniel Doodle Cockapoo 4 = high n=53 n=27 n=37 n=39 n=59
Trainability 3.13 3.13 2.82 2.88 3.07 3.00 - 3.25 2.75 - 3.38 2.50 - 3.00 2.63 - 3.00 2.75 - 3.14
Owner Dir. Aggression 0.00 0.00 0.13 0.00 0.00 0 - 0 0 - 0 0.00 - 0.25 0 - 0 0 - 0
Dog Rivalry 0.25 0.00 0.38 0.00 0.00 0.00 - 0.67 0 - 0 0.00 - 1.00 0.00 - 0.25 0.00 - 0.50
Separation Problems 0.38 0.00 0.25 0.25 0.13 0.13 - 0.50 0.00 - 0.25 0.25 - 0.50 0.00 - 0.38 0.00 - 0.38
Excitability 1.83 1.83 2.00 2.33 1.83 1.80 - 2.17 1.50 - 2.33 1.83 - 2.50 2.00 - 2.50 1.50 - 2.33
Chasing 2.00 1.75 2.25 2.25 2.63 1.67 - 2.50 1.50 - 2.50 1.50 - 2.67 1.75 - 2.75 2.25 - 3.00
Copraphagia 1.00 2.00 0.00 1.00 1.00 0.00 - 2.00 1.00 - 2.00 1.00 - 2.00 0.00 - 1.00 1.00 - 1.00
Begging 1.00 1.00 1.00 1.00 0.00 0.00 - 1.00 1.00 - 2.00 1.00 - 2.00 0.00 - 1.00 0.00 - 1.00
Food Stealing 1.00 0.00 1.00 1.00 0.00 0.00 - 1.00 0.00 - 2.00 1.00 - 2.00 1.00 - 2.00 0.00 - 1.00
Pulling on leash 1.00 1.00 1.00 2.00 1.00 0.00 - 1.00 1.00 - 2.00 1.00 - 2.00 1.00 - 2.00 0.00 - 2.00
Barking 1.00 0.00 2.00 1.00 1.00 1.00 - 1.00 0.00 - 1.00 1.00 - 3.00 0.00 - 1.00 1.00 - 1.00
Escape/roam 0.00 0.00 1.00 1.00 0.00
0.00 -1.00 0.00 - 1.00 0.00 - 2.00 0.00 - 1.00 0.00 - 1.00

035
Survey of floor types used on Northern Ireland beef farms V Murphy
1,2, D E Lowe
1, F Lively
1, D I Matthews
3
1Agri-Food and Biosciences Institute, Hillsborough, County Down, UK,
2Queen's University Belfast, UK,
3Agri-Food and
Biosciences Institute, Newforge, Belfast, UK
Application This study will provide a greater knowledge of the floor types beef cattle in Northern Ireland (NI) are most
likely to experience, and give a better understanding of farmer’s perception of welfare on these different floor types.
Introduction Much of the previous research, which indicated that animals accommodated on concrete slats had poorer
welfare than those on straw-bedded systems, has been carried out using bulls which were intensively reared and finished on
fully slatted flooring. This has led to some UK retailers having a lack of confidence in the welfare of beef cattle which have
been reared and finished on concrete slats. However, European systems outlined above are in contrast to grass-based
systems common in UK and Ireland, where cattle are only housed during the winter months and are grazed outdoors during
the summer months. The majority of NI cattle are accommodated on concrete slats, which is perceived poorer for welfare.
Unlike mainland UK (which mainly use straw bedded systems), NI only has sufficient straw to bed 20% of beef cattle
(AgriSearch, 2003), making it a limited and expensive resource. The aim of this survey is to evaluate farmer’s perceptions
of beef cattle welfare on different floor types in NI.
Material and methods A stratified sample of 150 farms with 100 or more cattle intended for slaughter was selected from a
total farm population of approximately 500 farms which were derived from the NI Agricultural Census (June 2013) data. A
30% proportional stratified sample was selected stratified by the number of cattle intended for slaughter into two size
groups, 100-199, 200 + and also by the county of farm. These farm size groups were chosen as it has been demonstrated
by the NI Agricultural Census (June 2013), that the majority of beef cattle are found in these categories, providing a better
representation of the floor type beef cattle are finished on. An additional replacement sample was also selected to provide
replacement farms for non-responding farms on the original sample. The survey contained 63 questions covering farmer’s
perception of welfare on different floor types, reasons for choosing current floor types and farmer’s perception as to what
they believed to be most important for animal welfare. The level of importance and rating of welfare was measured using
the Likert scale, 1 represents the lowest rating and 5 the highest. A questionnaire and coding scheme was then devised
containing 390 variables incorporating questions on aspects of beef farming and outline data was collected on the houses
and the floor types used on each farm. Data was collected by a combination of farm visits and phone responses. A total of
100 farms provided data for the final sample. The final data was combined with the variable labels and categories to create
a final SPSS dataset and data validation was carried out on the dataset. Summary descriptive analyses were carried out on
all the data estimating the proportions and number of farms for all variables. Further statistical analyses were carried out to
test selected hypothesis appropriate to the data types using IBM SPSS Statistics Version 22.
Results The majority of farms have more than one type of flooring to accommodate their cattle. The results show that 73%
of farms have concrete slats, 45% rubber flooring and 43% a solid floor with bedding material. Farmers perceived that a
greater frequency of slipping events, incidence of lameness, leg and tail injuries occurred in cattle accommodated on
concrete slats and least in bedded systems. There was no significant difference between concrete slats and rubber (Table
1).
Table 1 Farmer’s perceptions of beef cattle welfare on different floor types in Northern Ireland
Floor type
Welfare assessment1 Concrete slats Rubber Bedding Significance
2
Slipping (%) 46.6a 33.3
a 2.3
b ***
Lameness (%) 47.9a 31.1
a 9.3
b ***
Leg injuries (%) 23.3a 17.8
a 2.3
b **
Tail injuries (%) 12.3a 8.9
a 0.0
b *
1 Welfare assessment based on farmers perceived occurrence during last 12 months
2 Chi-squared comparison test between concrete slats and bedding
a,b Percentages in the same row with the same superscript do not differ significantly (P >0.05).
Conclusion This survey indicates that farmers perceive the welfare of beef cattle to be highest on a solid floor with bedding
material and lowest on concrete slats. However, these are perceptions and further research is required to clarify this.
Acknowledgements The authors gratefully acknowledge DARD for funding and the farmers who participated in the
survey.
References AgriSearch. 2003. The effect of housing system on performance, behaviour and welfare of beef cattle.

036
Do ewes respond differently to the severity of pain experienced by their twin lambs after one is
subject to a more painful procedure than the other? A Collins
2, C Douglas
1, T Hockridge
1, A Simpson
1, V Molony
2, J Kent
2
1Newcastle University, Newcastle upon Tyne, UK,
2Royal (Dick) School of Veterinary Studies, Edinburgh, UK
Application The use of analgesic treatments for painful procedures in young livestock animals could improve the dams’
welfare as well as that of the lambs.
Introduction The sustainability of an agricultural system depends on its ethical justification. Of particular concern are the
painful procedures on farm animals such as tail docking and castration in lambs. Studies have generally focused on the
animals experiencing pain, but some studies indicate that animals may show empathy and can be stressed by observing the
effects of procedures experienced by conspecifics (e.g. Howarth and Leach, 2015). Recent studies have shown that ewes
show particular behavioural responses when their lambs have undergone painful castration procedures, and that they
showed more maternal care the more severe the painful procedure, in the twins studied one was an untreated control (Futro
et al. 2015; Hild et al, 2011). The study reported here, was to determine whether ewes would differentiate between pain
produced by procedures of different severity, carried out on each of the twin lambs. Novel object/food approach tests were
used, on the ewes, to determine changes in cognitive bias and to help determine if the procedures on the lambs (within the
previous 30mins) had an effect on the ewe’s affective state and thus her welfare.
Material and methods This study used North of England Mule ewes with twin Texel lambs. In 12 ewes one twin acted as
a control lamb (experiencing handling but no procedure) and the other twin was subject to tail docking or castration using
rubber rings (control v pain); In another 8 ewes one twin was subjected to tail docking and the other to either castration or
castration and tail docking using rubber rings. Ewes and lambs were housed in straw-bedded individual pens (1.8mx1.2m)
in a commercial lambing shed. Behavioural observations (30 minutes, immediately post procedure) were made in situ, they
included: point sampling of proximity (every 2 minutes using distance between ewe’s head and lamb <10cm, 10-50cm or
50+cm) and continuous recording of the ewes’ behaviours towards each lamb (contacts, sniffs, licks, glances and pawing).
Lamb behaviour was continuously recorded over the 30 minutes focusing on the lesser observed and researched behaviours
(Kent, personal communication, 2015) of tremble, lip curl, suckle, play and vocalise (after Molony et al, 2002). The novel
object/food approach test was designed to be a pilot spontaneous cognitive bias test. The bucket was novel thus potentially
fear inducing, but it smelled like food, so potentially have been rewarding, hence an ambiguous stimulus. The ewe’s
response of approach/not approach would assess her categorisation of the stimulus as positive or negative (respectively)
and that this would reflect her underlying affective state (see Douglas et al, 2011).
Results No differences were found in the percentage of time ewes spent <10cm from lambs for either twins experiencing
control vs pain (P=0.105) or for a lesser pain versus a more severe pain (P=0.621). The percentage of time ewes spent at
<10cm from pairs of lambs with different treatments, was not different between control versus pain when compared with
lesser pain versus more severe pain (P=0.453). There were more ewe behaviours directed towards the lambs in pain versus
the untreated control lambs (P=0.003), but no difference in the ewe’s behaviour towards a particular twin when one was
experiencing a lesser pain and the other a more severe pain (P=0.382). No differences (P=0.166) were found, in the total
number of ewe behaviours directed towards twin lambs, between the untreated control versus pain group and the lesser pain
versus more severe pain group. The frequency of behaviours associated with pain was different between untreated control
and lesser pain (P=0.043), but was not different between lesser and more severe pain (P=0.794). No differences were found
in novel object/food approach test between control ewes with untreated lambs and ewes whose lambs had undergone
painful procedures (10/15 control ewes and 5/10 ewes with treated lambs approached, chi square 0.69 P=0.36). Some ewes
in each group were lame and this may have affected their responses to the novel object tests.
Conclusion Ewes focused more attention on the twin lamb in pain when one was in pain and the other not. There were no
differences in the ewes’ attentiveness when both lambs were in pain. No difference in attention by the ewes was found if
the pain was more severe in one lamb than the other. This suggests that ewes either do not differentiate between the
responses of the lambs to the two different treatments or that both treatments elicit the same (maximum) response.
However, further refinements to analysis of the observations will be necessary before drawing this conclusion. Increased
sample size and more rigorous selection criteria for ewes on health grounds is recommended if further research is to be
carried out.
References
Douglas, C., Bateson, M., Walsh, C., Bédué A. and Edwards, S. 2011 Applied Animal Behavious Science 139. 65-73.
Futro, A., Masłowska, K. and Dwyer, C. 2015. Plos One Vol 10 7
Hild, S., Clark, C., Dwyer, C., Murrell, J., Mendl, M. and Zanella, A. 2011. Applied Animal Behavious Science 132, 114-
120.
Howarth, E and Leach, M. 2015. BSc Thesis Newcastle University
Molony, V., Kent, J., and McKendrick, I. 2002. Applied Animal Behaviour Science 76. 215–238.

037
Monitoring and modelling dust concentration and animal activity in broiler houses
T G M Demmers1, T van Hertem
3, L Rooijakkers
3, A Youssef
2
1Royal Veterinary College, London, UK,
2Katholieke Universiteit Leuven, Belgium,
3Fancom BV, Panningen, The
Netherlands
Application Using EyeNamic activity sensors as a proxy for monitoring dust concentration in broiler houses.
Introduction Precision Livestock Farming (PLF) technology provides continuous measurement of key production and
welfare indicators on livestock farms, such as animal growth and activity, through image and sound analysis and other key
sensors, with some applications developed into commercial products. Animal activity and dust concentration have been
shown to be correlated (Demmers et al, 2010) and potentially this relationship can be used to manipulate the overall
emission rate of dust from the broiler house. The aim of this study was to model the relationship between broiler activity,
ventilation rate, broiler weight and measured dust concentrations.
Material and methods A mechanically ventilated broiler house (capacity 55.000 birds) was used for the experimental
work. Dust concentration was measured below two (out of 18) ridge extract fan shafts using DustTrac DRX 8533 analysers
(TSI Ltd). Ventilation rate was measured using three full size measuring fans (Fancom BV) fitted below the extract fans of
ventilation stages 1, 2 and 3 (out of 6), as well as the duration each fan was operational. Broiler activity was measured
using eYeNamic (Fancom BV), consisting of 4 cameras mounted equidistant in the ridge of the house. Light/dark cycle
variations, including dawn/dusk for 30 minutes, were implemented and, in addition, natural daylight from side wall
windows was used at variable intervals during the growing cycle. To model the dynamics of the dust concentration in
relation to broiler activity, a transfer function modelling approach was used (Aerts et al, 2000). The proposed multiple
input single output model (MISO) had two inputs, broiler activity and ventilation rate, and a single output (figure 1).
Broiler weight was not yet used as a disturbance in the model. The transfer function model was used to estimate the order
of the MISO model and the model parameters using two datasets, each comprising a full growing cycle. Further data sets
will be used to validate the model.
Figure 1 Proposed MISO model for estimating the dust concentration from the broiler activity and ventilation rate.
Results Dust concentration showed a regular pattern in relation to animal activity, with both dropping at the start and
quickly rising at the end of dark periods (during the dark periods eYeNamic is unable to provide data on activity levels).
The larger particles (PM10 and total dust) were clearly increasing with the animal activity, whereas the smaller particles,
PM1, were reduced by increasing ventilation rate. Dust concentration and broiler activity were correlated at the start of
growing cycle, with correlation coefficients of 0.59 and 0.60 for PM1 and total dust respectively, but less so towards the
end of the crop resulting in a poor overall correlation with coefficients of 0.36 and 0.39 for PM1 and total dust respectively.
The developed first order model estimated the dust concentration well, with separate values for the model parameters of the
small and large particle sizes (Table 1).
Table 1 Parameters for the MISO model predicting the dust concentration from the broiler activity and ventilation rate.
Average R2T Steady State Gain (mean ± std)
Ventilation Activity
PM1 0.97 -1.58 ± 0.53 0.5 ± 0.26
Total Dust 0.91 0.05 ± 0.046 0.82 ± 0.64
Conclusion Dust concentrations are not only clearly related to the level of broiler activity and ventilation rate, but can also
be estimated, based on these variables, using transfer function models. The developed model provides an accurate estimate
of the dust concentration (over various size fractions), which can be used to modify the overall dust emission of the
building.
Acknowledgements This project has received funding from the European Union’s Seventh Framework Programme for
research, technological development and demonstration under grant agreement nr 311825.
References
Aerts, J.M., Berckmans, D., Saevels, P., DeCuypere, E. and Buyse, J. 2000. Britisch Poultry Science 41, 651-659
Demmers, T.G.M., Saponja, A., Thomas, R., Phillips, G., McDonald, A., Stagg, S., Bowry, A., and Nemitz, E. 2010.
Proceedings CIGR XV11 World Congress, 10pp
y(k) = dust concentration B(z)/A(z) = steady state gain
u1(k)= ventilation rate k = discrete time step
u2(k)= activity z
-1 = backward shift operator

038
Weight gain in calves weaned naturally compared with calves weaned by separation from their
mother D Albertsen
University of Bristol, UK
Application In an attempt to improve weaner calf welfare, the effects of weaning and housing methods on their daily
weight gain were explored. Spring born suckler beef calves gained more weight between February and April when left with
their mother and less when weaned by separation. Housed calves gained more weight between February and April than
calves at pasture.
Introduction The losses through impaired performance suckler beef calves experience as a result of stress induced by the
separation from their mothers are accepted by the industry and the veterinary profession (Enriquez et al., 2011). Several
methods have been investigated to ease the calf’s adaption to life without its mother, with the main attention given to fence
line weaning (Price et al., 2003) and two step weaning (Haley et al., 2005). As an additional alternative the consequences
of natural weaning, without separation of cow and calf were the focus of this study. The hypothesis was that the calf’s
physical development would benefit if it remained with its mother and that this would happen at the expense of the cow’s
condition.
Material and methods Between February and April forty Aberdeen Angus cows and their calves were exposed to one of
four treatments: cow and calf housed together, cow and calf at pasture together, cow and calf separated with calves housed
and cows at pasture, and cow and calf separated with calves at pasture and cows housed. Pasture grass and hay for the
housed animals was fed at libitum. Each animal received an equal amount of concentrates every day. All animals were
under the same management and closely observed for disease. The groups were balanced for age (cows and calves), gender
and breed (calves) and weighed twice: on the first day of the trial in February and on two days in April. The weight
difference between the first and the second weighing was calculated for every animal and because of the differences in
breeds, calf ages and durations between weighings, growth was expressed in percent weight difference from the first
weight. An average weight difference was then established separately for calves and cows of every treatment group. Data
were analysed using ANOVA.
Results Remaining with their mother had a highly significant effect on calf weight gain (P<0.001). Being housed compared
to pastured had a significant effect on calf weight gain (P=0.042). Retaining her calf had a significant effect on cow weight
loss (P=0.006). Being housed compared to pastured had no significant effect on cow weight (P=0.88).
Table 1 Average weight difference of cows and their calves in four different husbandry systems
Treatment Group Calf weight difference (%) Cow weight difference (%)
Together, housed 8.95 (SD 5.32) 0 (SD 4.4)
Together, pastured 6.29 (SD 5.36) -0.89 (SD 3.26)
Separated, calves housed, cows pastured 3.15 (SD 3.74) 3.43 (SD 3.05)
Separated, calves pastured, cows housed -3.58 (SD 7.62) 4.23 (SD 6.43)
Conclusion This trial indicates that suckler beef calves’ weight gains benefit from remaining with their mothers to be
weaned naturally. A weight loss was noted in the cows retaining their calves at pasture, but not when housed.
Acknowledgements The author gratefully acknowledges funding from Harley Farms (South)
References
Enriquez, D., Hötzel, M.J., Ungerfeld, R. 2011. Acta Veterinaria Scandinavia 53, 28
Haley, D.B., Bailey, D.W., Stookey, J.M. 2005. Journal of Animal Science 83, 2205-2214
Price, E.O., Harris, J.E., Borgwardt, R.E., Sween, M.L., Connor, J.M. 2003. Journal of Animal Science 81, 116-121

039
Risk factors for respiratory disease in dairy heifer calves on commercial farms in SE England K Johnson, C Burn, D C Wathes
Royal Veterinary College, Hatfield, UK
Application Understanding risk factors for respiratory disease in dairy heifers can inform farm management to improve
disease prevention. Reducing respiratory disease would improve calf health, welfare and performance.
Introduction Dairy heifer calves have high rates of contagious disease and mortality (Brickell et al., 2009). Respiratory
disease is known to be a common cause of death and long term reduced performance in heifer calves by delaying age at
first calving and reducing the chance of completing a successful first lactation (Bach, 2011). The number of weeks with
respiratory disease has been shown to have a long term impact on calf performance and can be used as an indicator of
disease severity (Bach, 2011). There have been no studies of risk factors for respiratory disease on commercial UK dairy
farms to inform farm management.
Material and methods Dairy heifers (n=492) were recruited at birth from 11 farms in SE England. In the first week of life
a serum sample was taken to measure IgG by radial immunodiffusion. Calves were then checked weekly for disease from
weeks 1-9 using the Wisconsin calf health scoring system (McGuirk, 2008). Calves with pyrexia and a sign of respiratory
disease (score ≥5) were classed as having disease. IGF1 in blood was measured at weeks 1, 5 and 9. Husbandry factors
assessed included type of housing and amount of milk fed. A generalised mixed model was used to calculate the odds of a
calf having any respiratory disease and a linear mixed model was used to analyse the variable of disease duration.
Results About half the animals (266/492, 54%) had no recorded respiratory disease. The odds of having any respiratory
disease were reduced by having higher IgG at recruitment (indicating improved passive transfer of immunity), by being
housed in a fixed group rather than a continuous flow system and by being fed more milk solids in the second month of life.
The effect of milk fed was, however, of marginal statistical and practical significance.
Affected calves (n=226) had between 1 and 6 weeks with disease. The model for the number of weeks for which a calf had
respiratory disease explained a wider range of variation observed (Table 1). Holsteins were more at risk of respiratory
disease than other breeds of calves. Increasing milk feeding had a large effect size: increasing milk feeding from the 1st to
99th
percentile of the observed range predicted about 0.5 weeks less disease. Similarly, housing calves in fixed groups
rather than a continuous flow system was associated with 0.5 fewer weeks of disease. IGF1 at 5 weeks was inversely
correlated with disease duration.
Table 1 Risk factors associated with the number of weeks a calf has respiratory disease
Variable Estimate p value
(Intercept) 1.76038 <0.001 ***
Calf Breed: Holstein (n=349) (ref)
Calf Breed: not Holstein (n=143) -0.27587 0.026 *
Estimated Milk Solids 35-63 days (kg) -0.02151 0.04 *
IGF1 at 5 weeks (ng/ml) -0.00221 0.04 *
Calf Groups: continuous flow (ref)
Calf Groups: fixed group -0.50606 <0.001 ***
* p<0.05, *** p<0.001
Conclusion Good passive transfer of IgG reduces respiratory disease incidence. Disease duration, which has more long
term importance, is better reduced by improving calf housing and feeding. Holsteins appeared more susceptible than other
breeds.
Acknowledgements We are grateful to BBSRC and Volac Ltd. for funding this work as part of a PhD project.
References
Bach, A. 2011. Journal of Dairy Science 94, 1052-1057.
Brickell, J. S., McGowan, M. M., Pfeiffer, D. U., and Wathes, D. C. 2009. Animal 3, 1175-1182.
McGuirk, S. M. 2008. The Veterinary Clinics of North America. Food Animal Practice 24. 139-153.

040
Performance of winter-born Holstein Friesian heifer calves wearing calf coats during the
milk-fed phase of rearing E C L Bleach, L J Carnell, C J Britton
Harper Adams University, Newport, Shropshire, UK
Application Calf coats can be removed from dairy heifer calves at 3 weeks of age without negative impact on their growth
rates or health.
Introduction To meet the targets for first calving at 24 months, replacement heifer calves must grow at 0.7 to 0.8 kg/day
(Margerison and Downey, 2005). Calves are homeotherms seeking to maintain body temperatures of 39oC. When ambient
temperatures drop below the calf’s lower critical temperature (8 to 15oC) it uses energy for heat production, at the expense
of growth. Calf coats have been shown to reduce heat loss by 52% (Rawson et al., 1989) and studies suggest that winter-
reared dairy heifer calves wearing wool coats to 3 months of age have higher growth rates than those without (Loy et al.,
1999). Anecdotal evidence suggests that the use of calf coats is increasing; however, there are limited numbers of published
research studies on the use of calf coats and limited justified guidance for calf rearers as to how long the calf needs to wear
a coat. Our hypothesis was that removing coats from calves at 3 weeks of age would reduce growth rates when compare to
calves wearing coats for the first 6 weeks of life. The aims of the present study were to assess growth rates and health in
Holstein-Friesian heifer calves wearing coats for either 3 or 6 weeks from birth.
Material and methods The study was conducted from 26th
November 2014 to 15th
April 2015, in Shropshire UK. Within
12 hours of birth (day 0) 40 Holstein-Friesian heifer calves were allocated, according to birth weight and dam’s parity, to
one of 2 treatments. “C3” calves wore coats (Calf Jackets, Cosy Calf, UK) from birth until 3 weeks of age (n=20), “C6”
calves wore coats from birth until 6 weeks of age (n=20). The coats were put on to calves once their coats were dry. Calves
were removed from their dams at birth and fed 4 litres of colostrum. The calves were subsequently offered a further 2 litres
of colostrum. From day 1 they were offered milk replacer (5.8 litres/day; 155g/l Advanced Superstart, 23% CP, 20% oil)
from teated bottles in 2 equal feeds with ad libitum concentrate (HSE calf starter pellets, 18% CP). They were housed in
individual, straw bedded, outdoor hutches (Calf-tel, Hampel Animal Care, US). Live weights were recorded at birth, 2, 3, 4,
6 and 7 weeks of age. Concentrate intakes were calculated from total concentrate offered each week minus concentrate
refused. The incidence of respiratory and enteric disease were recorded in the two groups of calves over the duration of the
study. Weather data were collected from an on-site weather station. The mean (±SD) weather data for the study period were
– maximum temperature 9.2 (±3.6) oC, minimum temperature 1.8 (±3.3)
oC, precipitation 1.6 (±3.0) mm/d, wind speed 2.5
(±1.8) m/s. Calf live weight, daily live weight gain and concentrate intakes were analysed using repeated measures analysis
of variance in Genstat (16th
edition). The incidences of respiratory and enteric diseases in the two groups of calves were
compared using Chi-squared analyses.
Results There were no significant differences in the live weights or growth rates of the calves in treatment group C3
compared with those in group C6 at any of the time points measured. Live weights of C3 calves increased from 41.5±0.90
kg at birth to 69.5±1.56 kg at 7 weeks of age and those of C6 calves increased from 40.8±1.2 kg at birth to 68.2±1.52 kg at
7 weeks of age. Daily live weight gain from birth to 7 weeks of age was 0.64±0.02 kg/d in the C3 calves vs. 0.59±0.03 kg/d
in the C6 calves (p=0.147). Concentrate intakes were 7.0±3.3 g/d vs. 19.2±6.5 g/d (NS) in C3 and C6 calves, respectively
during week 1, increasing to 214.4±42.0 g/d vs. 163.6±6.5 g/d (C3 vs. C6 calves, respectively; NS) in week 4 and
656.7±80.4 g/d vs. 572.6±70.4 g/d by week 7 (C3 vs. C6 calves, respectively; NS). There were no significant difference in
the number of calves treated for respiratory disease (4 of 20 vs. 3 of 20, C3 vs. C6 calves, respectively) or enteric disease (4
of 20 vs 4 of 20, C3 vs. C6) during the study period.
Conclusion Reducing the period of time that young Holstein Friesian calves, born during the winter, wear coats from 6
weeks to 3 weeks after birth has no detrimental effects on growth rates through to 7 weeks of age or calf health.
Concentrate intakes during the milk fed phase of rearing were also not significantly different.
Acknowledgements The authors gratefully acknowledge the contribution of our calf rearer and other HAU dairy unit staff
involved with rearing the dairy heifer calves used in this study.
References
Loy, T.W., Schroeder, J.W., Lardy, G.P., Wallace, G.T., Zimmerman, M., Rose, M., Dhuyvetter, J. and Slanger, W.D.
1999. Journal of Dairy Science 84, abstr. 51.
Margerison, J. and Downey, N. 2005. Guidelines for optimal dairy heifer rearing and herd performance. In: Ed: P.C.
Garnsworthy. Calf and heifer rearing, Nottingham, Nottingham University Press. pp 307-338.
Rawson, R.E., Dziuk, H.E., Good, A.L., Anderson, J.F., Bates, D.W. and Ruth, G.R. 1989. Canadian Journal of Veterinary
Research 53, 275-278.
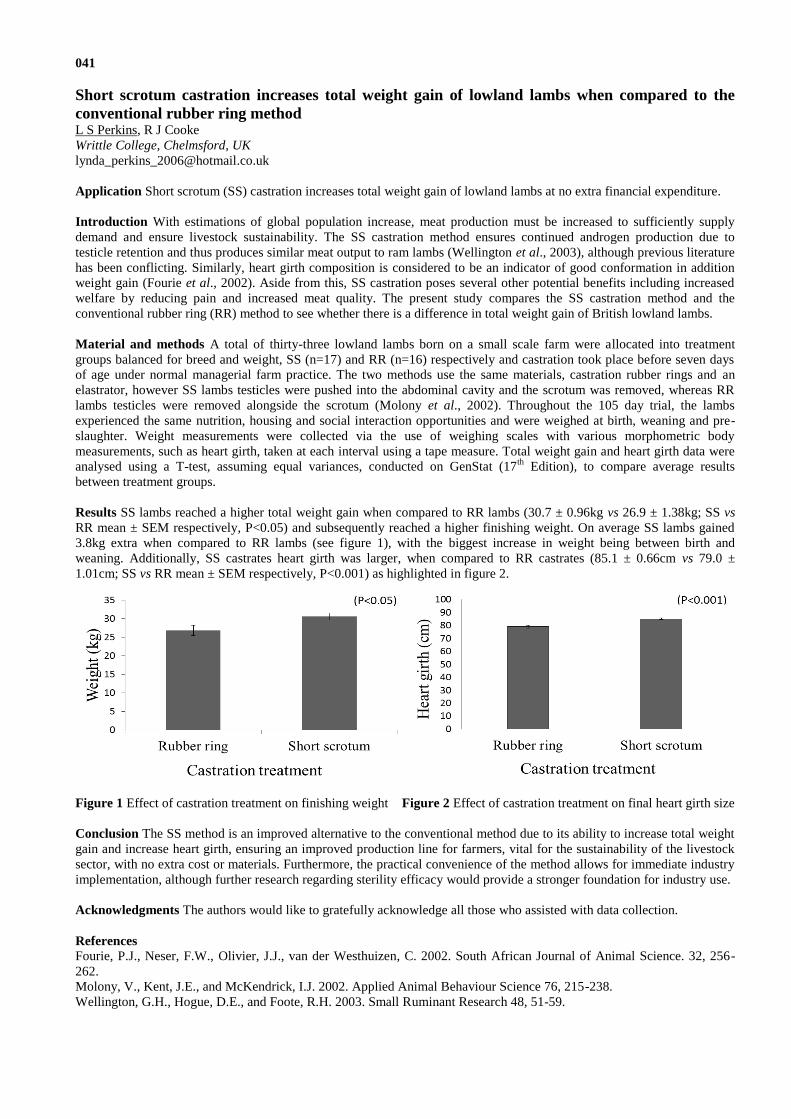
041
Short scrotum castration increases total weight gain of lowland lambs when compared to the
conventional rubber ring method L S Perkins, R J Cooke
Writtle College, Chelmsford, UK
Application Short scrotum (SS) castration increases total weight gain of lowland lambs at no extra financial expenditure.
Introduction With estimations of global population increase, meat production must be increased to sufficiently supply
demand and ensure livestock sustainability. The SS castration method ensures continued androgen production due to
testicle retention and thus produces similar meat output to ram lambs (Wellington et al., 2003), although previous literature
has been conflicting. Similarly, heart girth composition is considered to be an indicator of good conformation in addition
weight gain (Fourie et al., 2002). Aside from this, SS castration poses several other potential benefits including increased
welfare by reducing pain and increased meat quality. The present study compares the SS castration method and the
conventional rubber ring (RR) method to see whether there is a difference in total weight gain of British lowland lambs.
Material and methods A total of thirty-three lowland lambs born on a small scale farm were allocated into treatment
groups balanced for breed and weight, SS (n=17) and RR (n=16) respectively and castration took place before seven days
of age under normal managerial farm practice. The two methods use the same materials, castration rubber rings and an
elastrator, however SS lambs testicles were pushed into the abdominal cavity and the scrotum was removed, whereas RR
lambs testicles were removed alongside the scrotum (Molony et al., 2002). Throughout the 105 day trial, the lambs
experienced the same nutrition, housing and social interaction opportunities and were weighed at birth, weaning and pre-
slaughter. Weight measurements were collected via the use of weighing scales with various morphometric body
measurements, such as heart girth, taken at each interval using a tape measure. Total weight gain and heart girth data were
analysed using a T-test, assuming equal variances, conducted on GenStat (17th
Edition), to compare average results
between treatment groups.
Results SS lambs reached a higher total weight gain when compared to RR lambs (30.7 ± 0.96kg vs 26.9 ± 1.38kg; SS vs
RR mean ± SEM respectively, P<0.05) and subsequently reached a higher finishing weight. On average SS lambs gained
3.8kg extra when compared to RR lambs (see figure 1), with the biggest increase in weight being between birth and
weaning. Additionally, SS castrates heart girth was larger, when compared to RR castrates (85.1 ± 0.66cm vs 79.0 ±
1.01cm; SS vs RR mean ± SEM respectively, P<0.001) as highlighted in figure 2.
Figure 1 Effect of castration treatment on finishing weight Figure 2 Effect of castration treatment on final heart girth size
Conclusion The SS method is an improved alternative to the conventional method due to its ability to increase total weight
gain and increase heart girth, ensuring an improved production line for farmers, vital for the sustainability of the livestock
sector, with no extra cost or materials. Furthermore, the practical convenience of the method allows for immediate industry
implementation, although further research regarding sterility efficacy would provide a stronger foundation for industry use.
Acknowledgments The authors would like to gratefully acknowledge all those who assisted with data collection.
References
Fourie, P.J., Neser, F.W., Olivier, J.J., van der Westhuizen, C. 2002. South African Journal of Animal Science. 32, 256-
262.
Molony, V., Kent, J.E., and McKendrick, I.J. 2002. Applied Animal Behaviour Science 76, 215-238.
Wellington, G.H., Hogue, D.E., and Foote, R.H. 2003. Small Ruminant Research 48, 51-59.
042
Current commercial lamb tail-docking and castration practices, and a trial of 1) incidences of
pain responses in lambs when docked and 2) cleanliness of fleece with docked or entire tails T Hockridge
1, C Douglas
1, A Simpson
1, A Collins
2, V Molony
2, J Kent
2
1Newcastle University, Newcastle upon Tyne, UK,
2Royal (Dick) School of Veterinary Studies, Edinburgh, UK
Application An understanding of current practices and the rationale for undertaking painful procedures can provide a
useful context for research. Trial data can support researchers developing less painful alternatives.
Introduction Sustainability in agriculture includes the ethics of animal production and a significant issue is the painful tail-
docking and castration of lambs. Research in lambs has shown pain of castration to persist for 40days, in human
vasectomies 8-15% experience permanent pain (O’Riorden, personal communication). Many studies of commercial lamb
management were conducted years ago and may not reflect current practice, our survey provides an overview in the NE of
England to determine if changes in management have evolved with, for example, better chemicals to manage flystrike;
markets for entire lambs and whether this affects farmers’ decisions to dock and castrate. This may help flag opportunities
to reassess the need for these painful procedures, which may be based on un-challenged habit rather than evidence.
In addition to the survey, a pilot was carried out, on the effects of docking on fleece cleanliness. While avoiding painful
procedures is preferable, if this is not possible, practical alternative methods have to be sought. Graham et al. (2002) found
that 16% of lambs showed little evidence of pain in response to tail docking. They suggest this may be due to positioning of
the rubber ring in the intervertebral space resulting in mechanical deformation of the nerve trunks. It is possible that new,
more humane techniques could exploit understanding of this mechanism underlying the low response in these lambs. To
help validate the aforementioned finding we recorded the proportion of non-responders in the commercial flock. We also
recorded the time taken for the tail to fall off, again as a comparison for future research into alternative methods.
Material and methods A 16 question survey was conducted face-to-face on 16 sheep farms by the Farm Business Survey,
NE. The recording of non-responders was through observation of pain related behaviours (after Molony et al., 2002). April
born (indoor, lowland farm, NE England) lambs (n=54; mule x Texel/Charolais/Suffolk) were just tail docked with rubber
rings and point sampled for normal/abnormal posture (at 2min for 20min), a subjective assessment was also made of
whether the lamb was experiencing pain of tail docking (responder/low responder). A trial assessed the cleanliness of Mule
× Texel lambs’ rears at 6.5 months (Nov 2015). Ewe and castrated rams were assigned to either dock (n=9) or tail (n=10),
photos were scored 0 clean to 4 very dirty and analysed by MWU. The tails of Mule x Texel (n=11) were recorded on or
off in 2 observations 7 days apart. The study was approved by the University Animal Welfare Ethical Review Board.
Results The respondents had an average 423 ewes (69% mules) with a 135% lambing percentage; 54% lowland, 30%
upland; 15% hill; 82% lambed in April; 19% inside; 44% outside; 31% a mixture; 75% docked all lambs; 25% docked 50%
or according to breed e.g. Swaledales had tales left on. Reasons for docking were 87% to keep lambs clean; 37% to prevent
flystrike; 23% for appearance at auction. No farm used anaesthetic or analgesic for docking or castration; 95% use rubber
rings, 5% used burdizzo. Flystrike incidence was 2.5%, fatalities 0.8% (mean of 3 farms reporting fatalities) 95% used pour
on products to prevent flystrike 5% also stated dipping. Only 5% of farms sold lambs on contract (the rest through the mart)
but did not know if buyers had a policy on entire tails or males. 81% clipped between 10-50% of their docked lambs
because they were dirty. All farms castrated: 82% to avoid tupping ewe lambs; 18% due to other ram nuisance behaviour;
18% cannot sell if they do not castrate; 5% explained that they considered that ram lambs take longer to finish. 38% and
31% would consider not docking or castrating respectively stating: if buyer requested or lambs got away early. Objective
measure analysis (100% time in normal posture between 10-20 minutes) found 23% (of 54) “low responders” whereas 39%
were subjectively categorised as low-responders. 82% of tails fell off within 16-21days. There was no difference in lamb
cleanliness scores (mean rank tail: 10.3; docked: 9.7; MWU 42.5 P=0.47). Ad-hoc interview of farm manager also revealed
no perceived difference in cleanliness or incidence of fly strike. Ad-hoc observations noted Suffolk crosses when dirty were
much dirtier and had much longer tails compared to Texel- and Charolais-crosses and warrants investigation.
Conclusion All farms sampled routinely dock and castrate with no pain relief. Most farmers would not consider leaving
tails / males entire, but a significant proportion would if buyers required it. No differences in cleanliness was found
between docked or undocked lambs on one lowland farm in the NE England. “Low-responses” of lambs to tail docking,
assessed subjectively, appear to under-estimate the incidence of pain behaviours when compared to objective measurement
of behavioural events. If the number of “low/non responders” could increase to 100%, by refinement of the method of
application of rubber rings, the welfare of the lambs would be improved.
References Molony, V.,Kent, J., and McKendrick, I. 2002. Applied Animal Behaviour Science 76, 215-238.
Graham, M., Kent, J. and Molony, V. 2002. The Veterinary Journal 164, 240-243.
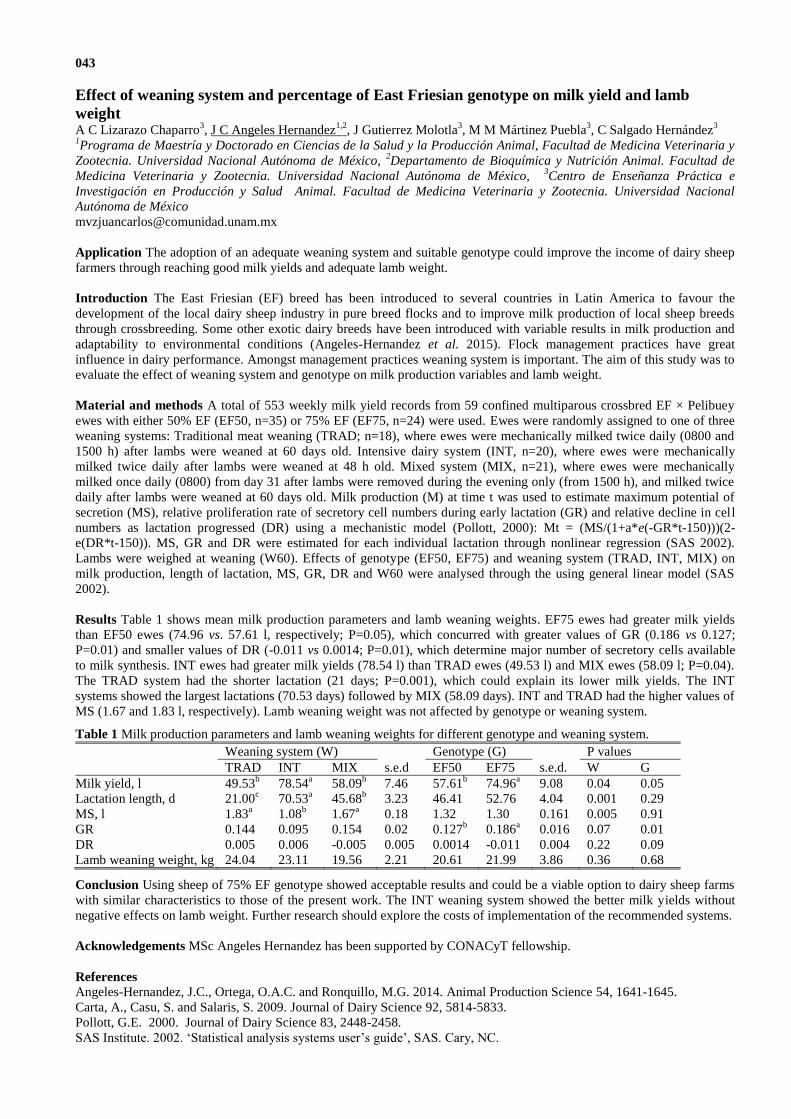
043
Effect of weaning system and percentage of East Friesian genotype on milk yield and lamb
weight A C Lizarazo Chaparro
3, J C Angeles Hernandez
1,2, J Gutierrez Molotla
3, M M Mártinez Puebla
3, C Salgado Hernández
3
1Programa de Maestría y Doctorado en Ciencias de la Salud y la Producción Animal, Facultad de Medicina Veterinaria y
Zootecnia. Universidad Nacional Autónoma de México, 2Departamento de Bioquímica y Nutrición Animal. Facultad de
Medicina Veterinaria y Zootecnia. Universidad Nacional Autónoma de México, 3Centro de Enseñanza Práctica e
Investigación en Producción y Salud Animal. Facultad de Medicina Veterinaria y Zootecnia. Universidad Nacional
Autónoma de México
Application The adoption of an adequate weaning system and suitable genotype could improve the income of dairy sheep
farmers through reaching good milk yields and adequate lamb weight.
Introduction The East Friesian (EF) breed has been introduced to several countries in Latin America to favour the
development of the local dairy sheep industry in pure breed flocks and to improve milk production of local sheep breeds
through crossbreeding. Some other exotic dairy breeds have been introduced with variable results in milk production and
adaptability to environmental conditions (Angeles-Hernandez et al. 2015). Flock management practices have great
influence in dairy performance. Amongst management practices weaning system is important. The aim of this study was to
evaluate the effect of weaning system and genotype on milk production variables and lamb weight.
Material and methods A total of 553 weekly milk yield records from 59 confined multiparous crossbred EF × Pelibuey
ewes with either 50% EF (EF50, n=35) or 75% EF (EF75, n=24) were used. Ewes were randomly assigned to one of three
weaning systems: Traditional meat weaning (TRAD; n=18), where ewes were mechanically milked twice daily (0800 and
1500 h) after lambs were weaned at 60 days old. Intensive dairy system (INT, n=20), where ewes were mechanically
milked twice daily after lambs were weaned at 48 h old. Mixed system (MIX, n=21), where ewes were mechanically
milked once daily (0800) from day 31 after lambs were removed during the evening only (from 1500 h), and milked twice
daily after lambs were weaned at 60 days old. Milk production (M) at time t was used to estimate maximum potential of
secretion (MS), relative proliferation rate of secretory cell numbers during early lactation (GR) and relative decline in cell
numbers as lactation progressed (DR) using a mechanistic model (Pollott, 2000): Mt = (MS/(1+a*e(-GR*t-150)))(2-
e(DR*t-150)). MS, GR and DR were estimated for each individual lactation through nonlinear regression (SAS 2002).
Lambs were weighed at weaning (W60). Effects of genotype (EF50, EF75) and weaning system (TRAD, INT, MIX) on
milk production, length of lactation, MS, GR, DR and W60 were analysed through the using general linear model (SAS
2002).
Results Table 1 shows mean milk production parameters and lamb weaning weights. EF75 ewes had greater milk yields
than EF50 ewes (74.96 vs. 57.61 l, respectively; P=0.05), which concurred with greater values of GR (0.186 vs 0.127;
P=0.01) and smaller values of DR (-0.011 vs 0.0014; P=0.01), which determine major number of secretory cells available
to milk synthesis. INT ewes had greater milk yields (78.54 l) than TRAD ewes (49.53 l) and MIX ewes (58.09 l; P=0.04).
The TRAD system had the shorter lactation (21 days; P=0.001), which could explain its lower milk yields. The INT
systems showed the largest lactations (70.53 days) followed by MIX (58.09 days). INT and TRAD had the higher values of
MS (1.67 and 1.83 l, respectively). Lamb weaning weight was not affected by genotype or weaning system.
Table 1 Milk production parameters and lamb weaning weights for different genotype and weaning system.
Weaning system (W) Genotype (G) P values
TRAD INT MIX s.e.d EF50 EF75 s.e.d. W G
Milk yield, l 49.53b 78.54
a 58.09
b 7.46 57.61
b 74.96
a 9.08 0.04 0.05
Lactation length, d 21.00c 70.53
a 45.68
b 3.23 46.41 52.76 4.04 0.001 0.29
MS, l 1.83a 1.08
b 1.67
a 0.18 1.32 1.30 0.161 0.005 0.91
GR 0.144 0.095 0.154 0.02 0.127b 0.186
a 0.016 0.07 0.01
DR 0.005 0.006 -0.005 0.005 0.0014 -0.011 0.004 0.22 0.09
Lamb weaning weight, kg 24.04 23.11 19.56 2.21 20.61 21.99 3.86 0.36 0.68
Conclusion Using sheep of 75% EF genotype showed acceptable results and could be a viable option to dairy sheep farms
with similar characteristics to those of the present work. The INT weaning system showed the better milk yields without
negative effects on lamb weight. Further research should explore the costs of implementation of the recommended systems.
Acknowledgements MSc Angeles Hernandez has been supported by CONACyT fellowship.
References Angeles-Hernandez, J.C., Ortega, O.A.C. and Ronquillo, M.G. 2014. Animal Production Science 54, 1641-1645.
Carta, A., Casu, S. and Salaris, S. 2009. Journal of Dairy Science 92, 5814-5833.
Pollott, G.E. 2000. Journal of Dairy Science 83, 2448-2458.
SAS Institute. 2002. ‘Statistical analysis systems user’s guide’, SAS. Cary, NC.
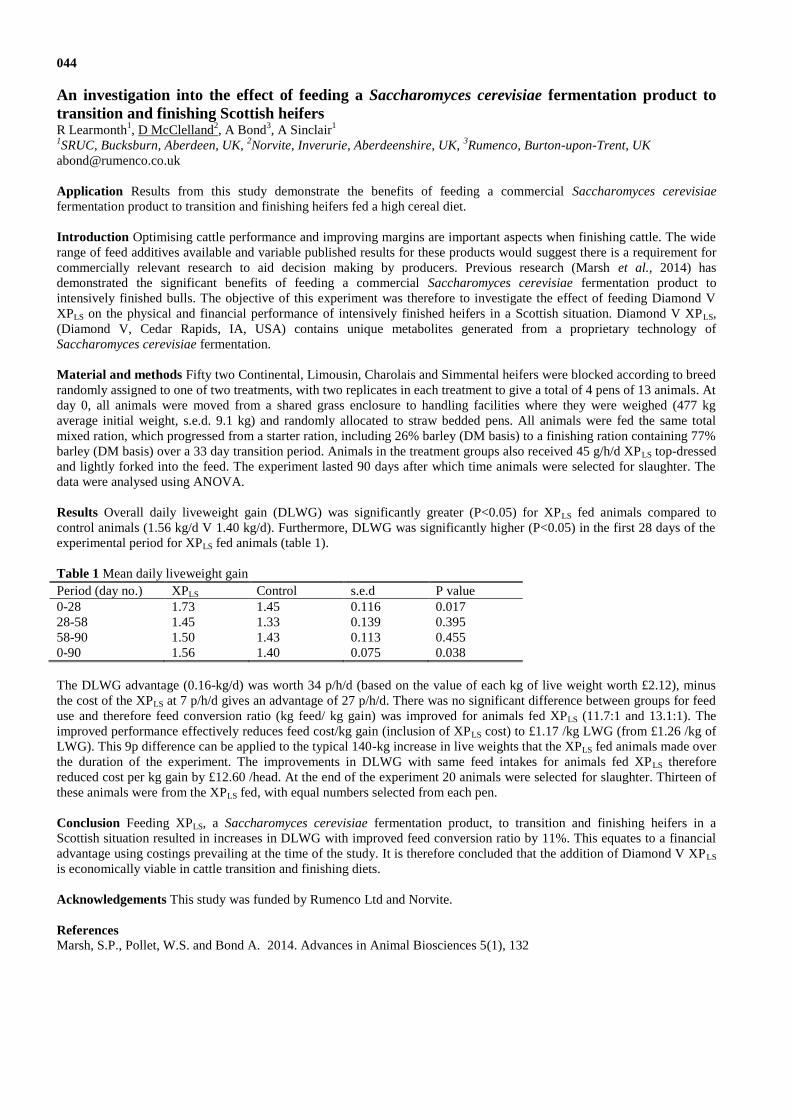
044
An investigation into the effect of feeding a Saccharomyces cerevisiae fermentation product to
transition and finishing Scottish heifers R Learmonth
1, D McClelland
2, A Bond
3, A Sinclair
1
1SRUC, Bucksburn, Aberdeen, UK,
2Norvite, Inverurie, Aberdeenshire, UK,
3Rumenco, Burton-upon-Trent, UK
Application Results from this study demonstrate the benefits of feeding a commercial Saccharomyces cerevisiae
fermentation product to transition and finishing heifers fed a high cereal diet.
Introduction Optimising cattle performance and improving margins are important aspects when finishing cattle. The wide
range of feed additives available and variable published results for these products would suggest there is a requirement for
commercially relevant research to aid decision making by producers. Previous research (Marsh et al., 2014) has
demonstrated the significant benefits of feeding a commercial Saccharomyces cerevisiae fermentation product to
intensively finished bulls. The objective of this experiment was therefore to investigate the effect of feeding Diamond V
XPLS on the physical and financial performance of intensively finished heifers in a Scottish situation. Diamond V XPLS,
(Diamond V, Cedar Rapids, IA, USA) contains unique metabolites generated from a proprietary technology of
Saccharomyces cerevisiae fermentation.
Material and methods Fifty two Continental, Limousin, Charolais and Simmental heifers were blocked according to breed
randomly assigned to one of two treatments, with two replicates in each treatment to give a total of 4 pens of 13 animals. At
day 0, all animals were moved from a shared grass enclosure to handling facilities where they were weighed (477 kg
average initial weight, s.e.d. 9.1 kg) and randomly allocated to straw bedded pens. All animals were fed the same total
mixed ration, which progressed from a starter ration, including 26% barley (DM basis) to a finishing ration containing 77%
barley (DM basis) over a 33 day transition period. Animals in the treatment groups also received 45 g/h/d XPLS top-dressed
and lightly forked into the feed. The experiment lasted 90 days after which time animals were selected for slaughter. The
data were analysed using ANOVA.
Results Overall daily liveweight gain (DLWG) was significantly greater (P<0.05) for XPLS fed animals compared to
control animals (1.56 kg/d V 1.40 kg/d). Furthermore, DLWG was significantly higher (P<0.05) in the first 28 days of the
experimental period for XPLS fed animals (table 1).
Table 1 Mean daily liveweight gain
Period (day no.) XPLS Control s.e.d P value
0-28 1.73 1.45 0.116 0.017
28-58 1.45 1.33 0.139 0.395
58-90 1.50 1.43 0.113 0.455
0-90 1.56 1.40 0.075 0.038
The DLWG advantage (0.16-kg/d) was worth 34 p/h/d (based on the value of each kg of live weight worth £2.12), minus
the cost of the XPLS at 7 p/h/d gives an advantage of 27 p/h/d. There was no significant difference between groups for feed
use and therefore feed conversion ratio (kg feed/ kg gain) was improved for animals fed XPLS (11.7:1 and 13.1:1). The
improved performance effectively reduces feed cost/kg gain (inclusion of XPLS cost) to £1.17 /kg LWG (from £1.26 /kg of
LWG). This 9p difference can be applied to the typical 140-kg increase in live weights that the XPLS fed animals made over
the duration of the experiment. The improvements in DLWG with same feed intakes for animals fed XPLS therefore
reduced cost per kg gain by £12.60 /head. At the end of the experiment 20 animals were selected for slaughter. Thirteen of
these animals were from the XPLS fed, with equal numbers selected from each pen.
Conclusion Feeding XPLS, a Saccharomyces cerevisiae fermentation product, to transition and finishing heifers in a
Scottish situation resulted in increases in DLWG with improved feed conversion ratio by 11%. This equates to a financial
advantage using costings prevailing at the time of the study. It is therefore concluded that the addition of Diamond V XPLS
is economically viable in cattle transition and finishing diets.
Acknowledgements This study was funded by Rumenco Ltd and Norvite.
References
Marsh, S.P., Pollet, W.S. and Bond A. 2014. Advances in Animal Biosciences 5(1), 132
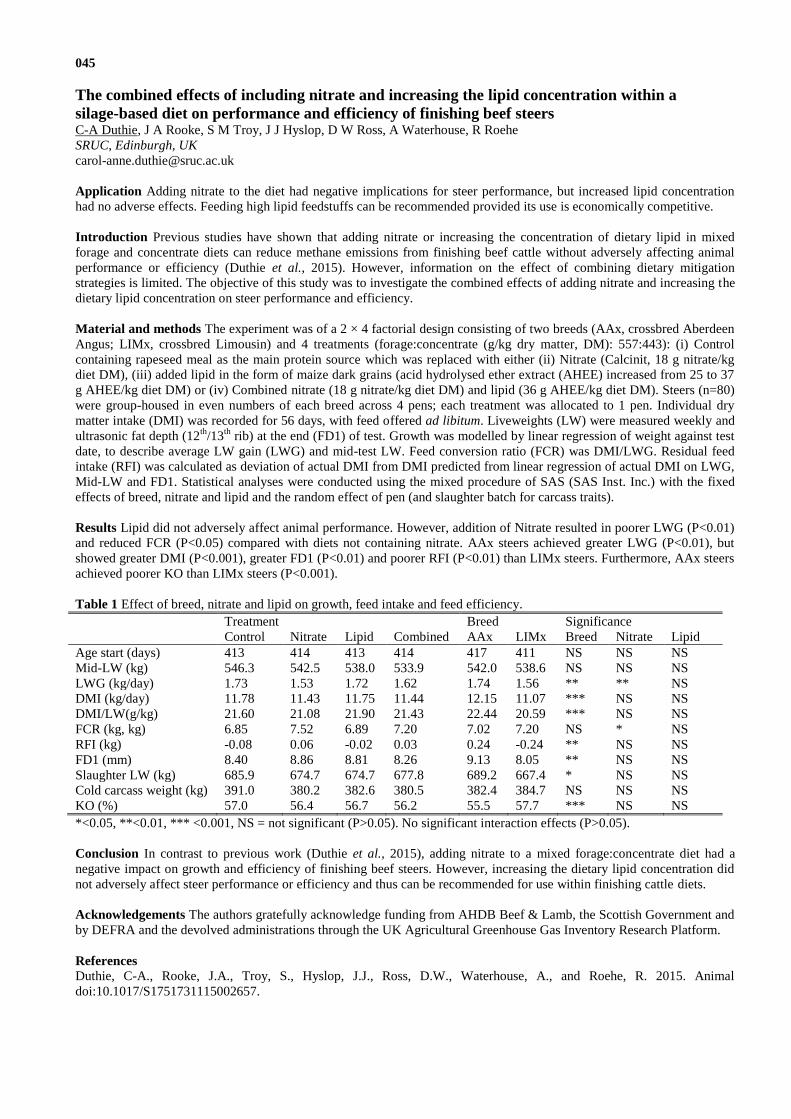
045
The combined effects of including nitrate and increasing the lipid concentration within a
silage-based diet on performance and efficiency of finishing beef steers C-A Duthie, J A Rooke, S M Troy, J J Hyslop, D W Ross, A Waterhouse, R Roehe
SRUC, Edinburgh, UK
Application Adding nitrate to the diet had negative implications for steer performance, but increased lipid concentration
had no adverse effects. Feeding high lipid feedstuffs can be recommended provided its use is economically competitive.
Introduction Previous studies have shown that adding nitrate or increasing the concentration of dietary lipid in mixed
forage and concentrate diets can reduce methane emissions from finishing beef cattle without adversely affecting animal
performance or efficiency (Duthie et al., 2015). However, information on the effect of combining dietary mitigation
strategies is limited. The objective of this study was to investigate the combined effects of adding nitrate and increasing the
dietary lipid concentration on steer performance and efficiency.
Material and methods The experiment was of a 2 × 4 factorial design consisting of two breeds (AAx, crossbred Aberdeen
Angus; LIMx, crossbred Limousin) and 4 treatments (forage:concentrate (g/kg dry matter, DM): 557:443): (i) Control
containing rapeseed meal as the main protein source which was replaced with either (ii) Nitrate (Calcinit, 18 g nitrate/kg
diet DM), (iii) added lipid in the form of maize dark grains (acid hydrolysed ether extract (AHEE) increased from 25 to 37
g AHEE/kg diet DM) or (iv) Combined nitrate (18 g nitrate/kg diet DM) and lipid (36 g AHEE/kg diet DM). Steers (n=80)
were group-housed in even numbers of each breed across 4 pens; each treatment was allocated to 1 pen. Individual dry
matter intake (DMI) was recorded for 56 days, with feed offered ad libitum. Liveweights (LW) were measured weekly and
ultrasonic fat depth (12th
/13th
rib) at the end (FD1) of test. Growth was modelled by linear regression of weight against test
date, to describe average LW gain (LWG) and mid-test LW. Feed conversion ratio (FCR) was DMI/LWG. Residual feed
intake (RFI) was calculated as deviation of actual DMI from DMI predicted from linear regression of actual DMI on LWG,
Mid-LW and FD1. Statistical analyses were conducted using the mixed procedure of SAS (SAS Inst. Inc.) with the fixed
effects of breed, nitrate and lipid and the random effect of pen (and slaughter batch for carcass traits).
Results Lipid did not adversely affect animal performance. However, addition of Nitrate resulted in poorer LWG (P<0.01)
and reduced FCR (P<0.05) compared with diets not containing nitrate. AAx steers achieved greater LWG (P<0.01), but
showed greater DMI (P<0.001), greater FD1 (P<0.01) and poorer RFI (P<0.01) than LIMx steers. Furthermore, AAx steers
achieved poorer KO than LIMx steers (P<0.001).
Table 1 Effect of breed, nitrate and lipid on growth, feed intake and feed efficiency.
Treatment Breed Significance
Control Nitrate Lipid Combined AAx LIMx Breed Nitrate Lipid
Age start (days) 413 414 413 414 417 411 NS NS NS
Mid-LW (kg) 546.3 542.5 538.0 533.9 542.0 538.6 NS NS NS
LWG (kg/day) 1.73 1.53 1.72 1.62 1.74 1.56 ** ** NS
DMI (kg/day) 11.78 11.43 11.75 11.44 12.15 11.07 *** NS NS
DMI/LW(g/kg) 21.60 21.08 21.90 21.43 22.44 20.59 *** NS NS
FCR (kg, kg) 6.85 7.52 6.89 7.20 7.02 7.20 NS * NS
RFI (kg) -0.08 0.06 -0.02 0.03 0.24 -0.24 ** NS NS
FD1 (mm) 8.40 8.86 8.81 8.26 9.13 8.05 ** NS NS
Slaughter LW (kg) 685.9 674.7 674.7 677.8 689.2 667.4 * NS NS
Cold carcass weight (kg) 391.0 380.2 382.6 380.5 382.4 384.7 NS NS NS
KO (%) 57.0 56.4 56.7 56.2 55.5 57.7 *** NS NS
*<0.05, **<0.01, *** <0.001, NS = not significant (P>0.05). No significant interaction effects (P>0.05).
Conclusion In contrast to previous work (Duthie et al., 2015), adding nitrate to a mixed forage:concentrate diet had a
negative impact on growth and efficiency of finishing beef steers. However, increasing the dietary lipid concentration did
not adversely affect steer performance or efficiency and thus can be recommended for use within finishing cattle diets.
Acknowledgements The authors gratefully acknowledge funding from AHDB Beef & Lamb, the Scottish Government and
by DEFRA and the devolved administrations through the UK Agricultural Greenhouse Gas Inventory Research Platform.
References
Duthie, C-A., Rooke, J.A., Troy, S., Hyslop, J.J., Ross, D.W., Waterhouse, A., and Roehe, R. 2015. Animal
doi:10.1017/S1751731115002657.
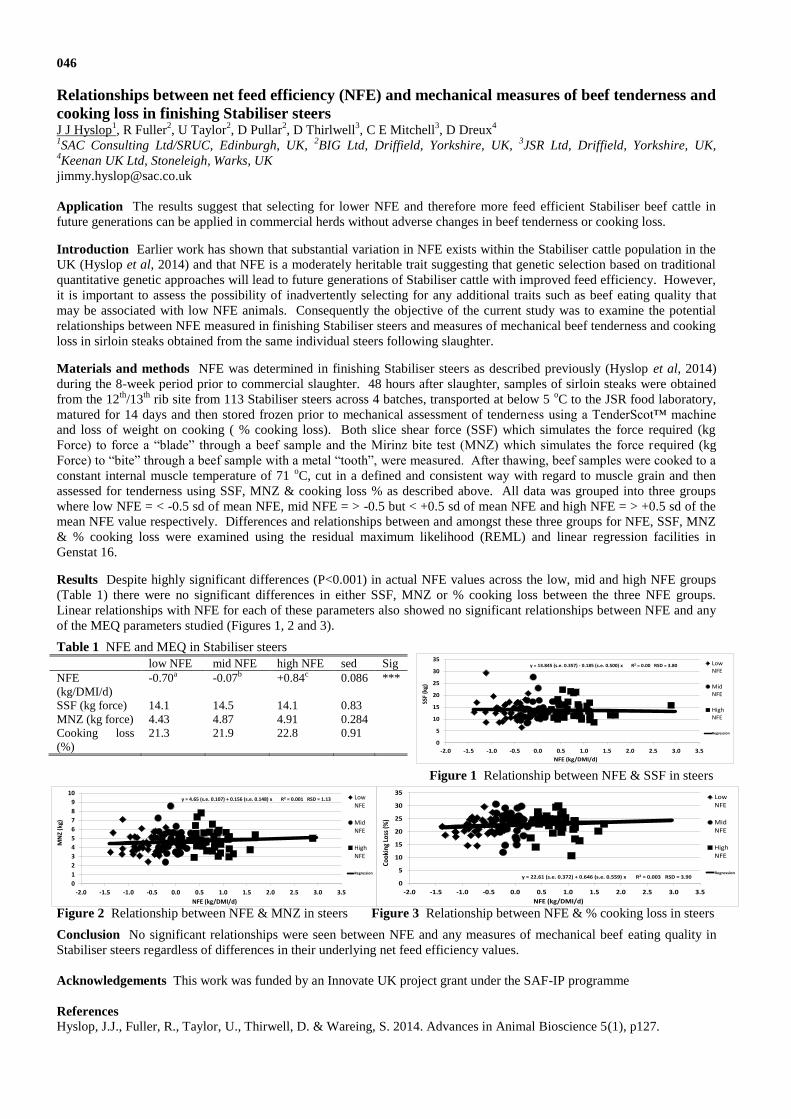
046
Relationships between net feed efficiency (NFE) and mechanical measures of beef tenderness and
cooking loss in finishing Stabiliser steers J J Hyslop
1, R Fuller
2, U Taylor
2, D Pullar
2, D Thirlwell
3, C E Mitchell
3, D Dreux
4
1SAC Consulting Ltd/SRUC, Edinburgh, UK,
2BIG Ltd, Driffield, Yorkshire, UK,
3JSR Ltd, Driffield, Yorkshire, UK,
4Keenan UK Ltd, Stoneleigh, Warks, UK
Application The results suggest that selecting for lower NFE and therefore more feed efficient Stabiliser beef cattle in
future generations can be applied in commercial herds without adverse changes in beef tenderness or cooking loss.
Introduction Earlier work has shown that substantial variation in NFE exists within the Stabiliser cattle population in the
UK (Hyslop et al, 2014) and that NFE is a moderately heritable trait suggesting that genetic selection based on traditional
quantitative genetic approaches will lead to future generations of Stabiliser cattle with improved feed efficiency. However,
it is important to assess the possibility of inadvertently selecting for any additional traits such as beef eating quality that
may be associated with low NFE animals. Consequently the objective of the current study was to examine the potential
relationships between NFE measured in finishing Stabiliser steers and measures of mechanical beef tenderness and cooking
loss in sirloin steaks obtained from the same individual steers following slaughter.
Materials and methods NFE was determined in finishing Stabiliser steers as described previously (Hyslop et al, 2014)
during the 8-week period prior to commercial slaughter. 48 hours after slaughter, samples of sirloin steaks were obtained
from the 12th
/13th
rib site from 113 Stabiliser steers across 4 batches, transported at below 5 oC to the JSR food laboratory,
matured for 14 days and then stored frozen prior to mechanical assessment of tenderness using a TenderScot™ machine
and loss of weight on cooking ( % cooking loss). Both slice shear force (SSF) which simulates the force required (kg
Force) to force a “blade” through a beef sample and the Mirinz bite test (MNZ) which simulates the force required (kg
Force) to “bite” through a beef sample with a metal “tooth”, were measured. After thawing, beef samples were cooked to a
constant internal muscle temperature of 71 oC, cut in a defined and consistent way with regard to muscle grain and then
assessed for tenderness using SSF, MNZ & cooking loss % as described above. All data was grouped into three groups
where low NFE = < -0.5 sd of mean NFE, mid NFE = > -0.5 but < +0.5 sd of mean NFE and high NFE = > +0.5 sd of the
mean NFE value respectively. Differences and relationships between and amongst these three groups for NFE, SSF, MNZ
& % cooking loss were examined using the residual maximum likelihood (REML) and linear regression facilities in
Genstat 16.
Results Despite highly significant differences (P<0.001) in actual NFE values across the low, mid and high NFE groups
(Table 1) there were no significant differences in either SSF, MNZ or % cooking loss between the three NFE groups.
Linear relationships with NFE for each of these parameters also showed no significant relationships between NFE and any
of the MEQ parameters studied (Figures 1, 2 and 3).
Table 1 NFE and MEQ in Stabiliser steers
low NFE mid NFE high NFE sed Sig
NFE
(kg/DMI/d)
-0.70a -0.07b +0.84c 0.086 ***
SSF (kg force) 14.1 14.5 14.1 0.83
MNZ (kg force) 4.43 4.87 4.91 0.284
Cooking loss
(%)
21.3 21.9 22.8 0.91
Figure 1 Relationship between NFE & SSF in steers
Figure 2 Relationship between NFE & MNZ in steers Figure 3 Relationship between NFE & % cooking loss in steers
Conclusion No significant relationships were seen between NFE and any measures of mechanical beef eating quality in
Stabiliser steers regardless of differences in their underlying net feed efficiency values.
Acknowledgements This work was funded by an Innovate UK project grant under the SAF-IP programme
References
Hyslop, J.J., Fuller, R., Taylor, U., Thirwell, D. & Wareing, S. 2014. Advances in Animal Bioscience 5(1), p127.
0
5
10
15
20
25
30
35
-2.0 -1.5 -1.0 -0.5 0.0 0.5 1.0 1.5 2.0 2.5 3.0 3.5
SSF
(kg)
NFE (kg/DMI/d)
LowNFE
MidNFE
HighNFE
Regression
y = 13.845 (s.e. 0.357) - 0.185 (s.e. 0.500) x R2 = 0.00 RSD = 3.80
0
1
2
3
4
5
6
7
8
9
10
-2.0 -1.5 -1.0 -0.5 0.0 0.5 1.0 1.5 2.0 2.5 3.0 3.5
MN
Z (k
g)
NFE (kg/DMI/d)
LowNFE
MidNFE
HighNFE
Regression
y = 4.65 (s.e. 0.107) + 0.156 (s.e. 0.148) x R2 = 0.001 RSD = 1.13
0
5
10
15
20
25
30
35
-2.0 -1.5 -1.0 -0.5 0.0 0.5 1.0 1.5 2.0 2.5 3.0 3.5
Cook
ing
Loss
(%)
NFE (kg/DMI/d)
LowNFE
MidNFE
HighNFE
Regressiony = 22.61 (s.e. 0.372) + 0.646 (s.e. 0.559) x R2 = 0.003 RSD = 3.90
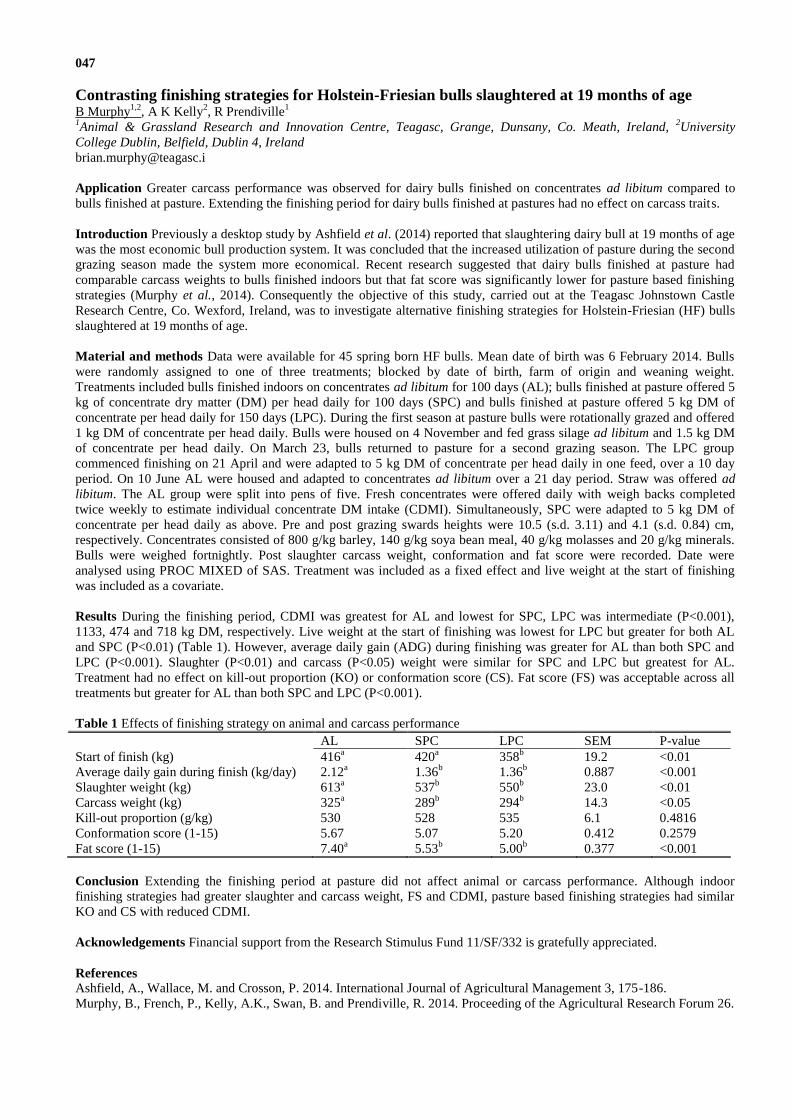
047
Contrasting finishing strategies for Holstein-Friesian bulls slaughtered at 19 months of age B Murphy
1,2, A K Kelly
2, R Prendiville
1
1Animal & Grassland Research and Innovation Centre, Teagasc, Grange, Dunsany, Co. Meath, Ireland,
2University
College Dublin, Belfield, Dublin 4, Ireland
Application Greater carcass performance was observed for dairy bulls finished on concentrates ad libitum compared to
bulls finished at pasture. Extending the finishing period for dairy bulls finished at pastures had no effect on carcass traits.
Introduction Previously a desktop study by Ashfield et al. (2014) reported that slaughtering dairy bull at 19 months of age
was the most economic bull production system. It was concluded that the increased utilization of pasture during the second
grazing season made the system more economical. Recent research suggested that dairy bulls finished at pasture had
comparable carcass weights to bulls finished indoors but that fat score was significantly lower for pasture based finishing
strategies (Murphy et al., 2014). Consequently the objective of this study, carried out at the Teagasc Johnstown Castle
Research Centre, Co. Wexford, Ireland, was to investigate alternative finishing strategies for Holstein-Friesian (HF) bulls
slaughtered at 19 months of age.
Material and methods Data were available for 45 spring born HF bulls. Mean date of birth was 6 February 2014. Bulls
were randomly assigned to one of three treatments; blocked by date of birth, farm of origin and weaning weight.
Treatments included bulls finished indoors on concentrates ad libitum for 100 days (AL); bulls finished at pasture offered 5
kg of concentrate dry matter (DM) per head daily for 100 days (SPC) and bulls finished at pasture offered 5 kg DM of
concentrate per head daily for 150 days (LPC). During the first season at pasture bulls were rotationally grazed and offered
1 kg DM of concentrate per head daily. Bulls were housed on 4 November and fed grass silage ad libitum and 1.5 kg DM
of concentrate per head daily. On March 23, bulls returned to pasture for a second grazing season. The LPC group
commenced finishing on 21 April and were adapted to 5 kg DM of concentrate per head daily in one feed, over a 10 day
period. On 10 June AL were housed and adapted to concentrates ad libitum over a 21 day period. Straw was offered ad
libitum. The AL group were split into pens of five. Fresh concentrates were offered daily with weigh backs completed
twice weekly to estimate individual concentrate DM intake (CDMI). Simultaneously, SPC were adapted to 5 kg DM of
concentrate per head daily as above. Pre and post grazing swards heights were 10.5 (s.d. 3.11) and 4.1 (s.d. 0.84) cm,
respectively. Concentrates consisted of 800 g/kg barley, 140 g/kg soya bean meal, 40 g/kg molasses and 20 g/kg minerals.
Bulls were weighed fortnightly. Post slaughter carcass weight, conformation and fat score were recorded. Date were
analysed using PROC MIXED of SAS. Treatment was included as a fixed effect and live weight at the start of finishing
was included as a covariate.
Results During the finishing period, CDMI was greatest for AL and lowest for SPC, LPC was intermediate (P<0.001),
1133, 474 and 718 kg DM, respectively. Live weight at the start of finishing was lowest for LPC but greater for both AL
and SPC (P<0.01) (Table 1). However, average daily gain (ADG) during finishing was greater for AL than both SPC and
LPC (P<0.001). Slaughter (P<0.01) and carcass (P<0.05) weight were similar for SPC and LPC but greatest for AL.
Treatment had no effect on kill-out proportion (KO) or conformation score (CS). Fat score (FS) was acceptable across all
treatments but greater for AL than both SPC and LPC (P<0.001).
Table 1 Effects of finishing strategy on animal and carcass performance
AL SPC LPC SEM P-value
Start of finish (kg) 416a 420
a 358
b 19.2 <0.01
Average daily gain during finish (kg/day) 2.12a 1.36
b 1.36
b 0.887 <0.001
Slaughter weight (kg) 613a 537
b 550
b 23.0 <0.01
Carcass weight (kg) 325a 289
b 294
b 14.3 <0.05
Kill-out proportion (g/kg) 530 528 535 6.1 0.4816
Conformation score (1-15) 5.67 5.07 5.20 0.412 0.2579
Fat score (1-15) 7.40a 5.53
b 5.00
b 0.377 <0.001
Conclusion Extending the finishing period at pasture did not affect animal or carcass performance. Although indoor
finishing strategies had greater slaughter and carcass weight, FS and CDMI, pasture based finishing strategies had similar
KO and CS with reduced CDMI.
Acknowledgements Financial support from the Research Stimulus Fund 11/SF/332 is gratefully appreciated.
References
Ashfield, A., Wallace, M. and Crosson, P. 2014. International Journal of Agricultural Management 3, 175-186.
Murphy, B., French, P., Kelly, A.K., Swan, B. and Prendiville, R. 2014. Proceeding of the Agricultural Research Forum 26.

048
Optimal slaughter age of UK beef cattle to increase profitability and reduce greenhouse gas
emissions A T Moran
1, K L Moore
1, P Amer
2, M P Coffey
1
1EGENES-SRUC, Edinburgh, UK,
2AbacusBio, Dunedin, New Zealand
Application Reducing days to slaughter will improve profits for farmers and increase cattle turnover on farm. Additionally
this will reduce greenhouse gas (GHG) emissions which are likely to become an increasingly important factor as the
government consider the introduction of an emissions tax.
Introduction Beef animals are most commonly finished on 24 month systems. The decision to intensively finish cattle or
over winter on straw can mean the difference between profit and loss and is often influenced by the variation in feed and
bedding costs. This study looked at the optimal age at slaughter for improved profit and reduced emissions accounting for
slaughter weight, fat, conformation and season of birth.
Material and methods The analysis focused on purebred Holstein Friesians, Limousin-Holstein Friesian crossbreeds and
purebred Limousin (106,059, 81,590 and 24,426 animals respectively) from seven UK abattoirs born between 2001 and
2013. Average slaughter age across all breed types was 715 days with a mean carcass weight of 325Kg. Carcass weight,
conformation and fat class were used to calculate the value of the animal from price grids, with the base price set at
£3.66/Kg. Penalties were applied to animals which missed the target weight range (260-420Kg) or were over 30 months of
age. The cost of finishing was calculated based on breed, season born and finishing system. Finishing system was inferred
from age at slaughter and further costs were accrued for each additional day spent outside of the finishing system.
Concentrates were charged at £170/tonne, straw at £67/tonne and silage at £30/tonne. Other fixed costs were charged at
£1.06/day in the summer and £1.18/day in the winter in order to account for seasonal costs associated with the number of
days spent housed or at grass as a result of the animal’s season of birth. The profit obtained from each animal was the
difference between the value of the carcass and the total costs as described above. Cattle emissions for concentrates were
estimated at 13.8g CO2e/g/hd and 21.15g CO2e/g/hd for forage.
Results Holstein Friesian cattle were slaughtered most frequently between 365 and 550 days. Whilst their peak carcass
value was at 730 days the difference in slaughter value between 365 and 730 days was just £135 making them most
profitable at 365 days (12 months) (Figure 1). Limousin cattle were slaughtered most frequently at 730 days and peak
carcass value was between 400 and 430 days making them most profitable between 365 and 430 days (12-14 months)
(Figure 1). Holstein Friesian-Limousin crossbred cattle were most frequently slaughtered between 700 and 800 days. Peak
carcass value of these animals was reached at 800 days although the difference between 365 and 800 days of age was just
£80 and therefore the most profitable age of slaughter was 365 days (12 months) (Figure 1). An additional advantage of the
12 month finishing system was the three fold decrease in emissions when compared with the current 24 month system
(Figure 2).
Figure 1 Profitability at slaughter age of different breed types Figure 2 Methane emissions for each finishing system
Conclusion For all breed types the optimal time to slaughter is at 12 months in order to maximise profit and also to provide
the opportunity to acquire more stock. This is of particular importance for dairy and dairy crossbreeds where profit rapidly
becomes a loss with each additional day. Additionally reducing days to slaughter decreases GHG emissions which may
potentially impact the profitability of beef in the future when charges are made for emissions.
Acknowledgements The authors gratefully acknowledge AHDB beef and lamb, AHDB dairy and HCC for funding this
work and the meat processors for supplying data.
References
SAC Consulting. The Farm Management Handbook 2015/2016
Basarab, J. A., Baron, D. and Darling, T. 2008. Carbon Credit Potential of Reducing Age at Slaughter in Beef Cattle
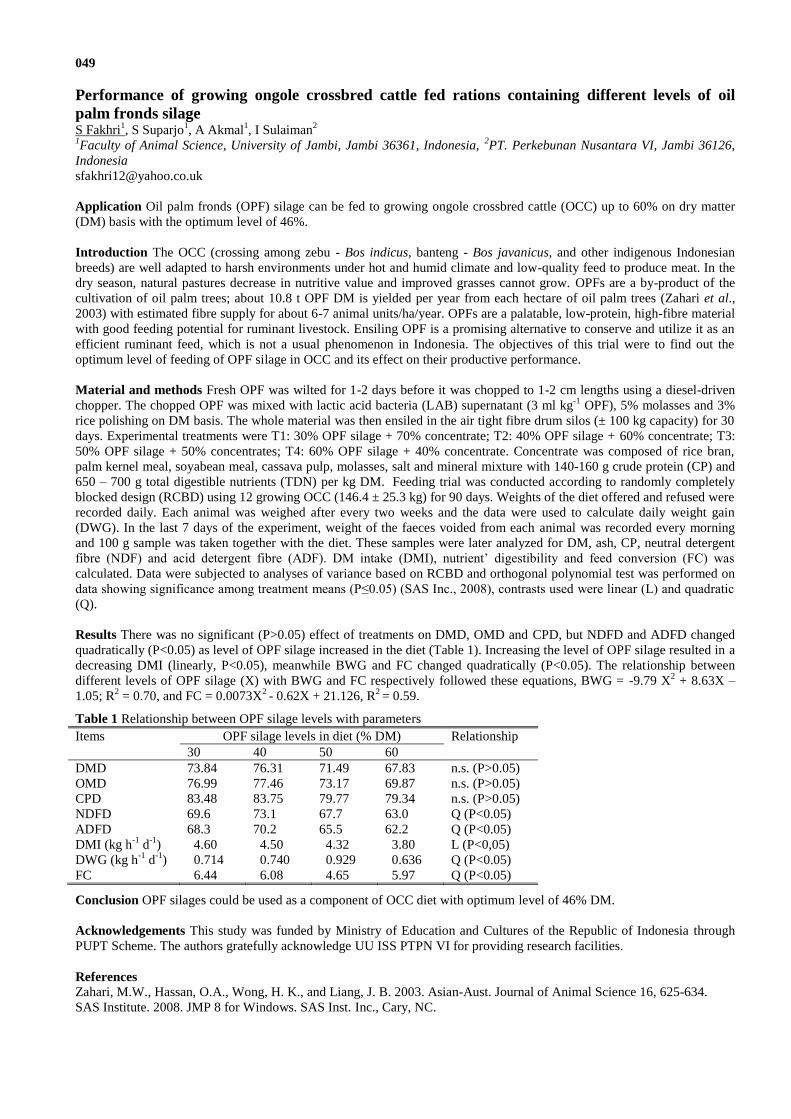
049
Performance of growing ongole crossbred cattle fed rations containing different levels of oil
palm fronds silage S Fakhri
1, S Suparjo
1, A Akmal
1, I Sulaiman
2
1Faculty of Animal Science, University of Jambi, Jambi 36361, Indonesia,
2PT. Perkebunan Nusantara VI, Jambi 36126,
Indonesia
Application Oil palm fronds (OPF) silage can be fed to growing ongole crossbred cattle (OCC) up to 60% on dry matter
(DM) basis with the optimum level of 46%.
Introduction The OCC (crossing among zebu - Bos indicus, banteng - Bos javanicus, and other indigenous Indonesian
breeds) are well adapted to harsh environments under hot and humid climate and low-quality feed to produce meat. In the
dry season, natural pastures decrease in nutritive value and improved grasses cannot grow. OPFs are a by-product of the
cultivation of oil palm trees; about 10.8 t OPF DM is yielded per year from each hectare of oil palm trees (Zahari et al.,
2003) with estimated fibre supply for about 6-7 animal units/ha/year. OPFs are a palatable, low-protein, high-fibre material
with good feeding potential for ruminant livestock. Ensiling OPF is a promising alternative to conserve and utilize it as an
efficient ruminant feed, which is not a usual phenomenon in Indonesia. The objectives of this trial were to find out the
optimum level of feeding of OPF silage in OCC and its effect on their productive performance.
Material and methods Fresh OPF was wilted for 1-2 days before it was chopped to 1-2 cm lengths using a diesel-driven
chopper. The chopped OPF was mixed with lactic acid bacteria (LAB) supernatant (3 ml kg-1
OPF), 5% molasses and 3%
rice polishing on DM basis. The whole material was then ensiled in the air tight fibre drum silos (± 100 kg capacity) for 30
days. Experimental treatments were T1: 30% OPF silage + 70% concentrate; T2: 40% OPF silage + 60% concentrate; T3:
50% OPF silage + 50% concentrates; T4: 60% OPF silage + 40% concentrate. Concentrate was composed of rice bran,
palm kernel meal, soyabean meal, cassava pulp, molasses, salt and mineral mixture with 140-160 g crude protein (CP) and
650 – 700 g total digestible nutrients (TDN) per kg DM. Feeding trial was conducted according to randomly completely
blocked design (RCBD) using 12 growing OCC (146.4 ± 25.3 kg) for 90 days. Weights of the diet offered and refused were
recorded daily. Each animal was weighed after every two weeks and the data were used to calculate daily weight gain
(DWG). In the last 7 days of the experiment, weight of the faeces voided from each animal was recorded every morning
and 100 g sample was taken together with the diet. These samples were later analyzed for DM, ash, CP, neutral detergent
fibre (NDF) and acid detergent fibre (ADF). DM intake (DMI), nutrient’ digestibility and feed conversion (FC) was
calculated. Data were subjected to analyses of variance based on RCBD and orthogonal polynomial test was performed on
data showing significance among treatment means (P≤0.05) (SAS Inc., 2008), contrasts used were linear (L) and quadratic
(Q).
Results There was no significant (P>0.05) effect of treatments on DMD, OMD and CPD, but NDFD and ADFD changed
quadratically (P<0.05) as level of OPF silage increased in the diet (Table 1). Increasing the level of OPF silage resulted in a
decreasing DMI (linearly, P<0.05), meanwhile BWG and FC changed quadratically (P<0.05). The relationship between
different levels of OPF silage (X) with BWG and FC respectively followed these equations, BWG = -9.79 X2 + 8.63X –
1.05; R2 = 0.70, and FC = 0.0073X
2 - 0.62X + 21.126, R
2 = 0.59.
Table 1 Relationship between OPF silage levels with parameters
Items OPF silage levels in diet (% DM) Relationship
30 40 50 60
DMD 73.84 76.31 71.49 67.83 n.s. (P>0.05)
OMD 76.99 77.46 73.17 69.87 n.s. (P>0.05)
CPD 83.48 83.75 79.77 79.34 n.s. (P>0.05)
NDFD 69.6 73.1 67.7 63.0 Q (P<0.05)
ADFD 68.3 70.2 65.5 62.2 Q (P<0.05)
DMI (kg h-1
d-1
) 4.60 4.50 4.32 3.80 L (P<0,05)
DWG (kg h-1
d-1
) 0.714 0.740 0.929 0.636 Q (P<0.05)
FC 6.44 6.08 4.65 5.97 Q (P<0.05)
Conclusion OPF silages could be used as a component of OCC diet with optimum level of 46% DM.
Acknowledgements This study was funded by Ministry of Education and Cultures of the Republic of Indonesia through
PUPT Scheme. The authors gratefully acknowledge UU ISS PTPN VI for providing research facilities.
References Zahari, M.W., Hassan, O.A., Wong, H. K., and Liang, J. B. 2003. Asian-Aust. Journal of Animal Science 16, 625-634.
SAS Institute. 2008. JMP 8 for Windows. SAS Inst. Inc., Cary, NC.

050
The effects of dietary nitrate addition and increased lipid concentration on methane (CH4) and
hydrogen (H2) emissions from beef cattle are independent S M Troy
1, C-A Duthie
1, J J Hyslop
2, D W Ross
1, R Roehe
1, J A Rooke
1
1SRUC, Edinburgh, UK,
2SAC Consulting, Edinburgh, UK
Application There was no interaction between added nitrate and increased lipid concentration on CH4 emissions from
steers fed a mixed forage: concentrate diet. Potential health effects associated with feeding nitrate could be reduced by
combining lesser amounts of nitrate with increased dietary lipid content.
Introduction Globally, emissions from livestock production are estimated at 7.1 Gt CO2-equivalent per annum, with beef
production responsible for 2.9 Gt CO2-equivalent (Gerber et al., 2013). Methane emissions account for 44% of the total
GHG emissions from beef production systems and are primarily affected by feed intake and quality. Previous studies have
shown that adding nitrate or increasing dietary oil concentrations in mixed forage and concentrate diets lowered CH4
emissions (Patra 2013; Troy, 2015). However there is little information on the effect of combining dietary CH4 mitigation
strategies. This experiment was designed to investigate the combined effects of adding nitrate or increasing dietary lipid on
CH4 and H2 emissions from finishing beef cattle fed a mixed 500:500 forage:concentrate diet (DM basis).
Material and methods The experiment was of a 2 × 4 factorial design whereby two breeds (AAx, crossbred Aberdeen
Angus; LIMx, crossbred Limousin) received a mixed forage and concentrate diet (forage:concentrate (g/kg DM): 557:443)
with four CH4 mitigation treatments (Control, Ctrl; Nitrate. Nit; Lipid, Lip; Combined, Comb): (Ctrl) containing rapeseed
meal as the main protein source which was replaced with either (Nit) Calcinit, (19 g nitrate/kg diet DM); (Lip) maize dark
grains (acid hydrolysed ether extract (AHEE) increased from 25 to 37 g AHEE/kg diet DM) or (Comb) nitrate (19 g
nitrate/kg diet DM) and lipid (36 g AHEE/kg diet DM). Diets were fed ad libitum. Steers (18 per treatment; live-weight,
659 kg (SE 8.3)) were offered experimental diets for a minimum of 10 weeks prior to measurement of CH4 and H2
emissions using 6 open-circuit respiration chambers (Troy et al. 2015). Steers were assigned to chambers using a
randomised block design in 13 weekly periods. Data were available for 71 steers and were analysed using general linear
models with fixed effects of breed, nitrate addition and increased lipid and random effects of chamber and block.
Results Steers receiving treatments which included nitrate produced less CH4 and more H2 than those receiving treatments
without added nitrate, when expressed on both a daily and intake corrected basis. Increasing the dietary lipid content had no
significant effect on CH4 or H2 emissions. There were no significant interactions between nitrate and lipid on CH4 or H2
emissions. Animals receiving the treatments which included nitrate produced 2.1 g/kg DMI less CH4 than those animals
that did not receive nitrate, which equates to 45% of the theoretical CH4 reduction potential given the amount of nitrate
added.
AAx steers were heavier than the LIMx steers and had a higher DMI during the chamber period. Therefore, they produced
more CH4 on a daily basis. However, the LIMx steers produced more CH4 when corrected for feed intake. Breed had no
effect on H2 emissions on both a daily and intake corrected basis.
Treatment Breed Significance Ctrl Nit Lip Comb AAx LIMx Nitrate Lipid Breed
CH4 (g/day) 246 219 238 210 242 215 *** NS *** CH4 (g/kg DMI) 24.0 22.1 23.4 20.9 22.1 23.2 *** NS *
H2 (g/day) 0.46 0.99 0.40 1.05 0.77 0.67 *** NS NS
H2 (g/kg DMI) 0.04 0.10 0.04 0.10 0.07 0.07 *** NS NS DMI (kg/day) 10.4 9.8 10.2 10.2 11.0 9.3 NS NS ***
There were no interactions between the nitrate and lipid treatments or between breed and nutritional treatments.
Conclusion There were no significant interactions between nitrate and lipid on CH4 or H2 emissions; thus the effects of
adding nitrate and increasing lipid were independent of each other. LIMx steers produced more CH4 than AAx steers on an
intake corrected basis.
Acknowledgements The authors gratefully acknowledge funding from AHDB Beef & Lamb, the Scottish Government and
by DEFRA and the devolved administrations through the UK Agricultural Greenhouse Gas Inventory Research Platform.
References
Gerber, P.J., Steinfeld, H., Henderson, B., Mottet, A., Opio, C., Dijkman, J., Falcucci, A., Tempio, G., 2013. FAO Report.
Patra, A.K., 2013. Livestock Science 155, 244–254.
Troy, S.M., Duthie, C.-A., Hyslop, J.J., Roehe, R., Ross, D.W., Wallace, R.J., Waterhouse, A., Rooke, J.A., 2015. Journal
of Animal Science 93, 1815–1823.
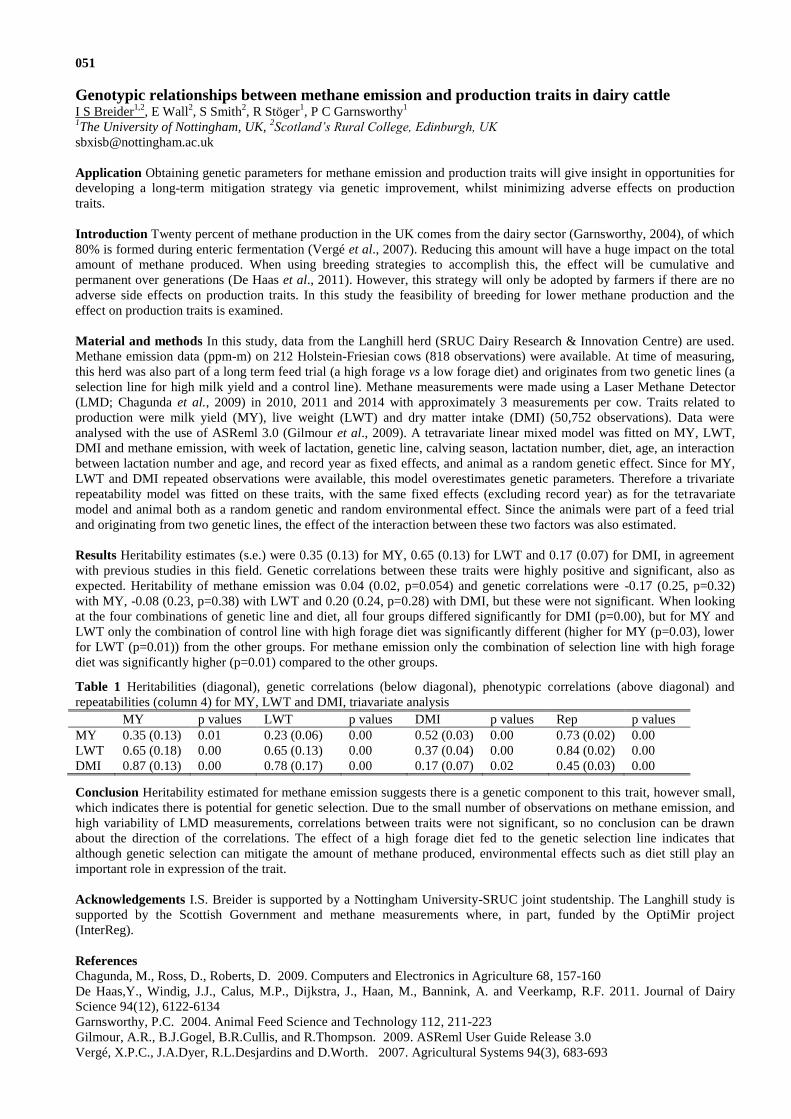
051
Genotypic relationships between methane emission and production traits in dairy cattle I S Breider
1,2, E Wall
2, S Smith
2, R Stöger
1, P C Garnsworthy
1
1The University of Nottingham, UK,
2Scotland’s Rural College, Edinburgh, UK
Application Obtaining genetic parameters for methane emission and production traits will give insight in opportunities for
developing a long-term mitigation strategy via genetic improvement, whilst minimizing adverse effects on production
traits.
Introduction Twenty percent of methane production in the UK comes from the dairy sector (Garnsworthy, 2004), of which
80% is formed during enteric fermentation (Vergé et al., 2007). Reducing this amount will have a huge impact on the total
amount of methane produced. When using breeding strategies to accomplish this, the effect will be cumulative and
permanent over generations (De Haas et al., 2011). However, this strategy will only be adopted by farmers if there are no
adverse side effects on production traits. In this study the feasibility of breeding for lower methane production and the
effect on production traits is examined.
Material and methods In this study, data from the Langhill herd (SRUC Dairy Research & Innovation Centre) are used.
Methane emission data (ppm-m) on 212 Holstein-Friesian cows (818 observations) were available. At time of measuring,
this herd was also part of a long term feed trial (a high forage vs a low forage diet) and originates from two genetic lines (a
selection line for high milk yield and a control line). Methane measurements were made using a Laser Methane Detector
(LMD; Chagunda et al., 2009) in 2010, 2011 and 2014 with approximately 3 measurements per cow. Traits related to
production were milk yield (MY), live weight (LWT) and dry matter intake (DMI) (50,752 observations). Data were
analysed with the use of ASReml 3.0 (Gilmour et al., 2009). A tetravariate linear mixed model was fitted on MY, LWT,
DMI and methane emission, with week of lactation, genetic line, calving season, lactation number, diet, age, an interaction
between lactation number and age, and record year as fixed effects, and animal as a random genetic effect. Since for MY,
LWT and DMI repeated observations were available, this model overestimates genetic parameters. Therefore a trivariate
repeatability model was fitted on these traits, with the same fixed effects (excluding record year) as for the tetravariate
model and animal both as a random genetic and random environmental effect. Since the animals were part of a feed trial
and originating from two genetic lines, the effect of the interaction between these two factors was also estimated.
Results Heritability estimates (s.e.) were 0.35 (0.13) for MY, 0.65 (0.13) for LWT and 0.17 (0.07) for DMI, in agreement
with previous studies in this field. Genetic correlations between these traits were highly positive and significant, also as
expected. Heritability of methane emission was 0.04 (0.02, p=0.054) and genetic correlations were -0.17 (0.25, p=0.32)
with MY, -0.08 (0.23, p=0.38) with LWT and 0.20 (0.24, p=0.28) with DMI, but these were not significant. When looking
at the four combinations of genetic line and diet, all four groups differed significantly for DMI (p=0.00), but for MY and
LWT only the combination of control line with high forage diet was significantly different (higher for MY (p=0.03), lower
for LWT (p=0.01)) from the other groups. For methane emission only the combination of selection line with high forage
diet was significantly higher (p=0.01) compared to the other groups.
Table 1 Heritabilities (diagonal), genetic correlations (below diagonal), phenotypic correlations (above diagonal) and
repeatabilities (column 4) for MY, LWT and DMI, triavariate analysis
MY p values LWT p values DMI p values Rep p values
MY 0.35 (0.13) 0.01 0.23 (0.06) 0.00 0.52 (0.03) 0.00 0.73 (0.02) 0.00
LWT 0.65 (0.18) 0.00 0.65 (0.13) 0.00 0.37 (0.04) 0.00 0.84 (0.02) 0.00
DMI 0.87 (0.13) 0.00 0.78 (0.17) 0.00 0.17 (0.07) 0.02 0.45 (0.03) 0.00
Conclusion Heritability estimated for methane emission suggests there is a genetic component to this trait, however small,
which indicates there is potential for genetic selection. Due to the small number of observations on methane emission, and
high variability of LMD measurements, correlations between traits were not significant, so no conclusion can be drawn
about the direction of the correlations. The effect of a high forage diet fed to the genetic selection line indicates that
although genetic selection can mitigate the amount of methane produced, environmental effects such as diet still play an
important role in expression of the trait.
Acknowledgements I.S. Breider is supported by a Nottingham University-SRUC joint studentship. The Langhill study is
supported by the Scottish Government and methane measurements where, in part, funded by the OptiMir project
(InterReg).
References
Chagunda, M., Ross, D., Roberts, D. 2009. Computers and Electronics in Agriculture 68, 157-160
De Haas,Y., Windig, J.J., Calus, M.P., Dijkstra, J., Haan, M., Bannink, A. and Veerkamp, R.F. 2011. Journal of Dairy
Science 94(12), 6122-6134
Garnsworthy, P.C. 2004. Animal Feed Science and Technology 112, 211-223
Gilmour, A.R., B.J.Gogel, B.R.Cullis, and R.Thompson. 2009. ASReml User Guide Release 3.0
Vergé, X.P.C., J.A.Dyer, R.L.Desjardins and D.Worth. 2007. Agricultural Systems 94(3), 683-693
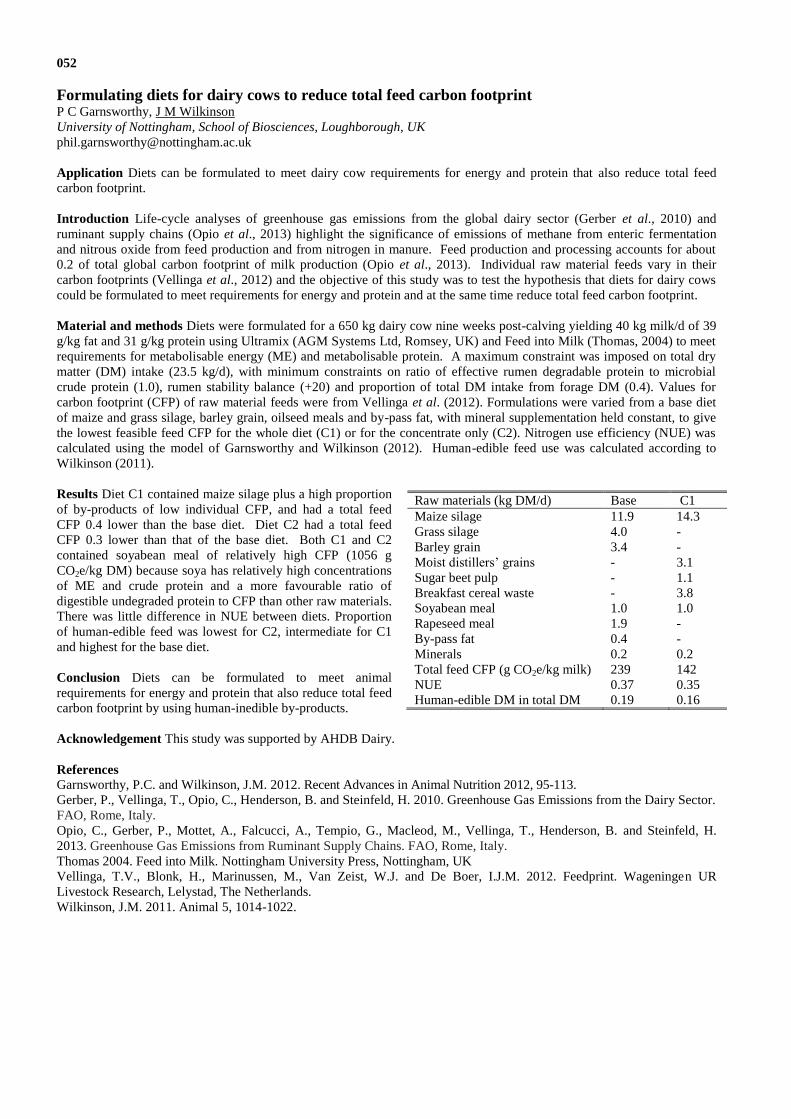
Raw materials (kg DM/d) Base C1 C2
Maize silage 11.9 14.3 11.9
G Grass silage 4.0 - 4.0
Barley grain 3.4 - -
Moist distillers’ grains - 3.1 1.3
Sugar beet pulp - 1.1 -
Breakfast cereal waste - 3.8 3.8
Soyabean meal 1.0 1.0 1.6
Rapeseed meal 1.9 - -
By-pass fat 0.4 - -
Minerals 0.2 0.2 0.2
Total feed CFP (g CO2e/kg milk) 239 142 168
NUE 0.37 0.35 0.37
Human-edible DM in total DM 0.19 0.16 0.09
052
Formulating diets for dairy cows to reduce total feed carbon footprint P C Garnsworthy, J M Wilkinson
University of Nottingham, School of Biosciences, Loughborough, UK
Application Diets can be formulated to meet dairy cow requirements for energy and protein that also reduce total feed
carbon footprint.
Introduction Life-cycle analyses of greenhouse gas emissions from the global dairy sector (Gerber et al., 2010) and
ruminant supply chains (Opio et al., 2013) highlight the significance of emissions of methane from enteric fermentation
and nitrous oxide from feed production and from nitrogen in manure. Feed production and processing accounts for about
0.2 of total global carbon footprint of milk production (Opio et al., 2013). Individual raw material feeds vary in their
carbon footprints (Vellinga et al., 2012) and the objective of this study was to test the hypothesis that diets for dairy cows
could be formulated to meet requirements for energy and protein and at the same time reduce total feed carbon footprint.
Material and methods Diets were formulated for a 650 kg dairy cow nine weeks post-calving yielding 40 kg milk/d of 39
g/kg fat and 31 g/kg protein using Ultramix (AGM Systems Ltd, Romsey, UK) and Feed into Milk (Thomas, 2004) to meet
requirements for metabolisable energy (ME) and metabolisable protein. A maximum constraint was imposed on total dry
matter (DM) intake (23.5 kg/d), with minimum constraints on ratio of effective rumen degradable protein to microbial
crude protein (1.0), rumen stability balance (+20) and proportion of total DM intake from forage DM (0.4). Values for
carbon footprint (CFP) of raw material feeds were from Vellinga et al. (2012). Formulations were varied from a base diet
of maize and grass silage, barley grain, oilseed meals and by-pass fat, with mineral supplementation held constant, to give
the lowest feasible feed CFP for the whole diet (C1) or for the concentrate only (C2). Nitrogen use efficiency (NUE) was
calculated using the model of Garnsworthy and Wilkinson (2012). Human-edible feed use was calculated according to
Wilkinson (2011).
Results Diet C1 contained maize silage plus a high proportion
of by-products of low individual CFP, and had a total feed
CFP 0.4 lower than the base diet. Diet C2 had a total feed
CFP 0.3 lower than that of the base diet. Both C1 and C2
contained soyabean meal of relatively high CFP (1056 g
CO2e/kg DM) because soya has relatively high concentrations
of ME and crude protein and a more favourable ratio of
digestible undegraded protein to CFP than other raw materials.
There was little difference in NUE between diets. Proportion
of human-edible feed was lowest for C2, intermediate for C1
and highest for the base diet.
Conclusion Diets can be formulated to meet animal
requirements for energy and protein that also reduce total feed
carbon footprint by using human-inedible by-products.
Acknowledgement This study was supported by AHDB Dairy.
References
Garnsworthy, P.C. and Wilkinson, J.M. 2012. Recent Advances in Animal Nutrition 2012, 95-113.
Gerber, P., Vellinga, T., Opio, C., Henderson, B. and Steinfeld, H. 2010. Greenhouse Gas Emissions from the Dairy Sector.
FAO, Rome, Italy.
Opio, C., Gerber, P., Mottet, A., Falcucci, A., Tempio, G., Macleod, M., Vellinga, T., Henderson, B. and Steinfeld, H.
2013. Greenhouse Gas Emissions from Ruminant Supply Chains. FAO, Rome, Italy.
Thomas 2004. Feed into Milk. Nottingham University Press, Nottingham, UK
Vellinga, T.V., Blonk, H., Marinussen, M., Van Zeist, W.J. and De Boer, I.J.M. 2012. Feedprint. Wageningen UR
Livestock Research, Lelystad, The Netherlands.
Wilkinson, J.M. 2011. Animal 5, 1014-1022.

053
Long-term changes in rumen volatile fatty acids (VFA) and archaea to bacteria (AB) ratios in
cattle fed either high concentrate or mixed forage:concentrate diets with or without the addition
of nitrate (NO3) J A Rooke
1, S M Troy
1, C-A Duthie
1, J J Hyslop
3, D W Ross
1, T Waterhouse
1, R Roehe
1, R J Wallace
2
1SRUC, Edinburgh, UK,
2Rowett Institute of Nutrition and Health, Aberdeen, UK,
3SAC Consulting, Edinburgh, UK
Application Rumen VFA concentrations and AB ratios established after adaptation to different basal diets and introduction
of NO3 as a treatment to mitigate methane emissions were stable for up to 5 months.
Introduction Many strategies to reduce methane emissions from ruminant livestock are initially successful but their long-
term effectiveness can be limited by adaptation of the rumen microbiota. However, long-term monitoring of the rumen is
rarely reported. Therefore, long term changes in rumen VFA and AB ratios when NO3 was included in the diet are
reported.
Material and methods Rumen samples were obtained during an experiment in which performance (Duthie et al. 2015) and
methane emissions (Troy et al. 2015) of beef steers were measured. The cattle (n=14 per treatment) were offered ad
libitum, either a high concentrate (C, 920 g concentrate/kg DM) or forage-based (F, 500 g concentrate/kg DM) basal diet
without (Con) or with the addition of NO3 (NO3, 20 g/kg DM) giving 4 treatments, CCON, CNO3, FCON and FNO3.
Rumen samples were obtained by stomach tube before NO3 was added to diets C and F (week (W) -7), 7 days after
addition of 5 g NO3/kg DM to diets (W-3), 1 week after addition of 20 g NO3/kg DM to diets (W0) and 4 (W4) and 8 (W8)
weeks subsequently. Samples were also obtained when steers left respiration chambers (between W9 and W20) by stomach
tube and by sampling rumen contents at slaughter (between W12 and W21). Rumen samples were strained through muslin
and analysed for VFA and DNA extracted and analysed for total bacteria and archaea (Rooke et al. 2014). VFA, reported
as acetate to propionate ratio (AP, mol/mol) and AB ratio (copy number basis) were analysed using a split plot analysis of
variance in Genstat with main effects the 2 x 2 factorial arrangement of diet and nitrate and sample time as a split plot. Four
sample points were considered ((i), during adaptation to NO3, W-3; (ii) as the mean of W0, W4, W8 (W4 in Fig. 1); (iii) on
leaving respiration chambers (Ch in Fig. 1) and (iv) at slaughter (Sl in Fig. 1); data from W-7 were included in analysis as a
covariate (AP, P<0.01; AB, P=0.07).
Results AP ratio (Figure 1a) was greater in forage- (F v C, P<0.001) and NO3-fed (NO3 v CON, P<0.05) cattle. AB ratio
(Figure 1b) was greater in forage- (F v C, P<0.05) and less in NO3-fed (NO3 v CON, P<0.05) cattle. These differences
were consistent between samples. Although AP and AB ratios changed with time (P<0.001), differences between times
were quantitatively small for AP. However, AB ratios for Ch and Sl samples were greater than W-3 and W4 samples.
Figure 1 AP (a) and AB (b) ratios in rumen samples taken during and after adaptation of cattle to NO3-containing diets.
, CCON;, CNO3; , FCON, , FNO3. SE of means were (a) for AP, 0.28 (n=13) and (b) for AB, 6.1 (n=9).
Conclusion The effects of basal diet and NO3 on VFA patterns and AB ratios were consistent for up to 5 months.
However, AB ratios were also influenced by sampling procedures.
Acknowledgements Funding from AHDB Beef & Lamb, the Scottish Government and by DEFRA and the devolved
administrations through the UK Agricultural Greenhouse Gas Inventory Research Platform is gratefully acknowledged.
References
Duthie, C-A., Rooke, J.A., Troy, S., Hyslop, J.J., Ross, D.W., Waterhouse, A., Roehe, R. 2015. Animal doi:
10.1017/S1751731115002657.
Rooke, J.A., Wallace R.J., Duthie C.-A., McKain N., de Souza S.M., Hyslop J.J., Ross D.W., Waterhouse, T., Roehe R.
2014. British Journal of Nutrition 112, 398-407.
Troy, S.M., Duthie, C.-A., Hyslop J.J., Roehe R., Ross D.W., Wallace R.J., Waterhouse T., Rooke J.A. 2015. Journal of
Animal Science 93, 1815-1823.
W-3 W4 Ch Sl W-3 W4 Ch Sl
(a) (b)
AP
rat
io (
mo
l/m
ol)
)
AB
rat
io
054
Prediction of enteric methane emissions from sheep fed fresh perennial ryegrass (Lolium
perenne) using data measured in respiration chambers Y G Zhao
1,2, N E O'Connell
2, T Yan
1
1Agri-Food and Biosciences Institute, Hillsborough, UK,
2Queen's University of Belfast, UK
Application Grass intake, nutrient and energy contents and digestible organic matter concentration can be used to predict
methane (CH4) emissions from sheep. These models can contribute to develop robust national CH4 inventories for sheep.
Introduction The IPCC Tier 1 default emission factor was used in UK to estimate enteric CH4 production for sheep with
no consideration of effects of animal and dietary factors (NAEI, 2015). There is an urgent need to develop more accurate
emission factors specific to sheep and representative of the breeds and rearing systems employed in the UK sheep industry.
The aim of the present study was to develop prediction equations of CH4 emissions from sheep fed perennial ryegrass.
Material and methods Data used were collated from six experiments (from May 2012 to June 2014) with 82 growing
lambs and replacement ewes (Highlander, Texel, Scottish Blackface and Swaledale) aged between 5 and 18 months,
weighted from 24.5 to 62.7 kg and offered fresh perennial ryegrass only ad libitum. Fresh grass was harvested daily in the
morning from the perennial ryegrass swards in the research farm at Agri-Food and Biosciences Institute (Hillsborough, Co.
Down, UK). Grass contained on average (g/kg dry matter (DM)): ash 91, nitrogen (N) 28, neutral detergent fibre (NDF)
499, acid detergent fibre (ADF) 254, water soluble carbohydrates (WSC) 156 and gross energy (GE) 18.6 (MJ/kg DM).
Animals were individually housed in pens and fed experimental diets for 19 days before being transferred to individual
calorimeter chambers for a further 4 days with feed intake, faecal and urine outputs collected and CH4 emissions measured
for the final 3 days. Liveweight (LW) was measured at the beginning of the study and before entering and after leaving the
chamber. Data were analysed using REML analysis to develop prediction equations for enteric CH4 emissions using feed
intake, grass chemical composition, LW and digestibility with effects of sex, breed and experimental periods removed. The
regression procedure sequentially added terms to fixed model and only the predictors with a significant effect (P < 0.05) on
the relationship were left in the models. The statistical programme used in this study was Genstat statistical package with a
probability level of P < 0.05 for significance in relationships.
Results The prediction equations for CH4 emissions are presented in Table 1. All relationships were significant (P < 0.001)
and each predictor had a significant effect on the relationship (P < 0.001). There was a strong positive relationship between
CH4 production (g/d) and DM intake (DMI). Adding grass NDF, N and metabolisable energy (ME) concentrations and
digestible organic matter (OM) in DM (DOMD) to this relationship increased prediction accuracy. Models using LW and
grass DM, GE, OM and N concentrations as predictors performed satisfactorily. These equations can be used in
commercial practice when DMI, DE and ME are not available. The negative relationship between CH4/DMI (g/kg) and
DMI indicated that when DMI increased by 1 kg/d, the predicted response in CH4 production was a decline of 5.3 g/kg
DMI.
Table 1 Prediction equations for methane emissions from sheep fed perennial ryegrass (n = 82)1,2
Equations SE r2
CH4 (g/d) = 16.7(0.74) DMI + 3.1(0.73) 2.63 0.86
= 18.3(0.62) DMI – 2.3(0.55) ME + 34.3(7.19) NDF + 260.6(41.3) N + 49.5(14.4) DOMD – 30.5(8.15) 2.05 0.92
= 0.34(0.059) LW + 151(28.5) DM + 24.5(3.70) GE – 463(69.9) OM – 1124(260) N – 23(58.5) 4.42 0.63
CH4/DMI
(g/kg)
= -5.3(0.92) DMI + 25.8(0.90) 3.23 0.29
= -3.8(0.79) ME + 34(10.4) NDF + 375(58.3) N + 94(20.9) DOMD – 28(11.6) 3.02 0.41
= 7.9(0.74) DE – 7.3(0.65) ME – 2.7(4.63) 2.39 0.62 1Values in subscript parentheses are SE;
2The units of parameters are kg/kg DM or MJ/kg DM except DMI (kg/d) and LW (kg).
Conclusion Methane emissions from sheep fed perennial ryegrass can be predicted by DMI and grass ME, NDF, N and
DOMD concentrations. Models based on farm level data (e.g., liveweight and grass DM, GE, OM and N concentrations)
were also developed and performed satisfactorily. Increasing 1kg DMI would decrease CH4 yield by 5.3 g/kg DMI. These
models can contribute to decrease the uncertainty in the development of CH4 emission inventories of ryegrass pasture-
based sheep industry. However, there is also a need for measurements with other forages (and with concentrates etc).
Acknowledgements This work was funded by DEFRA, the Scottish Government, DARD, and the Welsh Government as
part of the UK's Agricultural GHG Research Platform project (www.ghgplatform.org.uk).
References
National Atmospheric Emissions Inventory. 2015. Greenhouse Gas Inventories for England, Scotland, Wales and Northern
Ireland: 1990 – 2013.

055
Use of near-infrared reflectance spectroscopy to predict individual and total fatty acid content of
perennial ryegrass (Lolium perenne) S A Morgan, S A Huws, J K S Tweed, R Sanderson, S J Lister, N D Scollan
IBERS, Aberystwyth University, Ceredigion, UK
Application Offering a rapid and cheap high-throughput alternate method to gas chromatography (GC) for estimating forage
fatty acid (FA) content which will aid in selection and breeding for this trait.
Introduction Near-infrared reflectance spectroscopy (NIRS) offers a rapid, non-destructive and low cost method for
predicting chemical composition compared to traditional wet chemistry techniques (Corson et al., 1999). Consequently, it
has been widely adopted by the agricultural industry to provide accurate estimations of feed composition and particularly
nutritional evaluation and improvement of forage (Shenk & Westerhaus, 1994). One forage trait attracting growing interest
of late is FAs, due to potential for (1) increasing energy provision to ruminants, (2) improving FA profile of ruminant
products, and (3) developing non-seed biomass oil crops. This study sought to establish and evaluate NIRS calibrations for
prediction of individual and total fatty acid (TFA) content of perennial ryegrass.
Material and methods Four replicates of four Aurora x AberMagic F1 mapping and twenty 13th
generation intermediate
heading breeding population genotypes were maintained under poly-tunnel conditions. Plant material was harvested by
hand to a height of ~5cm in July 2012, snap frozen, freeze dried and ground. FA methyl esters (FAMEs) were extracted
(Sukhija & Palmquist, 1988) and quantified via GC (CP-3800 with PAL Autosampler; Varian Inc, CA, USA) using a CP-
select 100 m x 0.25 mm chemically bonded for FAME column (Agilent Technologies UK Ltd, Berkshire, UK). Peaks were
identified and quantified using a 37 FAME standard and C23:0 internal standard respectively. NIRS analysis was carried
out using a scanning monochromator (FOSS NIRSystems 6500; FOSS UK Ltd., Warrington, UK). Samples (n = 96) were
scanned at 2 nm intervals from 400 - 2500 nm in reflectance mode with data collected using WinISI II (Version 1.02a;
FOSS, Infrasoft International, PA, USA). Spectra were subjected to standard normal variate and detrend scatter corrections
and 1st (1,4,4,1) and 2
nd (2,6,4,1) derivative math treatments were evaluated. Outliers were identified as samples with a
critical t-statistic of >2.5 or global-H value of >10 and removed from the dataset. Data from 1100 - 2498 nm were used to
develop calibrations using modified partial least squares regression with group cross-validation using WinISI 4 (Version
4.6.8; FOSS Analytical A/S, Hilleroed, Denmark). Optimal calibrations were selected based on minimum standard error of
cross-validation and maximum coefficient of determination.
Results FA and calibration results are presented in Table 1. The data used for calibration development showed coefficients
of variation (CV%) ranging from 14.2 to 19.9 % for C16:0, C18:0, C18:1c9, C18:2n-6 and TFA while C16:1t3 and
C18:3n-3 showed greater variation (31.9 and 26.8 %, respectively). Standard errors were generally low and all calibrations
had good linearity with R2 values > 0.8 and 1-VR values of > 0.7, except for C18:1c9 where R
2 was 0.53 and 1-VR was
0.29.
Fatty Acid Math
Treatment
n (g kg-1
DM) No. of
Terms
SEC R2 SECV 1-VR
Min Max Mean SD
C16:0 2nd
, (2,6,4,1) 92 2.64 5.21 3.93 0.560 5 0.160 0.92 0.189 0.88
C16:1t3 2nd
, (2,6,4,1) 94 0.13 0.71 0.37 0.118 7 0.030 0.94 0.037 0.90
C18:0 1st, (1,4,4,1) 89 0.28 0.49 0.37 0.056 7 0.025 0.80 0.030 0.71
C18:1c9 1st, (1,4,4,1) 95 0.39 0.78 0.58 0.084 6 0.058 0.53 0.071 0.29
C18:2n-6 2nd
, (2,6,4,1) 94 2.48 4.92 3.64 0.549 6 0.193 0.88 0.247 0.76
C18:3n-3 2nd
, (2,6,4,1) 92 6.28 20.67 12.74 3.411 6 0.711 0.96 0.853 0.94
TFA 2nd
, (2,6,4,1) 92 14.48 33.79 23.30 4.637 6 0.950 0.96 1.095 0.94
n, number of samples; SD, standard deviation; SEC, standard error of calibration; R2, coefficient of determination for
calibration; SECV, standard error of cross-validation; 1-VR, coefficient of determination for cross-validation.
Conclusion These results demonstrate that NIRS is capable of predicting individual and total FA content of perennial
ryegrass, in agreement with previous investigations (Foster et al, 2006). The accuracies of these predictions would suffice
in screening plants for higher or lower FA content. However, further work to add more data encompassing a wider range of
cultivars grown under a variety of conditions could increase calibration robustness with the potential to enable
quantification of FAs through NIRS, which would facilitate plant selection and breeding for this trait.
Acknowledgements This project is funded through KESS with further support from Celtic Pride Ltd. KESS is part-funded
by the ESF through the EU's Convergence Programme (West Wales & the Valleys) administered by the Welsh
Government.
References
Corson D.C., Waghorn G.C., Ulyatt M.J., & Lee J. 1999. Proceedings of the New Zealand Grassland Association 61, 127–
132.
Foster J.G., Clapham W.M., & Fedders J.M. 2006. Journal of Agricultural and Food Chemistry 54, 3186–3192.
Shenk J.S. and Westerhaus M.O. 1994. Forage quality, evaluation, and utilization. pp. 406–449.
Sukhija P.S. and Palmquist D.L. 1988. Journal of Agricultural and Food Chemistry 36, 1202–1206.
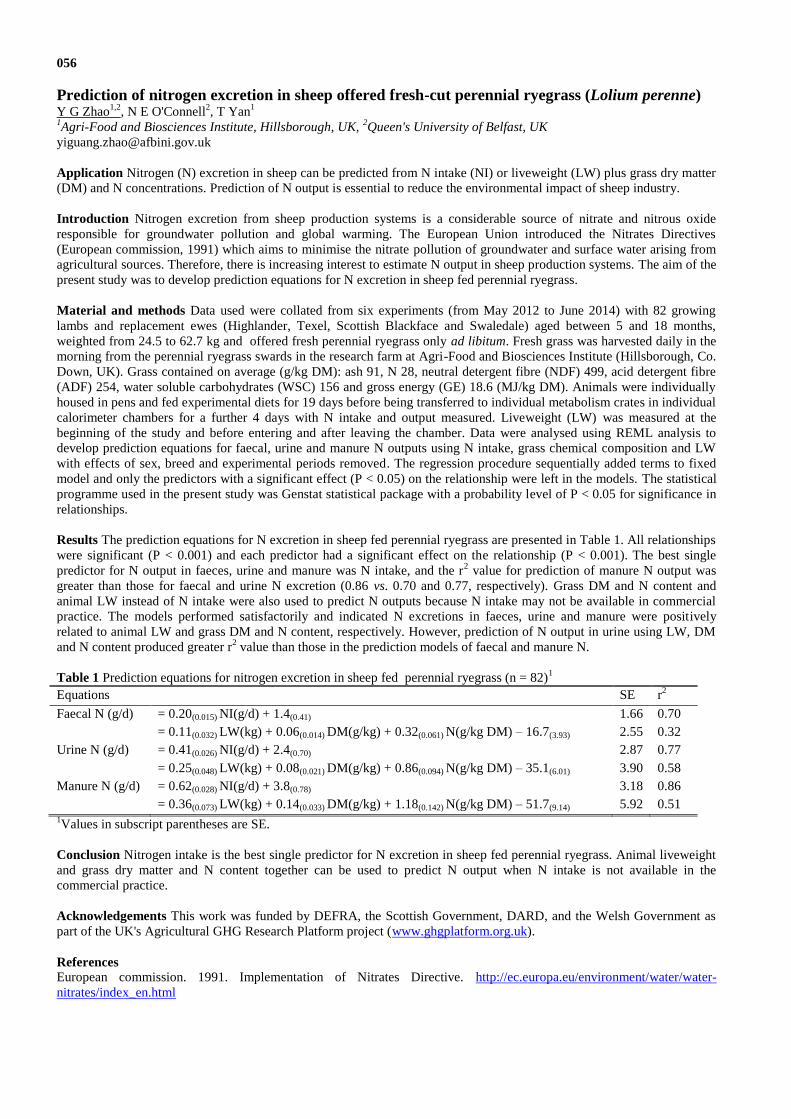
056
Prediction of nitrogen excretion in sheep offered fresh-cut perennial ryegrass (Lolium perenne) Y G Zhao
1,2, N E O'Connell
2, T Yan
1
1Agri-Food and Biosciences Institute, Hillsborough, UK,
2Queen's University of Belfast, UK
Application Nitrogen (N) excretion in sheep can be predicted from N intake (NI) or liveweight (LW) plus grass dry matter
(DM) and N concentrations. Prediction of N output is essential to reduce the environmental impact of sheep industry.
Introduction Nitrogen excretion from sheep production systems is a considerable source of nitrate and nitrous oxide
responsible for groundwater pollution and global warming. The European Union introduced the Nitrates Directives
(European commission, 1991) which aims to minimise the nitrate pollution of groundwater and surface water arising from
agricultural sources. Therefore, there is increasing interest to estimate N output in sheep production systems. The aim of the
present study was to develop prediction equations for N excretion in sheep fed perennial ryegrass.
Material and methods Data used were collated from six experiments (from May 2012 to June 2014) with 82 growing
lambs and replacement ewes (Highlander, Texel, Scottish Blackface and Swaledale) aged between 5 and 18 months,
weighted from 24.5 to 62.7 kg and offered fresh perennial ryegrass only ad libitum. Fresh grass was harvested daily in the
morning from the perennial ryegrass swards in the research farm at Agri-Food and Biosciences Institute (Hillsborough, Co.
Down, UK). Grass contained on average (g/kg DM): ash 91, N 28, neutral detergent fibre (NDF) 499, acid detergent fibre
(ADF) 254, water soluble carbohydrates (WSC) 156 and gross energy (GE) 18.6 (MJ/kg DM). Animals were individually
housed in pens and fed experimental diets for 19 days before being transferred to individual metabolism crates in individual
calorimeter chambers for a further 4 days with N intake and output measured. Liveweight (LW) was measured at the
beginning of the study and before entering and after leaving the chamber. Data were analysed using REML analysis to
develop prediction equations for faecal, urine and manure N outputs using N intake, grass chemical composition and LW
with effects of sex, breed and experimental periods removed. The regression procedure sequentially added terms to fixed
model and only the predictors with a significant effect (P < 0.05) on the relationship were left in the models. The statistical
programme used in the present study was Genstat statistical package with a probability level of P < 0.05 for significance in
relationships.
Results The prediction equations for N excretion in sheep fed perennial ryegrass are presented in Table 1. All relationships
were significant (P < 0.001) and each predictor had a significant effect on the relationship (P < 0.001). The best single
predictor for N output in faeces, urine and manure was N intake, and the r2 value for prediction of manure N output was
greater than those for faecal and urine N excretion (0.86 vs. 0.70 and 0.77, respectively). Grass DM and N content and
animal LW instead of N intake were also used to predict N outputs because N intake may not be available in commercial
practice. The models performed satisfactorily and indicated N excretions in faeces, urine and manure were positively
related to animal LW and grass DM and N content, respectively. However, prediction of N output in urine using LW, DM
and N content produced greater r2 value than those in the prediction models of faecal and manure N.
Table 1 Prediction equations for nitrogen excretion in sheep fed perennial ryegrass (n = 82)1
Equations SE r2
Faecal N (g/d) = 0.20(0.015) NI(g/d) + 1.4(0.41) 1.66 0.70
= 0.11(0.032) LW(kg) + 0.06(0.014) DM(g/kg) + 0.32(0.061) N(g/kg DM) – 16.7(3.93) 2.55 0.32
Urine N (g/d) = 0.41(0.026) NI(g/d) + 2.4(0.70) 2.87 0.77
= 0.25(0.048) LW(kg) + 0.08(0.021) DM(g/kg) + 0.86(0.094) N(g/kg DM) – 35.1(6.01) 3.90 0.58
Manure N (g/d) = 0.62(0.028) NI(g/d) + 3.8(0.78) 3.18 0.86
= 0.36(0.073) LW(kg) + 0.14(0.033) DM(g/kg) + 1.18(0.142) N(g/kg DM) – 51.7(9.14) 5.92 0.51 1Values in subscript parentheses are SE.
Conclusion Nitrogen intake is the best single predictor for N excretion in sheep fed perennial ryegrass. Animal liveweight
and grass dry matter and N content together can be used to predict N output when N intake is not available in the
commercial practice.
Acknowledgements This work was funded by DEFRA, the Scottish Government, DARD, and the Welsh Government as
part of the UK's Agricultural GHG Research Platform project (www.ghgplatform.org.uk).
References
European commission. 1991. Implementation of Nitrates Directive. http://ec.europa.eu/environment/water/water-
nitrates/index_en.html

057
Silvopastoral systems for sustainable animal production D M Broom
University of Cambridge, UK
Application Three-level silvopastoral systems, developed in the tropics and sub-tropics, can be more sustainable than
monoculture pasture systems and can be considered by producers for development in some temperate environments.
Introduction A system or procedure is sustainable if it is acceptable now and if its expected future effects are acceptable,
in particular in relation to resource availability, consequences of functioning and morality of action. A production system
might be unsustainable because of: inefficient usage of world food resources; adverse effects on human health; poor
welfare of animals; harmful environmental effects such as low biodiversity or insufficient conservation; unacceptable
genetic modification; not being “fair trade” in that producers in poor countries are not properly rewarded; or damage to
rural communities. Any of these inadequacies could result in the quality of the product being judged as poor. Three-level
plant production systems, that include pasture, shrubs with edible leaves and trees that may also have edible leaves are
examples of silvopastoral systems. The production of leaves and other material that can be eaten by the animals is much
greater on three-level silvopastoral than on pasture-only systems. Production animals, including cattle and sheep, may
consume the plant material directly, or tree and shrub leaves may be cut and fed to ruminants, pigs, poultry or farmed fish.
Material and methods In five studies in Colombia and Mexico, a series of fields were planted with grasses such as
Cynodon plectostachys and the leguminous shrub Leucaena leucocephala at 8,000 or 10,000 ha-1
together with Guazuma
ulmifolia in one of the studies. Trees of several species, or trees as live fences, mainly with edible leaves were left growing
or planted in or around the fields. These three-level silvopastoral systems (SSP) were compared with “improved pasture”:
monoculture fields planted to produce grass only (M) on the same farm. Beef or dairy cattle, 27 in some studies and 8 in
others, were rotated through either the SSP or M fields. Field size varied but stocking density and duration in field were
adjusted according to food availability with a mean of four days in each field. There were also comparisons of farms that
used only SSP or only M.
CH4 and N2O were measured following the IPCC (2006) protocols and in vitro studies of Cynodon/ Leucaena mixtures.
Results Some examples of results from these tropical and sub-tropical (higher altitude) studies are shown in Table 1. Soil
water-holding and production of herbage dry matter, plant protein and cattle were better on SSP. No added nitrogen was
needed on SSP and, since meat production was greater on SSP, methane per tonne of meat was lower. Populations of
predators of ticks and flies were greater on SSP so there was less disease transmission. Body temperature in sunny
conditions was <4C lower on SSP, and cattle welfare was better because of reduced disease, more shade and more choice
for the animals. In comparisons of farms, the biodiversity was much greater on SSP than on M. Worker satisfaction was
better on SSP.
Table 1
“Improved”
monoculture pasture
(M)
Three-level
silvopastoral system
(SSP)
M.E. Mcal ha-1
56.9 70.2
Crude plant protein tonne ha-1
2.5 4.1
Milk per cow kg day-1
3.5 4.1
Meat kg ha-1
year-1
183 821
Methane tonne of meat-1
208 128
Bird species 24 75
Anaplasmosis % of herd 25 <5
Fights % difference +37
Social licking % difference +46
Social interactions in shade % difference +57
Conclusion Developments in temperate silvopastoral systems, suitable for UK use, are discussed. Two-level or three-level
silvopastoral systems should be considered to replace one-level systems for animal production.
Acknowledgements The author thanks Enrique Murgueitio, Francisco Galindo and many other collaborators in Colombia,
Mexico and Brazil.
Reference
Broom, D.M., Galindo, F.A. and Murgueitio, E. 2013. Sustainable, efficient livestock production with high biodiversity and
good welfare for animals. Proc. Roy. Soc. B. 280, 20132025. doi.org/10.1098/rspb.2013.2025
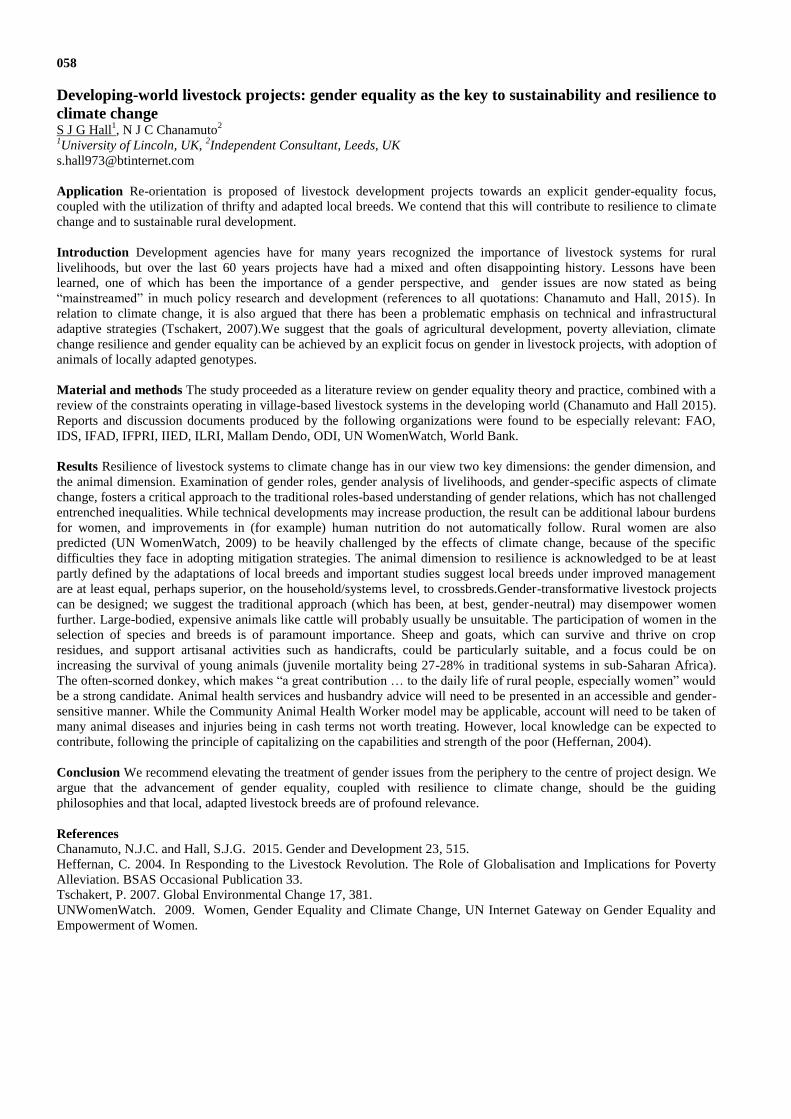
058
Developing-world livestock projects: gender equality as the key to sustainability and resilience to
climate change S J G Hall
1, N J C Chanamuto
2
1University of Lincoln, UK,
2Independent Consultant, Leeds, UK
Application Re-orientation is proposed of livestock development projects towards an explicit gender-equality focus,
coupled with the utilization of thrifty and adapted local breeds. We contend that this will contribute to resilience to climate
change and to sustainable rural development.
Introduction Development agencies have for many years recognized the importance of livestock systems for rural
livelihoods, but over the last 60 years projects have had a mixed and often disappointing history. Lessons have been
learned, one of which has been the importance of a gender perspective, and gender issues are now stated as being
“mainstreamed” in much policy research and development (references to all quotations: Chanamuto and Hall, 2015). In
relation to climate change, it is also argued that there has been a problematic emphasis on technical and infrastructural
adaptive strategies (Tschakert, 2007).We suggest that the goals of agricultural development, poverty alleviation, climate
change resilience and gender equality can be achieved by an explicit focus on gender in livestock projects, with adoption of
animals of locally adapted genotypes.
Material and methods The study proceeded as a literature review on gender equality theory and practice, combined with a
review of the constraints operating in village-based livestock systems in the developing world (Chanamuto and Hall 2015).
Reports and discussion documents produced by the following organizations were found to be especially relevant: FAO,
IDS, IFAD, IFPRI, IIED, ILRI, Mallam Dendo, ODI, UN WomenWatch, World Bank.
Results Resilience of livestock systems to climate change has in our view two key dimensions: the gender dimension, and
the animal dimension. Examination of gender roles, gender analysis of livelihoods, and gender-specific aspects of climate
change, fosters a critical approach to the traditional roles-based understanding of gender relations, which has not challenged
entrenched inequalities. While technical developments may increase production, the result can be additional labour burdens
for women, and improvements in (for example) human nutrition do not automatically follow. Rural women are also
predicted (UN WomenWatch, 2009) to be heavily challenged by the effects of climate change, because of the specific
difficulties they face in adopting mitigation strategies. The animal dimension to resilience is acknowledged to be at least
partly defined by the adaptations of local breeds and important studies suggest local breeds under improved management
are at least equal, perhaps superior, on the household/systems level, to crossbreds.Gender-transformative livestock projects
can be designed; we suggest the traditional approach (which has been, at best, gender-neutral) may disempower women
further. Large-bodied, expensive animals like cattle will probably usually be unsuitable. The participation of women in the
selection of species and breeds is of paramount importance. Sheep and goats, which can survive and thrive on crop
residues, and support artisanal activities such as handicrafts, could be particularly suitable, and a focus could be on
increasing the survival of young animals (juvenile mortality being 27-28% in traditional systems in sub-Saharan Africa).
The often-scorned donkey, which makes “a great contribution … to the daily life of rural people, especially women” would
be a strong candidate. Animal health services and husbandry advice will need to be presented in an accessible and gender-
sensitive manner. While the Community Animal Health Worker model may be applicable, account will need to be taken of
many animal diseases and injuries being in cash terms not worth treating. However, local knowledge can be expected to
contribute, following the principle of capitalizing on the capabilities and strength of the poor (Heffernan, 2004).
Conclusion We recommend elevating the treatment of gender issues from the periphery to the centre of project design. We
argue that the advancement of gender equality, coupled with resilience to climate change, should be the guiding
philosophies and that local, adapted livestock breeds are of profound relevance.
References
Chanamuto, N.J.C. and Hall, S.J.G. 2015. Gender and Development 23, 515.
Heffernan, C. 2004. In Responding to the Livestock Revolution. The Role of Globalisation and Implications for Poverty
Alleviation. BSAS Occasional Publication 33.
Tschakert, P. 2007. Global Environmental Change 17, 381.
UNWomenWatch. 2009. Women, Gender Equality and Climate Change, UN Internet Gateway on Gender Equality and
Empowerment of Women.
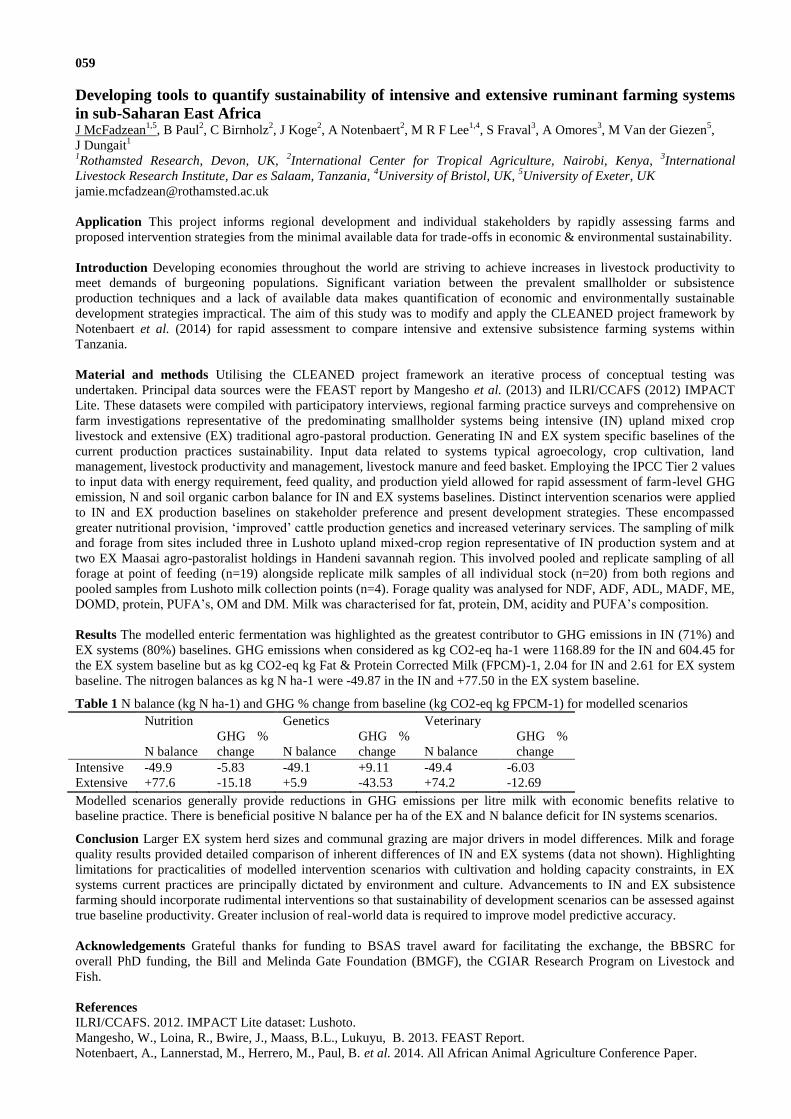
059
Developing tools to quantify sustainability of intensive and extensive ruminant farming systems
in sub-Saharan East Africa J McFadzean
1,5, B Paul
2, C Birnholz
2, J Koge
2, A Notenbaert
2, M R F Lee
1,4, S Fraval
3, A Omores
3, M Van der Giezen
5,
J Dungait1
1Rothamsted Research, Devon, UK,
2International Center for Tropical Agriculture, Nairobi, Kenya,
3International
Livestock Research Institute, Dar es Salaam, Tanzania, 4University of Bristol, UK,
5University of Exeter, UK
Application This project informs regional development and individual stakeholders by rapidly assessing farms and
proposed intervention strategies from the minimal available data for trade-offs in economic & environmental sustainability.
Introduction Developing economies throughout the world are striving to achieve increases in livestock productivity to
meet demands of burgeoning populations. Significant variation between the prevalent smallholder or subsistence
production techniques and a lack of available data makes quantification of economic and environmentally sustainable
development strategies impractical. The aim of this study was to modify and apply the CLEANED project framework by
Notenbaert et al. (2014) for rapid assessment to compare intensive and extensive subsistence farming systems within
Tanzania.
Material and methods Utilising the CLEANED project framework an iterative process of conceptual testing was
undertaken. Principal data sources were the FEAST report by Mangesho et al. (2013) and ILRI/CCAFS (2012) IMPACT
Lite. These datasets were compiled with participatory interviews, regional farming practice surveys and comprehensive on
farm investigations representative of the predominating smallholder systems being intensive (IN) upland mixed crop
livestock and extensive (EX) traditional agro-pastoral production. Generating IN and EX system specific baselines of the
current production practices sustainability. Input data related to systems typical agroecology, crop cultivation, land
management, livestock productivity and management, livestock manure and feed basket. Employing the IPCC Tier 2 values
to input data with energy requirement, feed quality, and production yield allowed for rapid assessment of farm-level GHG
emission, N and soil organic carbon balance for IN and EX systems baselines. Distinct intervention scenarios were applied
to IN and EX production baselines on stakeholder preference and present development strategies. These encompassed
greater nutritional provision, ‘improved’ cattle production genetics and increased veterinary services. The sampling of milk
and forage from sites included three in Lushoto upland mixed-crop region representative of IN production system and at
two EX Maasai agro-pastoralist holdings in Handeni savannah region. This involved pooled and replicate sampling of all
forage at point of feeding (n=19) alongside replicate milk samples of all individual stock (n=20) from both regions and
pooled samples from Lushoto milk collection points (n=4). Forage quality was analysed for NDF, ADF, ADL, MADF, ME,
DOMD, protein, PUFA’s, OM and DM. Milk was characterised for fat, protein, DM, acidity and PUFA’s composition.
Results The modelled enteric fermentation was highlighted as the greatest contributor to GHG emissions in IN (71%) and
EX systems (80%) baselines. GHG emissions when considered as kg CO2-eq ha-1 were 1168.89 for the IN and 604.45 for
the EX system baseline but as kg CO2-eq kg Fat & Protein Corrected Milk (FPCM)-1, 2.04 for IN and 2.61 for EX system
baseline. The nitrogen balances as kg N ha-1 were -49.87 in the IN and +77.50 in the EX system baseline.
Table 1 N balance (kg N ha-1) and GHG % change from baseline (kg CO2-eq kg FPCM-1) for modelled scenarios
Nutrition Genetics Veterinary
N balance
GHG %
change
N balance
GHG %
change
N balance
GHG %
change
Intensive -49.9 -5.83 -49.1 +9.11 -49.4 -6.03
Extensive +77.6 -15.18 +5.9 -43.53 +74.2 -12.69
Modelled scenarios generally provide reductions in GHG emissions per litre milk with economic benefits relative to
baseline practice. There is beneficial positive N balance per ha of the EX and N balance deficit for IN systems scenarios.
Conclusion Larger EX system herd sizes and communal grazing are major drivers in model differences. Milk and forage
quality results provided detailed comparison of inherent differences of IN and EX systems (data not shown). Highlighting
limitations for practicalities of modelled intervention scenarios with cultivation and holding capacity constraints, in EX
systems current practices are principally dictated by environment and culture. Advancements to IN and EX subsistence
farming should incorporate rudimental interventions so that sustainability of development scenarios can be assessed against
true baseline productivity. Greater inclusion of real-world data is required to improve model predictive accuracy.
Acknowledgements Grateful thanks for funding to BSAS travel award for facilitating the exchange, the BBSRC for
overall PhD funding, the Bill and Melinda Gate Foundation (BMGF), the CGIAR Research Program on Livestock and
Fish.
References
ILRI/CCAFS. 2012. IMPACT Lite dataset: Lushoto.
Mangesho, W., Loina, R., Bwire, J., Maass, B.L., Lukuyu, B. 2013. FEAST Report.
Notenbaert, A., Lannerstad, M., Herrero, M., Paul, B. et al. 2014. All African Animal Agriculture Conference Paper.

060
Holistically assessing dairy farm eco-efficiency by combining Life Cycle Analysis with Data
Envelopment Analysis A D Soteriades
1, S Moreau
2, T Charroin
2, M Blanchard
3, P Faverdin
4,5, A W Stott
1
1Scotland's Rural College (SRUC), Edinburgh, UK,
2French Livestock Institute (Idelde), Paris, France,
3French
Agricultural Research Centre for International Development (CIRAD), Bobo-Dioulasso, Burkina Faso, 4French National
Institute for Agricultural Research (INRA), St-Gilles, France, 5Agrocampus-Ouest, Rennes, France
Application This study demonstrated a modelling framework facilitating the measurement and analysis of dairy farm eco-
efficiency in much more depth than previous assessments.
Introduction Eco-efficiency is essential for sustainable dairy farming as it reflects a farm’s ability to minimize
environmental impacts (EIs) by producing at least the same output (physical or value added). It is typically expressed by
multiple partial ratios (EIs per some functional unit, e.g. unit milk), which can be problematic because (i)
incommensurability between them can complicate decision-making, (ii) substitution possibilities between EIs are ignored,
and (iii) allocation of EIs to several outputs (e.g. milk, meat, crops) is challenging. The objective of this study was to
demonstrate a 'global' eco-efficiency modelling framework overcoming issues (i)-(iii) by feeding EIs derived from Life
Cycle Analysis (LCA) data to the productive efficiency method Data Envelopment Analysis (DEA).
Material and methods DEA (Charnes et al., 1978) is a multiple-input, multiple-output efficiency measurement method
calculating single, aggregated, farm-specific efficiency indices by assessing the whole production system, including EIs.
With DEA allocation of EIs to specific products is unnecessary because the farm is assessed as a multiple-input, multiple-
output entity. DEA constructs a best-practice frontier consisting of the best-performing farms in the sample and all other
farms are benchmarked against it. Each farm receives a score between 0-1. A score of 1 means that a farm is on the frontier,
i.e. it does not have to make any adjustments in its inputs and/or outputs and/or EIs to become efficient. A score less than 1
indicates that the farm under evaluation is below the frontier and should make adjustments to its inputs/outputs/EIs to
become efficient. DEA is not affected by the variables’ different measurement units (e.g. land use in ha, milk in kg). The
variables are seen as multiple criteria and are weighted by an endogenous, ‘data-driven’, weighting scheme. This study
used the DEA model Range Adjusted Measure (RAM; Cooper et al., 1999) that is able to simultaneously minimize EIs and
maximize outputs for each farm. This is unlike previously used models where choice of orientation (EI minimization or
output maximization) is necessary. Another advantage of RAM over other DEA models is that it can be used to rank farms
in terms of eco-efficiency scores. Hence, non-parametric rank tests (Kruskal-Wallis test and Dunn’s test) can be employed
to test for significant differences in terms of eco-efficiency score ranks between different farm groups. An additional DEA
methodology (Brockett and Golany, 1996) was employed to correct farm eco-efficiency scores for eco-‘inefficiency’
attributed to managerial factors. Removal of managerial inefficiencies allowed for detecting differences in eco-efficiency
between farms solely attributed to the uncontrollable factor ‘region’. This was another novelty of this study, unlike
previous dairy studies combining LCA with DEA. The modelling framework was demonstrated with LCA data (Charroin
et al., 2005) from 185 French specialized dairy farms grouped by region (West France, Continental France) and feeding
strategy (<10%, 10-30% and >30% maize silage in the total forage area), regardless of region. The LCA data were derived
from a partnership involving the Chambers of Agriculture (France), the French Livestock Institute, and voluntary
participation of farmers (Inosys Réseaux d’Elevage). The five LCA-derived EIs used were non-renewable energy, land use,
eutrophication, acidification and global warming potential. The three outputs were milk, meat and crop production.
Results West farms ranked higher, on average, than Continental farms in terms of eco-efficiency scores. This difference
was significant (P < 0.05) only after removing managerial inefficiencies. Mean eco-efficiency score ranks were
significantly higher (P < 0.05) for farms with <10% and 10-30% maize silage in the total forage area than farms with
>30%, before removing managerial inefficiencies. After doing so, no significant differences were identified between
feeding strategies.
Conclusion The proposed framework can significantly improve dairy farm eco-efficiency assessments compared to
previous studies based on partial LCA ratios by combining LCA with an alternative DEA method. The capacity of the
proposed framework to measure and understand eco-efficiency, especially between different farm groups, makes it a
promising multiple-criteria tool supporting sustainable dairy production.
Acknowledgements Funded by SRUC and INRA and supported by Scottish Government’s Strategic Research
Programmes.
References
Brockett, P.L. and Golany, B. 1996. Management Science 42, 466-472.
Cooper, W.W., Park, K.S. and Pastor, J.T. 1999. Journal of Productivity Analysis 11, 5-42.
Charnes, A., Cooper, W.W., Rhodes, E. 1978. European Journal of Operational Research 6, 429-444.
Charroin, T., Palazon, R., Madeline, Y., Guillaumin, A. and Tchakerian, E. 2005. Rencontres Recherches Ruminants 12,
335-338.

061
The economic impact of animal breeding research: a case study of dairy cow fertility index
adoption S Fowler, P Midmore
Aberystwyth University, Wales, UK
Application Research dissemination. The case-study is one of six cases in the IMPRESA EU Framework VII project which
have been conducted with the aim of identifying aspects to support the improvement of efficiency in agronomic research
and creating new indicators for increased European monitoring of Research Impact Assessment.
Introduction Ensuring maximum impact from public funded agricultural research is increasingly important, in response to
grand global challenges but also diminishing resources for science resulting from fiscal austerity. We use a case study of
the MAFF-funded Link project to create a Dairy Fertility Index (FI) (2001-2006), exploring the pathway from research
through dissemination to its overall socioeconomic consequences, to illustrate the process and to indicate how impacts can
be improved.
Material and methods The case study used documentary analysis, interviews with key informants and stakeholder
workshops, guided by a standard protocol developed for use in parallel studies in four other EU countries, but with scope
for adaptation to national needs. Key players in research, funding and extension bodies were interviewed to develop an
account of the process from original investigation through to its adoption by farmers. Workshops to investigate farmers’
awareness of the research impact pathway were held in south-west England, Scotland and Northern Ireland; in Wales, a
questionnaire-based survey of farmers was used. A final workshop was held with researchers to confirm the research
narrative. Audio recordings of discussions were transcribed, analysed and interpreted, and findings were verified by
participants in the study.
Results Early adoption of the research output was achieved through the involvement of commercial breeding companies in
the research. They had access to FI results within two years of the project starting, and were able to remove bulls with poor
fertility results from the market. After FI results were published, farmers identified discussion groups as being most
valuable as sources of information. They also valued the farm vet, and early adopter farmers. In Northern Ireland and
Scotland, College-linked advisory services were used as sources for verification of husbandry approaches or innovations
covered in the press. In England and Wales, which lack a permanent structure of advisory services, farmers were more
likely to trust commercial representatives as sources of information, even though they are aware of a vested interest
problem. Despite the Fertility Index first being published in 2005, farmers first reported awareness of it around 2010. The
Calving Interval (CI) is used as a proxy measurement of fertility, and NMR results suggest this stabilised in 2008 and
started to decline in 2010. The final workshop confirmed the relative importance and influence of different stages of the
impact pathway, and highlighted potential forces which could, and indeed attempted to, prevent the research project from
going ahead.
Conclusion Without being aware of the work, farmers benefitted at an early stage from the research due to the involvement
of the commercial breeding companies. Despite barriers to the research, including absence of demand from farmers, lack of
conviction of vets, a lack of interest by commercial companies and the levy body, there were sufficient countervailing
factors. The project went ahead due to the considerable efforts of key academics and personnel at MAFF, together with the
existence of pre-competitive research funds, the legacy of public good remits; success in adoption and awareness was
largely due to the eventual engagement by the levy body. The project produced a Fertility Index, now incorporated into the
national breeding goals of the Profitable Lifetime Index (£PLI), and had beneficial impacts, including a proof of concept.
The concept has since been used for progress on mastitis, lameness and longevity and is now being used for indexing the
resistance to bTB. While private sector engagement is required to produce industry-relevant information, ownership of the
data is key, and the current institutional infrastructure to maintain the FI is fragile.
Acknowledgements
Funding from the European Union’s Seventh Framework Programme, Grant agreement 609448, is gratefully
acknowledged.

062
An economic analysis of production costs on a group of Irish suckler beef farms participating in
a knowledge transfer programme R F Taylor
1,2, P Crosson
1
1Teagasc, Grange, Dunsany, Co. Meath, Ireland,
2University College Dublin, Belfield, Dublin 4, Ireland
Application For suckler beef farms, concentrate costs as a percentage of total costs (TC) were higher for farms located in the west
of Ireland and on suckler farms finishing progeny to beef. Veterinary costs as a percentage of TC were higher on suckler farms
selling progeny as weanlings or yearling cattle.
Introduction Suckler beef production systems remain one of the lowest income enterprises in Irish agriculture with many
beef farms loss-making when EU and national subsidy payments are excluded from revenue (Hennessy and Moran,
2015). Previous research (Taylor et al., 2015) has shown no regional or production system differences in net margin on a
per hectare (ha) or per livestock unit (LU) basis for suckler beef farms. However, this analysis highlighted differences in
the cost structure of farms which has an important influence on profit. Therefore, the aim of this present study is to
further examine the influence of region and production system on the relative importance of various cost categories when
expressed relative to TC for Irish suckler beef farms and to quantify the relationship of these costs to profitability.
Material and methods Financial records of 38 farmer participants in the BETTER (Business, Environment and
Technology through Training, Extension and Research) beef farm programme during the period 2008-2014 were
obtained and analysed. Farms were assigned to one of four regions (north-east; NE, north-west; NW, south-east; SE,
south-west; SW) and one of three production systems (Beef, Live, Mixed) as described by Taylor et al. (2015). Data
were analysed as a factorial combination of region and system with year adjustment to allow for changes in conditions
from one year to the next. A repeated measures model was fitted to model correlations across years using the GLIMMIX
procedure in SAS 9.4 (SAS, 2014).
Results Concentrate costs as a percentage of TC were greater on NW and SW farms than SE farms (P<0.05) and higher on
Beef farms than Mixed farms which in turn were greater than on Live farms (P<0.001). Veterinary costs as a percentage of
TC were significantly greater on Live farms than on Beef and Mixed farms (P<0.01). There was a tendency for FC as a
percentage of TC to be greater on SE farms than on SW farms (P=0.055). Concentrates as a percentage of TC had a
moderate, positive correlation with net margin (NM) per ha (r=0.32, P<0.001) and per LU (r=0.32, P<0.001). Other variable
costs and FC as a percentage of TC showed a moderate, negative correlation with NM per ha (r=-0.31 and r=-0.38,
P<0.001, respectively). FC were also moderately, negatively correlated with NM per LU for TFC only (R=-0.37, P<0.001).
Conclusion The higher percentage of costs due to concentrate feeding on NW, SW and Beef farms is likely to have a
moderately positive effect on NM per ha and per LU. However further research would need to be carried out to determine
the extent of its benefit and the threshold beyond which positive returns diminish. Despite veterinary costs as a proportion
of TC being higher on Live farms, its low correlation with NM would suggest it has little impact on farm profitability. The
tendency for higher FC as a percentage of TC on SE farms, coupled with its negative correlation to NM implies that these
farms have the opportunity to increase profitability should FC as a percentage of TC be reduced. However, these costs are
likely to have occurred due to finishing system changes as a result of the knowledge transfer program and are expected to
decline naturally as assets depreciate.
Acknowledgements The authors gratefully acknowledge funding from the Walsh Fellowship fund, the assistance of the
management team and participants of the Teagasc/Irish Farmers Journal BETTER farms beef programme and the DAFM.
References
Hennessy ,T and Moran, B. 2015. Teagasc National Farm Survey 2014.
Taylor RF, Kelly AK, McGee M and Crosson P. 2015. International Journal of Agricultural Management (SUBMITTED).
Figure 1a & 1b Regional and system analysis of cost categories expressed as a percentage of total costs 1Conc= Concentrates, Fert=Fertilizer, Contr=Contractor, Vet=Veterinary, Other=Other variable costs (straw, transport, levies), FC=Fixed costs
*P<0.05, **P<0.01, ***P<0.001, xP=0.055
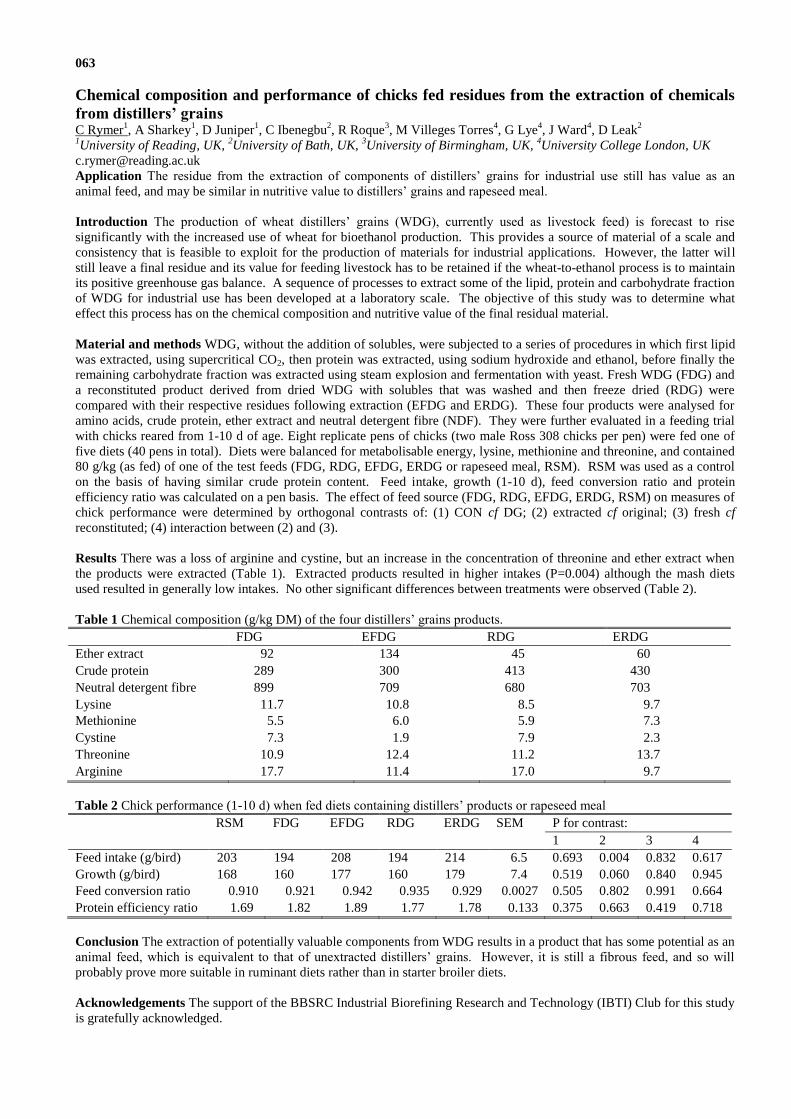
063
Chemical composition and performance of chicks fed residues from the extraction of chemicals
from distillers’ grains C Rymer
1, A Sharkey
1, D Juniper
1, C Ibenegbu
2, R Roque
3, M Villeges Torres
4, G Lye
4, J Ward
4, D Leak
2
1University of Reading, UK,
2University of Bath, UK,
3University of Birmingham, UK,
4University College London, UK
Application The residue from the extraction of components of distillers’ grains for industrial use still has value as an
animal feed, and may be similar in nutritive value to distillers’ grains and rapeseed meal.
Introduction The production of wheat distillers’ grains (WDG), currently used as livestock feed) is forecast to rise
significantly with the increased use of wheat for bioethanol production. This provides a source of material of a scale and
consistency that is feasible to exploit for the production of materials for industrial applications. However, the latter will
still leave a final residue and its value for feeding livestock has to be retained if the wheat-to-ethanol process is to maintain
its positive greenhouse gas balance. A sequence of processes to extract some of the lipid, protein and carbohydrate fraction
of WDG for industrial use has been developed at a laboratory scale. The objective of this study was to determine what
effect this process has on the chemical composition and nutritive value of the final residual material.
Material and methods WDG, without the addition of solubles, were subjected to a series of procedures in which first lipid
was extracted, using supercritical CO2, then protein was extracted, using sodium hydroxide and ethanol, before finally the
remaining carbohydrate fraction was extracted using steam explosion and fermentation with yeast. Fresh WDG (FDG) and
a reconstituted product derived from dried WDG with solubles that was washed and then freeze dried (RDG) were
compared with their respective residues following extraction (EFDG and ERDG). These four products were analysed for
amino acids, crude protein, ether extract and neutral detergent fibre (NDF). They were further evaluated in a feeding trial
with chicks reared from 1-10 d of age. Eight replicate pens of chicks (two male Ross 308 chicks per pen) were fed one of
five diets (40 pens in total). Diets were balanced for metabolisable energy, lysine, methionine and threonine, and contained
80 g/kg (as fed) of one of the test feeds (FDG, RDG, EFDG, ERDG or rapeseed meal, RSM). RSM was used as a control
on the basis of having similar crude protein content. Feed intake, growth (1-10 d), feed conversion ratio and protein
efficiency ratio was calculated on a pen basis. The effect of feed source (FDG, RDG, EFDG, ERDG, RSM) on measures of
chick performance were determined by orthogonal contrasts of: (1) CON cf DG; (2) extracted cf original; (3) fresh cf
reconstituted; (4) interaction between (2) and (3).
Results There was a loss of arginine and cystine, but an increase in the concentration of threonine and ether extract when
the products were extracted (Table 1). Extracted products resulted in higher intakes (P=0.004) although the mash diets
used resulted in generally low intakes. No other significant differences between treatments were observed (Table 2).
Table 1 Chemical composition (g/kg DM) of the four distillers’ grains products.
FDG EFDG RDG ERDG
Ether extract 92 134 45 60
Crude protein 289 300 413 430
Neutral detergent fibre 899 709 680 703
Lysine 11.7 10.8 8.5 9.7
Methionine 5.5 6.0 5.9 7.3
Cystine 7.3 1.9 7.9 2.3
Threonine 10.9 12.4 11.2 13.7
Arginine 17.7 11.4 17.0 9.7
Table 2 Chick performance (1-10 d) when fed diets containing distillers’ products or rapeseed meal
RSM FDG EFDG RDG ERDG SEM P for contrast:
1 2 3 4
Feed intake (g/bird) 203 194 208 194 214 6.5 0.693 0.004 0.832 0.617
Growth (g/bird) 168 160 177 160 179 7.4 0.519 0.060 0.840 0.945
Feed conversion ratio 0.910 0.921 0.942 0.935 0.929 0.0027 0.505 0.802 0.991 0.664
Protein efficiency ratio 1.69 1.82 1.89 1.77 1.78 0.133 0.375 0.663 0.419 0.718
Conclusion The extraction of potentially valuable components from WDG results in a product that has some potential as an
animal feed, which is equivalent to that of unextracted distillers’ grains. However, it is still a fibrous feed, and so will
probably prove more suitable in ruminant diets rather than in starter broiler diets.
Acknowledgements The support of the BBSRC Industrial Biorefining Research and Technology (IBTI) Club for this study
is gratefully acknowledged.

064
Effect on haematological parameters of broilers fed graded levels of toasted African yam bean
seed meal for the first 5 weeks of growth M O Raji, A O Abdulraheem
Oyo State College of Agriculture and Technology, Igboora, Oyo State, Nigeria
Application Toasted African yam bean seeds with protease enzyme supplementation in the diets of broiler starter diets
showed no deleterious effect on haematological parameters and can easily reduce competition between man and poultry.
Introduction The conventional protein feedstuffs are continually competed for by man to meet up their ever increasing
protein requirements, thus resulting in escalating cost of the conventional protein sources. The replacement of expensive
conventional feed ingredients with cheap locally available and non-human competitive substitutes in feed formulation
offers a veritable means of reducing the total feed cost of poultry production (Umoren et al., 2005).
Material and methods The experiment was carried out at the Poultry Unit, Teaching and Research Farm, Oyo State
College of Agriculture and Technology gbo- ra, yo tate, igeria, latitude 1 and longitude 0oE with average
annual rainfall of 1278mm and average temperature of 270C. African yam bean seeds were procured at Bodija market while
other ingredients were obtained from a reputable feed mill in Ibadan, Oyo state, Nigeria. Beans were toasted by using
frying pan of 74.5cm by 38.00cm and placed on firewood as source of heat and evenly distribution of heat was attained in 3
to 5 minutes when beans turned to crispy to touch. Chemical compositions were determined by using A.O.A.C, 2010 while
metabolizable energy was calculated as described by Pauzenga (1985). Protease enzyme was used for the experiment and
was used at150g/1000kg of feed. Five diets were formulated having percentage crude protein ranging between 20.58(%) to
22.00(%) while energy ranged between 3005.40ME (kcal/kg) to 3076.42ME (kcal/kg). Treatment one was corn-soybean
based (control) while toasted African yam bean seed meal was added to treatments 2, 3, 4, and 5 at 10, 20, 30 and 40%
nutrient to nutrient inclusion rate respectively to replace soybean meal. A total of 200 unsexed day-old Marshal (R) strain
broiler chicks were obtained from Obasanjo Farm Ltd., Igboora, Oyo State, Nigeria. The brooder house was cleaned,
washed, disinfected and fumigated a week before the arrival of the birds. A total of 195 birds were used for the study. The
birds were randomly allotted to each of 5 dietary treatments and were replicated 3 times with 13 birds per replicate in a
completely randomized design (CRD). The birds were fed ad libitum with the experimental broiler starter feed from day
old for 5 weeks. Litter was regularly turned and changed as at when due. All other vaccines and drugs were administered as
at when due. At the end of the 5th
week, one bird per replicate per treatment was randomly selected for hematological
parameters. Blood samples were collected using sterilized needle and syringe through the wing vein of the animal into vials
containing Ethylene Diamine Tetra Acetic Acid (EDTA) bottles and were transported to laboratory for hematological
assay.Data collected were subjected to analysis of variance (SPSS, 2012). Means were separated by using Duncan multiple
range test of the same software.
Result There were no significant (P>0.05) differences in packed cell volume, haemoglobin, red blood cell, white blood
cell, lymphocytes, heterocytes, monocytes, eosinocytes and basophils while significant (P<0.05) different was observed on
platelets.The non-significant (P>0.05) values obtained for haematological indices of experimental broiler starter in this
study concur with Uko et al., (1998) and showed that these broiler starters were well nourished.
Conclusion Toasted African yam bean seed meal with protease enzyme supplementation can be used toreplace soybean
meal up to 40% inclusion level in broiler finisher without adverse effect on health status of the birds.
References
A.O.A.C., 2010. Official methods of Analysis 18th
Edition. Association of official Analytical chemists, Washington D.C.
U.S.A.
Pauzenga, U. 1985. Feeding parent stock. Journal of Zootecnica Technology International. 22-24.
Statistical Package for Social Students (SSPS) 21.0 Version © 2012.-11.
Uko, O.J. and Ataja, A.M. 1998. Cereal by products as alternative energy source in diet for rabbit in Nigeria. Blood
composition and plasma biochemistry. A paper presented at the 35th
Annual Conference of National Veterinary Medical
Association (NVMA) July 14, 1998, Abuja.
Umorem, U.E, Essien, A.I, Ukorebi, B.A, and Essien, E.B 2005. Chemical evaluation of seeds of Milletia Obanensis.
Nigeria Journal of Food Chemistry, 91, 195-201.

065
Assessment of Xylopia aethiopica (Negro Pepper) as growth promoter using broilers E Ndelekwute
1, G Enyenihi
1, E Ikpat
1, D Akpan
1, H Akpan
1
1University of Uyo, Akwa Ibom, Nigeria
Application 2.5g Xylopia aethiopica per kg diet improved growth at starter and finisher phases, while 5g/kg improved
growth only at the finisher phase. Total feed intake was improved by 10g/kg at the starter phase but similar to control at
finisher phase. Final live weight was negatively affected by 10g/kg at starter and finisher phases due to poor feed: gain
ratio. X. aethiopica reduced bacteria load of the feed.
Introduction Plant resources with bioactive substances such as spices have been suggested as possible growth promoters in
antibiotics-free diets for broilers (Al-Harthi, 2000). Black pepper, garlic, thyme and ginger have been reported to positively
influence broiler growth (Damme, 1999). Search for more natural bioactive compounds should continue to augment the
known ones. Though widely used in human nutrition and medicine, not much has been reported about the nutritional
importance of X. aethiopica in farm animals. It is a tree whose different parts are used as spice by man for food and
medicine (Omodamiro et al., 2013). The aim of this study was to determine the effect of X. aethiopica on growth
performance of broilers and its antibacteria activity in feed.
Material and methods Ripe fruits of X. aethiopica were harvested and dried under the sun. Thereafter, they were grinded.
Total bacteria load of the feed was determined by mixing 0.0, 2.5, 5.0, 7.5g and 10.0g Xylopia respectively with 1.0kg of
the basal diet. 5.0g of each diet was then incubated at 37OC for 24 hours. Serial dilution method was used to determine the
total bacteria load. 150 day old broiler chicks were allotted to 5 dietary treatments (T) of 30 birds each, replicated thrice on
completely randomized design. Each replicate had 10 birds. A corn-soybean basal starter and finisher diets were
formulated. 0.00, 2.5, 5, 7.5 and 10g/kg diet of the spice was each added to a portion of the basal diet to form T1, T2, T3,
T4 and T5 respectively. The experiment which was conducted in deep litter, open-sided rearing house, lasted for 56 days
(28days each for starter and finisher). Feed and water were provided ad libitum. The starter feed had 22.10% CP,
2880KcalME/kg and finisher diet 20.05% CP, 2901 KcalME/kg. Kerosene stove was used to increase the temperature of
the house (35-30OC) for the first 21 days. Vaccination against Newcastle and Gumboro diseases was carried out. Data
collected were analyzed by One Way analysis of variance using SPSS software at 5% level of significance.
Results The X. aethiopica was antibacteria showing dose dependent action. Total bacteria load in the feed was reduced
from 3.6 x 10⁴ – 1.7 x 10
4 cfu. Tables 1 and 2 indicate that final live weight and weight gain were improved by 2.5g/kg at
the starter phase (P<0.05), while 10g/kg gave higher feed intake, but poor feed: gain ratio. At the finisher, 2.5g and 5g/kg
improved growth while 7.5g and 10g/kg reduced the weight and 10g/kg had poor feed: gain ratio.
Table 1 Effects of dietary X. aethiopica addition (g/kg diet) on feed intake and live weight gains in starter broilers
Parameters T1(0.00) T2 (2.5) T3 (5.0) T4 (7.5) T5 (10) SEM values
Initial live weight 44.12 43.72 43.56 43.68 45.20 4.01
Final live weight 743b 800
a 750
b 714
b 664
c 48.72
Daily weight gain 24.96b 27.01
a 25.23
b 23.94
b 22.14
c 1.35
Total feed intake 1289b 1389
ab 1370
ab 1405
a 1418
a 114
Feed: gain ratio 1.84b 1.84
b 1.90
b 2.10
a 2.29
a 0.16
Table 2 Effects of dietary X. aethiopica addition (g/kg diet) on feed intake and live weight gains in finisher broilers
Parameters T1(00) T2(2.5) T3(5) T4(7.5) T5(10) SEM values
Initial live weight (g) 743b 800
a 750
b 714
b 664
c 48.72
Final live weight (g) 2205b 2336
a 2332
a 2125
c 1935
d 78.50
Daily weight gain (g) 51.1b 54.9
b 56.6
a 50.4
b 45.4
c 4.86
Total feed intake (g) 4595bc
4711ab
4735a 4559
c 4549
c 152
Feed : gain ratio 3.21b 3.07
b 2.99
b 3.23
b 3.58
a 0.35
Conclusion It is concluded that 2.5g/kg X. aethiopica improved growth and sanitized the feed and could be used as a
potential and novel feed additive in diets of broiler chickens.
References
Al-Harthi, M.A. 2000. Egyptian Poultry Science. 21, 567–583.
Damme, K. 1999. World Poultry. 15, 27 – 28.
Omodamiro, O. D., Ohaeri, O. C. and Nweke, I. N. 2012. Asian Journal of Plant Science and Research. 2(1), 73-74.

066
Effect of dietary powdered Echinacea purpurea and Tribulus terrestris on performance,
haematology and some serum parameters of broilers B Shokrollahi
1, K Sayedoshohadaei
1, F Kheirollahi
2
1Sanandaj Branch, Islamic Azad University, Sanandaj/Kurdistan, Iran,
2Razi University, Kermanshah, Iran
Application Dietary powdered Echinacea Purpurea (EP) and Tribulus terrestris (TT) improved performance and some
haematology indices in broilers; therefore EP and TT can be used in broiler diets as additives.
Introduction Previous studies revealed that no single alternative exists with the effects comparable to antibiotics;
therefore, finding more efficient alternatives or combinations of different alternatives for maintaining health and improving
performance of poultry and other livestock species is needed. Antioxidant, growth promoting (Landy et al. 2011) and
immune stimulating (Nasir and Gashorn, 2010) effects of EP have been reported. TT has positive effect on some blood
parameters and haematology (Christev et al. 2011). Present study was planned to survey the effects of powdered EP and TT
on performance, haematology and some serum parameters of broilers.
Material and methods A total of 480 one-day-old broiler chicks (Ross-308) were randomly assigned to the 8-treatments,
each with 4 replicates with 15 broiler chickens in each replicate. The treatments were as follows: i. Basal diet (control).
Other treatments were basal diet + ii. antibiotic (5 mg Virginiamycin /kg diet), iii. EP (20 g/kg diet) and TT (10 g/kg diet)
powder, iv. EP (10 g/kg diet) and TT (20 g/kg diet) powder, v. EP (20 g/kg diet) and TT (20 g/kg diet) powder, vi. EP (10
g/kg diet) and TT (10 g/kg diet) powder, vii. EP (10 g/kg diet) powder, viii. TT (20 g/kg diet) powder. The basal diets were
formulated to meet the nutrients requirements of broilers. Birds were allowed free access to feed and water during the 42
days of experiment. Growth performance of broilers was evaluated by recording the daily body weight gain (DWG), daily
feed intake (DFI) and feed conversion ratio (FCR) during the 42 days of experimental period. Mortality was recorded as it
occurred and was used to adjust the total number of birds. At 21 and 42 days of age, two broilers from each replicate of
treatments were randomly selected, and blood samples were taken by puncture of the brachial vein for blood parameters
and haematology analysis. All the data were subjected to ANOVA (at P<0.05 and P<0.01 levels) using the General Linear
Models procedure of A software. The mean differences among different treatments were separated by Duncan’s multiple
range tests.
Results No significant treatment effect was observed on FCR, white blood cells, lymphocytes, haematocrit, cholesterol and
glucose. DFI in viii treatment and DWG in iii, iv, v, vi, vii, and viii treatments was significantly (P<0.01) higher than other
treatments. Significantly (P<0.05) higher neutrophils in treatment iii and monocyte in treatment viii were observed. Total
protein, immunoglobulin G (IgG) and immunoglobulin M (IgM) contents were significantly (P<0.05) higher viii, viii and
vii than other treatment groups, respectively.
Table 1 Effect of EP and TT on performance, blood parameters and haematology of broiler chicks
Treatments
Items I ii Iii Iv v vi Vii Viii SEM P
DFI (g/day) 128.7AB
123.8B 128.3
AB 139.9
AB 126.5
B 138.8
AB 134.8
AB 143.6
A 2.63 0.001
DWG (g/day) 55.4AB
51B 57.1
A 57.4
A 58.9
A 59.3
A 61.1
A 59.3
A 1.25 0.001
Neutrophil 15B 21
AB 24
A 20
AB 14.25
B 19.5
AB 16.75
B 15.5
B 2.23 0.020
Monocyte 2.5C 3.5
ABC 3
BC 3.7
AB 4
AB 3.5
ABC 4
AB 4.2
A 0.39 0.013
Total Protein 2.9C 3.8
ABC 4.3
AB 3.3
BC 2.7
C 4.9
A 3.6
ABC 4.6
A 0.63 0.031
IgG 1.47BC
1.28C 1.42
C 1.40
C 1.47
BC 1.44
C 1.71
AB 1.75
A 0.052 0.021
IgM 0.19BC
0.20 BC
0.22AB
0.20BC
0.18C 0.23
AB 0.24
A 0.23
AB 0.008 0.019
Conclusion The results of current study show that effects of immunostimulating phytogenic compounds like EP and TT are
observed, in terms of performance and neutrophil, monocyte, total protein, IgG and IgM counts if birds are reared under
optimal environmental conditions.
Acknowledgements The authors gratefully acknowledge funding from Sanandaj branch, Islamic Azad University.
References
Christev, C., Nickolava, M., Penkov, D., Ivanova, R., Abadjieva, D.and Grigorova, S. 2011. Journal of Central European
Agriculture. 12, 16-26.
Landy, N., Ghalamkari, G., Toghyani, M. and Moattar. F. 2011. Journal of Medicinal Plants Research. 5, 2332-2338
Nasir, Z. Grashorn, M. A. 2010. Journal of Animal and Feed Sciences. 19, 94–104.
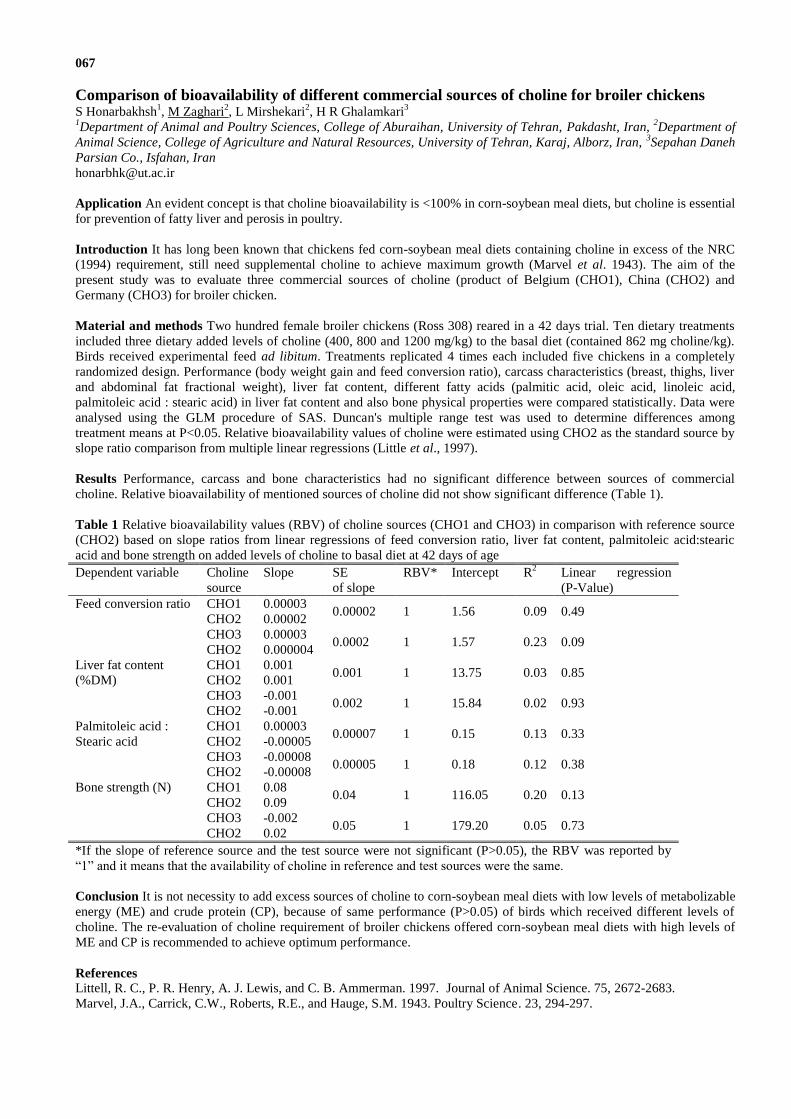
067
Comparison of bioavailability of different commercial sources of choline for broiler chickens S Honarbakhsh
1, M Zaghari
2, L Mirshekari
2, H R Ghalamkari
3
1Department of Animal and Poultry Sciences, College of Aburaihan, University of Tehran, Pakdasht, Iran,
2Department of
Animal Science, College of Agriculture and Natural Resources, University of Tehran, Karaj, Alborz, Iran, 3Sepahan Daneh
Parsian Co., Isfahan, Iran
Application An evident concept is that choline bioavailability is <100% in corn-soybean meal diets, but choline is essential
for prevention of fatty liver and perosis in poultry.
Introduction It has long been known that chickens fed corn-soybean meal diets containing choline in excess of the NRC
(1994) requirement, still need supplemental choline to achieve maximum growth (Marvel et al. 1943). The aim of the
present study was to evaluate three commercial sources of choline (product of Belgium (CHO1), China (CHO2) and
Germany (CHO3) for broiler chicken.
Material and methods Two hundred female broiler chickens (Ross 308) reared in a 42 days trial. Ten dietary treatments
included three dietary added levels of choline (400, 800 and 1200 mg/kg) to the basal diet (contained 862 mg choline/kg).
Birds received experimental feed ad libitum. Treatments replicated 4 times each included five chickens in a completely
randomized design. Performance (body weight gain and feed conversion ratio), carcass characteristics (breast, thighs, liver
and abdominal fat fractional weight), liver fat content, different fatty acids (palmitic acid, oleic acid, linoleic acid,
palmitoleic acid : stearic acid) in liver fat content and also bone physical properties were compared statistically. Data were
analysed using the GLM procedure of SAS. Duncan's multiple range test was used to determine differences among
treatment means at P<0.05. Relative bioavailability values of choline were estimated using CHO2 as the standard source by
slope ratio comparison from multiple linear regressions (Little et al., 1997).
Results Performance, carcass and bone characteristics had no significant difference between sources of commercial
choline. Relative bioavailability of mentioned sources of choline did not show significant difference (Table 1).
Table 1 Relative bioavailability values (RBV) of choline sources (CHO1 and CHO3) in comparison with reference source
(CHO2) based on slope ratios from linear regressions of feed conversion ratio, liver fat content, palmitoleic acid:stearic
acid and bone strength on added levels of choline to basal diet at 42 days of age
Dependent variable Choline
source
Slope SE
of slope
RBV* Intercept R2 Linear regression
(P-Value)
Feed conversion ratio CHO1 0.00003 0.00002 1 1.56 0.09 0.49
CHO2 0.00002
CHO3 0.00003 0.0002 1 1.57 0.23 0.09
CHO2 0.000004
Liver fat content
(%DM)
CHO1 0.001 0.001 1 13.75 0.03 0.85
CHO2 0.001
CHO3 -0.001 0.002 1 15.84 0.02 0.93
CHO2 -0.001
Palmitoleic acid :
Stearic acid
CHO1 0.00003 0.00007 1 0.15 0.13 0.33
CHO2 -0.00005
CHO3 -0.00008 0.00005 1 0.18 0.12 0.38
CHO2 -0.00008
Bone strength (N) CHO1 0.08 0.04 1 116.05 0.20 0.13
CHO2 0.09
CHO3 -0.002 0.05 1 179.20 0.05 0.73
CHO2 0.02
*If the slope of reference source and the test source were not significant (P>0.05), the RBV was reported by
“1” and it means that the availability of choline in reference and test sources were the same.
Conclusion It is not necessity to add excess sources of choline to corn-soybean meal diets with low levels of metabolizable
energy (ME) and crude protein (CP), because of same performance (P>0.05) of birds which received different levels of
choline. The re-evaluation of choline requirement of broiler chickens offered corn-soybean meal diets with high levels of
ME and CP is recommended to achieve optimum performance.
References
Littell, R. C., P. R. Henry, A. J. Lewis, and C. B. Ammerman. 1997. Journal of Animal Science. 75, 2672-2683.
Marvel, J.A., Carrick, C.W., Roberts, R.E., and Hauge, S.M. 1943. Poultry Science. 23, 294-297.

068
Effect of heat stress on growth performance and rectal temperature of broiler chickens K Adomako
1, C M Milfort
2, W Habashy
3,2, L Fuller
2, S E Aggrey
2
1Kwame Nkrumah University of Science and Technology, Kumasi, Ghana,
2University of Georgia, Athens, USA
3Damanhour University, Cairo, Egypt
Application Available data indicate that the average temperature of the earth is increasing and this is a threat to food
security especially in the tropics. Adaptability of birds especially broiler chickens to high ambient temperature has become
very important in ensuring food security.
Introduction Heat stress has been found to have various negative effects on liveability, production performance, immune
functions, and disease susceptibility in poultry (Cahaner et al., 2008; Chen et al., 2004). This is likely to worsen due to
climate change. The first step in solving the problem of heat stress is to look at the effect of heat stress on the growth
performance of chickens. This experiment was conducted to find out the effect of heat stress on rectal temperature and
growth performance of broiler chickens.
Material and methods Forty eight Cobb 500 unsexed broiler chickens were used for the study (Cobb Vantress, USA). The
birds were two weeks old and the experiment lasted for two weeks. They were randomly allocated to two treatments (Heat
stress, 36OC versus No Heat stress, 25
OC) with twenty four birds under each treatment. Each treatment had four replications
with six birds in each replicate. Birds for each replicate (6 birds) were kept in single cages (L=60.96cm, W=20.32cm and
H= 30.48cm) with feed (21% CP and 3100kcal ME/kg) and water administered ad libitum. The following parameters were
measured: feed intake, body weight, body weight gain, feed conversion ratio and rectal temperature. Analysis of variance
(ANOVA) was performed using the general linear model procedure of SAS Version 9.4 (2015) at P<0.05.
Results Feed intake and body weight gain were higher (P<0.001) in broilers that were not on heat stress compared to those
that were on heat stress (36OC). Feed conversion ratio (FCR) and rectal temperature were however not significantly
different (P>0.05) between the two treatments (Table 1).
Table 1 Effect of heat stress on rectal temperature and growth performance of broiler chickens
Treatments/Parameters Feed intake*, g Weight gain*, g FCR, feed/gain Rectal Temp., OC
Control 4750.50 3314.25 1.43 39.17
Heat stress 2990.25 2026.00 1.48 39.08
SEM 13.37 48.048 0.0036 0.14 *Feed intake and weight gain were totals for six birds within two weeks. Means compared at P<0.05
Conclusion Heat stress reduced feed intake and body weight gain in this study but did not influence rectal temperature and
feed conversion ratio (FCR).
Acknowledgements USDA-FAS, Nutrigenomics lab, UGA, Global Programs Office, UGA and KNUST, Kumasi, Ghana
References Cahaner A., Ajuh J. A., Siegmund-Schultze M., Azoulay Y., Druyan S., Zarate A. V. 2008. Poultry Science. 87, 2517–2527.
Chen C. F., Bordas A., Gourichon D. and Tixier-Boichard M. 2004. British Poultry Science 45, 346–354.

069
Effect of gelatinization of fermented cassava meal on its hydrogen cyanide content,
haematological and serum biochemical indices of finisher broilers E Enyenihi
1, E Ndelekwute
1, A Udedibie
2
1University of Uyo, Akwa Ibom, Nigeria,
2Federal University of Technology, Owerri, Imo, Nigeria
Application Effect of geletization of fermented cassava on the hydrogen cyanide content and its dietary effect on blood
parameters of finisher broilers were carried out. Fermentation followed by gelatinization of cassava tubers resulted in
hydrogen cyanide (HCN) free meal if peeled and 50mg/kg if unpeeled. Unpeeled and fermented cassava meal deteriorated
PCV and serum globulin, total protein and glucose. This may necessitate a longer period of fermentation of unpeeled as
cassava peels are known to contain more HCN than the pulp (Udedibie et al., 2004).
Introduction Maize is the major source of energy in poultry rations. It is however getting increasingly scarce and costly
due to over dependence on it for other uses such as staple food in Nigerian. The need for a search for other energy sources
as alternatives to maize has led to the investigation on the potentials of cassava as energy source in livestock feed. Presence
of HCN in cassava put a limit to its use. Processing of cassava has been advocated to reduce HCN effect. This study
focused on fermentation followed by gelatinization as a method of processing cassava tubers for use as alternative to maize
and its effect on the haematological and serum biochemical indices of broilers.
Material and methods Fresh cassava tubers of bitter variety were procured from a local market and divided into two
batches. One batch was peeled while the other was unpeeled. Samples of both batches were analyzed for HCN content by
Picrate paper method (Bradbury et al., 1999).The samples were cut into similar sizes and separately fermented for 4 days in
plastic vats containing water under atmospheric temperature. The water was removed at the end of the four days. The
fermented samples were spread in the sun to dry. They were milled using a hammer mill with 2mm sieve. The two samples
were subjected to gelatinization process and dried. The samples were subjected to HCN analysis according to Bradbury et
al. (1999). Three soyabean – fish meal- based experimental diets were made and fed for four weeks. Control (T1) contained
maize, while T2 and T3 contained only peeled and unpeeled fermented gelatinized cassava meals respectively in equal
proportion with maize. Each treatment contained 40 day old Anak chicks, replicated four times with 10 birds each on
completely randomized design (CRD). One bird was selected from each replicate for blood analysis. Blood was collected
through the vein on the wing into a bottle containing anticoagulant for haematological analysis and the bottle for serum
biochemistry did not contain anticoagulant. Data generated were subjected to analysis of variance (ANOVA). Means were
compared using Duncan New Multiple Range Test (DNMRT) at 5% level of significance.
Results Peeling, fermentation and gelatinization reduced HCN to zero level compared to raw and peeled (500ppm) and
unpeeled fermented (50ppm). Unpeeled and fermented significantly (P<0.05) reduced PCV, total protein, globulin and
glucose (Tables 1 and 2). Wbc, Rbc, albumin, Hb and cholesterol were not negatively affected.
Table 1 Effect of processed cassava on haematology of finisher broilers
Parameters T1 (Control) T2 (PFGC) T3 (UFGC) SEM
WBC (x104mm
2) 6.40 4.9 5.00 0.10
HB (g/dl) 10.00 8.93 9.87 0.28
RBC (x106/ul) 9.18 8.3 8.68 0.22
PCV (%) 30.57a 29.77
a 25.77
b 0.97
Table 2 Effect of processed cassava on serum protein, glucose and cholesterol of finisher broilers
Parameters T1(Control) T2 (PFGC) T3 (UFGC) SEM
Total protein (g/dl) 4.10a 3.90
a 3.40
b 0.13
Albumin (g/dl) 1.63 1.67 1.70 0.09
Globulin (g/dl) 2.47a 2.30
a 1.70 0.13
Glucose (g/dl) 39.67a 36.33
a 14.33
b 5.70
Cholesterol (mg/dl) 64.00 57.67 58.00 7.31
Conclusion Peeling and fermentation improved the quality of cassava meal, could replace whole maize in broiler diet.
References Bredbury, M. E., Egen, S. V. and Bradbury, J. H. 1999. Picrate Paper Kit for determination of total cyanogens in cassava
roots and al cyanogens in cassava products Journal Science Food Agriculture 79, 595-601.
Udedibie, A. B. I., Enyenihi, G. E., Akpan M. J., Obasi, O. C. and Solomon, I. P. 2008. Physiochemical nature and nutritive
value of dried cassava fufu meal for laying hens. Nigian Agricultural Journal 39, 44-49.

070
Comparison of bioavailability of different commercial sources of dicalcium phosphate for broiler
chickens S Honarbakhsh
1, M Zaghari
2, H Moravej
2, A H Golbaz
2, H R Ghalamkari
3
1Department of Animal and Poultry Sciences, College of Aburaihan, University of Tehran, Pakdasht, Tehran, Iran,
2Department of Animal Sciences, College of Agriculture and Natural Resources, University of Tehran,, Karaj, Alborz, Iran,
3Sepahan Daneh Parsian Co., Isfahan, Iran
Application Environmental and economic concerns regarding phosphorus (P) in broiler production pledge a reduction in
dietary P provision. However, to maintain growth performance and bone mineralisation, optimisation of P utilisation
appears crucial.
Introduction In broilers, P is involved in many essential functions, representing a key element in the maintenance of
growth performance and bone mineralisation (Le´ tourneau-Montminy et al., 2010). Thus, it must be of major concern that
current economic and environmental pressures leading to an unavoidable decrease in dietary P supply represent a threat to
animal productivity. Then it is necessary to find P sources with high levels of bioavailability. The aim of the present study
was to determine the bioavailability of P from six commercial sources of dicalcium phosphate (DCP2: 17.75% P; DCP3:
17% P; DCP4: 17% P; DCP5: 18.5% P; DCP6: 17% P; DCP7: 18.06% P) relative to standard source (P1=Phosphoric acid
85%, contains 26.87% P), for broiler chicks.
Material and methods A total of 440 1-d-old Ross-308 female broiler chickens were randomly allotted to 1 of 4 replicate
cages (5 chicks/cage) for each of 22 treatments in a completely randomized design involving seven P sources and 3 levels
of added P (0.15, 0.30, or 0.45%) plus a control diet containing 0.15% available P. Feed and water were available ad
libitum for an experimental phase of 42-d. Data were analysed using the GLM procedure of SAS. Duncan's multiple range
test was used to determine differences among treatment means at P<0.05. Relative bioavailability values of P were
estimated using P1 as the standard source by slope ratio comparison from multiple linear regressions (Little et al., 1997).
Results Body weight gain (BW), average daily feed intake, FCR, carcass and breast fractional weight, alkaline phosphatase
(ALP), tibia characteristics (length (L), ash content, bone strength (BS)) were different significantly, between P levels and
sources at 42d. Based on slope ratios from the linear regression of BW, FCR, ALP, BS, L and ash%, on added levels of
available P, the bioavailability of P in source no. 2, 3 and 7 were the same, relative to phosphoric acid.
Figure 1 Comparison of bioavailability of 7 different commercial sources of dicalcium phosphate (DCP2: 17.75% P;
DCP3: 17% P; DCP4: 17% P; DCP5: 18.5% P; DCP6: 17% P; DCP7: 18.06% P) relative to standard source
(P1=Phosphoric acid 85%, contains 26.87% P) for broiler chickens
Conclusion Phosphorous originated from sources no. 2, 3, 5 and 7 were 20% and 40% more available to broilers than
sources no. 4 and 6, respectively, in enhancing tibia length (Figure 1).
References
Le´ tourneau-Montminy, M. P., Narcy, A., Lescoat, P., Bernier, J. F., Magnin, M., Pomar, C., Nys1, Y., Sauvant, D. and
Jondreville, C. 2010. Animal. 4(11), 1844-1853.
Littell, R. C., P. R. Henry, A. J. Lewis, and C. B. Ammerman. 1997. Journal of Animal Science. 75, 2672-2683.

071
Assessing the genetic diversity of indigenous chicken genotypes in South-western Nigeria using
microsatellite markers A B Ajibike
1,2, B M Ilori
2, O A Adeniyi
1,2, A O Adebambo
2
1Oyo State College of Agriculture and Technology, Igboora, Oyo State, Nigeria,
2Federal University of Agriculture,
Abeokuta, Ogun State, Nigeria
Application Understanding of Nigerian indigenous chicken genetic diversity is required in contributing to meeting the
production needs, allow sustainable genetic improvement, and to facilitate rapid adaptation to changing breeding objectives
Introduction Despite the importance of indigenous chickens, little is known about their genetic diversity leading to
increasing research work on their genetic variation to characterise the genetic structure of locally available populations
which is an important step towards revealing the uniqueness of these populations and identify their valuable genetic
resources for conservation since they are largely free of systematic selection (Ajibike, 2015). Hence, this study was carried
out to assess the genetic variation between the available indigenous chicken genotypes in South-western Nigerian.
Material and methods 2ml of blood was collected from the wing vein of 69 individual chickens: Normal feather (N,
n=38), Naked neck (Na, n=4), Fulani (Fu, n=3), Frizzle (Fr, n=13) and “Opipi” (Op, n=11) using a new needle and syringe
for each animal to avoid cross contamination. Deoxyribonucleic acid (DNA) was extracted from Fast Technology for
Analysis (FTA) paper. The extracted DNA was amplified with 15 predefined microsatellite primer sets. Multiplexing was
carried out following the recommendation of the ISAG/FAO panel. Allele size calling was carried out after separation
using a ABI 3730XL automated capillary sequencer (Applied Biosystems, USA) with Liz 500-350 internal size marker.
Genotypic data were analyzed using POPGENE (Yeh et al., 1999) and GenAlex (Peakall and Smouse, 2012) to calculate
the observed number of alleles, effective number of alleles, observed (Ho) and expected (HE) heterozygosity, and test for
Hardy–Weinberg equilibrium (HWE). The extent of inbreeding was further studied using GENEPOP software (Raymond
and Rousset, 1995) by estimating the FIS values and their significance level within each of the populations.
Results The mean number of alleles (MNA) per population range from 2.93±0.25 alleles for Na and Fu chicken to
5.93±0.62 for N chicken, while the effective number of allele (NEA) contributing to the population range from 2.36±0.21
for Op to 2.92±0.26 for N chicken. The lowest observed heterozygosity (Ho) was observed in Fr chicken (0.50±0.06) while
Na chicken has the higher values (0.62±0.08). The highest expected heterozygosity (HE) was observed in N chicken
(0.61±0.04) while Na and Fu chickens has the lowest value (0.52±0.06). The inbreeding coefficients (FIS) for all the
sampled indigenous chicken genotypes were observed to be positive, except for Na chickens which shows a negative value
of -0.05 at P>0.01.
Table 1 Genetic diversity indicators for the sampled indigenous chicken genotypes
Pop MNA NEA I Ho He FIS
N 5.93±0.62 2.92±0.26 1.25±0.10 0.53±0.05 0.61±0.04 0.15
Na 2.93±0.25 2.40±0.22 0.89±0.10 0.62±0.08 0.52±0.06 -0.05
Fr 4.33±0.27 2.70±0.22 1.12±0.08 0.50±0.06 0.57±0.04 0.18
Fu 2.93±0.25 2.39±0.23 0.90±0.09 0.57±0.07 0.52±0.05 0.14
Op 4.13±0.45 2.36±0.21 1.00±0.10 0.54±0.07 0.53±0.05 0.03
Mean 4.05±0.22 2.56±0.10 1.03±0.04 0.55±0.03 0.61±0.02 0.13
Conclusion The used microsatellite markers indicated that there was a high genetic diversity and moderate differentiation,
despite the observed high degree of inbreeding and genetic admixture between the sampled chicken genotypes.
References
Ajibike, A.B. 2015. Genetic diversity of Nigerian indigenous chicken using microsatellite markers and mitochondrial DNA
D-loop sequences. M. Agric Dissertation. Department of Animal Breeding and Genetics, Federal University of Agriculture,
Abeokuta, Ogun State, Nigeria
Peakall, R. and Smouse, P. E. 2012. GenAlEx 6.5: Genetic Analysis in Excel. Population genetic software for teaching and
research – an update. Bioinformatics 28, 2537 – 2539
Raymond, M. and Rousset, F. 1995. An exact test for population differentiation. Evolution 49, 1280 – 1283
Yeh, F.C., Yang, R.C. and Boyle, T. 1999. POPGENE (version 1.31): A Microsoft Windows-based Freeware for
Population Genetic Analysis. University of Alberta and the Centre for International Forestry Research, Edmonton, Canada.
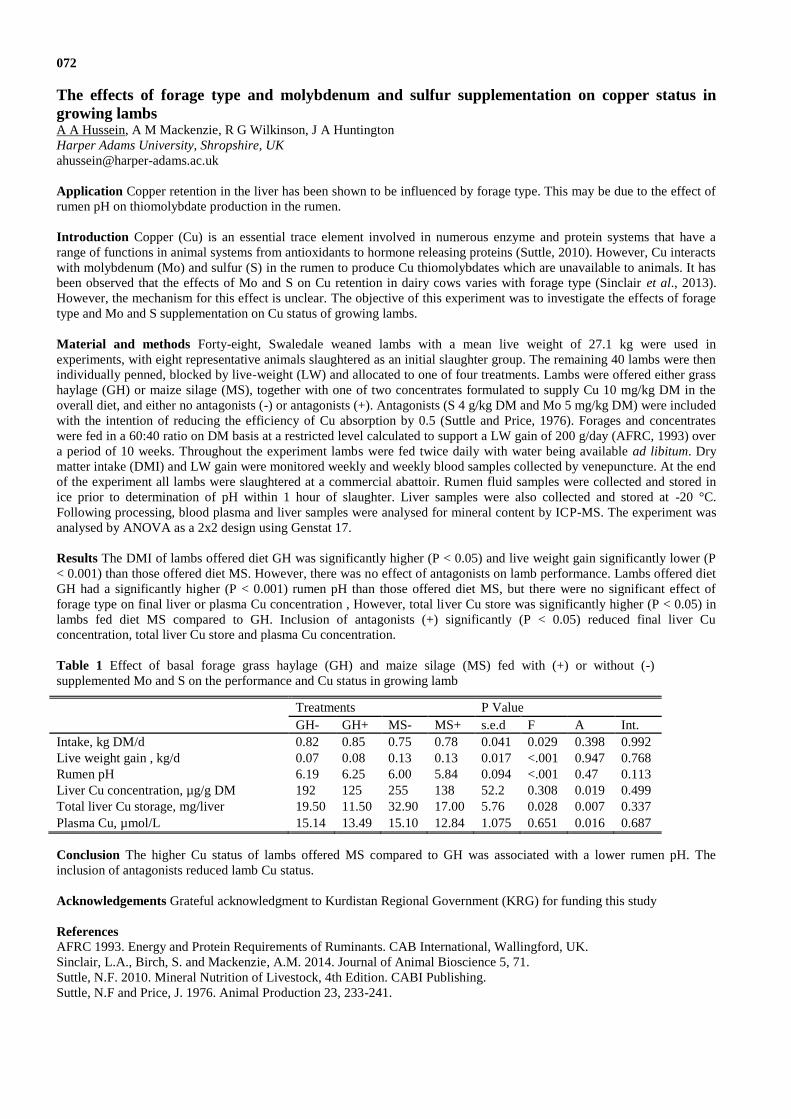
072
The effects of forage type and molybdenum and sulfur supplementation on copper status in
growing lambs A A Hussein, A M Mackenzie, R G Wilkinson, J A Huntington
Harper Adams University, Shropshire, UK
Application Copper retention in the liver has been shown to be influenced by forage type. This may be due to the effect of
rumen pH on thiomolybdate production in the rumen.
Introduction Copper (Cu) is an essential trace element involved in numerous enzyme and protein systems that have a
range of functions in animal systems from antioxidants to hormone releasing proteins (Suttle, 2010). However, Cu interacts
with molybdenum (Mo) and sulfur (S) in the rumen to produce Cu thiomolybdates which are unavailable to animals. It has
been observed that the effects of Mo and S on Cu retention in dairy cows varies with forage type (Sinclair et al., 2013).
However, the mechanism for this effect is unclear. The objective of this experiment was to investigate the effects of forage
type and Mo and S supplementation on Cu status of growing lambs.
Material and methods Forty-eight, Swaledale weaned lambs with a mean live weight of 27.1 kg were used in
experiments, with eight representative animals slaughtered as an initial slaughter group. The remaining 40 lambs were then
individually penned, blocked by live-weight (LW) and allocated to one of four treatments. Lambs were offered either grass
haylage (GH) or maize silage (MS), together with one of two concentrates formulated to supply Cu 10 mg/kg DM in the
overall diet, and either no antagonists (-) or antagonists (+). Antagonists (S 4 g/kg DM and Mo 5 mg/kg DM) were included
with the intention of reducing the efficiency of Cu absorption by 0.5 (Suttle and Price, 1976). Forages and concentrates
were fed in a 60:40 ratio on DM basis at a restricted level calculated to support a LW gain of 200 g/day (AFRC, 1993) over
a period of 10 weeks. Throughout the experiment lambs were fed twice daily with water being available ad libitum. Dry
matter intake (DMI) and LW gain were monitored weekly and weekly blood samples collected by venepuncture. At the end
of the experiment all lambs were slaughtered at a commercial abattoir. Rumen fluid samples were collected and stored in
ice prior to determination of pH within 1 hour of slaughter. Liver samples were also collected and stored at -20 °C.
Following processing, blood plasma and liver samples were analysed for mineral content by ICP-MS. The experiment was
analysed by ANOVA as a 2x2 design using Genstat 17.
Results The DMI of lambs offered diet GH was significantly higher (P < 0.05) and live weight gain significantly lower (P
< 0.001) than those offered diet MS. However, there was no effect of antagonists on lamb performance. Lambs offered diet
GH had a significantly higher (P < 0.001) rumen pH than those offered diet MS, but there were no significant effect of
forage type on final liver or plasma Cu concentration , However, total liver Cu store was significantly higher (P < 0.05) in
lambs fed diet MS compared to GH. Inclusion of antagonists (+) significantly (P < 0.05) reduced final liver Cu
concentration, total liver Cu store and plasma Cu concentration.
Conclusion The higher Cu status of lambs offered MS compared to GH was associated with a lower rumen pH. The
inclusion of antagonists reduced lamb Cu status.
Acknowledgements Grateful acknowledgment to Kurdistan Regional Government (KRG) for funding this study
References
AFRC 1993. Energy and Protein Requirements of Ruminants. CAB International, Wallingford, UK.
Sinclair, L.A., Birch, S. and Mackenzie, A.M. 2014. Journal of Animal Bioscience 5, 71.
Suttle, N.F. 2010. Mineral Nutrition of Livestock, 4th Edition. CABI Publishing.
Suttle, N.F and Price, J. 1976. Animal Production 23, 233-241.
Table 1 Effect of basal forage grass haylage (GH) and maize silage (MS) fed with (+) or without (-)
supplemented Mo and S on the performance and Cu status in growing lamb
Treatments P Value
GH- GH+ MS- MS+ s.e.d F A Int.
Intake, kg DM/d 0.82 0.85 0.75 0.78 0.041 0.029 0.398 0.992
Live weight gain , kg/d 0.07 0.08 0.13 0.13 0.017 <.001 0.947 0.768
Rumen pH 6.19 6.25 6.00 5.84 0.094 <.001 0.47 0.113
Liver Cu concentration, µg/g DM 192 125 255 138 52.2 0.308 0.019 0.499
Total liver Cu storage, mg/liver 19.50 11.50 32.90 17.00 5.76 0.028 0.007 0.337
Plasma Cu, µmol/L 15.14 13.49 15.10 12.84 1.075 0.651 0.016 0.687
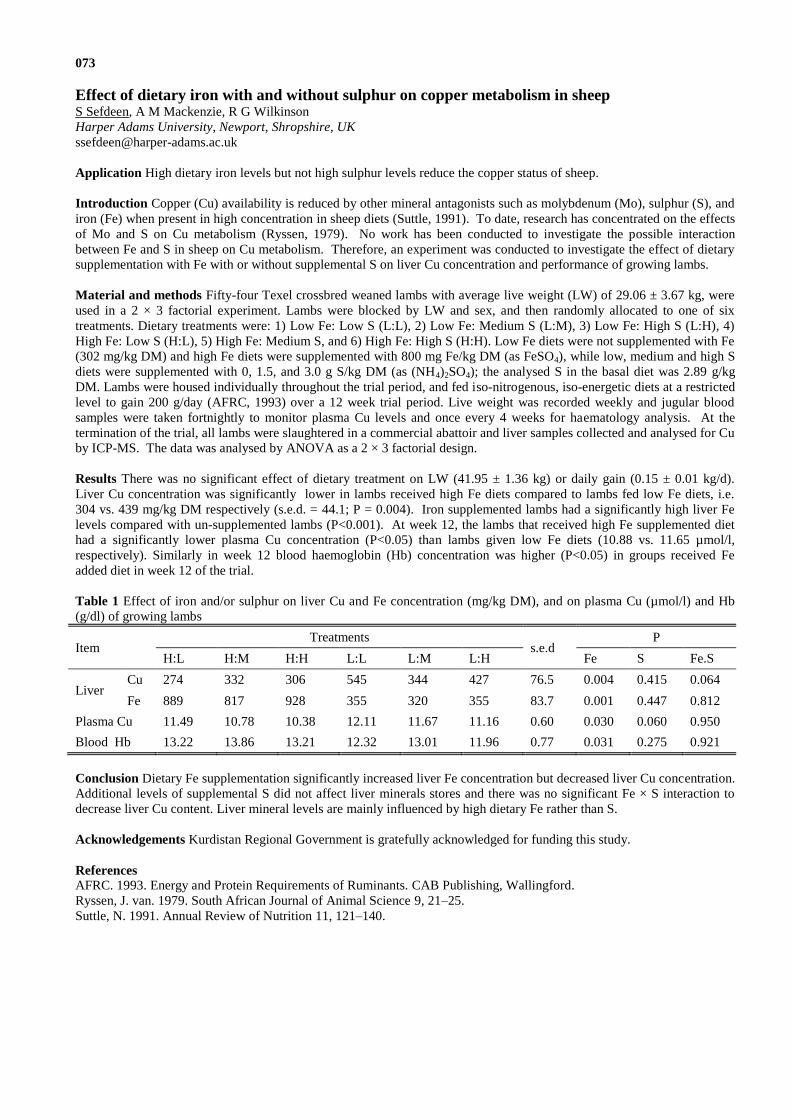
073
Effect of dietary iron with and without sulphur on copper metabolism in sheep S Sefdeen, A M Mackenzie, R G Wilkinson
Harper Adams University, Newport, Shropshire, UK
Application High dietary iron levels but not high sulphur levels reduce the copper status of sheep.
Introduction Copper (Cu) availability is reduced by other mineral antagonists such as molybdenum (Mo), sulphur (S), and
iron (Fe) when present in high concentration in sheep diets (Suttle, 1991). To date, research has concentrated on the effects
of Mo and S on Cu metabolism (Ryssen, 1979). No work has been conducted to investigate the possible interaction
between Fe and S in sheep on Cu metabolism. Therefore, an experiment was conducted to investigate the effect of dietary
supplementation with Fe with or without supplemental S on liver Cu concentration and performance of growing lambs.
Material and methods Fifty-four Texel crossbred weaned lambs with average live weight (LW) of 29.06 ± 3.67 kg, were
used in a 2 × 3 factorial experiment. Lambs were blocked by LW and sex, and then randomly allocated to one of six
treatments. Dietary treatments were: 1) Low Fe: Low S (L:L), 2) Low Fe: Medium S (L:M), 3) Low Fe: High S (L:H), 4)
High Fe: Low S (H:L), 5) High Fe: Medium S, and 6) High Fe: High S (H:H). Low Fe diets were not supplemented with Fe
(302 mg/kg DM) and high Fe diets were supplemented with 800 mg Fe/kg DM (as FeSO4), while low, medium and high S
diets were supplemented with 0, 1.5, and 3.0 g S/kg DM (as (NH4)2SO4); the analysed S in the basal diet was 2.89 g/kg
DM. Lambs were housed individually throughout the trial period, and fed iso-nitrogenous, iso-energetic diets at a restricted
level to gain 200 g/day (AFRC, 1993) over a 12 week trial period. Live weight was recorded weekly and jugular blood
samples were taken fortnightly to monitor plasma Cu levels and once every 4 weeks for haematology analysis. At the
termination of the trial, all lambs were slaughtered in a commercial abattoir and liver samples collected and analysed for Cu
by ICP-MS. The data was analysed by ANOVA as a 2 × 3 factorial design.
Results There was no significant effect of dietary treatment on LW (41.95 ± 1.36 kg) or daily gain (0.15 ± 0.01 kg/d).
Liver Cu concentration was significantly lower in lambs received high Fe diets compared to lambs fed low Fe diets, i.e.
304 vs. 439 mg/kg DM respectively (s.e.d. = 44.1; P = 0.004). Iron supplemented lambs had a significantly high liver Fe
levels compared with un-supplemented lambs (P<0.001). At week 12, the lambs that received high Fe supplemented diet
had a significantly lower plasma Cu concentration (P<0.05) than lambs given low Fe diets (10.88 vs. 11.65 µmol/l,
respectively). Similarly in week 12 blood haemoglobin (Hb) concentration was higher (P<0.05) in groups received Fe
added diet in week 12 of the trial.
Table 1 Effect of iron and/or sulphur on liver Cu and Fe concentration (mg/kg DM), and on plasma Cu (µmol/l) and Hb
(g/dl) of growing lambs
Item Treatments
s.e.d P
H:L H:M H:H L:L L:M L:H Fe S Fe.S
Liver Cu 274 332 306 545 344 427 76.5 0.004 0.415 0.064
Fe 889 817 928 355 320 355 83.7 0.001 0.447 0.812
Plasma Cu 11.49 10.78 10.38 12.11 11.67 11.16 0.60 0.030 0.060 0.950
Blood Hb 13.22 13.86 13.21 12.32 13.01 11.96 0.77 0.031 0.275 0.921
Conclusion Dietary Fe supplementation significantly increased liver Fe concentration but decreased liver Cu concentration.
Additional levels of supplemental S did not affect liver minerals stores and there was no significant Fe × S interaction to
decrease liver Cu content. Liver mineral levels are mainly influenced by high dietary Fe rather than S.
Acknowledgements Kurdistan Regional Government is gratefully acknowledged for funding this study.
References
AFRC. 1993. Energy and Protein Requirements of Ruminants. CAB Publishing, Wallingford.
Ryssen, J. van. 1979. South African Journal of Animal Science 9, 21–25.
Suttle, N. 1991. Annual Review of Nutrition 11, 121–140.
074
Effects of growth promoters on expression of genes associated with lipid metabolism in ovine
skeletal muscle, subcutaneous adipose tissue and liver M F Ab Aziz
1,2, S Al-Doski
1, K Hemmings
1, Z C T R Daniel
1, J M Brameld
1, T Parr
1, A Salter
1
1University of Nottingham, UK,
2University Putra Malaysia, Serdang, Selangor, Malaysia
Application The understanding of lipid metabolism in response to growth promoters will enable the identification of
potential changes in nutrient utilisation and deposition, which may be targets for improving feed efficiency.
Introduction The growth promoters, growth hormone (GH) and beta-adrenergic agonist (BA), alter nutrient mobilisation
and utilisation, which results in muscle hypertrophy and leaner carcasses (Bell et al., 1998). The aim of this study was to
determine the effects of these agents on the expression of genes associated with lipid synthesis (fatty acid synthase, FAS)
and degradation (adipose triglyceride lipase, ATGL) in various tissues of lambs.
Material and methods Male lambs (120 days old) were all fed a high protein/energy diet ad libitum, with the GH group
(n=10) receiving a single subcutaneous injection of bovine GH (3.75mg/kg body weight, POSILAC, Monsanto) on day 1;
the BA group (n=10) receiving BA (cimaterol) at 10mg/kg in the feed, whereas the control group (CO), n=11) only had the
ad libitum feed. After 6 days all lambs were slaughtered and samples of the longissimus dorsi (LD) and supraspinatus (SS)
muscles, subcutaneous adipose tissue (SC) and liver (Li), were snap frozen in liquid nitrogen and stored at -80oC. Total
RNA was extracted (Trizol) and first strand cDNA generated using random primers. Gene expression was determined using
quantitative RT-PCR analysis (Roche) relative to beta-actin gene expression (not significantly affected by treatment).
Metabolomic analysis of plasma fatty acid concentration taken at slaughter was carried out by Metabolon Inc (USA) using
GC/MS and LC/MS/MS platforms. Treatment groups were compared using one-way ANOVA (Genstat) and Post hoc
Dunnett’s test, error bars are standard error of the mean. ignificance was accepted at P<0.0 .
Results In both muscles, the expression of ATGL mRNA was decreased in BA treated relative to control, whilst FAS
mRNA was reduced in response to both BA and GH in LD and there was a trend in SS (P<0.1, ANOVA). There were no
effects of either treatment on gene expression in SC. In Li, there were no effects on ATGL mRNA expression, whilst FAS
gene expression was decreased in GH treated lambs relative to control (Figure 1). There was a significant increase in the
plasma concentrations of the free fatty acids, palmitate, stearate and oleate, in GH treated lambs (Figure 2).
Conclusion Following a relatively short term treatment (6 days) with GH, but not BA, there was an increase in plasma fatty
acids but this was not associated with changes in the expression of genes associated with either lipogenesis or lipolysis in
SC. Changes in FAS suggests growth promoters may reduce fatty acid synthetic capacity of muscles and Li, whilst
lipolysis in muscle is also decreased, particularly with BA treatment, suggesting a reduced turnover of lipids in muscle.
Acknowledgements This work was supported by the Biotechnology and Biological Sciences Research Council (BBSRC),
Ministry of Higher Education, Malaysia and University Putra Malaysia.
References
Bell, A.W., Bauman, D.E., Beerman, D.H., and Harrell, R.J. 1998. Journal of Nutrition 128, 360S – 363S.
Figure 1 Effects of BA and GH on FAS and ATGL mRNA expression
in longissimus dorsi (LD) and supraspinatus (SS) muscles,
subcutaneous (SC) adipose tissue and liver (Li). (*P<0.05, ** P<0.01)
Figure 2 Effects of BA and GH on
plasma fatty acid concentrations.
(*P<0.05, ** P<0.01)
075
Effects of age at first joining and ewe genotype on performance of ewes lambing at 2 years of age T W J Keady, J P Hanrahan
Teagasc, Athenry, Co Galway, Ireland
Application Regardless of genetic value for prolificacy joining replacement ewes to lamb as one-year olds has no negative
effect on ewe performance when lambing at 2 years of age.
Introduction Keady (2014) concluded that the mean cost nationally of rearing a replacement ewe to first joining at ~19
months equated to approximately 25% of the value of the lamb carcass output produced during her lifetime. Joining ewe
replacements to produce their first lambs at 1 year, with the objective of increasing the number of litters produced during
their lifetime, may provide an opportunity to reduce replacement costs. Previously, Keady and Hanrahan (2014) reported
that Belclare (B), B×Suffolk (B×S) and >75% S replacements joined at ~7 months reared 1.34, 1.03 and 0.93 lambs per
ewe lambing. The aim of the current study was to evaluate the effects of age at joining (~7 or 19 months) and ewe genotype
on the performance of ewes lambing at 2 years and the performance of their lambs.
Material and methods A total of 424 ewes [157 B, 114 B×S, 153 >75% S] were joined with Charollais rams to lamb in
March at 2 years of age. A random 50% of each genetic group had been joined at ~7 months while the remainder were
joined for the first time at ~19 months. Ewes were shorn at housing (early December) and offered grass silage ad libitum
until lambing. During the last 7 weeks pre lambing a total of 15, 23 and 28 kg concentrate was offered to ewes carrying
(scan data) singles, twins and triplets, respectively. Ewes rearing singles or twins received no concentrate supplementation
post lambing while those rearing triplets received concentrate (0.5 kg/d) for 5 weeks post lambing, and their lambs had
access to concentrate (up to 300 g/head daily) until weaning. All lambs were managed as one flock between weaning and
slaughter, and offered grazed grass as the sole diet. The data were analysed using Procs GENMOD or MIXED of SAS, as
appropriate.
Results The grass silage had DM and metabolizable energy concentrations of 213 g/kg and 11.5 MJ/kg DM, respectively.
The effects of age at first joining and ewe genotype on animal performance are presented in Table 1. There were no age at
first joining by ewe genotype interactions (P>0.05). Ewes that were joined for the first time to lamb at 2 years were heavier
at joining and lambing, tended to have a lower condition score (P=0.07) at joining and produced lighter lambs at birth
(P<0.001). Age at first joining had no effect (P>0.05) on ewe weight at weaning, litter size, or lamb gain from birth to
weaning. Belclare ewes were lighter at joining and lambing relative to the B×S and >75% S ewes. Ewe genotype had no
effect (P>0.05) on weight at weaning or body condition score at joining or weaning. Relative to B and B×S ewes, 75% S
ewes produced smaller litters and reared fewer lambs per ewe joined. Belclare ewes tended to produce (P=0.09) lighter
lambs at birth. Lambs born to the B×S ewes grew faster (P<0.01) from birth to weaning than those born to <75%S ewes.
Table 1 Effect of age at first joining and ewe genotype on ewe and lamb performance
First mating (FM) Ewe genotype1 (G) Sig.
2
7 months 19 months s.e. B B×S >75% S s.e. FM G
Ewe weight (kg)- joining 59.6 61.8 0.46 59.3a 61.2
b 61.6
b 0.56 *** **
lambing 64.5 62.3 0.54 61.4a 64.3
b 64.5
b 0.67 ** ***
weaning 65.2 64.7 0.61 64.5 65.1 65.4 0.75 NS NS
Condition score - joining 3.11 3.03 0.031 3.03 3.08 3.11 0.038 0.07 NS
weaning 3.31 3.24 0.034 3.26 3.25 3.31 0.042 NS NS
Litter size 1.78 1.79 0.046 1.92b 1.85
b 1.60
a 0.057 NS ***
Lambs reared per ewe joined 1.41 1.38 0.053 1.51b 1.49
b 1.18
a 0.065 NS ***
Lamb weight - birth 4.83 4.53 0.066 4.55 4.74 4.74 0.079 *** 0.09
weaning 29.8 29.3 0.52 29.6 30.2 28.9 0.57 0.10 NS
Lamb gain 0-14 weeks (g/day) 257 255 5.0 256ab
263b 248
a 5.4 NS *
Ewes joined at 30 months2 (%) 78 77 - 77 76 80 - NS NS
1B = Belclare, S = Suffolk;
2Relative to initial number assigned to the study.
2 ab
Means with a superscript in common are
not significantly different
Conclusion Age at first joining (~7 or 19 months) had no effect on the performance of ewes lambing at 2 years of age.
Belclare and B×S ewes reared 0.33 and 0.31 extra lambs per ewe joined than >75% S ewes.
References
Keady, T.W.J. 2014. Effects of rearing regime of replacements on the lifetime performance of ewes. Proc. Nat. Sheep
Conf. Teagasc, Carlow, Ireland. 18-27
Keady, T.W.J. and Hanrahan, J.P. 2014. Effect of genotype and weight at mating on performance of ewes joined to lamb at
1year of age. Advances in Animal Biosciences 5, 22

076
Effect of stocking rate and prolificacy potential on lamb performance and carcass output from a
grass based production system E Earle
1, N McHugh
1, T Boland
2, P Creighton
1
1Teagasc, Animal & Grassland Research and Innovation Centre, Mellows Campus, Athenry, Co, Galway, Ireland,
2UCD
School of Agriculture and Food Science, University College Dublin, Belfield, Dublin 4, Ireland
Application Increasing stocking rate and ewe prolificacy can increase carcass output from grass based production systems
Introduction Increasing output (kg carcass) is vital to maintaining sustainable lamb production systems. Grazed grass is
the most economic source of nutrition available to grazing ruminants (Finneran, et al., 2010) and has the potential to supply
90 to 95% of the energy requirements of sheep (Davies and Penning, 1996). Stocking rate (SR; ewe ha-1
) and ewe
prolificacy potential (PP; predicted number of lambs born ewe-1
year-1
) are two important factors influencing output in
grass-based production systems. The objective of this study therefore was to investigate the effect of SR, ewe PP and their
interaction on lamb performance and carcass output from a grass based production system.
Material and methods A 2 x 3 factorial study comprising two production years was completed between October 2012 to
October 2014. The study consisted of 180 medium prolificacy potential (MP) - Suffolk crossbred ewes (target weaning rate
of 1.5 lambs ewe-1
), and 180 high prolificacy potential (HP) - Belclare crossbred ewes (target weaning rate of 1.8 lambs
ewe-1
; Hanrahan, 1994) Within PP, ewes were blocked by live weight (kg) and body condition score (BCS) on a scale of 1
to 5, before being randomly assigned to one of three stocking rate (SR) pasture-based systems: a low SR (LSR; 10 ewes ha-
1), medium SR (MSR; 12 ewes ha
-1), and high SR (HSR; 14 ewes ha
-1) in October 2012. Ewes were mated in October each
year to Charollais rams over a six week period. Post-lambing, ewes and their progeny were rotationally grazed. Lamb
average daily gain (ADG; g day-1
) was recorded from birth to weaning and from weaning to slaughter, with lambs weighed
at two week intervals from six weeks of age. Lambs were weaned at 14 weeks of age and drafted for slaughter once pre-
defined live weight targets of 42, 43, 44, 45 and 46 kg were reached in the months June, July, August, September and
October, respectively to produce a carcass of 19 to 20 kg. Post-weaning a leader follower grazing system was operated with
lambs offered pasture access in advance of ewes. The effect of SR, PP and their interaction on lamb ADG, days to slaughter
(DTS), carcass weight and carcass output (kg ha-1
) were modelled using linear mixed models in PROC HPMIXED (SAS
Inst. Inc., Cary, NC, USA) with ewe included as a random effect.
Results
A significant PP by SR interaction was observed for pre-weaning lamb ADG, with MP lambs having a lower ADG at the
MSR (-18.9 g day-1
, SEM = 6.4; P<0.01, Table 1) compared to HP, however at the LSR and HSR lambs from HP ewes had
greater ADGs. Post-weaning; LSR lambs achieved a greater ADG (P<0.001) compared to the MSR and HSR lambs which
did not differ from each other. Also post-weaning the HP lambs achieved a greater ADG. Lifetime lamb ADG was highest
at the LSR, intermediate at the MSR and lowest at the HSR (P<0.001). A second PP by SR interaction was observed for
DTS, with MP lambs at the MSR requiring a greater number of days to reach slaughter (+14.9 days; SEM = 6.6; P<0.01)
compared to lambs finished off the LSR and HSR. High prolificacy lambs had a greater carcass weight (P<0.001). Carcass
output increased as both SR (P<0.001) and PP (P<0.01) increased.
Table 1 The effect of stocking rate and prolificacy level on lamb performance and carcass output
SR PP P-value
Parameter LSR MSR HSR SEM MP HP SEM SR PP PP x SR
Pre-weaning ADG g day-1
272a 263
b 242
c 7.9 263 255 4.3 <0.001 <0.01 <0.01
Post -weaning ADG g day-1
154a 137
b 135
b 1.3 136 149 7.4 <0.001 <0.01 NS
Lifetime ADG g day-1
195a 168
b 155
c 1.2 169 177 7.0 <0.001 NS NS
Days to slaughter (days) 209a 225
b 241
c 7.1 226 225 6.9 <0.001 NS <0.01
Carcass weight (kg) 19.8 19.7 19.6 0.21 19.4 19.9 0.12 NS <0.001 NS
Carcass output (kg ha-1
) 320a 379
b 419
c 24.9 344 401 13.6 <0.001 <0.01 NS
a,b,c Within rows superscripts indicates significant difference (P<0.01) in SR, ADG: Average daily gain (g day-1
)
Conclusion Increased carcass output from grass based production systems is achievable through increased stocking rate
and prolificacy potential levels despite lower individual performance.
Acknowledgements The authors gratefully acknowledge the Teagasc Walsh fellowship scheme and farm staff for help.
References
Davies, A. and Penning, P. 1996. Proceedings of the Agricultural Research Forum, 129-147.
Finnernan, E., Crosson, P., Shalloo, L., Foristal, D., ’Kiely, P. and Wallace, M. 2010. Journal of Farm Management 14,
95-116.
Hanrahan, J.P. 1994. Proceedings of the Agricultural Research Forum, 21-22.
077
Techniques to advance oestrus in ewes – a comparative study between the use of progestagen
sponges and the ‘ram effect’ S Batten, P Watson, B R Evans
Hartpury College, Gloucester, UK
Application Sponge treated ewes (SE) lambed earlier than teaser ram ewes (TE). The lambing percentage and the lamb
birth weights did not differ between the techniques. Lamb weights at 35 days were greater in SE lambs due to differences in
lambing resource availability.
Introduction The onset of oestrus in sheep can be manipulated in the last few weeks of anoestrus via several techniques
(Martin, 2004). Producers use these techniques to manage for an earlier lambing time frame and consequently allow lambs
to be marketed earlier in the year. The aim of the study was to see if the sponge technique compromised the performance of
the ewes and lambs compared to the use of teaser rams. The key performance indicators of lambing timings; number of
lambs per ewe and individual lamb weights were assessed between the two different techniques.
Material and methods The study investigated lambing outcomes following administration of flugestone acetate in
combination with Pregnant Mare Serum Gonadotrophin (PMSG) or the utilisation of the ram effect on ewes during the non-
breeding season. In the study, 138 Suffolk x Mule ewes were separated into two groups. The treatment group (n=60) was
given an intravaginal progestagen (20mg flugestone acetate). The sponges were left in for 14 day and immediately after
sponge removal an intramuscular injection of PMSG (300IU) was administered. Thirty-six hours after termination of the
progesterone and PMSG the ewes were introduced to the ram. For the teaser group (n=78) vasectomised rams were
introduced for two weeks on the same day the first treatment group were sponged. Once the teaser rams were removed,
entire rams were introduced and left to run with the ‘teaser’ group. ubsequent weights of live lambs at birth and days
later were recorded. Data were analysed using the t-test to compare key performance indicator diaferences between the two
techniques.
Results Lambing was significantly earlier (p<0.001) by 17 days in SE than the TE group. There was no significant
difference in the numbers of singles, double and triplets per ewe and in average weights at birth between groups. However,
a significant difference was identified in average lamb weights at 35 days old with the SE lambs being 1.4kg heavier
(p<0.01).
Conclusion Progestagen sponged ewes is an early oestrus technique which offers producers the advantage of a significantly
shorter ram introduction to lambing interval compared to teaser rams, without the lambing percentages and lamb birth
weights being compromised. The better growth rates observed in SE lambs because of less demand placed on lambing
resources warrants further investigation, such as lambing shed stocking density and disease build up as lambing progresses.
Acknowledgements The authors gratefully acknowledge the Carter family (Carswalls Farm) for allowing their sheep to be
studied.
References
Martin, G.N., Milton, J.T., Davidson, R.H., Banchero-Hunzicker, G.E., Lindsay, D.R. & Blache, D. 2004. Animal
Reproductive Science. 82 (83), pp. 231-245.
Table 1 Early oestrus technique key performance indicators comparison
Technique
SE TE s.e.d. p
Ram introduction to lambing
interval (days)
147.4 164.4 1.2 <0.001
Lambs per ewe 1.76 1.8 0.05 n.s.
Lamb birth weight (kg) 6.0 6.2 0.14 n.s.
35 day lamb weight (kg) 13.6 12.2 0.36 0.01

078
Relationship between body weight and milk production in dairy sheep S Radic Schilling
2, J C Angeles Hernandez
1,4, A M Vera Arias
2, P R Echeverria Perez
2, O O A Castelan
3,
M Gonzalez Ronquillo3
1Programa de Maestría y Doctorado en Ciencias de la Salud y la Producción Animal, Facultad de Medicina Veterinaria y
Zootecnia. Universidad Nacional Autónoma de México., Mexico, 2Facultad de Ciencias, Universidad de Magallanes,
Punta Arenas, Chile, 3Facultad de Medicina Veterinaria y Zootecnia, Universidad Autónoma del Estado de México,
Mexico, 4Departamento de Bioquímica y Nutrición Animal. Facultad de Medicina Veterinaria y Zootecnia. Universidad
Nacional Autónoma de México, Mexico
Application Monitoring body live weight in dairy sheep in each stage of their productive cycle allows the implementation
of feed management strategies that promote adequate nutrient availability for milk synthesis.
Introduction Ewe nutrition is vital for successful dairy performance. Although all nutrients are ultimately derived from
food intake, the nutrients stored in body tissues are fundamental to specific production stage e.g. late gestation and early
lactation. Nutrient demand is increased to achieve an adequate development and performance of the mammary gland. In
dairy animals there is a high priority in physiological functions i.e. pregnancy and milk production (Bauman and Currie,
1980).
Material and methods The aim of the present study was to analyse the effect of body weight at mating, late pregnancy
(day 120 of pregnancy), lambing, early lactation and late lactation on milk yield and patterns of milk production.
Furthermore to investigate the effects of environmental factors such as: number of lambing (NL) and type of lambing (TL)
on live weights and milk production. Monthly milk yields (MMY) were recorded throughout a period of 157±8.6 days from
52 multiparous East Friesian ewes from an experimental flock in Puerto Natales, University of Magallanes, Chile. The
flock was managed under a strip grazing system on mixed swards of rye grass (Lolium perenne), orchard grass (Dactilys
glomerata) and white clover (Trifolium repens) and supplemented at milking time with Lucerne hay (Medicago sativa)
(400g / ewe / d) and commercial concentrate (15% CP; 400g / ewe / d). The animals were mechanically milked once daily,
with the first MMY record at day 34±5.6; total milk yield (TMY) was computed using the Fleischmann´s method (Ruiz et
al. 2000). The ewes were weighed at mating (WM), late pregnancy (WLP), lambing (WL), early lactation (WEL), and late
lactation (WLL). Higher-order polynomials were used (PROC REG, SAS Institute 2002) to analyse the relationship
between total milk yield with measured body weights. The General Linear Model (PROC GLM, SAS Institute 2002) was
used to analyse the effect of TL (1, 2 and 3 lambs) and NL (1st, 2nd, 3er, 4th
and 5th
) on milk production. To analyse the
effect of the analysed variables (NL, TL, WM, WLP, WL, WEL and WLL) on lactation curves the mathematical model
proposed by Wood gamma model was utilised. The parameters of the Wood model (a, b and c) were estimated individually
for each lactation curve through an iterative procedure of nonlinear regression analysis (PROC NLIN, SAS Institute 2002).
Results There was a significant effect (P<0.05) of NL on WM, WLP, WL, WEL and WLL. All weights were lower in
younger animals compared with older ones; ewes of first and second lambing (55.62 and 56.48 kg; P=0.007; s.e.d.=9.67)
were lighter than ewes of third to fifth lambing (63.12, 65.17 and 65.17 kg, respectively). Ewes at their first and second
lambing had significantly lower TMY (86.88 kg and 97.87; P<0.001; s.e.d.=2.23) compared to those at their third to fifth
lambing (123.77, 123.91 and 127.02 l, respectively). There was a trend of effect of TL on TMY (P=0.08; s.e.d.=10.2), ewes
of triple lambing had higher TMY in comparison with simple and double lambing (137.23>103.59 and 110.74 l,
respectively). There was a positive quadratic relationship between WM and TMY (β1=9.6, β2=-0.04; P<0.001; R2=0.51).
TMY increased as WLP (quadratic effect, β1=20.0, β2=-0.13; P=0.003; R2=0. 8), WL (linear effect, β1=3.13; P<0.001;
R2=0.44) and WEL (quadratic effect, β1=14.9, β2=-0.09; P=0.04; R
2=0.48) increased. There was no effect of WM, WLP,
WL, WEL and WLL on their different parameters in the Wood model (P>0.05). The live weight of ewes at mating, late
pregnancy, lambing, early and late lactation had a positive effect on milk production (P<0.05). Higher milk yields were
obtained when ewes had weights from 59 to 66 kg at late pregnancy and 57 to 64 kg at lambing.
Conclusion To achieve appropriate production performance farmers must ensure adequate body weight that promotes
suitable mammary development in pregnancy and body reserves that will favours galactopoyesis.
Acknowledgements MSc Angeles Hernandez has been supported by CONACyT fellowship; Dr. Gonzalez Ronquillo was
supported by AGCI-Beca Alianza del Pacifico Chile 2014.
References
Bauman, D.E. and Currie, W.B. 1980. Journal of Dairy Science 63 (9), 1514-1529.
Ruiz, R., Oregui, L.M., and Herrero, M. 2000. Journal of Dairy Science 83, 2709-2719.
A nstitute. 2002. tatistical analysis systems user’s guide ( A : Cary, C).

079
Association of milking parlours and milking procedures with subclinical mastitis in dairy sheep S A Termatzidou, S Vouraki, P Kazana, A Gelasakis, G Valergakis, G Arsenos
Aristotle University, Laboratory of Animal Husbandry, Thessaloniki, Greece
Application Results from this study will enhance our knowledge regarding the role of machine milking and relative
procedures on the prevalence of subclinical mastitis in dairy sheep.
Introduction Although most farmers have adopted automatic milking, udder health has not improved as expected
(Hovinen et al., 2011). The standard operating procedures concerning machine milking are usually underestimated or
ignored by the majority of dairy farmers. As a result, udder health problems and large variation in milk quality dominate
the routine of dairy flocks. The objective here was to assess the role of milking parlours on udder health and particularly the
prevalence of subclinical mastitis in dairy sheep.
Material and methods A random number of twenty-eight dairy sheep farms, located in Northern Greece, were used. Each
farm was visited by a team of two veterinarians that assessed the structure and function of the milking parlour. A
designated recording form was used to assess the following: i) type and structure of the milking parlour, including
dimensions and holding area, numbers of stalls and milking units, diameters of pipelines, number of milkings per day,
frequency of teat cup liners replacement and general maintenance. Moreover, a specific mobile device (Exendis Milking
System Analyser PTV) was used to measure the vacuum level in the clusters (in order to compare it with the vacuum of the
pump), the pulsation rate and the duration of pulsation phases, in three milking units of each line in every milking parlour.
A random sample of milking ewes from each flock, representing about 20% of the total population in the flock, was
selected for milk sampling in order to perform California Mastitis Test (CMT; scores 0-4) as an indicator of subclinical
mastitis. If the percentage of ewes with milk assigned CMT score 3 and 4 was over 20%, then the flock was considered as
positive for subclinical mastitis. Data were analysed using univariate analysis of variance with SPSS 22 statistical software.
Vacuum level, difference of vacuum level between clusters and vacuum pump, pulsation rate, pulsation ratio and cluster
removal after vacuum cessation were transformed into categorical variables and used as fixed effects.
Results A general evaluation of the milking procedure and performance is shown in Figure 1 as a spider diagram, where 0
is the lowest and 10 the highest evaluation score. In 71% of the flocks, the percentage of animals with CMT 3 and 4 was
over 20%. The average percentage of ewes with CMT 3 and 4 was 7% and 22%, respectively. The holding area was small
compared to the number of milking ewes in the majority of the
flocks. Also, the length of milking stalls was < 90cm in 36% of
the flocks and the width was < 35cm in 25% of the flocks.
Additionally, in 14% of farms, the diameter of pipes in the milk
line was smaller than normal, which resulted in a decrease in
vacuum level. Furthermore, only one farmer replaced the liners
after 2500 milkings; all others were well above this number.
The effect of ewes per milking unit was statistically significant,
with the flocks that had more than 11 ewes per unit showing a
higher percentage of subclinical mastitis (24.5% to 31.4%,
P=0.012). The vacuum level measured in clusters differed
significantly from that in the vacuum pump (≥ 2 kPa) at two or
more measurements in 50% of flocks and at one measurement
in 21% of flocks. In case such difference existed at two or more
measurements, subclinical mastitis was observed in a
significantly higher percentage (33.5%) than in the other cases
(24.7%, P=0.047).
Conclusion Errors in milking process and lack of proper maintenance of the milking parlour increased the prevalence of
subclinical mastitis in dairy sheep. Farmers should have the milking parlours serviced by specialists in order to limit any
issues that have negative consequences on animal health and welfare.
Acknowledgements Milkplan, S.A. Farming Technologies is acknowledged for funding this work.
References
Hovinen M., and Pyörälä S., 2011. Invited review: Udder health of dairy cows in automatic milking. Journal of Dairy
Science 94, 547–562.
Figure 1 Evaluation of milking procedures and
performance
080
Zinc concentration changes in the tissues with supplementation of different zinc sources in
growing Baluchi lambs S Sobhanirad
Islamic Azad University, Mashhad Branch, Mashhad, Iran
Application Supplemental zinc (Zn) is usually added to animal diets in the form of inorganic and organically bound Zn
supplements. Feeding growing Baluchi lambs, with higher Zn concentration (100 mg Zn/kg of diet) of zinc supplements
resulted in higher accumulation of Zn in the tissues of liver, kidney, muscle, spleen, and testis in lambs.
Introduction Little information is available in the literature regarding the optimum productivity effects of Zn organic and
inorganic different sources (NRC, 2007). The objectives of this experiment were to examine the effects of inorganic and
organic Zn supplementation on accumulation of Zn in the tissues of growing lambs.
Material and methods Thirty-six male growing lambs with an average weight 27±0.3 kg were used to determine the
effects of level of the zinc (Zn) supplementation in diet from inorganic and organic sources on performance of Baluchi
lambs, an indigenous sheep breed in Iran. Animals were allocated to six groups, with the control group (C) receiving the
basal diet (no zinc supplementation); the other five groups were offered the basal diet supplemented with 50 or 100 ppm
Zn from zinc sulfate monohydrate (Zn-S) and Zinc proteinate(Zn-P) and added Zn from Zn-P+Zn-S (50+50 mg/kg,
respectively). Ingredients of the basal diet contained (%, DM) Alfalfa hay 55%, Barley 20%, corn 15.75%, Soybean meal
1.8%, Cottonseed meal 1.8%, Wheat bran 4.5%, Urea 0.2%, Calcium carbonate 0.45%, Salt 0.2%, and Minerals and
vitamins mix 0.5%. Upon termination of experiments, lambs were killed by exsanguination and liver, heart, kidney, lung,
muscle, spleen and testis were quantitatively excised. Zinc determinations were performed by a modified method of Parker
et al. (1967) using a Perkin-Elmer Model 603 atomic absorption spectrophotometer (Perkin-Elmer Corp., Norwalk, CT).
The data was analyzed using the mixed procedure of SAS (9.1) for a completely randomized design.
Results (Table 1) showed that the
Zn concentration of liver, kidney,
muscle, spleen, and testis in lambs
fed diets supplemented 100 mg/kg
Zn as zinc proteinate, 100 mg/kg
Zn as zinc sulfate and the mixture
of inorganic and organic Zn were
greater (P<0.05) than other groups.
The Zn concentrations of heart and
lung in lambs on treatments 100
Zn-P and ZnP+Zn-S were higher
(P<0.05) than other groups.
Conclusion This experiment
concluded that if supplementing
inorganic or organic Zn sources with zinc levels lower than 100 mg Zn/kg of the diet then in lambs tissue did not
accumulate zinc.
Acknowledgements
The authors wish to acknowledge the financial support received from the Islamic Azad University, Mashhad branch.
References
NRC (National Research Council). 2007. Nutrient Requirements of Small Ruminants. Seventh Edition. Washington, D.C.
Parker, M. M., Humoller, F. L., Mahler, D. J. 1967. Determination of copper and zinc in biological material. Clinical
Chemistry 13, 40-43.
Table 1 Effect of zinc sources on zinc concentration of tissues in lambs (mg/kg)
Treatments*
Tissue C 50
Zn-P
100
Zn-P
50
Zn-S
100
Zn-S
Zn-P+
Zn-S
SEM
Heart 44.3
b
49.0b 50.2
b 46.1
b 53.0
a 55.3
a 0.05
Kidney 52.1c 54.4
b 56.2
a 51.9
b 55.5
a 57.7
a 0.03
Liver 42.1b 43.7
ab 54.8
a 50.1
ab 57.3
a 59.2
a 0.04
Lung 22.3b 26.0
b 48.2
a 31.1
b 45.0
a 55.3
a 0.02
Muscle 62.1c 66.2
b 71.2
a 65.9
b 73.5
a 77.7
a 0.03
Testis 34.3a 39.0
b 46.2
a 38.1
b 43.0
a 45.3
a 0.05
Spleen 62.1b 65.7
ab 74.8
a 66.1
ab 77.3
a 79.2
a 0.04
C, control, Zn-S: zinc sulfate monohydrate, Zn-P: zinc proteinate.
a,b,c Means in the same row lacking a common superscript differ (P < 0.05).
081
Effect of Acacia erioloba and Dichrostachys cinerea supplementation on doe and kid growth of
indigenous Namibian goats L N Marius
1, E L K Osafo
2, I D T Mpofu
3, V Attoh-Kotoku
2, E Lutaaya
4, K L Shiningavamwe
1, P van der Merwe
1,
E Missanjo5
1Ministry of Agriculture, Water and Forestry, Windhoek, Namibia,
2Kwame Nkrumah University of Science and
Technology, Kumasi, Ghana, 3Chinhoyi University of Technology, Chinhoyi, Zimbabwe,
4University of Namibia, Windhoek,
Namibia, 5Malawi College of Forestry and Wildlife, Dedza, Malawi
Application Feed shortage and expensive commercial feeds is a challenge in goat farming. Indigenous woody plants are
adapted to harsh environment conditions. Their pods and fruits can be easily collected and used as protein supplements in
dry season.
Introduction Indigenous woody plants form a major source of the diet of livestock in arid, semi-arid zones in Africa
(Salem and Smith, 2008; Yayneshet et al., 2008). Tree pods and fruits have protein contents that range from 100-190 g/kg
and can provide significant protein supplements especially in the dry season but contain anti- nutritional factors such as
tannins that could be detrimental to ruminants. Feeding limited quantities of these pods or fruits could increase weight gain
and milk production. However, there is inadequate knowledge on the types of pods and their inclusion levels in the diet of
lactating does. The aim of the present study was to assess the effect of Acacia erioloba (AE) and Dichrostachys cinerea
(DC) pods on intake and growth rates of Namibian Caprivi and Ovambo does ecotypes.
Material and methods The study was carried out at John Pandeni Research Station under the Ministry of Agriculture,
Water and Forestry (MAWF), Grootfontein, Namibia. Forty eight (48) indigenous does aged between 18 - 30 months were
used in a 2x3 factorial arrangements of treatments. The main factors were pod type (2; AE and DC) and level of
supplementation (3; 20% 40% and 60%).The pods of AE, DC were milled and mixed with Lucerne, and grass hay to obtain
protein target between130-140 g/kg in the ration using try and error method. Seventy nine (79) goat kids from single and
twin birth types were used to determine the pre-weaning growth. Does were supplemented on individual units each fitted
with a feeding trough. Animals were supplemented with 200 g once a day in the morning 7:00AM before they were
allowed out for grazing. Phosphate lick and clean water points were available ad libitum. Kids were allowed to overnight
with their mothers except the night before weighing. Does and kids weights were recorded once a week. Before the onset of
the experiment, does were dipped in Alphamethrin solution to control external parasites and injected with 1% of Dectomax
against internal worms. The feeding trial lasted for 91 days and all kids were weaned. Data for live weight and intake of
supplement were analysed as a completely randomized design in a 2x3 factorial arrangements of treatments.
Results The results showed that type of supplement significantly (P<0.05) improved intake with DC does having a higher
intake. Level of supplementation did not affect intake (P>0.05). Level of supplementation significantly (P<0.05) affected
final live-weight of does and weaning weights of kids. Does offered supplement at 40% had higher final weights than does
of the other two levels, but there was no difference in weaning weights of kids due to supplement level (P>0.05).
Table 1 Effect of supplementation at different levels on intake and growth of doe and kid
AE=Acacia erioloba; DC= Dichrostachys cinerea; S= supplement; L= level; ADG=average daily gain; *=sig; ns=not sig.
Conclusion Does supplementation with DC at 40% had highest total intake and better kid weights at weaning.
Acknowledgements The authors are gratefully acknowledge funding from EU through Intra ACP Mobility and MAWF-
Namibia
References
Salem, B.H. and Smith, T. 2008. Small Ruminant Research 77, 174-194.
Yayneshet, T., Eik, L.O. and Moe, S.R. 2008. Livestock Science 119, 31-41.
POD TYPE LEVEL Significance
Item AE DC s.e.d 20% 40% 60% s.e.d. S L S x L
Supplement intake g DM/d 289.3 307.6 12.99 307.4 338.0 249.8 35.90 * ns ns
Supplement intake g/M0.75
/d 69.3 72.9 2.55 73.0 78.5 61.9 6.30 * ns ns
Crude protein consumed g/d 47.7 52.1 3.11 53.6 53.7 42.5 6.43 * ns ns
Doe final weight, kg 35.6 33.4 0.72 34.8 35.7 31.2 0.86 * ns ns
Kid weaning weight, kg 14.3 14.9 0.40 15.0 15.2 13.8 0.48 ns ns ns
Kid ADG, g 98.6 102.5 3.45 101.1 105.2 94.5 4.06 ns ns ns

082
Effects of high dietary zinc concentration and zinc sources on serum biochemical parameters in
growing lambs S Sobhanirad, E Rabieimotlagh
Islamic Azad University, Mashhad Branch, Mashhad, Iran
Application Feeding growing lambs, with organic and mixed of inorganic and organic Zn sources, improved some
biochemical parameters and concentration of minerals in the serum of lambs. However, insignificant differences of GLU
and ALB, TC, TG, and BUN levels between treatments may be due to the transfer of insufficient zinc on synthesis of these
metabolites.
Introduction According to NRC Nutrient Requirements of Small Ruminants (2007), the recommended level of zinc for
optimum productivity is 20-33 mg Zn/kg in sheep. In practice, feed manufacturers tend to use higher concentrations than
those specified by the small ruminant NRC (2007) to achieve optimum productivity performance. The objectives of this
experiment were to investigate the response of feeding high concentrations of either organic, inorganic or mixture of
inorganic and organic Zn supplements on the biochemical parameters of the blood of growing lambs.
Material and methods Thirty-six male growing Baluchi lambs, an indigenous sheep breed in Iran, with an average weight
26.5±0.3 kg were randomly allocated to one of the dietary treatments. The treatments were: basal diet (no zinc
supplementation, BD), other five groups were offered BD supplemented with 50 or 100 ppm Zn from feed-grade ZnSO4.
H2O (Zn-S) and Zinc Proteinate (Zn-P) and added Zn from Zn-P+Zn-S (50+50 mg/kg), respectively. Ingredients of the
basal diet contained (%, DM) Alfalfa hay 55%, Barley 20%, corn 15.75%, Soybean meal 1.8%, Cottonseed meal 1.8%,
Wheat bran 4.5%, Urea 0.2%, Calcium carbonate 0.45%, Salt 0.2%, and Minerals and vitamins mix 0.5%. Serum samples
were analyzed for total protein (TP), glucose (GLU), blood urea nitrogen (BUN), total cholesterol (TC), triglyceride (TG),
and albumin (ALB), Concentration of calcium (Ca) and phosphorus (P) by a Selectra-auto analyzer (Vital Scientific NV,
DIERN, Netherland). The data was analyzed using the mixed procedure of SAS (9.1) for a completely randomized design.
Results (Table 1) showed that there was a significant difference between groups for TP, Zn, Ca, and P concentrations,
although there were no significant differences between treatments in concentrations of GLU and ALB, TC, TG, and BUN
levels.
Conclusion In conclusion, feeding Baluchi lambs, with organic and mixed of inorganic and organic Zn, improved some
biochemical parameters and minerals in blood serum of lambs. However, in the present study, insignificant differences of
GLU and ALB, TC, TG, and BUN levels between treatments may be due to the transfer of insufficient zinc on synthesis of
these metabolites.
References
NRC (National Research Council). 2007. Nutrient Requirements of Small Ruminants. Seventh edition. Washington, D.C.
Table 1 Effects of Zn sources on biochemical parameters in lambs
Treatments*
Parameter C 50
Zn-P
100
Zn-P
50
Zn-S
100
Zn-S
Zn-P+
Zn-S SEM
Glucose (mg/dL) 71.68 77.58 72.75 75.58 73.15 72.08 2.19
Albumin (mg/dL) 3.01 3.41 3.33 3.05 3.35 3.11 1.16
Total protein (g/L) 9.06 a 8.55
ab 8.70
ab 7.94
b 8.59
ab 8.46
ab 0.02
Triglyceride (mg/dL) 17.54 15.87 18.55 13.22 14.83 17.41 2.86
Total cholesterol (mg/dL) 47.20 44.85 52.31 44.21 42.52 44.38 2.88
Phosphorus (mg/dL) 4.79bc
4.67 bc
5.20ab
4.50 c 4.85
abc 5.45
a 0.01
Calcium (mg/dL) 9.82ab
9.72 ab
9.75ab
9.44 b 10.20
a 10.27
a 0.04
Zinc (mg/ dL) 0.96c 1.09
b 1.15
a 1.03
c 1.09
b 1.20
a 0.03
Blood Urea Nitrogen
(mg/dL)
52.68 53.25 50.53 51.75 50.06 50.34 2.67
C, control, Zn-S: zinc sulphate monohydrate, Zn-P: zinc proteinate.
a,b,c Means in the same row lacking a common superscript differ (P < 0.05).
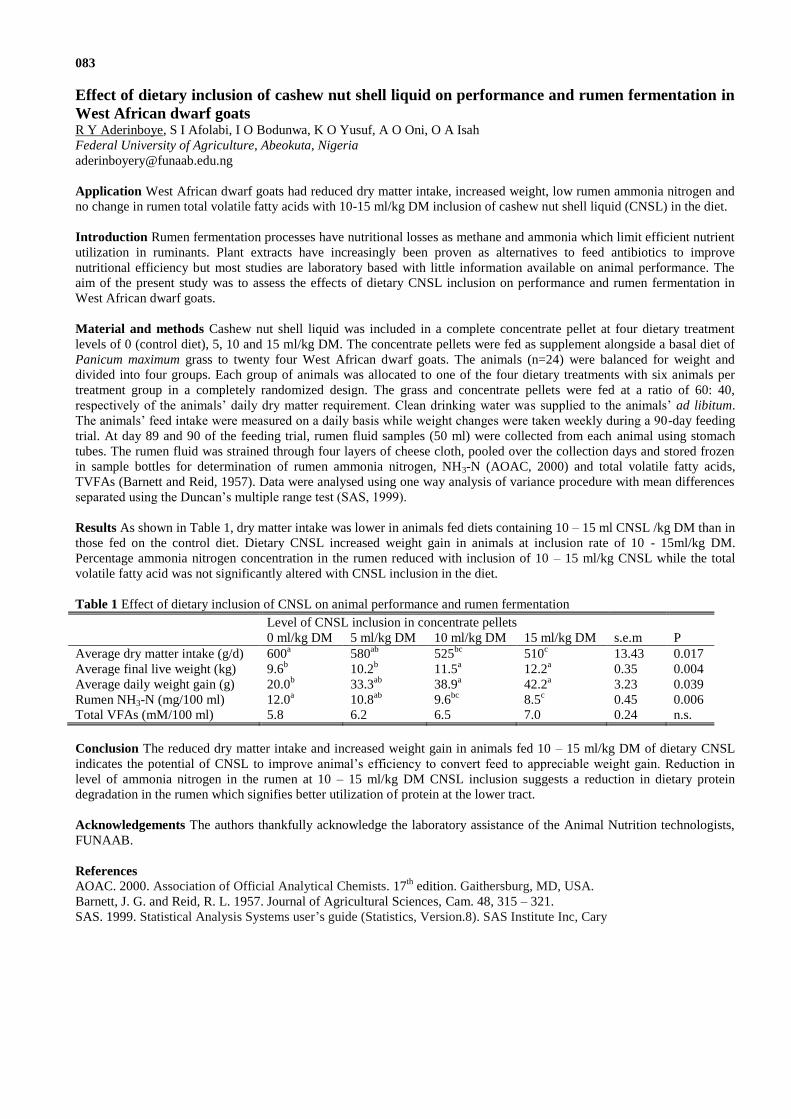
083
Effect of dietary inclusion of cashew nut shell liquid on performance and rumen fermentation in
West African dwarf goats R Y Aderinboye, S I Afolabi, I O Bodunwa, K O Yusuf, A O Oni, O A Isah
Federal University of Agriculture, Abeokuta, Nigeria
Application West African dwarf goats had reduced dry matter intake, increased weight, low rumen ammonia nitrogen and
no change in rumen total volatile fatty acids with 10-15 ml/kg DM inclusion of cashew nut shell liquid (CNSL) in the diet.
Introduction Rumen fermentation processes have nutritional losses as methane and ammonia which limit efficient nutrient
utilization in ruminants. Plant extracts have increasingly been proven as alternatives to feed antibiotics to improve
nutritional efficiency but most studies are laboratory based with little information available on animal performance. The
aim of the present study was to assess the effects of dietary CNSL inclusion on performance and rumen fermentation in
West African dwarf goats.
Material and methods Cashew nut shell liquid was included in a complete concentrate pellet at four dietary treatment
levels of 0 (control diet), 5, 10 and 15 ml/kg DM. The concentrate pellets were fed as supplement alongside a basal diet of
Panicum maximum grass to twenty four West African dwarf goats. The animals (n=24) were balanced for weight and
divided into four groups. Each group of animals was allocated to one of the four dietary treatments with six animals per
treatment group in a completely randomized design. The grass and concentrate pellets were fed at a ratio of 60: 40,
respectively of the animals’ daily dry matter requirement. Clean drinking water was supplied to the animals’ ad libitum.
The animals’ feed intake were measured on a daily basis while weight changes were taken weekly during a 90-day feeding
trial. At day 89 and 90 of the feeding trial, rumen fluid samples (50 ml) were collected from each animal using stomach
tubes. The rumen fluid was strained through four layers of cheese cloth, pooled over the collection days and stored frozen
in sample bottles for determination of rumen ammonia nitrogen, NH3-N (AOAC, 2000) and total volatile fatty acids,
TVFAs (Barnett and Reid, 1957). Data were analysed using one way analysis of variance procedure with mean differences
separated using the Duncan’s multiple range test ( A , 1999).
Results As shown in Table 1, dry matter intake was lower in animals fed diets containing 10 – 15 ml CNSL /kg DM than in
those fed on the control diet. Dietary CNSL increased weight gain in animals at inclusion rate of 10 - 15ml/kg DM.
Percentage ammonia nitrogen concentration in the rumen reduced with inclusion of 10 – 15 ml/kg CNSL while the total
volatile fatty acid was not significantly altered with CNSL inclusion in the diet.
Table 1 Effect of dietary inclusion of CNSL on animal performance and rumen fermentation
Level of CNSL inclusion in concentrate pellets
0 ml/kg DM 5 ml/kg DM 10 ml/kg DM 15 ml/kg DM s.e.m P
Average dry matter intake (g/d) 600a 580
ab 525
bc 510
c 13.43 0.017
Average final live weight (kg) 9.6b 10.2
b 11.5
a 12.2
a 0.35 0.004
Average daily weight gain (g) 20.0b 33.3
ab 38.9
a 42.2
a 3.23 0.039
Rumen NH3-N (mg/100 ml) 12.0a 10.8
ab 9.6
bc 8.5
c 0.45 0.006
Total VFAs (mM/100 ml) 5.8 6.2 6.5 7.0 0.24 n.s.
Conclusion The reduced dry matter intake and increased weight gain in animals fed 10 – 15 ml/kg DM of dietary CNSL
indicates the potential of CNSL to improve animal’s efficiency to convert feed to appreciable weight gain. Reduction in
level of ammonia nitrogen in the rumen at 10 – 15 ml/kg DM CNSL inclusion suggests a reduction in dietary protein
degradation in the rumen which signifies better utilization of protein at the lower tract.
Acknowledgements The authors thankfully acknowledge the laboratory assistance of the Animal Nutrition technologists,
FUNAAB.
References
AOAC. 2000. Association of Official Analytical Chemists. 17th
edition. Gaithersburg, MD, USA.
Barnett, J. G. and Reid, R. L. 1957. Journal of Agricultural Sciences, Cam. 48, 315 – 321.
SAS. 1999. Statistical Analysis Systems user’s guide (Statistics, Version.8). SAS Institute Inc, Cary

084
Influence of feed restriction on the dairy goat mammary gland proteome: a study in two breeds
with different levels of tolerance to weight loss L E Hernandez-Castellano
1,2, A Ferreira
3,6, P Nanni
4, J Grossmann
4, A Arguello
1, N Castro
1, J Capote
5, A M Almeida
6,7
1Universidad de Las Palmas de Gran Canaria, Arucas, Canary Is., Spain,
2VetSuisse, University of Bern, Switzerland,
3ITQB - Instituto de Tecnologia Quimica e Biologica da UNL, Oeiras, Portugal,
4ETH - Functional Genomics Center,
Zurich, Switzerland, 5ICIA - Instituto Canario de Investigaciones Agrarias, Valleguerra, Canary Is., Spain,
6IBET -
Instituto de Biologia Experimental e Tecnologica, Oeiras, Portugal, 7Ross University School of Veterinary Medicine,
Basseterre, Saint Kitts and Nevis
Application The use of high-throughput proteomics is of high importance to the establishment of weight loss tolerance
biomarkers. These are of use in the establishment of adequate dairy goat selection strategies in the tropics. Seasonal weight
loss tolerance in mammary goats was found to be related to the expression of immunity system proteins.
Introduction Seasonal weight loss (SWL) is one the many constraints to animal production in tropical regions. In this
work, we used two different goat breeds from the Canary Islands (Spain) with common ancestors and contrasting levels of
adaptation to SWL: Majorera (adapted to SWL) and Palmera breed (not adapted to SWL) as described (Lerias et al., 2013).
In pasture conditions, Majorera goats are known to maintain their productive levels whereas Palmeras tend to experience
rapid production decreases. Accordingly, Majorera animals have been exported to the Sahel regions of Mauritania to
increase production levels of local goats (Lerias et al., 2015). The ultimate objective of this work was to study the effect of
SWL on the mammary gland secretory tissue proteome in these two goat breeds.
Material and methods Within each breed, goats with the same age and stage of lactation were divided into two groups:
control (constant weight) and underfed (15% liveweight reduction): PC (Palmera Control), MC, Majorera Control), PE
(Palmera Experimental) and ME (Majorera Experimental). Five animals were used in the Majorera groups and 4 animals
were used in the Palmera groups. At day 22, mammary gland biopsy samples wer
added to 500 µl of ammonium bicarbonate 50 mM, urea 8M, thiourea 2M buffer and homogenized, centrifuged and
supernatant recovered. Per sample, 15 µg of proteins were trypsin digested (FASP protocol) and desalted. Peptides were
loaded onto reverse-phase C18 columns and analysed on an LTQ-Orbitrap Velos mass spectrometer. Protein identification
and label free quantification were performed using Mascot (Matrixscience) and Progenesis software (Nonlinear Dynamics).
Results A total of 1010 proteins were identified, from which 96 proteins were considered statistically different (fold change
> 1.98 and P<0.05) between two of the possible comparisons between the four experimental groups: PC vs PE: 63 proteins;
MC vs ME: 57 proteins; MC vs PC: 13 proteins and ME vs PE: 19 proteins. After SWL, there was an increase of proteins
related to apoptosis and stress processes in both breeds. Moreover, both breeds showed a decrease in the number of proteins
related to protein, carbohydrates and fat biosynthesis. When both breeds were compared after SWL, the Majorera breed
showed higher expression of immune system related proteins compared to Palmera breed. In contrast, Palmera breed
showed higher expression of proteins related to apoptosis, ketone bodies formation (Fat liver) and protein metabolic
processes compared to Majorera breed.
Conclusion The two goat breeds have a different metabolism reaction to SWL, highlighting differences particularly related
to the immune system (higher expression in the tolerant breed) and apoptosis (higher expression in the susceptible breed).
Acknowledgements Financial support: project PTDC/CVT/116499/2010 (Fundação para a Ciência e a Tecnologia).
Collaboration in Sample collection: A. Morales-delaNuez, D. Martell-Jaizme, A. Suárez-Trujillo, P. Delgado-delOlmo and
G. Cugno.
References
Lérias JR, Hernández-Castellano LE, Morales-Delanuez A, Araújo SS, Castro N, Argüello A, Capote J, Almeida AM 2013.
Tropical Animal Health and Production, November 2013. 45 (8), 1731-6.
Lérias JR, Peña R, Hernández-Castellano LE, Capote J, Castro N, Argüello A, Araújo SS, Saco Y, Bassols A, Almeida AM
2015. The Journal of Dairy Research, November 2015. 82(4), 416-25.
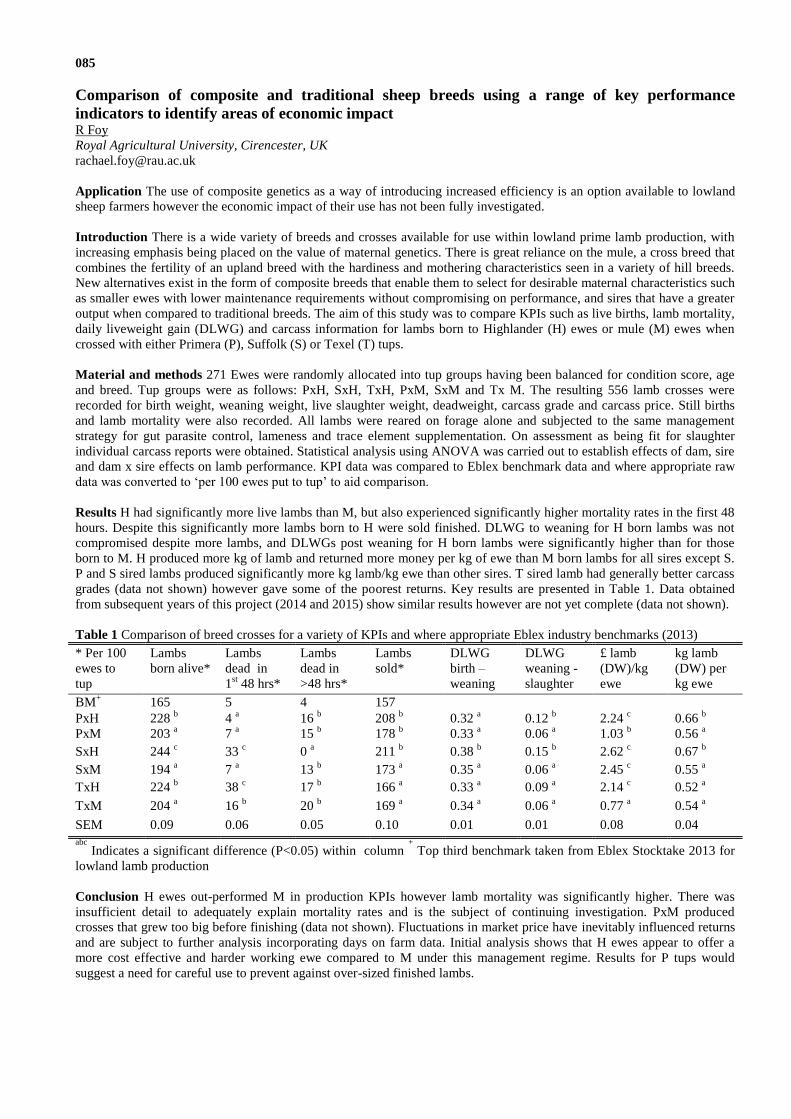
085
Comparison of composite and traditional sheep breeds using a range of key performance
indicators to identify areas of economic impact R Foy
Royal Agricultural University, Cirencester, UK
Application The use of composite genetics as a way of introducing increased efficiency is an option available to lowland
sheep farmers however the economic impact of their use has not been fully investigated.
Introduction There is a wide variety of breeds and crosses available for use within lowland prime lamb production, with
increasing emphasis being placed on the value of maternal genetics. There is great reliance on the mule, a cross breed that
combines the fertility of an upland breed with the hardiness and mothering characteristics seen in a variety of hill breeds.
New alternatives exist in the form of composite breeds that enable them to select for desirable maternal characteristics such
as smaller ewes with lower maintenance requirements without compromising on performance, and sires that have a greater
output when compared to traditional breeds. The aim of this study was to compare KPIs such as live births, lamb mortality,
daily liveweight gain (DLWG) and carcass information for lambs born to Highlander (H) ewes or mule (M) ewes when
crossed with either Primera (P), Suffolk (S) or Texel (T) tups.
Material and methods 271 Ewes were randomly allocated into tup groups having been balanced for condition score, age
and breed. Tup groups were as follows: PxH, SxH, TxH, PxM, SxM and Tx M. The resulting 556 lamb crosses were
recorded for birth weight, weaning weight, live slaughter weight, deadweight, carcass grade and carcass price. Still births
and lamb mortality were also recorded. All lambs were reared on forage alone and subjected to the same management
strategy for gut parasite control, lameness and trace element supplementation. On assessment as being fit for slaughter
individual carcass reports were obtained. Statistical analysis using ANOVA was carried out to establish effects of dam, sire
and dam x sire effects on lamb performance. KPI data was compared to Eblex benchmark data and where appropriate raw
data was converted to ‘per 100 ewes put to tup’ to aid comparison.
Results H had significantly more live lambs than M, but also experienced significantly higher mortality rates in the first 48
hours. Despite this significantly more lambs born to H were sold finished. DLWG to weaning for H born lambs was not
compromised despite more lambs, and DLWGs post weaning for H born lambs were significantly higher than for those
born to M. H produced more kg of lamb and returned more money per kg of ewe than M born lambs for all sires except S.
P and S sired lambs produced significantly more kg lamb/kg ewe than other sires. T sired lamb had generally better carcass
grades (data not shown) however gave some of the poorest returns. Key results are presented in Table 1. Data obtained
from subsequent years of this project (2014 and 2015) show similar results however are not yet complete (data not shown).
Table 1 Comparison of breed crosses for a variety of KPIs and where appropriate Eblex industry benchmarks (2013)
* Per 100
ewes to
tup
Lambs
born alive*
Lambs
dead in
1st 48 hrs*
Lambs
dead in
>48 hrs*
Lambs
sold*
DLWG
birth –
weaning
DLWG
weaning -
slaughter
£ lamb
(DW)/kg
ewe
kg lamb
(DW) per
kg ewe
BM+ 165 5 4 157
PxH 228 b 4
a 16
b 208
b 0.32
a 0.12
b 2.24
c 0.66
b
PxM 203 a 7
a 15
b 178
b 0.33
a 0.06
a 1.03
b 0.56
a
SxH 244 c 33
c 0
a 211
b 0.38
b 0.15
b 2.62
c 0.67
b
SxM 194 a 7
a 13
b 173
a 0.35
a 0.06
a 2.45
c 0.55
a
TxH 224 b 38
c 17
b 166
a 0.33
a 0.09
a 2.14
c 0.52
a
TxM 204 a 16
b 20
b 169
a 0.34
a 0.06
a 0.77
a 0.54
a
SEM 0.09 0.06 0.05 0.10 0.01 0.01 0.08 0.04
abc
Indicates a significant difference (P<0.05) within column +
Top third benchmark taken from Eblex Stocktake 2013 for
lowland lamb production
Conclusion H ewes out-performed M in production KPIs however lamb mortality was significantly higher. There was
insufficient detail to adequately explain mortality rates and is the subject of continuing investigation. PxM produced
crosses that grew too big before finishing (data not shown). Fluctuations in market price have inevitably influenced returns
and are subject to further analysis incorporating days on farm data. Initial analysis shows that H ewes appear to offer a
more cost effective and harder working ewe compared to M under this management regime. Results for P tups would
suggest a need for careful use to prevent against over-sized finished lambs.

086
Genomic regions underlying bovine tuberculosis resistance in Holstein Friesian dairy cattle K Raphaka
1, O Matika
1, E Sanchez-Molano
1, R Mrode
2, M P Coffey
2, V Riggio
1, L Glass
1, J A Woolliams
1, G Banos
1,2
1The Roslin Institute and R(D)SVS, University of Edinburgh, Midlothian, UK,
2Scotland's Rural College, The Roslin
Institute Building, Midlothian, UK
Application Genomic regions harbouring genes associated with resistance to bovine tuberculosis were identified. This
information may be used to develop breeding strategies to enhance disease resistance.
Introduction Bovine tuberculosis (bTB) has resulted in high social and economic losses in the UK despite longstanding
eradication schemes. However, within animal variation in cattle susceptibility to the disease has led to the exploration of
alternative control methods, one of which is selecting and breeding cattle for bTB resistance to augment existing control
measures. Although many genome-wide association studies (GWAS) aiming at identifying genes underlying cattle
resistance to bTB have been undertaken in different populations, none to date has identified any major common
quantitative trait locus. The objective of the present study was to conduct a genomic analysis for bTB resistance in Holstein
Friesian dairy cattle in Great Britain.
Material and methods Data consisted of genetic evaluation results for bTB resistance that had been based on skin test and
post mortem examination records; the latter were provided by the Animal and Plant Health Agency. De-regressed estimated
breeding values (EBVs) of Holstein Friesian bulls were calculated as per the procedure of Garrick et al. (2009) and 804 of
these bulls were genotyped with the 50K Illumina Bovine chip. A total of 56,134 SNPs were available per animal. After
quality control, where SNPs with MAF <0.02, SNP or animal call rate <0.95 and deviation from HWE <10-6
were
excluded, 36,643 SNPs and 799 individual bulls were kept. De-regressed EBVs of these bulls and the genomic relationship
matrix were included in GWAS using the GenABEL software (Aulchenko et al. 2007). In addition, Regional Heritability
Mapping was conducted considering genomic regions comprising 100 Ps per ‘window’, overlapping by 0 Ps
(Nagamine et al. 2012). Gene annotation was based on the Bos_taurus_UMD_3.1.1
(http://www.ncbi.nlm.nih.gov/genome/82).
Results Two SNPs on chromosomes 2 and 11 were significantly associated with bTB at chromosome-wide significance
level (Figure 1). The estimated polygenic heritability for resistance to bTB was 0.39 ± 0.07, while the proportion of
variance explained by the two SNPs was 0.02 and 0.11, respectively. A genomic region consisting of 100 SNPs, also found
on chromosome 2, had suggestive association with bTB resistance. This region accounted for 0.04 of the total variance. The
most plausible candidate gene falling within this region, integrin alpha 4, is a protein coding gene previously associated
with monocyte count in white blood cells, which play an important role in response to inflammation.
Figure 1 Manhattan plot displaying –log10 of P-values of association of each SNP to the phenotype.
Conclusion Genomic regions associated with bTB resistance and a plausible candidate gene were identified, offering the
potential to assist in understanding the pathways critical to cattle resistance to bTB. Validation of these regions and
associated genes with independent data is warranted.
Acknowledgements AHDB (Dairy) for funding the genetic evaluations, APHA for providing data, and BBSRC and the
UK Commonwealth Scholarship Commission for funding this work.
References
Aulchenko, Y.S., Ripke, S., Isaacs, A., van Duijn, C.M. 2007. Bioinformatics 23(10), 1294-1296.
Garrick D.J., Taylor, J.F., Fernando, R.L. 2009. Genetics Selection Evolution 41, 55.
Nagamine, Y., Pong-Wong, R., Navarro, P., Vitart, V., Hayward, C., Rudan, I., Campbell, H., Wilson, J., Wild, S., Hicks,
A.A., Pramstaller, P.P., Hastie, N., Wright, A.F., Haley, C.S. 2012. PLoS ONE 7(10), e46501.

087
Polymorphisms in genes regulating aspects of innate immunity are associated with life
expectancy in a population of UK Holstein dairy cows X Chen
1,2, G E Pollott
1, Z Cheng
1, D Werling
1, S J Zhang
1,2, D C Wathes
1
1Royal Veterinary College, London, UK,
2Huazhong Agricultural University, Wuhan, China
Application Life expectancy was correlated with coding differences in genes with key roles in innate immunity. Selective
breeding of cows for a “better” innate immune response is a promising way to reduce disease incidence in dairy
populations.
Introduction Mastitis, infertility and lameness are the three major reasons for involuntary culling of dairy cows. These
conditions all reduce life expectancy in the herd, which is in turn a major determinant of profitability (Kossaibati and
Esslemont, 2000). We initially undertook a review of the literature and databases to identify key genes involved in the
regulation of innate immune responses which are associated with the risk of a cow having a raised somatic cell count (SCC)
or developing clinical mastitis (Chen et al. 2015). This highlighted a number of genes relating to granulocyte adhesion and
diapedesis signaling and the ephrin receptor signaling pathway. These genes are important regulators of the early innate
immune response by controlling granulocyte recruitment and migration to infected tissues and subsequently an
inflammatory response. The candidate gene list included SELE, SELP, SELL (all adhesion molecules involved in
granulocyte diapedesis), TREM1 (encoding an Ig superfamily receptor expressed on myeloid cells such as granolucytes and
important for amplifying inflammatory responses) and RelA (a member of the NF-kappaB family of transcription factors
which co-ordinate regulation of host defense). The SNP rs41579632 was also studied as it had previously been associated
with clinical mastitis in Norwegian Red cattle (Sodeland et al., 2011).
Material and methods DNA from a well characterised population of 337 Holstein cows from 19 UK herds (Brickell and
Wathes, 2011 ) was used to sequence a number of candidate genes with a known role in innate immunity and to determine
SNP incidence. Associations between genotype, SCC, diseases recorded in the first lactation and survival time in the herd
were calculated. SCC was taken as either a quantitative (mean lactation SCC) or binary trait (affected v unaffected;
SCCbin). All analyses were performed using a 3 x 2 (genotype by status) chi-squared model except for the mean SCC
analysis which was carried out on environmental residuals (Aulechenko et al., 2007) with an allele substitution model in
PLINK. Fisher’s exact test was used for binary traits. Differences between genotypes in the life expectancy of animals
with each SNP were measured by Kaplan-Meier survival analysis. Censored animals were those that survived until the end
of their second lactation. The proportions of cows censored were compared using the Cox proportional hazards regression
model.
Results The initial sequencing identified 8 SNP in SELP, 3 in SELL, 1 in SELE, 2 in TREM1 and 1 in RelA. From these, 5
SNP in SELP, 2 in SELL, 1 in SELE, 2 in TREM1 and 1 in RelA in addition to rs41579632 were taken forward for
analysis, giving a total of 12 SNP. None of the SNP tested showed significant associations with SCC by any of the
analytical methods used (P>0.1), apart from RelA-intron5 with SCCbin (P=0.08). Two SNP in SELP in exons 4 and 8
demonstrated significant differences between genotypes with a variety of health traits including mastitis, uterine disease
and lameness (P=0.01-0.05). SELL-EX3 was associated with uterine disease (P=0.02). As results on health traits indicated
that the same SNP were associated with several disparate diseases, a survival analysis was next performed. Three SNP
(SELP-EXON4, TREM1-UTR and RelA-intron5) all showed significant associations with survival to the third lactation
(P= 0.02, 0.04 and 0.003 respectively). In all cases the differences in life expectancy according to genotype became more
pronounced from about 4 years of age, when most cows would be in their second lactation.
Conclusion Our results support the concept that coding differences in SELP, SELL, TREM1 and RelA can impact on the
life expectancy of Holstein dairy cows, potentially through altered functions of granulocytes, the first line of cells involved
in the defence to invading pathogens. Functional differences in this cell type may impact on the susceptibility of the host to
a variety of diseases which lead to earlier culling, particularly from the second lactation onwards.
Acknowledgements The authors are grateful to the European Commission Marie Curie Actions for their support.
References
Aulchenko, Y.S., de Koning, D. J. and Haley, C. 2007. Genetics 177, 577-585.
Brickell, J.S. and Wathes, D.C. 2011. Journal of Dairy Science 94, 1831-1838.
Chen, X., Cheng, Z., Zhang, S., Werling, D. and Wathes, D.C. 2015. Open Journal of Animal Sciences 5, 358-393.
Sodeland, M., Kent, M.P., Olsen, H.G., Opsal, M.A., Svendsen, M., et al. 2011 Animal Genetics 42, 457-465.
Kossaibati, M.A. and Esslemont, R.J. 2000. The Veterinary Journal 154, 41-51.
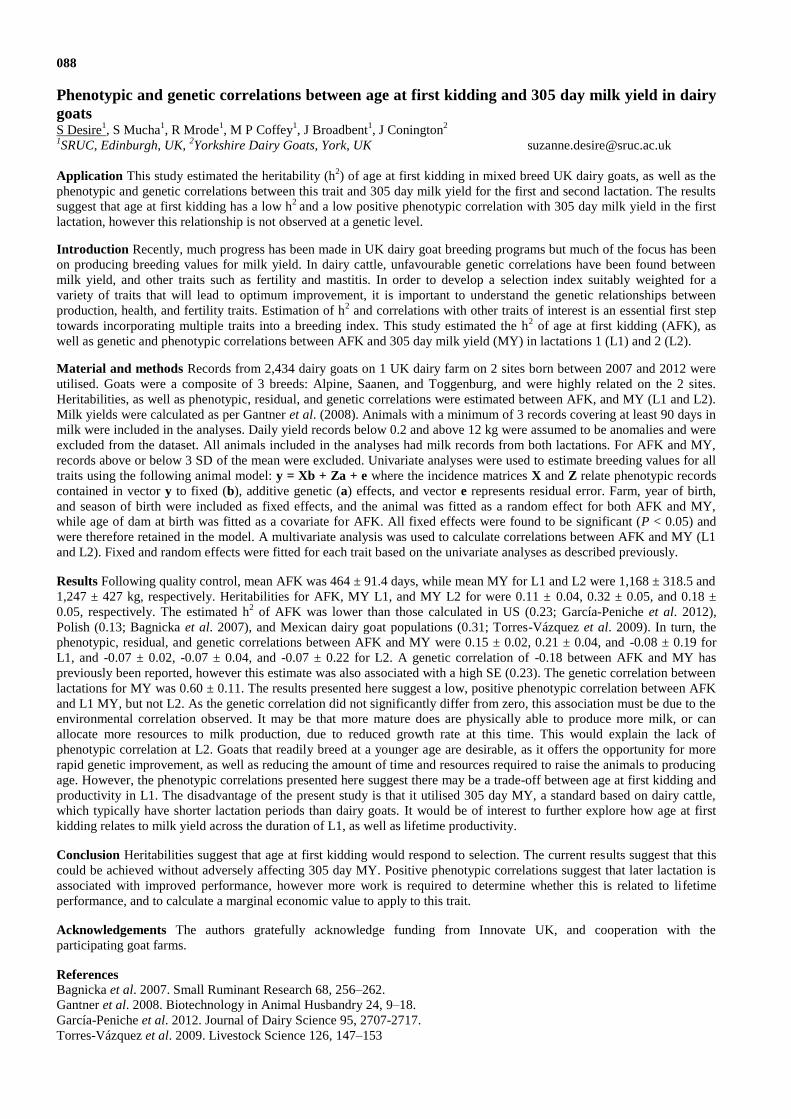
088
Phenotypic and genetic correlations between age at first kidding and 305 day milk yield in dairy
goats S Desire
1, S Mucha
1, R Mrode
1, M P Coffey
1, J Broadbent
1, J Conington
2
1SRUC, Edinburgh, UK,
2Yorkshire Dairy Goats, York, UK [email protected]
Application This study estimated the heritability (h2) of age at first kidding in mixed breed UK dairy goats, as well as the
phenotypic and genetic correlations between this trait and 305 day milk yield for the first and second lactation. The results
suggest that age at first kidding has a low h2
and a low positive phenotypic correlation with 305 day milk yield in the first
lactation, however this relationship is not observed at a genetic level.
Introduction Recently, much progress has been made in UK dairy goat breeding programs but much of the focus has been
on producing breeding values for milk yield. In dairy cattle, unfavourable genetic correlations have been found between
milk yield, and other traits such as fertility and mastitis. In order to develop a selection index suitably weighted for a
variety of traits that will lead to optimum improvement, it is important to understand the genetic relationships between
production, health, and fertility traits. Estimation of h2 and correlations with other traits of interest is an essential first step
towards incorporating multiple traits into a breeding index. This study estimated the h2 of age at first kidding (AFK), as
well as genetic and phenotypic correlations between AFK and 305 day milk yield (MY) in lactations 1 (L1) and 2 (L2).
Material and methods Records from 2,434 dairy goats on 1 UK dairy farm on 2 sites born between 2007 and 2012 were
utilised. Goats were a composite of 3 breeds: Alpine, Saanen, and Toggenburg, and were highly related on the 2 sites.
Heritabilities, as well as phenotypic, residual, and genetic correlations were estimated between AFK, and MY (L1 and L2).
Milk yields were calculated as per Gantner et al. (2008). Animals with a minimum of 3 records covering at least 90 days in
milk were included in the analyses. Daily yield records below 0.2 and above 12 kg were assumed to be anomalies and were
excluded from the dataset. All animals included in the analyses had milk records from both lactations. For AFK and MY,
records above or below 3 SD of the mean were excluded. Univariate analyses were used to estimate breeding values for all
traits using the following animal model: y = Xb + Za + e where the incidence matrices X and Z relate phenotypic records
contained in vector y to fixed (b), additive genetic (a) effects, and vector e represents residual error. Farm, year of birth,
and season of birth were included as fixed effects, and the animal was fitted as a random effect for both AFK and MY,
while age of dam at birth was fitted as a covariate for AFK. All fixed effects were found to be significant (P < 0.05) and
were therefore retained in the model. A multivariate analysis was used to calculate correlations between AFK and MY (L1
and L2). Fixed and random effects were fitted for each trait based on the univariate analyses as described previously.
Results Following quality control, mean AFK was 464 ± 91.4 days, while mean MY for L1 and L2 were 1,168 ± 318.5 and
1,247 ± 427 kg, respectively. Heritabilities for AFK, MY L1, and MY L2 for were 0.11 ± 0.04, 0.32 ± 0.05, and 0.18 ±
0.05, respectively. The estimated h2 of AFK was lower than those calculated in US (0.23; García-Peniche et al. 2012),
Polish (0.13; Bagnicka et al. 2007), and Mexican dairy goat populations (0.31; Torres-Vázquez et al. 2009). In turn, the
phenotypic, residual, and genetic correlations between AFK and MY were 0.15 ± 0.02, 0.21 ± 0.04, and -0.08 ± 0.19 for
L1, and -0.07 ± 0.02, -0.07 ± 0.04, and -0.07 ± 0.22 for L2. A genetic correlation of -0.18 between AFK and MY has
previously been reported, however this estimate was also associated with a high SE (0.23). The genetic correlation between
lactations for MY was 0.60 ± 0.11. The results presented here suggest a low, positive phenotypic correlation between AFK
and L1 MY, but not L2. As the genetic correlation did not significantly differ from zero, this association must be due to the
environmental correlation observed. It may be that more mature does are physically able to produce more milk, or can
allocate more resources to milk production, due to reduced growth rate at this time. This would explain the lack of
phenotypic correlation at L2. Goats that readily breed at a younger age are desirable, as it offers the opportunity for more
rapid genetic improvement, as well as reducing the amount of time and resources required to raise the animals to producing
age. However, the phenotypic correlations presented here suggest there may be a trade-off between age at first kidding and
productivity in L1. The disadvantage of the present study is that it utilised 305 day MY, a standard based on dairy cattle,
which typically have shorter lactation periods than dairy goats. It would be of interest to further explore how age at first
kidding relates to milk yield across the duration of L1, as well as lifetime productivity.
Conclusion Heritabilities suggest that age at first kidding would respond to selection. The current results suggest that this
could be achieved without adversely affecting 305 day MY. Positive phenotypic correlations suggest that later lactation is
associated with improved performance, however more work is required to determine whether this is related to lifetime
performance, and to calculate a marginal economic value to apply to this trait.
Acknowledgements The authors gratefully acknowledge funding from Innovate UK, and cooperation with the
participating goat farms.
References Bagnicka et al. 2007. Small Ruminant Research 68, 256–262.
Gantner et al. 2008. Biotechnology in Animal Husbandry 24, 9–18.
García-Peniche et al. 2012. Journal of Dairy Science 95, 2707-2717.
Torres-Vázquez et al. 2009. Livestock Science 126, 147–153

089
Genomic selection for conformation traits in UK dairy goats S Mucha
1, R Mrode
1,2, M P Coffey
1, J Conington
1
1SRUC, Edinburgh, UK,
2International Livestock Institute, Nairobi, Kenya
Application This paper presents the first implementation of genomic selection for conformation in UK dairy goats. This is
to ensure that improvements in productivity are accompanied by improvements in functional conformation traits relating to
locomotion and milking.
Introduction Conformation traits are of interest to dairy goat breeders not only as descriptive traits, but also because of
their influence on production, longevity and profitability. As these traits often have low heritability (McLaren et al., 2016)
and are expensive to score, the application of genomic technology could potentially offer significant benefits for breeders.
The objective of this study was to estimate genomic breeding values for 9 conformation traits (from groups of udder, teat,
legs, and feet).
Material and methods The research was based on data provided by two sites of one commercial goat farm in the UK
comprising scores for udder (udder furrow, udder depth, udder attachment), teat (teat shape, teat angle, teat placement),
back legs and feet (front feet, and back feet) conformation on 6,723 goats. The pedigree file contained 37,462 individuals.
In total 4518 animals with phenotypes were genotyped with the Illumina 50K caprine chip. The training population had
between 76 and 498 animals (trait dependent), whereas validation populations had between 22 and 896 animals. Genomic
breeding values were estimated using single-step BLUP (Legarra et al., 2009; Misztal et al., 2009). The software package
BLUPf90 (Misztal et al., 2002) was used to fit the following model: y = Xb + Za + e
where: y = vector of observations for the analysed conformation score; b = vector of fixed effects: farm, lactation stage,
birth year, scoring year and scorer; a = vector of random additive animal effects; e = vector of random residuals. X and Z =
incidence matrices. Random effects were assumed to be normally distributed with zero means and the following covariance
structure:
2
2
0
0
e
aVar
I
H
e
a
where I is an identity matrix, and H is a relationship matrix calculated by blending Van Raden’s (2008) genomic
relationship matrix G and pedigree relationship matrix A. The model was parameterised with (co) variance components
estimated in a previous study (McLaren et al., 2016). Accuracy of genomic predictions was calculated as a correlation
between the GEBVs and de-regressed EBVs for a given conformation trait.
Results Accuracy of genomic breeding values was between 0.23-0.39 for udder, 0.18-0.48 for teat, 0.04-0.55 for legs and
feet conformation. The respective regression coefficients were between 0.13-0.35 for udder, 0.15-0.52 for teat, and 0.05-
0.61 for legs and feet conformation. Accuracy obtained for the analysed conformation traits was lower than the accuracy of
GEBVs for milk yield of 0.61 (Mucha et al., 2015). This is mainly due to small size of the reference population and lower
heritability of the traits in the current study.
Conclusion This is the first estimation of genomic breeding values for conformation traits in UK dairy goats. Due to the
small size of the reference population for the conformation traits, these preliminary results should be treated with caution
and will be re-estimated as the reference population expands towards 12,000 goats and more phenotypes become available.
Current results indicate that the single-step methodology maximises accuracy, which is important particularly for traits with
lower heritability and with a small reference population.
Acknowledgements
The authors gratefully acknowledge funding from Innovate UK, and cooperation with the participating goat farms.
References
Legarra, A., Aguilar, I. and Misztal, I. 2009. Journal of Dairy Science 92, 4656–4663.
McLaren, A., Mucha, S., Mrode, R., Coffey, M. and Conington, J. 2016. Journal of Dairy Science in press.
Misztal, I., Tsuruta, S., Strabel, T., Auvray, B., Druet, T. and Lee, D. H. 2002. 7th World Congress on Genetics Applied to
Livestock Production, Montpellier, France.
Misztal, I., Legarra, A. and Aguilar, I. 2009. Journal of Dairy Science 92, 4648–4655
Mucha, S., Mrode, R., MacLaren-Lee, I., Coffey, M. and Conington, J. 2015. Journal of Dairy Science 98, 8201–8208.
VanRaden, P. M. 2008. Journal of Dairy Science 91, 4414–4423.

090
Detection and utility of ancestral haplotypes in cattle breeds E Sánchez-Molano
1, D Tsiokos
2, D Chatziplis
2, H Jorjani
3, E Nicolazzi
4, G Banos
1,5
1The Roslin Institute and R(D)SVS. University of Edinburgh, UK,
2School of Agricultural Technology, Food Technology
and Nutrition. ATEITH, Thessaloniki, Greece, 3Interbull Center, Uppsala, Sweden,
4FPTP, Lodi, Italy,
5SRUC, Edinburgh, UK
Application The study of ancestral haplotypes identifies regional variants of potential interest in selection programmes to
improve productivity and fitness. It also provides information regarding population history to be used in management.
Introduction In cattle, intense selection has led to the development of strong linkage disequilibrium with different patterns
across breeds. The analysis of ancestral haplotypes is expected to provide information about the evolutionary history of
diverse populations and identify regions of common interest for both conservation and breeding programmes. The main
objective of the present study was to develop a simple procedure to detect ancestral haplotypes in populations with genetic
links. The procedure was applied to Fleckvieh, Simmental and Brown-Swiss population data. Regions of common interest
were identified and patterns of the population history and dynamics were assessed.
Material and methods
Fleckvieh/Simmental dataset: 473 bulls genotyped for 714,759 Single Nucleotide Polymorphisms (SNPs) with Fleckvieh
(315 bulls) and Simmental (158 bulls) being treated as different populations with up to 7 generations.
Brown-Swiss dataset: 412 bulls genotyped for 714,759 SNPs and with each of the five involved countries considered as a
different population: Austria (21 bulls. 6 generations), Germany (54 bulls. 6 generations), Italy (77 bulls. 7 generations),
Switzerland (184 bulls. 7 generations) and USA (77 bulls. 7 generations).
Analysis: Genotypes were phased using clusters of 100 SNPs. Within each population, haplotypes in the base (oldest)
generation were identified in each cluster and considered as ancestral. In subsequent generations, ancestral haplotype
frequency and average similarity (molecular co-ancestry) was estimated and averaged across all clusters. Linear regression
was used to assess trends in frequency and co-ancestry across time. Haplotype variability was computed as the average
number of haplotypes identified per cluster, and ancestral haplotypes identified in a given population were also traced in
others to assess the shared percentage.
Results A higher haplotype variability (71.55) and reduced co-ancestry trend (b=7.43x10⁻⁵
) was observed for Fleckvieh
than for Simmental (44.98 and b=4.18x10⁻⁴
, respectively). This is contrary to what might have been expected from the
origin of Fleckvieh (imported nucleus of Simmental cattle into Germany and Austria). Possible explanations are the
enrichment of Simmental haplotypes with local breed haplotypes during the formation of the Fleckvieh breed and an
unbalanced genetic flow between the two populations. Both explanations are concordant with the history of Fleckvieh.
The Brown-Swiss breed originated in Switzerland and was exported to USA in 1869, where it was intensively selected and
exported back into Italy, Germany and Austria. In concordance, the Swiss population showed the highest variability (37.22)
and a low proportion of shared ancestral haplotypes with other European populations (5.8% ± 1.09), but also a high shared
proportion with the USA population (33.19%). Furthermore, the non-Swiss European populations and the USA population
had similar proportions of shared ancestral haplotypes (9.33% ± 1.76 and 11.58% ± 1.98, respectively).
The analysis of the most common ancestral haplotypes (Table 1) also revealed selection signatures in the populations, in
agreement with previous studies (Mészáros et al., 2015; Stella et al., 2010) and showing interesting genes closer than 0.3
Mb of the most frequent haplotypes.
Table 1 Analysis of the top 5 common ancestral haplotypes in Fleckvieh (Fleck), Simmental (Sim) and Brown-Swiss (BS)
Chr Breeds (number of haplotypes) Related genes (function)
5 Sim (2), BS (2) SYT10 (longevity/maturity), PMEL and ERBB5 (coat colour)
6 Fleck (3), Sim (3), BS (5) MEP6, ISBP, LAP3, MED28 (milk protein/fat) and KIT (coat colour)
7 Fleck (2) Previous QTL detected for milk production
21 BS (1) MEF2A (milk production)
Conclusion Detection of ancestral haplotypes has led to the identification of signatures of selection in three common cattle
breeds, mirroring also their population dynamics.
Acknowledgements The authors gratefully acknowledge funding and support from the EU 7th Framework Program (n°
289592 - Gene2Farm) and the ISP Grant BB/J004235/1 of the BBSRC.
References
Mészáros, G., Petautschnig, E., Schwarzenbacher, H., and Sölkner, J. 2015. Animal Genetics 46, 65-68.
Stella, A., Ajmone-Marsan, P., Lazzari, B., and Boettcher P. 2010. Genetics 185, 1451-1461.

091
Random regression analysis to determine herd profiles for carcass weight in UK beef cattle T M Englishby
1,2, D P Berry
2, K L Moore
1, M P Coffey
1, G Banos
1
1SRUC, Edinburgh, UK,
2Teagasc, Moorepark, Cork, Ireland
Application Knowledge of the variability in herd performance across years, by drawing inferences from carcass weight at
slaughter, could be used as a management tool to monitor herd performance.
Introduction Random regression models can provide information of the genetic variability in carcass weight across a given
time trajectory defined by age at slaughter. Random regression models also allow for modelling of herd-specific deviations
to describe differences in growth curves across herds (De Roos et al., 2004). The objective of the present study was to
determine growth curve and herd curve parameters, using a random regression model, for carcass weight measured on
young bulls across multiple breeds.
Material and methods Carcass trait information was available on 58,655 bulls from 2,387 UK herds slaughtered between
2002 and 2012. Records from bulls slaughtered <12 months or >24 months of age were discarded as were bulls with no
known sire or dam. Records outside ±4 standard deviations from the mean carcass weight or age at slaughter were
discarded. Dam records were restricted to parity 1 to 10, and parity was categorised as 1, 2, , 4, and ≥ . nly records from
sires with at least 5 progeny records were retained. Two contemporary groups were defined 1) abattoir-date of slaughter,
and 2) finishing herd-year of slaughter; only contemporary groups with five or more records were retained. Following edits,
22,971 young bulls from 2,239 sires remained. A random regression model was fitted in AsReml (Gilmour et al., 2009). A
fixed effect of age at slaughter was modelled with a Legendre polynomial and reflected the fixed curve. Other fixed effects
included breed of sire and breed of dam, parity of the dam, contemporary group of abattoir-date of slaughter as well as
heterosis and recombination coefficients of the animal. Random effects included the sire of the animal and the
contemporary group of finishing herd-year of slaughter; both were modelled across age at slaughter with Legendre
polynomials. Random effects reflected individual deviations from the fixed curve. The random residual term was modelled
as heterogeneous across age at slaughter classes. Covariance function coefficients were estimated using the variance
covariance matrix and the matrix of Legendre polynomials: G = ’K where G is the variance covariance matrix for
slaughter ages, is the matrix of Legendre polynomial age regression coefficients, and K is the estimated variance
covariance matrix of the random polynomial coefficients Ka or Khy.; Khy is the estimated finishing herd-year of slaughter
variance covariance matrix; Ka is the estimated genetic variance covariance matrix multiplied by four to transform from a
sire variance to a genetic variance.
Results The average (standard deviation in parentheses) carcass weight and age at slaughter across the data was 354.3
(52.2) kg and 454.8 (51.4) days, respectively. A random quadratic Legendre polynomial on sire and a random linear
Legendre polynomial on finishing herd-year of slaughter fitted the data best. The heritability of carcass weight (standard
error in parentheses) was least (i.e., 0.19; se=0.04) at 673 days of age and greatest (0.25; se=0.02) at 536 days of age
indicating that sufficient genetic variation exists for selection on this trait (Fig. 1). Finishing herd curve variance (standard
error in parentheses) ranged from 802.63 (70.98) units2 to 1594.90 (172.19) units
2 for carcass weight (Fig. 2). Analysis of
eigenvalues of finishing herd-year covariance across age at slaughter, revealed considerable variation between herds in
their growth curve parameters for carcass weight.
Conclusion Random regression models can be used to model herd variance in carcass weight across an age trajectory.
Considerable variation exists between herds in their growth curve parameters for carcass weight, reflecting different
management practices.
References
De Roos, A. P. W., Journal of Dairy Science 87, 2693-2701.
Gilmour, A. R., Gogel, B. J., Cullis, B. R., and Thompson, R. 2009. ASReml user guide release 3.0.
Figure 2 Herd curve variance estimates for carcass weight
across age at slaughter. Standard errors ranged from 68.93
to 172.19.
Figure 1 Estimated animal genetic variances for carcass
weight across age at slaughter. Standard errors ranged
from 0.02 to 0.06.
0.150.180.210.240.270.3
360 410 460 510 560 610 660
He
rita
bili
ty
Age (days)
600
1100
1600
360 410 460 510 560 610 660
He
rd c
urv
e
vari
ance
(u
nit
s2)
Age (days)
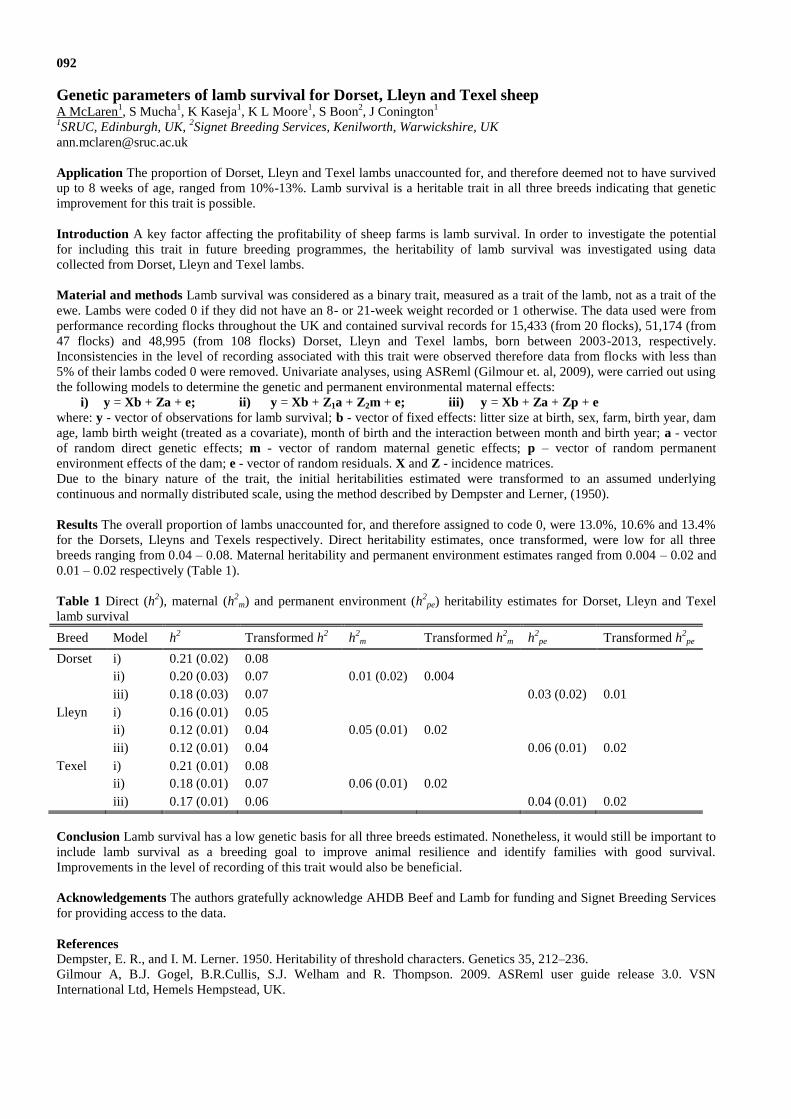
092
Genetic parameters of lamb survival for Dorset, Lleyn and Texel sheep A McLaren
1, S Mucha
1, K Kaseja
1, K L Moore
1, S Boon
2, J Conington
1
1SRUC, Edinburgh, UK,
2Signet Breeding Services, Kenilworth, Warwickshire, UK
Application The proportion of Dorset, Lleyn and Texel lambs unaccounted for, and therefore deemed not to have survived
up to 8 weeks of age, ranged from 10%-13%. Lamb survival is a heritable trait in all three breeds indicating that genetic
improvement for this trait is possible.
Introduction A key factor affecting the profitability of sheep farms is lamb survival. In order to investigate the potential
for including this trait in future breeding programmes, the heritability of lamb survival was investigated using data
collected from Dorset, Lleyn and Texel lambs.
Material and methods Lamb survival was considered as a binary trait, measured as a trait of the lamb, not as a trait of the
ewe. Lambs were coded 0 if they did not have an 8- or 21-week weight recorded or 1 otherwise. The data used were from
performance recording flocks throughout the UK and contained survival records for 15,433 (from 20 flocks), 51,174 (from
47 flocks) and 48,995 (from 108 flocks) Dorset, Lleyn and Texel lambs, born between 2003-2013, respectively.
Inconsistencies in the level of recording associated with this trait were observed therefore data from flocks with less than
5% of their lambs coded 0 were removed. Univariate analyses, using ASReml (Gilmour et. al, 2009), were carried out using
the following models to determine the genetic and permanent environmental maternal effects:
i) y = Xb + Za + e; ii) y = Xb + Z1a + Z2m + e; iii) y = Xb + Za + Zp + e
where: y - vector of observations for lamb survival; b - vector of fixed effects: litter size at birth, sex, farm, birth year, dam
age, lamb birth weight (treated as a covariate), month of birth and the interaction between month and birth year; a - vector
of random direct genetic effects; m - vector of random maternal genetic effects; p – vector of random permanent
environment effects of the dam; e - vector of random residuals. X and Z - incidence matrices.
Due to the binary nature of the trait, the initial heritabilities estimated were transformed to an assumed underlying
continuous and normally distributed scale, using the method described by Dempster and Lerner, (1950).
Results The overall proportion of lambs unaccounted for, and therefore assigned to code 0, were 13.0%, 10.6% and 13.4%
for the Dorsets, Lleyns and Texels respectively. Direct heritability estimates, once transformed, were low for all three
breeds ranging from 0.04 – 0.08. Maternal heritability and permanent environment estimates ranged from 0.004 – 0.02 and
0.01 – 0.02 respectively (Table 1).
Table 1 Direct (h2), maternal (h
2m) and permanent environment (h
2pe) heritability estimates for Dorset, Lleyn and Texel
lamb survival
Breed Model h2 Transformed h
2 h
2m Transformed h
2m h
2pe Transformed h
2pe
Dorset i) 0.21 (0.02) 0.08
ii) 0.20 (0.03) 0.07 0.01 (0.02) 0.004
iii) 0.18 (0.03) 0.07 0.03 (0.02) 0.01
Lleyn i) 0.16 (0.01) 0.05
ii) 0.12 (0.01) 0.04 0.05 (0.01) 0.02
iii) 0.12 (0.01) 0.04 0.06 (0.01) 0.02
Texel i) 0.21 (0.01) 0.08
ii) 0.18 (0.01) 0.07 0.06 (0.01) 0.02
iii) 0.17 (0.01) 0.06 0.04 (0.01) 0.02
Conclusion Lamb survival has a low genetic basis for all three breeds estimated. Nonetheless, it would still be important to
include lamb survival as a breeding goal to improve animal resilience and identify families with good survival.
Improvements in the level of recording of this trait would also be beneficial.
Acknowledgements The authors gratefully acknowledge AHDB Beef and Lamb for funding and Signet Breeding Services
for providing access to the data.
References
Dempster, E. R., and I. M. Lerner. 1950. Heritability of threshold characters. Genetics 35, 212–236.
Gilmour A, B.J. Gogel, B.R.Cullis, S.J. Welham and R. Thompson. 2009. ASReml user guide release 3.0. VSN
International Ltd, Hemels Hempstead, UK.
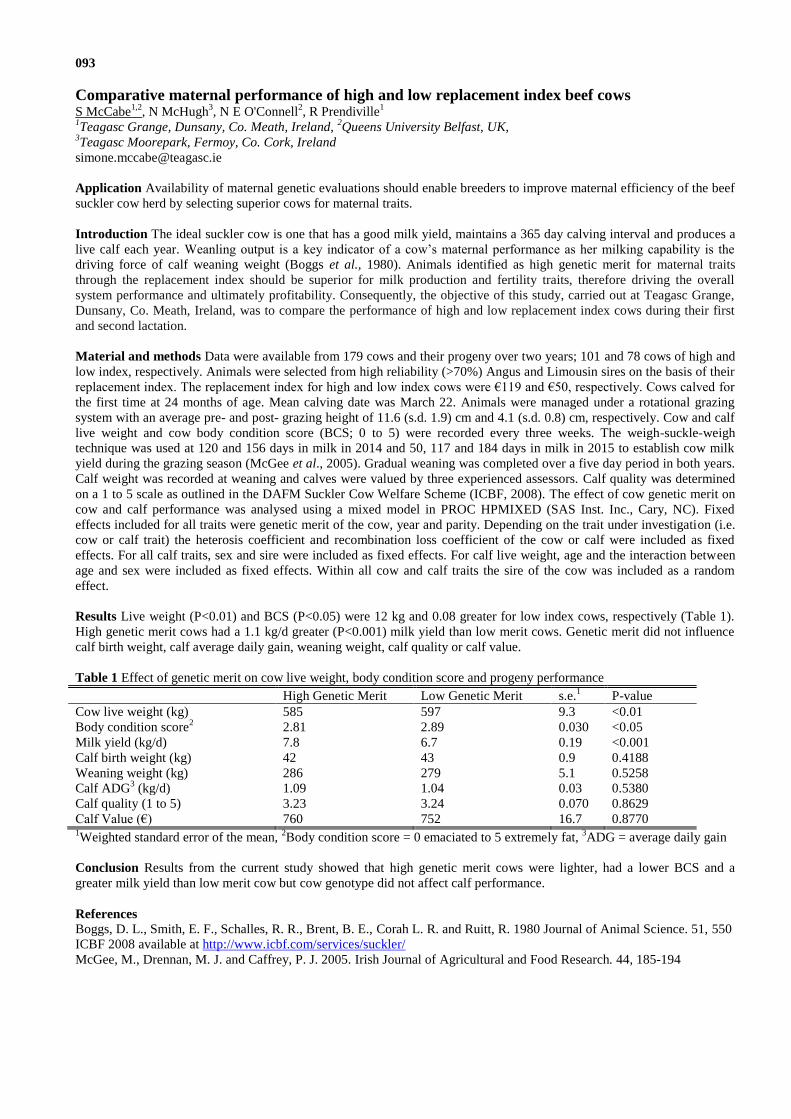
093
Comparative maternal performance of high and low replacement index beef cows S McCabe
1,2, N McHugh
3, N E O'Connell
2, R Prendiville
1
1Teagasc Grange, Dunsany, Co. Meath, Ireland,
2Queens University Belfast, UK,
3Teagasc Moorepark, Fermoy, Co. Cork, Ireland
Application Availability of maternal genetic evaluations should enable breeders to improve maternal efficiency of the beef
suckler cow herd by selecting superior cows for maternal traits.
Introduction The ideal suckler cow is one that has a good milk yield, maintains a 365 day calving interval and produces a
live calf each year. Weanling output is a key indicator of a cow’s maternal performance as her milking capability is the
driving force of calf weaning weight (Boggs et al., 1980). Animals identified as high genetic merit for maternal traits
through the replacement index should be superior for milk production and fertility traits, therefore driving the overall
system performance and ultimately profitability. Consequently, the objective of this study, carried out at Teagasc Grange,
Dunsany, Co. Meath, Ireland, was to compare the performance of high and low replacement index cows during their first
and second lactation.
Material and methods Data were available from 179 cows and their progeny over two years; 101 and 78 cows of high and
low index, respectively. Animals were selected from high reliability (>70%) Angus and Limousin sires on the basis of their
replacement index. The replacement index for high and low index cows were €119 and € 0, respectively. Cows calved for
the first time at 24 months of age. Mean calving date was March 22. Animals were managed under a rotational grazing
system with an average pre- and post- grazing height of 11.6 (s.d. 1.9) cm and 4.1 (s.d. 0.8) cm, respectively. Cow and calf
live weight and cow body condition score (BCS; 0 to 5) were recorded every three weeks. The weigh-suckle-weigh
technique was used at 120 and 156 days in milk in 2014 and 50, 117 and 184 days in milk in 2015 to establish cow milk
yield during the grazing season (McGee et al., 2005). Gradual weaning was completed over a five day period in both years.
Calf weight was recorded at weaning and calves were valued by three experienced assessors. Calf quality was determined
on a 1 to 5 scale as outlined in the DAFM Suckler Cow Welfare Scheme (ICBF, 2008). The effect of cow genetic merit on
cow and calf performance was analysed using a mixed model in PROC HPMIXED (SAS Inst. Inc., Cary, NC). Fixed
effects included for all traits were genetic merit of the cow, year and parity. Depending on the trait under investigation (i.e.
cow or calf trait) the heterosis coefficient and recombination loss coefficient of the cow or calf were included as fixed
effects. For all calf traits, sex and sire were included as fixed effects. For calf live weight, age and the interaction between
age and sex were included as fixed effects. Within all cow and calf traits the sire of the cow was included as a random
effect.
Results Live weight (P<0.01) and BCS (P<0.05) were 12 kg and 0.08 greater for low index cows, respectively (Table 1).
High genetic merit cows had a 1.1 kg/d greater (P<0.001) milk yield than low merit cows. Genetic merit did not influence
calf birth weight, calf average daily gain, weaning weight, calf quality or calf value.
Table 1 Effect of genetic merit on cow live weight, body condition score and progeny performance
High Genetic Merit Low Genetic Merit s.e.1 P-value
Cow live weight (kg) 585 597 9.3 <0.01
Body condition score2 2.81 2.89 0.030 <0.05
Milk yield (kg/d) 7.8 6.7 0.19 <0.001
Calf birth weight (kg) 42 43 0.9 0.4188
Weaning weight (kg) 286 279 5.1 0.5258
Calf ADG3 (kg/d) 1.09 1.04 0.03 0.5380
Calf quality (1 to 5) 3.23 3.24 0.070 0.8629
Calf Value (€) 760 752 16.7 0.8770 1Weighted standard error of the mean,
2Body condition score = 0 emaciated to 5 extremely fat,
3ADG = average daily gain
Conclusion Results from the current study showed that high genetic merit cows were lighter, had a lower BCS and a
greater milk yield than low merit cow but cow genotype did not affect calf performance.
References
Boggs, D. L., Smith, E. F., Schalles, R. R., Brent, B. E., Corah L. R. and Ruitt, R. 1980 Journal of Animal Science. 51, 550
ICBF 2008 available at http://www.icbf.com/services/suckler/
McGee, M., Drennan, M. J. and Caffrey, P. J. 2005. Irish Journal of Agricultural and Food Research. 44, 185-194

094
Joint genetic analysis of Jersey dairy cows performing in two countries in Sub Saharan Africa O Abejide
1,2, M Chagunda
2, R Mrode
2, G Banos
1,2, J Ojango
3, C Banga
4, G Simm
2
1University of Edinburgh, UK,
2SRUC, Edinburgh, UK,
3International Livestock Research Institute (ILRI), Nairobi, Kenya,
4Agricultural Research Council (ARC), Pretoria, South Africa
Application Currently, there are a few countries that carry out genetic evaluation for dairy cattle in Sub Saharan Africa.
Where this is done, it is at individual country level. Results from a joint genetic evaluation may provide robust and accurate
genetic parameters.
Introduction Genetic improvement of farmed livestock has had a major impact on productivity and its effects being
permanent, cumulative and usually highly cost effective. However, genetic improvement has not been carried out
systematically in most Sub Saharan Africa countries because of lack of performance recording and pedigree information.
However, some data has been collected in some countries which are currently used for national evaluation. A joint across-
country analysis may result in more accurate evaluations in cases where common foreign sires have been used. Using a
case study approach with data from Jersey cattle performing in Kenya and South Africa, the hypothesis was that joint
genetic evaluation would result in robust and accurate genetic parameters and hence, improve genetic progress.
Material and methods Test interval method (ICAR 2003) was used to determine 305-day milk yield from test day records
for Jersey cattle (n=46,242) obtained from the Kenya Livestock Breeders Organisation. In South Africa, 305-day milk yield
records (n=1,858,021) were obtained from Agricultural Research Council. Data were from cows between first and fifth
lactation from 1988 to 2012. A total of 400 sires with an average of 14 daughters per sire from Kenya and 9,962 sires with
an average of 34 daughters per sire from South Africa were used. There were 31 sires that had daughters in both Kenya and
South Africa from several foreign countries. The common sires were from USA (18), New Zealand (7), Denmark (1),
Canada (1), Great Britain (1) and Australia (1). Variance component estimation was performed fitting a bivariate mixed
linear model using ASReml (Gilmour et al., 2009). The model was yijkl = laci (age) + HYSk + animall + pem + eijkl, where
laci was the effect of the jth
lactation, HYSk was the herd-year-season, animall and pem were the random lth
animal and mth
pe effect. eijkl was the error term. In the joint evaluation, country of performance was included in the model to account for
the production system.
Results Descriptive statistics for production and fertility traits for Jersey cattle performing in Kenya and South Africa are
presented in Table 1.
Table 1 Means and standard deviations of Jersey cow performance traits in Kenya and South Africa between 1988 and 2012.
Trait Kenya South Africa Joint data
Age at first calving (months) 31.0 ±7.21 28.0±4.10 29.0±4.50
Calving interval (days) 493.0±152.01 404.0±89.30 405.2± 91.30
305-day milk yield (litres) 4181.0±1428.1 5563.0 ±1417.3 5520.4± 1437.5
Cows in Kenya calved for the first time at a slightly older age than in South Africa. However, cows in Kenya had relatively
lower milk yield than cows in South Africa with more variation in milk yield in Kenya (CV% = 34%) than in South Africa
(CV% = 25%). Genetic parameters for individual and joint evaluations are presented in Table 2.
Table 2 Estimation of genetic parameters and standard errors for Kenyan and South African Jersey cattle.
Genetic parameters Kenya South Africa Joint genetic evaluation
Heritability of 305-day milk yield (MY) 0.13 (0.10) 0.18 (0.01) 0.21 (0.01)
Heritability of age at first calving (AFC) 0.15 (0.05) 0.44 (0.05) 0.58 (0.05)
Heritability of calving interval (CI) Non estimable 0.04 (0.01) 0.05 (0.01)
Repeatability of 305-day MY 0.13 (0.10) 0.43 (0.03) 0.43 (0.01)
Genetic correlation of 305-day MY and AFC -0.53 (0.24) -0.12 (0.10) -0.20 (0.10)
Genetic correlation of 305-day MY and CI Non estimable 0.60 (0.05) 0.58 (0.04)
Joint genetic evaluation increased the value of the genetic parameter estimates and accuracy as reflected in low standard
errors associated with the estimates.
Conclusion A joint genetic evaluation between Jersey cattle from Kenya and South Africa is feasible and more appropriate
than individual country evaluation. This would generally increase the value of genetic parameter estimates and accuracy of
selection especially where there are insufficient data available in individual countries for a robust analysis.
Acknowledgement Thanks to the Agricultural Research Council, South Africa, Kenya Livestock Breeder’s rganisation
and International Livestock Research Institute for data and the SRUC International Engagement Strategy for funding.
References
ICAR – International Committee for Animal Recording 2003. Rome, Italy.
Gilmour, A.R., et al. 2009.VSN International Ltd, Hemel Hempstead, UK.

095
Investigating genomic selection in crossbred cattle using data from the Dairy Genetics Project
for East Africa A Brown
1, J Ojango
2, M Okeyo
2, R Mrode
1,2
1SRUC, Edinburgh, UK,
2International Livestock Research Institute, Nairobi, Kenya
Application Successful application of genomic selection in crossbred dairy cattle population from and for small holder
systems in some African countries would allow for the development of a selection programme to sustainably improve
production and fitness traits.
Introduction In developing countries, a large proportion of dairy production is carried out by small holders whose stock
comprises of fewer than ten cows. The majority of these cows are crosses between indigenous and exotic breeds. There is
little phenotypic recording, and no reliable pedigree records exist for these animals. Traditional methods of breeding value
estimation (which rely on phenotype and pedigree information) cannot, therefore, be used to select animals for breeding.
Genomic selection may be a suitable tool for estimating breeding values for these animals, as it allows the inference of
relationships between animals using genotypes as opposed to the pedigree. This study investigates the potential for
genomic evaluation in a small, crossbred, dairy cattle population, using three methods.
Material and methods The dataset comprised of milk yield deviations (YD) for 1,013 crossbred cows from the Kenyan
component of the Dairy Genetics East Africa Project, all of which had genotype data available from the Illumina
BovineHD SNP chip. Individuals were of varying crosses between indigenous African breeds (various Small East African
Zebu ecotypes), and exotic dairy breeds (Ayrshire, Friesian, Guernsey, Holstein and Jersey), and were split into five groups
according to proportion of dairy ancestry. Three groups were identified to be used as separate validation populations based
on PCA analysis. Group 1 contained all animals where a Zebu breed contributed to the cross (n=178), group 2 contained all
animals where 60-87.5% of the animal was contributed by exotic dairy breeds (n=448) and group 3 contained all animals
where >87.5% of the animal was contributed to by exotic dairy breeds. Genomic breeding values (GEBVs) were calculated
using 3 methods, SNP-BLUP, GBLUP, and BayesC, using the following model: y = μ + Za + e; where y is a vector of
YDs, μ is the fixed effect of the overall mean, e is a vector of residual effects with an assumed variance of (0,σ2
eI), and X
and Z are respective incidence matrices. For the SNP-BLUP model, a represents a vector of random unknown marker
effects where all Ps are assumed to affect the trait, and effect distribution is assumed (0,σ2aI), for the GBLUP model, a
represents a vector of unknown animal effects with an assumed distribution of (0,σ2
aG), where G is the genomic
relationship matrix, and for BayesC a represents a vector of SNP effects, where some SNPs have zero effect with
probability of π, which was set 0. in this study.
Results Accuracies of evaluation for the three validation groups for all three methods are shown in Table 1. In all cases, the
highest accuracy was obtained when predicting animals >87.5% dairy (group 3) from animals with lower dairy
contributions, with observed accuracies of approximately 0.4. Accuracies for group 2 were slightly lower but not
significantly different from group 3. Accuracies obtained for group 1 were slightly lower again, which is to be expected as
these animals are crosses between Bos Taurus and Bos Indicus species.
Table 1 Accuracy of GEBVs for three validation groups based on SNP-BLUP, GBLUP and BayesC analysis
Validation group N Accuracy (standard error)
SNP-BLUP GBLUP BayesC
1 178 0.28 (0.06) 0.32 (0.06) 0.28 (0.06)
2 448 0.36 (0.04) 0.35 (0.04) 0.35 (0.04)
3 297 0.42 (0.04) 0.41 (0.04) 0.39 (0.05)
Conclusion Though the study population is of limited size, the results suggest that there is the potential for estimation of
GEBVs in a crossbred cattle population. SNP-BLUP or GBLUP are likely the preferred method for estimation as they
produce similar accuracies to BayesC but are less computationally intensive. Innovative methods of data collection should
to be developed in order to increase the accuracy of GEBV estimation in the small holder system.
Acknowledgements The authors gratefully acknowledge ILRI and UNE for the provision of all data, and BBSRC, the
KTN and AHDB Dairy for funding.
096
Is a cross-validation approach useful to overcome stringent multiple testing correction
procedures in small GWAS studies? G E Pollott
1, J J Wu
2, S J Zhang
2, D C Wathes
1
1Royal Veterinary College, London, UK,
2Huazhong Agricultural University, Wuhan, China
Application Identifying allelic differences in genes which influence production and health traits may help improve the rate
of genetic progress in selection schemes or pinpoint physiological pathways playing a key role in trait phenotypes.
Introduction Using the Bonferroni correction in genomewide association studies (GWAS) often results in few single
nucleotide polymorphisms (SNP) achieving significance due to the large number of tests applied when using SNP chip
data. Here an approach is explored to overcome this limitation using a type of cross-validation. This method is tested on
data from the UK and China derived from a joint Holstein dairy cow study of somatic cell count (SCC) data.
Material and methods In this approach a GWAS was carried out on the data from Chinese cows (estimation set). The SNP
were ranked on their probability. A second GWAS was carried using the UK data (validation set) but only for SNP
identified in the UK dataset achieving significance at the 5% level. The second set of results was ranked on their
probabilities and those achieving significance at the 5% level were considered to be in LD with polymorphic genes
affecting the trait. This was repeated at more stringent cut-off points in order to see if the trade-off between stringency and
number of significant result differed. The cows used in this study have previously been described by Brickell et al. (2010)
and Wu et al. (2012). All cows were Holsteins maintained on commercial dairy farms. Wuhan dairy farm, in China, has
~3000 cattle housed in open-sided sheds with access to outside yards, providing shelter in winter while remaining
ventilated in summer. Cows are milked 3 times a day producing an average 305-day milk yield of 6,616 kg. The UK data
was from 20 dairy herds kept in a range of systems in the south-east of England averaging 7,218 kg of milk in a 305-day
lactation. They were genotyped with the 50K Illumina SNP chip. After quality control 171 UK and 214 Chinese cows, and
36,092 SNP remained in the analyses. Cow SCC status was characterised as a binary trait after Yoshida et al. (2012). The
GWAS were carried out with allelic, genotypic and dominance models in PLINK (Purcell et al., 2007). In addition SCC
analysis which was carried out on environmental residuals (Aulechenko et al., 2007) with an allele substitution model using
mean lactation SCC.
Results Running analyses on all 385 cows together resulted in no SNP achieving significance after Bonferroni correction
for multiple testing when using any of the 4 models (allelic, dominance, genotypic or allele substitution). When using the
allelic model on the Chinese data 117 SNP demonstrated an effect on SCC (P < 0.05). None of these SNP achieved
significance in the UK dataset when using a Bonferroni correction at 0.05. However, when considering only those SNP
which achieved significance at the more stringent P < 0.01 in the Chinese set then 4 SNP were found to be significant in the
UK population. Repeating these analyses but using the genotypic and dominance models resulted in 3 and 6 significant
SNP at the P < 0.01 level being found. Reversing the analysis by using the UK dataset as the estimation set resulted in 3
SNP with the allelic test, 3 SNP with the dominance test and 2 SNP with the genotypic test being significant at the P < 0.01
level in the Chinese set. Results from analysing the mean SCC data also found significant SNP using this method (P <
0.01).
Conclusion Discovering genes affecting traits from small GWAS studies is often limited by the stringent requirements of
correction for multiple testing. This study reports a cross-validation approach which appears to be promising since
significant SNP were found in the validation set when it was analysed just for SNP achieving significance in the estimation
set. In this case no SNP were found to be significant in the combined-set analysis. Whereas here the approach has been
used on two distinct populations, from the UK and China, it should be possible to extend this method by randomly splitting
a dataset into two halves and analysing the resultant datasets as described above. Potentially this could be repeated many
times and a meta-analysis used on the set of results produced.
Acknowledgements Thanks to the farm staff who helped to collect all the related data. Financial assistance from Chinese
international projects from the Chinese government, Innovation China UK, BBSRC China Partnering award, and National
Modern Agro-industry Technology Research System of China are greatly appreciated.
References
Aulchenko, Y. S., de Konig, D-J. and Haley, C. 2007. Genetics 177, 577–585.
Brickell, J. S., Pollott, G. E., Clempson, A. M., Otter, N. and Wathes, D. C. 2010. Journal of Dairy Science 93, 340-347.
Purcell, S., Neale, B., Todd-Brown, K., Thomas, L., Ferreira, M. A. R., Bender, D., Maller, J., Sklar, P., de Bakker, P. I.
W., Daly, M. J., and Sham, P. C.. 2007. American Journal of Human Genetics 81, 559-575.
Wu, J. J., Wathes, D. C., Brickell, J. S., Yang, L. G., Cheng, Z., Zhao, H. Q., Xu, Y. J., and Zhang, S. J. 2012. Animal
Production Science 52, 11-19.
Yoshida, T., Furuta, H., Kondo, Y. and, Mukoyama, H. 2012. Animal Science Journal 83, 359-66.
097
16S rRNA gene sequencing reveals temporal shifts in the porcine faecal microbiota post-
weaning, independent of enterotoxigenic Escherichia coli challenge J Pollock
1,2, D L Gally
2, L Glendinning
2, R Tiwari
3, M R Hutchings
1, J G M Houdijk
1
1SRUC, Edinburgh, UK,
2The Roslin Institute/The University of Edinburgh, Edinburgh, UK,
3Zoetis, Kalamazoo, Michigan,
USA
Application A 16S rRNA gene metabarcoding pipeline has been developed and was used to study microbial shifts in the
porcine gut, which may inform the development of novel therapeutic strategies to improve enteric health.
Introduction The weaning transition period in pigs is linked with increased vulnerability to enteric disorders, such as
post-weaning colibacillosis, primarily caused by enterotoxigenic Escherichia coli (ETEC). The gut microbiota has been
subject to intense research for several decades, due to associations with enteric health. In recent years, the emergence of
next-generation sequencing has allowed study of complex microbial communities with greater resolution. Here, a
previously developed ETEC infection model (Athanasiadou et al., 2011) was used to study the effect of ETEC challenge on
the faecal microbiota, as well as the temporal dynamics of faecal microbial communities over the post-weaning transition.
Materials and methods Fifty-nine pigs (Large White x Landrace) were weaned at 26.7±0.7 days of age and weighed
8.65±1.77kg and housed in groups of four where possible (2 males and 2 females). On days 4, 6, 8, 11 and 13 post-
weaning, pigs were either trickle challenged in-feed with 108 cfu ETEC in PBS or sham-challenged with PBS only. Rectal
faecal samples were taken on days 4 (pre-challenge), 8, 12, 15 and 19. Pigs from each treatment were selected for the
sequencing study, balancing for weaning weight, sex, pen and experimental round (n=16). Following DNA extraction, the
V3 hypervariable region of the 16S rRNA gene was amplified before sequencing using the Illumina MiSeq. Quality control
and analysis of sequences was carried out using mothur (Schloss et al., 2009). Changes in operational taxonomic unit
(OTU) relative abundances were assessed using Metastats (Paulson et al., 2011). Shifts in microbiota structure and
stability were assessed using analysis of molecular variance and homogeneity of molecular variance, respectively.
Results ETEC challenge had no effect on faecal microbiota structure, stability or OTU relative abundances (P > 0.05) at
any time point. However, changes in faecal microbiota structure and stability were observed over time (Figure 1) and shifts
in particular OTU relative abundances were evident (P < 0.05). Specifically, three OTUs identified as Prevotella species
increased in relative abundance over time in both ETEC- and sham-inoculated pigs from baseline (Table 1).
Conclusion ETEC challenge had no significant effect on the faecal microbiota. However, the site of colonisation is the
terminal small intestine, so any effects on the microbiota may be localised. Significant changes in microbiota structure and
stability were observed over a short time frame post-weaning, highlighting the importance of this dynamic phase in shaping
the porcine microbiota. Manipulation of the gut microbiota is viewed as a potential future therapeutic option for enteric
disorders, and a better understanding of microbial shifts during this dynamic phase may lead to the development of dietary
and probiotic management strategies.
Acknowledgements The authors greatly acknowledge BBSRC and Zoetis for sponsorship of this PhD project. Many
thanks to Dave Anderson and Lesley Smith for technical assistance during this trial.
References
Athanasiadou, S., Houdijk, J.G.M., Eckersall, P.D., Low, C.J., and Kyriazakis, I. 2010. Proceedings of the BSAS; 119.
Paulson J, Pop M and Bravo H. 2011. Genome Biology 12, 1-27.
Schloss PD, Westcott SL, Ryabin T, Hall JR, Hartmann M, Hollister EB, Lesniewski RA, Oakley BB, Parks DH, Robinson
CJ, Sahl JW, Stres B, Thallinger GG, Van Horn DJ and Weber CF. 2009. AEM 75, 7537-41.
Figure 1 3D-NMDS ordination of faecal microbial
communities pre-inoculation and 15 days post-inoculation
showing changes in community structure over time
Table 1 Metastats comparison of Day 4 and Day 19 relative
abundances (± SEM), only showing OTUs with significant
shifts in both ETEC and sham groups (P < 0.05).

098
The effects of xylanase on weaner-grower pig performance and peptide YY concentration in
portal and peripheral blood A Taylor
1, M R Bedford
2, H M Miller
1
1University of Leeds, UK,
2AB Vista Feed Ingredients - a division of AB Agri Ltd, Marlborough, UK
Application The addition of xylanase to weaner-grower pig diets may be less effective when fed high quality wheat-barley
based diets.
Introduction Xylanase, a glycosidase enzyme has been shown to improve pig performance through improvements in
digestibility and reduced diet viscosity. Studies in broiler chickens have shown that the addition of xylanase increases
peptide YY concentrations (Singh et al, 2012) which results in delayed gastric emptying, improving nutrient digestibility
and growth performance. The aim of this study was to determine the effects of increasing xylanase levels on pig
performance and the concentration of peptide YY in portal and peripheral blood.
Material and methods Five hundred and twelve weaner-grower pigs were allocated to pens (32 replicates) at 7 weeks of
age on the basis of litter origin, sex and liveweight. Pigs had ad libitum access to one of four treatment diets over a 35 day
period. Dietary treatments compromised 4 inclusion levels of xylanase (0, 8,000, 16,000 or 32,000 BTU/kg). Diets were
wheat-barley based and formulated to meet or exceed nutrient requirements. Pigs were individually weighed at the start of
the trial (7 weeks of age) and at 10 and 12 weeks of age. Pen feed intake and feed conversion ratios were calculated. Pig
health was assessed and recorded daily. At the end of the trial 15 pigs per treatment were euthanised and blood was
collected from portal and peripheral circulations into heparinised tubes. Mean pen data for liveweight, feed intake, daily
gain and FCR were analysed using an ANOVA according to a general linear model (GLM) procedure (SPSS, version 22).
Orthogonal polynomial contrasts were applied to test for linear and quadratic responses to the inclusion of xylanase (SPSS,
version 22). The number of pigs treated with antibiotics and faecal and health scores were analysed by the non-parametric
Kruskal–Wallis one-way ANOVA. An ANOVA was run to compare treatment effects on portal and peripheral levels of
peptide YY, whereas a Repeated-Measures ANOVA was performed to compare portal and peripheral concentrations.
Results Pigs performed well across all treatments with an average growth rate of 0.781±0.005 kg/day. The addition of
xylanase to the diet had no effect on performance over the 35 days (Figure1). Peptide YY levels in portal and peripheral
plasma were not significantly different between treatments (Figure 2). There was no difference in peptide YY
concentrations between portal and peripheral plasma (Figure 2). Health status was similar between treatments.
0.0
20.0
40.0
60.0
80.0
100.0
0 8,000 16,000 32,000
PYY
pg/m
l
Econase XT BTU/kg
Portal
Peripheral
Figure 1 Average daily gain of weaner-grower pigs fed four
levels of xylanase over a 35 day period
Conclusion The addition of xylanase to weaner-grower pigs fed a wheat-barley based diet had no effect on performance or
portal and peripheral peptide YY concentrations. Pigs grew well when fed the non-supplemented diet which may suggest
that diet quality was sufficient and thus there were no beneficial effects of adding xylanase with regards to growth
performance. Another reason for the lack of response may be due to the trial duration as response to xylanase may develop
when diets are fed over an extended period of time.
Acknowledgements This work was funded by AB Vista.
References ingh, A., Masey ’ eill, H.V., Ghosh, T.K., Bedford, M.R, Haldar, S. 2012. Animal Feed Science and Technology 177,
194-203.
Figure 2 PYY concentrations in portal and peripheral
plasma of weaner-grower pigs fed four levels of
xylanase (d 35)
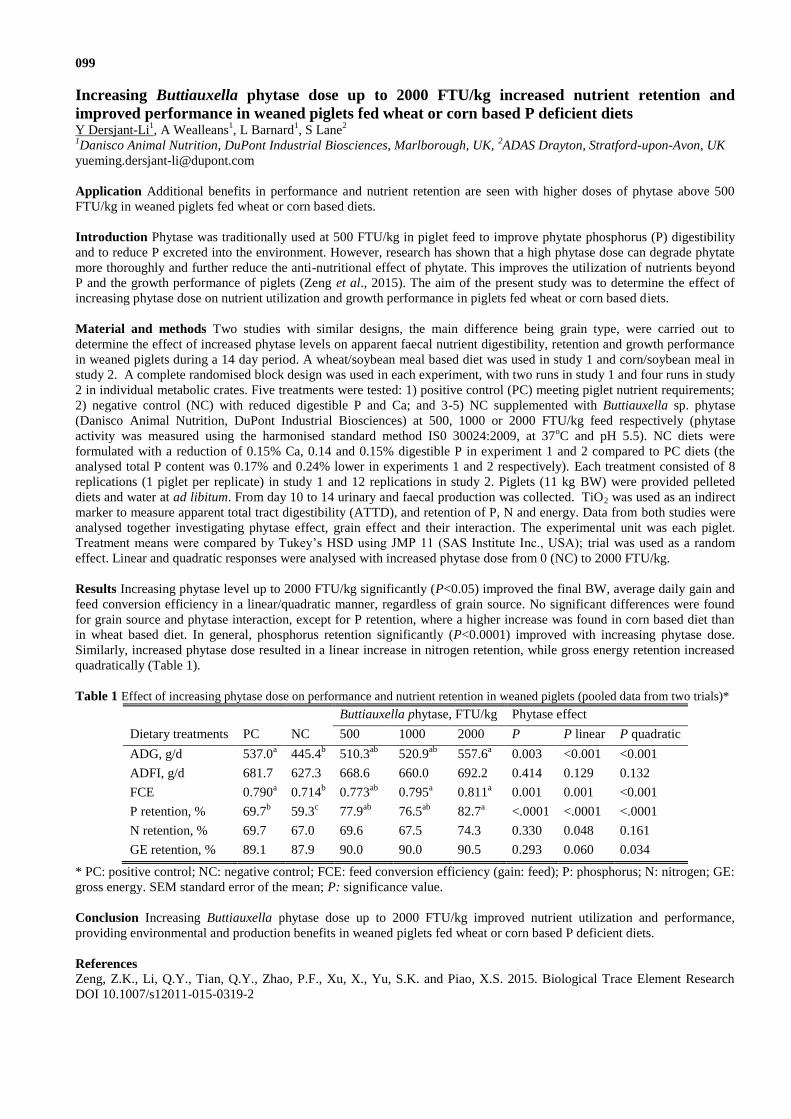
099
Increasing Buttiauxella phytase dose up to 2000 FTU/kg increased nutrient retention and
improved performance in weaned piglets fed wheat or corn based P deficient diets Y Dersjant-Li
1, A Wealleans
1, L Barnard
1, S Lane
2
1Danisco Animal Nutrition, DuPont Industrial Biosciences, Marlborough, UK,
2ADAS Drayton, Stratford-upon-Avon, UK
Application Additional benefits in performance and nutrient retention are seen with higher doses of phytase above 500
FTU/kg in weaned piglets fed wheat or corn based diets.
Introduction Phytase was traditionally used at 500 FTU/kg in piglet feed to improve phytate phosphorus (P) digestibility
and to reduce P excreted into the environment. However, research has shown that a high phytase dose can degrade phytate
more thoroughly and further reduce the anti-nutritional effect of phytate. This improves the utilization of nutrients beyond
P and the growth performance of piglets (Zeng et al., 2015). The aim of the present study was to determine the effect of
increasing phytase dose on nutrient utilization and growth performance in piglets fed wheat or corn based diets.
Material and methods Two studies with similar designs, the main difference being grain type, were carried out to
determine the effect of increased phytase levels on apparent faecal nutrient digestibility, retention and growth performance
in weaned piglets during a 14 day period. A wheat/soybean meal based diet was used in study 1 and corn/soybean meal in
study 2. A complete randomised block design was used in each experiment, with two runs in study 1 and four runs in study
2 in individual metabolic crates. Five treatments were tested: 1) positive control (PC) meeting piglet nutrient requirements;
2) negative control (NC) with reduced digestible P and Ca; and 3-5) NC supplemented with Buttiauxella sp. phytase
(Danisco Animal Nutrition, DuPont Industrial Biosciences) at 500, 1000 or 2000 FTU/kg feed respectively (phytase
activity was measured using the harmonised standard method IS0 30024:2009, at 37oC and pH 5.5). NC diets were
formulated with a reduction of 0.15% Ca, 0.14 and 0.15% digestible P in experiment 1 and 2 compared to PC diets (the
analysed total P content was 0.17% and 0.24% lower in experiments 1 and 2 respectively). Each treatment consisted of 8
replications (1 piglet per replicate) in study 1 and 12 replications in study 2. Piglets (11 kg BW) were provided pelleted
diets and water at ad libitum. From day 10 to 14 urinary and faecal production was collected. TiO2 was used as an indirect
marker to measure apparent total tract digestibility (ATTD), and retention of P, N and energy. Data from both studies were
analysed together investigating phytase effect, grain effect and their interaction. The experimental unit was each piglet.
Treatment means were compared by Tukey’s H D using JMP 11 ( A nstitute nc., U A); trial was used as a random
effect. Linear and quadratic responses were analysed with increased phytase dose from 0 (NC) to 2000 FTU/kg.
Results Increasing phytase level up to 2000 FTU/kg significantly (P<0.05) improved the final BW, average daily gain and
feed conversion efficiency in a linear/quadratic manner, regardless of grain source. No significant differences were found
for grain source and phytase interaction, except for P retention, where a higher increase was found in corn based diet than
in wheat based diet. In general, phosphorus retention significantly (P<0.0001) improved with increasing phytase dose.
Similarly, increased phytase dose resulted in a linear increase in nitrogen retention, while gross energy retention increased
quadratically (Table 1).
Table 1 Effect of increasing phytase dose on performance and nutrient retention in weaned piglets (pooled data from two trials)*
Buttiauxella phytase, FTU/kg Phytase effect
Dietary treatments PC NC 500 1000 2000 P P linear P quadratic
ADG, g/d 537.0a 445.4
b 510.3
ab 520.9
ab 557.6
a 0.003 <0.001 <0.001
ADFI, g/d 681.7 627.3 668.6 660.0 692.2 0.414 0.129 0.132
FCE 0.790a 0.714
b 0.773
ab 0.795
a 0.811
a 0.001 0.001 <0.001
P retention, % 69.7b 59.3
c 77.9
ab 76.5
ab 82.7
a <.0001 <.0001 <.0001
N retention, % 69.7 67.0 69.6 67.5 74.3 0.330 0.048 0.161
GE retention, % 89.1 87.9 90.0 90.0 90.5 0.293 0.060 0.034
* PC: positive control; NC: negative control; FCE: feed conversion efficiency (gain: feed); P: phosphorus; N: nitrogen; GE:
gross energy. SEM standard error of the mean; P: significance value.
Conclusion Increasing Buttiauxella phytase dose up to 2000 FTU/kg improved nutrient utilization and performance,
providing environmental and production benefits in weaned piglets fed wheat or corn based P deficient diets.
References
Zeng, Z.K., Li, Q.Y., Tian, Q.Y., Zhao, P.F., Xu, X., Yu, S.K. and Piao, X.S. 2015. Biological Trace Element Research
DOI 10.1007/s12011-015-0319-2
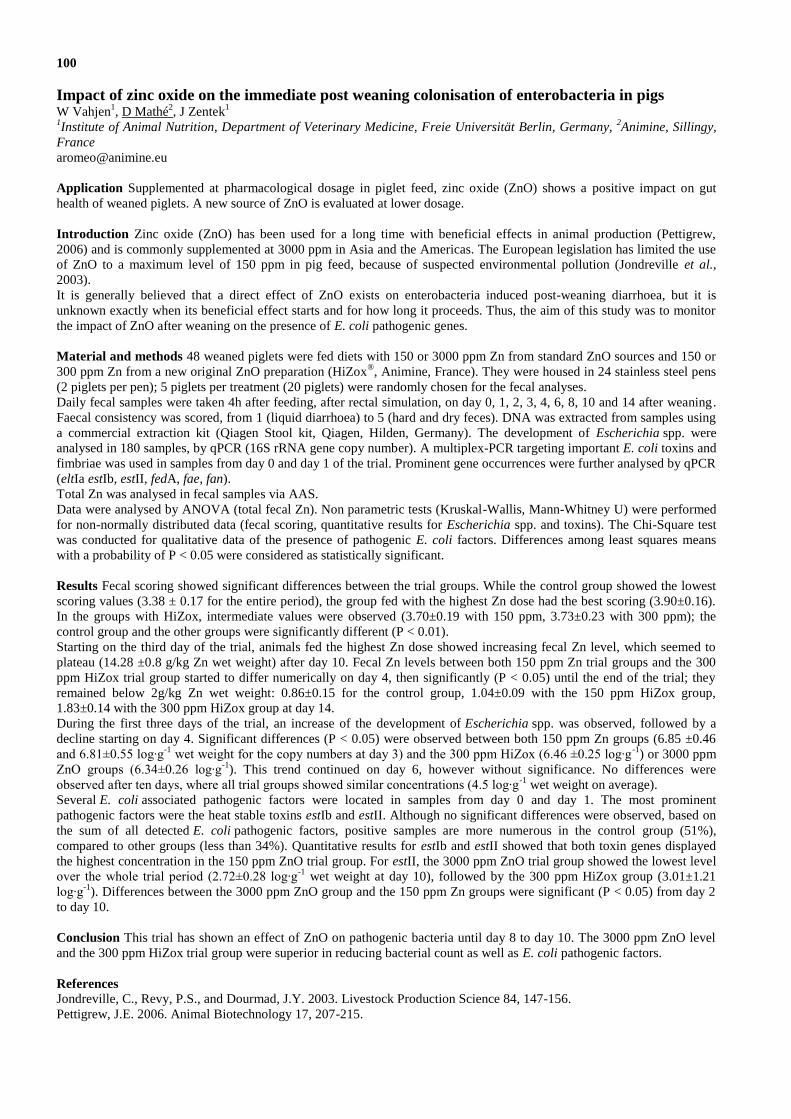
100
Impact of zinc oxide on the immediate post weaning colonisation of enterobacteria in pigs W Vahjen
1, D Mathé
2, J Zentek
1
1Institute of Animal Nutrition, Department of Veterinary Medicine, Freie Universität Berlin, Germany,
2Animine, Sillingy,
France
Application Supplemented at pharmacological dosage in piglet feed, zinc oxide (ZnO) shows a positive impact on gut
health of weaned piglets. A new source of ZnO is evaluated at lower dosage.
Introduction Zinc oxide (ZnO) has been used for a long time with beneficial effects in animal production (Pettigrew,
2006) and is commonly supplemented at 3000 ppm in Asia and the Americas. The European legislation has limited the use
of ZnO to a maximum level of 150 ppm in pig feed, because of suspected environmental pollution (Jondreville et al.,
2003).
It is generally believed that a direct effect of ZnO exists on enterobacteria induced post-weaning diarrhoea, but it is
unknown exactly when its beneficial effect starts and for how long it proceeds. Thus, the aim of this study was to monitor
the impact of ZnO after weaning on the presence of E. coli pathogenic genes.
Material and methods 48 weaned piglets were fed diets with 150 or 3000 ppm Zn from standard ZnO sources and 150 or
300 ppm Zn from a new original ZnO preparation (HiZox®, Animine, France). They were housed in 24 stainless steel pens
(2 piglets per pen); 5 piglets per treatment (20 piglets) were randomly chosen for the fecal analyses.
Daily fecal samples were taken 4h after feeding, after rectal simulation, on day 0, 1, 2, 3, 4, 6, 8, 10 and 14 after weaning.
Faecal consistency was scored, from 1 (liquid diarrhoea) to 5 (hard and dry feces). DNA was extracted from samples using
a commercial extraction kit (Qiagen Stool kit, Qiagen, Hilden, Germany). The development of Escherichia spp. were
analysed in 180 samples, by qPCR (16S rRNA gene copy number). A multiplex-PCR targeting important E. coli toxins and
fimbriae was used in samples from day 0 and day 1 of the trial. Prominent gene occurrences were further analysed by qPCR
(eltIa estIb, estII, fedA, fae, fan).
Total Zn was analysed in fecal samples via AAS.
Data were analysed by ANOVA (total fecal Zn). Non parametric tests (Kruskal-Wallis, Mann-Whitney U) were performed
for non-normally distributed data (fecal scoring, quantitative results for Escherichia spp. and toxins). The Chi-Square test
was conducted for qualitative data of the presence of pathogenic E. coli factors. Differences among least squares means
with a probability of P < 0.05 were considered as statistically significant.
Results Fecal scoring showed significant differences between the trial groups. While the control group showed the lowest
scoring values (3.38 ± 0.17 for the entire period), the group fed with the highest Zn dose had the best scoring (3.90±0.16).
In the groups with HiZox, intermediate values were observed (3.70±0.19 with 150 ppm, 3.73±0.23 with 300 ppm); the
control group and the other groups were significantly different (P < 0.01).
Starting on the third day of the trial, animals fed the highest Zn dose showed increasing fecal Zn level, which seemed to
plateau (14.28 ±0.8 g/kg Zn wet weight) after day 10. Fecal Zn levels between both 150 ppm Zn trial groups and the 300
ppm HiZox trial group started to differ numerically on day 4, then significantly (P < 0.05) until the end of the trial; they
remained below 2g/kg Zn wet weight: 0.86±0.15 for the control group, 1.04±0.09 with the 150 ppm HiZox group,
1.83±0.14 with the 300 ppm HiZox group at day 14.
During the first three days of the trial, an increase of the development of Escherichia spp. was observed, followed by a
decline starting on day 4. Significant differences (P < 0.05) were observed between both 150 ppm Zn groups (6.85 ±0.46
and 6.81±0. log∙g-1
wet weight for the copy numbers at day ) and the 00 ppm HiZox (6.46 ±0.2 log∙g-1
) or 3000 ppm
Zn groups (6. 4±0.26 log∙g-1
). This trend continued on day 6, however without significance. No differences were
observed after ten days, where all trial groups showed similar concentrations (4. log∙g-1
wet weight on average).
Several E. coli associated pathogenic factors were located in samples from day 0 and day 1. The most prominent
pathogenic factors were the heat stable toxins estIb and estII. Although no significant differences were observed, based on
the sum of all detected E. coli pathogenic factors, positive samples are more numerous in the control group (51%),
compared to other groups (less than 34%). Quantitative results for estIb and estII showed that both toxin genes displayed
the highest concentration in the 150 ppm ZnO trial group. For estII, the 3000 ppm ZnO trial group showed the lowest level
over the whole trial period (2. 2±0.28 log∙g-1
wet weight at day 10), followed by the 300 ppm HiZox group (3.01±1.21
log∙g-1
). Differences between the 3000 ppm ZnO group and the 150 ppm Zn groups were significant (P < 0.05) from day 2
to day 10.
Conclusion This trial has shown an effect of ZnO on pathogenic bacteria until day 8 to day 10. The 3000 ppm ZnO level
and the 300 ppm HiZox trial group were superior in reducing bacterial count as well as E. coli pathogenic factors.
References
Jondreville, C., Revy, P.S., and Dourmad, J.Y. 2003. Livestock Production Science 84, 147-156.
Pettigrew, J.E. 2006. Animal Biotechnology 17, 207-215.

101
The interactive effects of two different low dose dietary copper sources with phytase on weaned
pig performance C H Gaukroger
1, P Buttin
2, M Vazquez
2, S A Edwards
1
1Newcastle University, Newcastle Upon Tyne, Tyne and Wear, UK,
2Novus Europe, Brussels, Belgium
Application Chelating dietary copper with hydroxyl-methylthio-butanoic acid (HMTBa), in combination with phytase,
mediates a superior feed efficiency in weaned piglets provided with lower mineral diets to reduce environmental impact.
Introduction Weaning is associated with many stressors known to adversely affect piglets, resulting in post-weaning
growth depression. Copper (Cu), often in the form of inorganic CuSO4, is commonly utilised as a multifunctional in-feed
growth promoter at concentrations <175ppm until 8-10 weeks of age in the EU (Council Directive 70/524/EEC) (Zhoa et
al., 2014). Microbial phytase is commonly included in feed to improve the degradation of phytate phosphorus, the main
phosphorus (P) storage compound in cereals, increasing the bioavailability of P in cereal grains. Thus, phytase reduces P
excretion and can decrease other anti-nutritive effects of phytate. Inorganic sources of Cu are known to dissociate in the
stomach, releasing Cu2+
ions which have a very high affinity to phytic acid, resulting in a phytase resistant Cu-phytate
complex which is excreted (Banks et al., 2004). Chelating Cu with HMTBa prevents the dissociation of Cu2+
ions and the
subsequent antagonism with phytase. Consequently, the bioavailability of Cu is increased, reducing the concentrations
required to promote equivalent growth promotion compared to CuSO4 (Zhao et al., 2014), enabling lower mineral diets to
be utilised for environmental benefit. This study assessed whether supplementation of chelated Cu (Mintrex Copper, Novus
Europe, Belgium) in combination with a standard dose of phytase in weaned pig diets would additively improve
performance, as a result of the increased Cu and P bioavailability and reduced anti-nutritive effects of phytate.
Material and methods Ninety-six crossbred pigs ([Large White x Landrace] x Hylean Maxgro) were weaned onto trial at
28 days of age. Pigs were allocated between four dietary treatments, fed over two post-weaning phases for a period of five
weeks (Phase one (weeks 1-2): 21.5% CP, 2.5% CF, 8% Fats, 5.5% Ash, 0.75% Ca, 0.55% P. Phase two (weeks 3-5): 21%
CP, 3% CF, 6.5% Fats, 5.5% Ash, 0.72% Ca, 0.5% P). The basal diet contained only nutritional levels of zinc and no added
fish meal. The treatments were: 1) 80ppm/kg Mintrex copper (MC), 2) 80ppm/kg MC + 500FTU/kg phytase
(manufacturer’s declaration, Phyzyme XP, DuPont) (MC+Phy), 3) 80ppm/kg CuSO4 (CS) and 4) 80ppm/kg CuSO4 +
500FTU phytase (CS+Phy). Pigs were housed in pens of four, balanced for weight, sex ratio and litter origin, to provide six
replicates per treatment, blocked over two time batches. Feed and water were available ad libitum, with each pen having
access to one nipple drinker. Mean daily live weight gain (DLWG), daily voluntary feed intake (DVFI) and feed conversion
ratio (FCR) were measured from weekly weighing. The data obtained were analysed by the GLM function in Minitab
version 16 statistical software; pen served as the experimental unit for all analyses. Factors included in the model were
copper treatment, phytase treatment and copper/phytase interaction; start weight was included as a covariate and replicate
as a blocking factor.
Results Pigs receiving Mintrex copper or phytase were significantly heavier at the end of the study (+7.2 and +6.0%
respectively), attributed to their superior DLWG and FCR, demonstrating independent treatment effects. There was also an
interactive effect of copper source and phytase, with pigs receiving the MC+Phy diet recording a lower FCR.
Table 1 The interactive effects of copper source and phytase on pig performance during the 5 week period after weaning
MC+
Phy MC
CS+
Phy CS S.E.M
Cu
Significance
Phy Cu x Phy
Start weight (kg) 7.91 7.97 7.99 7.96 0.053 n.s. n.s. n.s.
End weight (kg) 22.39 20.54 20.30 19.75 0.343 <0.001 0.002 n.s.
Overall DLWG (kg) 0.414 0.359 0.352 0.339 0.010 0.001 0.002 n.s.
Overall DVFI (kg) 0.612 0.588 0.584 0.553 0.017 n.s. n.s. n.s.
Overall FCR (feed/gain) 1.48b 1.64
a 1.66
a 1.66
a 0.037 0.005 0.013 0.015
Conclusion Dietary supplementation with 80ppm/kg of MC, particularly when in combination with phytase, can enhance
weaned pig performance when utilised in lower mineral diets designed to reduce environmental impact.
Acknowledgements The authors gratefully acknowledge funding from Newcastle University and Novus International.
References
Banks, K.M., Thompson, K.L., Jaynes, P. and Applegate, T.J. 2004. Poultry Science 83, 1335-1341.
Zhao, J., Allee, G., Gerlemann, G., Ma, L.,Gracia, M.I., Parker, D., Vazquez-Anon, M. and Harrell, R.J. 2014. Journal of
Animal Science 27, 965-973.
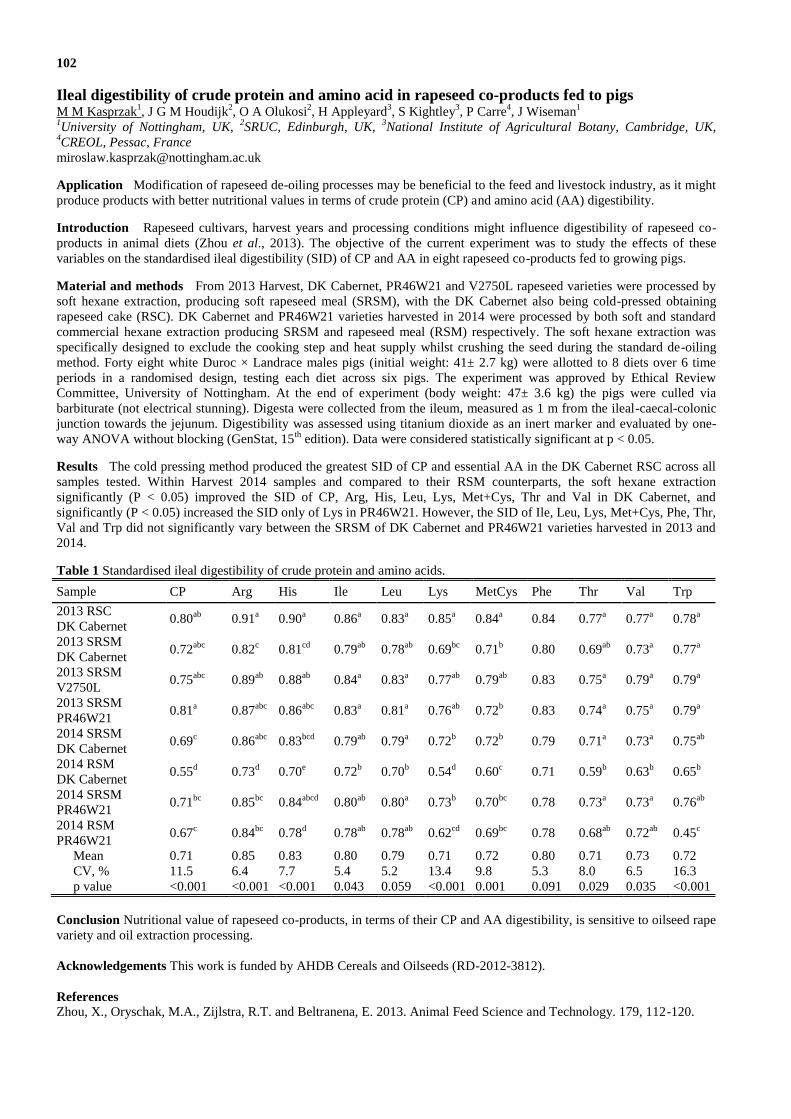
102
Ileal digestibility of crude protein and amino acid in rapeseed co-products fed to pigs M M Kasprzak
1, J G M Houdijk
2, O A Olukosi
2, H Appleyard
3, S Kightley
3, P Carre
4, J Wiseman
1
1University of Nottingham, UK,
2SRUC, Edinburgh, UK,
3National Institute of Agricultural Botany, Cambridge, UK,
4CREOL, Pessac, France
Application Modification of rapeseed de-oiling processes may be beneficial to the feed and livestock industry, as it might
produce products with better nutritional values in terms of crude protein (CP) and amino acid (AA) digestibility.
Introduction Rapeseed cultivars, harvest years and processing conditions might influence digestibility of rapeseed co-
products in animal diets (Zhou et al., 2013). The objective of the current experiment was to study the effects of these
variables on the standardised ileal digestibility (SID) of CP and AA in eight rapeseed co-products fed to growing pigs.
Material and methods From 2013 Harvest, DK Cabernet, PR46W21 and V2750L rapeseed varieties were processed by
soft hexane extraction, producing soft rapeseed meal (SRSM), with the DK Cabernet also being cold-pressed obtaining
rapeseed cake (RSC). DK Cabernet and PR46W21 varieties harvested in 2014 were processed by both soft and standard
commercial hexane extraction producing SRSM and rapeseed meal (RSM) respectively. The soft hexane extraction was
specifically designed to exclude the cooking step and heat supply whilst crushing the seed during the standard de-oiling
method. Forty eight white Duroc × Landrace males pigs (initial weight: 41± 2.7 kg) were allotted to 8 diets over 6 time
periods in a randomised design, testing each diet across six pigs. The experiment was approved by Ethical Review
Committee, University of Nottingham. At the end of experiment (body weight: 47± 3.6 kg) the pigs were culled via
barbiturate (not electrical stunning). Digesta were collected from the ileum, measured as 1 m from the ileal-caecal-colonic
junction towards the jejunum. Digestibility was assessed using titanium dioxide as an inert marker and evaluated by one-
way ANOVA without blocking (GenStat, 15th
edition). Data were considered statistically significant at p < 0.05.
Results The cold pressing method produced the greatest SID of CP and essential AA in the DK Cabernet RSC across all
samples tested. Within Harvest 2014 samples and compared to their RSM counterparts, the soft hexane extraction
significantly (P < 0.05) improved the SID of CP, Arg, His, Leu, Lys, Met+Cys, Thr and Val in DK Cabernet, and
significantly (P < 0.05) increased the SID only of Lys in PR46W21. However, the SID of Ile, Leu, Lys, Met+Cys, Phe, Thr,
Val and Trp did not significantly vary between the SRSM of DK Cabernet and PR46W21 varieties harvested in 2013 and
2014. Table 1 Standardised ileal digestibility of crude protein and amino acids.
Sample CP Arg His Ile Leu Lys MetCys Phe Thr Val Trp
2013 RSC
DK Cabernet 0.80
ab 0.91
a 0.90
a 0.86
a 0.83
a 0.85
a 0.84
a 0.84 0.77
a 0.77
a 0.78
a
2013 SRSM
DK Cabernet 0.72
abc 0.82
c 0.81
cd 0.79
ab 0.78
ab 0.69
bc 0.71
b 0.80 0.69
ab 0.73
a 0.77
a
2013 SRSM
V2750L 0.75
abc 0.89
ab 0.88
ab 0.84
a 0.83
a 0.77
ab 0.79
ab 0.83 0.75
a 0.79
a 0.79
a
2013 SRSM
PR46W21 0.81
a 0.87
abc 0.86
abc 0.83
a 0.81
a 0.76
ab 0.72
b 0.83 0.74
a 0.75
a 0.79
a
2014 SRSM
DK Cabernet 0.69
c 0.86
abc 0.83
bcd 0.79
ab 0.79
a 0.72
b 0.72
b 0.79 0.71
a 0.73
a 0.75
ab
2014 RSM
DK Cabernet 0.55
d 0.73
d 0.70
e 0.72
b 0.70
b 0.54
d 0.60
c 0.71 0.59
b 0.63
b 0.65
b
2014 SRSM
PR46W21 0.71
bc 0.85
bc 0.84
abcd 0.80
ab 0.80
a 0.73
b 0.70
bc 0.78 0.73
a 0.73
a 0.76
ab
2014 RSM
PR46W21 0.67
c 0.84
bc 0.78
d 0.78
ab 0.78
ab 0.62
cd 0.69
bc 0.78 0.68
ab 0.72
ab 0.45
c
Mean 0.71 0.85 0.83 0.80 0.79 0.71 0.72 0.80 0.71 0.73 0.72
CV, % 11.5 6.4 7.7 5.4 5.2 13.4 9.8 5.3 8.0 6.5 16.3
p value <0.001 <0.001 <0.001 0.043 0.059 <0.001 0.001 0.091 0.029 0.035 <0.001
Conclusion Nutritional value of rapeseed co-products, in terms of their CP and AA digestibility, is sensitive to oilseed rape
variety and oil extraction processing.
Acknowledgements This work is funded by AHDB Cereals and Oilseeds (RD-2012-3812).
References
Zhou, X., Oryschak, M.A., Zijlstra, R.T. and Beltranena, E. 2013. Animal Feed Science and Technology. 179, 112-120.

103
Rapeseed meal as home grown alternative to soya bean meal for fattening pigs J G M Houdijk
1, S Kightley
2, P Carre
3, M M Kasprzak
4, J Wiseman
4, O A Olukosi
1
1SRUC, Edinburgh, UK,
2NIAB, Cambridge, UK,
3CREOL, Pessoc, France,
4University of Nottingham, UK
Application Rapeseed meal may be used at greater levels than the typical 150 g/kg upper limit in nutritionally balanced
finisher feeds under UK conditions, and has the potential to replace soya bean meal with improved feed conversion ratio.
Introduction Rapeseed meal (RSM) is a protein source for fattening pig diets, with typical upper inclusion limit in the
UK of ~15%. Recent Canadian studies indicate that greater levels of RSM may be used in weaned pigs without detrimental
impact on performance (Landero et al., 2011). Here, we hypothesized that RSM prepared from modern varieties of UK
oilseed rape may be used at relatively large inclusion levels to replace soya bean meal (SBM) in fattening pig diets.
Material and methods RSM from two contrasting oilseed rape varieties (DK Cabernet and PR46W21, with
glucosinolates of 2.72 and 4.61 µmole/g dry matter, respectively) were used at 0, 50, 150 and 250 g/kg, gradually and
completely replacing SBM in finisher pig diets. The RSM were prepared at the oilseed crushing pilot plant CREOL under
commercial oil-extraction conditions, were analysed for amino acids, and using book values for standardized ileal
digestibility (SID) and net energy (NE) supply, iso-energetic diets were formulated (NE 9.3 MJ/kg), at similar SID lysine
(8.9 g/kg). Soya oil gradually increased from 13.7 to 45.4 g/kg, whilst wheat reduced from 265 to 165 g/kg. Pure amino
acids and macro-minerals levels were modified to meet requirements of methionine, threonine, tryptophan, calcium and
digestible phosphorus (BSAS, 2003). Barley, wheatfeed, salt and trace element / vitamin premix levels were kept constant.
Each RSM diet was fed ad libitum to two groups of three male and two groups of three female terminal line finisher LW ×
L pigs, for three weeks, after one week of adaptation period (n=4); the control diet was fed to four groups of males and
females (n=8). Body weight at housing was 61.7±0.9 and 61.9±0.9 kg for male and female pigs, respectively. Weekly live
weights for individual pigs, and pen feed intakes were taken to assess body weight gain (BWG, g/pig/day), average daily
feed intake (ADFI, g/pig/day) and feed conversion ratio (FCR as ADFI/BWG). Data was analysed for diet and sex effects
using a 7×2 factorial ANOVA, with pen as experimental unit, and housing body weight as covariate for ADFI and FCR,
and adaptation period BWG as covariate for test diet BWG. Orthogonal contrast statements were used to locate feeding
treatment effects as effects of RSM inclusion per se, RSM variety, RSM level, and their interaction.
Results There were no sex or diet effects on ADFI (Table 1). However, males grew faster than females (1207 vs 1130
g/day; s.e.d. 34 g/day; P=0.022), which tended to be more pronounced in the absence than in the presence of RSM (+175 vs
+45 g/day; s.e.d. 86 g/day; P=0.066). Males also grew at better FCR than females (2.24 vs 2.43; s.e.d. 0.04; P<0.001),
whilst FRC improved at greater levels of RSM, which tended to be stronger in DK Cabernet than in PR46W21 (Table 1).
Table 1 Effect of replacing soya bean meal (SBM) with rapeseed meal (RSM) on finisher pig performance.
RSM Variety RSM level (g/kg) SBM level (g/kg) ADFI (g/day) BWG (g/day) FCR
None 0 180 2684 1150 2.33
DK Cabernet 50 120 2807 1112 2.46
150 60 2647 1157 2.31
250 0 2601 1168 2.22
PR46W21 50 120 2706 1197 2.31
150 60 2921 1160 2.43
250 0 2702 1254 2.29
s.e.d. 120 60 0.07
P-values
Diet effects RSM 0.562 0.546 0.881
Variety 0.269 0.228 0.800
Level 0.299 0.321 0.040
Interaction 0.317 0.963 0.070
Conclusion This data support the view that RSM from modern varieties of oilseed rape may be used up to 250 g/kg
inclusion level, and as such completely replace SBM, in nutritionally complete finisher pig diets. This work is being
extended with grower pigs, whose performance is expected to be more sensitive to RSM feeding.
Acknowledgements The authors thank SRUC AVS animal technicians for their assistance. This work is funded by
AHDB Cereals and Oilseeds (RD-2012-3812). SRUC received support from Scottish Government (RESAS).
References
BSAS 2003. Nutrient Requirement Standards for Pigs. British Society of Animal Science, Midlothian, UK.
Hazzledine, M. 2008. Premier Atlas Ingredients Matrix. Rugeley: Premier Nutrition Products Ltd.
Landero JL, Beltranena E, Cervantes M, Morales A, and Zijlstra RT, 2011. Animal Feed Science and Technology 170,
136-140.
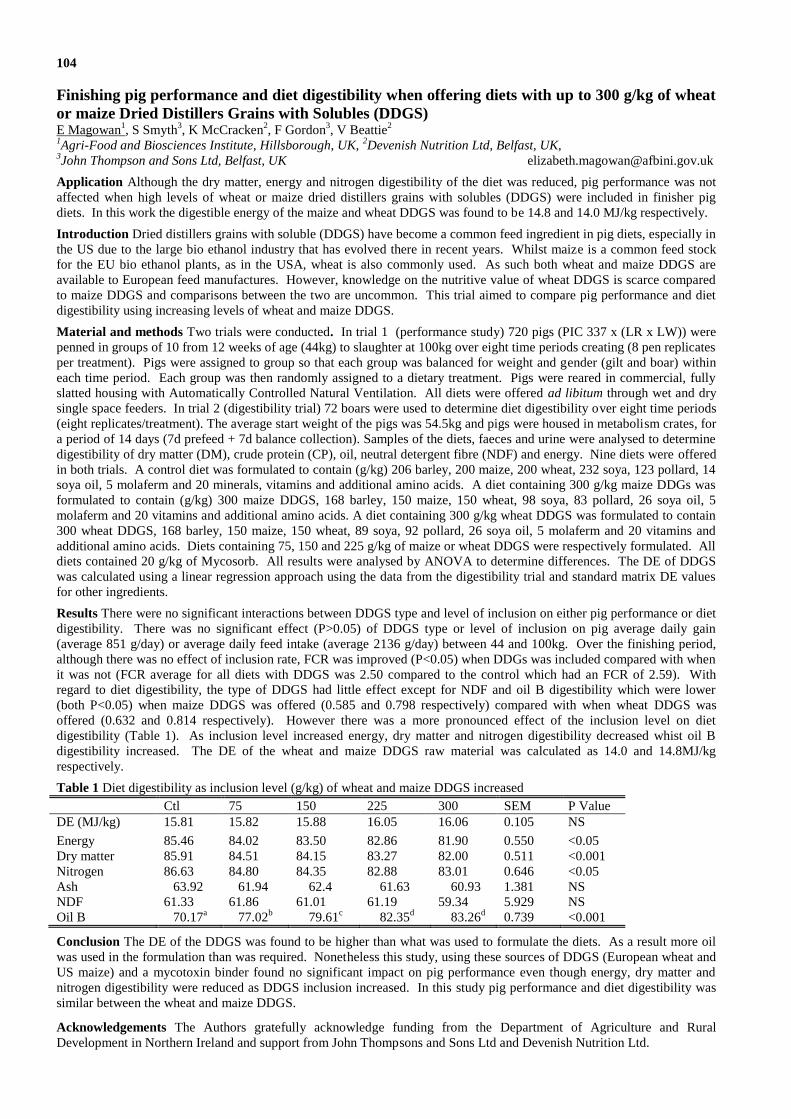
104
Finishing pig performance and diet digestibility when offering diets with up to 300 g/kg of wheat
or maize Dried Distillers Grains with Solubles (DDGS) E Magowan
1, S Smyth
3, K McCracken
2, F Gordon
3, V Beattie
2
1Agri-Food and Biosciences Institute, Hillsborough, UK,
2Devenish Nutrition Ltd, Belfast, UK,
3John Thompson and Sons Ltd, Belfast, UK [email protected]
Application Although the dry matter, energy and nitrogen digestibility of the diet was reduced, pig performance was not
affected when high levels of wheat or maize dried distillers grains with solubles (DDGS) were included in finisher pig
diets. In this work the digestible energy of the maize and wheat DDGS was found to be 14.8 and 14.0 MJ/kg respectively.
Introduction Dried distillers grains with soluble (DDGS) have become a common feed ingredient in pig diets, especially in
the US due to the large bio ethanol industry that has evolved there in recent years. Whilst maize is a common feed stock
for the EU bio ethanol plants, as in the USA, wheat is also commonly used. As such both wheat and maize DDGS are
available to European feed manufactures. However, knowledge on the nutritive value of wheat DDGS is scarce compared
to maize DDGS and comparisons between the two are uncommon. This trial aimed to compare pig performance and diet
digestibility using increasing levels of wheat and maize DDGS.
Material and methods Two trials were conducted. In trial 1 (performance study) 720 pigs (PIC 337 x (LR x LW)) were
penned in groups of 10 from 12 weeks of age (44kg) to slaughter at 100kg over eight time periods creating (8 pen replicates
per treatment). Pigs were assigned to group so that each group was balanced for weight and gender (gilt and boar) within
each time period. Each group was then randomly assigned to a dietary treatment. Pigs were reared in commercial, fully
slatted housing with Automatically Controlled Natural Ventilation. All diets were offered ad libitum through wet and dry
single space feeders. In trial 2 (digestibility trial) 72 boars were used to determine diet digestibility over eight time periods
(eight replicates/treatment). The average start weight of the pigs was 54.5kg and pigs were housed in metabolism crates, for
a period of 14 days (7d prefeed + 7d balance collection). Samples of the diets, faeces and urine were analysed to determine
digestibility of dry matter (DM), crude protein (CP), oil, neutral detergent fibre (NDF) and energy. Nine diets were offered
in both trials. A control diet was formulated to contain (g/kg) 206 barley, 200 maize, 200 wheat, 232 soya, 123 pollard, 14
soya oil, 5 molaferm and 20 minerals, vitamins and additional amino acids. A diet containing 300 g/kg maize DDGs was
formulated to contain (g/kg) 300 maize DDGS, 168 barley, 150 maize, 150 wheat, 98 soya, 83 pollard, 26 soya oil, 5
molaferm and 20 vitamins and additional amino acids. A diet containing 300 g/kg wheat DDGS was formulated to contain
300 wheat DDGS, 168 barley, 150 maize, 150 wheat, 89 soya, 92 pollard, 26 soya oil, 5 molaferm and 20 vitamins and
additional amino acids. Diets containing 75, 150 and 225 g/kg of maize or wheat DDGS were respectively formulated. All
diets contained 20 g/kg of Mycosorb. All results were analysed by ANOVA to determine differences. The DE of DDGS
was calculated using a linear regression approach using the data from the digestibility trial and standard matrix DE values
for other ingredients.
Results There were no significant interactions between DDGS type and level of inclusion on either pig performance or diet
digestibility. There was no significant effect (P>0.05) of DDGS type or level of inclusion on pig average daily gain
(average 851 g/day) or average daily feed intake (average 2136 g/day) between 44 and 100kg. Over the finishing period,
although there was no effect of inclusion rate, FCR was improved (P<0.05) when DDGs was included compared with when
it was not (FCR average for all diets with DDGS was 2.50 compared to the control which had an FCR of 2.59). With
regard to diet digestibility, the type of DDGS had little effect except for NDF and oil B digestibility which were lower
(both P<0.05) when maize DDGS was offered (0.585 and 0.798 respectively) compared with when wheat DDGS was
offered (0.632 and 0.814 respectively). However there was a more pronounced effect of the inclusion level on diet
digestibility (Table 1). As inclusion level increased energy, dry matter and nitrogen digestibility decreased whist oil B
digestibility increased. The DE of the wheat and maize DDGS raw material was calculated as 14.0 and 14.8MJ/kg
respectively.
Table 1 Diet digestibility as inclusion level (g/kg) of wheat and maize DDGS increased
Ctl 75 150 225 300 SEM P Value
DE (MJ/kg) 15.81 15.82 15.88 16.05 16.06 0.105 NS
Energy 85.46 84.02 83.50 82.86 81.90 0.550 <0.05
Dry matter 85.91 84.51 84.15 83.27 82.00 0.511 <0.001
Nitrogen 86.63 84.80 84.35 82.88 83.01 0.646 <0.05
Ash 63.92 61.94 62.4 61.63 60.93 1.381 NS
NDF 61.33 61.86 61.01 61.19 59.34 5.929 NS
Oil B 70.17a 77.02
b 79.61
c 82.35
d 83.26
d 0.739 <0.001
Conclusion The DE of the DDGS was found to be higher than what was used to formulate the diets. As a result more oil
was used in the formulation than was required. Nonetheless this study, using these sources of DDGS (European wheat and
US maize) and a mycotoxin binder found no significant impact on pig performance even though energy, dry matter and
nitrogen digestibility were reduced as DDGS inclusion increased. In this study pig performance and diet digestibility was
similar between the wheat and maize DDGS.
Acknowledgements The Authors gratefully acknowledge funding from the Department of Agriculture and Rural
Development in Northern Ireland and support from John Thompsons and Sons Ltd and Devenish Nutrition Ltd.

105
The effect of high phytase doses on phytate degradation and myo-inositol release in the
grower pig S Laird
1, C Brearley
2, I Kuehn
3, H M Miller
1
1Univeristy of Leeds, UK,
2University of East Anglia, Norwich, UK,
3AB Vista, Malborough, UK
Application Phytase at levels above the current standard recommendation further improve phytate degradation and myo-
inositol (MYO) release in pigs fed wheat-barley based diets.
Introduction Microbial phytases are commonly added to monogastric diets to degrade dietary phytate (myo-inositol
hexaphopshate, InsP6) and in doing so reduce the need for inorganic phosphate supplementation. Recent research has
shown that phytase can yield further improvements in nutrient bioavailability and growth performance in pigs when
included at levels above the standard recommendation (Santos et al., 2014). The underlying mechanism for this favourable
remains to be elucidated. It has been suggested that MYO, the end product of complete phytate hydrolysis, may be
involved (Cowieson et al., 2015). This study set out to determine the effect of high phytase levels on phytate degradation
and MYO generation in the grower pig.
Material and methods A total of 288 crossbred ((Large White x Landrace) x MAXGRO) grower pigs (initial BW 36.7 kg)
were used in this 28 day experiment. Pigs were blocked into pens of 4 (mixed sex) on the basis of body weight (BW), sex
and litter. Within block, pens were randomly assigned to one of 6 wheat-barley based diets (n = 12). Dietary treatments
included: (PC) a positive control formulated to meet or exceed the nutritional recommendations according to BSAS (2003);
(NC) a negative control diet similar to the PC but with reductions in Ca (1.6 g/kg), P (1.24 g/kg), Lys (0.17 g/kg), Thr (0.33
g/kg) and ME (0.217 MJ/kg); and the NC diet supplemented with phytase at 500, 1,000, 2,000 or 8,000 FTU/kg. Feed was
offered ad libitum throughout the experiment. At the end of the trial (d 29 and 30) 10 pigs per treatment, each from
different pens, were euthanised for the collection of blood and ileal digesta. Portal and peripheral blood samples were
collected into heparinised tubes from the portal and the jugular vein respectively prior to MYO analysis. Ileal digesta were
obtained from the terminal ileum, freeze dried and analysed for phytate, phytate hydrolysis products myo-inositol penta- to
di- phosphate (InsP2-6) and MYO. Data were analysed as a randomised complete block design using the GLM procedure of
SPSS. Orthogonal polynomial contrasts were used to test for linear and quadratic responses to phytase supplementation.
Results Ileal InsP6 and InsP5 concentrations were reduced in response to phytase treatment (linear P<0.01, quadratic
P<0.01; Table 1). Concomitantly, there were linear increases in ileal InsP4, InsP3 and MYO concentrations (P<0.01). In
support of the ileal phytate degradation data are the plasma MYO data (Figure 1) which showed linear increases in portal
and peripheral plasma MYO in response to phytase (P<0.001). MYO levels in the portal blood were higher than in the
peripheral blood (P<0.001).
Table 1 Effect of dietary phytase level on ileal InsP2-6 and MYO
concentration (nmol/g DM).
Diet MYO InsP2 InsP3 InsP4 InsP5 InsP6
PC 4,422 5,330 917 1,711 3,052 21,616
NC 4,309 5,142 657 1,204 2,950 25,189
500 7,729 5,634 1,236 2,658 2,075 15,217
1000 9,964 4,663 1,195 1,972 1,271 12,505
2000 12,812 5,841 1,172 1,771 987 11,038
8000 14,086 5,149 413 304 574 7,868
SEM 1,744 821 177 400 311 2,817
P value
Linear 0.001 0.907 0.002 <0.001 <0.001 0.001
Quadratic 0.008 0.449 0.012 0.162 <0.001 0.007
Conclusion Increasing phytase dose reduced ileal phytate concentration and increased MYO release, resulting in higher
MYO blood levels. Lower levels of phytase increased InsP4 and InsP3 to a peak at 1000 FTU/kg with further increments
reducing these below the control. These data support the current tenet that MYO is involved in the high phytase dosing
response.
References
BSAS. 2003. Nutrient Requirement Standards for Pigs. British Society of Animal Science, Midlothian, UK
Cowieson, A.J., Aureli, R., Guggenbuhl, P., Fru-Nji, F. 2015. Animal Production Science. 55, 710-719 Santos, T.T., Walk, C.T., Wilcock, P., Cordero, G., and Chewning, J. 2014. Canadian Journal of Animal Science. 94, 493-497
Figure 1 Effect of dietary phytase level on portal
and peripheral plasma MYO concentration.
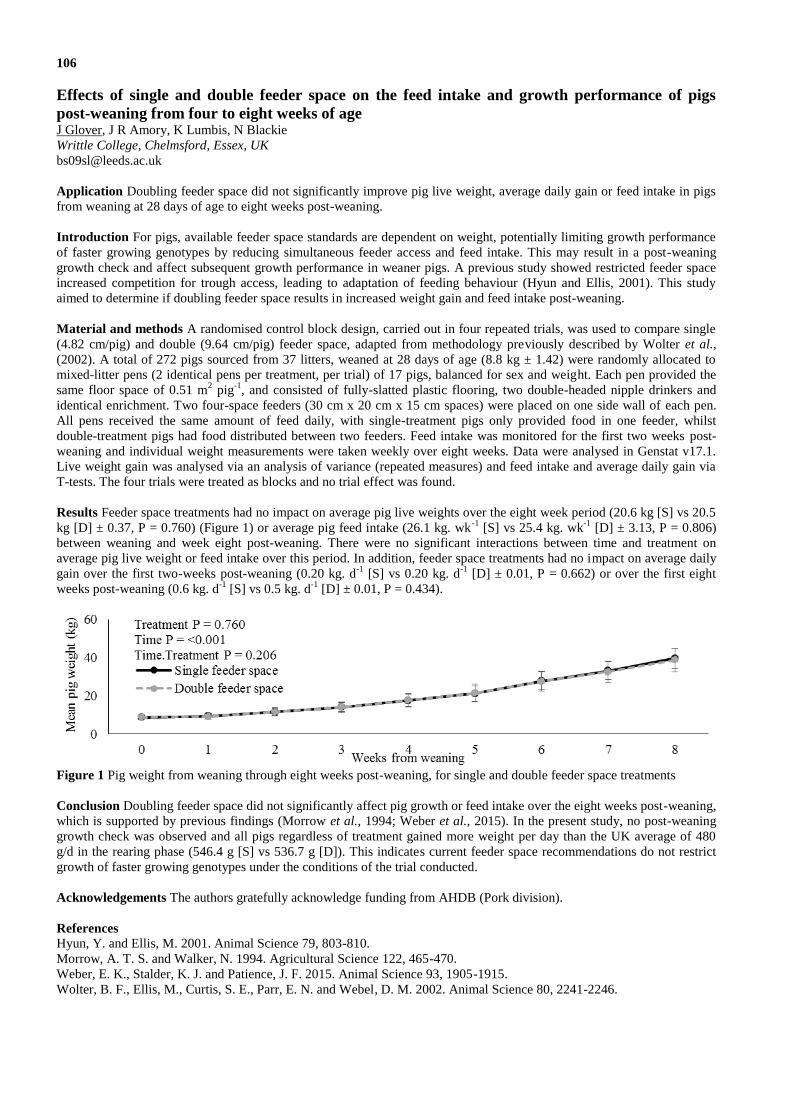
106
Effects of single and double feeder space on the feed intake and growth performance of pigs
post-weaning from four to eight weeks of age J Glover, J R Amory, K Lumbis, N Blackie
Writtle College, Chelmsford, Essex, UK
Application Doubling feeder space did not significantly improve pig live weight, average daily gain or feed intake in pigs
from weaning at 28 days of age to eight weeks post-weaning.
Introduction For pigs, available feeder space standards are dependent on weight, potentially limiting growth performance
of faster growing genotypes by reducing simultaneous feeder access and feed intake. This may result in a post-weaning
growth check and affect subsequent growth performance in weaner pigs. A previous study showed restricted feeder space
increased competition for trough access, leading to adaptation of feeding behaviour (Hyun and Ellis, 2001). This study
aimed to determine if doubling feeder space results in increased weight gain and feed intake post-weaning.
Material and methods A randomised control block design, carried out in four repeated trials, was used to compare single
(4.82 cm/pig) and double (9.64 cm/pig) feeder space, adapted from methodology previously described by Wolter et al.,
(2002). A total of 272 pigs sourced from 37 litters, weaned at 28 days of age (8.8 kg ± 1.42) were randomly allocated to
mixed-litter pens (2 identical pens per treatment, per trial) of 17 pigs, balanced for sex and weight. Each pen provided the
same floor space of 0.51 m2 pig
-1, and consisted of fully-slatted plastic flooring, two double-headed nipple drinkers and
identical enrichment. Two four-space feeders (30 cm x 20 cm x 15 cm spaces) were placed on one side wall of each pen.
All pens received the same amount of feed daily, with single-treatment pigs only provided food in one feeder, whilst
double-treatment pigs had food distributed between two feeders. Feed intake was monitored for the first two weeks post-
weaning and individual weight measurements were taken weekly over eight weeks. Data were analysed in Genstat v17.1.
Live weight gain was analysed via an analysis of variance (repeated measures) and feed intake and average daily gain via
T-tests. The four trials were treated as blocks and no trial effect was found.
Results Feeder space treatments had no impact on average pig live weights over the eight week period (20.6 kg [S] vs 20.5
kg [D] ± 0.37, P = 0.760) (Figure 1) or average pig feed intake (26.1 kg. wk-1
[S] vs 25.4 kg. wk-1
[D] ± 3.13, P = 0.806)
between weaning and week eight post-weaning. There were no significant interactions between time and treatment on
average pig live weight or feed intake over this period. In addition, feeder space treatments had no impact on average daily
gain over the first two-weeks post-weaning (0.20 kg. d-1
[S] vs 0.20 kg. d-1
[D] ± 0.01, P = 0.662) or over the first eight
weeks post-weaning (0.6 kg. d-1
[S] vs 0.5 kg. d-1
[D] ± 0.01, P = 0.434).
Figure 1 Pig weight from weaning through eight weeks post-weaning, for single and double feeder space treatments
Conclusion Doubling feeder space did not significantly affect pig growth or feed intake over the eight weeks post-weaning,
which is supported by previous findings (Morrow et al., 1994; Weber et al., 2015). In the present study, no post-weaning
growth check was observed and all pigs regardless of treatment gained more weight per day than the UK average of 480
g/d in the rearing phase (546.4 g [S] vs 536.7 g [D]). This indicates current feeder space recommendations do not restrict
growth of faster growing genotypes under the conditions of the trial conducted.
Acknowledgements The authors gratefully acknowledge funding from AHDB (Pork division).
References
Hyun, Y. and Ellis, M. 2001. Animal Science 79, 803-810.
Morrow, A. T. S. and Walker, N. 1994. Agricultural Science 122, 465-470.
Weber, E. K., Stalder, K. J. and Patience, J. F. 2015. Animal Science 93, 1905-1915.
Wolter, B. F., Ellis, M., Curtis, S. E., Parr, E. N. and Webel, D. M. 2002. Animal Science 80, 2241-2246.

107
Performance of individual piglets when reared on sows divergent in output potential A Craig
1,2, E Magowan
1,2
1AFBI, Hillsborough, Northern Ireland, UK,
2Queen’s University Belfast, Northern Ireland, UK
Application Sows in the top quartile, in terms of litter performance, weaned an average of 123kg of litter weight, while
sows in the bottom quartile weaned 94kg. This increase in total litter weaning weight had no effect on within litter
variation.
Introduction It is well documented that larger birth weight (BW) pigs reach heavier weaning weights (WW) (Fix et al.,
2010). How individual pigs perform on sows that have divergent outputs, in terms of weaning weight, is yet to be
discussed. Identifying how piglets respond within the litter could help producers improve performance across the whole
herd. This report aims to identify how pigs with a range of birth weights perform when reared on sows with different levels
of output.
Material and methods Using data from a trial reported by Craig and Magowan (2015), sows were assigned to top quartile
(n=29), mid-range (n=57) or bottom quartile (n=29) according to litter weight weaned. Pigs were weighed at 0, 7, 14, 21
and 28 days. Body condition score (BCS), backfat depth (measured at P2) and sow weight were recorded at farrowing and
weaning. Sow feed intake was also recorded. Pig and litter average daily gain (ADG), birth and wean coefficient of
variation (CoV) and daily digestible energy (DE), crude protein (CP), lysine and valine intakes were calculated. Individual
pigs were categorised within each litter according to BW into small (<1.2kg), medium (1.2-1.8kg) or large (>1.8kg). Data
was analysed using analysis of variance (ANOVA). Details of covariates are presented below.
Results Top quartile sows weaned an extra 28.2kg (P<0.001) of litter weight and an extra piglet (P<0.001) compared to the
bottom quartile (Table 1). Top quartile sows also had a higher ADFI (P=0.002) and ate an average of 7.9kg per day (i.e.
116.14 MJ DE/day and 79.9g lysine/d). There was no significant effect of sow ranking on the birth (0.17) and wean (0.21)
CoV, sow P2 change (-3.6), BCS change (-0.4) or weight change (6.2kg) between farrowing and weaning. Top quartile
sows had a higher proportion of large BW pigs at birth than bottom quartile sows (30% v. 11%). All pigs suckling top
quartile sows grew significantly faster (P<0.001) compared to their counterparts reared on the bottom quartile sows (Table
2). The weaning weight of medium and large pigs increased as overall litter weight increased but for small pigs although
weaning weight increased when pigs were reared on ‘mid’ sows compared with ‘bottom’ sows, the weaning weight of light
birth weight piglets did not increase any further even when they were reared on ‘top’ quartile sows.
Table 1 Performance of sows according to percentile*
Bottom 25% Mid 50% Top 25% P. Value SEM
Total Litter WW (kg) 94.1
a 109
b 122.7
c <.001 1.19
No. Weaned 12.2a 12.9
b 13.2
b <.001 0.11
ADFI (kg/d) 7.1a 7.6
b 7.9
b 0.002 0.16
*Covariates used: lactation length, no. of pigs after cross-fostering and litter weight after cross-fostering
Table 2 WW (kg) and ADG (kg) of individual piglets of different BW within each percentile*
Small (<1.2kg) Medium (1.2-1.8kg) Large (>1.8kg)
Wean Wt. ADG B-W Wean Wt. ADG B-W Wean Wt. ADG B-W
Bottom 25% 6.7a 0.193
a 8.0
a 0.230
a 8.8
a 0.241
a
Mid 50% 7.6b 0.230
b 8.5
b 0.251
b 9.4
b 0.263
a
Top 25% 7.6b 0.231
b 9.2
c 0.272
c 10.5
c 0.297
b
P. Value <.001 <.001 <.001 <.001 <.001 <.001
SEM 0.18 0.0072 0.093 0.0034 0.273 0.0104
*Covariates used: lactation length and number weaned
Conclusion The difference in sow potential during lactation within this data set equated to a difference of 28kg per litter
weaned. Commercially, litter WW are commonly 100kg and this examination of data has demonstrated the future
potential of sows. Furthermore, it appears that these high outputs can be achieved with no detrimental effect on body
condition. Whilst the WW of medium and large BW pigs increased as sow overall output increased, the WW of light BW
pigs did not. Although small BW pigs have been found to have WW of over 8kg at an individual pig level, this study
would suggest that, at a population level, the growth potential of small pigs becomes limiting compared with medium and
heavy BW piglets.
Acknowledgements The authors gratefully acknowledge funding from DARD NI and PigRegen.
References
Craig A. and Magowan, E. 2015. EAAP 2015 Book of Abstracts 116.
Fix, J. S., et al. 2010. Livestock Science Vol, 127, 51-59.
108
Identifying the optimum average pig weight to change diet in the finisher stage E Magowan
1, J Kennan
2, R Bradford
3, E Lawrence
2, B Marshall
2, V Beattie
2
1Agri-Food and Biosciences Institute, Hillsborough, UK,
2Devenish Nutrition Ltd, Belfast, UK,
3Preferrd Capital
Management, Belfast, UK
Application Changing the diet from a grower to a finisher pig diet when pigs are on average 60kg optimises the
performance of the group of animals and represents the lowest feed cost per kg gain during the finishing period.
Introduction Finishing feed accounts for approximately 70% of the feed used in a birth to bacon unit. Financially 60% of
feed cost is in the finishing period and a 0.1 unit improvement in feed conversion ratio (FCR) can increase profitability by
£18000 on a typical 500 sow unit. Pigs normally change from a grower to a finisher diet on entry to the finishing pig
accommodation (approximately 40kg) even though weight within that group of pigs could range from 25 to 50kg. This
trial investigated the impact of targeting a specific weight to change from the grower to the finisher diet on finishing pig
performance.
Material and methods The study was carried out on a commercial farm. There were five dietary treatments with each
being replicated eight times over four time periods. Dietary treatments represented a positive control where the grower diet
was offered through the entire finisher period or the diet changed from a grower to a finisher diet when average pig weight
in the pen was either 40, 50, 60 or 70kg. There were 15 pigs per pen and within time periods pens of pigs were balanced
for weight and gender (entire boars and gilts). The grower diet was a commercial mix and contained CP 185 g/kg, total
lysine 12.5 g/kg, DE 14.6 MJ/kg. The finisher diet was also a commercial mix and contained CP 170 g/kg, total lysine 10
g/kg, DE 13.8 MJ/kg. Diets were offered in dry pelleted form through single space wet and dry feeders with one feeder per
15 pigs. Pens of pigs were weighed at the start (approximately 13 weeks of age) and every two weeks until the first pigs
went for slaughter after which they were weighed every week. Pigs were weighed individually when being sent for
slaughter. Pen feed intake was recorded daily and any feed left at the end of the trial was weighed. Cold weight and back
fat depth at P2 was recorded at the factory before chill. Data was analysed using ANOVA with pen being the experimental
unit and start weight was used as a covariate.
Results Average daily feed intake was not significantly different (P>0.05) over the finishing period (37 to 118kg) and
averaged 2.48kg/day. There was a significant quadratic response (P<0.05) of diet on growth rate with growth rate
increasing as transfer weight increased to 60kg but numerically decreasing again when transfer weight was 70kg (Table 1).
FCR showed a similar quadratic response (P<0.01) with FCR improving as transfer weight increased to 60kg but no further
improvement was noted when transfer weight was 70kg (Table 1). There was no difference in back fat depth at P2 across
treatments with the average being 13.8mm (sed 0.46). The growth rate and FCR of pigs offered the positive control was
similar to those pigs whose diet changed at 60 or 70 kg. When offered the grower diet (within treatments 50, 60 and 70)
the daily gain of pigs averaged 1099 g/d and their feed conversion ratio averaged 1.93. When these pigs moved to the
finisher diet (within treatments 50, 60 and 70) their growth rate averaged 1017 g/d and FCR was 2.66. Using a differential
of £30/tonne the cost per kg gain followed the same pattern as the performance figures with changing diet at 60 kg being
optimum at 49.6p/kg while changing before or after 60 kg averaged 50.5p/kg.
Table 1 Pig performance when pigs changed from a grower diet to a finisher diet at 40, 50, 60 or 70kg or were offered the
grower diet throughout finishing.
Weight of diet change (kg) P Values
40 50 60 70 +ve SED Treatment Linear Quadratic
FCR 2.51b 2.48
b 2.41
ab 2.40
ab 2.33
a 0.055 0.017 0.874 0.005
ADG (g/day) 984a 998
ab 1061
c 1031
bc 1055
bc 22.0 0.002 0.413 0.013
ADFI (g/day) 2467 2461 2554 1476 2459 36.7 0.150 0.256 0.611
Cost/kg gain (p) 50.4 50.0 49.6 50.9 54.0
Conclusion Pigs offered the finisher diet from 40 kg had the same average daily feed intake as pigs offered the grower diet
throughout the finishing period. However due to the different nutrient levels in these diets pigs which were offered grower
diet throughout consumed 6% more energy and 20% more lysine and as a result increased growth rate by 73 g/d and
reduced FCR by 0.17 units. This study suggests that offering the more nutrient dense grower diet to 60kg will optimise
herd performance and economic return.
Acknowledgements The authors gratefully acknowledge funding from DARD RCF funding.
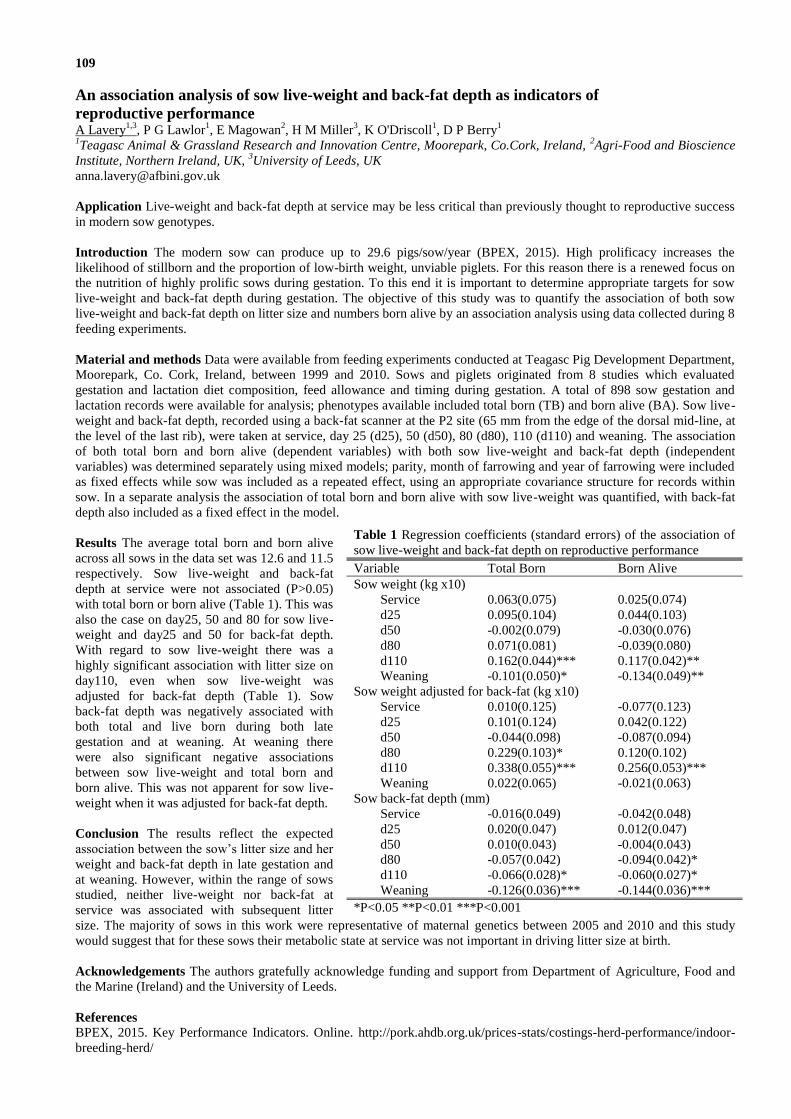
109
An association analysis of sow live-weight and back-fat depth as indicators of
reproductive performance A Lavery
1,3, P G Lawlor
1, E Magowan
2, H M Miller
3, K O'Driscoll
1, D P Berry
1
1Teagasc Animal & Grassland Research and Innovation Centre, Moorepark, Co.Cork, Ireland,
2Agri-Food and Bioscience
Institute, Northern Ireland, UK, 3University of Leeds, UK
Application Live-weight and back-fat depth at service may be less critical than previously thought to reproductive success
in modern sow genotypes.
Introduction The modern sow can produce up to 29.6 pigs/sow/year (BPEX, 2015). High prolificacy increases the
likelihood of stillborn and the proportion of low-birth weight, unviable piglets. For this reason there is a renewed focus on
the nutrition of highly prolific sows during gestation. To this end it is important to determine appropriate targets for sow
live-weight and back-fat depth during gestation. The objective of this study was to quantify the association of both sow
live-weight and back-fat depth on litter size and numbers born alive by an association analysis using data collected during 8
feeding experiments.
Material and methods Data were available from feeding experiments conducted at Teagasc Pig Development Department,
Moorepark, Co. Cork, Ireland, between 1999 and 2010. Sows and piglets originated from 8 studies which evaluated
gestation and lactation diet composition, feed allowance and timing during gestation. A total of 898 sow gestation and
lactation records were available for analysis; phenotypes available included total born (TB) and born alive (BA). Sow live-
weight and back-fat depth, recorded using a back-fat scanner at the P2 site (65 mm from the edge of the dorsal mid-line, at
the level of the last rib), were taken at service, day 25 (d25), 50 (d50), 80 (d80), 110 (d110) and weaning. The association
of both total born and born alive (dependent variables) with both sow live-weight and back-fat depth (independent
variables) was determined separately using mixed models; parity, month of farrowing and year of farrowing were included
as fixed effects while sow was included as a repeated effect, using an appropriate covariance structure for records within
sow. In a separate analysis the association of total born and born alive with sow live-weight was quantified, with back-fat
depth also included as a fixed effect in the model.
Results The average total born and born alive
across all sows in the data set was 12.6 and 11.5
respectively. Sow live-weight and back-fat
depth at service were not associated (P>0.05)
with total born or born alive (Table 1). This was
also the case on day25, 50 and 80 for sow live-
weight and day25 and 50 for back-fat depth.
With regard to sow live-weight there was a
highly significant association with litter size on
day110, even when sow live-weight was
adjusted for back-fat depth (Table 1). Sow
back-fat depth was negatively associated with
both total and live born during both late
gestation and at weaning. At weaning there
were also significant negative associations
between sow live-weight and total born and
born alive. This was not apparent for sow live-
weight when it was adjusted for back-fat depth.
Conclusion The results reflect the expected
association between the sow’s litter size and her
weight and back-fat depth in late gestation and
at weaning. However, within the range of sows
studied, neither live-weight nor back-fat at
service was associated with subsequent litter
size. The majority of sows in this work were representative of maternal genetics between 2005 and 2010 and this study
would suggest that for these sows their metabolic state at service was not important in driving litter size at birth.
Acknowledgements The authors gratefully acknowledge funding and support from Department of Agriculture, Food and
the Marine (Ireland) and the University of Leeds.
References
BPEX, 2015. Key Performance Indicators. Online. http://pork.ahdb.org.uk/prices-stats/costings-herd-performance/indoor-
breeding-herd/
Table 1 Regression coefficients (standard errors) of the association of
sow live-weight and back-fat depth on reproductive performance
Variable Total Born Born Alive
Sow weight (kg x10)
Service 0.063(0.075) 0.025(0.074)
d25 0.095(0.104) 0.044(0.103)
d50 -0.002(0.079) -0.030(0.076)
d80 0.071(0.081) -0.039(0.080)
d110 0.162(0.044)*** 0.117(0.042)**
Weaning -0.101(0.050)* -0.134(0.049)**
Sow weight adjusted for back-fat (kg x10)
Service 0.010(0.125) -0.077(0.123)
d25 0.101(0.124) 0.042(0.122)
d50 -0.044(0.098) -0.087(0.094)
d80 0.229(0.103)* 0.120(0.102)
d110 0.338(0.055)*** 0.256(0.053)***
Weaning 0.022(0.065) -0.021(0.063)
Sow back-fat depth (mm)
Service -0.016(0.049) -0.042(0.048)
d25 0.020(0.047) 0.012(0.047)
d50 0.010(0.043) -0.004(0.043)
d80 -0.057(0.042) -0.094(0.042)*
d110 -0.066(0.028)* -0.060(0.027)*
Weaning -0.126(0.036)*** -0.144(0.036)***
*P<0.05 **P<0.01 ***P<0.001
110
Investigating physiological measures of lifetime welfare in slaughter pigs G A Carroll
1, L A Boyle
2, A Hanlon
3, M Palmer
1, L Collins
4, K Griffin
1, N E O' Connell
1
1Queens University Belfast, UK,
2Teagasc, Cork, Ireland,
3UCD, Dublin, Ireland,
4University of Lincoln, UK
Application Elevated levels of haptoglobin (Hp), C-Reactive Protein (CRP) and hair cortisol sampled from pigs at
slaughter were associated with health and welfare problems identified throughout life and therefore may be useful measures
to integrate into abattoir-based welfare inspections.
Introduction Physiological measures indicative of medium to long-term welfare could form part of abattoir-based welfare
assessments of farm animals. Individual physiological measures vary in how they respond to compromised health and
welfare and it may therefore be beneficial to assess a combination of measures to gain a holistic view of herd health status.
The aim of this study was to determine the extent to which Hp and CRP, measured from exsanguinated blood, and hair
cortisol levels, sampled one day prior to slaughter, reflected welfare problems identified throughout the pigs life. Welfare
assessments were based on lesions and health status (e.g. lameness and coughing) and qualitative behavioural assessments
(QBA; Wemelsfelder, 1997).
Material and methods A total of 65 pigs from an experimental farm were used in this study. Data were collected between
June and December 2014. Welfare assessments were carried out on each pig at 7 and 9 weeks of age (in the weaning unit),
and at 10, 15, and 20 weeks of age (in the finishing unit). On each observation week, skin lesions scores were recorded
from [0] no injuries to [5] many very big, deep and red lesions in 12 body zones. Tail lesions were also recorded ([0] no
evidence of tail biting to [4] partial or total loss of tail), as was presence or absence (P/A) of different health issues
(lameness, bursitis, hernias, rectal prolapse, scouring, coughing, poor body condition and aural hematomas). QBA scores
were also made by scoring each pig on positive (e.g. ’happy’) and negative (e.g. ‘frustrated’) behavioural descriptors.
One day prior to slaughter, hair was collected from the rump area of each pig using a surgical scissors. Samples were
washed and treated using the methods described by Davenport et al. (2006) with the following adjustments; hair samples
were washed in isopropanol several times. Each sample was dried and cut into 1-2 mm sections. 60 mg of the sample was
weighed into a 4 ml tube. The samples were pulverized, 2 ml methanol added and the vial incubated overnight at room
temperature with constant gentle agitation for steroid extraction. Following extraction, methanol was transferred to a fresh
vial, evaporated in a scanvan vacuum centrifuge and stored at −80°C. ubsequently, Enzyme mmunoassay analysis was
performed as per Davenport et al (2006). On the day of slaughter, blood samples were taken from each pig at the point of
exsanguination. Concentrations of Hp and CRP were determined in duplicate using commercial assay kits in accordance
with the manufacturer’s instructions. QBA scores were analysed using principal components analysis. A number of fixed
effect models were used to examine the effects of control variables (live weight, average daily weight gain, sex, weaning
pen enrichment, pen size), and the following predictor variables; skin lesion scores, tail lesion scores, the P/A of each
individual health issue, the P/A of at least one health issue in the lifetime, and QBA scores, on levels of serum Hp and
CRP, and hair cortisol. All statistical analyses were carried out using SPSS version 20.
Results Pigs with tail lesions at any stage on farm had greater hair cortisol levels than those with no tail lesions (tail
lesions: 50.49±2.55 pg/mg, no tail lesions: 38.88±3.18 pg/mg, F = 8.94, P < 0.05). Pigs lame on at least one observation
week on farm had greater cortisol levels than those with no lameness on farm (lame: 51.91±2.88 pg/mg, not lame:
43.55±2.41 pg/mg, F = 4.67, P < 0.05). Pigs with moderate or severe tail lesions on farm had greater Hp levels than those
with no or mild tail lesions (moderate/severe: 1.22±0.41 mg/ml, none/mild: 0. 0±0.08 mg/ml, F = 4.48, P < 0.0 ). As ‘good
welfare’ QBA scores decreased, Hp levels tended to increase (F = . 21, P = 0.062) while CRP levels clearly increased (F
= 15.97, P < 0.001). No control variables contributed significantly to explaining Hp, CRP or hair cortisol levels.
Conclusion Physiological measures recorded at slaughter differed depending on whether or not the pig had been recorded
with different welfare-related conditions during its life. This suggests that they may be useful indicators of lifetime welfare
status, and that the use of both hair cortisol and acute phase proteins provides a more holistic picture.
Acknowledgements Funded by the Irish Dept. of Agriculture, Food and the Marine (Research Stimulus Fund (Grant
11/S/107).
References
Davenport, M., Tiefenbacher, S., Lutz, C., Novak, M. and Meyer, J. 2006. General and Comparative Endocrinology 147,
255–26
Wemelsfelder, F. 1997. Applied Animal Behaviour Science 53, 75–88.

111
Life cycle assessment (LCA) applied to Irish commercial pig production G A McAuliffe
1,2, T Takahashi
1,2, C L Sage
3, D V Chapman
4, M R F Lee
1,2
1Rothamsted Research North Wyke, Okehampton, UK,
2University of Bristol, UK,
3Department of Geography, University
College Cork, Ireland, 4School of Biological, Earth and Environmental Sciences, University College Cork, Ireland
Application The study was the first life cycle assessment (LCA) of Irish pig production, providing producers and policy
makers with insights into alternative strategies for reducing the sector’s environmental footprint.
Introduction Intensive pig production is widely regarded as having a negative impact on the environment. One method for
assessing a livestock system’s environmental performance is LCA, which models systems’ inputs and outputs and
calculates potential impacts on various categories such as global warming potential (GWP). This paper applies LCA to Irish
pig production under current and hypothetical production scenarios and highlights potential improvement opportunities.
Material and methods Figure 1 displays the system boundary from the production of crops for animal feed, to the
slaughterhouse gate. The functional unit was 1
kg of pig meat leaving the slaughterhouse. Data
on feed production were supplied by two
different Irish feed mills (one on-site mill and
one off-site mill). To build an inventory of Irish
pig production, a combination of herd
performance data for 2012 from Teagasc, and
environmental reports from the Irish
Environmental Protection Agency (EPA) were
utilised. Four scenarios representing typical pig
production in Ireland were created, depending
on the source (and hence ingredients) of feed
and herd feed efficiency (feed required for
weight-gain). For comparative analysis, four
replicate scenarios were also created to
examine the effects of replacing internationally
imported wheat and barley (the typical source in Ireland) with domestically produced wheat and barley. Data for feed
ingredients were sourced from Blonk et al. (2014) and Weidema et al. (2013). The three impact categories addressed were
global warming potential (GWP), acidification potential (AP), and eutrophication potential (EP).
Results The results suggest that animal feed consumption efficiency and the inclusion of Irish barley and wheat affect
GWP, AP and EP considerably. For example, throughout the eight scenarios, GWP ranged from 2.87 to 3.36 kg CO2-eq kg-
1 pig meat, AP ranged from 54.80 to 63.30 g SO2-eq kg
-1 pig meat, and EP ranged from 29.10 to 34.70 g PO4
3--eq kg
-1 pig
meat. For each of the scenarios representative of current pig production practices (using imported wheat and barley), the
alternative scenarios with Irish barley and wheat produced lower GWP, AP and EP. Table 1 provides results from the off-
site mill with average feed efficiency. Overall, results were largely in agreement with previous European research (e.g.
Nguyen et al., 2011; Reckmann et al., 2013).
Table 2 Results from the scenario of the off-site mill with average feed efficiency. This scenario excludes Irish wheat and
barley. Numbers are expressed as kg-1
pig meat leaving the slaughterhouse.
Impact Category Total Feed Housing Slaughtering
GWP (kg CO2-eq) 3.36 2.02 (60%) 1.18 (35%) 0.16 (5%)
AP (g SO2-eq)
63.30 27.87 (44%) 35.13 (55%) 0.30 (< 1%)
EP (g PO43-
-eq)
34.70 22.79 (66%) 11.31 (32%) 0.60 (2%)
Conclusion LCA was applied to Irish pig production to determine the environmental performance of the sector. The results
from the study largely fall within ranges from previous European LCA studies of swine production. Feed efficiency was the
greatest factor determining environmental performance. In addition, the inclusion of Irish wheat and barley (results not
shown) could potentially lower the environmental footprint of the sector significantly.
Acknowledgements This study was funded by the Department of Geography, University College Cork. The Utrecht-
Network provided a mobility grant for knowledge transfer and collaboration with the Department of Agroecology, Aarhus
University. Funding was received from BBSRC to attend this conference.
References
Blonk, H., Scholten, J., Durlinger, B., Broekema, R., Tyszler, M. and Zeist, W.-J. v. 2014. Agri-Footprint: Methodology
and basic principles. The Netherlands: Blonk Agri Footprint BV.
Nguyen, T. L. T., Hermansen, J. E. and Mogensen, L. 2011. Environmental Assessment of Danish Pork. Aarhus University.
Reckmann, K., Traulsen, I. and Krieter, J. 2013. Livestock Science 157, 586-596.
Weidema, B. P., Bauer, C., Hischier, R., Mutel, C., Nemecek, T., Reinhard, J., Vadenbo, C. O. & Wernet, G. 2013. The
ecoinvent database: Overview and methodology, Data quality guideline for the ecoinvent database version 3. ecoinvent v3.
Figure 2 System boundary of the LCA model. Excluded processes are in grey.
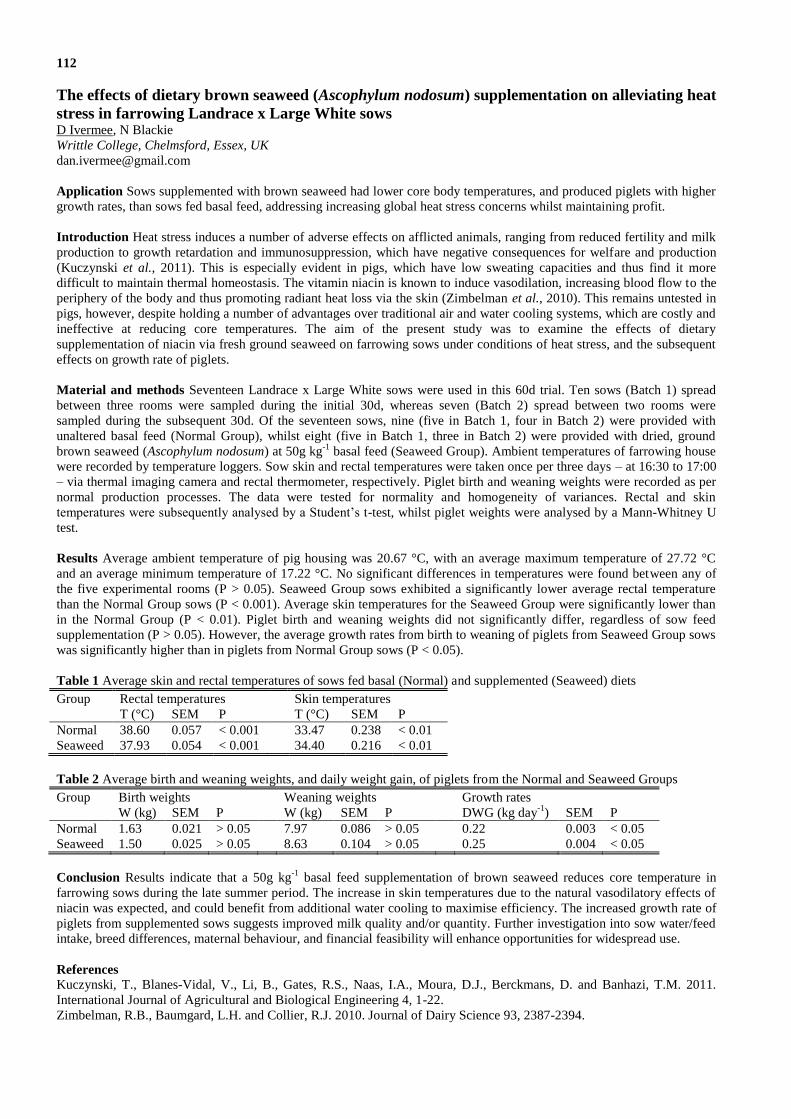
112
The effects of dietary brown seaweed (Ascophylum nodosum) supplementation on alleviating heat
stress in farrowing Landrace x Large White sows D Ivermee, N Blackie
Writtle College, Chelmsford, Essex, UK
Application Sows supplemented with brown seaweed had lower core body temperatures, and produced piglets with higher
growth rates, than sows fed basal feed, addressing increasing global heat stress concerns whilst maintaining profit.
Introduction Heat stress induces a number of adverse effects on afflicted animals, ranging from reduced fertility and milk
production to growth retardation and immunosuppression, which have negative consequences for welfare and production
(Kuczynski et al., 2011). This is especially evident in pigs, which have low sweating capacities and thus find it more
difficult to maintain thermal homeostasis. The vitamin niacin is known to induce vasodilation, increasing blood flow to the
periphery of the body and thus promoting radiant heat loss via the skin (Zimbelman et al., 2010). This remains untested in
pigs, however, despite holding a number of advantages over traditional air and water cooling systems, which are costly and
ineffective at reducing core temperatures. The aim of the present study was to examine the effects of dietary
supplementation of niacin via fresh ground seaweed on farrowing sows under conditions of heat stress, and the subsequent
effects on growth rate of piglets.
Material and methods Seventeen Landrace x Large White sows were used in this 60d trial. Ten sows (Batch 1) spread
between three rooms were sampled during the initial 30d, whereas seven (Batch 2) spread between two rooms were
sampled during the subsequent 30d. Of the seventeen sows, nine (five in Batch 1, four in Batch 2) were provided with
unaltered basal feed (Normal Group), whilst eight (five in Batch 1, three in Batch 2) were provided with dried, ground
brown seaweed (Ascophylum nodosum) at 50g kg-1
basal feed (Seaweed Group). Ambient temperatures of farrowing house
were recorded by temperature loggers. Sow skin and rectal temperatures were taken once per three days – at 16:30 to 17:00
– via thermal imaging camera and rectal thermometer, respectively. Piglet birth and weaning weights were recorded as per
normal production processes. The data were tested for normality and homogeneity of variances. Rectal and skin
temperatures were subsequently analysed by a tudent’s t-test, whilst piglet weights were analysed by a Mann-Whitney U
test.
Results Average ambient temperature of pig housing was 20.67 °C, with an average maximum temperature of 27.72 °C
and an average minimum temperature of 17.22 °C. No significant differences in temperatures were found between any of
the five experimental rooms (P > 0.05). Seaweed Group sows exhibited a significantly lower average rectal temperature
than the Normal Group sows (P < 0.001). Average skin temperatures for the Seaweed Group were significantly lower than
in the Normal Group (P < 0.01). Piglet birth and weaning weights did not significantly differ, regardless of sow feed
supplementation (P > 0.05). However, the average growth rates from birth to weaning of piglets from Seaweed Group sows
was significantly higher than in piglets from Normal Group sows (P < 0.05).
Table 1 Average skin and rectal temperatures of sows fed basal (Normal) and supplemented (Seaweed) diets
Group Rectal temperatures Skin temperatures
T (°C) SEM P T (°C) SEM P
Normal 38.60 0.057 < 0.001 33.47 0.238 < 0.01
Seaweed 37.93 0.054 < 0.001 34.40 0.216 < 0.01
Table 2 Average birth and weaning weights, and daily weight gain, of piglets from the Normal and Seaweed Groups
Group Birth weights Weaning weights Growth rates
W (kg) SEM P W (kg) SEM P DWG (kg day-1
) SEM P
Normal 1.63 0.021 > 0.05 7.97 0.086 > 0.05 0.22 0.003 < 0.05
Seaweed 1.50 0.025 > 0.05 8.63 0.104 > 0.05 0.25 0.004 < 0.05
Conclusion Results indicate that a 50g kg-1
basal feed supplementation of brown seaweed reduces core temperature in
farrowing sows during the late summer period. The increase in skin temperatures due to the natural vasodilatory effects of
niacin was expected, and could benefit from additional water cooling to maximise efficiency. The increased growth rate of
piglets from supplemented sows suggests improved milk quality and/or quantity. Further investigation into sow water/feed
intake, breed differences, maternal behaviour, and financial feasibility will enhance opportunities for widespread use.
References
Kuczynski, T., Blanes-Vidal, V., Li, B., Gates, R.S., Naas, I.A., Moura, D.J., Berckmans, D. and Banhazi, T.M. 2011.
International Journal of Agricultural and Biological Engineering 4, 1-22.
Zimbelman, R.B., Baumgard, L.H. and Collier, R.J. 2010. Journal of Dairy Science 93, 2387-2394.

113
Organic selenium and vitamin E supplementation improves feed conversion efficiency in heat
stressed dairy cows J Cottrell
1, M Sullivan
2, J Gaughan
2, K DiGiacomo
1, B Leury
1, P Celi
3,4, I Clarke
5, R Collier
6, F Dunshea
1
1The University of Melbourne, Parkville, Victoria, Australia,
2The University of Queensland, Gatton, Queensland,
Australia, 3The University of Sydney, Narellan, New South Wales, Australia,
4DSM Nutritional Products, Columbia, MD,
USA, 5Monash University, Clayton, Victoria, Australia,
6University of Arizona, Tucson, AZ, USA
Application Improving tolerance to heat stress (HS) in intensively farmed dairy cows by using supplemental anti-oxidants.
Introduction With increases in the frequency, intensity and duration of heat waves forecast plus increased participation in
tropical agriculture, HS is both a current and emerging problem. To control body temperature during HS, cows reduce
metabolic heat production by lowering feed intake and increase energy expenditure to dissipate heat. This results in a net
loss in production efficiency that is characterised by increased oxidative stress. With milk production trending towards
intensive production systems feeding TMR rather than pasture, the aim of this experiment was to investigate the effects of
anti-oxidant supplementation on milk production and oxidative stress in TMR fed dairy cows.
Material and methods Sixteen Fresian x Hosltein cows (ca. 120 DIM) were randomly allocated to control (0, n=6), “half”
(n= ) or “full” (n=5) dose of mixed organic selenium (yeast) and vitamin E (15 mg and 2000 IU/d respectively at full
dose). Cows were acclimatised to climate-controlled rooms and diets for one week before the following climates- 7d
Thermoneutral (TN, 18oC), 7d Heat Treatment (HT, cyclic 8h 35
oC/28
oC) and 5 d recovery (TN conditions). Milk yield and
feed intake were measured twice daily and FCE calculated as g milk/kg DMI per day. The oxidative status of the cows was
assessed from plasma samples collected at d 1,5,8,10,12,14,16 and 18. Kits were used to assess reactive oxygen metabolites
(ROMs, oxidant production), biological anti-oxidant potential (BAP, anti-oxidant capacity) and the oxidant stability index
(OSI) was calculated as the ROMs/BAP. Furthermore glutathione content was quantified. Data were analysed for the
effects of anti-oxidant dose (A, control, half or full), the day of experiment (D) and the interaction (A*D) using a REML
with blocking on cow and replicate.
Results As expected the HS conditions in week two of the experiment reduced feed intake and milk yield compared to TN
(P<0.001 for both). This resulted in reduced FCE, reflecting that the cows were diverting energy from production to heat
dissipation (P<0.001). Overall anti-oxidant supplementation did not improve milk yield or feed intake during HS. However
the half dose of anti-oxidants tended to have higher FCE during HS (P=0.089), which may reflect less energy being
diverted to heat dissipation and improved tolerance to heat stress. HS reduced BAP (P=0.020) and there was a slight but not
statistically significant increase in ROMs (P=0.098). The production of oxidants was unchanged with anti-oxidant diets
(ROMS P=0.56), however the BAP was increased overall (P=0.042). Consequently the OSI increased sharply during HS
(P=0.012) in control cows, with some buffering by anti-oxidants (P=0.062) and tendency to be lower overall during the
experiment (P=0.069). The improvement in BAP was in part due to increase glutathione content, which was reduced in the
control and to a lesser degree the half but not full dose during HS (P=0.022). As glutathione is synthesised by the
selenoprotein glutathione peroxidase, this result indicates anti-oxidant activity mediated by the Se supplementation.
Conclusion Lactating dairy cows are prone to heat and oxidative stress, resulting in reduced productivity. These data show
that supplementation of organic Se and vitamin E reduces oxidative stress. Anti-oxidants did not substantially improve milk
production when lactating dairy cows were experiencing HS, however they appear to be diverting less energy from
production as indicated by improved FCE which indicates improved tolerance to HS.
Acknowledgements Funding provided by the Department of Agriculture and Water Resources and Dairy Australia.

114
Pre-treating the ration with a crude fermentation extract derived from Trichoderma improved
the dry matter intake and milk yield of first lactation heifers N Walker
1, G Povey
2
1AB Vista, Marlborough, Wiltshire, UK,
2ADAS, Drayton, UK
Application Pre-treating the ration with Trichoderma extract led to an increase in D-value and ME of the ration as
measured by NIR. This ration when fed to primiparous cows resulted in increased DMI, milk yield and better fertility.
Introduction Feeding rations which have been pre-treated by fermentation extracts derived from Trichoderma have been
shown to improve the digestibility of the ration through the action of the extract on the surface of the fibre (McAllister et
al, 2001). Lag time to digestion is reduced, and faster colonisation by the rumen microflora once the fibre has been ingested
has been observed (Morgavi et al, 2000). This has led to improvements in animal performance and better feed efficiency
(Holtshausen et al, 2011). The aim of the current study was to evaluate the effect of pre-treating a ration with a novel
product, a crude fermentation extract derived from Trichoderma, on the performance of first lactation heifers during early
lactation.
Material and methods Fifty first lactation heifers were assigned to two groups Control (CON) or treated (Trichoderma
extract) on the basis of milk yield and dry matter intake measured over an initial 3 week co-variate period. The crude
extract was applied to the ration daily (750 ml/ T DM), approximately 1 h before feeding. Samples of treated and untreated
TMR were analysed by NIR to determine whether there was any effect on the ration. Individual milk yield and pen intake
was measured daily for the duration of the trial, which lasted 84 days. Fertility records were also maintained. Data was
analysed by the Mixed Procedure from SAS. Significance was declared at P<0.05, and numerical tendencies P<0.1.
Results Analysis of the treated and untreated TMR samples by NIR demonstrated that the predicted D-value was increased
from 63% to 67% and the predicted ME value from 10.5 to 11.1 MJ/kg DM. Dry matter intake was increased on average by
2 kg/day over the duration of the trial in the treated group (P<0.05). Milk yield was numerically increased in the treated
group compared to the control over the duration of the trial (28.2 vs 27.6, +0.6 litres/ day, P=0.09). This positive effect was
further improved in the last three weeks of the trial when milk yield was significantly increased by 1.4 litres vs CON (27.7
vs 26.3 litres/day, P<0.05). Fertility was also improved in the animals eating the ration pre-treated with Trichoderma
extract, with 84% of animals confirmed pregnant compared with 64% in the control group 4 months after starting the trial.
Insemination success rate was also higher, with the animals being fed feed pre-treated with Trichoderma extract requiring
2.3 inseminations versus 3.2 in the control group.
Conclusion Pre-treating the ration with a crude fermentation extract derived from Trichoderma led to an increase in the
predicted digestibilityand ME of the ration. The increase in digestibility significantly stimulated DMI. The extra intake and
resulting available energy was used in a variety of ways by the treated group, resulting in increased milk yield and some
positive effects on fertility.
Acknowledgements The authors would like to thank the staff at ADAS Drayton for monitoring the day to day running of
the trial and AB Vista for providing financial support.
References
Holtshausen L., Chung Y.H., Gerardo-Cuervo H., Oba M. and Beauchemin K.A. 2011. Journal of Dairy Science 94(2),
899-907.
McAllister, T.A., Hristov, A.N., Beauchemin, K.A., Rode, L.M. and Cheng, K.J. 2001. Enzymes in ruminant diets. Pages
273–298 in Enzymes in Farm Animal Nutrition. M. R. Bedford, and G. G. Partridge, ed. CABI Publishing.
Morgavi, D. P., Nsereko, V. L., Rode, L. M., Beauchemin, K.A., McAllister, T. A. and Wang, Y. 2000. Proceeings of the
XXV Conference on Rumen Function, Chicago, IL. p. 33 (Abstract)
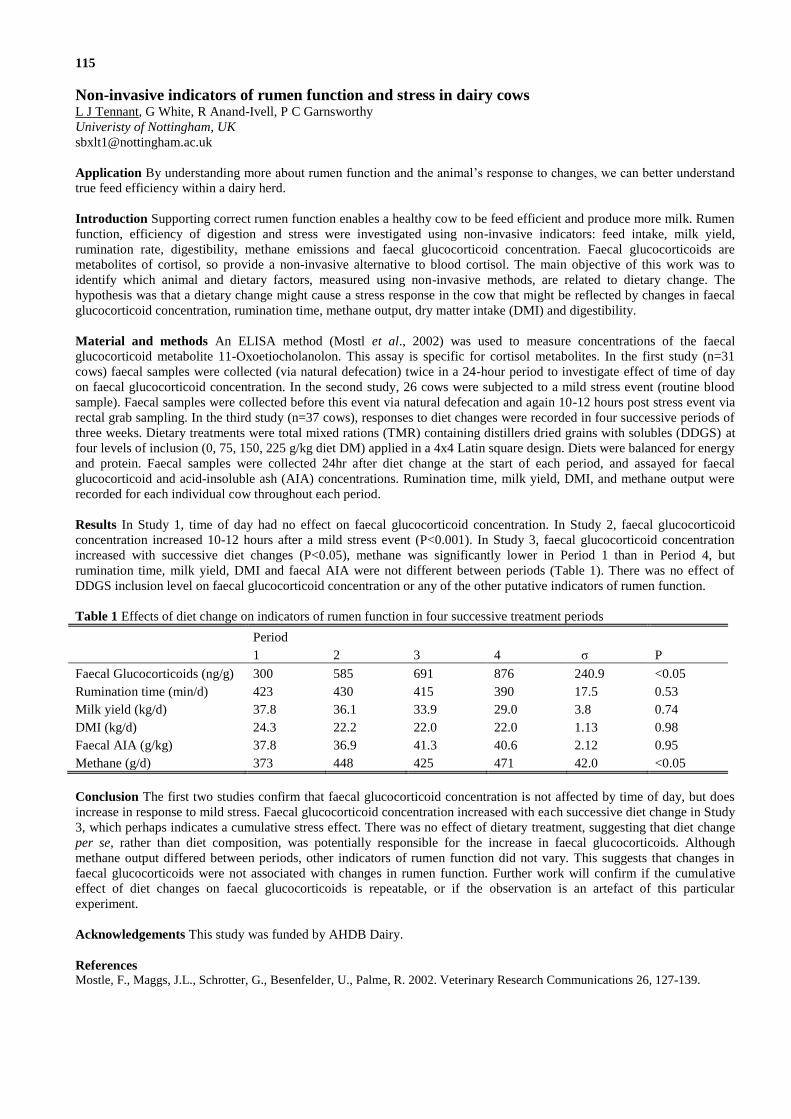
115
Non-invasive indicators of rumen function and stress in dairy cows L J Tennant, G White, R Anand-Ivell, P C Garnsworthy
Univeristy of Nottingham, UK
Application By understanding more about rumen function and the animal’s response to changes, we can better understand
true feed efficiency within a dairy herd.
Introduction Supporting correct rumen function enables a healthy cow to be feed efficient and produce more milk. Rumen
function, efficiency of digestion and stress were investigated using non-invasive indicators: feed intake, milk yield,
rumination rate, digestibility, methane emissions and faecal glucocorticoid concentration. Faecal glucocorticoids are
metabolites of cortisol, so provide a non-invasive alternative to blood cortisol. The main objective of this work was to
identify which animal and dietary factors, measured using non-invasive methods, are related to dietary change. The
hypothesis was that a dietary change might cause a stress response in the cow that might be reflected by changes in faecal
glucocorticoid concentration, rumination time, methane output, dry matter intake (DMI) and digestibility.
Material and methods An ELISA method (Mostl et al., 2002) was used to measure concentrations of the faecal
glucocorticoid metabolite 11-Oxoetiocholanolon. This assay is specific for cortisol metabolites. In the first study (n=31
cows) faecal samples were collected (via natural defecation) twice in a 24-hour period to investigate effect of time of day
on faecal glucocorticoid concentration. In the second study, 26 cows were subjected to a mild stress event (routine blood
sample). Faecal samples were collected before this event via natural defecation and again 10-12 hours post stress event via
rectal grab sampling. In the third study (n=37 cows), responses to diet changes were recorded in four successive periods of
three weeks. Dietary treatments were total mixed rations (TMR) containing distillers dried grains with solubles (DDGS) at
four levels of inclusion (0, 75, 150, 225 g/kg diet DM) applied in a 4x4 Latin square design. Diets were balanced for energy
and protein. Faecal samples were collected 24hr after diet change at the start of each period, and assayed for faecal
glucocorticoid and acid-insoluble ash (AIA) concentrations. Rumination time, milk yield, DMI, and methane output were
recorded for each individual cow throughout each period.
Results In Study 1, time of day had no effect on faecal glucocorticoid concentration. In Study 2, faecal glucocorticoid
concentration increased 10-12 hours after a mild stress event (P<0.001). In Study 3, faecal glucocorticoid concentration
increased with successive diet changes (P<0.05), methane was significantly lower in Period 1 than in Period 4, but
rumination time, milk yield, DMI and faecal AIA were not different between periods (Table 1). There was no effect of
DDGS inclusion level on faecal glucocorticoid concentration or any of the other putative indicators of rumen function.
Table 1 Effects of diet change on indicators of rumen function in four successive treatment periods
Period
1 2 3 4 σ P
Faecal Glucocorticoids (ng/g) 300 585 691 876 240.9 <0.05
Rumination time (min/d) 423 430 415 390 17.5 0.53
Milk yield (kg/d) 37.8 36.1 33.9 29.0 3.8 0.74
DMI (kg/d) 24.3 22.2 22.0 22.0 1.13 0.98
Faecal AIA (g/kg) 37.8 36.9 41.3 40.6 2.12 0.95
Methane (g/d) 373 448 425 471 42.0 <0.05
Conclusion The first two studies confirm that faecal glucocorticoid concentration is not affected by time of day, but does
increase in response to mild stress. Faecal glucocorticoid concentration increased with each successive diet change in Study
3, which perhaps indicates a cumulative stress effect. There was no effect of dietary treatment, suggesting that diet change
per se, rather than diet composition, was potentially responsible for the increase in faecal glucocorticoids. Although
methane output differed between periods, other indicators of rumen function did not vary. This suggests that changes in
faecal glucocorticoids were not associated with changes in rumen function. Further work will confirm if the cumulative
effect of diet changes on faecal glucocorticoids is repeatable, or if the observation is an artefact of this particular
experiment.
Acknowledgements This study was funded by AHDB Dairy.
References Mostle, F., Maggs, J.L., Schrotter, G., Besenfelder, U., Palme, R. 2002. Veterinary Research Communications 26, 127-139.

116
Effects of concentrate nitrogen levels on production performance and nutrient digestibility of
lactating dairy cows fed zero-grazed grass and concentrate diets D Hynes
1, S Stergiadis
2, T Yan
1
1Agri-Food and Bioscience Institute, Northern Ireland, UK,
2University of Reading, UK
Application Feeding dairy cows low nitrogen (N) diets on grass-based systems, without adverse effects on milk production
and animal health, can increase N utilisation efficiency and reduce environment footprint for dairy production.
Introduction Nitrogen is an expensive dietary component, which when utilized inefficiently has severe implications on the
environment, such as the increase of N excretion in faeces and urine, thus causing nitrate pollution to water resources and
ammonia and nitrous oxide emissions to atmosphere. Optimizing N utilisation efficiency is both economically and
environmentally beneficial for dairy production. The aim of the present study was to investigate the effect of concentrate N
levels on feed intake, milk production and nutrient digestibility in dairy cows fed fresh grass.
Material and methods Twelve multiparous lactating dairy cows (6 Holstein and 6 Holstein Swedish Red cross) were used
in a change-over design study with three dietary treatments and three 25-day periods. Cows within each breed were blocked
into three groups based on live weight, milk yield and lactation stage, and then randomly assigned to treatments.
Treatments were low, medium and high N concentrates (22.7, 26.1 and 29.4 g/kg DM respectively) fed at 33% dry matter
(DM) intake (DMI), with 67.2% DMI being fresh perennial ryegrass. Half of the daily concentrate rations were offered at
morning milking at 7am and half at afternoon milking at 3pm, while fresh-cut grass was offered at 10am each morning ad
libitum. Herbage was harvested daily at regrowth intervals depending on the month (increasing from 22 to 30 d from June
to September), thus offering grass of a similar quality that grazing animals would receive under routine management. Feed
intake, milk yield and composition and nutrient digestibility were measured during the final 6 d of each period. The
treatment effect was evaluated using one-way ANOVA with the effect of period being removed.
Results The ANOVA results are presented in Table 1. Concentrations of N in the total diet were 27.2, 28.0 and 28.8 g/kg
DM (crude protein = 170, 174 and 180 g/kg DM) for low, medium and high N concentrate diets, respectively. Cows on
medium N concentrate diets had a significantly lower body condition score than those given the low N concentrate diet (P
< 0.05), while the former had a significantly higher live weight than those on high N concentrate diets (P < 0.01). However,
the effect of diet was not significant on feed intake, milk yield or composition, and digestibility of energy or nutrients.
Table 1 Effects on feed intake, performance and nutrient digestibility
Low N
concentrate
Medium N
concentrate
High N
concentrate
SED Sig.
Grass DM intake (kg/d) 13.8 14.0 14.1 0.23 NS
Concentrate DM intake (kg/d) 6.7 6.8 6.7 0.11 NS
Total DM intake (kg/d) 20.6 20.8 20.8 0.28 NS
Body condition score 2.37b 2.29
a 2.33
ab 0.028 *
Live weight (kg) 580ab
586b 574
a 3.4 **
Energy corrected milk yield (kg/d) 27.4 27.7 28.0 0.62 NS
Milk fat content (g/kg) 42.2 41.5 41.9 0.59 NS
Milk protein content (g/kg) 36.1 36.4 36.5 0.30 NS
Milk lactose content (g/kg) 44.8 44.9 44.9 0.18 NS
DM digestibility 0.770 0.770 0.771 0.0071 NS
Digestible OM in total DM 0.718 0.718 0.718 0.0059 NS
Nitrogen digestibility 0.677 0.695 0.694 0.0132 NS
Energy digestibility 0.761 0.759 0.760 0.0076 NS
NDF digestibility 0.726 0.719 0.729 0.0093 NS
Conclusion Feeding zero-grazed lactating cows diets containing CP of 170 g/kg DM had no adverse effect on live weight
or milk production within the constraints of the present study. However the results need to be evaluated in long-term
studies.
Acknowledgements This study was funded by Department of Agriculture, Food and the Marine of ROI.
Note
The original version of this summary was published with S. Stergiadis's name incorrectly spelled. A notice detailing
this has been published

117
Concentrate supplementation of a grass silage based diet during the dry period: effects on cow
performance, metabolism and immune function M Little
1,2, N E O'Connell
2, M Welsh
3, K Meade
4, C P Ferris
1
1Agri-Food and Biosciences Institute, Hillsborough, UK,
2Queen’s University Belfast, UK,
3Agri-Food and Biosciences
Institute, Veterinary Sciences Division, UK, 4Teagasc, Grange, County Meath, Ireland
Application Pre partum concentrate supplementation of a grass silage diet did not affect subsequent milk production, but
improved neutrophil function during week 1 post calving.
Introduction The transition period, defined as the last three weeks of the dry period and the first three weeks of lactation,
is characterised by significant physiological changes and an increased disease risk (Friggens et al., 2004). A ‘stressful’
transition can increase the risk of both metabolic and infectious diseases, and may have a detrimental impact on milk
production during the subsequent lactation. Therefore, nutritional and management strategies which encourage a successful
transition, and result in improved performance and health during the subsequent lactation, are desirable. The present study
was designed to examine the impact of offering dairy cows a concentrate supplement during the dry period on feed intake,
milk production, metabolism and immune function. It was hypothesised that supplementing a grass silage with concentrates
during the dry period would have a beneficial effect on immunity during the transition period.
Material and methods Multiparous Holstein Friesian dairy cows (n=51) were offered a medium quality grass silage, either
alone (S) or mixed with concentrates (mean concentrate DM intake, 3.0 kg/cow/day: SC) for eight weeks pre partum. Cow
performance was measured for the first 70 days of lactation, during which time all cows were offered a common diet
comprising grass silage and concentrates (40:60 DM ratio). Blood samples taken at weeks 5, 3 and 1 prior to the predicted
calving date and at weeks 1, 2, 3, 4 and 8 post-calving, were analysed for non-esterified fatty acid (NEFA) and haptoglobin
concentrations, and for interferon gamma production by pokeweed mitogen (Phytolacca Americana) stimulated whole
blood culture. Blood samples taken at week 3 prior to the predicted calving date, and at week 1 and 2 post-calving, were
used to determine the in vitro phagocytic index of neutrophils (percentage of phagocytic positive neutrophils multiplied by
their phagocytic activity). Mean weekly data were analysed using one-way ANOVA. Continuous data were analysed using
REML repeated measures analysis.
Results Pre-calving treatment (S vs. SC) had no effect of on mean daily post partum DM intake (21.9 vs. 21.0 kg: P=
0.210), mean daily milk yield (39.0 vs. 39.4: P=0.830), milk protein content (32.1 vs. 32.5 g/kg: P=0.475) or milk fat +
protein yield (2.97 vs. 3.11 kg: P= 0.239). Cows on treatment SC had a higher mean daily pre partum DM intake (10.2 vs.
12.6: P<0.001), gained more liveweight (36 vs. 86 kg: P<0.001) and body condition (0.1 vs. 0.2: P<0.001) pre partum, lost
more liveweight (-11 vs. 33 kg: P<0.001) and body condition (0.0 vs. 0.1: P=0.010) post partum, produced milk with a
higher fat concentration (44.3 vs. 46.5 g/kg; P=0.072), and
tended to have a higher serum NEFA concentration (0.52
vs. 0.63 meq/L: P=0.056) post partum, compared with
cows on treatment S. Pre-calving treatment (S vs. SC) had
no effect on serum haptoglobin concentrations (0.74 vs.
0.76 mg/mL: P=0.681) or on interferon gamma production
by pokeweed mitogen stimulated whole blood culture (7.1
vs. 8.5 ng/mL: P=0.290) post partum, although there was a
significant change in these parameters over time (P=0.005
and P=0.018). Cows on treatment SC had a higher
(P=0.045) neutrophil phagocytic index than cows on
treatment S during week 1 post partum (Figure 1), largely
due to a greater (P=0.005) phagocytic activity with the
former treatment, although the phagocytic index was
unaffected by treatment at weeks 3 pre calving and at
week 2 post calving.
Conclusion Supplementing dairy cows with concentrates during the dry period resulted in greater liveweight and body
condition gain pre-calving, greater liveweight and body condition loss post-calving, but had no effect on milk production.
Cows offered concentrates during the dry period had an increased phagocytic activity at week 1 post-calving compared to
those offered silage only, which supports the initial hypothesis of a beneficial impact on transition period immunity.
Acknowledgements This study and PhD studentship was funded by AgriSearch
References
Friggens, N. C. Andersen, J. B. Larsen, T. Aaes, O. and Dewhurst, R. J. 2004. Animal Research 53 (6), 453-473.
Figure 1 Effect of concentrate supplementation during the
dry period on the mean phagocytic index of neutrophils

118
Seasonal variation of milk fatty acid profiles from dairy cows crossbred with US Brown Swiss in
low-input farms in Switzerland S Stergiadis
1,2, A Bieber
3, E Chatzidimitriou
1, E Franceschin
4, A Isensee
3, L Rempelos
1, M Baranski
1, V Maurer
3, G
Cozzi4, B Bapst
5, G Butler
1, C Leifert
1
1Newcastle University, Nafferton Ecological Farming Group, Newcastle upon Tyne, UK,
2University of Reading, UK,
3FiBL Research Institute of Organic Agriculture, Frick, Switzerland,
4University of Padua, Legnaro, Italy,
5Qualitas AG,
Zug, Switzerland
Application Using more Original Braunvieh (OB) genetics in crossbred dairy cows in low-input systems may improve
milk FA profiles, especially during the grazing period.
Introduction The three main Brown Swiss populations in Switzerland are US Brown Swiss (BS), Braunvieh and Original
Braunvieh (OB). Stergiadis et al. (2015) showed that summer milk fatty acid (FA) profile varied between crossbred cows,
with genetics from these populations with the relative effect influenced by pasture intake. Cows’ diets, in particular pasture
intake, has been suggested to be the main reason for seasonal variation in milk fat composition (Butler, 2011). This study
investigated the interaction of season and the contribution of B in cows’ genetics on milk FA profile, focusing both on
nutritionally undesirable saturated FA (SFA) and desirable monounsaturated FA (MUFA), such as vaccenic acid (VA, t11
C18:1), and polyunsaturated FA (PUFA), such as omega-3 FA (n-3), omega-6 FA (n-6), rumenic acid (RA, c9t11 C18:1
conjugated), α-linolenic (ALN, c9c12c15 C18:3) and eicosapentaenoic acid (EPA, c5c8c11c14c17 C20:5).
Material and methods Milk samples (n=1,976) were collected from 1,220 cows on 40 low-input farms twice over one
year, to represent winter (indoor feeding) and summer (grazing) periods. Animal crossbred type details were provided by
Braunvieh Schweiz (Zug, Switzerland) and cows were allocated into four crossbred categories, based on the contribution of
BS genes (BS1, 75-99%; BS2, 50-74%; BS3, 25-49%; BS4, 0-24%). Data on management and feeding practices were
recorded at milk collection, using questionnaires. Milk FA profiles were analysed in a Varian CP-SIL 88 fused silica
column (100 m x 0.25 mm internal diameter x 0.2 μm film thickness) and 68 FA were identified using external standards.
Analysis of variance, by linear mixed effects models in R, used crossbred type (BS1, BS2, BS3, BS4) and season (winter,
summer) as fixed factors and cow as random factor.
Results In winter, yield was higher in BS1 cows than BS4 cows but the same was not observed in summer. When
compared with milk from BS1 cows, (i) milk from BS3 and BS4 cows had more PUFA, VA, ALN and EPA and a higher n-
3:n-6 ratio and (ii) milk from BS2 cows had higher contents of n-3 and ALN (Table 1). Summer milk had less SFA and
ALN and more MUFA, PUFA, VA, RA and EPA (Table 1). Differences between genotypes were not consistent between
seasons, generally being less extensive or showing non-significance over summer. For example, the nutritionally desirable
increase of n-3:n-6 ratio when decreased BS genetics were used was more pronounced in summer, when animals grazed
(Figure 1).
Conclusion Using OB genetics for crossbreeding in low-input farms improved milk FA profile, with differences being
more pronounced over summer possibly as a result of different diets (especially higher fresh grass intake) between seasons.
Acknowledgements We gratefully acknowledge financial support from the EC under the FP7 LowInputBreeds project,
collaboration of dairy producers and technical help of Mrs Dominique Mahrer
References
Butler, G., Stergiadis, S., Seal, C.J., et al. 2011. Journal of Dairy Science 94, 24-36
Stergiadis, S., Bieber, A., Franceschin, E., et al. 2015. Food Chemistry 175, 609-618
Table 1 Relative proportions of FA (%) in crossbred types
and summer, compared with BS1 and winter respectively.
BS2 BS3 BS4 P-value Summer P-value
SFA 0.15 -0.05 -1.00 ns -5.8 ***
MUFA -0.8 -0.9 1.5 ns 15.1 ***
PUFA 2.0 5.2 6.4 *** 11.8 ***
n-3 6.0 16.3 15.9 *** 1.2 †
n-6 0.4 0.7 2.5 ns 0.9 ns
n-3:n-6 5.6 13.0 10.5 ** -1.0 ns
VA 1.7 11.7 11.0 * 60.5 ***
RA 2.3 1.5 2.0 ns 56.6 ***
ALN 6.8 19.0 16.8 *** -7.9 ***
EPA -6.2 19.2 31.9 *** 22.9 ***
Significant differences to BS1 or winter are shown in bold
case. ***, P<0.001; **, P<0.01, *, P<0.05; †: 0.0 ≤P<0.10;
ns, P≥0.10.
Figure 1 Interactions between crossbred type (BS1, BS2,
BS3, BS4) and season on milk n-3:n-6 ratio. Bars with
different lower case letter within season differ significantly.
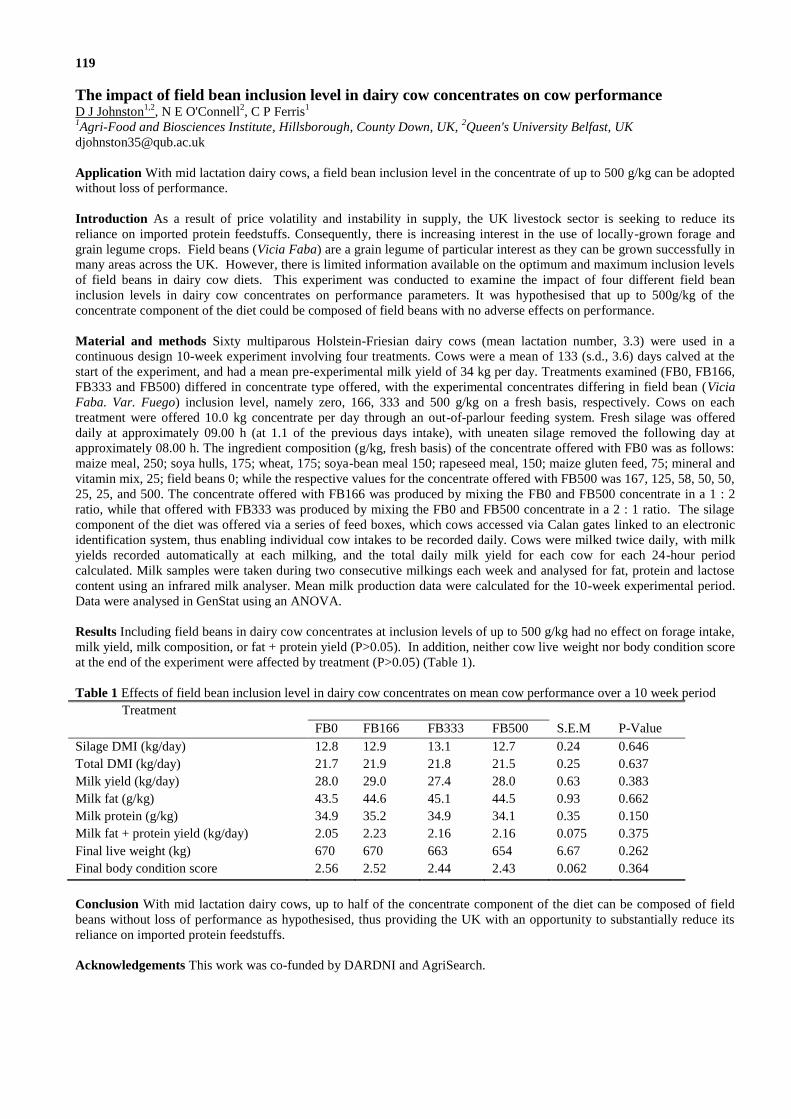
119
The impact of field bean inclusion level in dairy cow concentrates on cow performance D J Johnston
1,2, N E O'Connell
2, C P Ferris
1
1Agri-Food and Biosciences Institute, Hillsborough, County Down, UK,
2Queen's University Belfast, UK
Application With mid lactation dairy cows, a field bean inclusion level in the concentrate of up to 500 g/kg can be adopted
without loss of performance.
Introduction As a result of price volatility and instability in supply, the UK livestock sector is seeking to reduce its
reliance on imported protein feedstuffs. Consequently, there is increasing interest in the use of locally-grown forage and
grain legume crops. Field beans (Vicia Faba) are a grain legume of particular interest as they can be grown successfully in
many areas across the UK. However, there is limited information available on the optimum and maximum inclusion levels
of field beans in dairy cow diets. This experiment was conducted to examine the impact of four different field bean
inclusion levels in dairy cow concentrates on performance parameters. It was hypothesised that up to 500g/kg of the
concentrate component of the diet could be composed of field beans with no adverse effects on performance.
Material and methods Sixty multiparous Holstein-Friesian dairy cows (mean lactation number, 3.3) were used in a
continuous design 10-week experiment involving four treatments. Cows were a mean of 133 (s.d., 3.6) days calved at the
start of the experiment, and had a mean pre-experimental milk yield of 34 kg per day. Treatments examined (FB0, FB166,
FB333 and FB500) differed in concentrate type offered, with the experimental concentrates differing in field bean (Vicia
Faba. Var. Fuego) inclusion level, namely zero, 166, 333 and 500 g/kg on a fresh basis, respectively. Cows on each
treatment were offered 10.0 kg concentrate per day through an out-of-parlour feeding system. Fresh silage was offered
daily at approximately 09.00 h (at 1.1 of the previous days intake), with uneaten silage removed the following day at
approximately 08.00 h. The ingredient composition (g/kg, fresh basis) of the concentrate offered with FB0 was as follows:
maize meal, 250; soya hulls, 175; wheat, 175; soya-bean meal 150; rapeseed meal, 150; maize gluten feed, 75; mineral and
vitamin mix, 25; field beans 0; while the respective values for the concentrate offered with FB500 was 167, 125, 58, 50, 50,
25, 25, and 500. The concentrate offered with FB166 was produced by mixing the FB0 and FB500 concentrate in a 1 : 2
ratio, while that offered with FB333 was produced by mixing the FB0 and FB500 concentrate in a 2 : 1 ratio. The silage
component of the diet was offered via a series of feed boxes, which cows accessed via Calan gates linked to an electronic
identification system, thus enabling individual cow intakes to be recorded daily. Cows were milked twice daily, with milk
yields recorded automatically at each milking, and the total daily milk yield for each cow for each 24-hour period
calculated. Milk samples were taken during two consecutive milkings each week and analysed for fat, protein and lactose
content using an infrared milk analyser. Mean milk production data were calculated for the 10-week experimental period.
Data were analysed in GenStat using an ANOVA.
Results Including field beans in dairy cow concentrates at inclusion levels of up to 500 g/kg had no effect on forage intake,
milk yield, milk composition, or fat + protein yield (P>0.05). In addition, neither cow live weight nor body condition score
at the end of the experiment were affected by treatment (P>0.05) (Table 1).
Table 1 Effects of field bean inclusion level in dairy cow concentrates on mean cow performance over a 10 week period
Treatment
FB0 FB166 FB333 FB500 S.E.M P-Value
Silage DMI (kg/day) 12.8 12.9 13.1 12.7 0.24 0.646
Total DMI (kg/day) 21.7 21.9 21.8 21.5 0.25 0.637
Milk yield (kg/day) 28.0 29.0 27.4 28.0 0.63 0.383
Milk fat (g/kg) 43.5 44.6 45.1 44.5 0.93 0.662
Milk protein (g/kg) 34.9 35.2 34.9 34.1 0.35 0.150
Milk fat + protein yield (kg/day) 2.05 2.23 2.16 2.16 0.075 0.375
Final live weight (kg) 670 670 663 654 6.67 0.262
Final body condition score 2.56 2.52 2.44 2.43 0.062 0.364
Conclusion With mid lactation dairy cows, up to half of the concentrate component of the diet can be composed of field
beans without loss of performance as hypothesised, thus providing the UK with an opportunity to substantially reduce its
reliance on imported protein feedstuffs.
Acknowledgements This work was co-funded by DARDNI and AgriSearch.

120
Effect of inclusion rate and chop length of lucerne (medicago sativa) silage in a total mixed ration
with maize (zea mays) on milk yield and composition in dairy cattle A L Thomson, C K Reynolds, A Jones, D J Humphries
University of Reading, UK
Application Increasing lucerne inclusion rate in the ration from 25 to 75% of forage dry matter, combined with a short
chop length, can be a viable compromise between reducing intake and milk yield but increasing feed conversion efficiency.
Introduction Utilising legume silages in dairy systems reduces the need for inorganic fertiliser use for forage production,
which has both economic and environmental benefits. Combining lucerne, which is high in rumen degradable protein, with
maize as a source of fermentable energy in the ration can enhance microbial protein synthesis. Furthermore, lucerne chop
length can alter the rate of particle breakdown in the rumen. Longer chop lengths increase physically effective neutral
detergent fibre (peNDF) and stimulate chewing and saliva production, which benefits rumen pH (Zebeli et al., 2006).
However, shorter chop lengths increase dry matter intake (DMI), which can increase milk yield and energy balance
(Kononoff and Heinrichs, 2003). The hypothesis of this study was that lower lucerne inclusion and shorter chop length
would increase DMI and milk yield.
Material and methods Sixteen Holstein Friesian dairy cows in mid lactation (144 d in milk, s.e.m. ± 4.3) were blocked
according to milk yield and randomly assigned to one of 4 initial treatments within each block in a 4x4 Latin square design
experiment with 3 week periods. A total mixed ration (TMR) with 50:50 ratio on a dry matter (DM) basis of
forage:concentrate blend was fed. The forage was comprised of maize and lucerne silage in proportions of either 25:75
(HL) or 75:25 (LL) on a DM basis, respectively. First cut lucerne was harvested simultaneously from the same field and
stored as silage in concrete walled clamps at either a long (L) or short (S) chop length. These variables were combined in a
2x2 factorial design to give four treatments (HLL, HLS, LLL, LLS). Diets were formulated to be isonitrogenous (170g
crude protein/kg DM) and contain similar levels of fibre (330 g neutral detergent fibre/kg DM). Cows were housed and
individually fed in a cubicle yard and milked twice daily at 0630h and 1630h. In the final week of each period, DMI and
milk yield were recorded daily and milk composition measured for four consecutive milkings. Least squares means for each
cow and treatment were analysed using Mixed Model procedures.
Results Milk yield, DMI, milk protein concentration and yield (all P < 0.001) and milk fat yield (P < 0.02) were greater at
the lower lucerne inclusion rate (Table 1). However, feed conversion efficiency (energy corrected milk yield/DMI) tended
to be higher at the higher rate of Lucerne inclusion (P < 0.07). The shorter chop length of lucerne increased milk and milk
protein yield (P < 0.001) and DMI (P < 0.02). There was a tendency (P < 0.07) for milk protein concentration to be
differentially affected by chop length for LL versus HL diets.
Table 1 Effect of lucerne silage inclusion rate (IR), chop length (C) and their interaction (IRxC) on DMI and milk yield
Diets
P value
LLS LLL HLS HLL SEM IR C IRxC
Dry matter intake, kg/d 26.4 26.0 23.7 22.3 0.74 0.001 0.017 0.172
Milk yield, kg/d 35.2 33.9 32.5 30.6 1.04 0.001 0.001 0.449
Feed conversion efficiency, L/kg 1.34 1.37 1.42 1.42 0.040 0.068 0.744 0.698
Milk composition
Fat, g/kg 36.9 37.7 37.6 38.3 1.37 0.263 0.242 0.705
Protein, g/kg 30.2 30.5 31.2 30.9 0.68 0.001 0.962 0.066
Fat yield, g/d 1287 1279 1211 1207 65.6 0.017 0.844 0.954
Protein yield, g/d 1101 1061 997 946 36.5 0.001 0.003 0.706
Conclusions The inclusion of lucerne silage in the TMR at the higher rate as fed in the present study reduced DMI, milk
yield, and milk protein concentration. This may be partly attributable to greater rumen fill. A shorter lucerne chop length
increased DMI, milk yield, and milk protein yield, which may be due to effects on rate of passage.
Acknowledgements Funded by AHDB Dairy as part of the Grassland, Forage, and Soils Research Partnership.
References
Kononoff, P. J. and Heinrichs, A. J. 2003. Journal of Dairy Science 86 (4), 1445-1457.
Zebeli, Q., Tafaj, M., Steingass, H., Metzler, B. and Drochner, W. 2006. Journal of Dairy Science 89 (2), 651-668.

121
The effect of white or coloured flower forage pea silage as a replacement for grass silage on the
performance and whole tract digestibility of high yielding dairy cows C E A Campbell, J A Huntington, L A Sinclair
Harper Adams University, Newport, Shropshire, UK
Application The replacement of grass silage with forage peas reduced intake and milk performance in high yielding dairy
cows, and there was no effect of pea flower colour on performance or protein digestibility.
Introduction Increased global demand for soyabean and rapeseed meal, and associated fluctuations in their availability and
price has resulted in greater interest in the utilisation of home grown, protein-rich forage sources for ruminants. Peas
(Pisium sativum), are of interest due to their high protein content that can complement the lower protein levels found in
cereal based forages such as whole crop wheat and maize silage (Fraser et al., 2001). The protein in forage peas is however,
highly degradable, and as a consequence may not supply sufficient undegradable protein to meet the requirements of high
yielding dairy cows (Sinclair et al., 2009). Tannins are polyphenolic compounds of high molecular weight that can bind to
protein to form a complex that is resistant to microbial degradation at pH levels found within the rumen, but dissociate at
the lower pH levels found in the abomasum (Aerts et al., 1999). In forage peas the presence of condensed tannins is linked
to flower colour, with coloured varieties having a lower rumen degradability than white varieties, which increases dietary
undegradable protein supply (Sinclair et al., 2009). The study objectives were to determine the effect of inclusion of forage
peas differing in flower colour (and therefore tannin content) as a replacement for grass silage in the diet of high yielding
dairy cows on intake, performance, and whole tract digestibility.
Material and methods Eighteen multiparous dairy cows that were 100 ± 23 days in milk received one of 3 diets in each of
3 periods of 28 day duration, in a Latin square design with measurements taken in the final 7 days of each period. The
white and coloured pea silages were harvested at growth stage 206, the grass silage was a second cut from a ryegrass
sward, and the maize silage was harvested at approximately 350 g DM/kg The three dietary treatments were: grass and
maize silage (C), low tannin pea silage and maize silage (LT), and high tannin pea silage and maize silage (HT). The
proportion of grass, low tannin or high tannin pea silage to maize silage was 40:60 (DM basis), and all dietary treatments
had a forage to concentrate ratio of 55:45 (DM basis), and were formulated to be isonitrogenous. The concentrates and
forages were fed as a total mixed ration once daily at approximately 0800h. Cows were milked twice daily with yield
recorded at each milking. Blood samples were taken once during the collection week at 0700, 0900, 1100 and 1300 h. Acid
insoluble ash was used to estimate whole tract digestibility. Performance data and digestibility were analysed as a Latin
square design, and blood metabolites as repeated measures using Genstat (v.17).
Results The grass, low tannin, high tannin and maize silages contained 376, 333, 389 and 365 g DM/kg, with a protein
content of 178, 195, 208 and 82.5 g DM/kg respectively. Intake and milk yield was highest in cows when fed C, but there
was no effect on milk fat content or weight change (Table 1). Compared with C, cows receiving LT or HT had a lower milk
protein content and increased plasma urea concentrations, whereas nitrogen digestibility was lower in HT than C.
Table 1 Intake, performance, plasma urea and whole tract digestibility in dairy cows fed diets containing grass and maize
silages (C), low tannin pea and maize silages (LT) or high tannin pea and maize silages (HT).
C LT HT s.e.d P-value
DM intake, kg/d 21.4b
19.9a
20.7ab
0.37 0.002
Milk yield, kg/d 40.6b
38.4a
38.3a
0.75 0.005
Milk fat, g/kg 34.5 36.7 34.5 0.11 0.110
Milk protein, g/kg 30.8b
30.2a
30.1a
0.26 0.045
Live weight change, kg/d 0.53 0.06 0.24 0.205 0.088
Plasma urea, mmol/l 4.10a 5.34
b 5.43
b 0.301 <0.001
Digestibility, kg/kg
Organic matter 0.564 0.468 0.430 0.063 0.103
Nitrogen 0.686b 0.585
ab 0.523
a 0.059 0.032
a,b Means with different superscript differ (P < 0.05).
Conclusion The inclusion of low or high tannin pea silage reduced intake, milk performance and diet digestibility. Any
commercial advantage from feeding forage peas will therefore be based on savings in N from fertiliser or dietary protein.
Acknowledgements The authors gratefully acknowledge AHDB Dairy for funding this study.
References
Aerts, R.J., Barry, T.N., and McNabb, W.C. 1999. Agriculture, Ecosystems and Environment 75, 1-12.
Fraser, M.D., Fycan, R., and Jones, R. 2001. Grass and Forage Science 56, 218-230.
Sinclair, L.A., Hart, K.J., Wilkinson, R.G. and Huntington, J.A.. 2009. Livestock Science 124, 306-313.

122
Effects of fresh grass, grass hay and vitamin E supplementation on the rumen function in vitro A Belanche, E Jones, A H Kingston-Smith, C J Newbold
IBERS, Aberystwyth University, UK
Application Fresh grass should be used as much as possible, instead of grass hay, in order to improve rumen function and
to decrease the environmental impact of livestock agriculture. These findings must be further demonstrated in vivo.
Introduction Fresh ryegrass represents the main forage consumed by ruminants in the UK. Livestock intensification has
however required the use of grass hay (or silage) during the winter period to maintain production levels, and some farmers
based on intensive systems use grass hay throughout all year. Nonetheless, this decision is often arbitrary based on the farm
management, breeding program and feed price, without taking in consideration the impact of the feeding strategy on rumen
function, feed efficiency and ultimately on the environment. In contrast to hay, fresh grass represents an important source
of vitamin E to satisfy the requirements of the ruminant. Hence the use of vitamin E as a feed additive is gaining interest to
improve animal health and product quality. As a result, high levels of vitamin E are often used in ruminants regardless the
type of forage used. The aim of this in vitro experiment was to investigate the effect of using fresh ryegrass or ryegrass hay
on the rumen function and methane emissions when used alone or when supplemented with vitamin E.
Material and methods Fresh ryegrass (G) and ryegrass hay (H) from the same pasture (AberMagic) and harvest (3rd
cut)
were used. Fresh ryegrass was immediately frozen while hay was left to dry in the field for 2 days and finished in an air-
force oven at 25ºC. Experimental diets consisted of two types of forage (G vs H) supplemented with 20% of concentrate
containing zero (-) or 50 IU/d (+) of added vitamin E (as dl-α-tocopheryl acetate with adsorbate). The experiment was
carried out using a rumen simulation technique consisting of 16 vessels (800mL each) inoculated with rumen fluid from
four rumen-cannulated cows. Forages were chopped and incubated in the fermenters for 48h. The liquid dilution rate was
maintained at 3.35%/h by continuous infusion of artificial saliva. After 9 days adaptation, feed digestibility, gas and
methane emissions and production of fermentation products were measured over 4 days. Microbial protein synthesis was
then measured over a 2 day period using 15
N as a microbial marker. Data were analysed by ANOVA, blocking by cow
according to a 2×2 factorial design.
Results Feed digestibility of OM and NDF, as well as the total production of VFA was unaffected by the experimental
treatments; however the hay diet increased N digestibility and propionate production. Grass hay also promoted greater
production of gas and methane emissions per day or per unit of digested OM or VFA production in comparison to fresh
grass. On the contrary fresh grass increased the flow of non-ammonia N and microbial N and ultimately the flow of AA
available for absorption by the ruminant. Supplementation with vitamin E at 50 IU/d had no substantial effects on rumen
function.
Table 1 Effect of fresh grass or grass hay and vitamin E supplementation on the rumen function in vitro
Conclusions Use of ryegrass hay had a negative impact on the rumen function by increasing methane emissions (+35%)
and feed proteolysis (+10%). On the contrary fresh ryegrass improved the microbial protein synthesis (+16%).
Acknowledgements This work was supported by the European Regional Development Fund (WISE Network) and by the
BBSRC (BBS/E/W/10964A01).
Forage Fresh Grass Grass Hay P-value
Vitamin E G- G+ H- H+ SED Forage Vitamin E Interaction
Disappearance (%)
OM 55.7 62.1 59.4 63.1 4.68 0.494 0.162 0.692
N 69.3 73.1 77.6 78.7 2.39 0.003 0.177 0.437
NDF 43.8 52.3 50.1 53.2 5.27 0.356 0.155 0.486
Gas emissions
Total gas (L/d) 1.72 1.71 1.82 2.03 0.09 0.009 0.167 0.133
Methane (mmol/d) 5.10 5.01 6.04 7.59 0.79 0.012 0.223 0.180
Methane (mmol/gDOM) 0.90 0.79 0.98 1.16 0.10 0.012 0.666 0.081
Methane:VFA (mol/mol) 0.16 0.15 0.17 0.21 0.02 0.033 0.405 0.069
Fermentation products
Total VFA (mmol/d) 31.2 33.8 35.1 35.5 2.37 0.131 0.383 0.536
Acetate (mmol/d) 14.2 15.7 15.7 16.8 1.25 0.182 0.164 0.794
Propionate (mmol/d) 8.02 8.93 9.60 9.96 0.80 0.047 0.293 0.631
Butyrate (mmol/d) 4.50 4.94 5.51 5.04 0.48 0.139 0.975 0.211
Ammonia N (mg/d) 58.8 58.3 48.8 46.5 3.86 0.003 0.616 0.755
Non-ammonia N (mg/d) 140 152 122 115 6.92 <0.001 0.609 0.084
Microbial N (mg/d) 101 97.7 84.9 86.3 4.71 0.003 0.840 0.536
Microbial N : DOM (g/kg) 17.5 15.3 13.8 13.3 0.81 <0.001 0.040 0.180
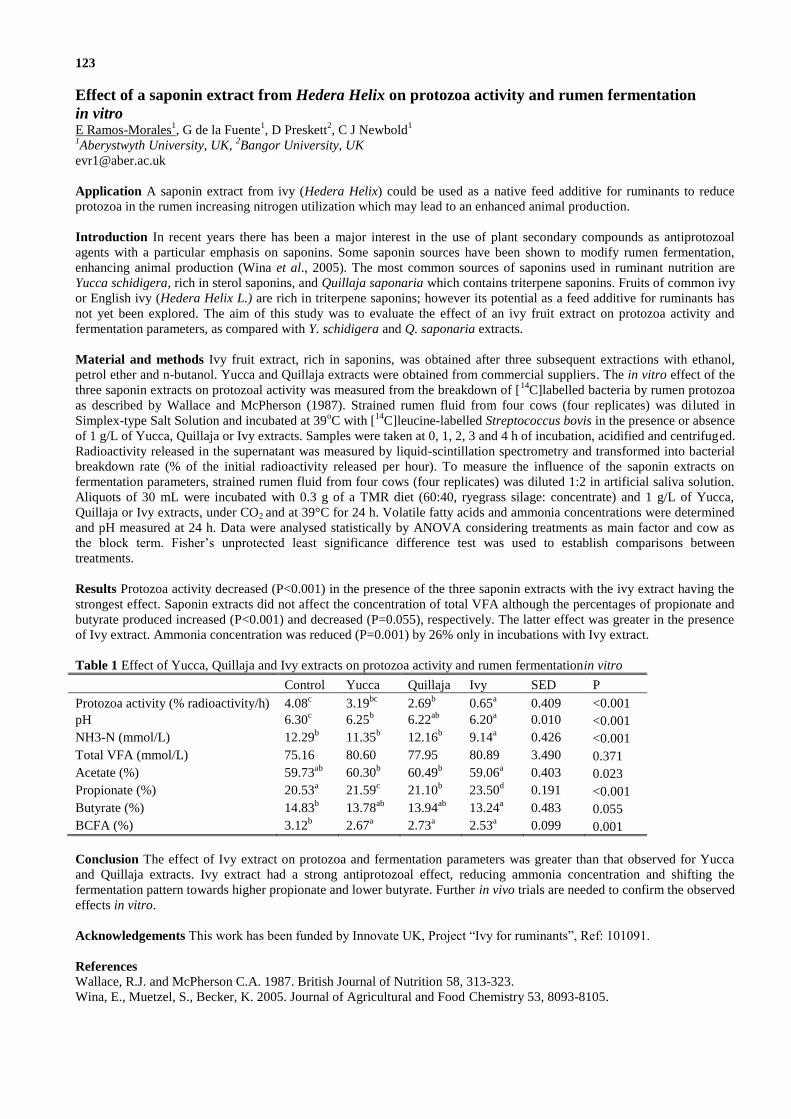
123
Effect of a saponin extract from Hedera Helix on protozoa activity and rumen fermentation
in vitro E Ramos-Morales
1, G de la Fuente
1, D Preskett
2, C J Newbold
1
1Aberystwyth University, UK,
2Bangor University, UK
Application A saponin extract from ivy (Hedera Helix) could be used as a native feed additive for ruminants to reduce
protozoa in the rumen increasing nitrogen utilization which may lead to an enhanced animal production.
Introduction In recent years there has been a major interest in the use of plant secondary compounds as antiprotozoal
agents with a particular emphasis on saponins. Some saponin sources have been shown to modify rumen fermentation,
enhancing animal production (Wina et al., 2005). The most common sources of saponins used in ruminant nutrition are
Yucca schidigera, rich in sterol saponins, and Quillaja saponaria which contains triterpene saponins. Fruits of common ivy
or English ivy (Hedera Helix L.) are rich in triterpene saponins; however its potential as a feed additive for ruminants has
not yet been explored. The aim of this study was to evaluate the effect of an ivy fruit extract on protozoa activity and
fermentation parameters, as compared with Y. schidigera and Q. saponaria extracts.
Material and methods Ivy fruit extract, rich in saponins, was obtained after three subsequent extractions with ethanol,
petrol ether and n-butanol. Yucca and Quillaja extracts were obtained from commercial suppliers. The in vitro effect of the
three saponin extracts on protozoal activity was measured from the breakdown of [14
C]labelled bacteria by rumen protozoa
as described by Wallace and McPherson (1987). Strained rumen fluid from four cows (four replicates) was diluted in
Simplex-type Salt Solution and incubated at 39oC with [
14C]leucine-labelled Streptococcus bovis in the presence or absence
of 1 g/L of Yucca, Quillaja or Ivy extracts. Samples were taken at 0, 1, 2, 3 and 4 h of incubation, acidified and centrifuged.
Radioactivity released in the supernatant was measured by liquid-scintillation spectrometry and transformed into bacterial
breakdown rate (% of the initial radioactivity released per hour). To measure the influence of the saponin extracts on
fermentation parameters, strained rumen fluid from four cows (four replicates) was diluted 1:2 in artificial saliva solution.
Aliquots of 30 mL were incubated with 0.3 g of a TMR diet (60:40, ryegrass silage: concentrate) and 1 g/L of Yucca,
Quillaja or Ivy extracts, under CO2 and at 39°C for 24 h. Volatile fatty acids and ammonia concentrations were determined
and pH measured at 24 h. Data were analysed statistically by ANOVA considering treatments as main factor and cow as
the block term. Fisher’s unprotected least significance difference test was used to establish comparisons between
treatments.
Results Protozoa activity decreased (P<0.001) in the presence of the three saponin extracts with the ivy extract having the
strongest effect. Saponin extracts did not affect the concentration of total VFA although the percentages of propionate and
butyrate produced increased (P<0.001) and decreased (P=0.055), respectively. The latter effect was greater in the presence
of Ivy extract. Ammonia concentration was reduced (P=0.001) by 26% only in incubations with Ivy extract.
Table 1 Effect of Yucca, Quillaja and Ivy extracts on protozoa activity and rumen fermentationin vitro
Control Yucca Quillaja Ivy SED P
Protozoa activity (% radioactivity/h) 4.08c 3.19
bc 2.69
b 0.65
a 0.409 <0.001
pH 6.30c 6.25
b 6.22
ab 6.20
a 0.010 <0.001
NH3-N (mmol/L) 12.29b 11.35
b 12.16
b 9.14
a 0.426 <0.001
Total VFA (mmol/L) 75.16 80.60 77.95 80.89 3.490 0.371
Acetate (%) 59.73ab
60.30b 60.49
b 59.06
a 0.403 0.023
Propionate (%) 20.53a 21.59
c 21.10
b 23.50
d 0.191 <0.001
Butyrate (%) 14.83b 13.78
ab 13.94
ab 13.24
a 0.483 0.055
BCFA (%) 3.12b 2.67
a 2.73
a 2.53
a 0.099 0.001
Conclusion The effect of Ivy extract on protozoa and fermentation parameters was greater than that observed for Yucca
and Quillaja extracts. Ivy extract had a strong antiprotozoal effect, reducing ammonia concentration and shifting the
fermentation pattern towards higher propionate and lower butyrate. Further in vivo trials are needed to confirm the observed
effects in vitro.
Acknowledgements This work has been funded by Innovate UK, Project “Ivy for ruminants”, Ref: 101091.
References
Wallace, R.J. and McPherson C.A. 1987. British Journal of Nutrition 58, 313-323.
Wina, E., Muetzel, S., Becker, K. 2005. Journal of Agricultural and Food Chemistry 53, 8093-8105.
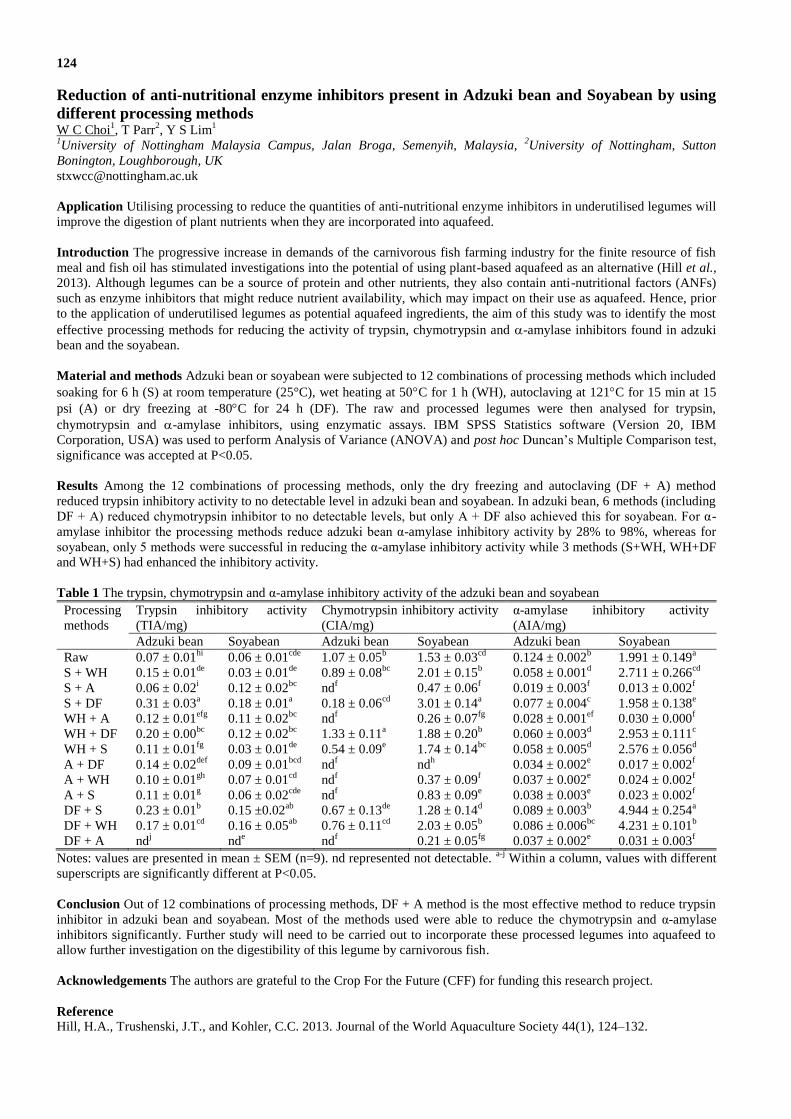
124
Reduction of anti-nutritional enzyme inhibitors present in Adzuki bean and Soyabean by using
different processing methods W C Choi
1, T Parr
2, Y S Lim
1
1University of Nottingham Malaysia Campus, Jalan Broga, Semenyih, Malaysia,
2University of Nottingham, Sutton
Bonington, Loughborough, UK
Application Utilising processing to reduce the quantities of anti-nutritional enzyme inhibitors in underutilised legumes will
improve the digestion of plant nutrients when they are incorporated into aquafeed.
Introduction The progressive increase in demands of the carnivorous fish farming industry for the finite resource of fish
meal and fish oil has stimulated investigations into the potential of using plant-based aquafeed as an alternative (Hill et al.,
2013). Although legumes can be a source of protein and other nutrients, they also contain anti-nutritional factors (ANFs)
such as enzyme inhibitors that might reduce nutrient availability, which may impact on their use as aquafeed. Hence, prior
to the application of underutilised legumes as potential aquafeed ingredients, the aim of this study was to identify the most
effective processing methods for reducing the activity of trypsin, chymotrypsin and -amylase inhibitors found in adzuki
bean and the soyabean.
Material and methods Adzuki bean or soyabean were subjected to 12 combinations of processing methods which included
soaking for 6 h (S) at room temperature (25°C), wet heating at 50C for 1 h (WH), autoclaving at 121C for 15 min at 15
psi (A) or dry freezing at -80C for 24 h (DF). The raw and processed legumes were then analysed for trypsin,
chymotrypsin and -amylase inhibitors, using enzymatic assays. IBM SPSS Statistics software (Version 20, IBM
Corporation, USA) was used to perform Analysis of Variance (ANOVA) and post hoc Duncan’s Multiple Comparison test,
significance was accepted at P<0.05.
Results Among the 12 combinations of processing methods, only the dry freezing and autoclaving (DF + A) method
reduced trypsin inhibitory activity to no detectable level in adzuki bean and soyabean. In adzuki bean, 6 methods (including
DF + A) reduced chymotrypsin inhibitor to no detectable levels, but only A + DF also achieved this for soyabean. For α-
amylase inhibitor the processing methods reduce adzuki bean α-amylase inhibitory activity by 28% to 98%, whereas for
soyabean, only 5 methods were successful in reducing the α-amylase inhibitory activity while 3 methods (S+WH, WH+DF
and WH+S) had enhanced the inhibitory activity.
Table 1 The trypsin, chymotrypsin and α-amylase inhibitory activity of the adzuki bean and soyabean
Processing
methods
Trypsin inhibitory activity
(TIA/mg)
Chymotrypsin inhibitory activity
(CIA/mg)
α-amylase inhibitory activity
(AIA/mg)
Adzuki bean Soyabean Adzuki bean Soyabean Adzuki bean Soyabean
Raw 0.07 ± 0.01hi 0.06 ± 0.01
cde 1.07 ± 0.05
b 1.53 ± 0.03
cd 0.124 ± 0.002
b 1.991 ± 0.149
a
S + WH 0.15 ± 0.01de
0.03 ± 0.01de
0.89 ± 0.08bc
2.01 ± 0.15b 0.058 ± 0.001
d 2.711 ± 0.266
cd
S + A 0.06 ± 0.02i 0.12 ± 0.02
bc nd
f 0.47 ± 0.06
f 0.019 ± 0.003
f 0.013 ± 0.002
f
S + DF 0.31 ± 0.03a 0.18 ± 0.01
a 0.18 ± 0.06
cd 3.01 ± 0.14
a 0.077 ± 0.004
c 1.958 ± 0.138
e
WH + A 0.12 ± 0.01efg
0.11 ± 0.02bc
ndf 0.26 ± 0.07
fg 0.028 ± 0.001
ef 0.030 ± 0.000
f
WH + DF 0.20 ± 0.00bc
0.12 ± 0.02bc
1.33 ± 0.11a 1.88 ± 0.20
b 0.060 ± 0.003
d 2.953 ± 0.111
c
WH + S 0.11 ± 0.01fg
0.03 ± 0.01de
0.54 ± 0.09e 1.74 ± 0.14
bc 0.058 ± 0.005
d 2.576 ± 0.056
d
A + DF 0.14 ± 0.02def
0.09 ± 0.01bcd
ndf nd
h 0.034 ± 0.002
e 0.017 ± 0.002
f
A + WH 0.10 ± 0.01gh
0.07 ± 0.01cd
ndf 0.37 ± 0.09
f 0.037 ± 0.002
e 0.024 ± 0.002
f
A + S 0.11 ± 0.01g 0.06 ± 0.02
cde nd
f 0.83 ± 0.09
e 0.038 ± 0.003
e 0.023 ± 0.002
f
DF + S 0.23 ± 0.01b 0.15 ±0.02
ab 0.67 ± 0.13
de 1.28 ± 0.14
d 0.089 ± 0.003
b 4.944 ± 0.254
a
DF + WH 0.17 ± 0.01cd
0.16 ± 0.05ab
0.76 ± 0.11cd
2.03 ± 0.05b 0.086 ± 0.006
bc 4.231 ± 0.101
b
DF + A ndj nd
e nd
f 0.21 ± 0.05
fg 0.037 ± 0.002
e 0.031 ± 0.003
f
Notes: values are presented in mean ± SEM (n=9). nd represented not detectable. a-j
Within a column, values with different
superscripts are significantly different at P<0.05.
Conclusion Out of 12 combinations of processing methods, DF + A method is the most effective method to reduce trypsin
inhibitor in adzuki bean and soyabean. Most of the methods used were able to reduce the chymotrypsin and α-amylase
inhibitors significantly. Further study will need to be carried out to incorporate these processed legumes into aquafeed to
allow further investigation on the digestibility of this legume by carnivorous fish.
Acknowledgements The authors are grateful to the Crop For the Future (CFF) for funding this research project.
Reference
Hill, H.A., Trushenski, J.T., and Kohler, C.C. 2013. Journal of the World Aquaculture Society 44(1), 124–132.
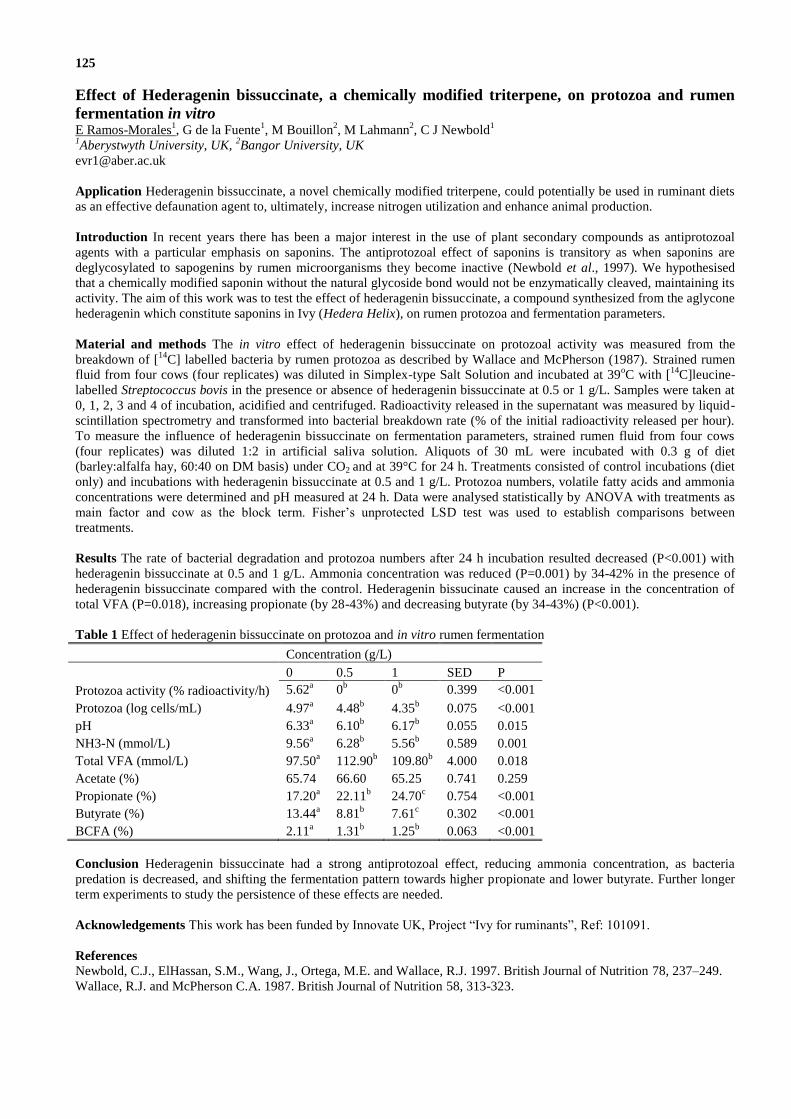
125
Effect of Hederagenin bissuccinate, a chemically modified triterpene, on protozoa and rumen
fermentation in vitro E Ramos-Morales
1, G de la Fuente
1, M Bouillon
2, M Lahmann
2, C J Newbold
1
1Aberystwyth University, UK,
2Bangor University, UK
Application Hederagenin bissuccinate, a novel chemically modified triterpene, could potentially be used in ruminant diets
as an effective defaunation agent to, ultimately, increase nitrogen utilization and enhance animal production.
Introduction In recent years there has been a major interest in the use of plant secondary compounds as antiprotozoal
agents with a particular emphasis on saponins. The antiprotozoal effect of saponins is transitory as when saponins are
deglycosylated to sapogenins by rumen microorganisms they become inactive (Newbold et al., 1997). We hypothesised
that a chemically modified saponin without the natural glycoside bond would not be enzymatically cleaved, maintaining its
activity. The aim of this work was to test the effect of hederagenin bissuccinate, a compound synthesized from the aglycone
hederagenin which constitute saponins in Ivy (Hedera Helix), on rumen protozoa and fermentation parameters.
Material and methods The in vitro effect of hederagenin bissuccinate on protozoal activity was measured from the
breakdown of [14
C] labelled bacteria by rumen protozoa as described by Wallace and McPherson (1987). Strained rumen
fluid from four cows (four replicates) was diluted in Simplex-type Salt Solution and incubated at 39oC with [
14C]leucine-
labelled Streptococcus bovis in the presence or absence of hederagenin bissuccinate at 0.5 or 1 g/L. Samples were taken at
0, 1, 2, 3 and 4 of incubation, acidified and centrifuged. Radioactivity released in the supernatant was measured by liquid-
scintillation spectrometry and transformed into bacterial breakdown rate (% of the initial radioactivity released per hour).
To measure the influence of hederagenin bissuccinate on fermentation parameters, strained rumen fluid from four cows
(four replicates) was diluted 1:2 in artificial saliva solution. Aliquots of 30 mL were incubated with 0.3 g of diet
(barley:alfalfa hay, 60:40 on DM basis) under CO2 and at 39°C for 24 h. Treatments consisted of control incubations (diet
only) and incubations with hederagenin bissuccinate at 0.5 and 1 g/L. Protozoa numbers, volatile fatty acids and ammonia
concentrations were determined and pH measured at 24 h. Data were analysed statistically by ANOVA with treatments as
main factor and cow as the block term. Fisher’s unprotected LSD test was used to establish comparisons between
treatments.
Results The rate of bacterial degradation and protozoa numbers after 24 h incubation resulted decreased (P<0.001) with
hederagenin bissuccinate at 0.5 and 1 g/L. Ammonia concentration was reduced (P=0.001) by 34-42% in the presence of
hederagenin bissuccinate compared with the control. Hederagenin bissucinate caused an increase in the concentration of
total VFA (P=0.018), increasing propionate (by 28-43%) and decreasing butyrate (by 34-43%) (P<0.001).
Table 1 Effect of hederagenin bissuccinate on protozoa and in vitro rumen fermentation
Concentration (g/L)
0 0.5 1 SED P
Protozoa activity (% radioactivity/h) 5.62a 0
b 0
b 0.399 <0.001
Protozoa (log cells/mL) 4.97a 4.48
b 4.35
b 0.075 <0.001
pH 6.33a 6.10
b 6.17
b 0.055 0.015
NH3-N (mmol/L) 9.56a 6.28
b 5.56
b 0.589 0.001
Total VFA (mmol/L) 97.50a 112.90
b 109.80
b 4.000 0.018
Acetate (%) 65.74 66.60 65.25 0.741 0.259
Propionate (%) 17.20a 22.11
b 24.70
c 0.754 <0.001
Butyrate (%) 13.44a 8.81
b 7.61
c 0.302 <0.001
BCFA (%) 2.11a 1.31
b 1.25
b 0.063 <0.001
Conclusion Hederagenin bissuccinate had a strong antiprotozoal effect, reducing ammonia concentration, as bacteria
predation is decreased, and shifting the fermentation pattern towards higher propionate and lower butyrate. Further longer
term experiments to study the persistence of these effects are needed.
Acknowledgements This work has been funded by Innovate UK, Project “Ivy for ruminants”, Ref: 101091.
References
Newbold, C.J., ElHassan, S.M., Wang, J., Ortega, M.E. and Wallace, R.J. 1997. British Journal of Nutrition 78, 237–249.
Wallace, R.J. and McPherson C.A. 1987. British Journal of Nutrition 58, 313-323.

126
The effects of resistant starch from underutilised legumes on the growth of potential probiotic
Lactococcus lactis isolated from barramundi (Lates calcarifer) I K M Chiew
1, A M Salter
2, T Parr
2, Y S Lim
1
1University of Nottingham Malaysia Campus, Jalan Broga, Semenyih, Malaysia,
2University of Nottingham, Sutton
Bonington, Loughborough, UK [email protected]
Application Resistant starch (RS) extracted from legumes has the potential to act as a prebiotic for lactic acid bacteria so
could be used to improve gastrointestinal microbiota, thereby improving fish health in aquaculture production systems.
Introduction: Legumes are an important source of resistant starch (RS), which can be improved further through the
process of hydrolysis, gelatinisation and retrogradation. As a prebiotic, RS contributes to improved gastrointestinal health
in humans (Fuentes‐Zaragoza, et al., 2011). Human prebiotics have also shown benefits in fish (Ringø et al., 2010). The
aim of this study was to investigate the effect of RS-enhanced legume starch on a potential probiotic bacterium isolated
from the intestine of barramundi (Lates calcarifer).
Material and methods Starches were isolated from six legumes (adzuki beans (Vigna angularis), mung beans (V. radiata),
black-eyed peas (V. unguiculata subsp. Unguiculata), pigeon peas (Cajanus cajan), Bambara groundnuts (V. subterranea)
and red lentil (Lens culinaris)) and were subject to acid or enzyme hydrolysis, gelatinisation via autoclave and
retrogradation at 4°C prior to lyophilisation. The RS were produced in a single batch and were labelled as acid-hydrolysed
resistant starch (AH), enzyme-hydrolysed resistant starch (EH) and untreated starch (ST), which was used as the control.
RS content of samples from each treatment and legume were quantified and supplemented at 5% (w/v) into nutrient broth
which were then inoculated with 24h-old active L. lactis and incubated at 37°C for 24 h. The samples were prepared in
triplicates and the viable cell count of L. lactis and pH of the nutrient broth were determined at 0 and 24 h incubation as an
assessment of bacteria growth rate and acid production ability, respectively. All assays were conducted in triplicate and the
results obtained were analysed using two-way ANOVA (Genstat) and Post hoc Duncan’s test, error bars are standard
deviation of the mean. Significance was accepted at p<0.05.
Results The types of legumes and the treatments applied led to significant interaction for both growth and acid production
in the bacteria (P<0.001). The EH treated RSs of Adzuki bean, Lentils and Bambara groundnut significantly enhanced the
bacterial growth. No significant difference was observed in the bacterial growth for the remaining legumes treated with EH
and ST processing methods. AH processing method was the least effective method to enhance the bacterial growth, only
the AH treated RSs of Bambara groundnut showed significant higher bacterial growth than ST treatment (Figure 1).
Accompanying the enhanced bacterial growth of EH treated RSs of Adzuki bean, Lentils and Bambara groundnut there was
significantly reduced the pH of the nutrient broth which indicated the production of acid (Figure 2).
Conclusion The EH treated RSs of Adzuki bean, Lentils and Bambara groundnut were found to enhance the growth of L
lactis isolated from the intestine of barramundi. These RSs also increased acid production which indicated growth of L.
lactis, as its growth will lead to the production of lactic acid, and hence could be applied as putative prebiotic in aquafeed
to promote intestinal health of fish.
Acknowledgements This work is based upon the work supported by CFF under Grant No. NCHB0004
References
Ringø1, E., Olsen, R. E., Gifstad, T. Ø, Dalmo, R. A., Amlund, H., Hemre, G.-I. and Bakke, A. M. 2010. Aquaculture
Nutrition 16, 117-136.
Fuentes‐Zaragoza, E., Sánchez‐Zapata, E., Sendra, E., Sayas, E., Navarro, C., Fernández‐López, J. and Pérez‐Alvarez, J.A.,
2011. Starch‐Stärke 63, 406-415.
Figure 1 Effect of processed resistant starches and the
control starch of legume on the growth of L. lactis.
Asterisks (*) above each bar refer to treatments
significantly different compared to ST (p < 0.05).
(*P<0.05, ** P<0.01)
Figure 2 Effect of processed resistant starches and the
control starch of legume on the acid production of L.
lactis. Asterisks (*) above each bar refer to treatments
significantly different compared to ST (p < 0.05).
(*P<0.05, ** P<0.01)
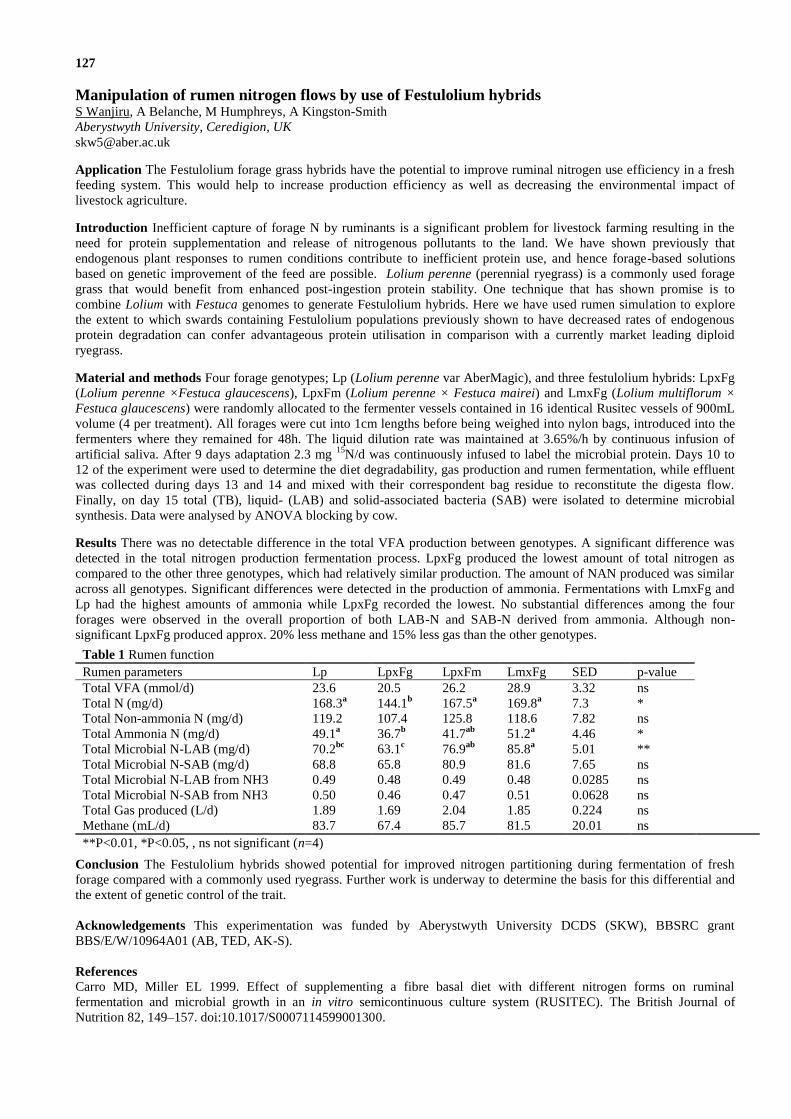
127
Manipulation of rumen nitrogen flows by use of Festulolium hybrids S Wanjiru, A Belanche, M Humphreys, A Kingston-Smith
Aberystwyth University, Ceredigion, UK
Application The Festulolium forage grass hybrids have the potential to improve ruminal nitrogen use efficiency in a fresh
feeding system. This would help to increase production efficiency as well as decreasing the environmental impact of
livestock agriculture.
Introduction Inefficient capture of forage N by ruminants is a significant problem for livestock farming resulting in the
need for protein supplementation and release of nitrogenous pollutants to the land. We have shown previously that
endogenous plant responses to rumen conditions contribute to inefficient protein use, and hence forage-based solutions
based on genetic improvement of the feed are possible. Lolium perenne (perennial ryegrass) is a commonly used forage
grass that would benefit from enhanced post-ingestion protein stability. One technique that has shown promise is to
combine Lolium with Festuca genomes to generate Festulolium hybrids. Here we have used rumen simulation to explore
the extent to which swards containing Festulolium populations previously shown to have decreased rates of endogenous
protein degradation can confer advantageous protein utilisation in comparison with a currently market leading diploid
ryegrass.
Material and methods Four forage genotypes; Lp (Lolium perenne var AberMagic), and three festulolium hybrids: LpxFg
(Lolium perenne ×Festuca glaucescens), LpxFm (Lolium perenne × Festuca mairei) and LmxFg (Lolium multiflorum ×
Festuca glaucescens) were randomly allocated to the fermenter vessels contained in 16 identical Rusitec vessels of 900mL
volume (4 per treatment). All forages were cut into 1cm lengths before being weighed into nylon bags, introduced into the
fermenters where they remained for 48h. The liquid dilution rate was maintained at 3.65%/h by continuous infusion of
artificial saliva. After 9 days adaptation 2.3 mg 15
N/d was continuously infused to label the microbial protein. Days 10 to
12 of the experiment were used to determine the diet degradability, gas production and rumen fermentation, while effluent
was collected during days 13 and 14 and mixed with their correspondent bag residue to reconstitute the digesta flow.
Finally, on day 15 total (TB), liquid- (LAB) and solid-associated bacteria (SAB) were isolated to determine microbial
synthesis. Data were analysed by ANOVA blocking by cow.
Results There was no detectable difference in the total VFA production between genotypes. A significant difference was
detected in the total nitrogen production fermentation process. LpxFg produced the lowest amount of total nitrogen as
compared to the other three genotypes, which had relatively similar production. The amount of NAN produced was similar
across all genotypes. Significant differences were detected in the production of ammonia. Fermentations with LmxFg and
Lp had the highest amounts of ammonia while LpxFg recorded the lowest. No substantial differences among the four
forages were observed in the overall proportion of both LAB-N and SAB-N derived from ammonia. Although non-
significant LpxFg produced approx. 20% less methane and 15% less gas than the other genotypes.
Table 1 Rumen function
Rumen parameters Lp LpxFg LpxFm LmxFg SED p-value
Total VFA (mmol/d) 23.6 20.5 26.2 28.9 3.32 ns
Total N (mg/d) 168.3a 144.1
b 167.5
a 169.8
a 7.3 *
Total Non-ammonia N (mg/d) 119.2 107.4 125.8 118.6 7.82 ns
Total Ammonia N (mg/d) 49.1a 36.7
b 41.7
ab 51.2
a 4.46 *
Total Microbial N-LAB (mg/d) 70.2bc
63.1c 76.9
ab 85.8
a 5.01 **
Total Microbial N-SAB (mg/d) 68.8 65.8 80.9 81.6 7.65 ns
Total Microbial N-LAB from NH3 0.49 0.48 0.49 0.48 0.0285 ns
Total Microbial N-SAB from NH3 0.50 0.46 0.47 0.51 0.0628 ns
Total Gas produced (L/d) 1.89 1.69 2.04 1.85 0.224 ns
Methane (mL/d) 83.7 67.4 85.7 81.5 20.01 ns
**P<0.01, *P<0.05, , ns not significant (n=4)
Conclusion The Festulolium hybrids showed potential for improved nitrogen partitioning during fermentation of fresh
forage compared with a commonly used ryegrass. Further work is underway to determine the basis for this differential and
the extent of genetic control of the trait.
Acknowledgements This experimentation was funded by Aberystwyth University DCDS (SKW), BBSRC grant
BBS/E/W/10964A01 (AB, TED, AK-S).
References Carro MD, Miller EL 1999. Effect of supplementing a fibre basal diet with different nitrogen forms on ruminal
fermentation and microbial growth in an in vitro semicontinuous culture system (RUSITEC). The British Journal of
Nutrition 82, 149–157. doi:10.1017/S0007114599001300.
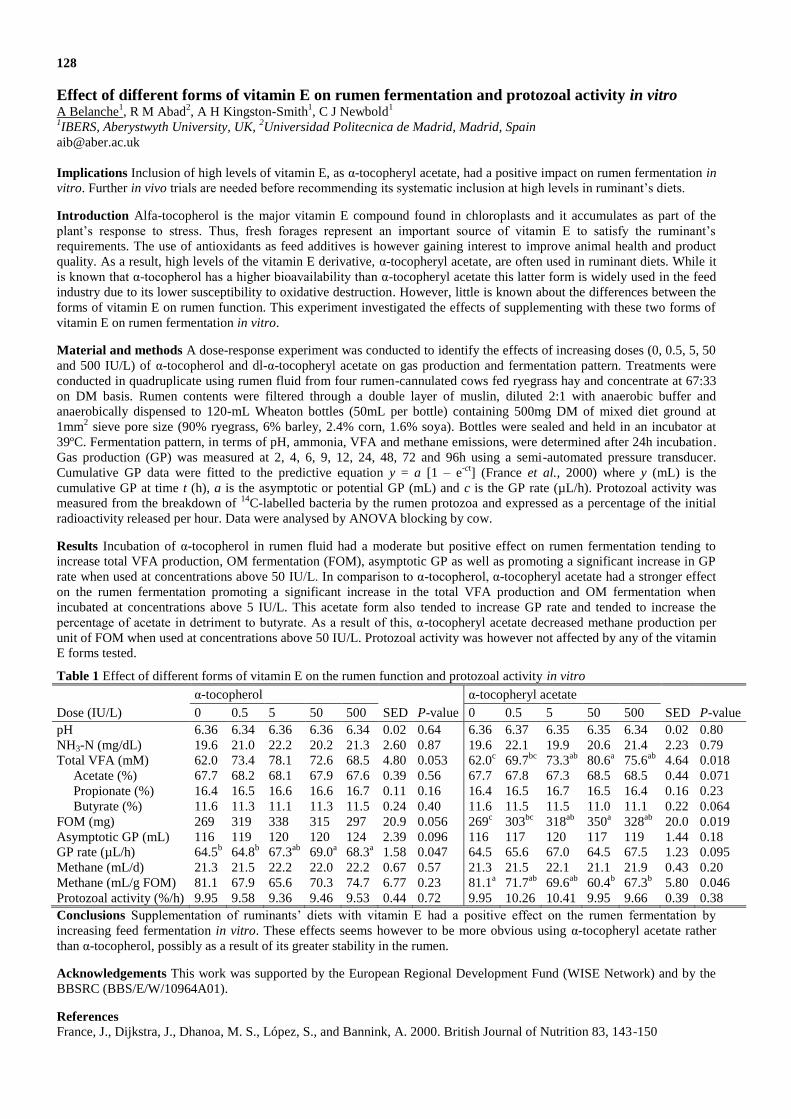
128
Effect of different forms of vitamin E on rumen fermentation and protozoal activity in vitro A Belanche
1, R M Abad
2, A H Kingston-Smith
1, C J Newbold
1
1IBERS, Aberystwyth University, UK,
2Universidad Politecnica de Madrid, Madrid, Spain
Implications Inclusion of high levels of vitamin E, as α-tocopheryl acetate, had a positive impact on rumen fermentation in
vitro. Further in vivo trials are needed before recommending its systematic inclusion at high levels in ruminant’s diets.
Introduction Alfa-tocopherol is the major vitamin E compound found in chloroplasts and it accumulates as part of the
plant’s response to stress. Thus, fresh forages represent an important source of vitamin E to satisfy the ruminant’s
requirements. The use of antioxidants as feed additives is however gaining interest to improve animal health and product
quality. As a result, high levels of the vitamin E derivative, α-tocopheryl acetate, are often used in ruminant diets. While it
is known that α-tocopherol has a higher bioavailability than α-tocopheryl acetate this latter form is widely used in the feed
industry due to its lower susceptibility to oxidative destruction. However, little is known about the differences between the
forms of vitamin E on rumen function. This experiment investigated the effects of supplementing with these two forms of
vitamin E on rumen fermentation in vitro.
Material and methods A dose-response experiment was conducted to identify the effects of increasing doses (0, 0.5, 5, 50
and 500 IU/L) of α-tocopherol and dl-α-tocopheryl acetate on gas production and fermentation pattern. Treatments were
conducted in quadruplicate using rumen fluid from four rumen-cannulated cows fed ryegrass hay and concentrate at 67:33
on DM basis. Rumen contents were filtered through a double layer of muslin, diluted 2:1 with anaerobic buffer and
anaerobically dispensed to 120-mL Wheaton bottles (50mL per bottle) containing 500mg DM of mixed diet ground at
1mm2 sieve pore size (90% ryegrass, 6% barley, 2.4% corn, 1.6% soya). Bottles were sealed and held in an incubator at
39ºC. Fermentation pattern, in terms of pH, ammonia, VFA and methane emissions, were determined after 24h incubation.
Gas production (GP) was measured at 2, 4, 6, 9, 12, 24, 48, 72 and 96h using a semi-automated pressure transducer.
Cumulative GP data were fitted to the predictive equation y = a [1 – e-ct
] (France et al., 2000) where y (mL) is the
cumulative GP at time t (h), a is the asymptotic or potential GP (mL) and c is the GP rate (µL/h). Protozoal activity was
measured from the breakdown of 14
C-labelled bacteria by the rumen protozoa and expressed as a percentage of the initial
radioactivity released per hour. Data were analysed by ANOVA blocking by cow.
Results Incubation of α-tocopherol in rumen fluid had a moderate but positive effect on rumen fermentation tending to
increase total VFA production, OM fermentation (FOM), asymptotic GP as well as promoting a significant increase in GP
rate when used at concentrations above 50 IU/L. In comparison to α-tocopherol, α-tocopheryl acetate had a stronger effect
on the rumen fermentation promoting a significant increase in the total VFA production and OM fermentation when
incubated at concentrations above 5 IU/L. This acetate form also tended to increase GP rate and tended to increase the
percentage of acetate in detriment to butyrate. As a result of this, α-tocopheryl acetate decreased methane production per
unit of FOM when used at concentrations above 50 IU/L. Protozoal activity was however not affected by any of the vitamin
E forms tested.
Table 1 Effect of different forms of vitamin E on the rumen function and protozoal activity in vitro
α-tocopherol
α-tocopheryl acetate
Dose (IU/L) 0 0.5 5 50 500 SED P-value 0 0.5 5 50 500 SED P-value
pH 6.36 6.34 6.36 6.36 6.34 0.02 0.64 6.36 6.37 6.35 6.35 6.34 0.02 0.80
NH3-N (mg/dL) 19.6 21.0 22.2 20.2 21.3 2.60 0.87 19.6 22.1 19.9 20.6 21.4 2.23 0.79
Total VFA (mM) 62.0 73.4 78.1 72.6 68.5 4.80 0.053 62.0c 69.7
bc 73.3
ab 80.6
a 75.6
ab 4.64 0.018
Acetate (%) 67.7 68.2 68.1 67.9 67.6 0.39 0.56 67.7 67.8 67.3 68.5 68.5 0.44 0.071
Propionate (%) 16.4 16.5 16.6 16.6 16.7 0.11 0.16 16.4 16.5 16.7 16.5 16.4 0.16 0.23
Butyrate (%) 11.6 11.3 11.1 11.3 11.5 0.24 0.40 11.6 11.5 11.5 11.0 11.1 0.22 0.064
FOM (mg) 269 319 338 315 297 20.9 0.056 269c 303
bc 318
ab 350
a 328
ab 20.0 0.019
Asymptotic GP (mL) 116 119 120 120 124 2.39 0.096 116 117 120 117 119 1.44 0.18
GP rate (µL/h) 64.5b 64.8
b 67.3
ab 69.0
a 68.3
a 1.58 0.047 64.5 65.6 67.0 64.5 67.5 1.23 0.095
Methane (mL/d) 21.3 21.5 22.2 22.0 22.2 0.67 0.57 21.3 21.5 22.1 21.1 21.9 0.43 0.20
Methane (mL/g FOM) 81.1 67.9 65.6 70.3 74.7 6.77 0.23 81.1a 71.7
ab 69.6
ab 60.4
b 67.3
b 5.80 0.046
Protozoal activity (%/h) 9.95 9.58 9.36 9.46 9.53 0.44 0.72 9.95 10.26 10.41 9.95 9.66 0.39 0.38
Conclusions Supplementation of ruminants’ diets with vitamin E had a positive effect on the rumen fermentation by
increasing feed fermentation in vitro. These effects seems however to be more obvious using α-tocopheryl acetate rather
than α-tocopherol, possibly as a result of its greater stability in the rumen.
Acknowledgements This work was supported by the European Regional Development Fund (WISE Network) and by the
BBSRC (BBS/E/W/10964A01).
References France, J., Dijkstra, J., Dhanoa, M. S., López, S., and Bannink, A. 2000. British Journal of Nutrition 83, 143-150
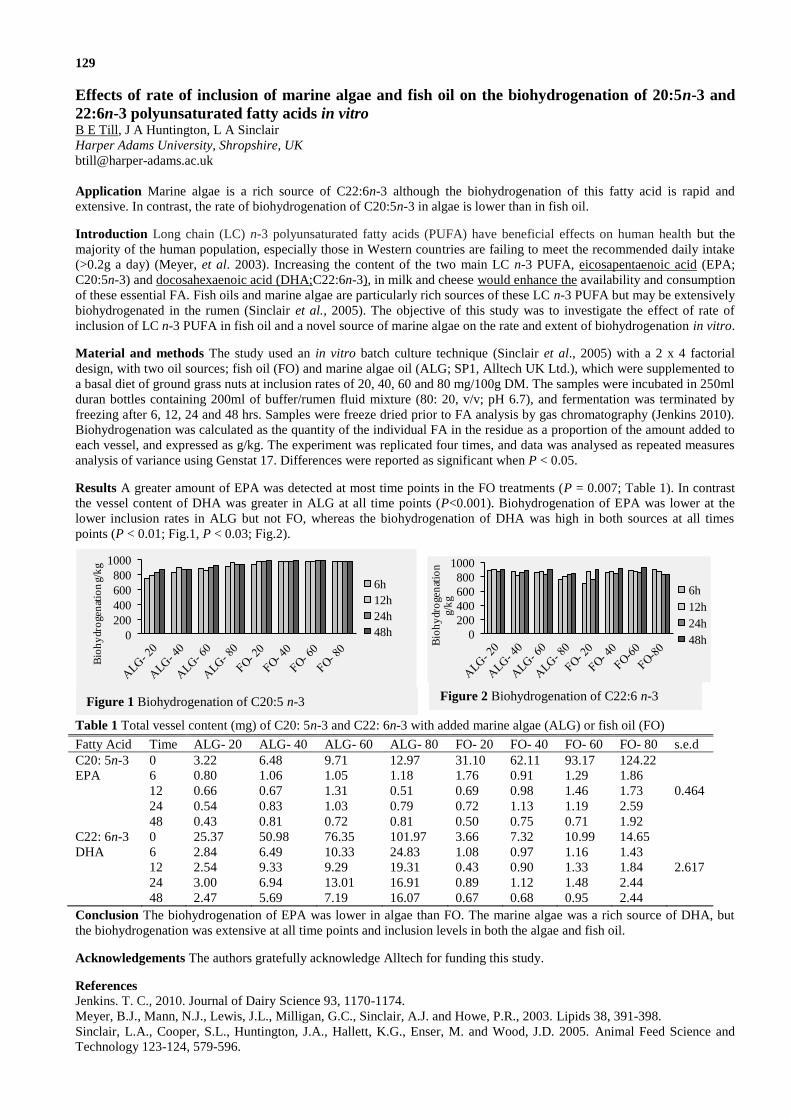
0
200
400
600
800
1000
Bio
hy
dro
gen
atio
n
g/k
g 6h
12h
24h
48h0
200
400
600
800
1000
Bio
hy
dro
gen
atio
n g
/kg
6h
12h
24h
48h
Figure 1 Biohydrogenation of C20:5 n-3 Figure 2 Biohydrogenation of C22:6 n-3
129
Effects of rate of inclusion of marine algae and fish oil on the biohydrogenation of 20:5n-3 and
22:6n-3 polyunsaturated fatty acids in vitro B E Till, J A Huntington, L A Sinclair
Harper Adams University, Shropshire, UK
Application Marine algae is a rich source of C22:6n-3 although the biohydrogenation of this fatty acid is rapid and
extensive. In contrast, the rate of biohydrogenation of C20:5n-3 in algae is lower than in fish oil.
Introduction Long chain (LC) n-3 polyunsaturated fatty acids (PUFA) have beneficial effects on human health but the
majority of the human population, especially those in Western countries are failing to meet the recommended daily intake
(>0.2g a day) (Meyer, et al. 2003). Increasing the content of the two main LC n-3 PUFA, eicosapentaenoic acid (EPA;
C20:5n-3) and docosahexaenoic acid (DHA;C22:6n-3), in milk and cheese would enhance the availability and consumption
of these essential FA. Fish oils and marine algae are particularly rich sources of these LC n-3 PUFA but may be extensively
biohydrogenated in the rumen (Sinclair et al., 2005). The objective of this study was to investigate the effect of rate of
inclusion of LC n-3 PUFA in fish oil and a novel source of marine algae on the rate and extent of biohydrogenation in vitro.
Material and methods The study used an in vitro batch culture technique (Sinclair et al., 2005) with a 2 x 4 factorial
design, with two oil sources; fish oil (FO) and marine algae oil (ALG; SP1, Alltech UK Ltd.), which were supplemented to
a basal diet of ground grass nuts at inclusion rates of 20, 40, 60 and 80 mg/100g DM. The samples were incubated in 250ml
duran bottles containing 200ml of buffer/rumen fluid mixture (80: 20, v/v; pH 6.7), and fermentation was terminated by
freezing after 6, 12, 24 and 48 hrs. Samples were freeze dried prior to FA analysis by gas chromatography (Jenkins 2010).
Biohydrogenation was calculated as the quantity of the individual FA in the residue as a proportion of the amount added to
each vessel, and expressed as g/kg. The experiment was replicated four times, and data was analysed as repeated measures
analysis of variance using Genstat 17. Differences were reported as significant when P < 0.05.
Results A greater amount of EPA was detected at most time points in the FO treatments (P = 0.007; Table 1). In contrast
the vessel content of DHA was greater in ALG at all time points (P<0.001). Biohydrogenation of EPA was lower at the
lower inclusion rates in ALG but not FO, whereas the biohydrogenation of DHA was high in both sources at all times
points (P < 0.01; Fig.1, P < 0.03; Fig.2).
Table 1 Total vessel content (mg) of C20: 5n-3 and C22: 6n-3 with added marine algae (ALG) or fish oil (FO)
Conclusion The biohydrogenation of EPA was lower in algae than FO. The marine algae was a rich source of DHA, but
the biohydrogenation was extensive at all time points and inclusion levels in both the algae and fish oil.
Acknowledgements The authors gratefully acknowledge Alltech for funding this study.
References Jenkins. T. C., 2010. Journal of Dairy Science 93, 1170-1174.
Meyer, B.J., Mann, N.J., Lewis, J.L., Milligan, G.C., Sinclair, A.J. and Howe, P.R., 2003. Lipids 38, 391-398.
Sinclair, L.A., Cooper, S.L., Huntington, J.A., Hallett, K.G., Enser, M. and Wood, J.D. 2005. Animal Feed Science and
Technology 123-124, 579-596.
Fatty Acid Time ALG- 20 ALG- 40 ALG- 60 ALG- 80 FO- 20 FO- 40 FO- 60 FO- 80 s.e.d
C20: 5n-3 0 3.22 6.48 9.71 12.97 31.10 62.11 93.17 124.22
EPA 6 0.80 1.06 1.05 1.18 1.76 0.91 1.29 1.86
12 0.66 0.67 1.31 0.51 0.69 0.98 1.46 1.73 0.464
24 0.54 0.83 1.03 0.79 0.72 1.13 1.19 2.59
48 0.43 0.81 0.72 0.81 0.50 0.75 0.71 1.92
C22: 6n-3 0 25.37 50.98 76.35 101.97 3.66 7.32 10.99 14.65
DHA 6 2.84 6.49 10.33 24.83 1.08 0.97 1.16 1.43
12 2.54 9.33 9.29 19.31 0.43 0.90 1.33 1.84 2.617
24 3.00 6.94 13.01 16.91 0.89 1.12 1.48 2.44
48 2.47 5.69 7.19 16.07 0.67 0.68 0.95 2.44
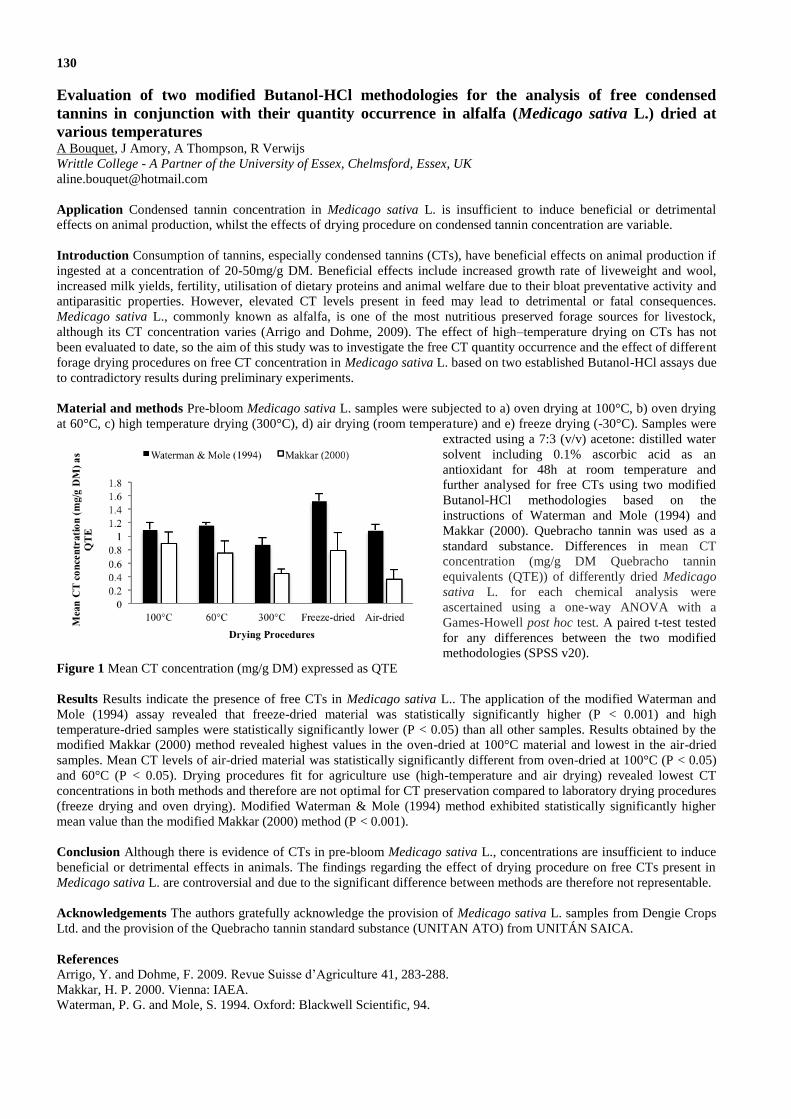
130
Evaluation of two modified Butanol-HCl methodologies for the analysis of free condensed
tannins in conjunction with their quantity occurrence in alfalfa (Medicago sativa L.) dried at
various temperatures A Bouquet, J Amory, A Thompson, R Verwijs
Writtle College - A Partner of the University of Essex, Chelmsford, Essex, UK
Application Condensed tannin concentration in Medicago sativa L. is insufficient to induce beneficial or detrimental
effects on animal production, whilst the effects of drying procedure on condensed tannin concentration are variable.
Introduction Consumption of tannins, especially condensed tannins (CTs), have beneficial effects on animal production if
ingested at a concentration of 20-50mg/g DM. Beneficial effects include increased growth rate of liveweight and wool,
increased milk yields, fertility, utilisation of dietary proteins and animal welfare due to their bloat preventative activity and
antiparasitic properties. However, elevated CT levels present in feed may lead to detrimental or fatal consequences.
Medicago sativa L., commonly known as alfalfa, is one of the most nutritious preserved forage sources for livestock,
although its CT concentration varies (Arrigo and Dohme, 2009). The effect of high–temperature drying on CTs has not
been evaluated to date, so the aim of this study was to investigate the free CT quantity occurrence and the effect of different
forage drying procedures on free CT concentration in Medicago sativa L. based on two established Butanol-HCl assays due
to contradictory results during preliminary experiments.
Material and methods Pre-bloom Medicago sativa L. samples were subjected to a) oven drying at 100°C, b) oven drying
at 60°C, c) high temperature drying (300°C), d) air drying (room temperature) and e) freeze drying (-30°C). Samples were
extracted using a 7:3 (v/v) acetone: distilled water
solvent including 0.1% ascorbic acid as an
antioxidant for 48h at room temperature and
further analysed for free CTs using two modified
Butanol-HCl methodologies based on the
instructions of Waterman and Mole (1994) and
Makkar (2000). Quebracho tannin was used as a
standard substance. Differences in mean CT
concentration (mg/g DM Quebracho tannin
equivalents (QTE)) of differently dried Medicago
sativa L. for each chemical analysis were
ascertained using a one-way ANOVA with a
Games-Howell post hoc test. A paired t-test tested
for any differences between the two modified
methodologies (SPSS v20).
Figure 1 Mean CT concentration (mg/g DM) expressed as QTE
Results Results indicate the presence of free CTs in Medicago sativa L.. The application of the modified Waterman and
Mole (1994) assay revealed that freeze-dried material was statistically significantly higher (P < 0.001) and high
temperature-dried samples were statistically significantly lower (P < 0.05) than all other samples. Results obtained by the
modified Makkar (2000) method revealed highest values in the oven-dried at 100°C material and lowest in the air-dried
samples. Mean CT levels of air-dried material was statistically significantly different from oven-dried at 100°C (P < 0.05)
and 60°C (P < 0.05). Drying procedures fit for agriculture use (high-temperature and air drying) revealed lowest CT
concentrations in both methods and therefore are not optimal for CT preservation compared to laboratory drying procedures
(freeze drying and oven drying). Modified Waterman & Mole (1994) method exhibited statistically significantly higher
mean value than the modified Makkar (2000) method (P < 0.001).
Conclusion Although there is evidence of CTs in pre-bloom Medicago sativa L., concentrations are insufficient to induce
beneficial or detrimental effects in animals. The findings regarding the effect of drying procedure on free CTs present in
Medicago sativa L. are controversial and due to the significant difference between methods are therefore not representable.
Acknowledgements The authors gratefully acknowledge the provision of Medicago sativa L. samples from Dengie Crops
Ltd. and the provision of the Quebracho tannin standard substance (UNITAN ATO) from UNITÁN SAICA.
References
Arrigo, Y. and Dohme, F. 2009. Revue Suisse d’Agriculture 41, 283-288.
Makkar, H. P. 2000. Vienna: IAEA.
Waterman, P. G. and Mole, S. 1994. Oxford: Blackwell Scientific, 94.
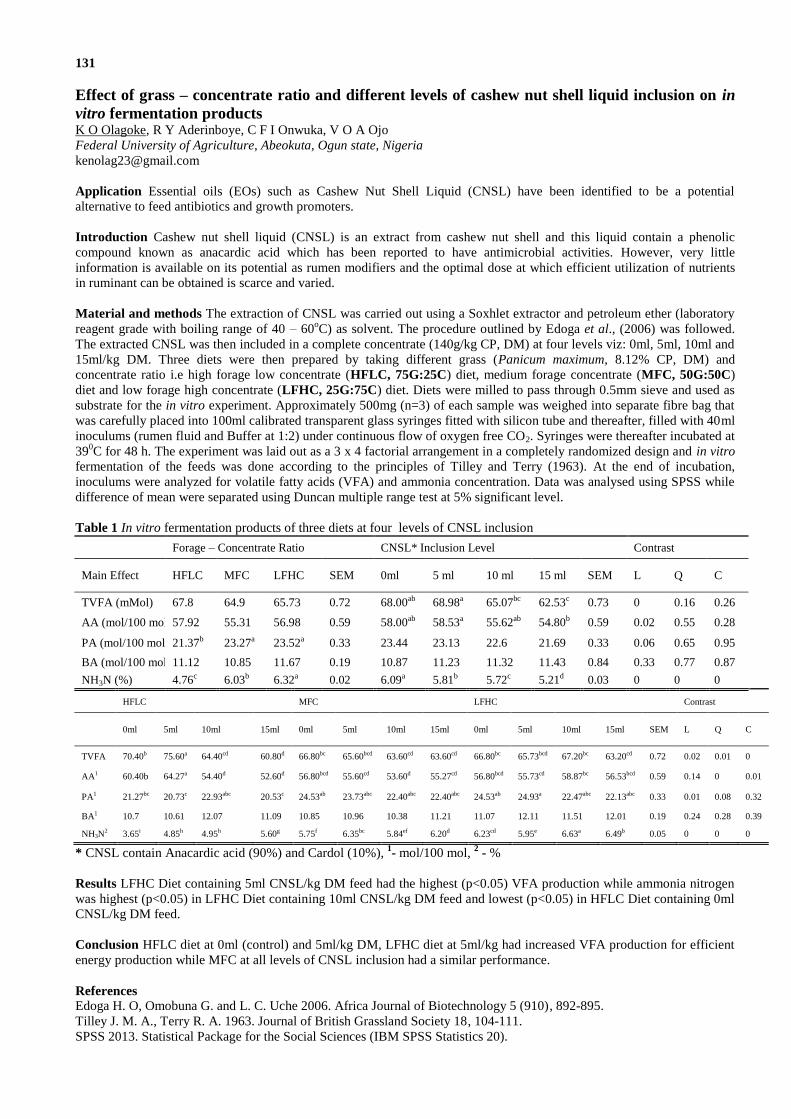
131
Effect of grass – concentrate ratio and different levels of cashew nut shell liquid inclusion on in
vitro fermentation products K O Olagoke, R Y Aderinboye, C F I Onwuka, V O A Ojo
Federal University of Agriculture, Abeokuta, Ogun state, Nigeria
Application Essential oils (EOs) such as Cashew Nut Shell Liquid (CNSL) have been identified to be a potential
alternative to feed antibiotics and growth promoters.
Introduction Cashew nut shell liquid (CNSL) is an extract from cashew nut shell and this liquid contain a phenolic
compound known as anacardic acid which has been reported to have antimicrobial activities. However, very little
information is available on its potential as rumen modifiers and the optimal dose at which efficient utilization of nutrients
in ruminant can be obtained is scarce and varied.
Material and methods The extraction of CNSL was carried out using a Soxhlet extractor and petroleum ether (laboratory
reagent grade with boiling range of 40 – 60oC) as solvent. The procedure outlined by Edoga et al., (2006) was followed.
The extracted CNSL was then included in a complete concentrate (140g/kg CP, DM) at four levels viz: 0ml, 5ml, 10ml and
15ml/kg DM. Three diets were then prepared by taking different grass (Panicum maximum, 8.12% CP, DM) and
concentrate ratio i.e high forage low concentrate (HFLC, 75G:25C) diet, medium forage concentrate (MFC, 50G:50C)
diet and low forage high concentrate (LFHC, 25G:75C) diet. Diets were milled to pass through 0.5mm sieve and used as
substrate for the in vitro experiment. Approximately 500mg (n=3) of each sample was weighed into separate fibre bag that
was carefully placed into 100ml calibrated transparent glass syringes fitted with silicon tube and thereafter, filled with 40ml
inoculums (rumen fluid and Buffer at 1:2) under continuous flow of oxygen free CO2. Syringes were thereafter incubated at
390C for 48 h. The experiment was laid out as a 3 x 4 factorial arrangement in a completely randomized design and in vitro
fermentation of the feeds was done according to the principles of Tilley and Terry (1963). At the end of incubation,
inoculums were analyzed for volatile fatty acids (VFA) and ammonia concentration. Data was analysed using SPSS while
difference of mean were separated using Duncan multiple range test at 5% significant level.
Table 1 In vitro fermentation products of three diets at four levels of CNSL inclusion
Forage – Concentrate Ratio CNSL* Inclusion Level Contrast
Main Effect HFLC MFC LFHC SEM 0ml 5 ml 10 ml 15 ml SEM L Q C
TVFA (mMol) 67.8 64.9 65.73 0.72 68.00ab 68.98a 65.07bc 62.53c 0.73 0 0.16 0.26
AA (mol/100 mol) 57.92 55.31 56.98 0.59 58.00ab 58.53a 55.62ab 54.80b 0.59 0.02 0.55 0.28
PA (mol/100 mol) 21.37b 23.27a 23.52a 0.33 23.44 23.13 22.6 21.69 0.33 0.06 0.65 0.95
BA (mol/100 mol) 11.12 10.85 11.67 0.19 10.87 11.23 11.32 11.43 0.84 0.33 0.77 0.87
NH3N (%) 4.76c 6.03b 6.32a 0.02 6.09a 5.81b 5.72c 5.21d 0.03 0 0 0
HFLC MFC LFHC Contrast
0ml 5ml 10ml 15ml 0ml 5ml 10ml 15ml 0ml 5ml 10ml 15ml SEM L Q C
TVFA 70.40b 75.60a 64.40cd 60.80d 66.80bc 65.60bcd 63.60cd 63.60cd 66.80bc 65.73bcd 67.20bc 63.20cd 0.72 0.02 0.01 0
AA1 60.40b 64.27a 54.40d 52.60d 56.80bcd 55.60cd 53.60d 55.27cd 56.80bcd 55.73cd 58.87bc 56.53bcd 0.59 0.14 0 0.01
PA1 21.27bc 20.73c 22.93abc 20.53c 24.53ab 23.73abc 22.40abc 22.40abc 24.53ab 24.93a 22.47abc 22.13abc 0.33 0.01 0.08 0.32
BA1 10.7 10.61 12.07 11.09 10.85 10.96 10.38 11.21 11.07 12.11 11.51 12.01 0.19 0.24 0.28 0.39
NH3N2 3.65i 4.85h 4.95h 5.60g 5.75f 6.35bc 5.84ef 6.20d 6.23cd 5.95e 6.63a 6.49b 0.05 0 0 0
* CNSL contain Anacardic acid (90%) and Cardol (10%), 1- mol/100 mol,
2 - %
Results LFHC Diet containing 5ml CNSL/kg DM feed had the highest (p<0.05) VFA production while ammonia nitrogen
was highest (p<0.05) in LFHC Diet containing 10ml CNSL/kg DM feed and lowest (p<0.05) in HFLC Diet containing 0ml
CNSL/kg DM feed.
Conclusion HFLC diet at 0ml (control) and 5ml/kg DM, LFHC diet at 5ml/kg had increased VFA production for efficient
energy production while MFC at all levels of CNSL inclusion had a similar performance.
References
Edoga H. O, Omobuna G. and L. C. Uche 2006. Africa Journal of Biotechnology 5 (910), 892-895.
Tilley J. M. A., Terry R. A. 1963. Journal of British Grassland Society 18, 104-111.
SPSS 2013. Statistical Package for the Social Sciences (IBM SPSS Statistics 20).
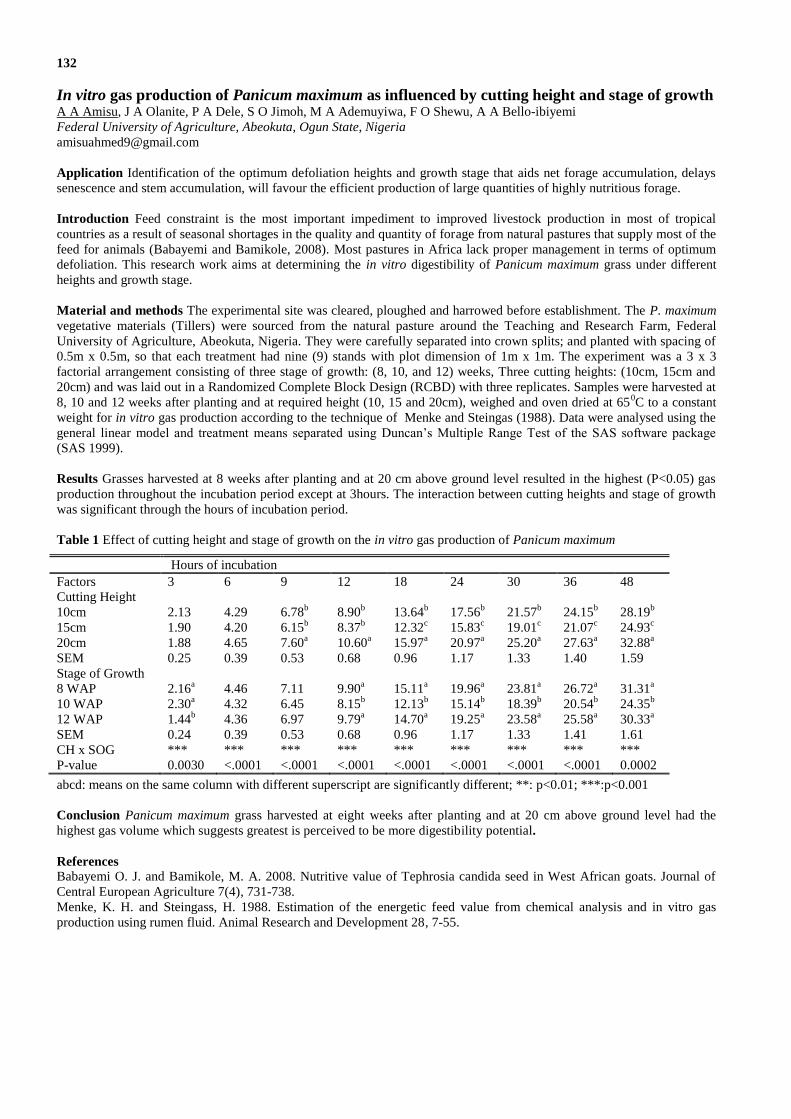
132
In vitro gas production of Panicum maximum as influenced by cutting height and stage of growth A A Amisu, J A Olanite, P A Dele, S O Jimoh, M A Ademuyiwa, F O Shewu, A A Bello-ibiyemi
Federal University of Agriculture, Abeokuta, Ogun State, Nigeria
Application Identification of the optimum defoliation heights and growth stage that aids net forage accumulation, delays
senescence and stem accumulation, will favour the efficient production of large quantities of highly nutritious forage.
Introduction Feed constraint is the most important impediment to improved livestock production in most of tropical
countries as a result of seasonal shortages in the quality and quantity of forage from natural pastures that supply most of the
feed for animals (Babayemi and Bamikole, 2008). Most pastures in Africa lack proper management in terms of optimum
defoliation. This research work aims at determining the in vitro digestibility of Panicum maximum grass under different
heights and growth stage.
Material and methods The experimental site was cleared, ploughed and harrowed before establishment. The P. maximum
vegetative materials (Tillers) were sourced from the natural pasture around the Teaching and Research Farm, Federal
University of Agriculture, Abeokuta, Nigeria. They were carefully separated into crown splits; and planted with spacing of
0.5m x 0.5m, so that each treatment had nine (9) stands with plot dimension of 1m x 1m. The experiment was a 3 x 3
factorial arrangement consisting of three stage of growth: (8, 10, and 12) weeks, Three cutting heights: (10cm, 15cm and
20cm) and was laid out in a Randomized Complete Block Design (RCBD) with three replicates. Samples were harvested at
8, 10 and 12 weeks after planting and at required height (10, 15 and 20cm), weighed and oven dried at 650C to a constant
weight for in vitro gas production according to the technique of Menke and Steingas (1988). Data were analysed using the
general linear model and treatment means separated using Duncan’s Multiple Range Test of the SAS software package
(SAS 1999).
Results Grasses harvested at 8 weeks after planting and at 20 cm above ground level resulted in the highest (P<0.05) gas
production throughout the incubation period except at 3hours. The interaction between cutting heights and stage of growth
was significant through the hours of incubation period.
Table 1 Effect of cutting height and stage of growth on the in vitro gas production of Panicum maximum
abcd: means on the same column with different superscript are significantly different; **: p<0.01; ***:p<0.001
Conclusion Panicum maximum grass harvested at eight weeks after planting and at 20 cm above ground level had the
highest gas volume which suggests greatest is perceived to be more digestibility potential.
References
Babayemi O. J. and Bamikole, M. A. 2008. Nutritive value of Tephrosia candida seed in West African goats. Journal of
Central European Agriculture 7(4), 731-738.
Menke, K. H. and Steingass, H. 1988. Estimation of the energetic feed value from chemical analysis and in vitro gas
production using rumen fluid. Animal Research and Development 28, 7-55.
Hours of incubation
Factors 3 6 9 12 18 24 30 36 48
Cutting Height
10cm 2.13 4.29 6.78b
8.90b
13.64b
17.56b
21.57b
24.15b
28.19b
15cm 1.90 4.20 6.15b
8.37b
12.32c
15.83c
19.01c
21.07c
24.93c
20cm 1.88 4.65 7.60a
10.60a
15.97a
20.97a
25.20a
27.63a
32.88a
SEM 0.25 0.39 0.53 0.68 0.96 1.17 1.33 1.40 1.59
Stage of Growth
8 WAP 2.16a
4.46 7.11 9.90a
15.11a
19.96a
23.81a
26.72a
31.31a
10 WAP 2.30a
4.32 6.45 8.15b
12.13b
15.14b
18.39b
20.54b
24.35b
12 WAP 1.44b
4.36 6.97 9.79a
14.70a
19.25a
23.58a
25.58a
30.33a
SEM 0.24 0.39 0.53 0.68 0.96 1.17 1.33 1.41 1.61
CH x SOG *** *** *** *** *** *** *** *** ***
P-value 0.0030 <.0001 <.0001 <.0001 <.0001 <.0001 <.0001 <.0001 0.0002

133
Ingestive behaviour of three novel forages in horses L Niles
1, L Cameron
1,2, J Lowe
3
1Sparsholt College, Hampshire, UK,
2University of Portsmouth, Hampshire, UK,
3Dodson & Horrell Ltd,
Northamptonshire, UK
Application Pea haulm may be suitable for inclusion in the diet of horses where minimal nutrient intake but maximal
chewing time is required, whereas whole crop oat and sainfoin deliver more nutrition for relatively less chewing time.
Introduction Horses have many diverse roles in current society and thus require different nutrient and energy intakes
although their evolution as a hind-gut fermenter dictates that frequent feeding and forage should form the mainstay of their
diets (Hale, Hemmings & Bee, 2011). Forage intake is associated with physiological factors such as dental health, saliva
production and its resultant impact on stomach lining as well as moderating undesired behaviours (Sarrafchi & Blokhuis,
2013). The aim of the study was to evaluate three novel forages, pea haulm (PH), sainfoin (S) and whole crop oat (WCO)
through proximate analysis and assess preferences and bite/chew rates of individual forages and blends thereof.
Material and methods Proximate analysis was conducted on the novel forages, including dry matter (DM), acid detergent
(ADF) and neutral detergent fibre (NDF). Using a stratified sample of healthy horses from the on-site college equine centre
(n = 18), individual preference tests with randomised presentation of 200g of forage were conducted between three single
forages (PH1, S
2, WCO
3) and three forage blends (S:PH
4, WCO:PH
5, S:WCO
6) in a 1:1 ratio. Preference presentations were
limited to five minutes and first taste, subsequent preferences and amount remaining recorded. Chew and bite rates for eight
forage blends (as for preference testing plus 2:1 ratio each of S:WCO7 and WCO:S
8) were assessed using 16 horses in a
replicated, balanced Latin square. Each horse was fed 500g of forage blend and presentations timed for 10 minutes. The
amount remaining, number of bites and chews, and time taken to eat were recorded and used to calculate time taken to eat
1kg/DM, chews and bites/kg DM, chew/minute and chews/kg NDF. The level of significance was set to 0.05 and the non-
parametric data analysed in Minitab 17 using Friedman’s test for differences and Spearman’s rho for correlations.
Results PH had a higher DM and ADF and NDF values than WCO and S respectively. Preference test results (Table 1)
indicated significant differences for the amount consumed between single forages (S = 21.52, p < 0.05) and forage blends
(S = 18.97, p < 0.05). Significant differences were found for the time taken to eat 1kg of DM (S = 41.40, p < 0.05), total
amounts eaten (S = 67.50, p < 0.05), chews/ kg DM (S = 19.78, p < 0.05), chews per minute (S = 69.70, p < 0.05) and
chews/kg NDF (S = 23.93, p < 0.05). A negative correlation was found between NDF content and DM intake (rs= -0.55, p
< 0.05) and chews/minute and NDF content (rs= -0.34, p < 0.05).
Table 1 Ingestive behaviour expressed through preference testing (mean and s.d.)
Forage/forage blend PH S WCO S:PH WCO:PH WCO:S
Amount consumed (g) 8.2 (±12.7) 125.5 (±69.0) 79.2 (±69.4) 47.2 (±53.3) 13.8 (±30.9) 126.1 (±75.1)
Conclusion Horses expressed strong individual preferences between forage blends and preference trials should be
replicated to account for any feeding-side preferences. Forage blends containing WCO and S were consumed faster than
those containing PH. PH may be suitable for inclusion in the diet of horses where minimal nutrient intake but maximal
chewing time is required. Conversely, S and WCO appear to maximise nutrient intake with less chewing effort. These
findings are in line with Ellis, Thomas, Arkell and Harris (2005) who reported a decreased eating time when lucerne was
added to a meal, but an increased eating time when short-chopped straw was added. Further long-term studies may be
warranted to assess voluntary intake and chew rates across a wider sample of horses and ponies but commercial production
of custom-blended forages which are convenient to feed, provide occupational therapy through chewing and form the
mainstay of a balanced diet supplemented with concentrates where necessary, could eventually be realised.
Acknowledgements The authors wish to thank Dodson & Horrell Ltd., Northamptonshire for supply of the trial forages.
References
Ellis, A. D., Thomas, S., Arkell, K. and Harris, P. 2005. Adding chopped straw to concentrate feed: the effect on inclusion
rate and particle length on intake behaviour of horses. Pferdeheilkunde 21, 35-37.
Hale, C. E., Hemmings, A. J. and Bee, S. E. 2011. The effects of a high starch, cereal-based diet compared to a low starch,
fibre-based diet on reactivity in horses. In A. Lindner (Ed.), Applied Equine Nutrition and Training (pp. 227-232).
Netherlands: Wageningen Academic Publishers.
Sarrafchi, A. and Blokhuis, H. J. 2013. Equine stereotypic behaviors: Causation, occurrence and prevention. Journal of
Veterinary Behavior 8, 386-394.
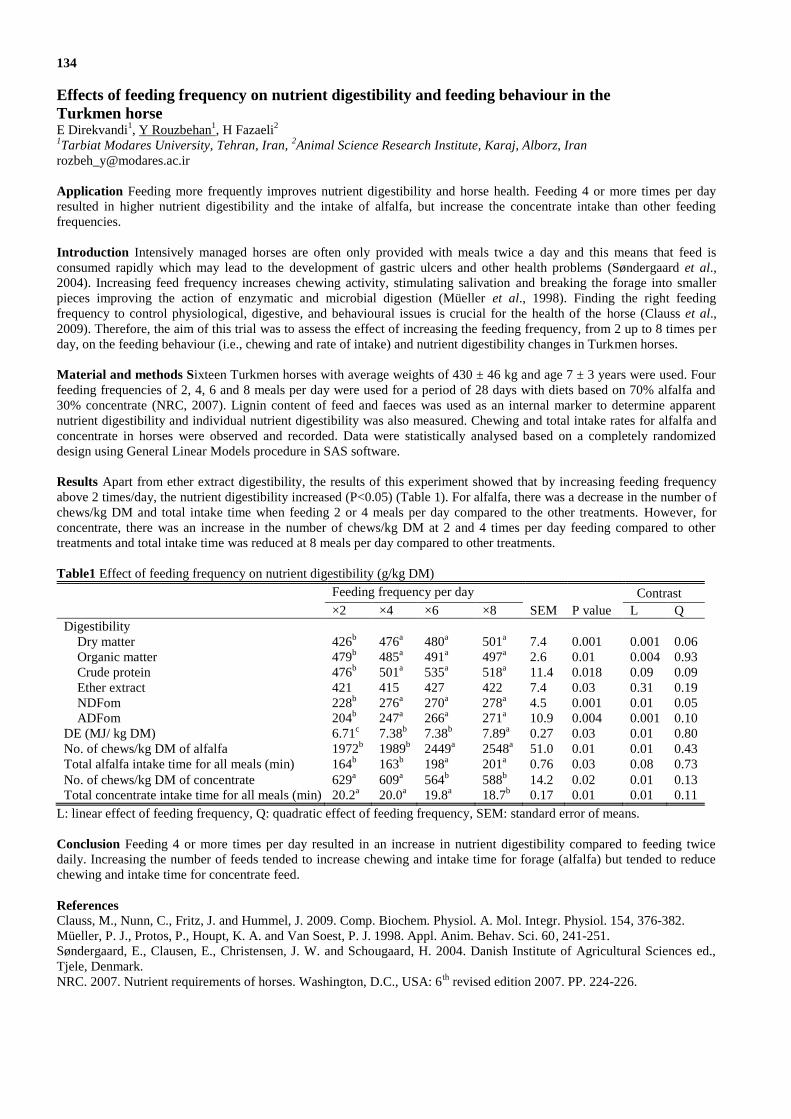
134
Effects of feeding frequency on nutrient digestibility and feeding behaviour in the
Turkmen horse E Direkvandi
1, Y Rouzbehan
1, H Fazaeli
2
1Tarbiat Modares University, Tehran, Iran,
2Animal Science Research Institute, Karaj, Alborz, Iran
Application Feeding more frequently improves nutrient digestibility and horse health. Feeding 4 or more times per day
resulted in higher nutrient digestibility and the intake of alfalfa, but increase the concentrate intake than other feeding
frequencies.
Introduction Intensively managed horses are often only provided with meals twice a day and this means that feed is
consumed rapidly which may lead to the development of gastric ulcers and other health problems (Søndergaard et al.,
2004). Increasing feed frequency increases chewing activity, stimulating salivation and breaking the forage into smaller
pieces improving the action of enzymatic and microbial digestion (Müeller et al., 1998). Finding the right feeding
frequency to control physiological, digestive, and behavioural issues is crucial for the health of the horse (Clauss et al.,
2009). Therefore, the aim of this trial was to assess the effect of increasing the feeding frequency, from 2 up to 8 times per
day, on the feeding behaviour (i.e., chewing and rate of intake) and nutrient digestibility changes in Turkmen horses.
Material and methods Sixteen Turkmen horses with average weights of 430 ± 46 kg and age 7 ± 3 years were used. Four
feeding frequencies of 2, 4, 6 and 8 meals per day were used for a period of 28 days with diets based on 70% alfalfa and
30% concentrate (NRC, 2007). Lignin content of feed and faeces was used as an internal marker to determine apparent
nutrient digestibility and individual nutrient digestibility was also measured. Chewing and total intake rates for alfalfa and
concentrate in horses were observed and recorded. Data were statistically analysed based on a completely randomized
design using General Linear Models procedure in SAS software.
Results Apart from ether extract digestibility, the results of this experiment showed that by increasing feeding frequency
above 2 times/day, the nutrient digestibility increased (P<0.05) (Table 1). For alfalfa, there was a decrease in the number of
chews/kg DM and total intake time when feeding 2 or 4 meals per day compared to the other treatments. However, for
concentrate, there was an increase in the number of chews/kg DM at 2 and 4 times per day feeding compared to other
treatments and total intake time was reduced at 8 meals per day compared to other treatments.
Table1 Effect of feeding frequency on nutrient digestibility (g/kg DM)
Feeding frequency per day
SEM
Contrast
×2 ×4 ×6 ×8 P value L Q
Digestibility
Dry matter
Organic matter
Crude protein
Ether extract
NDFom
ADFom
DE (MJ/ kg DM)
426b
479b
476b
421
228b
204b
6.71c
476a
485a
501a
415
276a
247a
7.38b
480a
491a
535a
427
270a
266a
7.38b
501a
497a
518a
422
278a
271a
7.89a
7.4
2.6
11.4
7.4
4.5
10.9
0.27
0.001
0.01
0.018
0.03
0.001
0.004
0.03
0.001
0.004
0.09
0.31
0.01
0.001
0.01
0.06
0.93
0.09
0.19
0.05
0.10
0.80
No. of chews/kg DM of alfalfa 1972b 1989
b 2449
a 2548
a 51.0 0.01 0.01 0.43
Total alfalfa intake time for all meals (min) 164b 163
b 198
a 201
a 0.76 0.03 0.08 0.73
No. of chews/kg DM of concentrate 629a 609
a 564
b 588
b 14.2 0.02 0.01 0.13
Total concentrate intake time for all meals (min) 20.2a 20.0
a 19.8
a 18.7
b 0.17 0.01 0.01 0.11
L: linear effect of feeding frequency, Q: quadratic effect of feeding frequency, SEM: standard error of means.
Conclusion Feeding 4 or more times per day resulted in an increase in nutrient digestibility compared to feeding twice
daily. Increasing the number of feeds tended to increase chewing and intake time for forage (alfalfa) but tended to reduce
chewing and intake time for concentrate feed.
References
Clauss, M., Nunn, C., Fritz, J. and Hummel, J. 2009. Comp. Biochem. Physiol. A. Mol. Integr. Physiol. 154, 376-382.
Müeller, P. J., Protos, P., Houpt, K. A. and Van Soest, P. J. 1998. Appl. Anim. Behav. Sci. 60, 241-251.
Søndergaard, E., Clausen, E., Christensen, J. W. and Schougaard, H. 2004. Danish Institute of Agricultural Sciences ed.,
Tjele, Denmark.
NRC. 2007. Nutrient requirements of horses. Washington, D.C., USA: 6th
revised edition 2007. PP. 224-226.

135
The effect of novel yeast strain Saccharomyces cerevisiae Y1242 on apparent digestibility
in ponies A Garber
1, P M Hastie
1, N D Walker
2, J M D Murray
1
1College of Medical, Veterinary & Life Sciences, School of Veterinary Medicine, University of Glasgow, UK,
2AB Vista, Marlborough, Wiltshire, UK
Application Improving diet digestibility using yeast products is advantageous for any horse feed producer and horse
owner. The effect of higher concentrations of yeast product supplementation warrants further investigation.
Introduction There is increasing interest in feeding higher energy, fibre-based diets to horses as an alternative to rations
composed of high levels of starch-rich cereal grains. Yeast supplementation has been shown to increase fibre digestibility
in ruminants (Desnoyers et al., 2009) and horses (Agazzi et al., 2009; Jouany et al., 2008). This appears to be due to yeasts
having an important role in the microbial digestion process (Medina et al., 2002). The precise mode of action has not been
identified; however, the most common finding in yeast research studies is an increase in the fibrolytic bacterial population
and fibre digestibility (Agazzi et al., 2009; Jouany et al., 2008). In vivo data is crucial for evaluation and validation of any
potential feed additive for horses used for this purpose. The aim of the experiment reported here was to examine the effects
of Saccharomyces cerevisiae Y1242 on diet digestibility in ponies.
Material and methods Six gelding ponies were used in a digestibility study to evaluate the effect of a new strain of live
yeast Saccharomyces cerevisiae Y1242 on diet digestibility. The yeast was supplied to the treatment group as a top
dressing on the concentrate feed at a dose rate of 1.8g yeast/horse/day. Animals were fed a ration consisting of mature grass
hay and concentrate mix fed twice daily at 1.75% of their bodyweight on a dry matter (DM) basis. Concentrate inclusion
rate in the diet was preset at 20% of daily digestible energy requirements. In vivo evaluation consisted of two phases in a
double-blind randomized crossover design. All animals were randomly assigned to one of the two experimental groups and
each group received their respective diet (control or treatment) during the first phase; the groups crossed over from one
treatment to another during the second phase of the trial. During each of the two phases described previously all animals
were subject to an adaptation period of 21 days followed by a 7 day collection period. Total daily DM intake and excretion
were ascertained. Apparent digestibility of DM, crude fibre, neutral detergent fibre (NDF), acid detergent fibre,
hemicellulose, crude protein and organic matter were determined by total collection method. All data are presented as mean
± SEM, n=6. Data were analysed using the general linear model (GLM) procedure (Minitab 17, Minitab Inc., State
College, PA). Faecal pH was also determined.
Results Yeast supplementation at a dose rate of 1.8 g/horse/day did not significantly affect nutrient digestibility in ponies.
However, there were trends (p<0.10) for higher NDF apparent digestibility with yeast supplementation in comparison to
the control diet (Table1). Furthermore, faecal pH was not affected by yeast supplementation (p>0.05).
Table 1 Total diet in vivo apparent digestibility coefficients of nutrients
Treatment SEM Control SEM p-value
Dry Matter 0.482 0.0035 0.483 0.0061 0.850
Organic Matter 0.490 0.0042 0.491 0.0066 0.786
Crude Fibre 0.362 0.0124 0.365 0.0166 0.801
Neutral Detergent Fibre 0.373 0.0071 0.358 0.0102 0.087
Acid Detergent Fibre 0.340 0.0112 0.341 0.0173 0.911
Hemicellulose 0.414 0.0185 0.388 0.0069 0.143
Crude Protein 0.573 0.0193 0.574 0.0110 0.915
Gross Energy 0.418 0.0062 0.413 0.0114 0.428
Conclusion In the current study Saccharomyces cerevisiae Y1242 did not significantly improve diet apparent digestibility
in ponies. However, given the trend for higher NDF apparent digestibility with yeast supplementation it is possible that
this lack of effect may be due to insufficient level of yeast supplementation. Therefore, further work is required to evaluate
optimal yeast inclusion rates and also investigate factors such as level of exercise and diet composition on the efficacy of
yeast supplementation.
Acknowledgements The authors gratefully acknowledge funding from AB Vista.
References Agazzi, A., Invernizzi, G., Ferroni, M., Fanelli, A., and Savoini, G. 2009. Ital. J. Anim. Sci. 8 (Suppl.2), 685-687.
Desnoyers, M., Giger-Reverdin, S., Bertin, G., Duvaux-Ponter, C., and Sauvant, D. 2009. J. Dairy Sci. 92, 1620-1632.
Jouany, J.P., Gobert, J., Medina, B., Bertin, G., and Julliand V. 2008 J. Anim. Sci. 86, 339-347.
Médina, B., Girard, I.D., Jacotot, E., and Julliand, V. 2002. J. of Animal Sci. 80, 2600-2609.

136
Temporal changes in the faecal volatile organic compound (VOC) metabolome of healthy mares
pre- and post-partum R Hough, S Salem, D Archer, C Probert
University of Liverpool, UK
Application Understanding normal changes in the faecal metabolome will act as benchmark for disease.
Introduction The post-partum mare has an increased risk of colic. Changes in the faecal microbiome have been identified
in mares prior to a colic episode (Weese et al.,2015). Faecal volatile organic compound (VOC) profiling is an economical
technique to study the metabolome (functional microbiome). Horses with colic have been shown to have a different faecal
VOC profile from healthy horses (Turner et al., 2013). The aim of this study was to characterise the faecal VOC changes in
healthy mares pre- and post-partum to understand the normal fluctuations in the metabolome around this time.
Material and methods A faecal sample was collected from seven mares two (-2) and one week (-1) prior to foaling and at
one (1) and two weeks (2) post foaling. Mares were stabled overnight with ad lib hay and turned out into a paddock during
the day throughout the sampling period. Post collection, samples were stored at -80oC before analysis. Aliquots of 1000 mg
were placed in 10 ml glass vials with a septum in the lid, each sample was analysed in triplicate giving a total sample size
of 21 per time point. VOCs were extracted using headspace solid-phase micro extraction (HS-SPME) at 60oC for 20
minutes. Prior to extraction vials were incubated at 60oC for 30 minutes. The SPME fibre used was
divinylbenzene/carboxen/polydimethysiloxane (DVB-CAR-PDMS) 50/30µm (Sigma-Aldridge, Dorset, UK). Gas
chromatography mass spectroscopy (GC-MS) analysis was carried out using a Perkin Elmer Clarus 500 GC/MS Quadruple
bench top system (Beacons field, UK). The GC-MS method and conditions are detailed elsewhere (Reade et al., 2014).
Data was analysed using the Automated Mass Deconvolution System (AMDIS-version 2.71, 2012) and the NIST mass
spectral library (version 2.0, 2011) to identify VOCs. Statistical analysis was performed in R, version 3.1.2. A one-way
analysis of variance (ANOVA) followed by Tukey’s HSD test for pairwise comparisons or a Fisher’s exact test was applied
to the data where appropriate. Final p-values were adjusted using Bonferroni correction.
Results A total of 102 VOCs were identified across all four weeks; these were mainly carboxylic acids, ketones and
aldehydes. The means and SEM of VOC numbers were 79 + 1.4, 80 + 1.3, 74 + 1.4, 79 + 1.8 detected at -2, -1, 1 and 2
weeks, respectively. Significantly fewer VOCs were found 1 week post-partum than at 1 and 2 weeks pre-partum (p<0.05).
Fig. 1 shows numerical range of VOCs identified at each week pre- and post-partum. Two compounds (butanoic acid, 2-
methylbutyl ester and propanoic acid, 3-methyl-butnyl ester) were significantly less frequent in samples one week post
foaling (p<0.05).
Figure 1 The number of VOCs obtained from the faeces of mares two weeks prior to and two weeks post foaling using HS-
SPME-GCMS analysis.
Conclusion The faecal metabolome of the mare appears to alter one week after foaling before returning to baseline levels
by the second week post foaling. Further research is necessary to establish the mechanisms underlying this finding.
References
Reade S., Mayor A., Aggio R., Khalid T., Pritchard DM., Ewer AK., and Probert CS. 2014, Journal of Analytical and
Bioanalytical Techniques 5, doi:10.4172/2155-9872.1000184.
Turner, C., Batty, C., Escalona, E., Hunter, J., and Proudman, C. 2013, Current Analytical Chemistry 9, 614-621.
Weese, J.S., Holcombe, S.J., Embertson, R.M., Kurtz, K.A., Roessner, H.A., Jalali, M., and Wismer, S.E. 2015, Equine
Veterinary Journal 47, 641-649.

137
Incidence of Caslick’s vulvoplasty operations in a population of Thoroughbred mares R McLean, M Davies Morel
Aberystwyth University, UK
Application Of the 602 Thoroughbred (TB) broodmares sampled, 46.7% had the Caslick vulvoplasty operation. The
likelihood of Caslick vulvopasty operations in TB mares is increased with increased age, multi-parity and the country in
which the mare resides, in this case, Great Britain (GB) versus Ireland and Northern Ireland (IRL and NI).
Introduction Caslick vulvoplasty operations are used to correct pneumovagina in mares with poor vulva conformation
(Pascoe, 1979). Both poor conformation and treatment by Caslick’s vulvoplasty are common in the TB, as selection of
broodmares is predominantly for performance, not reproductive competence. Limited research exists about the frequency of
the procedure and the exact reasons that lead to the treatment. This study aimed to determine the frequency of the operation
in a sample of TB mares residing in GB and IRL/NI, identify if there are certain factors that contribute to whether the mare
had a Caslick vulvoplasty operation and the affect these factors have on observational grading of the performed vulvoplasty
(is the Caslick vulvoplasty efficient).
Material and methods 602 TB broodmares aged 2-26 years were recruited; mares were sourced via online search engines
and personal contacts. Information obtained for each mare included; presence or absence of Caslick operation, year of first
Caslick operation, reason why the mare was given the Caslick operation, age, whether she had ever been bred from, if she
had a race career and country of residence. Fifty-four broodmares were given a perineal examination via observation by
the researcher to enable the mares to be placed into a 5-tiered grade system (1. Neat and tidy suture – 5. Suture is of the
lowest quality).
Results From a total of 602 mares in both areas 46.7% had been given a Caslick vulvoplasty, with the percentage of
Caslick operations being significantly (p<0.001) higher in GB (59%) than in IRL/NI (34%). The largest sole factor for
performing Caslick’s across GB and IRL/NI was poor conformation. Significant associations were identified in the effect
of age (p<0.001), reproductive status (p<0.001), country of residence (p<0.001) and race career (p<0.02) to the likelihood
of a Caslick operation. There was a higher incidence of Caslick vulvoplasty operations in mares ≥15+ years than mares
aged <5 (81.4% vs. 10.3% respectively; p<0.001). Reason for performing the Caslick (mainly poor conformation and
injury) and increased age had a detrimental effect upon the grading of the Caslick (p<0.05 and p<0.01, respectively),with
Caslick’s more likely to be graded between 2-5, signifying a more inefficient Caslick.
Conclusion Caslick’s vulvoplasty is routinely used to combat pneumovagina and decrease conformational fault in TB
broodmares, with heightened use in GB compared with IRL/NI. Reasons provided for performing the operation varied,
however it is still predominantly used to correct faults that are sufficiently treated with a vulvoplasty. In support of the
literature, the results reiterate that as broodmares get older and have foaled there is an increased chance of having the
operation (Saastamoinen and Barrey, 2000). Some of the reasons listed as to why the Caslick vulvoplasty operation was
performed including urovagina, endometritis and as a breeding measure (a non-specific diagnosis) should be reviewed as a
Caslick vulvoplasty will not treat these problems but may exacerbate them.
Acknowledgements
The author gratefully acknowledges the funding from UFAW.
References
Pascoe, R.R. 1979. Observations on the length and angle of declination of the vulva and its relation to fertility in the mare.
Journal of Reproduction and Fertility Supplement 27, 299-305
Saastamoinen, M.T. and Barrey, E. 2000. Genetics of Conformation, Locomotion and Physiological Traits. In: Bowling,
A.T. and Ruvinsky, A. The Genetics of the Horse. London. CABI pp.441
138
Anatomical differences in the equine pineal gland between gender and breed: a pilot study S Dolman, S Daniels
Royal Agricultural University, Cirencester, UK
Application Advancement in knowledge of pineal gland anatomy could aid commercial breeding programs in
manipulating reproductive cycles in both the mare and stallion.
Introduction The equine pineal gland plays an essential role in the relaying of photoperiodic information to allow for the
production of the neurohormone melatonin (Reiter et al., 2010). Melatonin is multifunctional and effects not only sleep-
wake cycles but also reproductive function in seasonal breeders (Aurich 2011). Manipulation of seasonal breeding in
thoroughbred racehorses is common practice to ensure offspring are born at the optimum time for racing success (Satue and
Gardon 2013). Ovine studies show that both the mass of the pineal gland and the number of pinealocytes in contains has a
direct effect on melatonin concentrations produced (Gomez Brunet et al., 2002), however this has not been followed up in
the horse. This pilot study aimed to determine differences in the mass of the equine pineal gland between genders and breed
types.
Material and methods Horse head cadavers (n=16), comprising of Thoroughbred females (n=4), native females (n=4),
Thoroughbred males (n=4) and native males (n=4) all between the ages of 3-20 years were collected. These horses were
slaughtered for human consumption of which these cadavers were a by-product. Brain extraction was done as described by
McBride and Hemmings (2005). The brain was carefully removed and in order to expose the pineal gland a scalpel blade
was used to make a incision down the centre of the brain to locate the pineal gland. Once removed the pineal gland was
weighed and its mass recorded. Data was analysed using a Two-Way ANOVA with breed and sex as factors and LSD test.
Results When comparing all Thoroughbreds against all native types there was a significant difference in pineal mass
(P=0.043), with mean TB pineal mass 0.166g +/- 0.039g and native pineal mass 0.113g +/- 0.047g. No significant
difference was seen between males or females with male pineal size 0.140g +/- 0.04g and female 0.138g +/- 0.061g (P
=0.923) across both breeds.
Conclusion These results suggest that Thoroughbred types may require a higher volume of melatonin to enter into periods
of anoestrus than Native types due to pineal mass and this is supported by evidence in ovine research where melatonin
output was found to be proportional to pineal gland mass (Coon et al., 1999, Gomez Brunet et al., 2002). Melatonin plays
an important role in the reproductive physiology and function of both males and females potentially explaining why there is
no significant difference in their pineal mass. A more extensive study is required using a larger sample size so that factors
such as age may be taken into consideration. Notwithstanding the small sample size used in this study this information adds
value to our understanding of pineal mass in the horse and could help to explain the impact of selective breeding for
homogeneity in the Thoroughbred breed and reduced seasonality in Thoroughbreds.
Acknowledgements
I would like to acknowledge the Royal Agricultural University for funding and LJ Potter Partners for supplying the
cadavers.
References
Aurich, C. 2011. Animal Reproduction Science 124, 220-228
Coon, S. Zarazaga, L. Malpaux, B. Ravault, J. Bodin, L. Voisin, P. Weller, J. Klein, D. Chemineau, P. 1999. American
Journal of Physiology, Endocrinology and Metabolism 277, E792-E797.
Gomez Brunet, A. Malpaux, B. Daveau, A. Taragnat, C. Chemineau, P. 2002. Journal of Endocrinology J172, 397-404
Hemmings, A. McBride, S. 2005. Behavioural Brain Research 159, 113-118
Reiter, R. Tan, DX. Fuentes-Broto, L. 2010. Progress in Brain Research 181, 127-151
Satue, K and Gardon, J. 2013. Steroids and Hormonal Science 2, 1-8
139
A preliminary comparison of semen quality between competing and non-competing stallions M Wilson, A Twigg-Flesner
Hartpury College, Gloucester, UK
Application Equine Artificial Insemination practices in the UK have increased from only 18 in 2006 to over 50 in 2015
(BEVA, 2015). Competition records of stallions often determine their breeding popularity, as stallions can be competed at
high levels in order to make them more desirable to potential clients. These stallions have to meet the double intensity
requirements of performance and breeding activities, a process which may require further optimisation.
Introduction Amann et al. (1987) suggested that moderate daily exercise is important for the wellbeing of stallions, but
may lead to reduced libido compared to stallions that are not in exercise. More recent research suggests that training of
stallions at moderate exercise intensity does not affect semen quality (Gordon et al., 2014). In contrast, Janett et al. (2006)
found strenuous repeated treadmill exercise dramatically decreases both quality and freezability of the semen. Rosenberg et
al. (2013) found that a rise in body temperature during exercise induces thermal stress to stallion testes, resulting in
reduction of the stallion’s reproductive capacity. The aim of the study was to preliminarily investigate whether stallions
with concurrent breeding and performance careers have lower semen quality compared to non-competing stallions.
Material and methods Retrospective data was collected for 625 collections over six breeding seasons (from a total of 76
stallions), with 394 collections from competing stallions and 230 collections from non-competing stallions. Data recorded
included ejaculate volume, progressive motility (PM) and concentration. An independent-samples t-test was conducted to
compare volume, PM and concentration in competing and non-competing stallions, using SPSS 23.0.
Results There was a significant difference in the volume between both groups, with competing stallions producing higher
volume ejaculates (p=0.003), at a mean 5.96±24.3ml more per ejaculate than non-competing stallions. There was a
significant difference in PM (p=0.006), with PM in competing stallions recorded at a mean 3.28% ± 10.4%;which was
lower than the non competing stallions. There was also a significant difference for the concentration (p= 0.009) between
both groups, with competing stallions showing a lower concentration by a mean 2.7x10⁶ compared to non-competing
stallions.
Conclusion The differences between the two groups descriptively do not seem to be large, but as all three areas showed
significant differences between groups, some concerns are raised. Whilst semen collection with a concurrent competition
career remains a viable option, care must be taken to manage both performance areas for stallions carefully, to ensure the
highest possible semen quality is collected and distributed. Where semen quality is strongly affected, stallions may not be
able to cope with concurrent careers, and semen collection should be planned out of the competition season, or the early
stages of the competition season, to limit the travel and competition stress that may have had an effect on semen quality.
Follow up research should consider the intensity or level of competition, discipline and age of the stallions to produce more
practical guidance for practitioners.
References
Amann, R.P.; Christanelli, M.J. and Squires, E.L. 1987. Journal of Reproduction and Fertility supplement 35, 113-120
Gordon, R.K., Mawyer, J.D., Cavinder, C.A., Sigler, D.H., Blanchard, T.L., Love, C.C., Brinsko, S.P., Arnold, C.E.,
Teague, S. and Vogelsang, M.M. 2014. Journal of Equine Veterinary Science 34(1), 65.
Janett, F., Burkhardt, C., Burger, D., Imboden, I., Hässig, M. and Thun, R. 2006. Theriogenology 65 (9), 1737–1749.
Rosenberg, JL, Cavinder CA, Love CC, Teague SR, Sigler H, Varner DD, Blanchard TL and Vogelsang MM 2013.
Professional Animal Scientist 29(5), 482-489

140
Thermographic imaging study into the comparative efficiency of cooling agents on the equine
limb post exercise F Howell, A Twigg-Flesner, E Davies
Hartpury College, Gloucester, UK
Application A large range of leg cooling products are widely available, for use at home and in competition, and have
replaced cold hosing widely where access to cold hosing is not possible, or time is limited, as cold hosing takes around 20
minutes (Wilson & Goodship, 1994). The actual cooling effect of these products remains to be ascertained; alongside
optimum application times and improved effects compared to traditional cold hosing.
Introduction When a horse is exercised, heat is naturally produced in the limbs due to increased circulation to the area and
the release of stored energy (Sander et al., 2013), which is beneficial during exercise to keep structures pliable. After
exercise, residual heat can damage tissues through secondary inflammatory processes, the use of external cooling may
reduce the risk of damage. The aim of the study was to investigate the cooling effect of three commercially available
products in comparison to traditional cold hosing, using thermal imaging technology.
Material and methods Five horse received each treatment in a randomised, cross over trial, acting as their own controls
(left leg cooled, right leg untreated). Three commercially available products; Barrier White Ice (BWI), Lincoln Cool Gel
(LCG) and Equine Products relax (EPR), were compared with cold hosing. All horses were subjected to a standard exercise
test (SET) in a fully enclosed indoor arena (ambient temperature recorded), and leg temperature was assessed by thermal
imaging before and immediately after exercise, once product was applied, 15 minutes into treatment, at the end of
treatment, and 1 hour after treatment cessation. Data was analysed using Factorial Repeated Measures ANOVA (SPSS
23.0).
Results There was a significant main effect of the type of product on the temperature of the limb,( F(4,16) = 4.89, p=
0.009), indicating that EPR had the same cooling effect as using cold hosing, whilst LCG and BWI were less efficient at
cooling the limb than cold hosing. The cooled leg was significantly cooler than the control leg for all treatments
(F(1,4)=13.59; p=0.021). The leg is at its coldest 1 hour after treatment, with a mean temperature of 0.5ºC lower than the
initial mean leg temperature, which is significantly lower than 15 mins into treatment, and at the end of treatment
(F(1.4)=22580, p=0.000 and F(1,4)= 31.67, p=0.005 respectively). On average, legs are 0.5ºC cooler after treatment
compared to the pre exercise temperature.
Table 1Temperatures recorded for all time points and all products
T- Treatment C- Control Cold Hosing
Barrier White Ice Lincoln Cool Gel Equine Products
Relax
T pre exercise 22.96±5.91 23.42±5.97 22.51±5.95 22.11±5.77
C pre exercise 22.74±5.98 23.20±5.99 22.29±5.85 21.95±5.72
T post exercise 22.91±5.91 23.39±5.67 22.48±5.94 22.07±5.77
C post exercise 22.96±5.98 23.16±5.97 22.27±5.84 21.92±5.72
T 15mis into cooling 22.82±5.94 23.37±5.95 22.47±5.93 22.01±5.77
C 15mins into cooling 22.62±5.97 23.13±5.94 22.24±5.93 21.88±5.67
T end of cooling 22.82±5.94 23.04±5.91 22.42±5.90 21.99±5.75
C end of cooling 22.55±5.96 23.06±5.98 22.18±5.77 21.84±5.64
T 1hr post cooling 22.81±5.96 23.22±5.98 22.36±5.89 21.94±5.73
c 1hr post cooling 22.55±5.96 23.04±5.90 22.17±8.45 21.84±5.63
Conclusion Cold hosing remains a viable option, with EPR having an equal cooling effect, and LCG and BWI showing
less effective in this trial. All products had a cooling effect overall, with initial heating observed in early treatment, which
warrants further investigation.
References
Sander, L., Hopegood, L., Ellis, A.D. 2013 The influence of boot design on exercise associated skin surface temperature
covering tendons in horses Applied equine nutrition and training: Equine Nutrition and Training Conference 173-179.
Wilson, A.M, and Goodship, A. E. 1994. Exercise-induced hyperthermia as a possible mechanism for tendon degeneration.
Journal of Biomechanics 27, 899-905
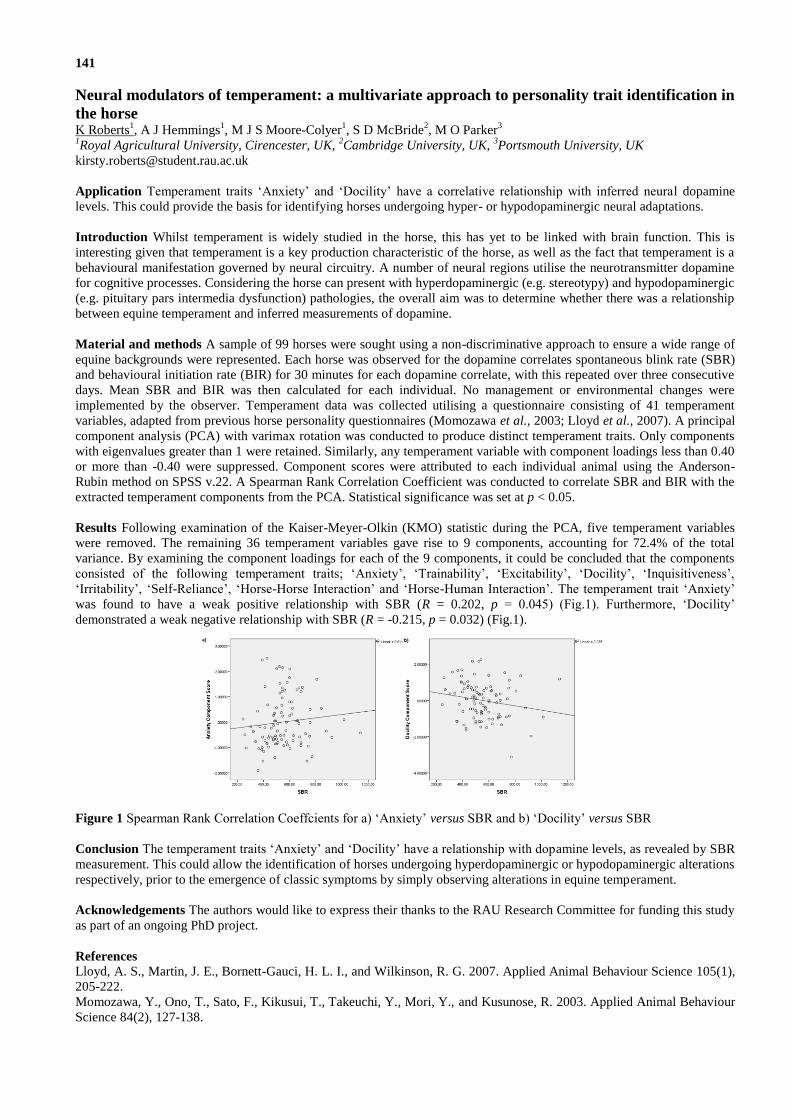
141
Neural modulators of temperament: a multivariate approach to personality trait identification in
the horse K Roberts
1, A J Hemmings
1, M J S Moore-Colyer
1, S D McBride
2, M O Parker
3
1Royal Agricultural University, Cirencester, UK,
2Cambridge University, UK,
3Portsmouth University, UK
Application Temperament traits ‘Anxiety’ and ‘Docility’ have a correlative relationship with inferred neural dopamine
levels. This could provide the basis for identifying horses undergoing hyper- or hypodopaminergic neural adaptations.
Introduction Whilst temperament is widely studied in the horse, this has yet to be linked with brain function. This is
interesting given that temperament is a key production characteristic of the horse, as well as the fact that temperament is a
behavioural manifestation governed by neural circuitry. A number of neural regions utilise the neurotransmitter dopamine
for cognitive processes. Considering the horse can present with hyperdopaminergic (e.g. stereotypy) and hypodopaminergic
(e.g. pituitary pars intermedia dysfunction) pathologies, the overall aim was to determine whether there was a relationship
between equine temperament and inferred measurements of dopamine.
Material and methods A sample of 99 horses were sought using a non-discriminative approach to ensure a wide range of
equine backgrounds were represented. Each horse was observed for the dopamine correlates spontaneous blink rate (SBR)
and behavioural initiation rate (BIR) for 30 minutes for each dopamine correlate, with this repeated over three consecutive
days. Mean SBR and BIR was then calculated for each individual. No management or environmental changes were
implemented by the observer. Temperament data was collected utilising a questionnaire consisting of 41 temperament
variables, adapted from previous horse personality questionnaires (Momozawa et al., 2003; Lloyd et al., 2007). A principal
component analysis (PCA) with varimax rotation was conducted to produce distinct temperament traits. Only components
with eigenvalues greater than 1 were retained. Similarly, any temperament variable with component loadings less than 0.40
or more than -0.40 were suppressed. Component scores were attributed to each individual animal using the Anderson-
Rubin method on SPSS v.22. A Spearman Rank Correlation Coefficient was conducted to correlate SBR and BIR with the
extracted temperament components from the PCA. Statistical significance was set at p < 0.05.
Results Following examination of the Kaiser-Meyer-Olkin (KMO) statistic during the PCA, five temperament variables
were removed. The remaining 36 temperament variables gave rise to 9 components, accounting for 72.4% of the total
variance. By examining the component loadings for each of the 9 components, it could be concluded that the components
consisted of the following temperament traits; ‘Anxiety’, ‘Trainability’, ‘Excitability’, ‘Docility’, ‘Inquisitiveness’,
‘Irritability’, ‘Self-Reliance’, ‘Horse-Horse Interaction’ and ‘Horse-Human Interaction’. The temperament trait ‘Anxiety’
was found to have a weak positive relationship with SBR (R = 0.202, p = 0.045) (Fig.1). Furthermore, ‘Docility’
demonstrated a weak negative relationship with SBR (R = -0.215, p = 0.032) (Fig.1).
Figure 1 Spearman Rank Correlation Coeffcients for a) ‘Anxiety’ versus SBR and b) ‘Docility’ versus SBR
Conclusion The temperament traits ‘Anxiety’ and ‘Docility’ have a relationship with dopamine levels, as revealed by SBR
measurement. This could allow the identification of horses undergoing hyperdopaminergic or hypodopaminergic alterations
respectively, prior to the emergence of classic symptoms by simply observing alterations in equine temperament.
Acknowledgements The authors would like to express their thanks to the RAU Research Committee for funding this study
as part of an ongoing PhD project.
References
Lloyd, A. S., Martin, J. E., Bornett-Gauci, H. L. I., and Wilkinson, R. G. 2007. Applied Animal Behaviour Science 105(1),
205-222.
Momozawa, Y., Ono, T., Sato, F., Kikusui, T., Takeuchi, Y., Mori, Y., and Kusunose, R. 2003. Applied Animal Behaviour
Science 84(2), 127-138.

142
Effect of selenium and vitamin E supplements on blood lactate and serum lactate dehydrogenase
activity in horses undergoing moderate exercise E Velazquez-Canton, A H Ramirez-Perez, N de La Cruz Rodriguez, L Ramirez Olivares, L A Zarco Quintero,
J C Angeles Hernandez
FMVZ-UNAM, Mexico
Application Working horses at high altitudes are exposed to an important oxidative stress and free radical formation,
which could damage their skeletal muscle. Oral antioxidants could reduce these effects, using the appropriate doses.
Introduction Exercise in horses is directly associated with O2 uptake by tissues, mainly by skeletal muscle. Mitochondria
use O2 to produce ATP. However, this generates oxidation and free radical formation (Piccione et al., 2012), which could
alter the sarcolemma permeability. This fact could increase serum lactate dehydrogenase (LDH) activity and lactatemia
(LAC). The secondary antioxidant system prevents cellular membrane damage caused by free radicals. The objective of
this study was to evaluate the effect of selenium (Se, selenium methionine) and vitamin E (E, α-tocopheryl acetate)
supplementation on lactatemia and LDH serum activity in horses under moderate exercise.
Materials and methods Institutional Animal Care and Use Committee of the Faculty of Veterinary Medicine of the
National Autonomous University of Mexico approved the experimental protocol. The study lasted 77 days and was carried
out in the Mounted Police Unit of Mexico City (2,240 m above mean sea level) in winter 2014. The trial involved 24
clinically healthy horses, without physical labour the month prior to this study. The horses were 5 to 15 years old (450 kg
BW), and were randomly allocated in 4 experimental treatments with 6 animals each one. They were assigned in a factorial
design [2 Se levels × 2 E levels, high (H) and low (L)] with repeated measures. The supplementation levels followed NRC
recommendations (2007). Therefore, the experimental treatments were: LSeLE, HSeLE, LSeHE and HSeHE (LSe, 0.1;
HSe, 0.3 mg Se/kg of DM and LE, 1.6; HE, 2 IU vitamin E/kg of BW). Selenium was undetectable (<2 μg/kg DM), while
vitamin E reached 14.4 IU/kg DM in the daily ration used. Thus, Se and E were fully provided using oral supplements. Day
zero (d0) corresponded to the baseline measurement of LAC and LDH. The trial was formed by an adaptation period (d0 to
d32); from d33 to d56 the exercise period consisted of 3 consecutive days and 4 without exercise sequences per horse.
Moderate exercise included 5:20:5 min (warm up:gallop:cool down). Horses were readapted from d57 to d77. At d64,
supplementation was ended. Once a week, jugular blood samples were taken. During the exercise period, samples were
taken at the end of the 3 rd
day, 10 min after physical activity. LAC was immediately quantified (Reflectance photometry,
Roche) in blood, whilst LDH activity was quantified in serum by spectrophotometry (Randox Daytona™). Data were
analysed using the SAS PROC MIXED (SAS Inst. Inc., Car. NC.) for the design described above. The fixed effects were
Se, E, d and their interactions, while horse nested within treatment was the random effect. Tukey-Kramer’s test was used to
compare LSM. Statistical significant levels were set at P<0.05, while a trend was defined at P<0.10. Regression analysis
between LDH and LAC were applied to each experimental day.
Results LAC and LDH in horses that received 0.3 mg Se/kg DM and 2.0 IU vitamin E/kg of BW supplementation, were
not different from those who received 0.1 mg Se/kg DM and 1.6 IU vitamin E/kg of BW; therefore, all treatments were
pooled together. Experimental day affected both LAC and LDH (P<0.05; Table 1). Noticeable differences for LAC
(P<0.05) were established between d0 and d35 to d56. LDH increased at d21, which was not different (P>0.05) from that of
d77. The lowest value was observed at d63. Day effect was explained by experimental periods (adaptation, physical activity
and no supplementation). A trend (P<0.06) for vitamin E effect was observed on LDH activity. LAC at d56 was 2.4 times
higher than LAC at d0 in all treatments. At d42 a positive relationship (P<0.05) between LDH and LAC was found for
horses who received 1.6 IU vitamin E/kg BW [LAC (mMol/L) =0.003×LDH (U/L); n=12, R2(adj)=0.9]. At d63 (rest
period), the lowest values of LDH were observed (P<0.05), while LAC returned to basal values. Both LAC and LDH
increased at d70 and d77.
Table 1 Lactate blood (mMol/L) and LDH serum activity (U/L) in horses with moderate exercise
Days of adaptation period Days of moderate exercise No supplementation
0 7 14 21 28 35 42 49 56 63 70 77
LAC1 0.846
* 0.975 1.012 1.250 1.058 1.571
* 1.800
* 1.645
* 2.067
* 1.096 1.354 1.600
*
LDH1 469.6 469.5 504.5 606.8
* 514.5 506.5 524.3 490.0 454.2 391.8
* 473.7 563.3
*
1SEM, LAC, 0.12; LDH, 24.8. Significant differences are marked with * (P < 0.05)
Conclusion Moderate physical activity affected both LAC and LDH values. The trend for a vitamin E effect on LDH
activity and the relationship observed at d42 between LDH and LAC in horses from LE group requires further research.
References
Piccione, G., Gianetto, C., Marafioti, S., Faggio, C., Alberghina, D. And Fazio, F. 2012. Journal of Animal Physiology and
Animal Nutrition 96, 978-984.
143
Equicoll: a product for selecting robust stallion sperm for artificial insemination or freezing J Morrell
1, H Rodriguez-Martinez
2
1Swedish University of Agricultural Sciences, Uppsala, Sweden,
2University if Linköping, Sweden
Product description Equicoll is a species-specific colloid for selecting robust stallion sperm for artificial insemination or
freezing, thus helping to improve pregnancy rates in inseminated mares.
Industry need Artificial insemination (AI) with cooled semen is being used more and more frequently in equine breeding
in Europe. The per cycle pregnancy rate after inseminations with approximately 1x10⁹ spermatozoa (cooled semen) is
around 65% and is dependent on the sperm quality of the ejaculate. Thus approximately one third of mares inseminated
with cooled semen do not become pregnant, due to a variety of reasons, including sperm quality, handling factors, or mare
factors. Improving sperm quality could thus be an effective method of increasing pregnancy rates.
The solution A method for improving the sperm quality of semen doses for AI has been developed in which the most
robust spermatozoa are selected by centrifugation through a colloid, Equicoll (previously known as Androcoll-E). This
technique enables the most motile spermatozoa, and those with normal morphology, intact plasma membranes and good
chromatin integrity to be separated from the rest of the ejaculate. These spermatozoa retain their motility, viability and
chromatin integrity for longer than unselected spermatozoa, and show normal fertilizing capability at 5 days post-
collection. This method has been shown not only to improve pregnancy rates for problem ejaculates but also to improve
pregnancy rates from “normal” stallions in a multicentre study. Finally, the selected spermatozoa may freeze better than
unselected samples. The technique can be performed easily at any stud where there is a bench centrifuge and is easy to
learn.
Supporting evidence or validation The product has been tested extensively by the inventors in controlled trials and also
by other research groups and stud personnel. The method is easy to use and can be done on any stud where there is a bench
centrifuge. There is an extensive list of more than 80 scientific articles documenting the beneficial effects of colloid
centrifugation on sperm quality.
Commercial applications and availability Androcoll-E is currently only available from the inventors (contact
[email protected] for details) but this situation will change soon. Another version, Androcoll-Equine, was temporarily
available from Minitüb International.
Future development There is scope to develop similar products for other species
Opportunities for collaboration/networking We seek collaboration with manufacturers of equine products who are
interested in marketing and distributing the product.
Acknowledgements We thank BSAS for permission to present our product here.
References
Morrell et al. 2010. Single Layer Centrifugation of stallion spermatozoa consistently selects the most robust spermatozoa
from the rest of the ejaculate in a large sample size: data from 3 breeding seasons. Equine Veterinary Journal 42, 579-585.
Morrell et al. 2011. Spermatozoa from stallion ejaculates processed by Single Layer Centrifugation with Androcoll™-E
are capable of fertilization after artificial insemination. Reprod Dom Anim. 46, 642-645.
Hoogewijs et al. 2011. Sperm selection using single layer centrifugation prior to cryopreservation can increase post thaw
sperm quality in stallions. Equine Vet Journal 43 (Suppl 40), 35-41
Lindahl J, Dalin A-M, Stuhtmann G, Morrell J. M. 2012. Stallion spermatozoa selected by Single Layer Centrifugation
are capable of fertilization after storage for up to 96h at 6˚C prior to artificial insemination. Acta Veterinaria Scandinavica
54, 40-45.
Morrell et al. 2014. Pregnancy rates are higher after artificial insemination with cooled stallion spermatozoa selected by
Single Layer Centrifugation than with control semen doses. Theriogenology 82, 1102-1105.
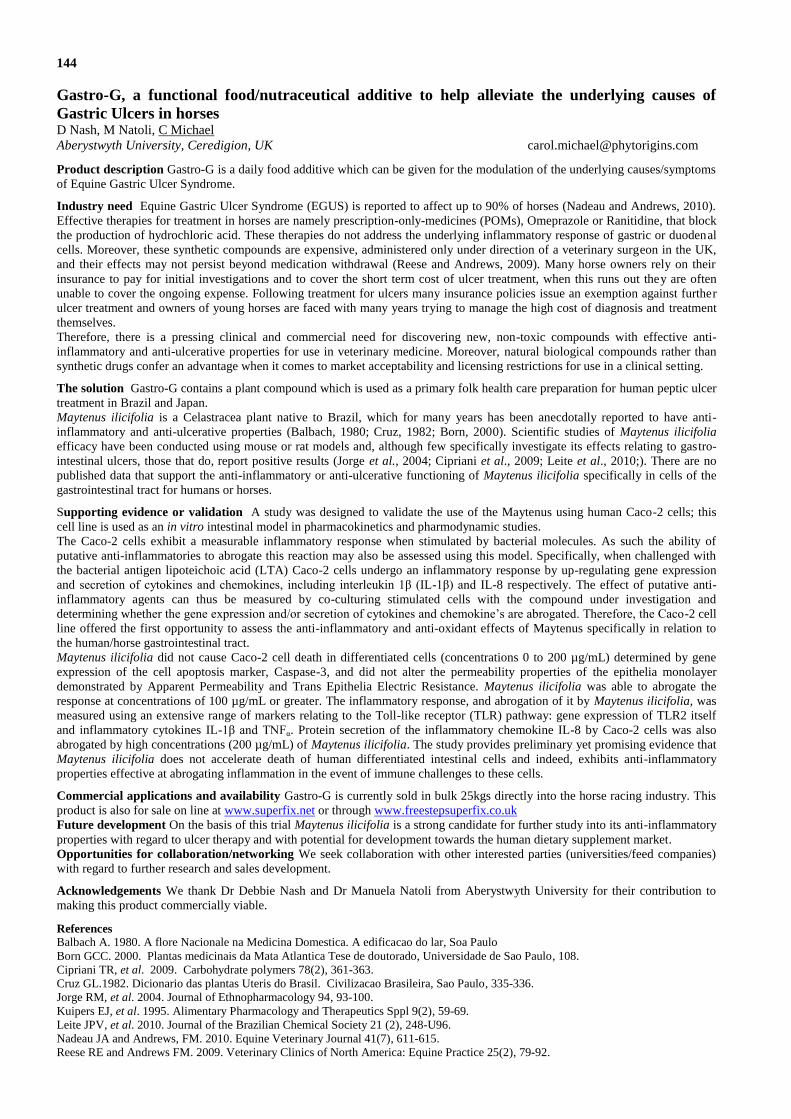
144
Gastro-G, a functional food/nutraceutical additive to help alleviate the underlying causes of
Gastric Ulcers in horses D Nash, M Natoli, C Michael
Aberystwyth University, Ceredigion, UK [email protected]
Product description Gastro-G is a daily food additive which can be given for the modulation of the underlying causes/symptoms
of Equine Gastric Ulcer Syndrome.
Industry need Equine Gastric Ulcer Syndrome (EGUS) is reported to affect up to 90% of horses (Nadeau and Andrews, 2010).
Effective therapies for treatment in horses are namely prescription-only-medicines (POMs), Omeprazole or Ranitidine, that block
the production of hydrochloric acid. These therapies do not address the underlying inflammatory response of gastric or duodenal
cells. Moreover, these synthetic compounds are expensive, administered only under direction of a veterinary surgeon in the UK,
and their effects may not persist beyond medication withdrawal (Reese and Andrews, 2009). Many horse owners rely on their
insurance to pay for initial investigations and to cover the short term cost of ulcer treatment, when this runs out they are often
unable to cover the ongoing expense. Following treatment for ulcers many insurance policies issue an exemption against further
ulcer treatment and owners of young horses are faced with many years trying to manage the high cost of diagnosis and treatment
themselves.
Therefore, there is a pressing clinical and commercial need for discovering new, non-toxic compounds with effective anti-
inflammatory and anti-ulcerative properties for use in veterinary medicine. Moreover, natural biological compounds rather than
synthetic drugs confer an advantage when it comes to market acceptability and licensing restrictions for use in a clinical setting.
The solution Gastro-G contains a plant compound which is used as a primary folk health care preparation for human peptic ulcer
treatment in Brazil and Japan.
Maytenus ilicifolia is a Celastracea plant native to Brazil, which for many years has been anecdotally reported to have anti-
inflammatory and anti-ulcerative properties (Balbach, 1980; Cruz, 1982; Born, 2000). Scientific studies of Maytenus ilicifolia
efficacy have been conducted using mouse or rat models and, although few specifically investigate its effects relating to gastro-
intestinal ulcers, those that do, report positive results (Jorge et al., 2004; Cipriani et al., 2009; Leite et al., 2010;). There are no
published data that support the anti-inflammatory or anti-ulcerative functioning of Maytenus ilicifolia specifically in cells of the
gastrointestinal tract for humans or horses.
Supporting evidence or validation A study was designed to validate the use of the Maytenus using human Caco-2 cells; this
cell line is used as an in vitro intestinal model in pharmacokinetics and pharmodynamic studies.
The Caco-2 cells exhibit a measurable inflammatory response when stimulated by bacterial molecules. As such the ability of
putative anti-inflammatories to abrogate this reaction may also be assessed using this model. Specifically, when challenged with
the bacterial antigen lipoteichoic acid (LTA) Caco-2 cells undergo an inflammatory response by up-regulating gene expression
and secretion of cytokines and chemokines, including interleukin 1β (IL-1β) and IL-8 respectively. The effect of putative anti-
inflammatory agents can thus be measured by co-culturing stimulated cells with the compound under investigation and
determining whether the gene expression and/or secretion of cytokines and chemokine’s are abrogated. Therefore, the Caco-2 cell
line offered the first opportunity to assess the anti-inflammatory and anti-oxidant effects of Maytenus specifically in relation to
the human/horse gastrointestinal tract.
Maytenus ilicifolia did not cause Caco-2 cell death in differentiated cells (concentrations 0 to 200 µg/mL) determined by gene
expression of the cell apoptosis marker, Caspase-3, and did not alter the permeability properties of the epithelia monolayer
demonstrated by Apparent Permeability and Trans Epithelia Electric Resistance. Maytenus ilicifolia was able to abrogate the
response at concentrations of 100 µg/mL or greater. The inflammatory response, and abrogation of it by Maytenus ilicifolia, was
measured using an extensive range of markers relating to the Toll-like receptor (TLR) pathway: gene expression of TLR2 itself
and inflammatory cytokines IL-1β and TNFα. Protein secretion of the inflammatory chemokine IL-8 by Caco-2 cells was also
abrogated by high concentrations (200 µg/mL) of Maytenus ilicifolia. The study provides preliminary yet promising evidence that
Maytenus ilicifolia does not accelerate death of human differentiated intestinal cells and indeed, exhibits anti-inflammatory
properties effective at abrogating inflammation in the event of immune challenges to these cells.
Commercial applications and availability Gastro-G is currently sold in bulk 25kgs directly into the horse racing industry. This
product is also for sale on line at www.superfix.net or through www.freestepsuperfix.co.uk
Future development On the basis of this trial Maytenus ilicifolia is a strong candidate for further study into its anti-inflammatory
properties with regard to ulcer therapy and with potential for development towards the human dietary supplement market.
Opportunities for collaboration/networking We seek collaboration with other interested parties (universities/feed companies)
with regard to further research and sales development.
Acknowledgements We thank Dr Debbie Nash and Dr Manuela Natoli from Aberystwyth University for their contribution to
making this product commercially viable.
References
Balbach A. 1980. A flore Nacionale na Medicina Domestica. A edificacao do lar, Soa Paulo
Born GCC. 2000. Plantas medicinais da Mata Atlantica Tese de doutorado, Universidade de Sao Paulo, 108.
Cipriani TR, et al. 2009. Carbohydrate polymers 78(2), 361-363.
Cruz GL.1982. Dicionario das plantas Uteris do Brasil. Civilizacao Brasileira, Sao Paulo, 335-336.
Jorge RM, et al. 2004. Journal of Ethnopharmacology 94, 93-100.
Kuipers EJ, et al. 1995. Alimentary Pharmacology and Therapeutics Sppl 9(2), 59-69.
Leite JPV, et al. 2010. Journal of the Brazilian Chemical Society 21 (2), 248-U96.
Nadeau JA and Andrews, FM. 2010. Equine Veterinary Journal 41(7), 611-615.
Reese RE and Andrews FM. 2009. Veterinary Clinics of North America: Equine Practice 25(2), 79-92.

Figure 2 Competitive placing
associated with jumps performed in
cross country warm-up (* sign. less
likely to place)
Figure 1 Competitive placing associated
with warm up time in trot in cross
country (* sign. less likely to place)
145
Association of warm up and competitive placing at BE100 and Novice level eventing K Patrick, H J Janicke
University of Nottingham, UK
Application Identification of common warm up routines and their effect on competitive placing in British Eventing may
inform riders of ideal techniques to ensure maximum performance.
Introduction Warm up has been shown to be an important element of success in human athletes (Kapnik et al., 1992), yet
there has been little research into the types and effect of warm up routines in any equestrian sport. Eventing is an extremely
popular, but little researched equestrian discipline in the UK, in which hundreds of horse and rider combinations compete
every year (Singer et al., 2008). There have been a few studies that look at injury in event horses in training and
competition at national and international level (Dyson, 2002). Yet, despite the majority of competitors competing at one
day events, there is little research concentrating on these lower levels. This study aims to characterise warm up routines of
competitors at lower levels of British Eventing (BE100 and Novice) and identify any effect they may have on competitive
placing. In particular, rider status (professional or amateur) and rider and horse placing were compared to different warm
up routines.
Material and methods Data were acquired anonymously by online survey using SurveyMonkey (SurveyMonkey Inc.,
www.surveymonkey.com) after permission was granted by British Eventing. Completion of the survey included permission
to use data. Riders were recruited at competitions and online using social media (©Twitter, ©Facebook, ©Instagram) over
the space of seven weeks. A total of 208 surveys were completed. Only complete surveys were used in the statistical
analysis (n=203). The data were transferred into Microsoft Excel (www.microsoft.com), coded and Chi –Square analyses
performed. Significance was set at P < 0,05.
Results Professional riders (defined as someone who makes a living from producing/competing/training horses) were
shown to use pre-tack warm-up techniques such as massage pads or magnetic rugs significantly more commonly than
amateur riders (X2=3.92; P=0.048). In addition, competitive placing was shown to be associated with the following events:
cross country warm-up time in trot (P=0.0021), number of jumps performed before cross country (P=0.0026), show
jumping warm-up time in trot (P=0.0079) and overall dressage warm-up time (P=0.038).
Conclusion This study identified that too
short (<30min) or too long (>49min) a
warm-up before the dressage was
significantly associated with a lower overall
placing. Similarly, trotting less than 5
minutes or more than 10 minutes during the
warm-up for show jumping and cross
country was associated with a lower overall
placing. In addition, during the cross
country warm-up, performing 1-10 jumps
was most advantageous for competitive
placing. These results show that elements of
warm-up routines do influence outcome for
competitors. More research into this area
could identify ideal warm-up routines to
maximise performance during eventing.
Acknowledgements The authors gratefully
acknowledge the support of British
Eventing and their members.
References
Dyson, S. 2002. Journal of Equine Veterinary Science 22(4), 145-150
Knapik, J., Jones, B.H., Bauman, C.L., Harris, J.McA 1992. Sports Medicine 14(5), 277-288.
Singer, E.R., Barnes, J., Saxby, F., Murray, J.K., 2008. The Veterinary Journal 175(1), 76-81
Figure 3 Competitive placing associated
with warm up time in trot in show
jumping (* sign. less likely to place)
Figure 4 Competitive placing
associated with total warm-up time in
dressage (* sign. less likely to place)
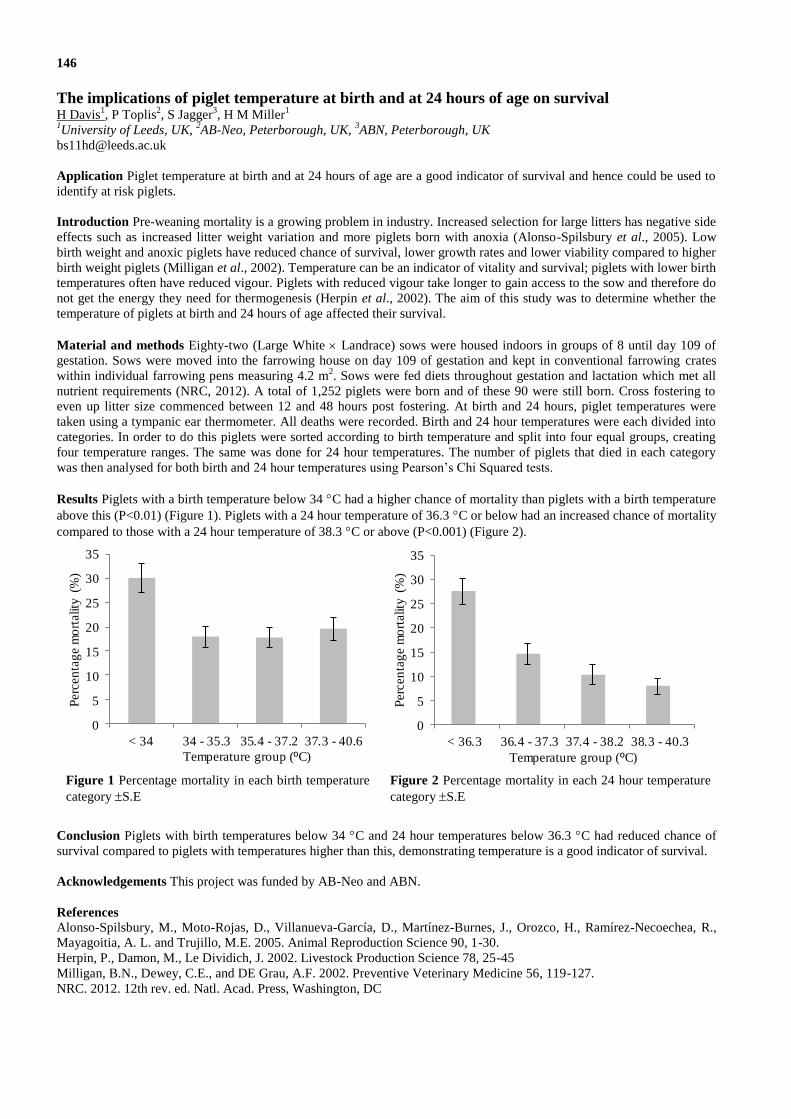
146
The implications of piglet temperature at birth and at 24 hours of age on survival H Davis
1, P Toplis
2, S Jagger
3, H M Miller
1
1University of Leeds, UK,
2AB-Neo, Peterborough, UK,
3ABN, Peterborough, UK
Application Piglet temperature at birth and at 24 hours of age are a good indicator of survival and hence could be used to
identify at risk piglets.
Introduction Pre-weaning mortality is a growing problem in industry. Increased selection for large litters has negative side
effects such as increased litter weight variation and more piglets born with anoxia (Alonso-Spilsbury et al., 2005). Low
birth weight and anoxic piglets have reduced chance of survival, lower growth rates and lower viability compared to higher
birth weight piglets (Milligan et al., 2002). Temperature can be an indicator of vitality and survival; piglets with lower birth
temperatures often have reduced vigour. Piglets with reduced vigour take longer to gain access to the sow and therefore do
not get the energy they need for thermogenesis (Herpin et al., 2002). The aim of this study was to determine whether the
temperature of piglets at birth and 24 hours of age affected their survival.
Material and methods Eighty-two (Large White Landrace) sows were housed indoors in groups of 8 until day 109 of
gestation. Sows were moved into the farrowing house on day 109 of gestation and kept in conventional farrowing crates
within individual farrowing pens measuring 4.2 m2. Sows were fed diets throughout gestation and lactation which met all
nutrient requirements (NRC, 2012). A total of 1,252 piglets were born and of these 90 were still born. Cross fostering to
even up litter size commenced between 12 and 48 hours post fostering. At birth and 24 hours, piglet temperatures were
taken using a tympanic ear thermometer. All deaths were recorded. Birth and 24 hour temperatures were each divided into
categories. In order to do this piglets were sorted according to birth temperature and split into four equal groups, creating
four temperature ranges. The same was done for 24 hour temperatures. The number of piglets that died in each category
was then analysed for both birth and 24 hour temperatures using Pearson’s Chi Squared tests.
Results Piglets with a birth temperature below 34 C had a higher chance of mortality than piglets with a birth temperature
above this (P<0.01) (Figure 1). Piglets with a 24 hour temperature of 36.3 C or below had an increased chance of mortality
compared to those with a 24 hour temperature of 38.3 C or above (P<0.001) (Figure 2).
Conclusion Piglets with birth temperatures below 34 C and 24 hour temperatures below 36.3 C had reduced chance of
survival compared to piglets with temperatures higher than this, demonstrating temperature is a good indicator of survival.
Acknowledgements This project was funded by AB-Neo and ABN.
References
Alonso-Spilsbury, M., Moto-Rojas, D., Villanueva-García, D., Martínez-Burnes, J., Orozco, H., Ramírez-Necoechea, R.,
Mayagoitia, A. L. and Trujillo, M.E. 2005. Animal Reproduction Science 90, 1-30.
Herpin, P., Damon, M., Le Dividich, J. 2002. Livestock Production Science 78, 25-45
Milligan, B.N., Dewey, C.E., and DE Grau, A.F. 2002. Preventive Veterinary Medicine 56, 119-127.
NRC. 2012. 12th rev. ed. Natl. Acad. Press, Washington, DC
0
5
10
15
20
25
30
35
< 34 34 - 35.3 35.4 - 37.2 37.3 - 40.6
Perc
en
tag
e m
ort
ality
(%
)
Temperature group (ºC)
0
5
10
15
20
25
30
35
< 36.3 36.4 - 37.3 37.4 - 38.2 38.3 - 40.3
Perc
en
tag
e m
ort
ality
(%
)
Temperature group (ºC)
Figure 1 Percentage mortality in each birth temperature
category S.E
Figure 2 Percentage mortality in each 24 hour temperature
category S.E

147
Efficacy of a novel efficient phytate degrading bacterial 6-phytase in gestating and lactating sows P Ader
1, D Torrallardona
2
1BASF SE, Lampertheim, Germany,
2IRTA, Constanti / Tarragona, Spain
Application Excretion of phosphorous (P) by pigs has some negative impact on the environment in areas with a high
density of pig production. The use of highly efficient phytases in animal nutrition is a promising tool to restrict that impact.
Introduction Phytate is regarded as the primary storage form of P in plants and accounts for 60–80% of P found in plant-
derived feedstuffs (Crosgrove, 1966; Ravindran et al., 1995). Since there are no significant amounts of intrinsic phytate
degrading enzymes in monogastric animals it can be assumed that most of the phytate bound P is not absorbed, but
excreted. Due to this, diets for pigs and poultry have been traditionally supplemented with inorganic P sources
(Rodehutscord, 2001). On average 500 FTU/kg of phytase added to feed was assumed to generate 0.8g digestible P (dP)
(Poulsen et al., 2007). However, due to the increasing livestock density in many regions, manure has been applied to the
soil at rates exceeding plant needs, resulting to accumulation of phosphate in the soil (CAST, 2002). Long lasting that bears
the risk of eutrophication of surface waters and leaching of phosphate into ground water (Furrer and Stauffer, 1987). The
objective of the study was to investigate the potential of a novel bacterial 6-phytase (6-Phy) that is different from
established phytases by being a composite of various bacterial sources, in order to evaluate the potential of a possible
reduction of inorganic P sources in the diet. The effects of this phytase on Ca, P, ash and DM digestibility in gestating and
lactating sows was measured in addition to some performance parameters in sows and piglets.
Material and methods A total of 27 sows [Duroc X Landrace] with confirmed gestation (week 7) from three consecutive
batches were distributed into groups (blocks) of three sows as similar as possible according to parity number and body
weight. Sows in each block were randomly assigned to three experimental treatments that consisted of a negative control
basal diet (NC), NC + 100 FTU (phytase unit) 6-Phy/kg of feed (6-Phy-100) and NC + 250 FTU 6-Phy/kg of feed (6-Phy-
250). Basal diet was a common corn/SBM-based but digestible P (dP) was formulated to be marginal at amounts of 0.13
and 0.11 g/kg of feed in the gestation and lactation phase, respectively. Feed was restricted (3.6 kg/d) during gestation and
offered ad libitum during lactation. Water was available ad libitum during the complete trial. Sows were weighed at day 2
and 26 post partum, piglets were weighed directly after farrowing and at weaning (day 26). Fresh faeces from sows for
determination of the digestibility parameters was taken from day 85 to 88 of gestation and from day 18-22 of lactation. For
that purpose, feed was supplemented with the indigestible marker TiO2 (5kg/MT). The bacterial 6-Phy prototype was
produced and supplied by BASF SE, Ludwigshafen, Germany. The P-Phy gene is assembled from sequences of various
phytase producing bacteria of the species Hafnia ssp., Yersinia ssp. and Buttauxiella ssp. Production was done by
fermentation in Aspergillus niger. Phytase units (FTU) in feed were analysed according to Engelen et al. (1994).
Results No statistically significant differences were found for sow´s final body weight and body weight changes among the
treatments. Similarly, no significant improvements in litter size and weight of new born piglets were observed. However, a
better performance relating to litter size (p=0.08) and litter weight (p≤0.05) was suggested at farrowing in phytase
supplemented groups compared to NC. Apparent total tract digestibility (ATTD) of Ca was numerically improved by
phytase addition in both periods. In both periods ATTD of P was significantly improved in 6-Phy-100 compared to NC
(p≤0.05) and was further significantly improved in 6-Phy-250 (p≤0.05) (15.3 vs 25.2 vs 32.7% in gestation, 17.5 vs 23.6 vs
36.3% in lactation, respectively). For 6-Phy-250 increases of 0.70 and 0.83g dP/kg of feed compared to NC were
calculated. ATTD of ash was significantly improved by the phytase treatment (p≤0.05).
Conclusion It is concluded that the novel bacterial 6-Phy improves P digestibility in gestating and lactating sows at rather
low dose rates. The indicated positive impact on litter size and performance as well as the impact at higher dose rates needs
further work in consecutive studies for confirmation.
References
Cosgrove, D.J. 1966. Review of Pure and Applied Chemistry 16, 209–215.
CAST (Council for Agricultural Science and Technology) 2002. Issue Paper 21, 1–16.
Engelen, A. J., van der Heeft, F.C, Randsdorp, P.H.G. and Smit, E.L.C. 1994. Journal of AOAC International 77, 760-764.
Furrer O.J. and Stauffer W. 1987. FAC Oktobertagung 1987, 83-90.
Poulsen, H.D.,Blaabjerg, K., and Feuerstein, D. 2007. Livestock Science 109, 255-257.
Ravindran, V., Bryden, W.L., Kornegay, .E.T. 1995. Poultry and Avian Biology Review 6, 125–143.
Rodehutscord, M. 2001. Lohmann-Information 25, 1–8.
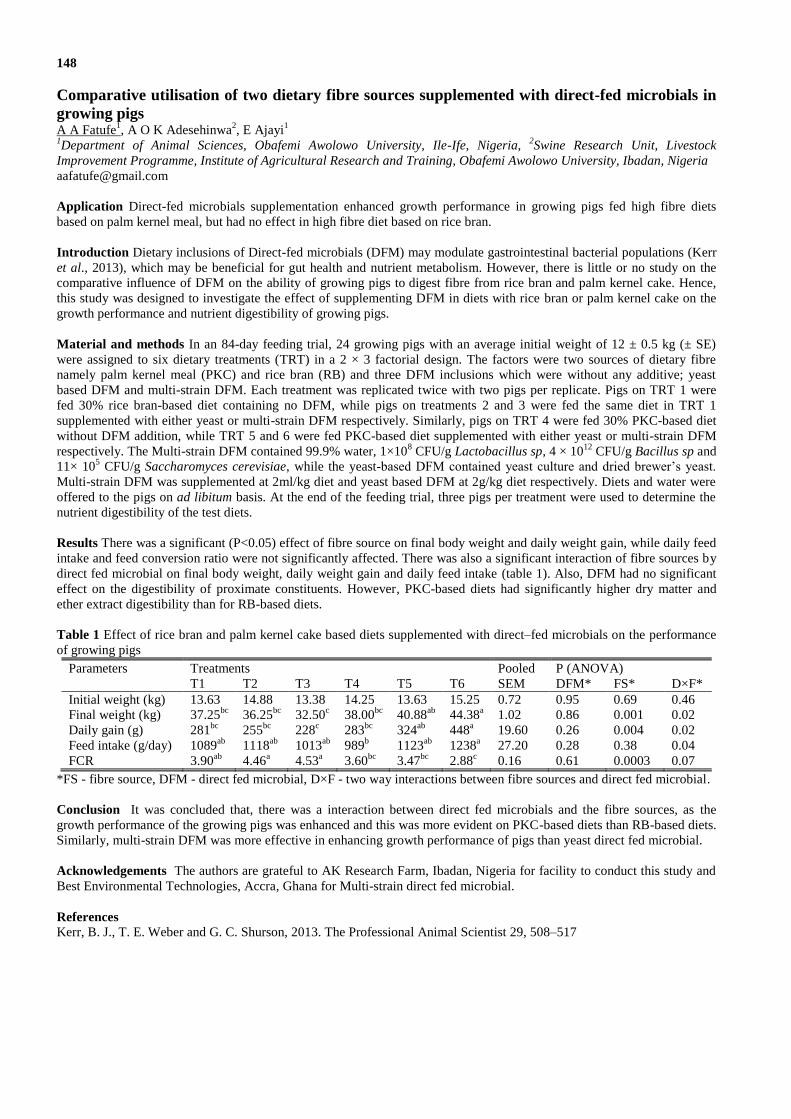
148
Comparative utilisation of two dietary fibre sources supplemented with direct-fed microbials in
growing pigs A A Fatufe
1, A O K Adesehinwa
2, E Ajayi
1
1Department of Animal Sciences, Obafemi Awolowo University, Ile-Ife, Nigeria,
2Swine Research Unit, Livestock
Improvement Programme, Institute of Agricultural Research and Training, Obafemi Awolowo University, Ibadan, Nigeria
Application Direct-fed microbials supplementation enhanced growth performance in growing pigs fed high fibre diets
based on palm kernel meal, but had no effect in high fibre diet based on rice bran.
Introduction Dietary inclusions of Direct-fed microbials (DFM) may modulate gastrointestinal bacterial populations (Kerr
et al., 2013), which may be beneficial for gut health and nutrient metabolism. However, there is little or no study on the
comparative influence of DFM on the ability of growing pigs to digest fibre from rice bran and palm kernel cake. Hence,
this study was designed to investigate the effect of supplementing DFM in diets with rice bran or palm kernel cake on the
growth performance and nutrient digestibility of growing pigs.
Material and methods In an 84-day feeding trial, 24 growing pigs with an average initial weight of 12 ± 0.5 kg (± SE)
were assigned to six dietary treatments (TRT) in a 2 × 3 factorial design. The factors were two sources of dietary fibre
namely palm kernel meal (PKC) and rice bran (RB) and three DFM inclusions which were without any additive; yeast
based DFM and multi-strain DFM. Each treatment was replicated twice with two pigs per replicate. Pigs on TRT 1 were
fed 30% rice bran-based diet containing no DFM, while pigs on treatments 2 and 3 were fed the same diet in TRT 1
supplemented with either yeast or multi-strain DFM respectively. Similarly, pigs on TRT 4 were fed 30% PKC-based diet
without DFM addition, while TRT 5 and 6 were fed PKC-based diet supplemented with either yeast or multi-strain DFM
respectively. The Multi-strain DFM contained 99.9% water, 1×10⁸ CFU/g Lactobacillus sp, 4 × 10
12 CFU/g Bacillus sp and
11× 105 CFU/g Saccharomyces cerevisiae, while the yeast-based DFM contained yeast culture and dried brewer’s yeast.
Multi-strain DFM was supplemented at 2ml/kg diet and yeast based DFM at 2g/kg diet respectively. Diets and water were
offered to the pigs on ad libitum basis. At the end of the feeding trial, three pigs per treatment were used to determine the
nutrient digestibility of the test diets.
Results There was a significant (P<0.05) effect of fibre source on final body weight and daily weight gain, while daily feed
intake and feed conversion ratio were not significantly affected. There was also a significant interaction of fibre sources by
direct fed microbial on final body weight, daily weight gain and daily feed intake (table 1). Also, DFM had no significant
effect on the digestibility of proximate constituents. However, PKC-based diets had significantly higher dry matter and
ether extract digestibility than for RB-based diets.
Table 1 Effect of rice bran and palm kernel cake based diets supplemented with direct–fed microbials on the performance
of growing pigs
Parameters Treatments Pooled P (ANOVA)
T1 T2 T3 T4 T5 T6 SEM DFM* FS* D×F*
Initial weight (kg) 13.63 14.88 13.38 14.25 13.63 15.25 0.72 0.95 0.69 0.46
Final weight (kg) 37.25bc
36.25bc
32.50c 38.00
bc 40.88
ab 44.38
a 1.02 0.86 0.001 0.02
Daily gain (g) 281bc
255bc
228c 283
bc 324
ab 448
a 19.60 0.26 0.004 0.02
Feed intake (g/day) 1089ab
1118ab
1013ab
989b 1123
ab 1238
a 27.20 0.28 0.38 0.04
FCR 3.90ab
4.46a 4.53
a 3.60
bc 3.47
bc 2.88
c 0.16 0.61 0.0003 0.07
*FS - fibre source, DFM - direct fed microbial, D×F - two way interactions between fibre sources and direct fed microbial.
Conclusion It was concluded that, there was a interaction between direct fed microbials and the fibre sources, as the
growth performance of the growing pigs was enhanced and this was more evident on PKC-based diets than RB-based diets.
Similarly, multi-strain DFM was more effective in enhancing growth performance of pigs than yeast direct fed microbial.
Acknowledgements The authors are grateful to AK Research Farm, Ibadan, Nigeria for facility to conduct this study and
Best Environmental Technologies, Accra, Ghana for Multi-strain direct fed microbial.
References
Kerr, B. J., T. E. Weber and G. C. Shurson, 2013. The Professional Animal Scientist 29, 508–517

149
QTL mapping for Cell Mediated Immunity in chicken V Raeesi, A Ehsani, R Vaez Torshizi, R Didehban, A A Masoudi
Tarbiat Modares University, Tehran, Iran
Application Improvement of immunity system responses to disease and pathogens in domestic animals is achievable by
gene identification and selective breeding in favour of immunity related traits. Selection of animals based on their genomic
impact in immunity related traits results in producing animals with strong capacity to disease resistance.
Introduction Availability of genetic map for farm animals has enabled animal breeding community to seek for associations
between genomic variables and phenotypes of complex traits and diseases, commonly called genome wide association
studies (GWAS). Application of genomic variables for low heritable or hard to measure traits such as immunity related
traits is an extra advantage of genomic selection. CMI refers to various immune cells, including neutrophils and cytotoxic T
cells but humoral immunity mainly refers to antibodies (Harnett, Katz et al. 2005).
Material and methods a GWAS is performed to identify genomic regions associated with cell-mediated immunity in
chicken using chicken 60k high density single nucleotide polymorphism (SNP) array. Phenotypes of 198 animals for cell
mediated immunity (CMI) was available in a F2 population. In order to account for multiple testing a chromosomal false
discovery rate was applied as significant thresholds. Based on genomic inflation factor, comparison of the power of fixed
and mixed linear models (MLM) is done. Since MLM had better inflation rate its results is used for subsequent analysis. In
order to account for multiple comparison, P-values were adjusted based on chromosomal false discovery rate (FDR) of 5%
as significant and suggestive threshold respectively (Benjamini and Hochberg 1995).
Results 3 significantly associated SNPs on chromosome 24 and linkage group E22C19W28_E50C23 and 3 suggested
associated SNPs on chromosome 1, 5 and 16 were identified. Pathway analysis showed that 2 biological pathways which
are related to immune responses were strongly associated with the candidate genes surrounding identified SNPs and their
influences were mostly on antigen processing and presentation and cellular structure.
Conclusion This study specifically focused on CMI in chicken and showed that it might be possible to predict genomic
estimated breeding values (GEBV) and use it to improve immune response in poultry populations through genomic
selection and marker assisted selection.
Acknowledgements This work is done using the 60k chicken SNP chip produced by Illumina Inc. for the GWMAS
consortium. Genotyping the birds is funded by Aarhus University, Denmark. We acknowledge Prof. Just Jensen from
Aarhus University.
References Benjamini, Y. and Y. Hochberg . 1995. Controlling the false discovery rate: a practical and powerful approach to multiple
testing. Journal of the Royal Statistical Society. Series B (Methodological), 289-300.
Harnett, M. M., E. Katz, et al. 2005. Differential signalling during B-cell maturation. Immunol Lett 98(1), 33-44.

150
Principal component factor analysis of the morphostructural traits of West African dwarf sheep A A Bello-ibiyemi
1, C O N Ikeobi
1, A S Adenaike
1, M Wheto
1, J S Decampos
1, D O Ogunlakin
1, R A Lawal
2, A A Amisu
1
1Federal University of Agriculture, Abeokuta, Ogun State, Nigeria,
2University of Nottingham, UK
Application Isolation of best traits to predict body weight of West African Dwarf (WAD) sheep from orthogonal body
shape characteristics from multicollinear predictors
Introduction Livestock supplies contribute immensely to protein consumption, mainly estimated at 27.9 percent
worldwide and 47.8 in developed countries (FAOSTAT, 2011). Sheep classified as small ruminant is raised commonly by
farmers with low income (Kurnianto et al., 2013). WAD sheep is a multipurpose predominant breed of humid tropics
primarily reared for its meat. The Principal Component Analysis (PCA) is a multivariate statistical methodology for
assessment of morphometric traits (Yakubu et al., 2009).
Material and methods Evaluation of seven morphostructural traits across age range 0-2 and 2-4 years of 200 West African
Dwarf (WAD) sheep, was employed in the prediction of body weight character. Collinearity effect was orchestrated with
computations of eigenvalues and variance proportions. Component solution through VARIMAX orthogonal rotation
generated one and two principal components for 0-2 and 2-4 years respectively. The principal component based regression
models revealed, body weight was best predicted from heart girth, and combination of rump height and wither’s height
measurements
Results Evaluation of seven morphostructural traits across age range 0-2 and 2-4 years of 200 West African Dwarf (WAD)
sheep was used in determining prediction of body weight character. Collinearity effect was orchestrated with computations
of eigenvalues and variance proportions. Component solution through VARIMAX orthogonal rotation generated one and
two principal components for 0-2 and 2-4 years respectively. The principal component based regression models revealed,
body weight was best predicted from heart girth, and combination of rump height and wither’s height measurements.
Table 1 Rotated component matrix for the age groups and body weight prediction with multiple regression of body
measurements on the principal components scores of West African dwarf sheep
Model Age group 0-2 Age group 2-4
Trait PC 1 Communality PC 1 PC 2 Communality
BL
WH
RH
FCBL
CD
HW
HG
Eigenvalue
%
Variance
R2
Intercept
Orthogonal
Predictor
.775
.851
.882
.484
.554
.537
.816
4.00
51.41
.63
-15.70
HG
.601
.725
.777
.234
.307
.288
.666
.693
.770
.798
.394
.722
.279
.748
3.02
43.20
.25
-12.80
(HG)(RH)
.353
-.178
-.051
-.774
-.177
.843
.089
21.53
1.51
.14
1.08
WH
.605
.625
.639
.755
.552
.788
.567
BL: body length; WH: wither’s height; RH: rump height; FCBL: fore cannon bone length; CD: chest depth; HW: hip
width; HG: hearth girth.
Conclusion Selection of WAD sheep based on the PCA suggested traits for identification of early maturing animals is an
appropriate tool for effective livestock farm management and breeding.
References
FAOSTAT, 2011. FAOSTAT Database on Agriculture. http://www.faostat.fao.org. Accessed on September 18, 2012.
Kurnianto E., S. Sutopo, E.Purbowati, E.T. Setiatin, D. Samsudewa and T. Permatasari, 2013. Multivariate Analysis of
Morphological Traits of Local Goats in Central Java, Indonesia. Iranian Journal of Applied Animal Science 3(2), 361-367.
Yakubu, A., D. M. Ogah, K.O Idahor, 2009. Principal Component Analysis of the Morphostructural Indices of White
Fulani Cattle. Trakia Journal of Sciences 7(2), 67-73.
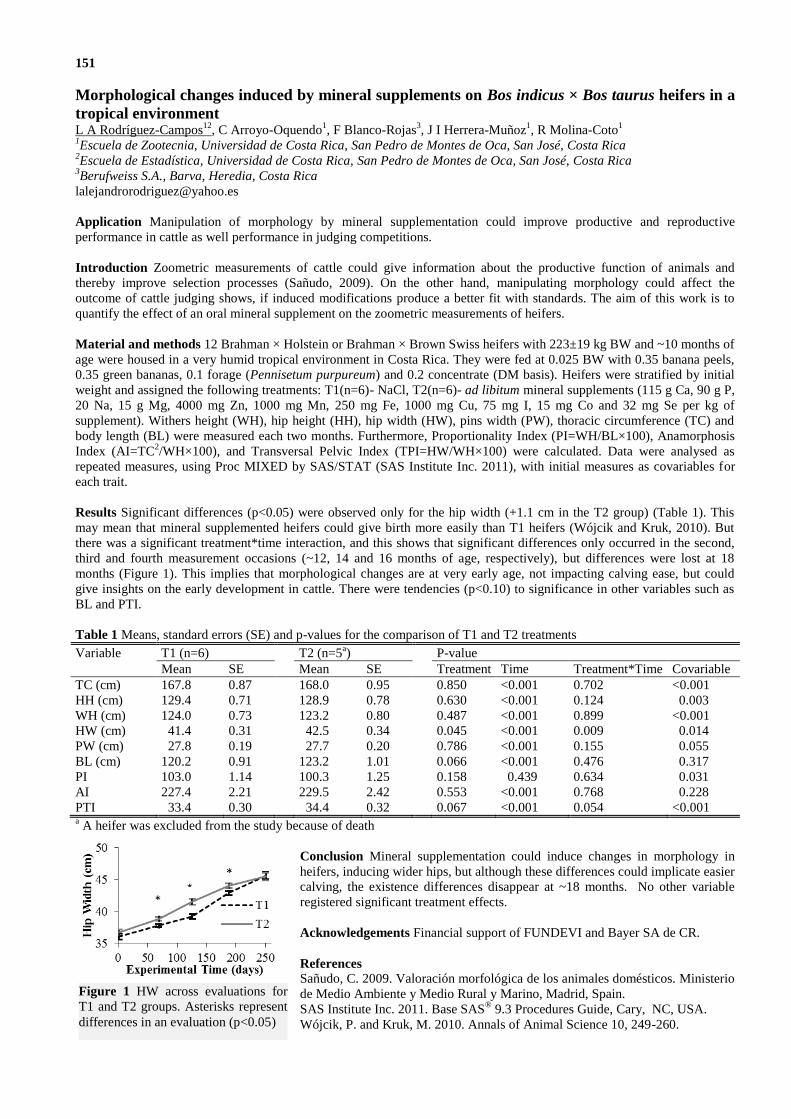
151
Morphological changes induced by mineral supplements on Bos indicus × Bos taurus heifers in a
tropical environment L A Rodríguez-Campos
12, C Arroyo-Oquendo
1, F Blanco-Rojas
3, J I Herrera-Muñoz
1, R Molina-Coto
1
1Escuela de Zootecnia, Universidad de Costa Rica, San Pedro de Montes de Oca, San José, Costa Rica
2Escuela de Estadística, Universidad de Costa Rica, San Pedro de Montes de Oca, San José, Costa Rica
3Berufweiss S.A., Barva, Heredia, Costa Rica
Application Manipulation of morphology by mineral supplementation could improve productive and reproductive
performance in cattle as well performance in judging competitions.
Introduction Zoometric measurements of cattle could give information about the productive function of animals and
thereby improve selection processes (Sañudo, 2009). On the other hand, manipulating morphology could affect the
outcome of cattle judging shows, if induced modifications produce a better fit with standards. The aim of this work is to
quantify the effect of an oral mineral supplement on the zoometric measurements of heifers.
Material and methods 12 Brahman × Holstein or Brahman × Brown Swiss heifers with 223±19 kg BW and ~10 months of
age were housed in a very humid tropical environment in Costa Rica. They were fed at 0.025 BW with 0.35 banana peels,
0.35 green bananas, 0.1 forage (Pennisetum purpureum) and 0.2 concentrate (DM basis). Heifers were stratified by initial
weight and assigned the following treatments: T1(n=6)- NaCl, T2(n=6)- ad libitum mineral supplements (115 g Ca, 90 g P,
20 Na, 15 g Mg, 4000 mg Zn, 1000 mg Mn, 250 mg Fe, 1000 mg Cu, 75 mg I, 15 mg Co and 32 mg Se per kg of
supplement). Withers height (WH), hip height (HH), hip width (HW), pins width (PW), thoracic circumference (TC) and
body length (BL) were measured each two months. Furthermore, Proportionality Index (PI=WH/BL×100), Anamorphosis
Index (AI=TC2/WH×100), and Transversal Pelvic Index (TPI=HW/WH×100) were calculated. Data were analysed as
repeated measures, using Proc MIXED by SAS/STAT (SAS Institute Inc. 2011), with initial measures as covariables for
each trait.
Results Significant differences (p<0.05) were observed only for the hip width (+1.1 cm in the T2 group) (Table 1). This
may mean that mineral supplemented heifers could give birth more easily than T1 heifers (Wójcik and Kruk, 2010). But
there was a significant treatment*time interaction, and this shows that significant differences only occurred in the second,
third and fourth measurement occasions (~12, 14 and 16 months of age, respectively), but differences were lost at 18
months (Figure 1). This implies that morphological changes are at very early age, not impacting calving ease, but could
give insights on the early development in cattle. There were tendencies (p<0.10) to significance in other variables such as
BL and PTI.
Table 1 Means, standard errors (SE) and p-values for the comparison of T1 and T2 treatments
Variable T1 (n=6) T2 (n=5a) P-value
Mean SE Mean SE Treatment Time Treatment*Time Covariable
TC (cm) 167.8 0.87 168.0 0.95 0.850 <0.001 0.702 <0.001
HH (cm) 129.4 0.71 128.9 0.78 0.630 <0.001 0.124 0.003
WH (cm) 124.0 0.73 123.2 0.80 0.487 <0.001 0.899 <0.001
HW (cm) 41.4 0.31 42.5 0.34 0.045 <0.001 0.009 0.014
PW (cm) 27.8 0.19 27.7 0.20 0.786 <0.001 0.155 0.055
BL (cm) 120.2 0.91 123.2 1.01 0.066 <0.001 0.476 0.317
PI 103.0 1.14 100.3 1.25 0.158 0.439 0.634 0.031
AI 227.4 2.21 229.5 2.42 0.553 <0.001 0.768 0.228
PTI 33.4 0.30 34.4 0.32 0.067 <0.001 0.054 <0.001 a A heifer was excluded from the study because of death
Conclusion Mineral supplementation could induce changes in morphology in
heifers, inducing wider hips, but although these differences could implicate easier
calving, the existence differences disappear at ~18 months. No other variable
registered significant treatment effects.
Acknowledgements Financial support of FUNDEVI and Bayer SA de CR.
References
Sañudo, C. 2009. Valoración morfológica de los animales domésticos. Ministerio
de Medio Ambiente y Medio Rural y Marino, Madrid, Spain.
SAS Institute Inc. 2011. Base SAS® 9.3 Procedures Guide, Cary, NC, USA.
Wójcik, P. and Kruk, M. 2010. Annals of Animal Science 10, 249-260.
Figure 1 HW across evaluations for
T1 and T2 groups. Asterisks represent
differences in an evaluation (p<0.05)

152
Patulin in Maize Silage V Morris
1, J Raj
2, T Cogan
1, M Bailey
1, M R F Lee
1,3
1University of Bristol, UK,
2Micron Bio-Systems, Bridgewater, UK,
3Rothamsted Research, North Wyke, UK
Application While patulin is not commonly reported in the UK, it is possible that in poorly stored silage patulin may occur
in high quantities but only for a short period of time potentially making patulin mycotoxicosis difficult to diagnose from
feed samples.
Introduction Penicillium roqueforti is found in silage, grain, and other plant materials stored under microaerobic
conditions and produces several secondary metabolites, one of which is patulin. A cyclic lactone, patulin is toxic to plants
and animals and has an antimicrobial effect on aerobic and anaerobic bacteria and protozoa. The effects of ingestion of
patulin are relatively unknown with a few reports that it causes neurotoxic symptoms in animals, including tremors and
ataxia and recumbency (Gallo et al 2015). Patulin is however widely recognised to alter the metabolism of nutrients by
ruminal microbes and significantly reduce the degradation of fibre (Tapia et al 2005). While diagnoses of patulin toxicosis
is infrequent in the UK, its occurrence would be detrimental to animal production.
Material and methods Maize silage samples from three farms in the South West of England were sampled during June
2015 from the face of well-maintained clamps in a typical W pattern. All three clamps had been inoculated with a silage
improver: Farm A with maizecoolgold (Biotal, Cardiff, UK), Farm’s B and C with solomaize (Biotal, Cardiff, UK). Three
samples were taken from each farm and each sample was then split into three replicates of 1kg each and stored at 23°C
±1°C in low level light. Subsamples were taken at 0, 1, 2 and 3 weeks of storage for mycotoxins, DM and fungal counts.
Mycotoxins were analysed by UPLCMS/MS by Micron-Biosystems (Somerset, UK) and for fungal counts a 5g subsample
of silage was added to 45ml of PBS and stomached for 1 min before being spread on to PDA (Oxoid, Basingstoke, UK).
The plates were incubated at 23°C ±1°C in low level light. The ten most predominant morphologies of fungi present on the
PDA were sent for sequence analysis (MWG-Biotech, Germany) after amplification by panfungal PCR. Patulin levels were
analysed by GLM Repeated Measures on SPSS V21.
Results Sequence analysis results showed that P. roqueforti was present at one week of storage onwards in samples from
Farms A and B (Figure 1a) but at no time in Farm C. While no patulin was recovered from the fresh samples or after one
week of storage, a high spike was evident after two weeks of storage in both Farms A and B where levels from Farm A
were significantly higher (P>0.01) than from Farm B at two weeks of storage (Figure 1b). After three weeks of storage, the
mean amount of patulin had fallen by 88% in the samples from farm A and was no longer evident in the samples from
Farm B.
0wk
1wk
2wk
3wk
0
2
4
6
8
10Farm A
Farm B
Farm C
P.
roq
uef
ort
i(l
og
10cf
u/g
silag
e)
Conclusion While patulin is not common in the UK, it is possible that in poorly stored silage patulin occurs in high
quantities for a short period (even when P. roqueforti is present in high levels), making it difficult to diagnose patulin
mycotoxicosis. Further investigation is required as to why the patulin level dropped so suddenly.
Acknowledgements The authors would like to thank BBSRC for funding this project (BovMycoTox – BB/M006409/1).
References
Gallo A, G. G., Frisvad JC, Bertuzzi T, Nielsen KF. . Battilani P. 2015 Toxins 7, 3057-3111.
Tapia, M. O., et al. 2005. Animal Feed Science and Technology 119(3–4), 247-258.
Table 1 Patulin recovered from maize silage collected from
three farms and stored over a three week period.
Patulin (mean
ppm)
0wk 1wk 2wk 3wk
Farm A 0 0 106.40* 12.39
Farm B 0 0 0.14 0
Farm C 0 0 0 0
* denotes a significant difference (P<0.01) within a column
Figure 2 Penicillium roqueforti isolated from maize
silage collected from three farms and stored over a
three week period
153
Chemical constituents of sown and naturally existing Sesbania sesban and Tephrosia candida in
late wet season T O Muraina1, J A Olanite2, P R Adebayo1, C B Emiola1, I A Ewetola2, O A Okukenu2, S O Mustapha2, Y T Adesetan2,
Y M Ishiaku3, O Oladepo1 1Oyo State College of Agriculture and Technology, Igbo-Ora, Nigeria,
2Federal University of Agriculture, Abeokuta,
Nigeria, 3National Animal Production Research Institute, Ahmadu Bello University, Zaria, Nigeria
Application Screening of browse plants would assist livestock farmers to identify those with good potentials as livestock
fodder and as supplements to the poor grasses, especially in dry season in Nigeria.
Introduction Shortage of nutrients prevents optimal performance of ruminants, particularly in the dry season when the
quality and quantity of the natural pasture significantly drops. Shrubs and legume tree fodders have been important sources
of supplementary nutrients for livestock at these times. Hence, this study aimed to assess the chemical composition in sown
and naturally existing species of Sesbania sesban and Tephrosia candida in the late wet dry season.
Material and methods The study was conducted at Oyo State College of Agriculture and Technology, Igbo-Ora, located
in the derived Savannah zone of Nigeria and lies on Latitude 7o
26` 0 N and Longitude 3o 17`0 E (Google Earth, 2014).
Treatments in the experiment were arranged as a Randomized Complete Block Design. 1kg fresh samples of leaves and
twigs of naturally existing species of T. candida and S. sesban were randomly harvested during the late rainy season
(August 2013) within the College premises, while the leaves and twigs of sown species of T. candida and S. sesban were
harvested at the same period on a year-old sown pasture. Samples collected were dried at 65 ˚C and ground to pass through
1.0mm sieve screen. Dry matter (DM), crude protein (CP), ether extract (EE) and ash were determined using the procedure
of A.O.A.C (2000). Neutral Detergent Fibre (NDF), Acid Detergent Fibre (ADF), Acid Detergent Lignin (ADL), were
determined using the method of Van Soest et al. (1991). Cellulose (CELL) and hemicellulose (HEM) were calculated as
follows: CELL= ADF-ADL and HEM= NDF-ADF. Data collected were subjected to Analysis of Variance and treatment
means were separated using Duncan Multiple Range Test at 5% level of significance (SAS, 1999).
Results The results were significantly (p<0.05) different for all investigated samples. Higher (20.12%) and least (7.14%)
CP were obtained in sown and natural species of T. candida. Crude protein contents of the browse species were higher than
the minimum level of 7% required for optimum rumen function (Van Soest, 1994). Roughage diets with NDF content of
45-65% and below 45% are generally considered as medium and high quality feeds, respectively (Singh and Oosting,
1992). Higher NDF (72.00%) was obtained from naturally existing T. candida, while sown S. sesban produced the least
(59.00%).
Table 1 Chemical constituents of sown and naturally existing S. sesban and T. candida
Mean on the same column with different superscripts differ significantly (p<0.05); N: Naturally existing; S: Sown pasture.
Conclusion Sown S. sesban contained medially rated fibre contents and yielded higher inorganic contents (ash). Sown T.
candida and naturally existing S. sesban were better protein sources respectively. The browse species were generally rich in
crude protein which is difficultly or rarely met at that period of the season.
References
AOAC, 2000. Official Methods of Analysis, 17th
edition. Washington, DC.
Google Earth, 2014. http//www.google.earth
SAS, 1999. Statistical Analytical Systems Institute. User’s guide. v6.Cary. North. Carolina. USA, 943
Singh, G. P. and Oosting, S. J. 1992. Indian Dairyman XLI, 322-327.
Van Soest, P. J., Robertson, J. B. and Lewis, B. A. 1991. Journal of Dairy Science 74(10), 3583-3597.
Van Soest, P. J. 1994. Nutritional Ecology of the Ruminant. 2nd
Ed. Cornell University Press, 47.
Species DM CP ASH EE NDF ADF ADL CELL HEM
S. sesban (S) 97.50a
13.28c
10.00a
8.00a
59.00c
39.00c
11.00b
29.00b
18.00c
S. sesban (N) 96.50b
15.20b
6.00b
7.00ab
67.00b
49.00a
9.00c
36.00a
19.00bc
T. candida (S) 97.50a
20.12a
6.00b
5.50c
66.00b
47.00b
11.00b
35.00a
20.00b
T. candida (N) 95.50c
7.14d
4.00c
6.50bc
72.00a
49.00a
13.00a
35.00a
23.00a
SEM 0.28 1.40 0.68 0.31 1.45 1.26 0.49 0.89 0.59
154
Morphological changes induced by monthly injections of butaphosphane and cyanocobalamin or
phosphorylcolamine, zinc, iodine and selenium on Bos indicus × Bos taurus heifers L A Rodríguez-Campos
12, C Arroyo-Oquendo
1, F Blanco-Rojas
3, J I Herrera-Muñoz
1, R Molina-Coto
1
1Escuela de Zootecnia, Universidad de Costa Rica, San Pedro de Montes de Oca, San José, Costa Rica
2Escuela de Estadística, Universidad de Costa Rica, San Pedro de Montes de Oca, San José, Costa Rica
3Berufweiss S.A., Barva, Heredia, Costa Rica
Application Manipulation of morphology by mineral supplementation could improve productive and reproductive
performance in cattle as well performance in judging competitions.
Introduction Different parental solutions improved health, mineral hepatic concentration, immune response, antioxidant
capacity and reproduction traits on cattle (Rodríguez and Ruiz, 2015). Mora et al. (2010) reported lower withers height
growth in cattle injected with zinc gluconate. Instead, effects of injectable solutions on body conformation are scarcely
evaluated. The aim of this study was to evaluate the effects of two mineral tonics on the zoometric measurements of
heifers.
Material and methods 36 Brahman crossbred heifers with 223±19 kg BW and ~10 months of age were housed in Costa
Rica and fed at 0.025 BW with 0.35 banana peels, 0.35 green bananas, 0.10 forage (Pennisetum purpureum) and 0.2
concentrate (DM basis). They were stratified by initial weight and assigned the following treatments: T1(n=12)- ad libitum
mineral supplement (115 g Ca, 90 g P, 20 Na, 15 g Mg, 4000 mg Zn, 1000 mg Mn, 250 mg Fe, 1000 mg Cu, 75 mg I, 15
mg Co and 32 mg Se per kg), T2(n=12)- T1 plus a monthly injection of 100 mg butaphosphane and 50 µg of
cyanocobalamin/20 kg BW. T3(n=12): T1 plus a monthly injection of 100 mg phosphorylcolamine, 13,19 mg ZnSO4, 20
mg KI and 0.22 mg Na2SeO3/20 kg BW Withers height (WH), hip height (HH), hip width (HW), pins width (PW), thoracic
circumference (TC) and body length (BL) were measured, and proportionality (PI=WH/BL×100), anamorphosis
(AI=TC2/WH×100), and transversal pelvic (TPI=HW/WH×100) indexes were calculated, each two months. Data were
analysed using Proc MIXED (SAS Institute Inc. 2011), with initial measures as covariables for each trait.
Results Significant differences (p<0.05) were observed only for PI (Table 1). As lower values are expected in beef animals
(Sañudo 2009), T2 heifers showed an inferior conformation than T1 (Sañudo, 2009). There were significant treatment*time
interactions for PI, because T2 had higher values at the beginning of the experiment, but they approximate to T1 in
subsequent evaluations (Figure 1). In addition, HW tended to be lower in T3 than the other two treatments (P=0.08).
Table 1 Means standard errors and p-values for the comparison of T1, T2 and T3 treatments
Variable T1 (n=11)a
T2 (n=12) T3 (n=11)a P-Value
Mean SE Mean SE Mean SE Treatment Time Treatment*Time Covariable
TC (cm) 168.8 1.26 171.0 1.21 170.0 1.26 0.485 <0.001 0.620 <0.001
HH (cm) 129.2 0.56 130.2 0.54 129.3 0.56 0.407 <0.001 0.933 <0.001
WH (cm) 123.5 0.66 125.5 0.64 124.5 0.66 0.116 <0.001 0.240 <0.001
HW (cm) 43.2 0.28 43.0 0.27 42.2 0.28 0.080 <0.001 0.495 <0.001
PW (cm) 27.7 0.30 28.2 0.29 28.3 0.30 0.370 <0.001 0.725 0.002
BL (cm) 121.8 0.92 119.8 0.88 122.2 0.94 0.162 <0.001 0.214 <0.001
PI 101.1 0.87 c 105.0 0.81
b 102.4 0.87
bc 0.008 0.013 0.039 0.001
AI 231.7 3.29 232.9 3.13 232.5 3.26 0.959 <0.001 0.371 <0.001
PTI 34.8 0.28 34.3 0.27 33.9 0.28 0.101 <0.001 0.292 <0.001 aTwo heifer died and their data were excluded.
b,c Different superscripts in a
row indicate significant differences (p<0.05).
Conclusion The injected tonics differed in their effects on the morphology of
animals: T2 induced higher values of PI and T3 did not significantly affect
zoometric measures. There is a possibility to induce morphological changes in
cattle using parenteral solutions, but mechanisms are unclear.
Acknowledgements Financial support of FUNDEVI and Bayer SA de CR.
References
Mora, R., Herrera, A., García, M., Chicco, C. and Pérez, R. 2010. Revista
Científica FCV-LUZ. 20,519-528.
Rodríguez, L.A. and Ruiz, G. 2015. Nutrición Animal Tropical 9, 57-87.
Sañudo, C. 2009. Valoración morfológica de los animales domésticos.
Ministerio de Medio Ambiente y Medio Rural y Marino, Madrid, Spain.
SAS Institute Inc. 2011. Base SAS® 9.3 Procedures Guide. Cary, NC, USA.
Figure 3 PI across evaluations for T1, T2,
and T3 groups. Means with different letters
indicate significant differences (lowercase
p<0.05, uppercase p<0.01)
155
Bioaccumulation of heavy metals, phenol and polycyclic aromatic hydrocarbons on skin-on red
Sokoto buck goats differently singed A B Omojola
1, O J Aremo
1, O O Olusola
1, V Attoh-Kotoku
2
1University of Ibadan, Nigeria,
2Kwame Nkrumah University of Science and Technology, Kumasi, Ghana
Introduction The safety of skin-on meat obtained from singed carcasses is a matter of public health concern. This study
was therefore carried out to investigate the concentration of heavy metals {Lead (Pb), Cadmium (Cd), Zinc (Zn),
Manganese (Mn) and Copper (Cu)}, phenol and polycyclic aromatic hydrocarbons (PAH) in red Sokoto buck goat
carcasses singed using fire wood, kerosene, scrap tyre and liquefied gas (LG).
Material and methods A total of twenty four good grade red Sokoto buck goats weighing between 18-20 kg were
randomly distributed into each of the four treatments in a completely randomized design. Each treatment was replicated six
times. The total PAH and phenol contents were determined by High Performance Liquid Chromatography (HPLC) while,
the minerals were measured by Atomic Absorption Spectroscopy (AAS).
Results
PAH levels were highest (P<0.05) in scrap tyre singed carcasses (0.040mg/kg) and least in LG singed carcasses
(0.001mg/kg). Pb and Mn were below detectable limit in carcasses singed with LG while the concentrations were similar
(P>0.01) in the other treatments. Cd was not detected in any of the treatments. Zn concentration was highest (P>0.05) in
carcasses singed with kerosene (0.05mg/kg). The level of phenol ranged from 0.02 Gae/kg in LG singed carcasses to 0.38
Gae/kg when scrap tyre was used.
Table 1 Phenol, Hydrocarbons and heavy metals at the loin region of red Sokoto buck goats differently singed
Parameters
Singeing Materials
SEM Kerosene Fire Wood Scrape Tyre Liquefied Gas
Phenol,(Gae/kg) 0.040 0.210 0.380 0.020 0.020
Hydrocarbon(mg/kg) 0.006 c 0.025
ab 0.040
a 0.001
c 0.001
Heavymetals
(mg/kg)
Lead 0.013 0.013
0.017
ND 0.010
Cadmium ND ND ND ND -
Zinc 0.050 a 0.023
b 0.020
b 0.023
b 0.020
Copper 0.200a 0.200
a 0.100
b 0.100
b 0.010
Manganese 0.020 0.020
0.020 0.017
0.000
abcMeans along the same row with the same superscript are not significantly different (P>0.01)
ND (Not detected)
Conclusion Materials used in singeing was found to have profound effect on heavy metal, phenol and PAH depositions on
skin-on meat from red Sokoto buck goats.
Acknowledgements The authors gratefully acknowledge the technical assistance from the laboratory crew of Meat Science
Laboratory, University of Ibadan, Nigeria
References
Al-Yakoob, S. N., T. Saeed, and H. H. Al-Hashash. 1994. Polycyclic aromatic hydrocarbons in . sh: exposure assessment
for Kuwaiti consumers after the Gulf oil spill of 1991. Environ. Int. 20,221–227
Bostro¨m, C. E., P. Gerde, A. Hanberg, B. Jernstro¨m, C. Johansson, T. Kyrklund, A. Rannug, M. To¨rnqvist, K. Victorin,
and R. Westerholm. 2002. Cancer risk assessment, indicators, and guidelines for polycyclic aromatic hydrocarbons in the
ambient air. Environ. Health Perspect. 110 (Suppl. 3), 451–489.
156
Growth performance of weaned rabbits reared under two different management systems
in Nigeria B Shehu
1, W Buba
1, M Magaji
2
1National Agricultural Extension and Research Liaison Services, Ahmadu Bello University, Zaria, Kaduna State, Nigeria,
2Ahmadu Bello University, Zaria, Kaduna State, Nigeria
Application Caged-housed rabbits had superior growth performance indices than pen-housed rabbits. Further research is
however necessary to measure the welfare of rabbits in the different management systems in Nigeria.
Introduction Rabbit meat production has been on the increase in Nigeria in recent years. Rabbits (Oryctolagus cuniculus)
are considered a fast growing and highly prolific species with a short generation interval, and represent a high potential for
improving animal protein intake in the developing countries generally. Rabbit production in Nigeria is largely carried out in
cages, and mainly in iron frame cages. Also, cages of different sizes are used with different stocking densities or group
sizes. According to Dal Bosco et al. (2000) housing system affects body weight, some carcass parameters and sometimes
the meat quality. Therefore, this study is aimed at evaluating the effects of two different management systems (pen-housed
and caged-housed) on the growth performance of weaned rabbits.
Material and methods Twenty-four weaned heterogeneous breeds of rabbits in equal number of males and females, aged
between 5 - 6 weeks with average initial live weight of 612 ± 14.72 g were procured from a rabbit farm. They were
randomly divided into two groups (pen-housed and caged-housed) consisting of 12 rabbits per group. One of the groups
was housed in well-ventilated room in three tier cages measuring 70×60×50cm per cage. The wire cages were fitted with
earthen drinkers and feeders and aluminium tray for collection of faces and urine. While the other group was housed in a
pen according to housing standards for rabbits (0.4 sq meter/ rabbit) established by Hoy, (2005). Wood shaving was used as
the litter material. The rabbits were pre-conditioned for two weeks during which they were treated with Ivermectin at the
dose rate of 0.1ml per rabbit subcutaneously. Rabbits were fed a commercial diet supplemented with Tridax procumbens
and given access to clean fresh water ad libitum. To evaluate the growth performance of the rabbits, initial weight (g), daily
weight gain (g), daily feed intake (g) and final body weight (g) were measured. Weight gain for each rabbit was calculated
by subtracting the initial weight (g) from the final body weight (g). The study lasted for 8 weeks.
Results The results from the study are presented in Table 1. Significant (P < 0.05) differences in daily body weight gain,
feed intake and final body weight were observed. The cage-housed rabbits recorded higher daily weight gain (13.62
g/day), daily feed intake (72.24 g/day) and final body weight (1373 g) as against (9.92 g/day, 63.58 g/day and 1168 g,
respectively for the pen-housed rabbits.
Table 1 Growth performance of weaned rabbit reared under two different management systems
Pen-housed Caged-housed p
Initial body weight (g) 612.34±3.40 609.81±6.01 n.s
Daily Body weight gain (g/day) 9.92b ±0.38 13.62
a ±0.70 <.0001
Daily Feed intake (g/ day) 63.58b ±0.88 72.24
a ±0.70 <.0001
Final body weight (g) 1168b ±23.36 1373
a ±41.57 <.0001
Conclusion Rabbits reared in cages had higher growth performance indices. The lower final body weight of the pen–
housed rabbits could be attributed to high locomotor activity. Also, the lower daily feed intake recorded for pen–housed
rabbits could be due to feed wastage associated with group rearing. Further research is however necessary to measure the
welfare of rabbits in the different management systems in Nigeria. Keeping rabbits in cages has been associated with their
poor welfare due to limited space.
Acknowledgements The authors gratefully acknowledge the Tertiary Education Fund of Nigeria (TETFund) for partially
financing this study.
References
Dal Bosco A., Castellini, C. and Bernardini, M. 2000. World Rabbit Science 8(1), 579-583.
Hoy S. 2005. In Proceeding 4th International Conference on Rabbit Production in Hot Climates. Sharm El-Sheikh.

157
Breadfruit (Artocarpus altilis) flour as an ingredient in meat patties V Attoh-Kotoku, A B Omojola, A Donkoh, C C Atuahene, C Mawusi
Kwame Nkrumah University of Science and Technology, Kumasi/Ashanti, Ghana [email protected]
Application The use of a non-protein dried fruit flour as a binder in processed meat products to lower production cost
without compromising nutritional qualities can improve income and make animal protein available at a lower cost.
Introduction Breadfruit flour (BFF) is much richer than wheat flour in lysine and other essential amino-acids, while it is
similar to cassava flour in its carbohydrate and caloric value. It is also a relatively good source of iron, calcium, potassium,
riboflavin (vitamin B2, the principal growth-promoting factor in the vitamin B complex) and niacin. Although, breadfruit is
nutritious, cheap and available in abundance during its season, it has limited applications in the food industries (Adepeju et
al., 2011). The study seeks to determine the suitability, sensory characteristics and cost effects of BFF inclusion in meat
products.
Material and methods The breadfruit (Artocarpus altilis) was harvested at the point of ripening, washed, sliced into small
chunks and sundried for 48 h and milled using a hammer mill with a plate diameter of 1 mm, packaged and stored in a
freezer until required. Frozen boneless lean pork (5 kg) were minced through a 5 mm sieve plate using a Mado Super Wolf
(MEW 513, Maschinferfabrik Domhan, GmBH, Germany) meat mincer. Similarly pork fat (1 kg) trimmings, of shoulder,
flank and thigh was also minced. The minced meat, fat and all the other ingredients were mixed thoroughly according to the
four treatments in a Super Wolf MADO bowl cutter. Crushed ice was added during comminution to obtain the desired
consistency. The products were formulated with breadfruit flour at three levels (T2, 10 %; T3, 20 % and T4, 30 %) with the
control T1 containing 0 % of BFF; 100g of each treatment was weighed and placed on a meat patty machine and pressed to
obtain a flat surface. Ten (10) patties were prepared for each of the four treatments. The patties were cooked in an oven at a
temperature of 180 °C to a core temperature of 70 °C using a meat thermometer. The patties were cooled, labelled and
stored in a freezer at a storage temperature of -2 °C for sensory and chemical analyses. Samples were taken from each
treatment and weighed before cooking (broiling) and after cooking. The percentage cooking yield was obtained by dividing
the cooked weight by the fresh weight and multiplying the answer by 100. A consumer panel made up of thirty five
students of KNUST randomly selected evaluated the products for the appearance, mouth feel, texture, aroma, taste and
acceptability using a five-point hedonic scale (5- like very much, 4- like moderately, 3- Neither like nor dislike, 2- dislike
moderately, 1- Dislike very much). The products were thawed, wrapped in labelled Kitchen foil, warmed in an oven at 1800
C for 5 minutes, sliced into approximately equal sizes of 2.0cm2 and served while hot. Water was offered each panellist to
rinse the mouth in-between tasting the patties. All products were randomized. A completely randomised Design was used
and each treatment was replicated five times. Chemical analysis was carried out on the pork, BFF and the patties for
moisture, fat, protein and ash content using the procedures described by AOAC (1990). The data were analyzed using SAS
2000 package while means were separated with Duncan Multiple Range Test.
Results Panellists detected significant (P<0.05) differences in all the five attributes. Reduction in the cost of the patties
increased with increased inclusion of the BFF. The appearance score of the patties decreased as the level of the BFF
increased and this ran through all the attributes. Acceptability of the patties decreased significantly (P<0.05) for the 20 and
30 % inclusion levels.
Table 1 Sensory attributes and cooking yield of the sausages
Attributes T1 T2 T3 T4 SEM
Appearance 4.37a
4.00ab
3.91b
3.89b
0.146
Taste 4.03a
3.69ab
3.46ab
3.31b
0.193
Aroma 4.26a
3.83ab
3.54b
3.49b
0.173
Texture 4.29a
4.03ab
3.66b
3.77b
0.159
Mouth feel 4.09a
3.71ab
3.43b
3.46b
0.182
Acceptability 4.03a
3.77a
3.54b
3.40b
0.178
*% change in cost/kg NA 8.14 17.38 28.16 -
Means with different superscripts within a row are significantly (P<0.05) different; *% change in production cost relative
to the control
Conclusion The results revealed that BFF could be used as an extender in meat patties at up to 30% inclusion as this had
salutary effects on the sensory profile of meat patties and also might provide the consumer with food containing natural
additives, which might be healthful at a lower cost though, acceptability at 20 and 30 % levels was low compared to the 10
%.
Acknowledgements The authors would like to acknowledge the Department of Animal Science for the use of their
facilities for the study.
References
Adepeju, A.B., Gbadamosi, S.O., Adeniran, A.H. and Omobuwajo, T.O. 2011. Functional and pasting characteristics of
breadfruit (Artocarpus altilis) flours. African Journal of food Science 5(9), 529-535.

158
Unfermented African locust bean flour (UALBF) Parkia biglobosa (jacq.) Benth as a non-
conventional extender in frankfurter type sausages V Attoh-Kotoku, A B Omojola, A Donkoh, C C Atuahene, A S Salmanu
Kwame Nkrumah University of Science and Technology, Kumasi/Ashanti, Ghana [email protected]
Implications Decreased production cost in processed meat products without compromising comparative eating qualities
and nutritional benefits; improved income and making animal protein available at a lower cost can be achieved by using a
non-meat protein extender.
Introduction Dawadawa the fermented seeds of the African locust beans is used as a flavouring agent and improves the
nutritional quality of poor protein diets. As a protein additive in stews and soups it has a CP content of 23.5-33.4 % as well
as containing riboflavin (Dike and Odumfa, 2003). The study seeks to evaluate the effects of substituting ground meat with
unfermented african locust bean flour (UALBF) to produce affordable frankfurter sausage with comparable eating quality
and nutritional benefits.
Material and methods Dawadawa (Parkia biglobosa) seeds were separated out of the pods and boiled overnight at 100 ˚C.
The heat treated seeds were rubbed to remove testa, washed, sundried for 48 h and milled using a hammer mill with a plate
diameter of 1 mm. The milled flour was packaged in polyethylene bags and stored in a freezer until required. Chilled lean
beef (6 kg) and pork fat (1 kg) trimmings, of shoulder, flank and thigh, were minced through a 13 mm diameter (Mado
Super Wolf meat mincer). The dawadawa flour, spices and water were weighed and mixed with the minced beef and pork
fat after, which each treatment was stuffed into casings of uniform size and shape using a hand operated stuffer. The
sausages were formulated separately for the five treatments, with five replicates each. The treatments were T1 (control
product), T2 (5 % inclusion), T3 (10 % inclusion), T4 (15 % inclusion) and T5 (20 % inclusion) of UALBF. They were
linked at 10 cm length strands, smoked for 3 h using firewood and sawdust after, which they were scalded in water at 72 ˚C
to a core temperature of 68 ˚C, cooled under tap water and placed under ceiling fan for 30 min. The sausages were stored at
-18 °C for 24 h, re-packaged and kept at the same temperature till required. The sausages were thawed overnight at 10 °C
and were heated in an oven at 180 °C to obtain a core temperature of 77 °C using a meat thermometer. Samples were taken
from each treatment and weighed before cooking (broiling) and after cooking. The percentage cooking yield was obtained
by dividing the cooked weight by the fresh weight and multiplying the answer by 100. The products were then sliced and
kept in a microwave till they were served. A hedonic scale of 5 – 1 was used; where 5 means ‘like extremely’ and 1 means
‘Dislike extremely’. Forty five untrained regular consumers of processed meat products were used as panelists from
Kwame Nkrumah University of Science and Technology. At each sensory evaluation session, the coded samples of the
different treatments were served following a completely randomized design, which ensured that no two panelists at any
time were served in the same order. They were each served with water, disposable cups and napkins. Chemical analysis
was carried out on the beef, UALBF and the processed product for moisture, fat, protein and ash content using the
procedures described by AOAC (1990). The data were analyzed using the one-way analyses of variance (ANOVA) in a
Completely Randomized Design. Means and associated standard errors for measured parameters were computed using
Genstat 2008 Version 7.2 DE for Windows and differences between means were compared using the Student-Newman-
Keuls test.
Results The panelists detected significant (P<0.001) differences in taste, flavor, cooking yield and overall acceptability of
the test samples (Table 1). There was no significant (P>0.001) difference between T1 (control) and T2 (5 % inclusion) for
all the attributes (appearance, taste, flavor, texture and overall acceptance). The test products had significantly (P<0.001)
higher cooking yields T2, T3, (86.7 %), T4 (92.9 %) and T5 (93.3 %) when compared to the control T1 (78.8 %), likewise the
CP content (52.95 %) compared to the control (21 %) and these could be due to the moisture retention capacity and the
high CP (44.7 %) content of UALBF.
Table 1 Sensory attributes and cooking yield of the sausages
Attributes T1 T2 T3 T4 T5 SEM
Appearance 4.60a
4.23a
3.71b
3.66b
3.60b
0.167
Taste 4.00a
3.71ab
3.46ab
3.29b
3.26 0.191
Flavour 4.23a
3.91ab
3.57b
3.26b
3.34b
0.188
Texture 4.23a
3.60b
3.77ab
3.63b
3.66ab
0.196
Acceptability 4.29a
3.80ab
3.43bc
3.17c
3.17c
0.207
Cooking Yield 78.80c
86.70b
86.70b
92.90a 93.30
a 0.514
Means with different superscripts within a row are significantly (P<0.001) different
Conclusion The study showed that UALBF can be used as an extender in frankfurter-type sausages at an inclusion level of
5 % with no effect on appearance, taste, flavor, texture and overall acceptance and also enhanced the CP content of the
product.
Acknowledgements The authors are grateful to the Meat Processing Unit of the Department of Animal Science, KNUST for the facility.
References
AOAC. 1990. Official methods of analysis. 15th
ed. Association of Official Analytical Chemists, Washington, D.C.
Dike, E.N. and Odumfa, S.A. 2003. Microbiological and biochemical evaluation of a fermented Soyabean product-
soyadawadawa. Journal of Food Science and Technology 40, 606-610.


