
Determination of Al, Ca, Fe, K, Mg, P and Na in soil by ICP-AES
and method validation of the AL-method
Richard Svensson
Supervisors Mohammed Biggie and Jean Pettersson
Department of Chemistry BMC Bachelor Degree project in Chemistry (15 hp)

2
Abstract Concentrations of Al, Ca, Fe, K, Mg, P and Na are determined in soil. The soil is prepared by
an open vessel extraction by ammonium lactate and acetic acid, AL-method. The extraction
is a soft extraction thus the concentrations determined are not total concentrations but the
concentrations of the elements which plants have access to. The AL-method is designed for
agriculture hence the reason for measuring a concentration that is not the total
concentration of the elements in the soil. For the sample preparation 5.00 gram of soil is
leached with 100.0 mL AL-solution, the sample is shaken and filtered before it is analysed by
ICP-AES.
A validation of the AL-method is done were the LOD, LOQ, linearity, robustness, trueness, precision and day-to-day variation is determined. LOD and LOQ were determined by several measurements on blank solutions. Since the concentrations in the blank solutions and the concentration of Na were lower than LOD and LOQ, the concentrations are less accurate determined. The linearity of the instrument was controlled to confirm that neither samples, including the spiked samples with 50 % extra, nor calibration solutions exceeds the linear range. The robustness proved the method to be sensitive for changes in the amount of soil used for the preparation and for changes in the concentration of the AL-solution. The trueness of the method is determined by calculating the recovery for spiked samples and blanks. The recovery for the blanks was around 100 % for most of the elements, for the samples however, the recovery was lower probably due to re-adsorption of the metals back on the soil particles, as the equilibrium change when more metals are added in the solution. The precision of the method was determined by the RSD of samples made on the same day. A majority of the elements had a RSD lower than 2 %. Day-to-day variation of the method was determined with a one way ANOVA for all elements. The method showed a significant day-to-day variation for all elements.

3
Table of Contents
Determination of Al, Ca, Fe, K, Mg, P and Na in soil by ICP-AES and method validation of the AL-method ........................................................................................................................................ 1
Abstract ............................................................................................................................................... 2 Abbreviations ...................................................................................................................................... 3 Material and method .......................................................................................................................... 5
Sample preparation ........................................................................................................................ 5 Calibration solution ........................................................................................................................ 5 Instrument and settings .................................................................................................................. 6
Setup for the validation of the method ............................................................................................... 7 Linear range .................................................................................................................................... 7 LOD and LOQ................................................................................................................................... 8 Trueness .......................................................................................................................................... 8 Precision ......................................................................................................................................... 8 Robustness ...................................................................................................................................... 9 Day to day variation ........................................................................................................................ 9
Results and discussion ......................................................................................................................... 9 Linear range .................................................................................................................................. 11 LOD and LOQ................................................................................................................................. 13 Trueness ........................................................................................................................................ 13 Precision ....................................................................................................................................... 15 Robustness .................................................................................................................................... 16 Day to day variation ...................................................................................................................... 21
Conclusion ......................................................................................................................................... 22 References ......................................................................................................................................... 22 Appendix ........................................................................................................................................... 23
Abbreviations LOD Limit of Detection
LOQ Limit of Quantification
ICP-AES Inductively Coupled Plasma Atomic Emission Spectroscopy
AL-method Ammonium-Lactate-method
RSD Relative Standard Deviation
CRM Certified Reference Material
rpm Rounds Per Minute
MV Mean value of Variance
VM Variance of Mean value
ANOVA Analysis Of Variance

4
Introduction There are various different elements in the ground. In this study aluminium, calcium, iron,
phosphorus, magnesium, potassium and sodium concentration in soil are determined after
extraction with the AL-method and analysis by ICP-AES. The AL-method [1] is an open vessel
extraction where the sample is extracted with ammonium lactate and acetic acid; it is
commonly used for preparation of soil samples for analysis. Extraction by ammonium
lactate and acetic acid is a soft extraction.
This study is done at Agrilab AB, which is a company that analyse soil, cattle food and
manure for agriculture and individuals sending samples to Agrilab.
This method is designed to measure the concentrations of the elements that are easily
accessible to the plants; hence it does not provide the total concentrations of the elements
in the soil. The purpose of the analysis method is for agriculture and the information needed
there is how much of the elements that are accessible for the plants growing. Due to this,
only the easily accessible metals are measured, hence the soft extraction is used. In order to
measure the total concentrations in the soil stronger acids would need to be used for the
digestion. [2]
The principle of the AL-method is to extract the elements of interest from the soil to the
water phase with the ammonium lactate and acetic acid. Then the soil is filtered away and
the concentrations of the different metals are measured in the water phase with ICP. The
reason that the soil is filtered away is because it can damage the ICP-instrument and
influence the results. [2]
The plants growing in the soil needs potassium for some essential functions in the plant, one
of them is for transport of water, carbohydrates and nutrients in the plant. [3] A phosphorus
deficiency can lead to inhibition of the plant growth. [4] Magnesium plays an important part
for cell membranes and cell walls in the plants, it is also important for many enzymes which
are essential for the plant. [5]
Since P, K, Ca and Mg all are essential elements for the plants; knowing the amount of
elements in the soil is important. [6] It is the only way for the plant to get access to the
elements. It is important that the plants can grow because they fed humans and to get the
maximum of the plants required amounts of essential elements are needed. With the
knowledge of the concentrations in the ground right amounts of fertilizers can be used
which can save both time and money for the farmers. Over fertilization (eutrophication) is a
problem as a result of a too high usage of P and N in fertilizers. It affects both animals and
marine life negatively. Phosphorus in lakes lead to an increase of algae, which reduce the

5
oxygen levels thereby killing fishes in the lakes. [6] Calcium ions are important for enzymes
and for transport of nutrients over cell membranes. [7]
It is important that eutrophication is avoided since it damages the environment while the
plants still get enough of these essential elements to grow in a rapid speed. It is therefore of
importance to know the amounts of elements in the soil.
The goal of the study was to determine the amount of Al, Ca, Fe, K, Mg, P and Na in soil
prepared with the AL-method and analysed with ICP-AES. In addition to the concentration
determination the method is validated.
Material and method
Sample preparation
First 1.5 litres of lactic acid (90%) was diluted to 4.5 litres with deionized water and put into
a warming cupboard at 96-98 °C for two days. After the two days the solution is cooled in a
water bath. 20.27 g 98.6 % NaOH is dissolved in 519.81 g of water giving a solution of 1.000
M NaOH. 0.10 g phenolphthalein is dissolved in 100 mL 95 % ethanol.
After the hydration 1 mL of the lactic acid solution was titrated with the sodium hydroxide
solution and the molality is calculated for the lactic acid. 4.99 g of lactic acid were titrated
with 21.93 g 1.000 M NaOH giving the lactic acid solution a concentration of 4.22 moles/kg.
The acetic acid was also titrated with the sodium hydroxide solution. 3.15 g acetic acid was
titrated with 54.75 g 1.000 M NaOH; the acetic acid solution has the measured
concentration of 16.71 moles/kg.
The stock AL-solution is then made by mixing 392.07 g 98.3 % ammonium acetate, 897.81 g
acetic acid and 1183.60 g lactic acid and then diluting to 5 litres with distillate water. The
final solution is 1 M ammonium lactate and 4 M acetic acid, before usage the solution is
diluted 10 times and the pH of the diluted solution should be 3.75 ±0.05.
5.00 grams of soil is weighed up and in a tube and 100.0 ml of AL-solutions is added. For all
samples the standard soil from Agrilab is used. The sample is then shaken for 90 minutes.
When the samples are shaken the soil is filtered away with Munktells filter paper OOH, 150
mm. The first 2-5 mL of the filtered liquid is not used due to having a higher risk of
containing contaminations from the filter paper. After the first mL of liquid has passed a test
tube is filled with sample for analysis by ICP-AES.
Calibration solution
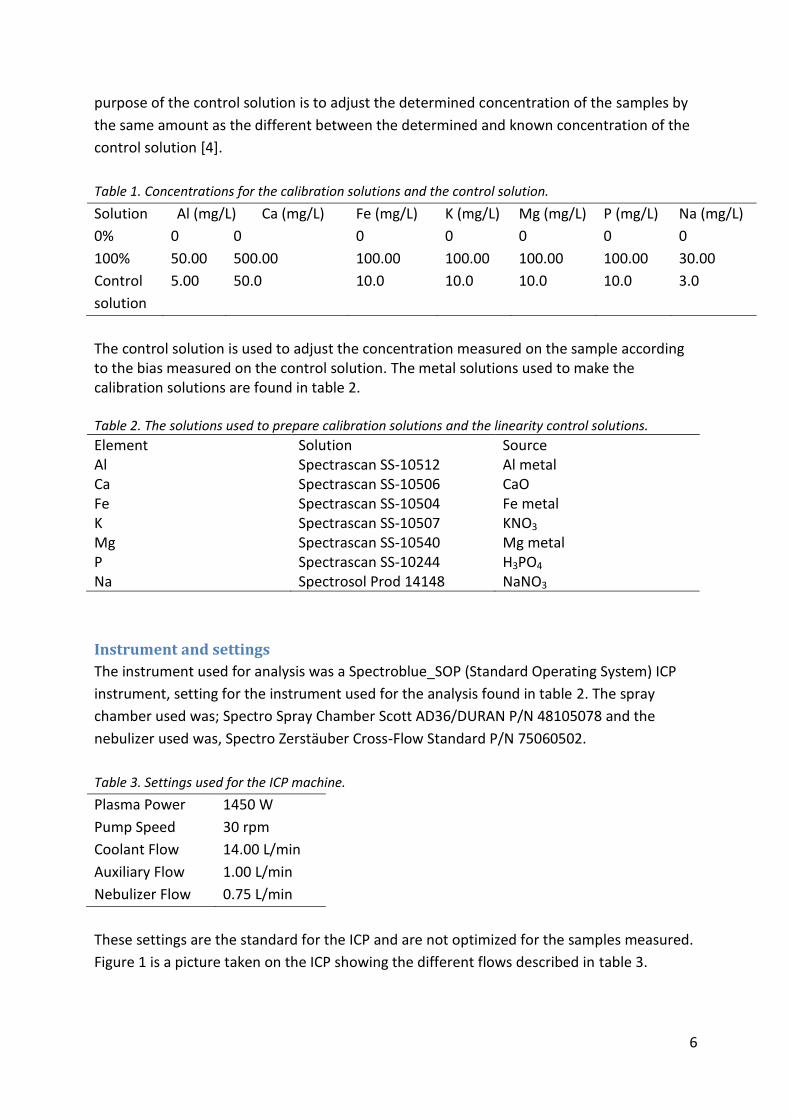
Calibration solutions were prepared with the concentrations in table 1. Before and after
each set of samples is measured the concentration of a control solution is measured. The
6
purpose of the control solution is to adjust the determined concentration of the samples by
the same amount as the different between the determined and known concentration of the
control solution [4].
Table 1. Concentrations for the calibration solutions and the control solution.
Solution Al (mg/L) Ca (mg/L) Fe (mg/L) K (mg/L) Mg (mg/L) P (mg/L) Na (mg/L)
0% 0 0 0 0 0 0 0
100% 50.00 500.00 100.00 100.00 100.00 100.00 30.00
Control
solution
5.00 50.0 10.0 10.0 10.0 10.0 3.0
The control solution is used to adjust the concentration measured on the sample according to the bias measured on the control solution. The metal solutions used to make the calibration solutions are found in table 2. Table 2. The solutions used to prepare calibration solutions and the linearity control solutions.
Element Solution Source Al Spectrascan SS-10512 Al metal Ca Spectrascan SS-10506 CaO Fe Spectrascan SS-10504 Fe metal K Spectrascan SS-10507 KNO3 Mg Spectrascan SS-10540 Mg metal P Spectrascan SS-10244 H3PO4 Na Spectrosol Prod 14148 NaNO3
Instrument and settings
The instrument used for analysis was a Spectroblue_SOP (Standard Operating System) ICP
instrument, setting for the instrument used for the analysis found in table 2. The spray
chamber used was; Spectro Spray Chamber Scott AD36/DURAN P/N 48105078 and the
nebulizer used was, Spectro Zerstäuber Cross-Flow Standard P/N 75060502.
Table 3. Settings used for the ICP machine.
Plasma Power 1450 W
Pump Speed 30 rpm
Coolant Flow 14.00 L/min
Auxiliary Flow 1.00 L/min
Nebulizer Flow 0.75 L/min
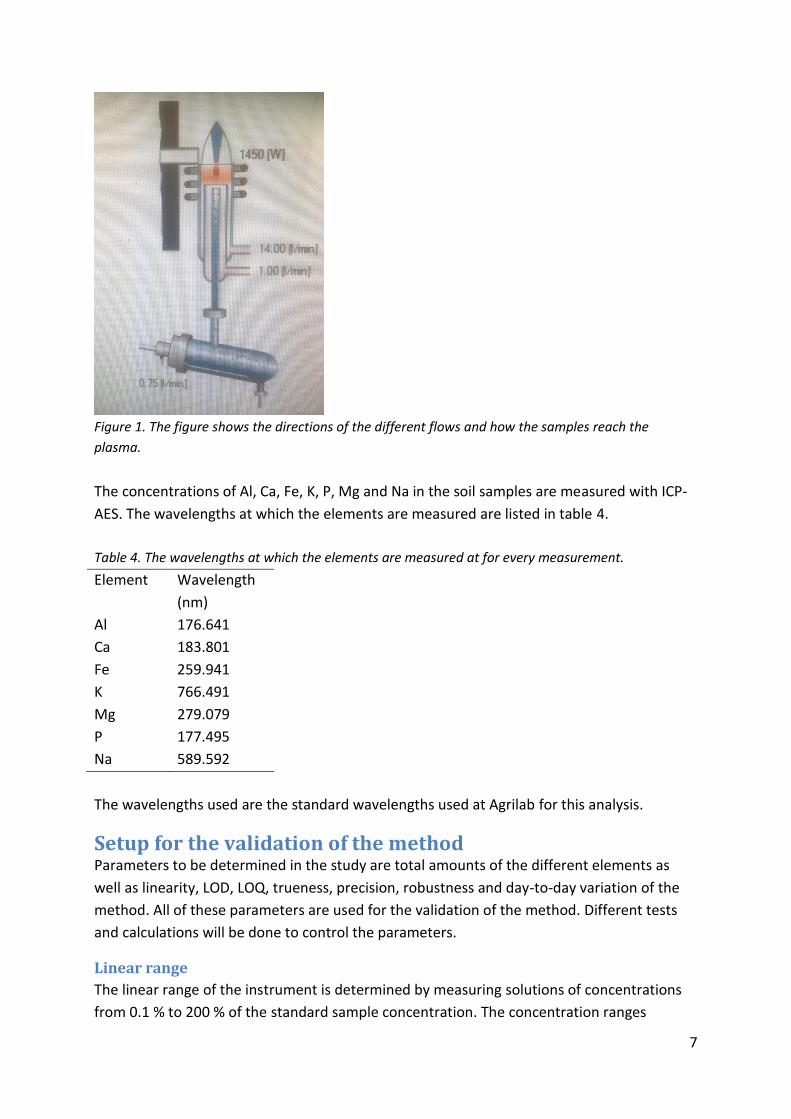
These settings are the standard for the ICP and are not optimized for the samples measured.
Figure 1 is a picture taken on the ICP showing the different flows described in table 3.
7
Figure 1. The figure shows the directions of the different flows and how the samples reach the
plasma.
The concentrations of Al, Ca, Fe, K, P, Mg and Na in the soil samples are measured with ICP-
AES. The wavelengths at which the elements are measured are listed in table 4.
Table 4. The wavelengths at which the elements are measured at for every measurement.
Element Wavelength
(nm)
Al 176.641
Ca 183.801
Fe 259.941
K 766.491
Mg 279.079
P 177.495
Na 589.592
The wavelengths used are the standard wavelengths used at Agrilab for this analysis.
Setup for the validation of the method Parameters to be determined in the study are total amounts of the different elements as
well as linearity, LOD, LOQ, trueness, precision, robustness and day-to-day variation of the
method. All of these parameters are used for the validation of the method. Different tests
and calculations will be done to control the parameters.
Linear range
The linear range of the instrument is determined by measuring solutions of concentrations
from 0.1 % to 200 % of the standard sample concentration. The concentration ranges

8
corresponds to concentrations between 0.05 mg/L to 200 mg/L for Al, Fe, Mg, P and K,
between 0.5 mg/L to 1000mg/L for Ca and between 0.03 and 60 mg/L for Na. The linearity is
the range in which the signal to concentration is linear. The linear range is controlled to
confirm that no samples have a concentration above of the linear range. Concentration
measured above of the linear range will be lower due to saturation of analyte outside of the
linear range. Linearity is accepted if the correlation factor R2>0.999 for the curve. For the
trueness where the samples are spiked with extra metals there is very important to know
that the samples still are within the linear range with the extra metals added, therefore the
linear range must be tested beyond the sample concentrations.
LOD and LOQ
The limit of detection of the method is determined by 2 measurements on 6 blank solutions.
From the measurements of the blanks the standard deviation is calculated. LOD of the
method is calculated by 3 ∗𝑠
𝑠𝑙𝑜𝑝𝑒 and LOQ of the method is calculated in a similar way,
10 ∗𝑠
𝑠𝑙𝑜𝑝𝑒 . Where s is the standard deviation for the intensity of the blank and the slope is
the slope for the calibrations curve.
Trueness
Systematic errors lead to a bias in the method, which affect the trueness of the method, as
trueness is the lack of a bias for a method. To determine the trueness of the method,
samples and blanks are spiked with a known amount of analyte and thereafter the recovery
of the added spike is calculated and will be used to determine the trueness of the method.
The recovery is calculated by dividing the concentration calculated from the signal from the
spike with the known amount of added spike. The trueness is measured on 14 samples and
10 blanks.
One other way to determine the trueness of is to use a certified reference material (CRM)
with a known concentration and use the same sample procedure as for the normal samples.
The problem is that the method is not designed to measure total concentration, which is the
concentration that is given for the CRM samples. Thus the measured value will be lower than
the reference value and no useful information would be gained. Therefore only spiked
samples will be used to determine the trueness of the method.
Precision
Precision is defined as the random errors of a method. [8] With low random errors the
repeatability of the method will be good. The repeatability is determined by the relative
standard deviation. RSD will be calculated from the standard deviations of samples made on
the same day. RSD is calculated by 100*s/x, where s is the standard deviation and x is the
mean value. The reason the RSD in calculated from samples made on the same day is
because day-to-day variation should not be included in the determination of RSD. A low
value of RSD indicates that the difference between the samples measured on the same day

9
is low. With a low difference between the samples made on the same day, the preparation
and analysis is precise.
RSD was also calculated on samples analysed on different days. One sample for each day for
the 5 days was used for the calculation. The value of the RSD for different days will give an
indication of the reproducibility of the method.
Robustness
The robustness of the method is a parameter that determines how sensitive the method it is
to small changes. If the method is very sensitive it is more difficult to get repeatability of the
results. It will be tested in two different ways, the first by adding 20% more and 20% less soil
in the samples. The second test for the method is to dilute the stock AL-solution 20% more
and 20% less to get two different concentrations of the AL-solution.
Six samples with the different preparation methods were made on two different days for a
total of 12 unique samples. The results from those samples are compared to the results of
the standard method.
To determine whether there is a difference between these results and the results from the
normal samples a two-sided t-test will be used for the results from the samples with the
special preparation methods against the normal samples. [8] If the value is lower than the
critical value for the test there is no difference, however if the value is larger than the critical
value, there is a proven difference between the results. A significant difference purposes
that the method is sensitive for changes in the preparation of the samples.
Day to day variation
Eight samples will be made and measured every day for five days and the eventual day-to-
day variation of those samples will be tested by a one-way ANOVA. [8] The ANOVA is a
comparison of the variances and mean values for sample done on different days.
Results and discussion A total of 46 standard samples were done and analysed in addition to samples with
alternative preparation methods see robustness. The standard deviation, relative standard
deviation and day-to-day variation were calculated with the standard samples. All
concentrations are mean values of two measurements for both standard samples and
robustness samples.
The concentrations of the samples are calculated by the concentrations given from the
measurements. The ICP program give the concentrations in mg/L, by multiplying the value
with the volume and dividing it by the added amount of soil the units is converted to mg/g.
Before and after the samples are measured a control solution with concentration, see table

10
5, is measured. The quotient for the known control solutions concentration and the
measured concentration is used to adjust the calculated values of the samples for the bias in
the measured concentration.
Data from all the measurements are found in the appendix.
Table 5. Results for the standard samples.
Sample Al (mg/g) Ca (mg/g) Fe (mg/g) K (mg/g) Mg (mg/g) P (mg/g) Na (mg/g)
1 day 1 0.189 7.58 1.28 0.256 0.203 0.363 0.018
2 day 1 0.186 7.53 1.23 0.255 0.202 0.357 0.016
3 day 1 0.187 7.61 1.26 0.258 0.202 0.360 0.034
4 day 1 0.186 7.56 1.24 0.256 0.201 0.357 0.019
5 day 1 0.190 7.65 1.31 0.258 0.207 0.364 0.019
6 day 1 0.184 7.49 1.26 0.253 0.201 0.361 0.016
7 day 1 0.188 7.53 1.28 0.255 0.203 0.363 0.019
8 day1 0.189 7.59 1.26 0.259 0.203 0.366 0.024
1 day 2 0.193 7.60 1.28 0.261 0.207 0.360 0.021
2 day 2 0.196 7.60 1.28 0.261 0.207 0.361 0.024
3 day 2 0.192 7.63 1.25 0.257 0.205 0.360 0.025
4 day 2 0.193 7.58 1.24 0.259 0.205 0.361 0.029
5 day 2 0.191 7.56 1.25 0.253 0.202 0.358 0.029
6 day 2 0.192 7.58 1.25 0.259 0.204 0.361 0.026
7 day 2 0.190 7.52 1.23 0.255 0.203 0.356 0.031
8 day 2 0.192 7.68 1.25 0.257 0.206 0.364 0.027
1 day 3 0.182 7.57 1.26 0.253 0.197 0.351 0.021
2 day 3 0.182 7.50 1.27 0.251 0.201 0.354 0.023
3 day 3 0.178 7.57 1.27 0.250 0.197 0.358 0.018
4 day 3 0.180 7.56 1.29 0.253 0.197 0.351 0.018
5 day 3 0.178 7.63 1.26 0.251 0.198 0.356 0.018
6 day 3 0.181 7.41 1.26 0.252 0.197 0.353 0.018
7 day 3 0.179 7.55 1.27 0.250 0.196 0.358 0.018
8 day 3 0.178 7.55 1.28 0.249 0.197 0.355 0.018
1 day 4 0.185 7.48 1.24 0.256 0.207 0.356 0.026
2 day 4 0.189 7.63 1.26 0.258 0.209 0.368 0.025
3 day 4 0.185 7.47 1.23 0.257 0.207 0.356 0.031
4 day 4 0.189 7.68 1.26 0.257 0.207 0.353 0.035
5 day 4 0.184 7.44 1.23 0.254 0.205 0.357 0.032
6 day 4 0.189 7.60 1.24 0.262 0.211 0.362 0.035
7 day 4 0.180 7.57 1.21 0.252 0.203 0.351 0.025
8 day 4 0.187 7.57 1.24 0.261 0.208 0.363 0.025
1 day 6 0.179 7.35 1.18 0.244 0.193 0.348 0.016

11
2 day 6 0.180 7.38 1.17 0.243 0.193 0.347 0.016
3 day 6 0.179 7.42 1.18 0.243 0.193 0.349 0.016
4 day 6 0.180 7.29 1.16 0.243 0.193 0.344 0.017
5 day 6 0.193 7.40 1.18 0.250 0.195 0.347 0.018
6 day 6 0.180 7.35 1.16 0.245 0.193 0.344 0.016
7 day 6 0.179 7.33 1.16 0.243 0.192 0.346 0.016
8 day 6 0.182 7.33 1.17 0.243 0.194 0.345 0.017
9 day 6 0.182 7.35 1.17 0.244 0.194 0.350 0.016
10 day 6 0.197 7.34 1.18 0.255 0.195 0.346 0.019
11 day 6 0.187 7.36 1.16 0.250 0.195 0.353 0.018
12 day 6 0.182 7.42 1.17 0.245 0.194 0.349 0.017
13 day 6 0.181 7.37 1.16 0.244 0.193 0.346 0.017
14 day 6 0.186 7.40 1.18 0.247 0.195 0.355 0.018
Mean value for the elements are calculated for all the determined values. From the mean
values and confidence intervals, the concentration of the elements in the soil is determined.
See table 6 for the determined concentrations of the metals.
Table 6. Concentration of the different metals in the soil examined.
Element Al Ca Fe K Mg P Na
Concentration
(mg/g)
0.185 ±
0.002
7.50 ±
0.03
1.23 ±
0.01
0.252 ±
0.002
0.200 ±
0.002
0.355 ±
0.002
0.022 ±
0.002
Linear range
To determine the linear range eight solutions were prepared. First the solution containing
200 % of the expected sample concentration from measurements done earlier at the lab was
prepared. The other solutions were made from the 200 % solution. Concentrations of the
linearity solutions are found in table 7.
Table 7. Concentrations of the elements in all of the eight linearity solutions.
Solution Ca (mg/L) Al (mg/L) Fe (mg/L) K (mg/L) Mg (mg/L) P (mg/L) Na (mg/L)
200% 1000.00 100.00 200.00 200.00 200.00 200.00 60
100% 500.00 50.00 100.00 100.00 100.00 100.00 30
50% 250.00 25.00 50.00 50.00 50.00 50.00 15
10% 50.00 5.00 10.00 10.00 10.00 10.00 3.0
5% 25.00 2.500 5.000 5.000 5.000 5.000 1.5
1% 5.000 0.500 1.000 1.000 1.000 1.000 0.30
0.5% 2.500 0.250 0.500 0.500 0.500 0.500 0.15
0.1% 0.500 0.050 0.010 0.010 0.010 0.010 0.03
12
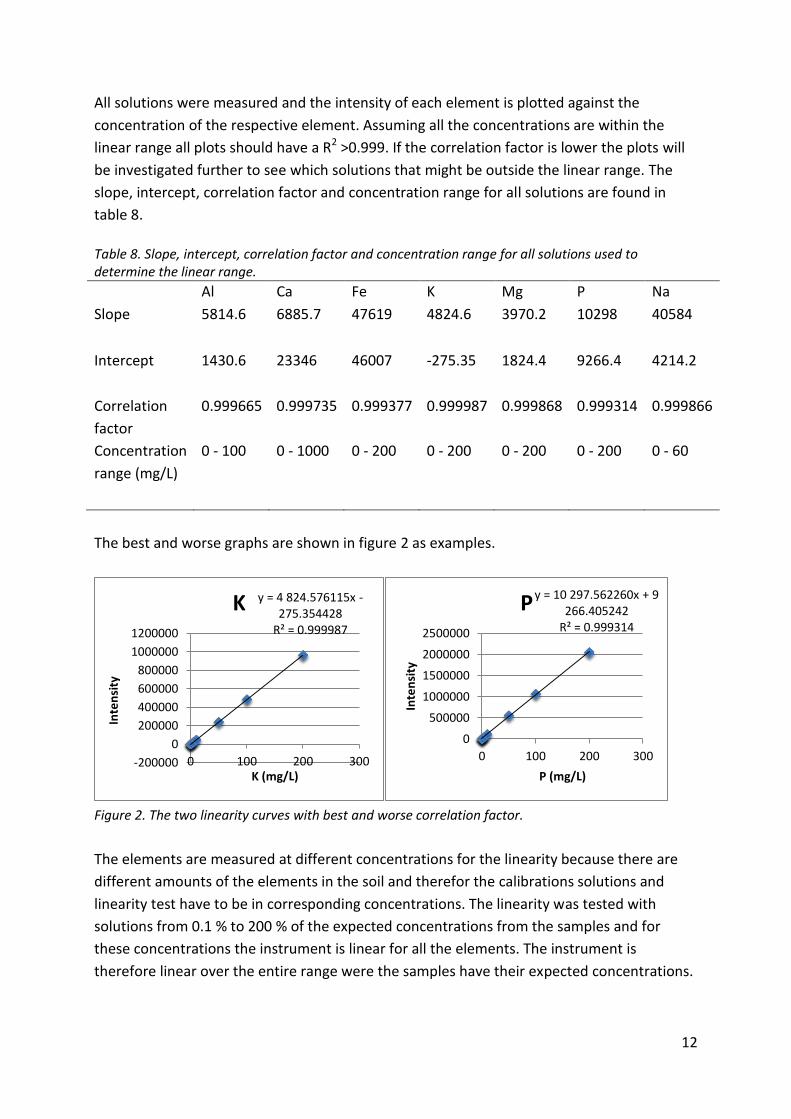
All solutions were measured and the intensity of each element is plotted against the
concentration of the respective element. Assuming all the concentrations are within the
linear range all plots should have a R2 >0.999. If the correlation factor is lower the plots will
be investigated further to see which solutions that might be outside the linear range. The
slope, intercept, correlation factor and concentration range for all solutions are found in
table 8.
Table 8. Slope, intercept, correlation factor and concentration range for all solutions used to determine the linear range.
Al Ca Fe K Mg P Na
Slope 5814.6 6885.7 47619 4824.6 3970.2 10298 40584
Intercept 1430.6 23346 46007 -275.35 1824.4 9266.4 4214.2
Correlation
factor
0.999665 0.999735 0.999377 0.999987 0.999868 0.999314 0.999866
Concentration
range (mg/L)
0 - 100 0 - 1000 0 - 200 0 - 200 0 - 200 0 - 200 0 - 60
The best and worse graphs are shown in figure 2 as examples.
Figure 2. The two linearity curves with best and worse correlation factor.
The elements are measured at different concentrations for the linearity because there are
different amounts of the elements in the soil and therefor the calibrations solutions and
linearity test have to be in corresponding concentrations. The linearity was tested with
solutions from 0.1 % to 200 % of the expected concentrations from the samples and for
these concentrations the instrument is linear for all the elements. The instrument is
therefore linear over the entire range were the samples have their expected concentrations.
y = 4 824.576115x - 275.354428
R² = 0.999987
-200000
0
200000
400000
600000
800000
1000000
1200000
0 100 200 300
Inte
nsi
ty
K (mg/L)
K y = 10 297.562260x + 9 266.405242
R² = 0.999314
0
500000
1000000
1500000
2000000
2500000
0 100 200 300
Inte
nsi
ty
P (mg/L)
P

13
The trueness is tested by spiking samples with 50 % extra of the sample concentration of all
the elements and therefore it is important that the instrument is linear for the wavelengths
used even for the spiked samples.
LOD and LOQ
Limit of detection and quantification are determined by measurements on 6 different blank
solutions prepared from the same solution. For the LOD and LOQ the intensities are used in
addition to the slopes of the calibration curves. Equation for the calculation is found under
method validation. Calculated values of LOD and LOQ are found in table 9. Intensities are
found in the appendix in A3.
Table 9. LOD and LOQ of the method for all elements.
Al Ca Fe K Mg P Na
LOD (mg/g) 0.018 0.20 0.13 0.046 0.023 0.038 0.25
LOQ (mg/g) 0.061 0.65 0.42 0.15 0.075 0.13 0.83
The determined concentrations for the blank solutions are lower than both the LOD and
LOQ. Hence the determinations of their concentrations are not exact concentrations. LOD
and LOQ values are much lower than the sample concentration for all elements except Na.
The mean value for the Na concentration determined on the standard samples is 0.022,
which is lower than both LOD and LOQ for Na. Therefore the concentration for Na is not
accurately determined.
Trueness
The spiked samples are made by adding 50 % of the standard sample concentration of the
metals analysed in the AL-solution according to table 10. The instrument has been controlled
to be linear at 150 % of the samples concentration; therefore no problems due to non-
linearity will arise. The same spiked concentration was added to both blanks and samples.
Table 10. The concentrations of the different elements added to the AL-solution.
Element Concentration
(mg/L)
Al 4.933
Ca 198.5
Fe 34.73
K 5.945
Mg 4.962
P 8.931
Na 0.699
For the blank solutions all the metals were from the spiked AL-solution. The recovery was
calculated to determine an eventual bias in the method. The recovery is calculated by

14
subtracting the known concentration of the blanks from the measured concentration. Then
dividing the determined concentrations with the concentration calculated from the stock
solutions. The ratio between these concentrations is multiplied with 100 to convert the
results to percentages. For the results see table 10.
Table 11. Recovery for the spiked blank solutions.
Al Ca Fe K Mg P Na
100% 98.4% 102.8% 104.8% 99.7% 111.9% 104%
101% 98.1% 102.6% 102.8% 98.9% 111.7% 101%
101% 97.1% 101.2% 102.9% 97.8% 111.3% 101%
101% 97.6% 101.9% 102.5% 98.9% 111.5% 98.9%
100% 96.6% 100.8% 101.3% 96.9% 110.8% 98.7%
99.5% 96.6% 100.7% 102.0% 97.4% 111.2% 101%
100% 97.3% 101.9% 102.7% 98.3% 112.1% 101%
101% 97.5% 101.2% 100.9% 97.9% 111.6% 99.6%
99.7% 96.6% 100.8% 100.6% 97.4% 110.7% 104%
102% 98.4% 102.1% 103.1% 98.6% 113.3% 111%
The mean values for the recovery are calculated from all of the single values see table 12 for
the results.
Table 12. The mean recovery for each element is determined from the values in table 11.
Element Al Ca Fe K Mg P Na
Mean recovery (%) 101 97.4 102 102 98.2 112 102
The mean recoveries are an indication of the bias of the method. The bias is calculated after
the blank is subtracted and the concentration adjusted according to the control solution. For
all elements but phosphorous the bias is less than 3 %.
14 samples were made with the same spiked AL-solution to determine the recovery for the
method. The mean concentrations of the normal samples are subtracted from concentration
of the spiked samples. The remaining concentrations from the spiked samples are the
concentrations from the spike. The concentration determined from the spiked AL-solution is
compared to the theoretical concentration of the spiked solution and the recovery is
determined, see table 13.
Table 13. Recovery for the spiked samples.
Al Ca Fe K Mg P Na
69.3% 85.6% 63.7% 84.2% 78.6% 74.0% 60.9%
73.1% 85.8% 64.4% 85.5% 79.7% 74.8% 113%
75.7% 84.8% 66.3% 88.2% 82.2% 74.0% 119%
71.0% 82.6% 61.0% 85.9% 77.6% 70.1% 127%

15
78.5% 83.4% 62.1% 86.0% 78.8% 69.2% 123%
78.2% 90.0% 68.5% 88.9% 84.4% 76.2% 105%
78.4% 90.2% 66.8% 90.2% 84.5% 79.1% 116%
75.2% 84.4% 63.3% 87.2% 80.7% 73.6% 80.9%
75.2% 84.4% 63.3% 87.2% 80.7% 73.6% 80.9%
77.3% 86.5% 64.7% 89.5% 82.8% 74.5% 111%
75.8% 92.3% 67.3% 92.7% 84.9% 80.7% 72.9%
77.9% 90.0% 65.9% 91.2% 83.8% 79.9% 76.0%
93.7% 88.7% 67.4% 97.9% 86.7% 75.6% 90.9%
79.4% 90.9% 65.3% 90.5% 82.9% 76.8% 71.3%
The mean value of the recovery are calculated and found in table 14.
Table 14. Mean recovery for the elements.
Element Al Ca Fe K Mg P Na
Mean recovery (%) 77.1 87.1 65.0 88.9 82.0 75.2 96.3
The acids in the AL-solution react differently in the solution with added metals already in the
solution. Adding metals in the AL-solution probably changes the extraction equilibrium in the
solution by lowering the extraction. The added metals in the solution push the equilibrium
towards adsorption of the metals back on the soil particles; therefore the recovery is lower
for the samples than for the blanks. The method is thereby sensitive to addition of metals in
the solution.
One problem with not measuring the total concentrations is that there is not possible to
compare the determined values with another method to control the eventual bias in the
method. With this method only spiked samples and spiked blanks can be used. For the
spiked samples the change in the equilibrium lowers the recovery due to the re-adsorption
of the metals back to the soil particles, hence giving the method a low recovery.
Precision
The precision of the method is determined by the RSD from the results of the 14 standard
samples done in the same day. The RSD is calculated by s/x*100, were s is the standard
deviation and x is the mean value for the samples done on day 6. Calculated mean value,
RSD and standard deviation is found in table 15.
Table 15. Table over mean values, standard deviations, and RSD for the elements measured on the
standard samples.
Al Ca Fe K Mg P Na
Mean value
(mg/g) 0.183 7.36 1.17 0.245 0.194 0.348 0.017
Standard 0.0056 0.036 0.0080 0.0036 0.0011 0.0033 0.0010

16
deviation
(mg/g)
RSD (%) 3.1 0.5 0.7 1.5 0.6 0.9 6.1
RSD over
several
days (%) 3.0 1.4 3.4 2.4 3.0 1.7 18.0
RSD of all the elements except Al is less than 2 %. For Na the RSD is 6.1 %, which is very high.
Na results are more insecure due to the determined concentration being lower than the LOD
of the method. The method is not developed or optimized to measure Na concentration
therefore these values are not as good as the other. The other results are good enough for
the purpose of the analysis.
RSD over several days is the relative standard deviation for the first sample done for every
day. The results for the RSD over several days are higher than the result for the normal RSD,
see table 15. The higher RSD for the result over several days is due to day-to-day variation.
To measure sodium all glassware and plastic equipment used should be washed in acid [1]
before usage to reduce contamination. It was not done the two first days, resulting in a
higher insecurity and worse precision for the result of sodium on those two days.
Robustness
To determine the robustness of the method the values from the nonstandard samples are
compared by t-tests to the standard samples. The different nonstandard samples are the
samples done with 20 % more or 20 % less soil, and those samples where the soil is diluted
in 20 % higher and 20 % lower concentrated AL-solution. The results from both these
alternative methods will determine the robustness of the method. For the determination of
the robustness only the samples done on the first day for the respective test was used.
Results from the samples done with 4 grams of soil are found in table 16.
Table 16. Concentration values from the samples with 4 grams of soil added instead of the standard
samples with 5 gram of soil.
Sample
Al
(mg/g)
Ca
(mg/g)
Fe
(mg/g)
K
(mg/g)
Mg
(mg/g)
P
(mg/g)
Na
(mg/g)
9 (4g) day 1 0.199 7.69 1.29 0.258 0.214 0.378 0.028
10 (4g) day 1 0.205 7.70 1.31 0.261 0.211 0.378 0.058
11 (4g) day 1 0.197 7.66 1.30 0.259 0.210 0.377 0.025
12 (4g) day 1 0.202 7.76 1.31 0.262 0.211 0.380 0.021
13 (4g) day 1 0.200 7.70 1.30 0.257 0.207 0.378 0.018
14 (4g) day 1 0.200 7.73 1.32 0.261 0.210 0.380 0.018
9 (4g) day 2 0.201 7.68 1.29 0.256 0.208 0.372 0.038
17
10 (4g) day 2 0.205 7.70 1.29 0.255 0.208 0.372 0.013
11 (4g) day 2 0.203 7.61 1.30 0.259 0.209 0.373 0.013
12 (4g) day 2 0.204 7.68 1.28 0.256 0.208 0.371 0.013
13 (4g) day 2 0.207 7.84 1.29 0.263 0.213 0.387 0.013
14 (4g) day 2 0.205 7.72 1.29 0.259 0.209 0.381 0.013
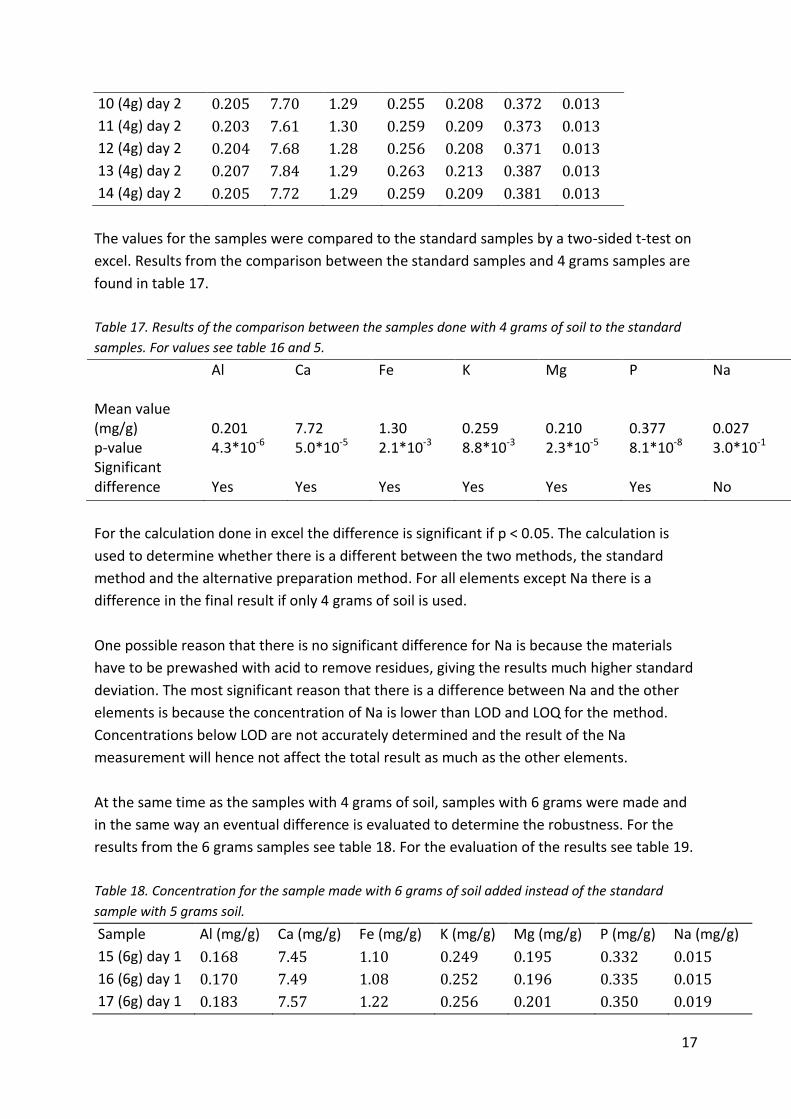
The values for the samples were compared to the standard samples by a two-sided t-test on
excel. Results from the comparison between the standard samples and 4 grams samples are
found in table 17.
Table 17. Results of the comparison between the samples done with 4 grams of soil to the standard
samples. For values see table 16 and 5.
Al Ca Fe K Mg P Na Mean value (mg/g) 0.201 7.72 1.30 0.259 0.210 0.377 0.027 p-value 4.3*10-6 5.0*10-5 2.1*10-3 8.8*10-3 2.3*10-5 8.1*10-8 3.0*10-1 Significant difference
Yes
Yes
Yes
Yes
Yes
Yes
No
For the calculation done in excel the difference is significant if p < 0.05. The calculation is
used to determine whether there is a different between the two methods, the standard
method and the alternative preparation method. For all elements except Na there is a
difference in the final result if only 4 grams of soil is used.
One possible reason that there is no significant difference for Na is because the materials
have to be prewashed with acid to remove residues, giving the results much higher standard
deviation. The most significant reason that there is a difference between Na and the other
elements is because the concentration of Na is lower than LOD and LOQ for the method.
Concentrations below LOD are not accurately determined and the result of the Na
measurement will hence not affect the total result as much as the other elements.
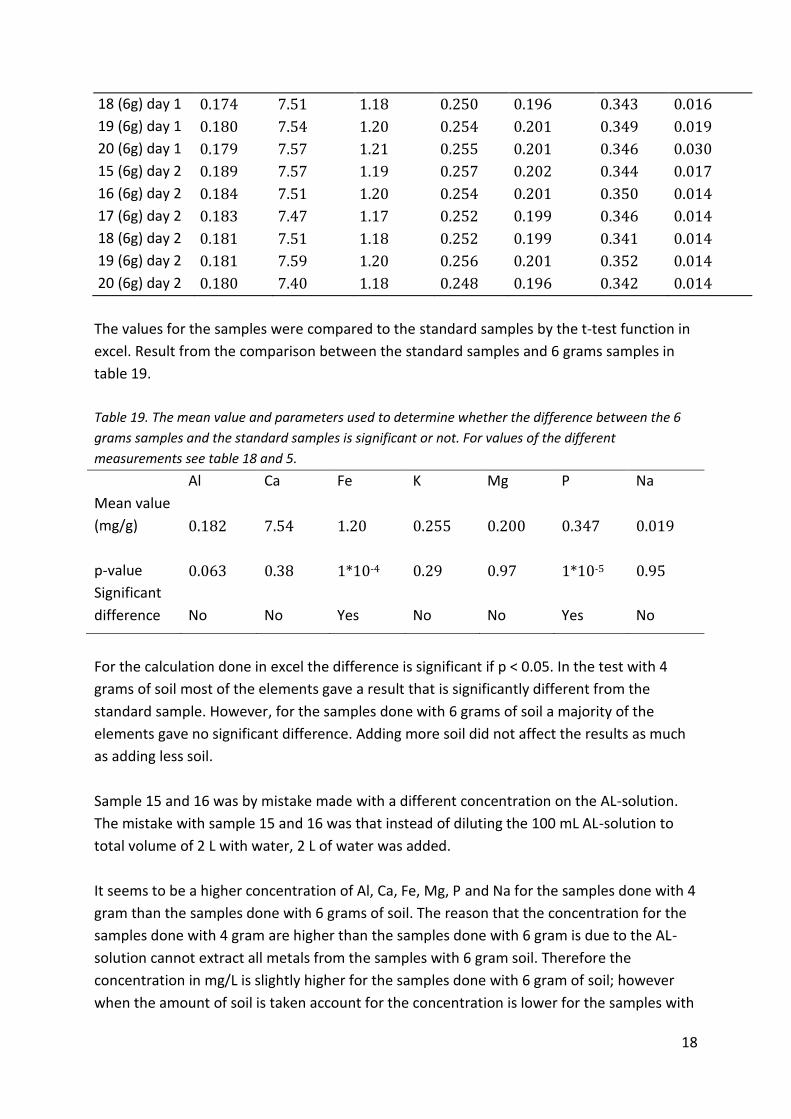
At the same time as the samples with 4 grams of soil, samples with 6 grams were made and
in the same way an eventual difference is evaluated to determine the robustness. For the
results from the 6 grams samples see table 18. For the evaluation of the results see table 19.
Table 18. Concentration for the sample made with 6 grams of soil added instead of the standard
sample with 5 grams soil.
Sample Al (mg/g) Ca (mg/g) Fe (mg/g) K (mg/g) Mg (mg/g) P (mg/g) Na (mg/g)
15 (6g) day 1 0.168 7.45 1.10 0.249 0.195 0.332 0.015
16 (6g) day 1 0.170 7.49 1.08 0.252 0.196 0.335 0.015
17 (6g) day 1 0.183 7.57 1.22 0.256 0.201 0.350 0.019
18
18 (6g) day 1 0.174 7.51 1.18 0.250 0.196 0.343 0.016
19 (6g) day 1 0.180 7.54 1.20 0.254 0.201 0.349 0.019
20 (6g) day 1 0.179 7.57 1.21 0.255 0.201 0.346 0.030
15 (6g) day 2 0.189 7.57 1.19 0.257 0.202 0.344 0.017
16 (6g) day 2 0.184 7.51 1.20 0.254 0.201 0.350 0.014
17 (6g) day 2 0.183 7.47 1.17 0.252 0.199 0.346 0.014
18 (6g) day 2 0.181 7.51 1.18 0.252 0.199 0.341 0.014
19 (6g) day 2 0.181 7.59 1.20 0.256 0.201 0.352 0.014
20 (6g) day 2 0.180 7.40 1.18 0.248 0.196 0.342 0.014
The values for the samples were compared to the standard samples by the t-test function in
excel. Result from the comparison between the standard samples and 6 grams samples in
table 19.
Table 19. The mean value and parameters used to determine whether the difference between the 6
grams samples and the standard samples is significant or not. For values of the different
measurements see table 18 and 5.
Al Ca Fe K Mg P Na
Mean value
(mg/g) 0.182 7.54 1.20 0.255 0.200 0.347 0.019
p-value 0.063 0.38 1*10-4 0.29 0.97 1*10-5 0.95
Significant
difference
No
No
Yes
No
No
Yes
No
For the calculation done in excel the difference is significant if p < 0.05. In the test with 4
grams of soil most of the elements gave a result that is significantly different from the
standard sample. However, for the samples done with 6 grams of soil a majority of the
elements gave no significant difference. Adding more soil did not affect the results as much
as adding less soil.
Sample 15 and 16 was by mistake made with a different concentration on the AL-solution.
The mistake with sample 15 and 16 was that instead of diluting the 100 mL AL-solution to
total volume of 2 L with water, 2 L of water was added.
It seems to be a higher concentration of Al, Ca, Fe, Mg, P and Na for the samples done with 4
gram than the samples done with 6 grams of soil. The reason that the concentration for the
samples done with 4 gram are higher than the samples done with 6 gram is due to the AL-
solution cannot extract all metals from the samples with 6 gram soil. Therefore the
concentration in mg/L is slightly higher for the samples done with 6 gram of soil; however
when the amount of soil is taken account for the concentration is lower for the samples with

19
more soil. The results will change with different amount of soil used in the preparation.
Hence it is important to use the same weight every time.
One other method in which the robustness of the method was tested was by dissolving the
samples in 20 % higher and lower concentrated AL-solution. The results from the tests done
with different strengths of the AL-solution will be compared to the standard samples with a
t-tests on excel. For results from the samples done with 20 % higher concentrated AL-
solution, see table 20.
Table 20. Concentration values for the samples done with 120% concentrated AL-solution.
Sample Al (mg/g) Ca (mg/g) Fe (mg/g) K (mg/g) Mg (mg/g) P (mg/g) Na (mg/g)
1 (120%) day 3 0.196 7.80 1.28 0.252 0.194 0.380 0.019
2 (120%) day 3 0.196 7.65 1.26 0.251 0.193 0.376 0.021
3 (120%) day 3 0.198 7.67 1.29 0.253 0.196 0.381 0.019
4 (120%) day 3 0.194 7.65 1.27 0.249 0.192 0.375 0.019
5 (120%) day 3 0.197 7.71 1.29 0.251 0.196 0.382 0.019
6 (120%) day 3 0.193 7.58 1.28 0.251 0.192 0.374 0.019
19 (120 %) day 4 0.206 7.73 1.31 0.260 0.209 0.386 0.025
20 (120 %) day 4 0.204 7.67 1.31 0.256 0.205 0.382 0.025
21 (120 %) day 4 0.203 7.70 1.31 0.256 0.205 0.381 0.025
22 (120 %) day 4 0.204 7.58 1.29 0.256 0.205 0.386 0.026
23 (120 %) day 4 0.201 7.69 1.31 0.260 0.204 0.378 0.025
24 (120 %) day 4 0.204 7.71 1.31 0.261 0.208 0.379 0.027
The concentration from the measurements with 120 % concentrated AL-solution are
compared to the concentrations of the standard samples with a t-test done by excel. The
calculated values are compared to the critical values. There is a difference between the
results if p < 0.05. For the mean values and evaluation of the test see table 21.
Table 21. The mean values and parameters used to determine whether the difference between the
samples diluted in 120% concentrated AL-solution and the standard samples is significant or not. For
values of the different measurements see table 20 and 5.
Al Ca Fe K Mg P Na
Mean
value 0.196 7.68 1.28 0.251 0.194 0.780 0.019

20
(mg/g)
p-value 8.1*10-3 4.2*10-2 5.3*10-13 1.7*10-4 2.3*10-7 2.5*10-6 3.7*10-4
Significant
difference
Yes Yes Yes Yes Yes Yes Yes
From the results of the critical parameters in table 21, there is clear that using a higher
concentrated AL-solution gives a significant different result for most elements. The
determined concentrations are significant higher than for the standard samples. Hence if the
Al-solution is incorrectly prepared or diluted, the results will not be correct if the
concentration of the AL-solution is higher than the normal.
The final robustness test was to dilute the soil in 20 % lower concentrated AL-solution.
Results from the measurements in table 22.
Table 22. Concentration values for the samples done with 80% concentrated AL-solution.
Sample Al (mg/g) Ca (mg/g)
Fe
(mg/g) K (mg/g)
Mg
(mg/g) P (mg/g)
Na
(mg/g)
7 (80%) day 3 0.165 7.49 1.09 0.251 0.199 0.331 0.021
8 (80%) day 3 0.164 7.43 1.09 0.249 0.196 0.333 0.020
9 (80%) day 3 0.164 7.49 1.10 0.249 0.197 0.330 0.021
10 (80%) day 3 0.161 7.40 1.07 0.248 0.194 0.328 0.021
11 (80%) day 3 0.176 7.38 1.09 0.256 0.199 0.324 0.022
12 (80%) day 3 0.164 7.41 1.09 0.251 0.197 0.332 0.019
10 (80%) day 4 0.166 7.37 1.09 0.256 0.206 0.331 0.024
11 (80%) day 4 0.171 7.40 1.10 0.258 0.209 0.330 0.025
12 (80%) day 4 0.172 7.30 1.09 0.254 0.211 0.329 0.046
13 (80%) day 4 0.169 7.40 1.10 0.257 0.207 0.333 0.024
14 (80%) day 4 0.171 7.35 1.09 0.257 0.207 0.329 0.025
10 (80%) day 4 0.171 7.38 1.09 0.255 0.208 0.335 0.025
The concentrations determined are compared to the standard samples by a two-sided t-test;
see table 23, to determine if there is a difference between the two preparation methods.
Table 23. Mean value and parameters used to determine whether the difference between the
samples diluted in 80% concentrated AL-solution and the standard samples is significant or not. For
values of the different measurements see table 22 and 5.
Al Ca Fe K Mg P Na
Mean value
(mg/g) 0.166 7.43 1.09 0.251 0.197 0.330 0.020

21
p-value 5.3*10-9 4.9*10-5 1.5*10-8 2.9*10-1 7.7*10-3 1.4*10-10 6.1*10-1
Significant
difference
Yes
Yes
Yes
No
Yes
Yes
No
The calculated values are compared to the critical value. If p < 0.05 for the calculation done
by excel there is a significant difference.
With the lower concentrated AL-solution the determined concentration for the samples are
lower than for the standard samples for all elements except K, and Na. The difference is that
when the higher concentrated AL-solution is used the measured concentration that differed
was higher than the standard samples. However for the samples done with 80 % AL-solution
the concentration that differed from the standard samples was lower. These results show
that the concentration of AL-solution is of great importance and that it had to be consistent
for all measurements.
Day to day variation
For the day-to-day variation 8 samples per day was done for 5 days with the same method.
The mean value and variance of the concentrations for each element is calculated for every
day. From the calculated values the variance of the mean value and mean value of the
variances are calculated, see table 24.
Table 24. Variances of mean values and mean value of the variances for each element, used to
determine the day-to-day variation.
Al Ca Fe K Mg P Na
MV 8.3*10-6
3.6*10-3
2.8*10-4
6.2*10-6
3.1*10-6
1.1*10-5
1.5*10-5
VM 2.5*10-5
9.0*10-3 1.7*10-3
3.2*10-5
3.2*10-5
1.2*10-5
2.8*10-5
The calculated value of both MV and VM is used to determine whether there is a day-to-day
variation in the determined concentrations. To determine the variation F=VM*number of
samples/MV is calculated, the critical value Fcrit = 2.64. F-values calculated from the ANOVA
are found in table 25.
Table 25. F values from the ANOVA test.
Al Ca Fe K Mg P Na
F-value 24.3 20.1 46.1 42.2 81.2 26.2 15.1
For every element the F-value exceeds the critical value of 2.64. Therefore there is a clear
day-to-day variation for all elements. The variance within a day is very low; however the
differences between the different days are significant. The day-to-day variation is partly due
to variations in the ICP-instrument.
22
Conclusion The sample preparation is a simple process however the analysis is very sensitive for small
changes in the method, thus it is important to be very accurate particularly when the AL-
solution is prepared.
The method validation proved that the precision of the method is good since most of the
elements had a low RSD. The concentration of the blank solutions and Na were lower than
both LOD and LOQ and Na are hence not as accurately determined as the other elements.
Conversely the method proved to be sensitive to small changes in the preparation from the
robustness tests in addition to a significant day-to-day variation for all elements. The
linearity was controlled partly to know that the spiked sample would not exceed the linear
range of the instrument. Even though the spiked samples did not exceed the linear range the
recovery for the spiked samples was around 80 % for most elements. The low recovery for
the spiked samples is likely due to re-adsorption of the metals on the soil particles.
References 1. Standardsamling – MARKUNDERSÖKNINGAR. 2001. SIS Förlag AB.
2. Martin Ulfvik Personal communication, worker at Agrilab AB. 2017
3. Lakduzala D,D. Potassium response in some Malawi soils. International Letters of
Chemistry, Physics and Astronomy 2013 8: 175-181
4. Kaiser E Daniel, Rose Carl J. and Lamb John A. Potassium for crop production 2016.
University of Minnesota Extension.
5. Guo Wanil, Nazim Hussain, Liang Zongsuo and Yang Dongfeng. Magnesium deficiency in
plants: An urgent problem. The Crop Journal 2016 4:83-91

23
6. Carpenter S. R, Caraco N. F, Correll D. L, Howarth R. W, Sharpley A. N. and Smith V. H.
Nonpoint Pollution of Surface Waters with Phosphorus and Nitrogen. Ecological Society of
America. 1998 8:559-568.
7. Geoffrey M. Cooper and Robert E Hausman. The Cell A Molecular Approach 7th edition.
Sunderland Massachusetts.
8. Miller. James N and Miller, Jane C. Statistics and Chemometrics for Analytical Chemistry 6th
edition, 2010. Person Education Limited Essex, England
Appendix Data from the measurments on all samples, calibration solutions and linear range solutions.
The measured values for the linear range control are found in A1. The data from all
measured samples and calibration, linear range and control solutions are found in A2.
Intensities used for LOD and LOQ are found in A3.
A1. Shows the intensities measured for the solutions made to determine the linear range. For Ca one
value for the solution with 100 % concentration was missed in the picture, the value is 3543470.

24
A2. All data from the samples, includes measured concentrations as well as used amount of soil and AL-solution.
Day 1
Measured concentration (mg/L)
Weigth (g)
Volume (mL) Al Ca Fe K Mg P Na
blank 0.00 100.00 -0.02430 -0.40515 -0.07776 0.02571 -0.0607 -0.0267 0.1919
Blank 0.00 100.00 -0.02601 -0.39969 -0.00689 -0.00176 -0.0619 -0.0293 0.4913
1 (standard) 5.00 100.00 9.982 413.849 70.654 12.79 10.667 18.92 1.216
2 (standard) 5.00 100.01 9.828 410.914 68.043 12.721 10.607 18.631 1.114
3 (standard) 5.00 100.00 9.864 415.449 69.636 12.863 10.618 18.787 2.053
4 (standard) 5.00 100.00 9.801 412.544 68.165 12.776 10.581 18.638 1.301
5 (standard) 5.00 100.00 10.006 417.511 72.106 12.888 10.903 18.964 1.296
6 (standard) 5.00 100.01 9.735 408.833 69.212 12.622 10.6 18.813 1.146
7 (standard) 5.00 100.00 9.938 410.844 70.414 12.749 10.697 18.928 1.283
8 (standard) 5.00 100.00 9.959 414.081 69.576 12.905 10.709 19.094 1.527

25
9 (4g) 4.00 100.00 8.396 335.647 56.752 10.313 8.989 15.753 1.464
10 (4g) 4.00 100.00 8.654 336.2 57.755 10.407 8.86 15.768 2.641
11 (4g) 4.01 100.00 8.357 335.252 57.319 10.353 8.852 15.766 1.349
12 (4g) 4.00 100.00 8.526 338.49 57.921 10.474 8.856 15.86 1.173
13 (4g) 4.00 100.00 8.428 336.225 57.313 10.265 8.726 15.753 1.073
14 (4g) 4.00 100.00 8.434 337.145 58.31 10.408 8.821 15.832 1.045
15 (6g) 6.00 100.02 10.624 487.491 72.919 14.919 12.338 20.792 1.261
16 (6g) 6.00 100.00 10.762 490.555 71.63 15.094 12.414 20.975 1.25
17 (6g) 6.00 100.00 11.595 495.557 80.927 15.348 12.701 21.915 1.482
18 (6g) 6.00 100.00 11.05 491.651 78.16 15.000 12.389 21.471 1.299
19 (6g) 6.00 100.00 11.394 493.949 79.254 15.239 12.696 21.841 1.498
20 (6g) 6.00 100.00 11.348 495.444 79.999 15.285 12.738 21.684 2.163
control solution
5.318 54.578 11.034 9.889 10.553 10.437 2.983
control solution
5.266 54.657 11.045 10.057 10.621 10.454 2.992
Water
< -0.004 < -0.519 < -0.110 < -0.022 < -0.067 < -0.039 < -0.001
Day 2
Measured concentration (mg/L)
Sample weight (g)
Volume (mL) Al Ca Fe K Mg P Na
blank 0 100.00 -0.0180 -0.42021 -0.06776 -0.03771 -0.054 -0.0331 0.1648
blank 0 100.00 -0.01799 -0.27807 0.007968 -0.0446 -0.06 -0.0295 0.3382
1 (standard) 5.00 100.00 10.186 410.719 69.113 12.758 10.782 18.667 1.28
2 (standard) 5.00 100.01 10.324 410.382 68.901 12.797 10.761 18.719 1.418
3 (standard) 5.00 100.00 10.11 412.338 67.508 12.581 10.645 18.678 1.459
4 (standard) 5.00 100.00 10.135 409.591 66.704 12.661 10.692 18.728 1.69
5 (standard) 5.00 100.00 10.07 408.501 67.442 12.378 10.513 18.563 1.674
6 (standard) 5.00 100.05 10.115 409.239 67.398 12.649 10.621 18.696 1.513
7 (standard) 5.00 100.00 9.985 405.969 66.209 12.473 10.545 18.449 1.788
8 (standard) 5.00 100.00 10.085 414.879 67.486 12.586 10.709 18.883 1.581
9 (4g) 4.00 100.01 8.478 331.613 55.797 10.008 8.655 15.411 1.759
10 (4g) 4.00 100.00 8.644 332.648 55.889 9.987 8.663 15.428 0.7561
11 (4g) 4.00 100.00 8.534 328.839 56.236 10.119 8.691 15.471 0.7587
12 (4g) 4.00 100.00 8.587 331.838 55.208 10.027 8.64 15.352 0.7809
13 (4g) 4.00 100.00 8.732 338.532 55.79 10.297 8.865 16.028 0.7831
14 (4g) 4.00 100.00 8.618 333.345 55.803 10.128 8.711 15.77 0.767
15 (6g) 6.00 100.01 11.962 490.398 77.24 15.111 12.639 21.405 1.254
16 (6g) 6.00 100.00 11.627 486.611 77.427 14.956 12.571 21.763 1.081
17 (6g) 6.00 100.00 11.538 484.339 76.096 14.807 12.424 21.51 1.07
18 (6g) 6.00 100.00 11.459 486.937 76.473 14.8 12.443 21.2 1.066
19 (6g) 6.00 100.01 11.454 491.828 78.008 15.068 12.586 21.878 1.095
20 (6g) 6.00 100.00 11.361 479.500 76.371 14.576 12.235 21.237 1.095
control solution
5.294 54.037 10.836 9.864 10.514 10.355 2.964
water
< 0.0160 < 0.0113 < 0.0014 < 0.0351 < 0.0539 < 0.0008 < 0.0050
Control solution
5.254 54.09 10.769 9.78 10.413 10.404 2.95
Day 3
Measured concentration (mg/L)
Sample Weight (g)
Volume (mL) Al Ca Fe K Mg P Na
blank 0 100.00 -0.02664 -0.31602 -0.08256 -0.04075 -0.0532 -0.0281 0.0366
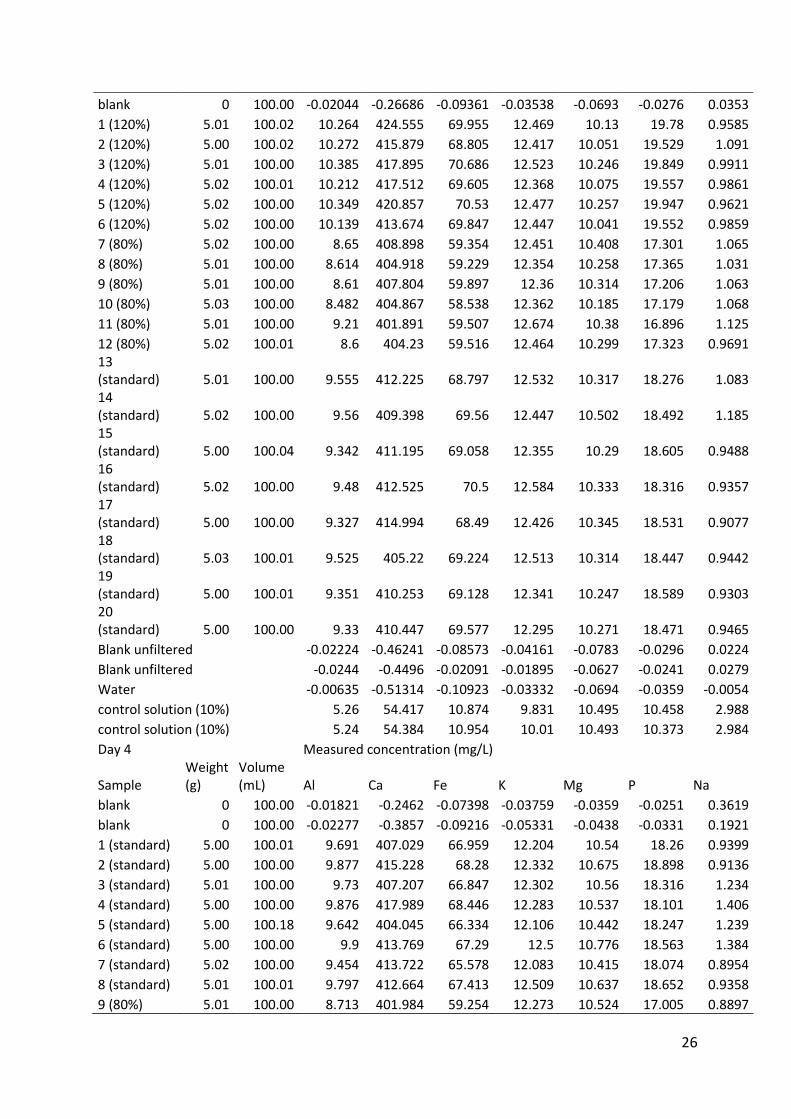
26
blank 0 100.00 -0.02044 -0.26686 -0.09361 -0.03538 -0.0693 -0.0276 0.0353
1 (120%) 5.01 100.02 10.264 424.555 69.955 12.469 10.13 19.78 0.9585
2 (120%) 5.00 100.02 10.272 415.879 68.805 12.417 10.051 19.529 1.091
3 (120%) 5.01 100.00 10.385 417.895 70.686 12.523 10.246 19.849 0.9911
4 (120%) 5.02 100.01 10.212 417.512 69.605 12.368 10.075 19.557 0.9861
5 (120%) 5.02 100.00 10.349 420.857 70.53 12.477 10.257 19.947 0.9621
6 (120%) 5.02 100.00 10.139 413.674 69.847 12.447 10.041 19.552 0.9859
7 (80%) 5.02 100.00 8.65 408.898 59.354 12.451 10.408 17.301 1.065
8 (80%) 5.01 100.00 8.614 404.918 59.229 12.354 10.258 17.365 1.031
9 (80%) 5.01 100.00 8.61 407.804 59.897 12.36 10.314 17.206 1.063
10 (80%) 5.03 100.00 8.482 404.867 58.538 12.362 10.185 17.179 1.068
11 (80%) 5.01 100.00 9.21 401.891 59.507 12.674 10.38 16.896 1.125
12 (80%) 5.02 100.01 8.6 404.23 59.516 12.464 10.299 17.323 0.9691 13 (standard) 5.01 100.00 9.555 412.225 68.797 12.532 10.317 18.276 1.083 14 (standard) 5.02 100.00 9.56 409.398 69.56 12.447 10.502 18.492 1.185 15 (standard) 5.00 100.04 9.342 411.195 69.058 12.355 10.29 18.605 0.9488 16 (standard) 5.02 100.00 9.48 412.525 70.5 12.584 10.333 18.316 0.9357 17 (standard) 5.00 100.00 9.327 414.994 68.49 12.426 10.345 18.531 0.9077 18 (standard) 5.03 100.01 9.525 405.22 69.224 12.513 10.314 18.447 0.9442 19 (standard) 5.00 100.01 9.351 410.253 69.128 12.341 10.247 18.589 0.9303 20 (standard) 5.00 100.00 9.33 410.447 69.577 12.295 10.271 18.471 0.9465
Blank unfiltered
-0.02224 -0.46241 -0.08573 -0.04161 -0.0783 -0.0296 0.0224
Blank unfiltered
-0.0244 -0.4496 -0.02091 -0.01895 -0.0627 -0.0241 0.0279
Water
-0.00635 -0.51314 -0.10923 -0.03332 -0.0694 -0.0359 -0.0054
control solution (10%) 5.26 54.417 10.874 9.831 10.495 10.458 2.988
control solution (10%) 5.24 54.384 10.954 10.01 10.493 10.373 2.984
Day 4
Measured concentration (mg/L)
Sample Weight (g)
Volume (mL) Al Ca Fe K Mg P Na
blank 0 100.00 -0.01821 -0.2462 -0.07398 -0.03759 -0.0359 -0.0251 0.3619
blank 0 100.00 -0.02277 -0.3857 -0.09216 -0.05331 -0.0438 -0.0331 0.1921
1 (standard) 5.00 100.01 9.691 407.029 66.959 12.204 10.54 18.26 0.9399
2 (standard) 5.00 100.00 9.877 415.228 68.28 12.332 10.675 18.898 0.9136
3 (standard) 5.01 100.00 9.73 407.207 66.847 12.302 10.56 18.316 1.234
4 (standard) 5.00 100.00 9.876 417.989 68.446 12.283 10.537 18.101 1.406
5 (standard) 5.00 100.18 9.642 404.045 66.334 12.106 10.442 18.247 1.239
6 (standard) 5.00 100.00 9.9 413.769 67.29 12.5 10.776 18.563 1.384
7 (standard) 5.02 100.00 9.454 413.722 65.578 12.083 10.415 18.074 0.8954
8 (standard) 5.01 100.01 9.797 412.664 67.413 12.509 10.637 18.652 0.9358
9 (80%) 5.01 100.00 8.713 401.984 59.254 12.273 10.524 17.005 0.8897
27
10 (80%) 5.01 100.02 8.978 403.35 59.772 12.368 10.699 16.929 0.9217
11 (80%) 5.01 100.01 9.053 397.855 59.354 12.178 10.771 16.869 1.973
12 (80%) 5.00 100.00 8.849 402.869 59.33 12.268 10.566 17.05 0.8856
13 (80%) 5.00 100.00 8.95 400.098 59.187 12.287 10.561 16.838 0.9108
14 (80%) 5.00 100.02 8.959 401.299 59.094 12.17 10.599 17.145 0.9045
15(120%) 5.00 100.00 10.804 420.756 71.21 12.446 10.673 19.806 0.9141
15(120%) 5.00 100.00 10.67 417.264 71.011 12.21 10.455 19.628 0.9012
15(120%) 5.00 100.00 10.646 418.981 70.967 12.243 10.449 19.56 0.9105
15(120%) 5.02 100.00 10.709 414.326 70.204 12.265 10.497 19.882 0.979
15(120%) 5.00 100.02 10.552 418.55 70.846 12.417 10.406 19.407 0.9331
15(120%) 5.00 100.00 10.69 419.337 71.036 12.466 10.629 19.448 1.028
control solution (10%) 5.232 54.574 10.992 9.746 10.508 10.451 2.951
Water
-0.00439 -0.52048 -0.10895 -0.02235 -0.0562 -0.0359 -0.0001
blank unfiltered
-0.02512 -0.46448 -0.08502 -0.04795 -0.0546 -0.0333 0.0212
blank unfiltered
-0.01830 -0.44989 -0.02018 -0.05557 -0.0609 -0.0275 0.0217
control solution (10%) 5.268 54.356 10.95 9.854 10.512 10.413 2.948
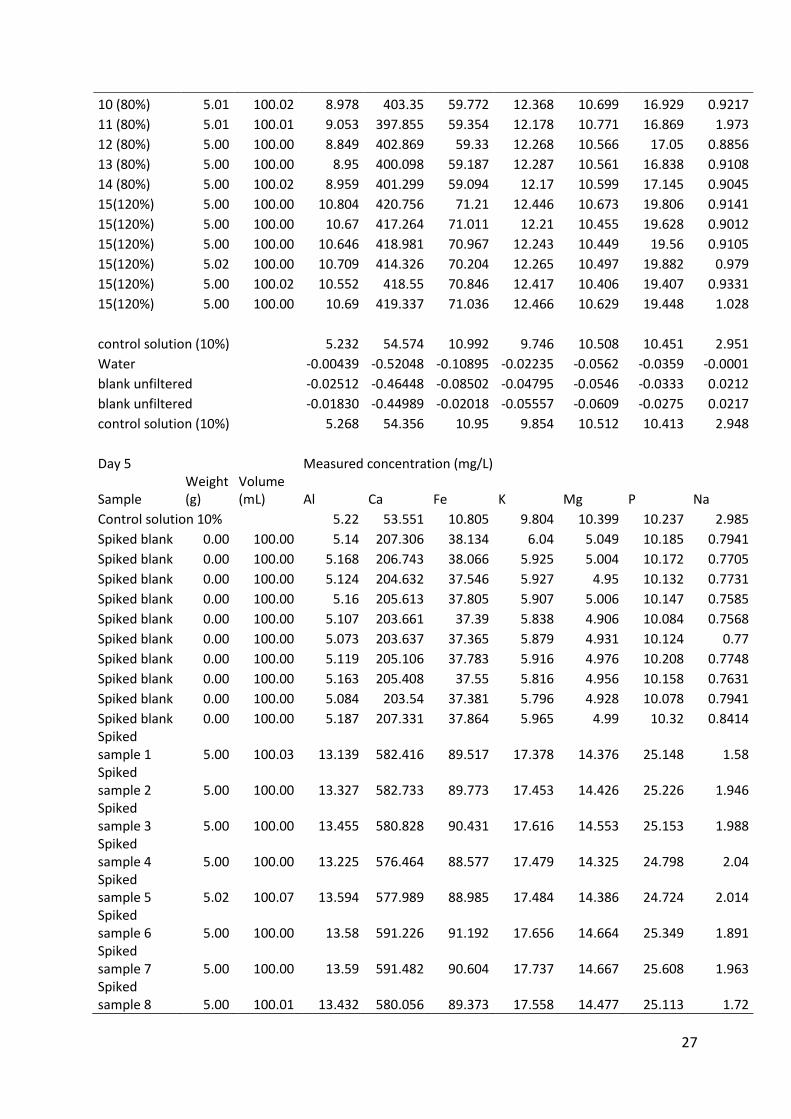
Day 5
Measured concentration (mg/L)
Sample Weight (g)
Volume (mL) Al Ca Fe K Mg P Na
Control solution 10% 5.22 53.551 10.805 9.804 10.399 10.237 2.985
Spiked blank 0.00 100.00 5.14 207.306 38.134 6.04 5.049 10.185 0.7941
Spiked blank 0.00 100.00 5.168 206.743 38.066 5.925 5.004 10.172 0.7705
Spiked blank 0.00 100.00 5.124 204.632 37.546 5.927 4.95 10.132 0.7731
Spiked blank 0.00 100.00 5.16 205.613 37.805 5.907 5.006 10.147 0.7585
Spiked blank 0.00 100.00 5.107 203.661 37.39 5.838 4.906 10.084 0.7568
Spiked blank 0.00 100.00 5.073 203.637 37.365 5.879 4.931 10.124 0.77
Spiked blank 0.00 100.00 5.119 205.106 37.783 5.916 4.976 10.208 0.7748
Spiked blank 0.00 100.00 5.163 205.408 37.55 5.816 4.956 10.158 0.7631
Spiked blank 0.00 100.00 5.084 203.54 37.381 5.796 4.928 10.078 0.7941
Spiked blank 0.00 100.00 5.187 207.331 37.864 5.965 4.99 10.32 0.8414 Spiked sample 1 5.00 100.03 13.139 582.416 89.517 17.378 14.376 25.148 1.58 Spiked sample 2 5.00 100.00 13.327 582.733 89.773 17.453 14.426 25.226 1.946 Spiked sample 3 5.00 100.00 13.455 580.828 90.431 17.616 14.553 25.153 1.988 Spiked sample 4 5.00 100.00 13.225 576.464 88.577 17.479 14.325 24.798 2.04 Spiked sample 5 5.02 100.07 13.594 577.989 88.985 17.484 14.386 24.724 2.014 Spiked sample 6 5.00 100.00 13.58 591.226 91.192 17.656 14.664 25.349 1.891 Spiked sample 7 5.00 100.00 13.59 591.482 90.604 17.737 14.667 25.608 1.963 Spiked sample 8 5.00 100.01 13.432 580.056 89.373 17.558 14.477 25.113 1.72

28
Spiked sample 9 5.02 100.95 13.432 580.056 89.373 17.558 14.477 25.113 1.72 Spiked sample 10 5.00 100.00 13.537 584.315 89.884 17.694 14.581 25.194 1.928 Spiked sample 11 5.00 100.00 13.46 595.675 90.781 17.882 14.687 25.75 1.664 Spiked sample 12 5.01 100.00 13.563 591.123 90.296 17.797 14.63 25.677 1.686 Spiked sample 13 5.00 100.00 14.345 588.535 90.817 18.19 14.775 25.297 1.79 Spiked sample 14 5.00 100.00 13.638 593.053 90.097 17.755 14.586 25.398 1.653
control solution
5.158 52.786 10.587 9.663 10.182 10.205 2.912
Water
< -0.007 < -0.518 < -0.111 < -0.029 < -0.050 < -0.039 < 0.0011
Day 6
Measured concentration (mg/L)
Prov Weight (g)
Volume (mL) Al Ca Fe K Mg P Na
blank 0 100.00 -0.01346 -0.20113 0.018485 -0.0075 -0.0358 -0.0004 0.2586
blank 0 100.00 -0.02718 -0.31342 -0.07282 -0.02698 -0.0472 -0.0312 0.0579
blank 0 100.00 -0.01926 -0.26004 -0.08153 -0.02711 -0.0478 -0.031 0.0481
blank 0 100.00 -0.01919 -0.37667 -0.09082 -0.01598 -0.0476 -0.0325 0.0449
blank 0 100.00 -0.02011 -0.31777 -0.0939 -0.02997 -0.0395 -0.0345 0.0387
blank 0 100.00 -0.02507 -0.37461 -0.09193 -0.0492 -0.0395 -0.0268 0.0323
1 (standard) 5.00 100.00 9.32 397.048 63.839 11.865 10.014 18.006 0.8803
2 (standard) 5.01 100.00 9.355 399.103 63.445 11.816 10.034 17.973 0.893
3 (standard) 5.00 100.00 9.31 400.482 63.629 11.779 9.997 18.033 0.8809
4 (standard) 5.00 100.31 9.323 392.577 62.662 11.789 9.969 17.731 0.8989
5 (standard) 5.00 100.00 10.024 399.259 63.608 12.125 10.142 17.95 0.991
6 (standard) 5.01 100.00 9.389 397.607 62.843 11.922 10.016 17.81 0.8733
7 (standard) 5.00 100.01 9.277 395.793 62.517 11.78 9.974 17.886 0.871
8 (standard) 5.00 100.00 9.433 395.968 63.142 11.807 10.042 17.84 0.903
9 (standard) 5.01 100.00 9.49 397.608 63.491 11.858 10.091 18.12 0.8933 10 (standard) 5.00 100.02 10.26 396.229 63.808 12.37 10.119 17.872 1.042 11 (standard) 5.00 100.00 9.696 397.398 62.957 12.139 10.106 18.241 0.9726 12 (standard) 5.00 100.00 9.47 400.731 63.199 11.881 10.039 18.069 0.9277 13 (standard) 5.01 100.00 9.442 398.784 62.946 11.85 10.051 17.947 0.9335 14 (standard) 5.00 100.00 9.674 399.68 63.739 11.979 10.129 18.374 0.9557
control solution
5.24 53.924 10.847 9.714 10.401 10.341 2.968
Water
< -0.002 < -0.524 < -0.108 < -0.023 < -0.063 < -0.039 < -0.004
Control solution
5.176 54.136 10.817 9.755 10.438 10.379 2.967
A3 Intensity for the single measurements on the blanks used for LOD and LOQ calculations.
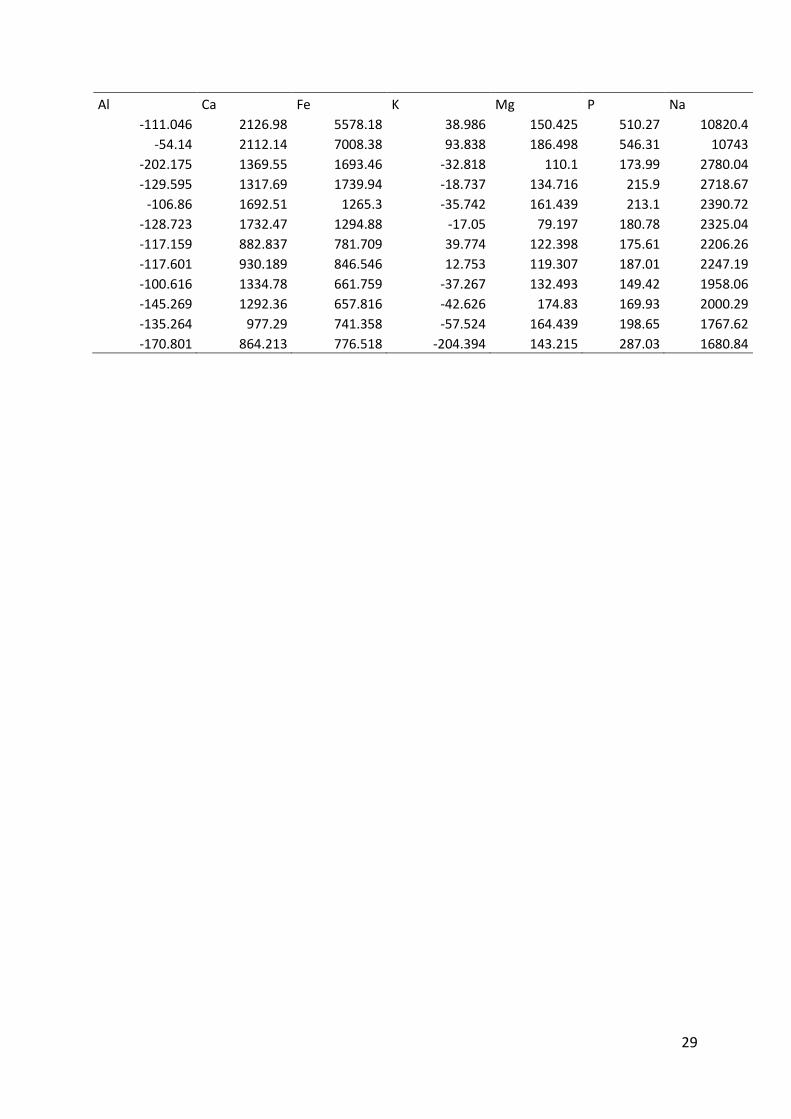
29
Al Ca Fe K Mg P Na
-111.046 2126.98 5578.18 38.986 150.425 510.27 10820.4
-54.14 2112.14 7008.38 93.838 186.498 546.31 10743
-202.175 1369.55 1693.46 -32.818 110.1 173.99 2780.04
-129.595 1317.69 1739.94 -18.737 134.716 215.9 2718.67
-106.86 1692.51 1265.3 -35.742 161.439 213.1 2390.72
-128.723 1732.47 1294.88 -17.05 79.197 180.78 2325.04
-117.159 882.837 781.709 39.774 122.398 175.61 2206.26
-117.601 930.189 846.546 12.753 119.307 187.01 2247.19
-100.616 1334.78 661.759 -37.267 132.493 149.42 1958.06
-145.269 1292.36 657.816 -42.626 174.83 169.93 2000.29
-135.264 977.29 741.358 -57.524 164.439 198.65 1767.62
-170.801 864.213 776.518 -204.394 143.215 287.03 1680.84


