
1
ICUC9 - 9th International Conference on Urban Climate jointly with 12th
Symposium on the Urban Environment, 20-24 July, 2015 Toulouse
Developing fine-scale urban canopy parameters in Guangzhou city and its application in the WRF-Urban model
Xuemei Wang, Wei Dai Sun Yat-Sen University
Guangzhou, China

Introduction
2
Development of city clusters in China
pose a great scientific challenge
Data source: United Nations, Department of Economic and Social Affairs, Population Division (2012).
The world’s cities by size class of urban settlement, in 2014 (world urbanization prospects, UN, 2014)
11,8 13,9 16,2 18,1 17,4 17,4 19,4 22,9
26,4 31,0
35,9 42,5
49,2 55,6
61,0 65,4
68,7 71,3 73,4 75,4 77,3
—
10,0
20,0
30,0
40,0
50,0
60,0
70,0
80,0
90,0
1950 1955 1960 1965 1970 1975 1980 1985 1990 1995 2000 2005 2010 2015 2020 2025 2030 2035 2040 2045 2050
■China
■Globe
The urban population in percentage (Population Division, UN, 2012)

The challenge with Urbanization
3
Urban Heat Island
(UHI)
Extreme weather
and climate events
Heavy air pollution
Changing of LULC
Balance of surface
radiation、 water vapor
and energy
Anthropologic heat
Harm human health Zhang, Q.; He, K.; Huo, H. Nature 2012
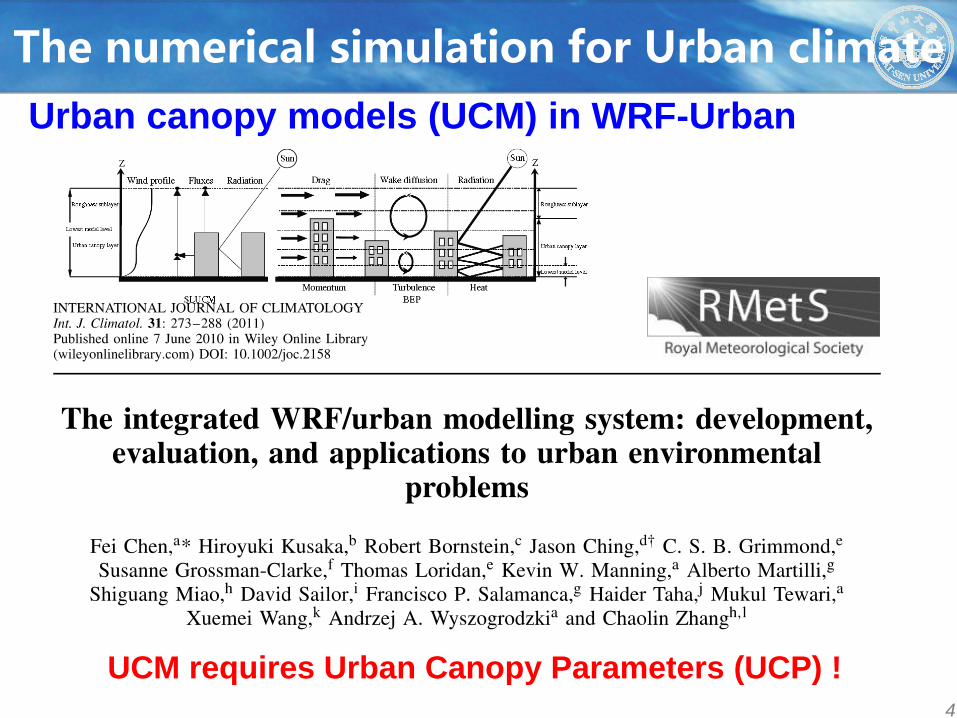
The numerical simulation for Urban climate
4
Urban canopy models (UCM) in WRF-Urban
UCM requires Urban Canopy Parameters (UCP) !

UCPs are available for US (NUDAPT, Ching et al. 2009).
The NBSD was developed by
NUDAPT including data for 44
cities in the USA and it is
available to the WRF-Urban.
(Burian et al., 2007, Ching et al., 2009,
Burian and Ching, 2010)
However, obtaining UCPs remains problematic in the developing countries, especially in China.

Objectives
To establish a methodology to obtain specific
urban morphology for UCM from Google-Earth
images;
To develop a dataset of fine-scale UCPs in
Guangzhou city (GZ-UCPs);
To assess impact of using the new GZ-UCPs
in WRF-UCM on local weather.

Extract building span and height
7
2th Oct 2009 27th Oct 2010
Time series Google-Earth images for the same location
show the building pictures with different solar angle
Similar to the steropair (Kazuhiko AKENO, 1996), we could obtain building span and
height with GIS and RS technologies, and make a 3D map with building models.
α:satellite elevation/off nadir angle; θ:satellite azimuth
α:18°, θ:144° α:19°, θ:68°

Principle of steropair
8
Calculation of building height
Adjustment of roof shift
H: building height, GSD: cell size
θ: azimuth difference between two images α1: satellite1 elevation , α2: satellite2 elevation
H: building height
P: satellite azimuth, θ : satellite elevation
There is a little shift between roof and floor of building, and this shift can be fix by
building height and satellite parameters.

Workflow
9
To download map
tiles
To mosaic the tiles
Geometric correction
Vectorization of the
roof
To calculate the distance
between two related roofs of
satellites
Calculation of building
height
Satellite
Parameters
Adjustment of roof
shift
Roof from image A
Roof from image B
Checking satellite parameters from
https://browse.digitalglobe.com/imagefinder/main.jsp?
Example for Downloading Google earth image from
http://khm1.google.com/kh/v=122&x=213575&y=113771
&z=18
The details of tile encoding algorithm for web map imagery
can be found in
http://msdn.microsoft.com/en-us/library/bb259689.aspx &
http://www.codeproject.com/Articles/14793/How-Google-
Map-Works

Urban morphology parameters
10
Burian et al., 2007, Development and assessment of the second
generation national building statistics database.
• Roof Area
Density:
• Building Frontal Area
Index:
• Frontal Area
Density:
• Complete Aspect
Ratio:
• Building Surface Area to Plan Area Ratio:
• Height-to-Width
Ratio:
• mean building height:
• mean building height weighted by building
plan area:
• building plan area
fraction:
• Building Plan Area
Density:
ℎ = ℎ𝑖
𝑁𝑖=1
𝑁
ℎ 𝐴𝑊 = 𝐴𝑖ℎ𝑖
𝑁𝑖=1
𝐴𝑖𝑁𝑖=1
𝜆𝑝 =𝐴𝑝
𝐴𝑇
𝑎𝑝 𝑧 ≅𝜆𝑝 𝑧
∆𝑧
𝐿 𝑧 = 𝑎𝑟 𝑧′
ℎ𝑐
𝑧
𝑑𝑧′
𝜆𝑓 𝜃 =𝐴𝑝𝑟𝑜𝑗
𝐴𝑇
𝑎𝑓 𝑧,𝜃 =𝐴 𝜃 𝑝𝑟𝑜𝑗 ∆𝑧
𝐴𝑇∆𝑧
𝜆𝑐 =𝐴𝑐
𝐴𝑇=
𝐴𝑊 + 𝐴𝑅 + 𝐴𝐺
𝐴𝑇
𝜆𝐵 =𝐴𝑊 + 𝐴𝑅
𝐴𝑇
𝜆𝑆 = 𝐻1 +𝐻2 2
𝑆12

City cluster of PRD
11
Pearl River Delta(PRD) is one of the largest city clusters
in China, and it includes 9 cities.
Population of built up area was 40 million with an area of about 20,000 km2.
City Area/Core
(km2)
Population
(2010
census)
>5 million
Guangzhou 7,434.4/
279.63 12,700,800
Shenzhen 2,050/
412 10,357,938
Dongguan 115.98/
24.8 8,220,237
Foshan 3,840/
154 7,194,311
Because of the big populations and wide built-up
areas, We chose Guangzhou for testing.

1-km UCPs in Guangzhou
Area weight mean
build height
5m 35m
Distribution of building heights
70m and more
Building Surface to
Plan Area Ratio
Plan Area
Fraction
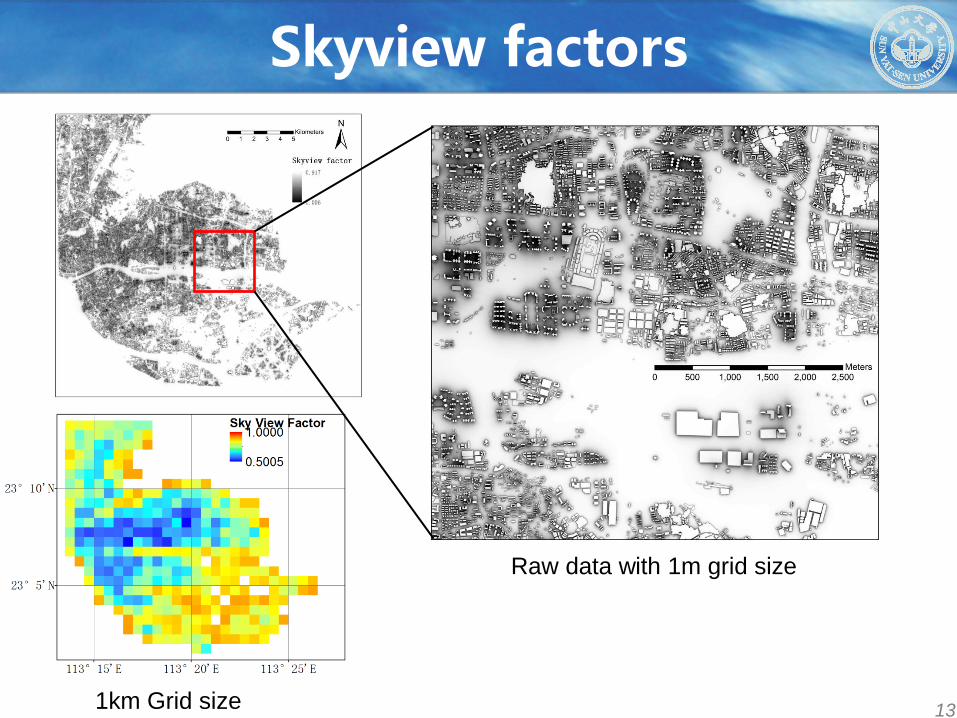
Skyview factors
13 1km Grid size
Raw data with 1m grid size

Ensure consistency
14
http://data.ess.tsinghua.edu.cn/index.html
Urban fraction
1km resolution The global land cover data
2010- 30 m resolution
The urban fraction calculated from ESS2013 (the global land cover database)
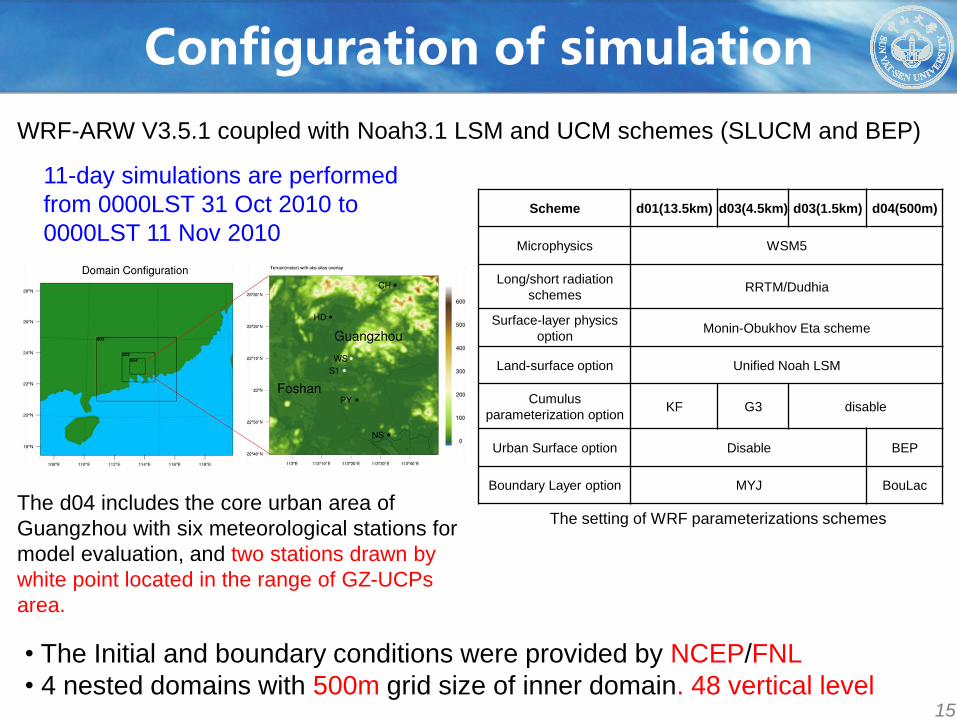
Configuration of simulation
15
Scheme d01(13.5km) d03(4.5km) d03(1.5km) d04(500m)
Microphysics WSM5
Long/short radiation
schemes RRTM/Dudhia
Surface-layer physics
option Monin-Obukhov Eta scheme
Land-surface option Unified Noah LSM
Cumulus
parameterization option KF G3 disable
Urban Surface option Disable BEP
Boundary Layer option MYJ BouLac
WRF-ARW V3.5.1 coupled with Noah3.1 LSM and UCM schemes (SLUCM and BEP)
The setting of WRF parameterizations schemes
11-day simulations are performed
from 0000LST 31 Oct 2010 to
0000LST 11 Nov 2010
The d04 includes the core urban area of
Guangzhou with six meteorological stations for
model evaluation, and two stations drawn by
white point located in the range of GZ-UCPs
area.
• The Initial and boundary conditions were provided by NCEP/FNL
• 4 nested domains with 500m grid size of inner domain. 48 vertical level

UCPs in WRF-urban replaced by GZ-UCPs
16
Model BEP
variable GZ-UCPs (new) URBPARM.TBL (old)
LF_URB2D Plan area fraction LamP Function of Street width & Building
width
HGT_URB2D Area weighted mean
building height awaHT
Function of building Distribution
HI_URB2D Distribution of building
heights Histogram
Building Distribution
5 m : 33 % 10 m : 34 % 15 m : 33 %
LB_URB2D Building surface to
plan area ratio LamB
Function of Street width、 Building width and
Building Distribution
Street width (m) 15
Building width (m) 15
FRC_URB Urban fraction LamU Urban fraction 0.95 %

WRF-Urban Experiment setup
17
Base Case1 Case2
Base Case1 & Case2
• Base: Before rapid
urbanization (USGS 1993)
• Case1: Urbanized
Guangzhou city (MODIS
2001)
• Case2: Urbanized
Guangzhou city with GZ-
UCPs

Time series of wind speed Simulation Vs. Observation
18
Summer
Fall GZ-UCPs is more close to observation
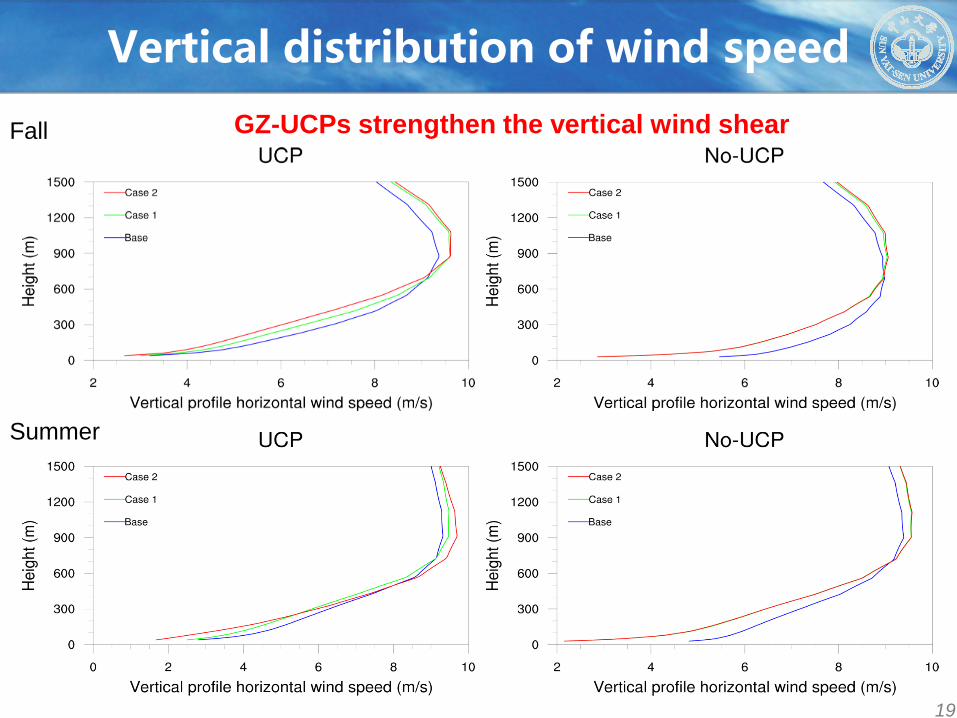
Vertical distribution of wind speed
19
Summer
Fall GZ-UCPs strengthen the vertical wind shear

Vertical section of V wind distribution
20
Base Case1 Case2

Conclusion
21
1. We developed a new framework, based on Google-earth images, to derive comprehensive UCPs for its applications in WRF-Urban in Guangzhou.
2. New UCPs significantly impact WRF-Urban:
Improve high biases in surface wind speed
Increase vertical wind shear, hence affect atmospheric transport
and diffusion
Impact of cities on downwind has increased
Future work:
To enhance efficiency of extracting building span,
To create the urban structure database for the entire PRD city
clusters

22
Thank you !
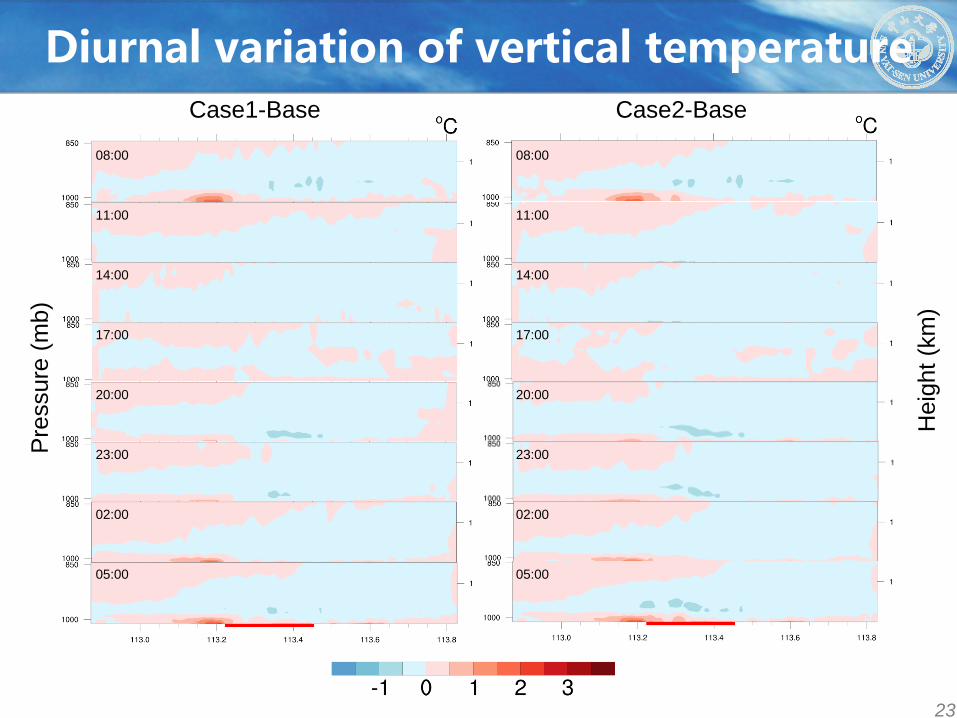
Diurnal variation of vertical temperature
23
Case1-Base
Pre
ssure
(m
b)
08:00
11:00
14:00
17:00
20:00
23:00
02:00
05:00
Case2-Base
Heig
ht
(km
)
08:00
11:00
14:00
17:00
20:00
23:00
02:00
05:00


