
DEVELOPMENT OF A TECHNIQUE TO DETERMINE BLOOD HEMOLYSIS DUE TO LONGER STORAGE AT VARIOUS
VISIBLE LIGHT WAVELENGTHS
by
MADHIYAH BINTI YAHA Y A BERMAKAI
Thesis submitted in fulfillment of the requirements for the degree of
Master of Science
2010
ACKNOWLEDGEMENTS
First of all, thanks to Allah for His blessing that I can complete this study
successfully. Besides that, it is a pleasure to thank those who made this research
possible. I would like to express profound gratitude to my supervisor, Prof. Madya
Mohaniad Suhaimi Jaafar, for his invaluable support, encouragement, supervision
and useful suggestion throughout this research work. His moral support and
continuous guidance from the initial to the final level of this research enable me to
complete my work successfully. I am also highly thankful to Mr. Yahya Ibrahim, lab
assistant of Medical Physics Laboratory and Mr. Azmi Abdullah, lab assistant of
Biophysics Laboratory for giving me their valuable suggestions for my study. They
also give a full cooperation in providing the materials and equipments required
during the experiment.
I am heartily thankful for the cooperation given by Dr. Nurulain Abdullah
Bayanuddin, Director of USM Health Centre by allowing me to obtain the blood
samples and use some instruments in their clinical laboratory. I really appreciate the
kindness of Mr. Yahaya Osman, head of laboratory in Health Centre and also other
lab staffs, Mrs. Aqsoriah Kamaruddin, Mrs. Nurul Ihsan Ishak and Ms. Nurul
Shuhada Osman who were willing to help me throughout this study. They also
contributed some useful comments and information during my data collection that
enabled me to develop more understanding in my study.
Lastly, I am indebted to my parent, Fatimah Sahaid and Yahaya Bermakai
Zakaria for their love and supported throughout my life. I also wish to thank my
sister and my brother for their physically and mentally supported during my study.
II

TABLE OF CONTENTS
Acknowledgements ..... , ............................................................................. i i
Table of contents ..................................................................................... iii
List of tables .......................................................................................... vi
List of figures ................................................................................. '" .,. vi i
List of abbreviations ............................................................................. , .. xi
List of units ......................................................................................... xiii
Abstrak ............................................................................................... xiv
Abstract ............................................................................................. xvi
CHAPTER 1 - INTRODUCTION
1.1 Background ........................................................................................ I
1.1.1 Composition of blood ................................................................. I
1.1.2 Functions of blood cells and plasma ............................................... 5
1.1.3 Blood types and rhesus (Rh) factor ................................................ 7
1.104 Blood hemolysis ..................................................................... 8
1.2 Problems statement.. ........................................................................... 1 I
1.3 Research objectives ............................................................................ 12
1.4 Scope of research ............................................................................... 12
1.5 Outline of thesis ................................................................................. 12
CHAPTER 2 - THEORY AND LITERATURE REVIEW
2.1 Visible light and its optical properties ...................................................... 14
2.2 Spectral absorption in biological tissues; blood ........................................... 17
2.3 Ultrasonic absorption and velocity in biological tissue .................................... 21
2.4 Literature review ...................... , ....................................................... 23
CHAPTER 3 - MATERIALS AND METHODS
3.1 Visible light source ............................................................................. 26
3.2 Blood samples ................................................................................. 27
3.3 Solar Light Unit (Datalogging Radiometer) ................................................ 28
3.4 Blue light safety detector ..................................................................... 30
iii

3.5 Ultrasound A-mode Krautkramer instrument.. ............................................. 31
3.6 Automated hematology analyzer Cell-Dyn 1700 ........................................... 33
3.7 Experimental set up ........................................................................... .36
3.7.1 Solar Light Unit ..................................................................... 36
3.7.2 Ultrasound A-mode Krautkramer (USM 25) instrument.. .................... 37
3.8 Calibrations ..................................................................................... 38
3.8.1 Calibration of Solar Light Unit. .................................................. 38
3.8.2 Calibration of automated hematology analyzer. ................................ 39
3.8.3 Calibration of ultrasound A-mode Krautkramer (USM 25) instrument.. .... 40
3.9 Procedures ......................................................................................... 41
3.9.1 Blood grouping .................................................................... .41
3.9.2 Solar Light Unit ..................................................................... 43
3.9.3 Automated hematology analyzer ................................................. 43
3.9.4 Ultrasound A-mode Krautkramer (USM 25) instrument.. ................... .44
CHAPTER 4 - RESULTS AND DISCUSSIONS
4.1 Whole-blood hemolysis using all light sources via transmittance technique .......... .45
4.2 Whole-blood hemolysis using all light sources via transmittance technique; analysis
by gender ....................................................................................... 48
4.3 Whole-blood hemolysis using all light sources via transmittance technique; analysis
by age ............................................................................................ 55
4.4 Whole-blood hemolysis using all light sources via transmittance technique; analysis
by ethnic ....................................................................................... 62
4.5 Whole-blood hemolysis using all light sources via transmittance technique; analysis
by blood group ............................. , ..................................... , ............. 69
4.6 Changes in complete blood count (CBC) of whole-blood up to 25 days ............... 76
4.7 Hemolysis from CBC and its correlation with light transmittance ..................... 83
4.8 Hemolysis level in whole-blood sample using ultrasonic technique .................... 86
iv

CHAPTER 5 - CONCLUSIONS AND FURTHER WORK
5.1 Conclusions ........................................................ , ................................. 90
5.2 Further work ........ , ............................................................... '" ......... 91
REFERENCES ...................................................................................... 93
LIST OF PUBLICATIONS ........................................................................ 97
APPENDICES
Appendix A Variations of several light transmittances at distance of 12 to 50 cm
Appendix B Multiple comparisons between days in blood count
Appendix C Multiple comparison of several variables in ultrasonic velocity
v

LIST OF TABLES
Page
Table 1.1 Summary of formed elements in blood and their functions 5
Table 1.2 Substances in blood plasma and their functions 6
Table 1.3 Blood types determined by the ABO blood group antigens 7
present on RBCs
Table 1.4 Effect of hemolysis on some chemistry test result 9
Table 2.1 Range of wavelengths for visible spectrum 14
Table 3.1 Visible light source with their corresponding wavelength 26
Table 3.2 Specifications of PMA2121 31
Table 3.3 Specifications of Ultrasound A-mode Krautkramer (USM 25) 32
Table 3.4 Determination of blood group (type) based on combination of 42
anti-A and anti-B
Table 4.1 R2 values for transmittance of all light sources 45
VI

LIST OF FIGURES
Page
Figure 1.1 Composition of blood 2
Figure 1.2 Constituents of blood 2
Figure 1.3 Red blood cells with and without hemolysis 9
Figure 2.1 Relative absorption of visible range in blood 17
Figure 2.2 Penetration of UV, visible and IR range in the skin 18
Figure 2.3 Incident intensity, 10 passes through the solution with 19
concentration C at thickness I. I is transmitted intensity
Figure 2.4(a) Percentage of light transmittance T versus concentration C 20
Figure 2.4(b) Absorbance A of light versus concentration C 20
Figure 2.5 A-mode ultrasound display with the two spikes A and B 22
Figure 3.1 Gas discharge lamp as a light source 26
Figure 3.2 Lavender stopper blood collection tube filled with human 28
blood
Figure 3.3 Datalogging Radiometer PMA21 00 29
Figure 3.4 Description of PMA meter operation 29
Figure 3.5 Blue Light Safety Detector PMA2121 31
Figure 3.6 Ultrasound A-mode Krautkramer (USM 25) 32
Figure 3.7 Hematology Analyzer Cell-Dyn 1700 with colour monitor 34
and full keyboard
Figure 3.8 Operating principle of automated hematology analyzer 35
Figure 3.9 Experimental set up for Solar Light Unit 36
Figure 3.10 Experimental set up for Ultrasound Krautkramer (USM 25) 38
Figure 3.11 Apparatus used for blood grouping test 41
Vll

Figure 3.12 Microscope slide divided into 3 parts for blood drops prior 42
testing blood groups
Figure 4.1 Percentage of light transmittances for various light sources 47
Figure 4.2 Variations of Zn light transmittance with gender 50
Figure 4.3 Variations of Hg light transmittance with gender 51
Figure 4.4 Variations of Cd light transmittance with gender 51
Figure 4.5 Variations of In light transmittance with gender 52
Figure 4.6 Variations of He light transmittance with gender 53
Figure 4.7 Variations ofNa light transmittance with gender 54
Figure 4.8 Variations of Kr light transmittance with gender 54
Figure 4.9 Variations of Ar light transmittance with gender 55
Figure 4.10 Variations of Zn light transmittance with age 57
Figure 4.11 Variations of Hg light transmittance with age 57
Figure 4.12 Variations of Cd light transmittance with age 58
Figure 4.13 Variations of In light transmittance with age 59
Figure 4.14 Variations of He light transmittance with age 60
Figure 4.15 Variations ofNa light transmittance with age 60
Figure 4.16 Variations of Kr light transmittance with age 61
Figure 4.17 Variations of Ar light transmittance with age 61
Figure 4.18 Variations of Zn light transmittance with ethnics 64
Figure 4.19 Variations of Hg light transmittance with ethnics 64
Figure 4.20 Variations of Cd light transmittance with ethnics 65
Figure 4.21 Variations of In light transmittance with ethnics 66
Figure 4.22 Variations of He light transmittance with ethnics 67
Figure 4.23 Variations ofNa light transmittance with ethnics 67
viii

Figure 4.24 Variations of Kr light transmittance with ethnics 68
Figure 4.25 Variations of Ar light transmittance with ethnics 68
Figure 4.26 Variations of Zn light transmittance with blood group 70
Figure 4.27 Variations of Hg light transmittance with blood group 71
Figure 4.28 Variations of Cd light transmittance with blood group 73
Figure 4.29 Variations ofIn light transmittance with blood group 73
Figure 4.30 Variations of He light transmittance with blood group 74
Figure 4.31 Variations ofNa light transmittance with blood group 74
Figure 4.32 Variations of Kr light transmittance with blood group 75
Figure 4.33 Variations of Ar light transmittance with blood group 75
Figure 4.34 Count of WBCs and its differentials 77
Figure 4.35 Hemoglobin count in 25 days 78
Figure 4.36 Counts of HCT and MCHC in 25 days 79
Figure 4.37 Mean cell volume (MCV) of red cell in 25 days 80
Figure 4.38 Mean cell hemoglobin (MCH) in 25 days 81
Figure 4.39 FHP counts in 25 days 82
Figure 4.40 Platelet count in 25 days 82
Figure 4.41 Percentage of hemolysis versus time (days) of sample 83
Figure 4.42 Light transmittance of all light sources versus hemolysis 85
Figure 4.43 Light transmittance of Zn, Hg, Cd and In versus hemolysis 85
Figure 4.44 Ultrasonic velocities as a function of time storage of the 87
sample (day) for male and female
Figure 4.45 Ultrasonic velocities as a function of time storage of the 88
sample (day) for each blood group
ix

ADC
ALP
ALT
A-mode
ANOYA
Ar
AST
B-mode
CBC
Cd
CK
CPDA
DC
EDTA
FHP
GGT
GRAN
HCT
He
Hg
HGB
In
LIST OF ABBREVIATIONS
Analog-to-digital converter
Alkaline phosphatase
Alanine transaminase
Amplitude mode
Analysis of variance
Argon
Aspartate transaminase
Brightness mode
Complete blood count
Cadmium
Creatine kinase
Citrate phosphate dextrose anticoagulant
Direct current
Ethylenediamine tetraacetic acid dipotassium salt
Free hemoglobin plasma
y-glutamyl transferase
Granulocytes
Hematocrit
Helium
Mercury
Hemoglobin
Indium
xi
IR Infrared
Kr Krypton
LCD Liquid crystal display
LOH Lactate dehydrogenise
LYM Lymphocytes
MCH Mean cell hemoglobin
MCHC Mean cell hemoglobin concentration
MCV Mean cell volume
M-mode Motion mode
MPV Mean platelet volume
Na Natrium
PCT Platelet crit
PCV Packet cell volume
POW Platelet distribution width
PLT Platelet
RBC Red blood cell
ROW Red blood cell distribution width
Rh Rhesus
SO Standard deviation
UV Ultraviolet
WBC White blood cell
Zn Zinc
xii

LIST OF SI UNITS
UNIT SYMBOL UNIT NAME QUANTITY
~L microliter Volume
~m micrometer Length
~W/cm2 micro watt per centimeter Irradiance
square
°c degree Celsius Temperature
cm centimeter Length
tL femtoliters Volume
g gram Mass
g/dL gram per decilitre Mass per volume
concentration
k1~L thousand per microliter Count per volume
kHz kilohertz Frequency
rn/s meter per second velocity
MHz megahertz Frequency
mm millimeter Length
nm nanometer Length
pg picograms Mass
V volt Voltage
xiii

PEMBANGUNAN TEKNIK BAGI MENENTUKAN HEMOLISIS DARAH
DISEBABKAN PENYIMPANAN LAMA PADA PELBAGAI JARAK
GELOMBANG CAHA Y A NAMP AK
ABSTRAK
Kaedah piawai makmal klinikal untuk menentukan hemolisis darah adalah
dengan menggunakan emparan dan kemudian pemeriksaan visual dilakukan ke at as
hasil pecahan plasma sarna ada ia telah tercemar atau tidak. Pada masa ini, masih
tidak kedapatan kaedah yang praktikal untuk menentukan hemolysis secara terus ke
atas darah. Tujuan penyelidikan ini adalah untuk membangunkan teknik bagi
menentukan hemolisis pada keseluruhan darah disebabkan penyimpanan yang lama
pada jarak gelombang cahaya narnpak dan juga mengkaji faktor-faktor yang
menjejaskan pola-pola penyerapan dan pemancaran cahaya yang disebabkan oleh
proses hemolisis. Pelbagai jenis kumpulan darah ABO telah diambil daripada 100
pasien dari Pusat Sejahtera USM. Lapan sumber cahaya dengan jarak gelombang
dalam julat 300 nm hinnga 700 nm digunakan untuk dipancarkan ke atas sampel
darah. Bacaan keamatan cahaya yang melalui darah dikesan dan bilangan sel-sel
darah juga diperolehi menggunakan mesin analisa hematologi untuk 25 hari berturut
turut. Penemuan menunjukkan kepekatan plasma hemoglobin bebas dan terbitan sel
darah merah penting dalam penyerapan dan pemancaran gelombang cahaya nampak,
oleh itu, mampu menunjukkan tahap hemolisis dalarn sarnpel darah. Penyelidikan ini
berguna untuk menentukan sarna ada darah telah mengalarni hemolisis dan dapat
menunjukkan tahap hemolisis apabila diuji pada keseluruhan darah. Tarnbahan,
teknik ini boleh digunakan di mana emparan tidak boleh didapati.
xiv

DEVELOPMENT OF A TECHNIQUE TO DETERMINE BLOOD
HEMOL YSIS DUE TO LONGER STORAGE AT VARIOUS
V ASIBLE LIGHT WAVELENGTHS
ABSTRACT
Standard clinical laboratory method for determining blood hemolysis is to
spin the sample in centrifuge and then, visually examine the plasma fraction being
contaminated or not. Currently, there is no practical method for determining whether
a sample is hemolyzed which operates on whole-blood. The purpose of this research
is to develop a technique to determine blood hemolysis due to longer storage at
various visible light wavelengths and also to study the factors that affect the patterns
of light absorption and transmission caused due to the hemolysis. Various types of
ABO blood group samples were taken from 100 patients in the USM Health Centre.
Eight different light sources with wavelengths in the range of 300 nm to 700 nm
were used to irradiate the. Intensity readings were detected through the blood and the
count of the blood cells were also acquired for 25 consecutive days using the
automated hematology analyzer. The finding shows that concentration of free
hemoglobin plasma and red blood cells derivatives play an important role in
absorbance and transmittance of visible light wavelengths, thus, indicated the level of
hemolysis in the whole-blood sample. This research is useful in determining whether
the blood sample is hemolyzed and also can indicate the level of the hemolysis when
tested on the whole-blood. Furthermore, this technique can be used where a
centrifuge is not available.
xv

1.1 Background
1.1. I Composition of blood
CHAPTER 1
INTRODUCTION
Blood is a complex and unique fluid of variable composition through the
heart, arteries, capillaries, and veins, known as the vascular system of the body. It is
a tissue in which cellular constituents are suspended in liquid medium performing
specialized functions. As with other suspensions, the components of blood can be
separated by filtration, however, the most common method of separating blood is to
centrifuge (spin) it. Three layers are visible in centrifuged blood as shown in
Figure 1.1.
Blood is composed of two main parts, the straw-coloured liquid portion called
plasma and the other part is formed elements composed of blood cells. Plasma makes
up 55% of the blood. The main plasma protein groups are albumins, globulins, and
fibrinogens. The primary gases in plasma are oxygen, carbon dioxide, and nitrogen
(John C. Da Costa, 1905). The blood cells are suspended in the plasma, making up
approximately 45% of total blood volume and include erythrocytes or red blood cells
(RBCs), leukocytes or white blood cells (WBCs), and thrombocytes or platelets
(PLTs). Figure 1.2 shows details of blood constituents. Blood cells consist of 99%
red blood cells, with white blood cells and platelets making up the remainder. The
average pH value of blood is 7.40. Blood is slightly denser and approximately 3-4
times more viscous than water. Blood volume is variable, but tends to be about 8% of
body weight. Factors such as body size, amount of adipose tissue, and electrolyte
concentrations all affect volume. The average adult has about 5 liters of blood.
1

Fonned
elements
Plasma
!LeUkocytes and thrombocytes
Erythrocytes ----..
Figure 1.1 Composition of blood (National Cancer Institute, 2008).
Whole Blood
Plasma /' "" Formed Elements
/ plaL,s \ Erythrocytes
Ami~ 1\\ ~genous acids waste
Nutrients Electrolytes Leukocytes
Proteins Gases
/~ Alb"Tnnogen
Globulins
Granulocytes Agranulocytes
Neutrophils Basophils /~ Lymphocytes Monocytes
Esinophils
Figure 1.2 Constituents of blood (virtual cancer centre, 2002).
a. Erythrocytes (RBCs)
Erythrocytes are filled with hemoglobin (Hb), a biomolecules that can bind to
oxygen. They take up oxygen in the lungs or gills and release it while squeezing
through the body's capillaries. The blood's red colour is due to the colour of
hemoglobin. In humans, RBCs develop in bone marrow; take the form of flexible
biconcave disks, non-nucleated, and the ability to synthesize protein. RBCs have an
average life span only about 120 days (Tortora & Derrickson, 2006).
2

A typical human RBC disk has a diameter of 6-8 ).lm and a thickness of 2 ).lm,
much smaller than most other human cells. A normal RBC has a volume 90 fL.
About a third of that volume is hemoglobin, a total of 270 million hemoglobin
molecules, which each carrying four heme groups whose iron atoms temporarily link
to oxygen molecules in the lungs or gills and release them throughout the body (Don
& Timothy, 2004).
Adult humans have roughly 2_3xlO 13 RBCs at any given time; women have
about 4 to 5 million erythrocytes per microliter or blood and men about 5 to 6 million;
people living at high altitudes with low oxygen tension will have more. In humans,
hemoglobin in the RBCs is responsible for the transports most of the oxygen and part
of the carbon dioxide in the blood (Tortora & Derrickson, 2006).
b. Leukocytes (WBCs)
Leukocytes are commonly known as white blood cells (WBCs) because of
their lack of colour in unstained preparations. WBCs are cells of the immune system
defending the body against both infection disease and foreign materials. They are
nucleated cells that have an average diameter of 8 to 12 ).lm. The number of WBCs in
the blood is often an indicator of disease. There are normally between 4x 1 09 and
11 x 1 09 white blood cells in a liter of blood, making up approximately 1 % of blood in
a healthy adult (Alberts et aI., 2008). They can be divided into granulocytes and
agranulocytes. The former have cytoplasms that contain organelles that appear as
coloured granules through light microscopy. Granulocytes consist of neutrophils,
eosinophils and basophils. In contrast, agranulocytes do not contain granules. They
3
consist of lymphocytes and monocytes (Sherwood, 2004). They are differentiated by
the specific nuclear and cytoplasmic staining properties.
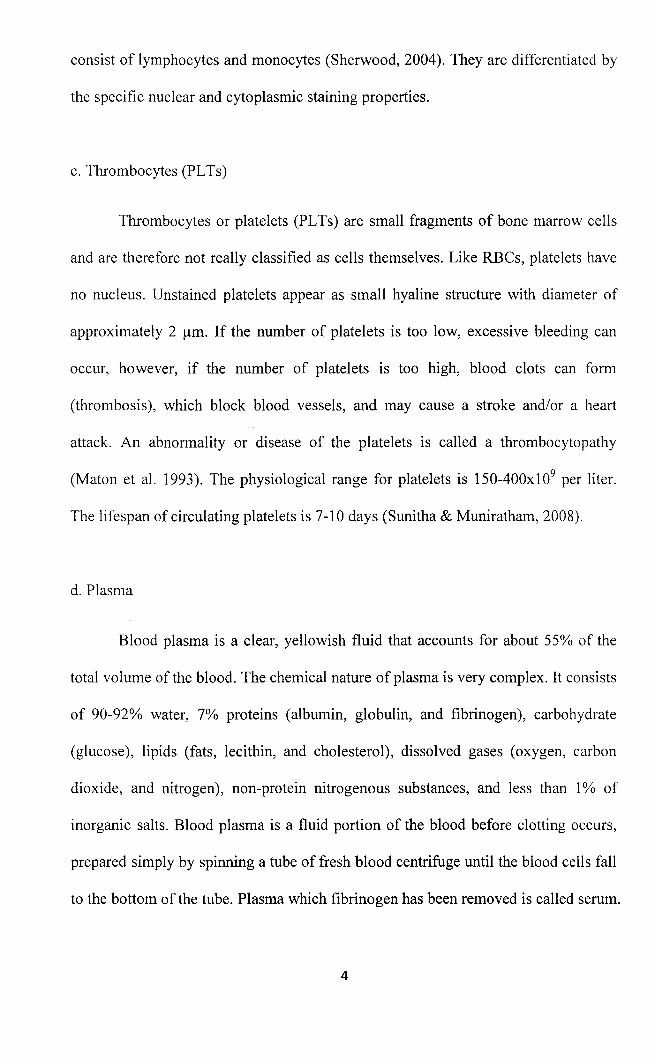
c. Thrombocytes (PLTs)
Thrombocytes or platelets (PLTs) are small fragments of bone marrow cells
and are therefore not really classified as cells themselves. Like RBCs, platelets have
no nucleus. Unstained platelets appear as small hyaline structure with diameter of
approximately 2 /lm. If the number of platelets is too low, excessive bleeding can
occur, however, if the number of platelets is too high, blood clots can form
(thrombosis), which block blood vessels, and may cause a stroke and/or a heart
attack. An abnormality or disease of the platelets is called a thrombocytopathy
(Maton et al. 1993). The physiological range for platelets is 150-400x 1 09 per liter.
The lifespan of circulating platelets is 7-10 days (Sunitha & Muniratham, 2008).
d. Plasma
Blood plasma is a clear, yellowish fluid that accounts for about 55% of the
total volume of the blood. The chemical nature of plasma is very complex. It consists
of 90-92% water, 7% proteins (albumin, globulin, and fibrinogen), carbohydrate
(glucose), lipids (fats, lecithin, and cholesterol), dissolved gases (oxygen, carbon
dioxide, and nitrogen), non-protein nitrogenous substances, and less than 1 % of
inorganic salts. Blood plasma is a fluid portion of the blood before clotting occurs,
prepared simply by spinning a tube of fresh blood centrifuge until the blood cells fall
to the bottom of the tube. Plasma which fibrinogen has been removed is called serum.
4

Blood and separated serum are the most common specImens taken to
investigate the etiology of communicable diseases. Blood is also separated into
serum for the detection of genetic material, specific antibodies, antigens, or toxin
(Caribbean Epidemiology Centre, 2006). For processing of most specimens for
diagnosis of viral pathogens, generally, serum is preferable to unseparated blood.
1.1.2 Functions of blood cells and plasma
Each component of blood is uniquely capable of performing one or more
functions. Together, these components provide the maintenance of a relative
biological constancy or integrity and are known as homeostasis. Once the blood cells
reach full maturity, they enter the bloodstream and begin fulfilling their functions.
Tables 1.1 and 1.2 (Tortora & Derrickson, 2006) summarize the functions of formed
elements in blood and blood plasma respectively.
Table 1.1 Summary of formed elements in blood and their functions.
Formed elements Functions
Erythrocytes (RBCs) Hemoglobin within RBCs transports most of the oxygen and part of the carbon dioxide in the blood.
Leukocytes (WBCs) Combat pathogens and other foreign substances that enter the body.
Granular leukocytes Neutrophils Phagocytosis. Destruction of bacteria with lysozyme,
de fens ins and strong oxidants, such as superoxide anion, hydrogen peroxide and hypochlorite.
Eosinophils Combat the effects of histamine in allergic reactions, phagocytise antigen - antibody complexes and destroy certain parasitic worms.
Basophils Liberate heparin, histamine and serotonin in allergic reactions that intensify the overall inflammatory response.
5

Table 1.1 Continued
Formed elements Functions
Agranular leukocytes
Lymphocytes Mediate immune responses, including antigen - antibody reactions. B cells develop into plasma cells, which secrete
(T cells, B cells and antibodies. T cells attack invading viruses, cancer cells and natural killer cells) transplanted tissue cells. Natural killer cells attack a wide
variety of infectious microbes and certain spontaneously arising tumor cells
monocytes Phagocytosis (after transforming into fixed or wandering macrophages)
Thrombocytes Form platelet plug in homeostasis; release chemicals that (PLTs) promote vascular spasm and blood clotting
Table 1.2 Substances in blood plasma and their functions.
Constituent Functions
Water (91.5%) Acts as solvent and suspending medium for components of blood; absorb, transport and released heat.
Plasma Protein Exert colloid osmotic pressure, which helps maintain water (7.0%) balance between blood and tissue and regulates blood
volume.
Albumins Smallest and most numerous blood plasma proteins; functions as transport protein for several steroid hormones and for fatty acids.
Globulins Antibodies (immunoglobulins) help attack viruses and bacteria. Alpha and beta globulins transport iron, lipids and fat-soluble vitamins.
Fibrinogen Plays essential role in blood clotting
Other solutes (1.5%)
Electrolytes Helps maintain osmotic pressure and play essential roles in the function of cells
Nutrients Products of digestion pass into blood for distribution to all body cells
Gases, regulatory substances and waste products
6

1.1.3 Blood types and rhesus (Rh) factor
The differences in human blood are due to the presence or absence of certain
protein molecules called antigens and antibodies. The antigens are located on the
surface of the RBCs and the antibodies are in the blood plasma. Individuals have
different types and combinations of these molecules. The blood groups belong to
depends on inheritance from parents. According to the ABO blood typing system
there are four different kinds of blood types: A, B, AB, or 0 (Table 1.3) (Marieb &
Hoehn, 1998).
Table 1.3 Blood types detennined by the ABO blood group antigens present on RBCs (National Cancer Institute, 2008).
Group A Group B Group AB Group 0
RBC type antigen -I Binti
9"
A "tibOd! ~ A "tibody
A antigen ~ ... B antibody
Antibodies Anti-B Anti-A None Anti-A and Anti-B
A antigens B antigens AandB None
Many people also have a so called Rh factor on the red blood cells surface.
This is also an antigen and those who have it are called Rh+ and Rh- for those
without. A person with Rh- blood does not have Rh antibodies naturally in the blood
plasma, however, Rh antibodies can be develop in the blood plasma if he or she
receives blood from a person with Rh+ blood, whose Rh antigens can trigger the
production of Rh antibodies. A person with Rh+ blood can receive blood from a
person with Rh- blood without any problems.
7

Figure 1.3 Red blood cells with (right) and without (left and middle) hemolysis.
In vitro hemolysis is often graded as mild, moderate or gross. A slight
hemolysis has little effect on most test values. The gross hemolysis causes a slight
dilutional effect on analytes present at a lower concentration in the red cells
compared to plasma. However, a marked elevation may be observed for analytes
present at a higher concentration in red cells than in plasma. Table 1.4 displays the
effect of hemolysis on some chemistry test result (Calgary Laboratory Services,
2005).
Table 1.4 Effect of hemolysis on some chemistry test result.
Degree of change in Test result increased by Test result decreased by analyte hemolysis hemolysis
Slight change Phosphate, Total Protein, Haptoglobin, Bilirubin Albumin, Magnesium, Calcium, Alkaline Phosphatase (ALP)
Noticeable change ALT, CK, iron Thyroxine (T4)
Significant change Potassium (K +), Lactate Troponin T Dehydrogenise (LDH), AST, free hemoglobin in plasma
9

In vivo, red cells are carried and protected by the plasma, which helps to
regulate the body temperature, controlled pH, adequate glucose supply and removed
of metabolic waste. In the protected environment, the life span of the red cells is
about 120 days. In vitro, series of changes occur that alters the physiological
properties. To ensure that blood retains its in vivo environment involves
anticoagulants, preservative, storage temperature, shipping and transport conditions.
Lowering of the storage temperature and adding the preservatives do help in
reducing the changes but changes do occur and known as storage lesion (Christopher
et aI., 2001).
Clinical laboratories must improve the preanalytical phase, a phase highly
susceptible to mistakes (Jones, 1997). In some reports, hemolyzed specimens, the
most common reason for rejection, account for nearly 60% of rejected specimens,
fivefold more than the second most common cause (Plebani & Carraro, 1997). It is
suggested that appropriate analytical methods be used to quantify the levels of
hemoglobin in the blood samples. This will avoid unnecessary rejection of blood
samples that are within the acceptable level that is recognized by regulatory agencies
for the licensure of additive solutions for the long-term storage ofRBCs.
Since the colour of the blood sample changes due to the hemolysis, visible
light sources with photometer will be used to study the level of blood hemolysis as a
reversible and non destructive testing method to the blood. Besides that, this research
will focused on the prolong storage hemolysis using the light transmittance and
absorbance technique in the whole blood sample. So, the different between intensity
of light transmission will reveal.
10

1.2 Problems statement
The most common causes of hemolyzed specimens are improper specimen
collection, storage or transport. Specific examples include forceful aspiration during
venipuncture, prolonged tourniquet time, vigorous shaking or mixing, centrifugation
of a serum specimen before completion of clotting, and prolonged storage or delayed
transport at room temperature.
The standard clinical chemistry laboratory method for determining if a blood
sample has significant hemolysis is to spin the sample in a centrifuge to separate the
plasma fraction from the red blood cells, and then visually examine the plasma
fraction. Hemolysis results in the plasma fraction being contaminated with
hemoglobin, which gives an obvious red colour to the otherwise yellow plasma. In a
typical clinical chemical laboratory, virtually all blood tests performed are based on
plasma measurements (Davis, 1995). Accordingly, centrifuging the blood sample is
a satisfactory procedure to determine hemolysis in the clinical laboratory. On the
other hand, centrifugation process itself generates heat that can cause unnecessary
damage to the cells which means it is a destructive and non-reversible process to the
sample. In general, operational costs for a centrifuge are relatively low, but the
machines themselves are expensive to purchase and maintain.
Currently, there is no practical method for determining whether a blood
sample is hemolyzed when tested with any analytical system which operates on
whole-blood as a non-destructive process, and is used at the patient's bedside, where
a centrifuge is not available. So, this research will encompass a method of estimating
the concentration of hemoglobin in a whole-blood sample, and correspondingly, the
number of hemolyzed red blood cells per unit volume or concentration of hemolyzed
11

red blood cells in a whole-blood sample by using the light absorbance and
transmittance technique.
1.3 Research objectives
This study aims to have three objectives. Firstly, is to develop a technique to
determine blood hemolysis due to longer storage at various visible light wavelengths.
Secondly, is to study the effect of light absorption on blood hemolysis with time and
lastly to study the effect of light transmission on blood hemolysis with time.
1.4 Scope of research
The blood samples to be used in this research will be fresh human blood
samples from the patients who are either students or staff in the Universiti Sains
Malaysia. Chronic or problematic blood patients will be excluded from this research.
Visible light of wavelengths between 300 nm and 700 run will be employed
to irradiate the blood samples. A-mode ultrasound will be utilized to measure the
ultrasound velocity in the hemolysed blood samples. Hematology analyzer will be
used to measure the complete blood count for 25 days consecutively.
1.5 Outline of thesis
This thesis is divided into several chapters. The chapter on introduction
includes general background of research, problems of research, research objectives,
scope of research and the outline of each chapter in this thesis.
12

Chapter 2 is mainly concern about some theory of this research. It includes
the theory of visible light and its optical properties, spectral absorption by human
blood and also about ultrasonic absorption and velocity in biological tissue. This
chapter also includes literature review on previous and current research.
The following chapter mentions the equipments employed in this experiment.
The features and functions of each equipment are included in this chapter.
Chapter 4 highlights the procedure of each experiment, beginning with the
selections of the materials and samples, preparations of the samples and finally the
details of the experimental setup and calibration. Chapter 5 will focus on the results
and discussion and also the finding of this research. The conclusion appears in
Chapter 6 with suggestions on further work.
13
CHAPTER 2
THEORY AND LITERATURE REVIEW
2.1 Visible light and its optical properties
The visible spectrum is the portion of the electromagnetic spectrum that is visible
to or can be detected by the human eye. A typical human eye will respond to wavelength
from about 380 to 750 nm (Cecie, 2003). A light-adapted eye generally has its maximum
sensitivity at around 555 nm, in the green region of the optical spectrum.
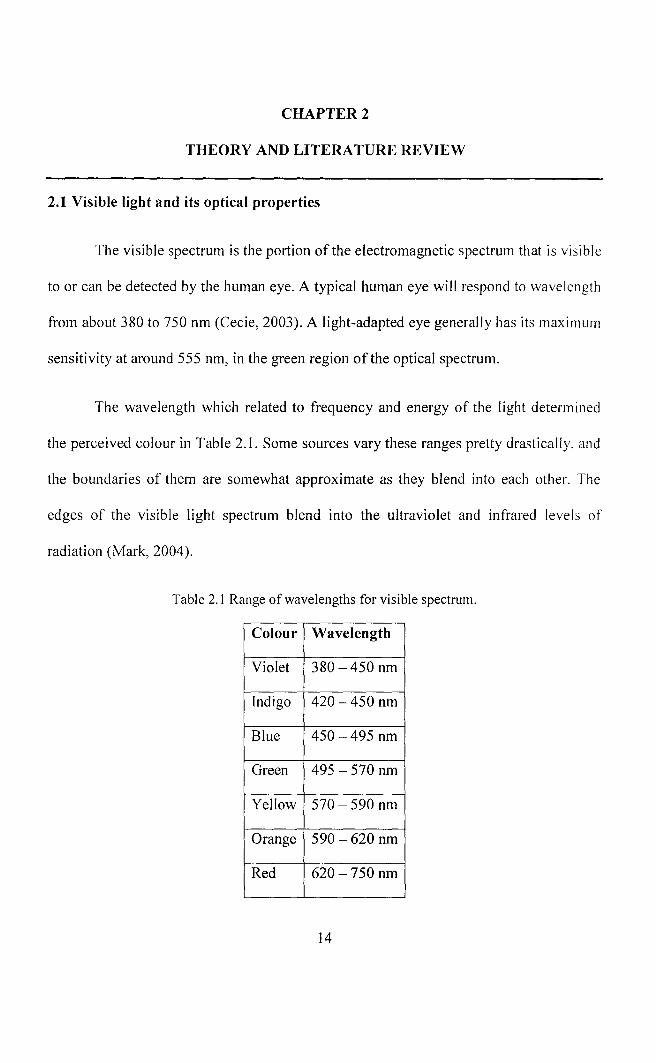
The wavelength which related to frequency and energy of the light determined
the perceived colour in Table 2.1. Some sources vary these ranges pretty drastically, and
the boundaries of them are somewhat approximate as they blend into each other. The
edges of the visible light spectrum blend into the ultraviolet and infrared levels of
radiation (Mark, 2004).
Table 2.1 Range of wavelengths for visible spectrum.
Colour Wavelength
Violet 380 -450 nm
Indigo 420 -450 nm
Blue 450 -495 nm
Green 495 - 570 nm
Yellow 570 - 590 nm
Orange 590 -620 nm
Red 620-750 nm
14

Visible light waves consist of a continuous range of wavelengths or frequencies.
When a light wave with a single frequency strikes an object, a number of things could
happen. The light wave could be absorbed by the object, in which case its energy is
converted to heat. The light wave could also be reflected or transmitted by the object.
It is more usual that visible light of many frequencies or even all frequencies are
incident towards the surface of objects. When this occurs, objects have a tendency to
selectively absorb, reflect or transmit light of certain frequencies. That is, one object
might reflect green light while absorbing all other frequencies of visible light. Another
object might selectively transmit blue light while absorbing all other frequencies of
visible light. The manner in which visible light interacts with an object is dependent
upon the frequency of the light and the nature of the atoms of the object. The absorbance
of a sample is proportional to the thickness of the sample and the concentration of the
absorbing species in the sample.
Reflection and transmission of light waves occur because the frequencies of the
light waves do not match the natural frequencies of vibration of the objects. When light
waves of these frequencies strike an object, the electrons in the atoms of the object begin
vibrating. But instead of vibrating in resonance at large amplitude, the electrons vibrate
for brief periods of time with small amplitudes of vibration; then the energy is reemitted
as a light wave. If the object is transparent, then the vibrations of the electrons are
passed on to neighbouring atoms through the bulk of the material and reemitted on the
opposite side of the object. Such frequencies of light waves are said to be transmitted. If
the object is opaque, then the vibrations of the electrons are not passed from atom to
15

atom through the bulk of the material. Rather the electrons of atoms on the material's
surface vibrate for short periods of time and then reemit the energy as a reflected light
wave (Henderson, 1996).
A relationship between the absorption of light in a purely absorbing medium and
the thickness of the medium was first determined by Bouguer (1729). Some years later
Lambert (1760) derived mathematical expression for the relationship, known as the
Lambert-Bouguer Law or Beer-Lambert Law which describes how successive layer dl of
the medium absorbs the same fraction dl I I of the incident intensity I for a constant /.la,
the latter known as the absorption coefficient with units ofmm'l.
Thus,
ell T = lia dl
(2.1 )
For incident intensity 10, therefore, the transmitted intensity I through a distance or
thickness I will be
(2.2)
From equation (2.2), the transmittance T and absorbance A can be calculated by;
T = IlIa (2.3)
A = Log (1/T) (2.4)
The percentage of transmission is
% T = IlIa x 100 (2.5)
16

2.2 Spectral absorption in biological tissues; blood
Most colours in biological tissues arise from natural pigments. A pigment is a
molecule that absorbs visible light of a certain colour. Heme, the molecule in blood that
makes it red, absorbs blue and green light. Only red light passes through or gets
reflected. The pigments can be assumed as selective filters that allow only certain
wavelengths of light to reach our eyes (Thompson, Stewart & Rodriguez, 2008).
Human blood is always red. The tone is bright red when it is oxygenated (or
oxygen rich) and a darker red when it is lacking oxygen or oxygen poor. Although blood
has a high absorption in a very broad region (300-900 nm) it has a strong and narrow
absorption band with a maximum wavelength around 415 nm as shown in Figure 2.1.
Absorption is weakest above 600 nm (Hortola, 1992). This results in the reflection of
visible light and the appearance of red wavelength of the visible light. Absorption by
blood is mainly determined by the concentration and oxygen saturation (S02) level of
hemoglobin since the absorption of water is low.
i : ! 70 L-.oo ____ _
W • .,.lenltll •
Figure 2.1 Relative absorption of visible range in blood (Hortola, 1992).
17

When the electromagnetic wave of optical ray encounters biological tissue, there
will be multiple effects of reflectance, absorption, and scattering due to inhomogeneities
of the sample. In this study, even though, each tissue has its own optical absorption
spectra characteristic, one can approximate the optical properties with that of water, due
to the fact that water is the major composition of human body which accounts> 70%.
Both water and saline solution transmit well in the visible range and the absorption is
high in the UV and IR. Tissue shows similar strong absorption in UV and the IR region.
However, in blood there are strong absorption in the visible range due to chromospheres
such as hemoglobin and bilirubin. The penetration of these three regions of
electromagnetic wave is shown in Figure 2.2 where the epidermis is about 50-150 11m in
thickness, the dermis (1000-4000 11m), with collagen and elastic fibres produced by
fibroblasts, blood and lymph vessels, hair follicles, sweat and sebaceous glands, smooth
muscles, and nerves. The last part is subdermal tissues which consist of a fat layer.
Ul
E "III o
Ultraviolet ; I
C l8lA: I I I
~ _l:~ao
Visible
--I
! I I
Infrared
'00 1_ ~
Figure 2.2 Penetration ofUV, visible and IR range in the skin (Cheong, Prahl & Weich, 1990).
18

Due to the difference in isotropic and intracellular contents, different types of
tissue do show markedly different optical and thennal properties. It thus required in
depth investigation for the clinical application of optical methods. Some of these
properties may depend on the water content.
The red blood cell concentration influences the absorption as well as the
transmission behaviour of blood (Kim & Keller, 2003). The Beer-Lambert Law states
that the concentration of a substance in solution is directly proportional to the
absorbance, A, of the solution, given by
Absorbance, A = (constant) x (concentration) x (cell length)
The law is only true for monochromatic light, which is light of a single
wavelength or narrow band of wavelength, and provided that the physical or chemical
state of the substance does not change with concentration. When monochromatic
radiation passes through a homogenous solution in a cell, the intensity of the emitted
radiation (I) depends upon the thickness (1) and the concentration (C) of the solution
(Figure 2.3).
I :< >:
I
Figure 2.3 Incident intensity, 10 passes through the solution with concentration C at thickness I. I
is the transmitted intensity.
19

Mathematically, absorbance is related to percentage transmittance T by the expression:
A = 10gIO (l0/I) = 10gIO (I OOIT) = kCf (2.6)
where f is the length of the radiation path through the sample, C is the concentration of
absorbance molecules in the path, and k is the extinction coefficient; a constant
dependent only the nature of the molecule and the wavelength of the radiation
(Figure 2.4). Applying equation (2.6), the relation between absorbance, A and
transmittance, T is shown as;
0% T = C() A
0.1% T = 3.0 A
1.0% T = 2.0 A
10% T = 1.0 A
100% T = 0 A
'<f? >--:l CT
en .., 0 ~ ..,
::l CT en ~ :3 ::l ....... 0 ....... (1)
~ ::l 0 (1)
Concentration, C Concentration C , (a) (b)
Figure 2.4 (a) Percentage of light transmittance T versus concentration C.
(b) Absorbance A of light versus concentration C.
20

2.3 Ultrasonic absorption and velocity in biological tissue
Amplitude-mode ultrasound is used as an additional technique to study the
hemolysis level in whole-blood sample. Ultrasound is the second most utilized
diagnostic imaging modality in medicine, second only to conventional X-ray and is
critically important diagnostic tool of any medical facility. Ultrasound is a form of
nonionizing radiation and is considered safe to the best present knowledge, less
expensive, produces images in real time and also portable. Besides that, ultrasound also
has several drawbacks. Chief among them are; organs containing gases and bony
structure cannot be adequately imaged without introducing specialized procedure and it
also depends on operator skill.
Ultrasound is a wave characterized by such parameter as pressure, medium
(particle) velocity, medium displacement, density and temperature. It differs from a
sound wave in that its frequency is higher than 20 kHz. The audible range of human ear
is from 20 Hz to 20 kHz. Ultrasound is a wave, thus, requires a medium in which to
travel and thus cannot propagate in a vacuum. As an acoustic wave propagates through
an inhomogeneous medium such as biological tissues, part of its energy will be lost due
to absorption and scattering and part of its energy will be lost due to specular reflection
at the boundary. The ultrasonic images are formed from the specularly reflected echoes
due to planar interfaces. However, according to Anson et al. (1989) it does not
necessarily preclude significant scattering effects because the dimension of blood cells is
much less than a wavelength. Moreover, investigations by Shung and Thiemen (1993)
have shown that scattering contributes little to attenuation at most, a few percentage
21

points in most soft tissues. Therefore, it is safe to say that absorption is the dominant
mechanism for ultrasonic attenuation in biological tissues.
There are several types of ultrasound imaging modes which is amplitude-mode
(A-mode), brightness-mode (B-mode), motion-mode (M-mode), two dimension-real
time (2D-real time) and Doppler modes. In this study, an A-mode ultrasound is used to
measure the ultrasonic velocity in whole-blood sample. When the ultrasound beam
encounters an anatomical boundary, the received sound impulse is processed to appear
as a vertical reflection of a point. On the display, it will looks like spikes of different
height or the amplitude as shown in Figure 2.5. The intensity of the returning impulses
determined the height of the vertical reflection and the time it took for the impulse to
make the round trip would determine the space between the verticals. The distance
between these spikes can be measured accurately by dividing the speed of sound in
tissue (1540 m/s) by half the sound travel time.
A
Figure 2.5 A-mode ultrasound display with the two spikes A and B (Anaesthesia UK, 2004).
The acoustic velocity in a medium is a sensitive function of the temperature but
its dependence on frequency is minimal over the frequency range 1 to 15 MHz.
Ultrasound velocity in biological media is also dependent both on the protein
concentration of biological liquids composing the biological tissue and on the external
22

pressure; factors that are influencing tissue density. However, the influence of these
factors is depending on temperature. It is reported by Carstensen and Schwan (1953)
that the absorption of ultrasound in blood is caused primarily by protein content of blood
and also due to the vary presence of intact cells in suspension.
The ultrasonic study of liquid mixtures has been gaining importance in assessing
the nature of molecular interaction. Many researchers have used ultrasonic techniques
for studying the conformational fluctuations of protein molecules. Barnes et al. (1988)
studied the absorption of low-frequency ultrasound in aqueous solutions of hemoglobin,
myoglobin and bovine serum albumin, at 200 - 1200 kHz and pH 2 - 11, to study the
absorption of ultrasound with a constant temperature of 20 Dc. Besides that, Arumugam
et al. (1998) also discovered that the transformation from monomer to the polymeric
form of collagen also results in increase of the attenuation and velocity with
concentration. Thus, the interaction between the collagen molecules may be responsible
for the observed increase in ultrasonic velocity, viscosity and relaxation time.
The literature reveals a continuing interest in the measurement of the ultrasonic
properties of biological systems. Hence, it might be of interest to extend the ultrasonic
study to free hemoglobin plasma in hemolysis blood.
2.4 Literature review
The invention of blood hemolysis analyzer relates generally to device and methods
that are used for measuring the concentration of hemoglobin in bodily fluids such as
blood, plasma, serum and urine (Tarasev, 2007). In addition, the invention provides
23

methods and devices for evaluating erythrocyte membrane deformation or fragility,
erythrocyte hemolysis and hematocrit levels in a fluid sample. This method allows direct
measurement of plasma hemoglobin concentration by scanning spectroscopic methods
using visible and near infrared portions of the electromagnetic spectrum. The analyzer
can also be used to evaluate the relative amount of rupture erythrocytes thus providing
an indirect measure of erythrocyte membrane fragility, based on cell-free Hb
concentration in plasma. Each of the Hb derivatives has a characteristic absorption.
Oxyhemoglobin has the maximum absorbance 415 nm, deoxyhemoglobin at 430 nm,
carboxyhemoglobin at 419 nm, and methemoglobin at 405 nm. These absorbance peak
wavelengths can be used to identify the hemoglobin derivatives in a sample and the
hemolyzed blood can be investigated. However not all changes in membrane fragility
result in erythrocyte rupture and increased cell-free Hb. The limit in this invention is that
centrifugation to remove the erythrocytes is required before analysis can take place, and
thus, requires an access to laboratory equipment and do not provide the speed necessary
for rapid analysis.
Davis (1995) estimated the concentration of Hb in a whole blood sample, and
correspondingly the number of hemolyzed red blood cells per unit volume or
concentration of hemolyzed red blood cells in a whole blood sample, by comparing the
colour hue of the separated fraction with a number of different colour hues on a chart.
The chart displays a number of characteristic colour hues corresponding to the colours
associated with range of predetermined Hb concentration in plasma. The detection step
may alternatively be performed with the aid of a reflectance meter, the meter providing a
reading that is a function of the concentration of extracellular hemoglobin present in the
24


