
Faculty of Science and Technology
MASTER’S THESIS
Study program/ Specialization:
Petroleum Engineering/Drilling Technology
Spring semester, 2016
Open
Writer:
Stanislaw Wrobel
…………………………………………
(Writer’s signature)
Faculty supervisor: Mesfin Belayneh
Thesis title:
Development of an improved Nanoparticle-modified Water Based Drilling Fluid
Credits (ECTS): 30
Key words:
WBM, Nanoparticles, Rheology, Friction,
Simulations, Experimental
Pages: 127 (+ 45 enclosure)
Stavanger, 15.06.2016
Development of an improved nanoparticle-modified water based drilling fluid
MSc Thesis, Stanislaw Wrobel 2
Acknowledgements
I like to express my deepest gratitude and appreciation to Mesfin Belayneh Agonafir for
allocating this very interesting subject to me. His guidance, enthusiasm, encouragement
and advice have supported me in the understanding of this subject. His contribution to
the success of this work has been inevitable. I could never have made it to see the day
that I finish my thesis, without his support.
Additionally, I would like to thank my family and my friends for supporting me in
every endeavor.
Stavanger, June 2016
Stanislaw Wrobel
Development of an improved nanoparticle-modified water based drilling fluid
MSc Thesis, Stanislaw Wrobel 3
Abstract
The objective was to improve conventional water based drilling fluid systems by the
addition of nanoparticles. Experiments were conducted to evaluate whether addition of
nanoparticles to the drilling fluid could improve rheological, lubricating, viscoelastic
and filtrate loss properties. The rheological properties were measured using av Fanning-
VG viscometer. The lubricating properties of the fluid were determined through friction
coefficient measurements using a CSM DIN 50324 Tribometer at varying temperatures,
while filtrate loss was measured using standard API filtrate loss test setup. The tested
nanoparticle additives were MoS2, Graphene, TiO2 and TiN.
The results show that nanoparticle additives to the drilling fluid can improve the
rheological properties. Addition of 0.1 g MoS2 per 500 ml at ambient temperature,
improved the Bingham Yield Strength (YS) of the drilling fluid by 183 % relative to the
reference fluid. Similar experiments with higher concentration in the range of 0.2 g to
0.4 g per 500 mL, showed that increasing the nanoparticle concentration leads to a
reduction in Bingham YS at ambient temperature. The same added concentrations
showed that Graphene, TiO2 and TiN did not have a significant impact on the fluid
rheological properties. Nanoparticle composition and size may therefore impact the
potential for drilling property improvement.
In terms of lubricating properties, the experiments show that nanoparticles can improve
the lubricity of the drilling fluid by reducing the friction coefficient. MoS2 showed a
reduction in friction coefficient of up to 53 %, while Graphene modified fluid systems
showed up to 56 % reduction. TiO2 and TiN did not show lubricating effects, in some
cases increasing the friction coefficient of the drilling fluid. Experiments at
temperatures ranging from 20-70 °C showed that MoS2 and Graphene yield improved
lubricity at all tested temperatures.
Based on experimental results Hydraulic, Cuttings transport and Torque & Drag
simulations were conducted. Simulations suggested that 0.4g MoS2 added to the drilling
fluid could reduce the bed height by 45%, improving cuttings transport capacity
significantly. Torque & drag simulations suggest that the improved lubricity of
graphene and MoS2 addition could extend drilling reach by as much as 26.3%.

Development of an improved nanoparticle-modified water based drilling fluid
MSc Thesis, Stanislaw Wrobel 4
1 Table of Contents
ACKNOWLEDGEMENTS ....................................................................................................... 2
ABSTRACT ............................................................................................................................... 3
1 INTRODUCTION ................................................................................................................ 7
1.1 Background ................................................................................................................. 7
1.2 Problem definition ..................................................................................................... 10
1.3 Objective ................................................................................................................... 10
1.4 Methodology ............................................................................................................. 11
2 LITERATURE STUDY ..................................................................................................... 12
2.1 Loss of Circulation .................................................................................................... 12
2.2 Function, Characterization and Composition of Drilling Fluids ............................... 14
2.3 Filter cake-bridging process ..................................................................................... 14
2.3.1 Components of water drilling fluids ............................................................ 16
2.3.2 Polymers ....................................................................................................... 18
2.3.3 Polyanionic Cellulose (PAC) ....................................................................... 20
2.3.4 KCl ............................................................................................................... 20
3 THEORY ............................................................................................................................ 22
3.1 The Rheology of Drilling Fluids ............................................................................... 22
3.1.1 Newtonian Fluids ......................................................................................... 22
3.1.2 Non-Newtonian Fluids ................................................................................. 22
3.1.3 Rheological models ...................................................................................... 23
3.2 Hydraulics ................................................................................................................. 27
3.3 Viscoelasticity ........................................................................................................... 30
3.3.1 Oscillatory Test: Amplitude Sweep ............................................................. 32
3.4 Drill string mechanics ............................................................................................... 33
3.4.1 Drag .............................................................................................................. 33
3.4.2 Torque .......................................................................................................... 35
4 EXPERIMENTAL EVALUATION OF NANO-MODIFIED BENTONITE
BASED DRILLING FLUID .............................................................................................. 36
4.1 Description of equipment .......................................................................................... 36
4.2 Description of the drilling fluid systems ................................................................... 41
4.3 Effect of Molybdenum disulfide (MoS2) nanoparticles ............................................ 41

Development of an improved nanoparticle-modified water based drilling fluid
MSc Thesis, Stanislaw Wrobel 5
4.3.1 Drilling fluid development with Molybdenum disulfide
(MoS2) nanoparticles .................................................................................... 42
4.3.2 Results and analysis of Molybdenum disulfide treated drilling
fluid system .................................................................................................. 43
4.4 Effect of Titanium Oxide (TiO2 ) nanoparticles ........................................................ 57
4.4.1 Drilling fluid development with Titanium Oxide TiO2 ................................ 57
4.4.2 Results and analysis of drilling fluid system containing
nanosized TiO .............................................................................................. 58
4.5 Effect of Graphene nanoparticles .............................................................................. 69
4.5.1 Results and analysis of drilling fluid system containing
nanosized Graphene ..................................................................................... 71
4.6 Effect Titanium Nitride (TiN) nanoparticles ............................................................. 82
4.6.1 Drilling fluid system containing TiN nanoparticles ..................................... 83
4.6.2 Results and analysis of drilling fluid system containing TiN ...................... 84
4.7 Viscoelasticity – Oscillatory test: Amplitude Sweep ................................................ 95
5 PERFORMANCE SIMULATION STUDIES ................................................................... 98
5.1 Hydraulic simulation ................................................................................................. 98
5.1.1 Simulation arrangement ............................................................................... 98
5.1.2 Effect of graphene-modified fluid on ECD and Pump
Pressure simulation results ......................................................................... 100
5.1.3 Effect of MoS2-modified fluid on ECD and Pump pressure
simulation results ....................................................................................... 102
5.2 Cuttings transport simulation .................................................................................. 103
5.2.1 Simulation setup ......................................................................................... 104
5.2.2 Drilling fluids ............................................................................................. 104
5.2.3 Transport parameters .................................................................................. 104
5.2.4 Simulation result and discussion ................................................................ 105
6 DRILL STRING MECHANICS SIMULATION............................................................. 107
6.1 Description of fluids ................................................................................................ 108
6.1.1 Torque and drag simulation setup .............................................................. 109
6.2 Simulation result ..................................................................................................... 111
7 SUMMARY AND DISCUSSION ................................................................................... 115
7.1 Effect of Molybdenum disulfide (MoS2) nanoparticles .......................................... 115
7.2 Effect of Titanium Oxide (TiO2 ) nanoparticles ...................................................... 117
7.3 Effect of Graphene nanoparticles ............................................................................ 118
7.4 Effect of Titanium Nitride (TiN) nanoparticles ...................................................... 119
7.5 Simulation results .................................................................................................... 120

Development of an improved nanoparticle-modified water based drilling fluid
MSc Thesis, Stanislaw Wrobel 6
7.5.1 Hydraulic Simulation ................................................................................. 120
7.5.2 Cuttings transport Simulation .................................................................... 120
7.5.3 Torque and Drag Simulation ...................................................................... 121
8 CONCLUSION ................................................................................................................ 122
9 REFERENCES ................................................................................................................. 123
10 APPENDIX – A - RHEOLOGY MODELS WITH %-DEVIATION .............................. 127
10.1 MoS2 127
10.2 TiO2 132
10.3 Graphene ................................................................................................................. 138
10.4 TiN 143
APPENDIX B WELL CONSTRUCTION PARAMETERS. ........................................................ 149
APPENDIX C: ........................................................................................................................ 152
10.5 Effect of nano free (Ref CMC) and Ref CMC +0.4tm MoS2 ................................. 152
10.6 Effect of nano free (Ref XG) and Ref XG +0.1tm Graphene ................................. 155
LIST OF SYMBOLS .............................................................................................................. 160
NOMENCLATURE ............................................................................................................... 161
LIST OF FIGURES .................................................................................................................... 1
LIST OF TABLES ..................................................................................................................... 6
Development of an improved nanoparticle-modified water based drilling fluid
MSc Thesis, Stanislaw Wrobel 7
1 Introduction
This thesis presents the effect of different Nanoparticles in conventional (nano-free)
bentonite drilling fluid. The reference fluid (nano-free) is prepared with bentonite clay,
polymers (carboxymethyl cellulose (CMC), polyanionic cellulose (PAC) and Xanthan
Gum(XG)) and KCl salt. The primary objective of the study was to formulate a nano-
modified drilling fluid with enhanced parameters. The evaluation of the fluid systems
was through experimental and simulation studies. For the characterization of the fluid
systems, their rheology, filtrate volume, viscoelasticity, and tribology attributes were
measured.
The best fluid systems have been selected based on rheological and tribological
properties and their performances have been evaluated through simulation studies.
These are hydraulics, cuttings transport and torque & drag.
1.1 Background
A drilling operation is about connecting the surface environment with a reservoir with
the objective to gain access hydrocarbons. For this, the drilling fluid plays many
important roles. The main function of drilling fluid among many others is to lift
cuttings, maintain well pressure and cool the bit.
If drilling fluid is not appropriately designed, several drilling problems could occur,
which cost the oil industry a lot.
The static mud density and the friction loss when circulating determine the circulation
mud density, (i.e equivalent circulation density, ECD), which is a function of rheology
and density of drilling fluid.
Equivalent circulating density is determined by [1]
TVD
PECD annulus
st.052.0
(1.1)
Where:
st - Static mud weight [ppg]
ΔPannulus - Pressure loss in the annulus [psi]
TVD - True vertical depth [ft]
Development of an improved nanoparticle-modified water based drilling fluid
MSc Thesis, Stanislaw Wrobel 8
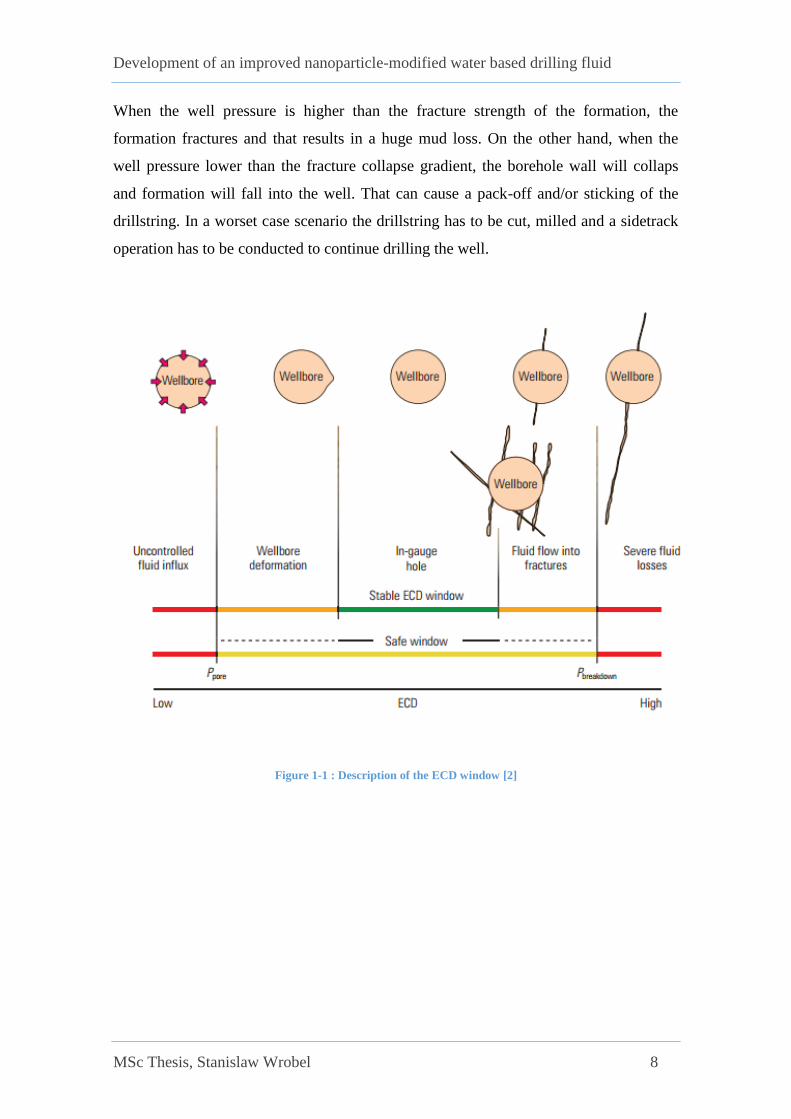
When the well pressure is higher than the fracture strength of the formation, the
formation fractures and that results in a huge mud loss. On the other hand, when the
well pressure lower than the fracture collapse gradient, the borehole wall will collaps
and formation will fall into the well. That can cause a pack-off and/or sticking of the
drillstring. In a worset case scenario the drillstring has to be cut, milled and a sidetrack
operation has to be conducted to continue drilling the well.
Figure 1-1 : Description of the ECD window [2]
Development of an improved nanoparticle-modified water based drilling fluid
MSc Thesis, Stanislaw Wrobel 9
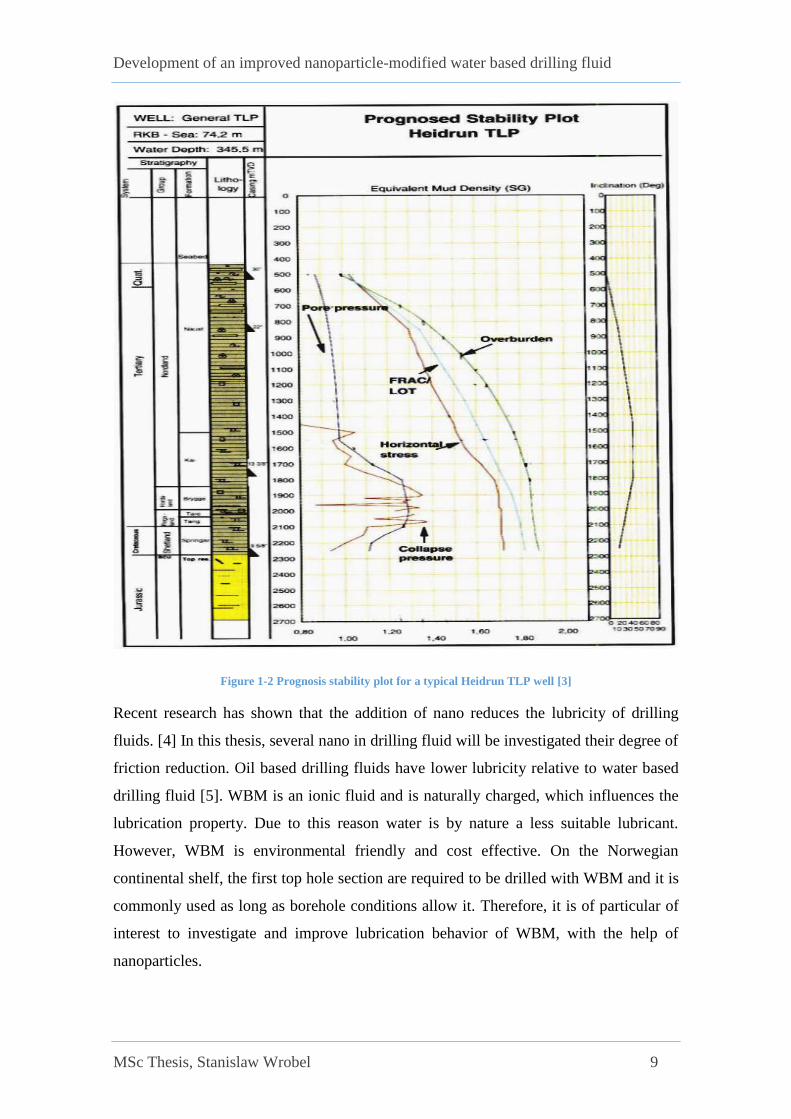
Figure 1-2 Prognosis stability plot for a typical Heidrun TLP well [3]
Recent research has shown that the addition of nano reduces the lubricity of drilling
fluids. [4] In this thesis, several nano in drilling fluid will be investigated their degree of
friction reduction. Oil based drilling fluids have lower lubricity relative to water based
drilling fluid [5]. WBM is an ionic fluid and is naturally charged, which influences the
lubrication property. Due to this reason water is by nature a less suitable lubricant.
However, WBM is environmental friendly and cost effective. On the Norwegian
continental shelf, the first top hole section are required to be drilled with WBM and it is
commonly used as long as borehole conditions allow it. Therefore, it is of particular of
interest to investigate and improve lubrication behavior of WBM, with the help of
nanoparticles.
Development of an improved nanoparticle-modified water based drilling fluid
MSc Thesis, Stanislaw Wrobel 10
1.2 Problem definition
Oil based drilling fluid is better than water based mud systems in terms of higher
lubricity and shale stability. However, in some cases (e.g. drilling top section) oil based
drilling fluid systems are not allowed to be used in a country where environmental
policy is very strict such as in Norway. The common practice is to change the drilling
operation to water based drilling fluid. However, water based drilling fluids can not
replace the oil based mud system and are less effective in terms of the mentioned
parameters.
The application of nanomaterials have been documented in literature showing positive
performance in drilling fluids, cement and enhanced oil recovery. [4] [6] [7]
This thesis addresses issues such as:
The effect of different nanoparticles with different concentrations on
conventional WBM in terms of rheology, viscoelasticity and lubricity
Issues regarding pump pressure and ECD management
Potential extended reach drilling by drilling fluid modification with
nanoparticles
Effect of different nanoparticles in terms of borehole cleaning
1.3 Objective
The primary objective of this thesis is to formulate nanoparticle-modified drilling fluids
and characterize their properties through experimental work and simulation studies. The
main activities are:
Literature studies on the theory of rheology, hydraulics, and well friction model
used to analyze the drilling fluids.
Review of drilling fluid’s chemical ingredients properties used for the
formulation of a nanoparticle-modified drilling drilling fluid
Characterization of the formulated drilling fluids through experimental
evaluations
Evaluation of the best formulated nanoparticle treated drilling fluids through
simulation studies.
Development of an improved nanoparticle-modified water based drilling fluid
MSc Thesis, Stanislaw Wrobel 11
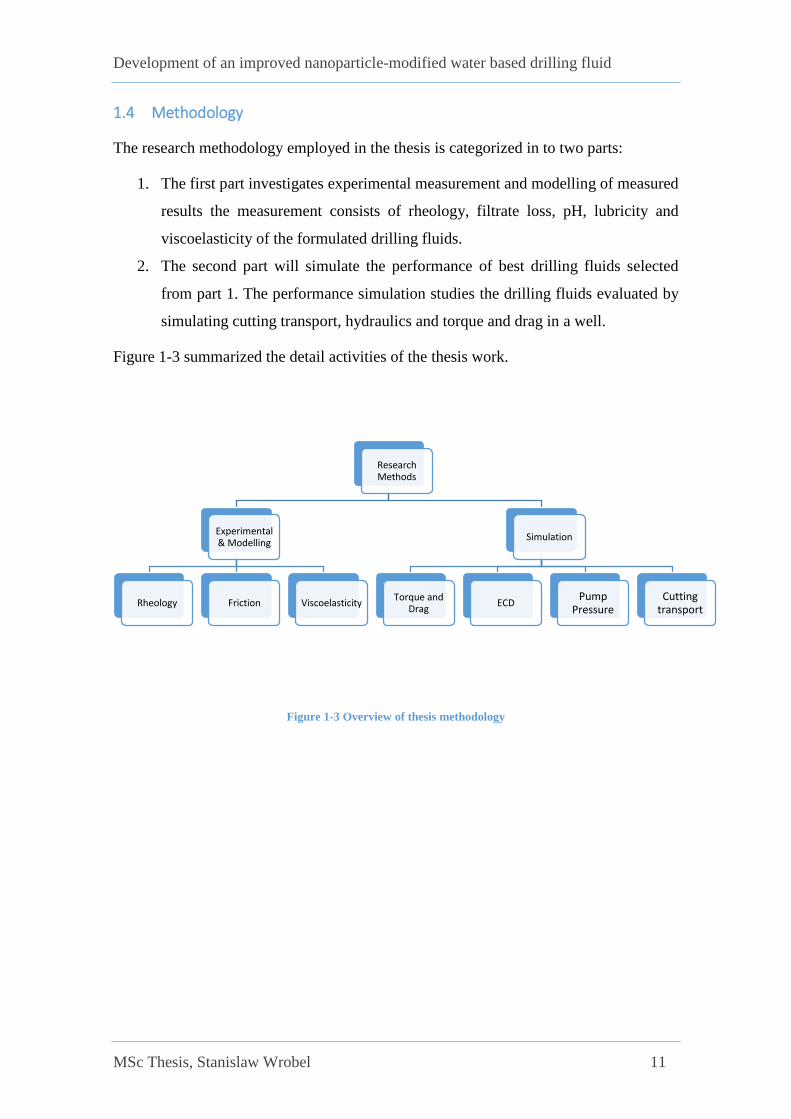
1.4 Methodology
The research methodology employed in the thesis is categorized in to two parts:
1. The first part investigates experimental measurement and modelling of measured
results the measurement consists of rheology, filtrate loss, pH, lubricity and
viscoelasticity of the formulated drilling fluids.
2. The second part will simulate the performance of best drilling fluids selected
from part 1. The performance simulation studies the drilling fluids evaluated by
simulating cutting transport, hydraulics and torque and drag in a well.
Figure 1-3 summarized the detail activities of the thesis work.
Figure 1-3 Overview of thesis methodology
Research Methods
Experimental & Modelling
Rheology Friction Viscoelasticity
Simulation
Torque and Drag
ECDPump
PressureCutting
transport

Development of an improved nanoparticle-modified water based drilling fluid
MSc Thesis, Stanislaw Wrobel 12
2 Literature study
This chapter presents the description of the drilling fluid additives used for the
formulation in chapter 4.
2.1 Loss of Circulation
Lost circulation is the loss of drilling fluid into drilling formation. The loss increases
drilling cost directly and indirectly by increasing nonproductive time. The fluid loss into
formation also damages the formation. [2]
As illustrated on Figure 2-1, lost circulation occurs in drilling formation through several
means such as [8]
A. Unconsolidated or highly permeable formations (such as loose gravels)
B. Cavernous formations (crevices and channels)
C. Natural fractures
D. Drilling induced fractures
Figure 2-1 Lost circulation formations [18]

Development of an improved nanoparticle-modified water based drilling fluid
MSc Thesis, Stanislaw Wrobel 13
Depending on the degree and severity of loss, operators use loss circulation materials to
cure huge mud loses. Among other Messenger has studied the performance of various
loss circulation materials to gain control of loss circulation scenarios. [8]
Figure 2-2 illustrates the four strategies used to take prevention and remediation
measures.
The prevention action comprises of three elements, namely:
Best drilling practices
Fluid selection having proper rheological properties
Materials used for wellbore strengthening.
The remediation action is to use loss circulation material in order to cure or stop losses.
Experience showed that prevention of loss circulation occurrence is more beneficial
than to stop/cure or reduce the problem once they already have occurred. [2].
Figure 2-2 Four-tiered strategy consisting of both prevention and remediation measures for lost circulation [2]
Development of an improved nanoparticle-modified water based drilling fluid
MSc Thesis, Stanislaw Wrobel 14
2.2 Function, Characterization and Composition of Drilling Fluids
Drilling fluids are the essential part of drilling operation. Among several functions, it
provides: [9].
Hole cleaning : Drilling fluids lift cuttings from downhole all the way to the
surface
Maintain well pressure: Drilling fluids control well pressure in order to avoid
well instability.
Buoyancy effect: Drilling fluids reduce the hook load by reducing the effective
weight of the submerged drillstring.
Lubricity : Drilling fluids provide lubricity between the drill string and
formations, reducing torque, drag and perhaps wear.
Cooling effect : Drilling fluids cooling the drillbit and wellbore.
Well stability (chemical) : Drilling fluids control the shale swelling effect if
properly designed.
Medium for signal transfer for real time measurements and/or logging data.
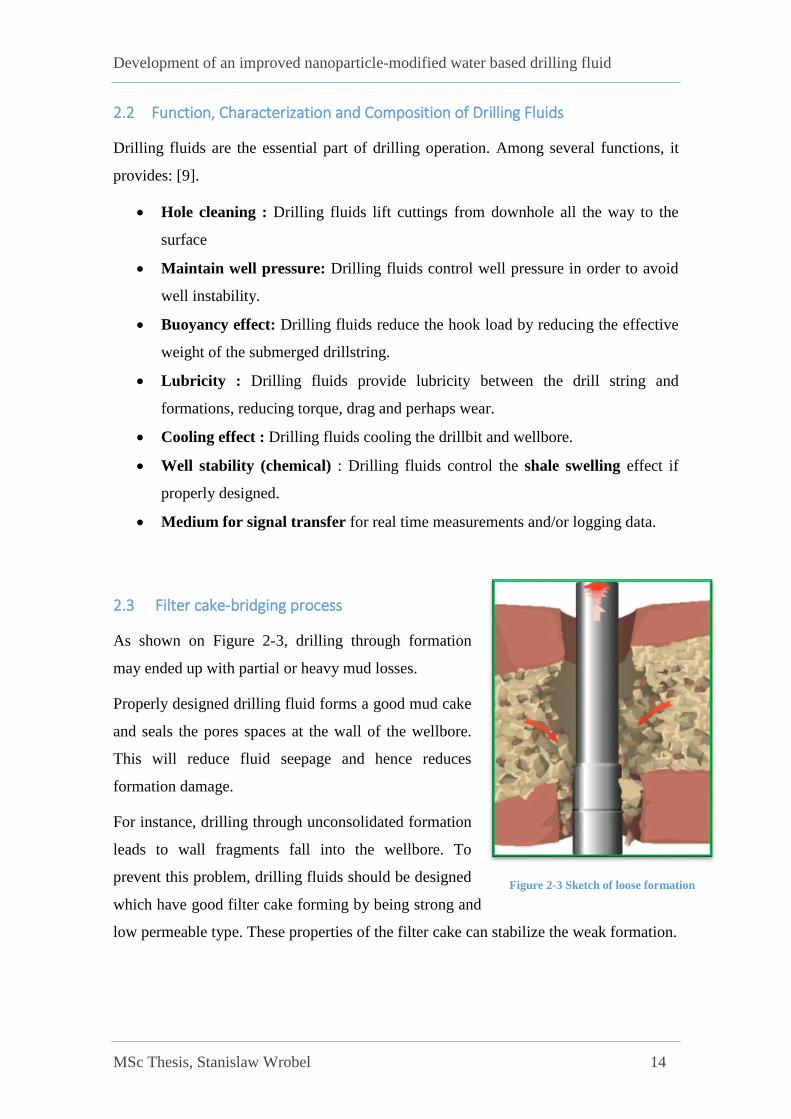
2.3 Filter cake-bridging process
As shown on Figure 2-3, drilling through formation
may ended up with partial or heavy mud losses.
Properly designed drilling fluid forms a good mud cake
and seals the pores spaces at the wall of the wellbore.
This will reduce fluid seepage and hence reduces
formation damage.
For instance, drilling through unconsolidated formation
leads to wall fragments fall into the wellbore. To
prevent this problem, drilling fluids should be designed
which have good filter cake forming by being strong and
low permeable type. These properties of the filter cake can stabilize the weak formation.
Figure 2-3 Sketch of loose formation
Development of an improved nanoparticle-modified water based drilling fluid
MSc Thesis, Stanislaw Wrobel 15
Figure 2-4 is also another problematic formation, which
is reactive shale. Drilling through this formation with oil
based mud or ‘’inhibitive’’ KCL treated water based
mud are the best solutions for stability of shale swelling.
However, the water base inhibitive drilling cannot
completely solve swelling problems.
In recent years, the application of nano on improving the
filter cake property has shown a promising results for
developing nano-fluid in water based system. This thesis
also deals with the performance of nano in water based
fluid.
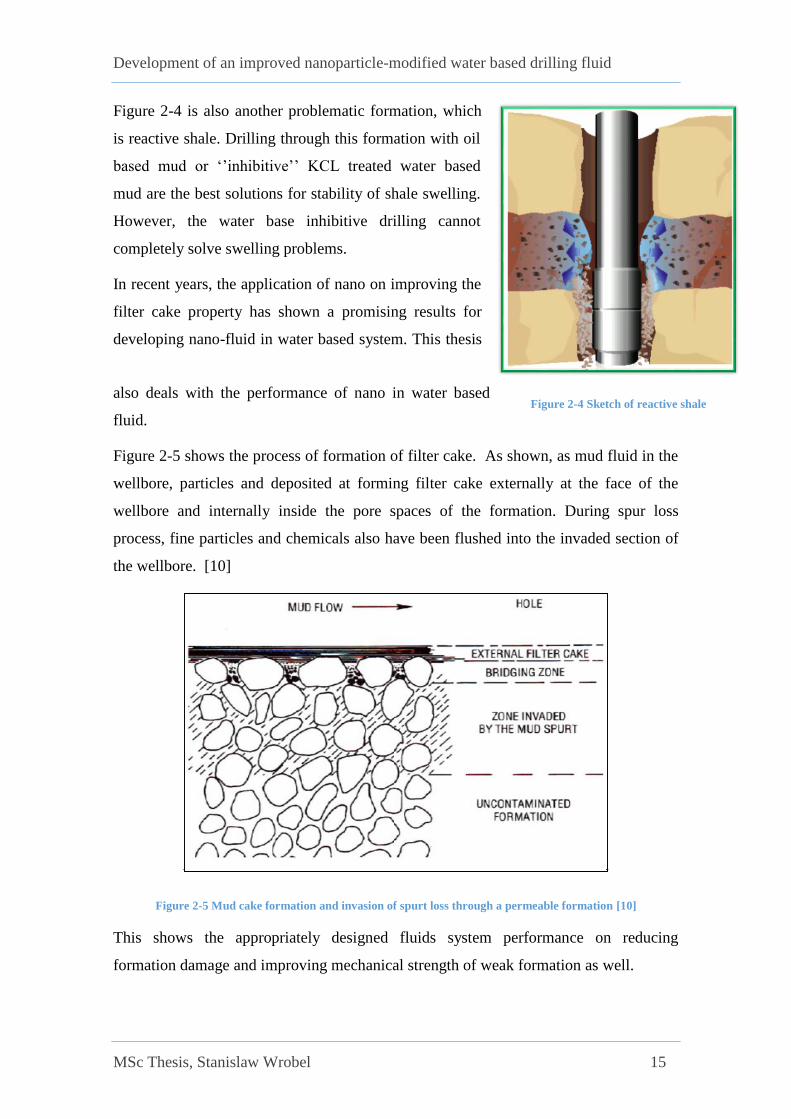
Figure 2-5 shows the process of formation of filter cake. As shown, as mud fluid in the
wellbore, particles and deposited at forming filter cake externally at the face of the
wellbore and internally inside the pore spaces of the formation. During spur loss
process, fine particles and chemicals also have been flushed into the invaded section of
the wellbore. [10]
Figure 2-5 Mud cake formation and invasion of spurt loss through a permeable formation [10]
This shows the appropriately designed fluids system performance on reducing
formation damage and improving mechanical strength of weak formation as well.
Figure 2-4 Sketch of reactive shale
Development of an improved nanoparticle-modified water based drilling fluid
MSc Thesis, Stanislaw Wrobel 16
2.3.1 Components of water drilling fluids
This section presents the the description of chemical additives used to prepare drilling
fluid in section 4. These are tap water, bentonite, KCl salt, polymers (CMC, Xanthan
gum and PAC) and nano particles.
2.3.1.1 Fresh water
Tap water was used to prepare bentonite based drilling fluid. The chemistry of the tap
water is not documented here since no data available.
2.3.1.2 Clays - Bentonite
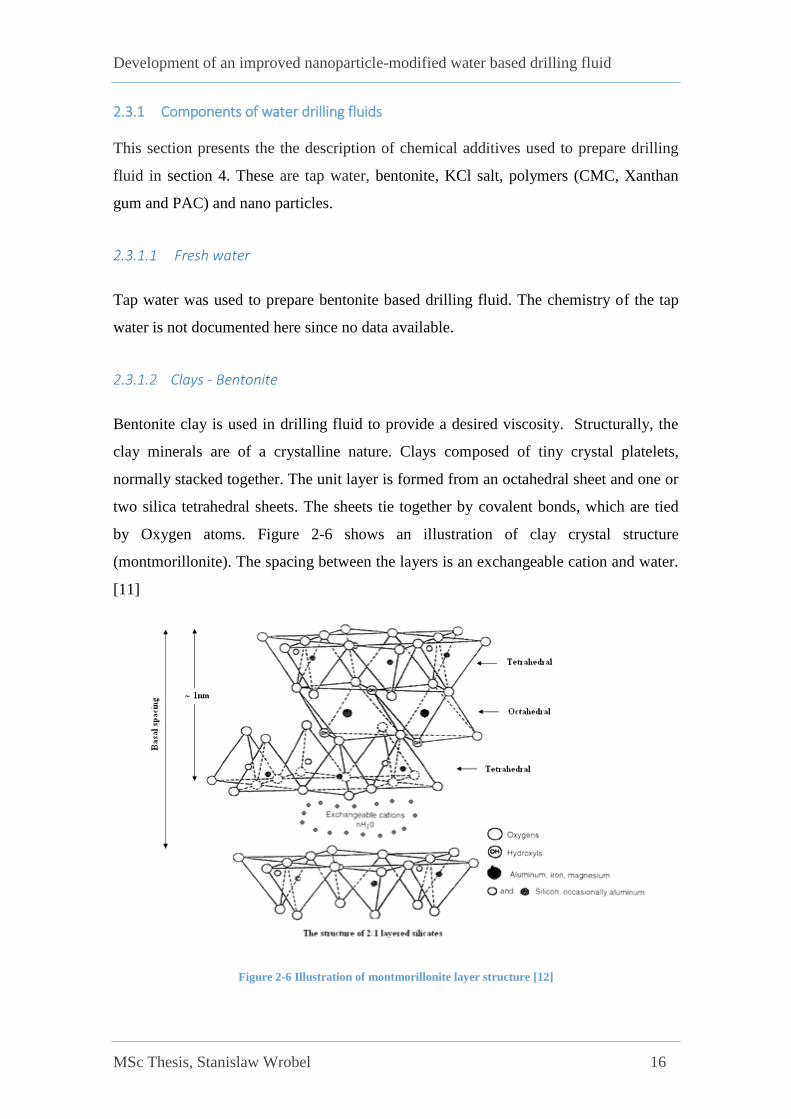
Bentonite clay is used in drilling fluid to provide a desired viscosity. Structurally, the
clay minerals are of a crystalline nature. Clays composed of tiny crystal platelets,
normally stacked together. The unit layer is formed from an octahedral sheet and one or
two silica tetrahedral sheets. The sheets tie together by covalent bonds, which are tied
by Oxygen atoms. Figure 2-6 shows an illustration of clay crystal structure
(montmorillonite). The spacing between the layers is an exchangeable cation and water.
[11]
Figure 2-6 Illustration of montmorillonite layer structure [12]
Development of an improved nanoparticle-modified water based drilling fluid
MSc Thesis, Stanislaw Wrobel 17
2.3.1.3 Particle associations
The rheological properties and fluid losses behaviors are affected by the particle
arrangement of clay. The particle arrangement in general are categorized into four and
illustrated as in Figure 2-7.
Dispersed system
When the aggregated clay particles are break down, the particles exist in as single
platelets. This system is known as a Dispersed system. The particle systems could be in
a deflocculated and flocculated state and yet dispersed.
Flocculated system
This system describe the clay particles are connected, but exist in the form of loose
structure. This system is due the positive change on the surface of clay, which allows to
create a 3D network system. Flocculated systems result in a higher viscosity, yield
strength and filter loss.
Deflocculated system
Due to the repulsive force between particles, the platelets the aggregated clay platelets
will be separated as illustrated on Figure 2-7. The repulsion force is due to the same
changes of the particles.
Aggregated system
As shown on Figure 2-7, the aggregate system is formed when the clay platelets are
bounded together. The system could be in flocculated and deflocculated condition.

Development of an improved nanoparticle-modified water based drilling fluid
MSc Thesis, Stanislaw Wrobel 18
Figure 2-7 Arrangement of clay particles in drilling fluid
2.3.2 Polymers
Polymers are used in drilling fluid in order to control viscosity, and fluid loss. There are
different types of polymer which are classified by their origin. Figure 2-8 illustrates the
liner, branched and crosslinked structure of polymers. [13]
The three types of polymers were used in this thesis. They are:
Carboxymethyl Cellulose Sodium (CMC),
Polyanionic Cellulose (PAC)
Xantham Gum, all are modified natural polymers.

Development of an improved nanoparticle-modified water based drilling fluid
MSc Thesis, Stanislaw Wrobel 19
Figure 2-8 Polymers structures: linear, branched and crosslinked
2.3.2.1 Carboxymethyl Cellulose Sodium (CMC)
CMC is Carboxymethyl Cellulose Sodium derived by the reaction of sodium salt with
cellulose. The structure is linear and polyaniuc. Figure 2-9 illustrate the CMC polymer
As mentioned earlier, CMC is used as viscosity and fluid loss control additives. [14]
Development of an improved nanoparticle-modified water based drilling fluid
MSc Thesis, Stanislaw Wrobel 20
Figure 2-9 Structure of Sodium CMC [14]
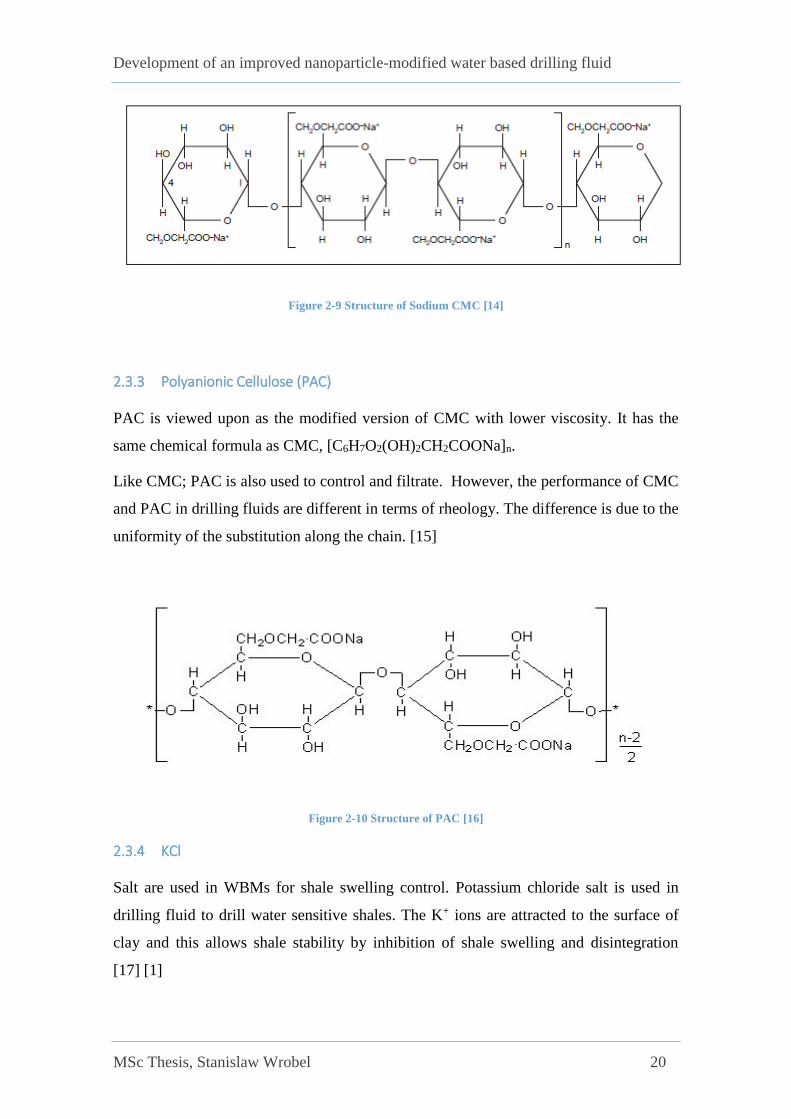
2.3.3 Polyanionic Cellulose (PAC)
PAC is viewed upon as the modified version of CMC with lower viscosity. It has the
same chemical formula as CMC, [C6H7O2(OH)2CH2COONa]n.
Like CMC; PAC is also used to control and filtrate. However, the performance of CMC
and PAC in drilling fluids are different in terms of rheology. The difference is due to the
uniformity of the substitution along the chain. [15]
Figure 2-10 Structure of PAC [16]
2.3.4 KCl
Salt are used in WBMs for shale swelling control. Potassium chloride salt is used in
drilling fluid to drill water sensitive shales. The K+ ions are attracted to the surface of
clay and this allows shale stability by inhibition of shale swelling and disintegration
[17] [1]

Development of an improved nanoparticle-modified water based drilling fluid
MSc Thesis, Stanislaw Wrobel 21
Figure 2-11 illustrates the effect of salt on CMC. As shown the addition salt has a
capacity to break down the CMC chains into smaller pieces. For the stability, it is
important to optimize the right amount of salt additive. [15]
Figure 2-11 Structure of CMC (a) Only CMC (b) CMC + Salt [ [15]
Development of an improved nanoparticle-modified water based drilling fluid
MSc Thesis, Stanislaw Wrobel 22
3 Theory
This chapter presents the review theories used for the evaluation of the drilling fluids
formulated in chapter 4.
3.1 The Rheology of Drilling Fluids
Rheology is the study of fluid deformation and flow. The rheological characterization
of fluid is important. The hole cleaning, and hydraulics performance of drilling fluid is a
function of the fluids physical and viscosity properties. [18]
There are two types of rheology models, namely Newtonian and non-Newtonian. The
rheology parameters extracted from the models are used for borehole cleaning, and
hydraulics model. Therefore selecting the right model is indirectly getting the right
input parameters for the models. [19] Figure 3-1 Rheological models illustrating typical
behaviour for each model Figure 3-1 illustrates the different rheological models
describing typical behaviour for each model.
3.1.1 Newtonian Fluids
Newtonian liquids have a viscosity which is independent of shear rate. They are simple
and clean liquids containing no particles larger than molecules. The Newtonian model
does not describe fluid systems that contain solid particles. For instance liquids such as
water, oil, and glycol, that do not contain solids behave, as Newtonian fluids [20]
Given as Eq. the shear stress is directly proportional to shear rate:
𝜏 = 𝜇 ∙ 𝛾 ( 1 )
where τ is shear stress, μ is viscosity and γ is shear rate.
3.1.2 Non-Newtonian Fluids
Unlike the Newtonian fluids, the viscosity for non-Newtonian fluids depends on shear
rate. These are divided into three main categories: Plastic liquids, pseudo plastic fluids
and dilatant fluids. It follows that the assortment of drilling fluids will be either having
plastic or pseudo plastic characteristics. In short, the main difference between plastic
and pseudo plastic fluids are that plastic fluids have yield strength and a pseudo plastic
Development of an improved nanoparticle-modified water based drilling fluid
MSc Thesis, Stanislaw Wrobel 23
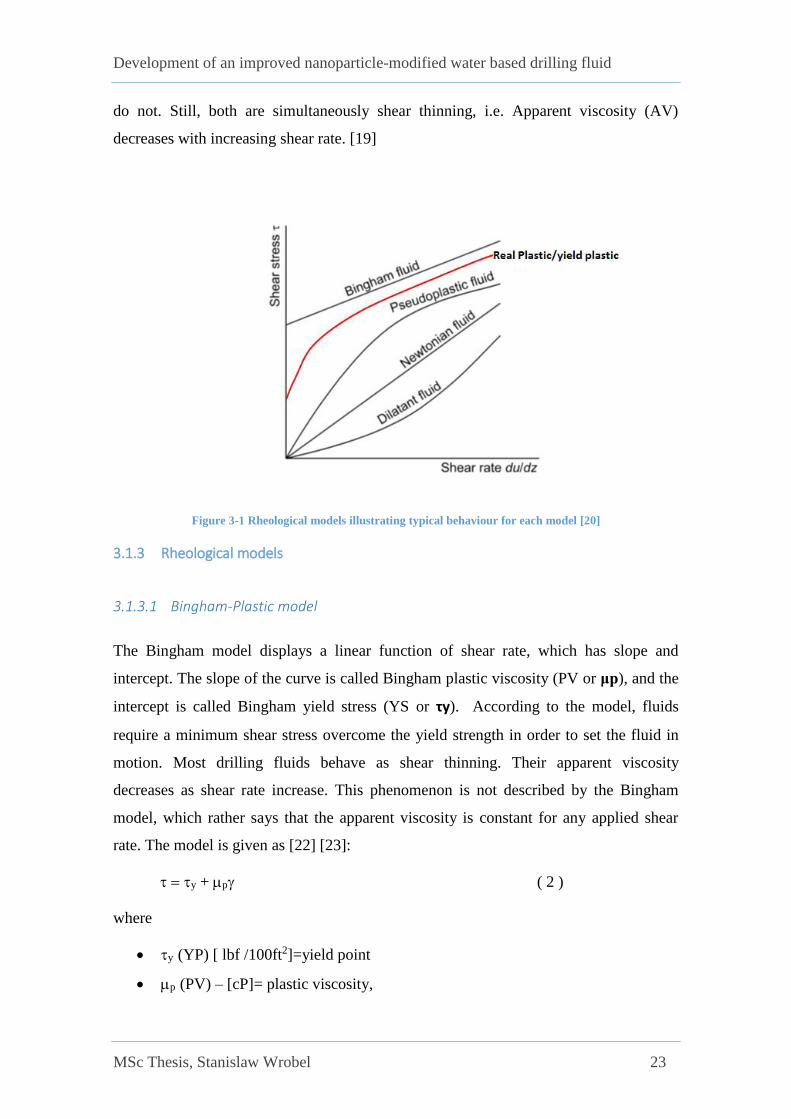
do not. Still, both are simultaneously shear thinning, i.e. Apparent viscosity (AV)
decreases with increasing shear rate. [19]
Figure 3-1 Rheological models illustrating typical behaviour for each model [20]
3.1.3 Rheological models
3.1.3.1 Bingham-Plastic model
The Bingham model displays a linear function of shear rate, which has slope and
intercept. The slope of the curve is called Bingham plastic viscosity (PV or μp), and the
intercept is called Bingham yield stress (YS or τy). According to the model, fluids
require a minimum shear stress overcome the yield strength in order to set the fluid in
motion. Most drilling fluids behave as shear thinning. Their apparent viscosity
decreases as shear rate increase. This phenomenon is not described by the Bingham
model, which rather says that the apparent viscosity is constant for any applied shear
rate. The model is given as [22] [23]:
y + p ( 2 )
where
y (YP) [ lbf /100ft2]=yield point
p (PV) – [cP]= plastic viscosity,

Development of an improved nanoparticle-modified water based drilling fluid
MSc Thesis, Stanislaw Wrobel 24
(𝛾[1/sec]) =the shear rate
The plastic viscosity is calculated as:
( 3 )
The yield strength is calculated as:
( 4 )
3.1.3.2 Power Law Model
Unlike the Bingham model, the Power-law fluid model describes that the apparent
viscosity decreases as the shear rate increases, as it does for most drilling fluids. The
aspect of yield stress is not included in this model. The shear stress and shear rate
behavior is described in the power law model and it is two parameter model. The shear
stress is given by [23] [22]
𝜏 = 𝑘 ∙ 𝛾𝑛 ( 5 )
Where
k [lbf/100sqft] = consistency index
n = flow behaviour index.
The Power-law parameters computed from the following equations:
( 6 )
( 7 )
The flow index parameter describe the fluid as::
n < 1 a shear thinning fluid
n = 1 a Newtonian fluid
n > 1 a shear thickening or dilatant fluid
300
600
R
Rlog32.3n
nn
RRk
1022511
600300
Development of an improved nanoparticle-modified water based drilling fluid
MSc Thesis, Stanislaw Wrobel 25
3.1.3.3 Herschel-Bulkley model
The Herschel-Bulkley model is described by three parameters. One disadvantage of the
power law model is that it describes that fluid can flow at zero shear rate without the
applied external pressure. However, this is not observed in real fluids. Herschel-Bulkley
enhanced the Power Law model by including yield stress 𝜏0. This model describes the
measured drilling fluid data more exceptional accuracy. The model is defined by the
equation below [21] [22]
( 8 )
where
where 𝜏∗ is determined by interpolation from the shear rate, 𝛾∗ .
( 9 )
3.1.3.4 Robertson-Stiff model
The Robertson-Stiff model is the more generalized model. It describes the rheology
behavior of drilling fluids and cement slurries. The model reads [21]
τ = A (γ + C) B ( 10 )
where A and B are model parameters, these are similar to n and K values in the power
law and in the Herschel-Bulkley model. The yield stress is determined from the zero
shear stress, which yields:.
( 11 )

Development of an improved nanoparticle-modified water based drilling fluid
MSc Thesis, Stanislaw Wrobel 26
where 𝛾∗ is the shear rate value which is determined by interpolation from the shear
stress, 𝜏∗,
( 12 )
3.1.3.5 Unified Model
The unified model is also a modified version of the Power law model. The difference
between the Herschel-Bulkley model is based on the determination of the yield strength.
In addition, the way the flow index and the consistency indexes are determined are
different from the Herschel-Bulkley modes. The model reads as [21]:
𝜏 = 𝜏𝑦𝐿 + 𝑘 ∙ 𝛾𝑛 ( 13 )
Where:
τyL = (2R3-R6)*1.066 ( 14 )
Pipe flow:
np = 3.32log(2µ𝑝+𝜏𝑦
µ𝑝+𝜏𝑦) ( 15 )
kp = 1.066(µ𝑝+𝜏𝑦
511𝑛𝑝) ( 16)
Annular flow:
na = 3.32log(2µ𝑝+𝜏𝑦−𝜏𝑦
µ𝑝+𝜏𝑦−𝜏𝑦) ( 17 )
ka = 1.066(µ𝑝+𝜏𝑦−𝜏𝑦
511𝑛𝑎) ( 18 )
Where:
τyL - Lower shear yield stress [lbf /100ft2]
np -Flow index in the pipe
na -Flow index in the annulus
kp -Pipe flow consistency index [lbf*secn/100ft2]
ka - annulus flow consistency index [lbf*secn/100ft2]
Development of an improved nanoparticle-modified water based drilling fluid
MSc Thesis, Stanislaw Wrobel 27
3.2 Hydraulics
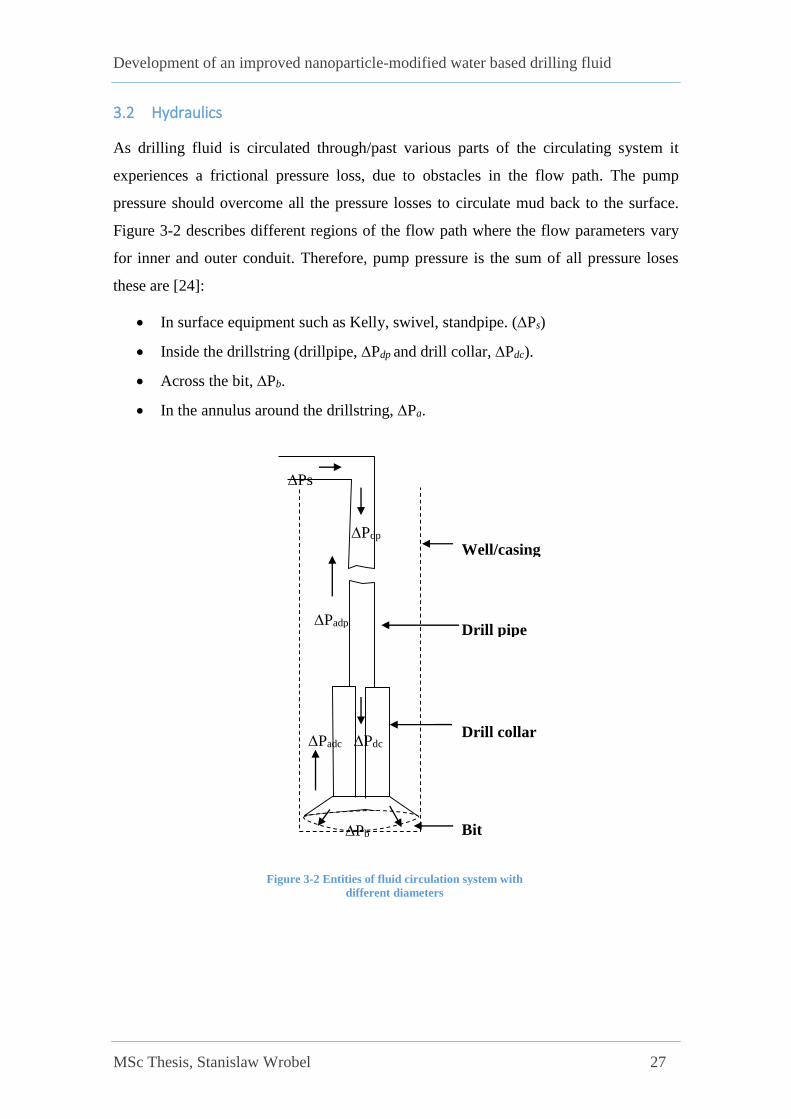
As drilling fluid is circulated through/past various parts of the circulating system it
experiences a frictional pressure loss, due to obstacles in the flow path. The pump
pressure should overcome all the pressure losses to circulate mud back to the surface.
Figure 3-2 describes different regions of the flow path where the flow parameters vary
for inner and outer conduit. Therefore, pump pressure is the sum of all pressure loses
these are [24]:
In surface equipment such as Kelly, swivel, standpipe. (Ps)
Inside the drillstring (drillpipe, Pdp and drill collar, Pdc).
Across the bit, Pb.
In the annulus around the drillstring, Pa.
Ps
Pdp
Pb
Padp
Padc
Bit
Drill collar
Drill pipe
Well/casing
Pdc
Figure 3-2 Entities of fluid circulation system with
different diameters
Development of an improved nanoparticle-modified water based drilling fluid
MSc Thesis, Stanislaw Wrobel 28
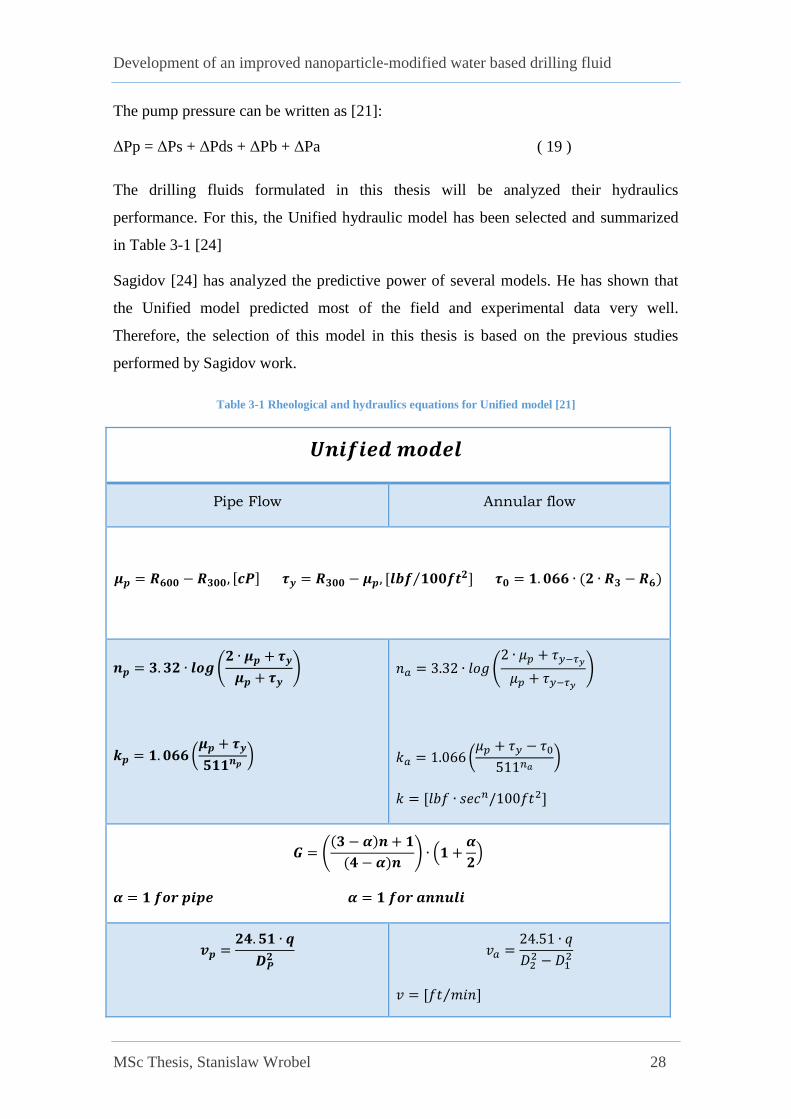
The pump pressure can be written as [21]:
ΔPp = ΔPs + ΔPds + ΔPb + ΔPa ( 19 )
The drilling fluids formulated in this thesis will be analyzed their hydraulics
performance. For this, the Unified hydraulic model has been selected and summarized
in Table 3-1 [24]
Sagidov [24] has analyzed the predictive power of several models. He has shown that
the Unified model predicted most of the field and experimental data very well.
Therefore, the selection of this model in this thesis is based on the previous studies
performed by Sagidov work.
Table 3-1 Rheological and hydraulics equations for Unified model [21]
𝑼𝒏𝒊𝒇𝒊𝒆𝒅 𝒎𝒐𝒅𝒆𝒍
Pipe Flow Annular flow
𝝁𝒑 = 𝑹𝟔𝟎𝟎 − 𝑹𝟑𝟎𝟎, [𝒄𝑷] 𝝉𝒚 = 𝑹𝟑𝟎𝟎 − 𝝁𝒑, [𝒍𝒃𝒇 𝟏𝟎𝟎𝒇𝒕𝟐⁄ ] 𝝉𝟎 = 𝟏. 𝟎𝟔𝟔 ∙ (𝟐 ∙ 𝑹𝟑 − 𝑹𝟔)
𝒏𝒑 = 𝟑. 𝟑𝟐 ∙ 𝒍𝒐𝒈 (𝟐 ∙ 𝝁𝒑 + 𝝉𝒚
𝝁𝒑 + 𝝉𝒚)
𝒌𝒑 = 𝟏. 𝟎𝟔𝟔 (𝝁𝒑 + 𝝉𝒚
𝟓𝟏𝟏𝒏𝒑)
𝑛𝑎 = 3.32 ∙ 𝑙𝑜𝑔 (2 ∙ 𝜇𝑝 + 𝜏𝑦−𝜏𝑦
𝜇𝑝 + 𝜏𝑦−𝜏𝑦
)
𝑘𝑎 = 1.066 (𝜇𝑝 + 𝜏𝑦 − 𝜏0
511𝑛𝑎)
𝑘 = [𝑙𝑏𝑓 ∙ 𝑠𝑒𝑐𝑛/100𝑓𝑡2]
𝑮 = ((𝟑 − 𝜶)𝒏 + 𝟏
(𝟒 − 𝜶)𝒏) ∙ (𝟏 +
𝜶
𝟐)
𝜶 = 𝟏 𝒇𝒐𝒓 𝒑𝒊𝒑𝒆 𝜶 = 𝟏 𝒇𝒐𝒓 𝒂𝒏𝒏𝒖𝒍𝒊
𝒗𝒑 =𝟐𝟒. 𝟓𝟏 ∙ 𝒒
𝑫𝑷𝟐
𝑣𝑎 =24.51 ∙ 𝑞
𝐷22 − 𝐷1
2
𝑣 = [𝑓𝑡 𝑚𝑖𝑛⁄ ]

Development of an improved nanoparticle-modified water based drilling fluid
MSc Thesis, Stanislaw Wrobel 29
𝜸𝒘 =𝟏. 𝟔 ∙ 𝑮 ∙ 𝒗
𝑫𝑹= [𝒔𝒆𝒄−𝟏]
𝝉𝒘 = [(𝟒 − 𝜶
𝟑 − 𝜶)
𝒏
𝝉𝟎 + (𝒌 ∙ 𝜸𝒘𝒏 )] = [𝒍𝒃𝒇 𝟏𝟎𝟎𝒇𝒕𝟐⁄ ]
𝑵𝑹𝒆 =𝝆 ∙ 𝒗𝒑
𝟐
𝟏𝟗. 𝟑𝟔 ∙ 𝝉𝒘 𝑁𝑅𝑒 =
𝜌 ∙ 𝑣𝑎2
19.36 ∙ 𝜏𝑤
𝒇𝒍𝒂𝒎𝒊𝒏𝒂𝒓 =𝟏𝟔
𝑵𝑹𝒆
𝒇𝒕𝒓𝒂𝒏𝒔𝒊𝒆𝒏𝒕 =𝟏𝟔 ∙ 𝑵𝑹𝒆
(𝟑𝟒𝟕𝟎 − 𝟏𝟑𝟕𝟎 ∙ 𝒏𝒑)𝟐
Turbulent:
𝒇𝒕𝒖𝒓𝒃𝒖𝒍𝒆𝒏𝒕 =𝒂
𝑵𝑹𝒆𝒃
𝒂 =𝐥𝐨𝐠(𝒏) + 𝟑. 𝟗𝟑
𝟓𝟎 𝒃
=𝟏. 𝟕𝟓 − 𝐥𝐨𝐠 (𝒏)
𝟕
𝑓𝑙𝑎𝑚𝑖𝑛𝑎𝑟 =24
𝑁𝑅𝑒
𝑓𝑡𝑟𝑎𝑛𝑠𝑖𝑒𝑛𝑡 =16 ∙ 𝑁𝑅𝑒
(3470 − 1370 ∙ 𝑛𝑎)2
Turbulent:
𝑓𝑡𝑢𝑟𝑏𝑢𝑙𝑒𝑛𝑡 =𝑎
𝑁𝑅𝑒𝑏
𝑎 =log(𝑛) + 3.93
50 𝑏 =
1.75 − log (𝑛)
7
𝒇𝒑𝒂𝒓𝒕𝒊𝒂𝒍 = (𝒇𝒕𝒓𝒂𝒏𝒔𝒊𝒆𝒏𝒕−𝟖 + 𝒇𝒕𝒖𝒓𝒃𝒖𝒍𝒆𝒏𝒕
−𝟖)−𝟏/𝟖
𝒇𝒑 = (𝒇𝒑𝒂𝒓𝒕𝒊𝒂𝒍𝟏𝟐 + 𝒇𝒍𝒂𝒎𝒊𝒏𝒂𝒓
𝟏𝟐)𝟏/𝟏𝟐 𝑓𝑎 = (𝑓𝑝𝑎𝑟𝑡𝑖𝑎𝑙12 + 𝑓𝑙𝑎𝑚𝑖𝑛𝑎𝑟
12)1/12
(𝒅𝒑
𝒅𝑳) = 𝟏. 𝟎𝟕𝟔 ∙
𝒇𝒑 ∙ 𝒗𝒑𝟐 ∙ 𝝆
𝟏𝟎𝟓 ∙ 𝑫𝒑= [𝒑𝒔𝒊 𝒇𝒕⁄ ]
𝚫𝒑 = (𝒅𝒑
𝒅𝑳) ∙ 𝚫𝐋 = [𝐩𝐬𝐢]
(𝑑𝑝
𝑑𝐿) = 1.076 ∙
𝑓𝑎 ∙ 𝑣𝑎2 ∙ 𝜌
105 ∙ (𝐷2 − 𝐷1)= [𝑝𝑠𝑖/𝑓𝑡]
Δ𝑝 = (𝑑𝑝
𝑑𝐿) ∙ ΔL = [psi]
𝚫𝒑𝑵𝒐𝒛𝒛𝒍𝒆𝒔 =𝟏𝟓𝟔 ∙ 𝝆 ∙ 𝒒𝟐
(𝑫𝑵𝟏𝟐 − 𝑫𝑵𝟐
𝟐 − 𝑫𝑵𝟑𝟐)
𝟐= [𝒑𝒔𝒊]
Development of an improved nanoparticle-modified water based drilling fluid
MSc Thesis, Stanislaw Wrobel 30
3.3 Viscoelasticity
Drilling fluids can display viscous and elastic responses during deformation. This is
called viscoelastic behavior. It is a time-dependent attribute, which is used to evaluate
the gel strength and internal gel structure of drilling fluid. [25] The elastic property has
an effect on the flow behavior and pressure drop during circulation of drilling fluid.
The viscoelastic properties are quantified by measuring the elastic (storage) modulus
(G’) and viscous (loss ) modulus (G’’)
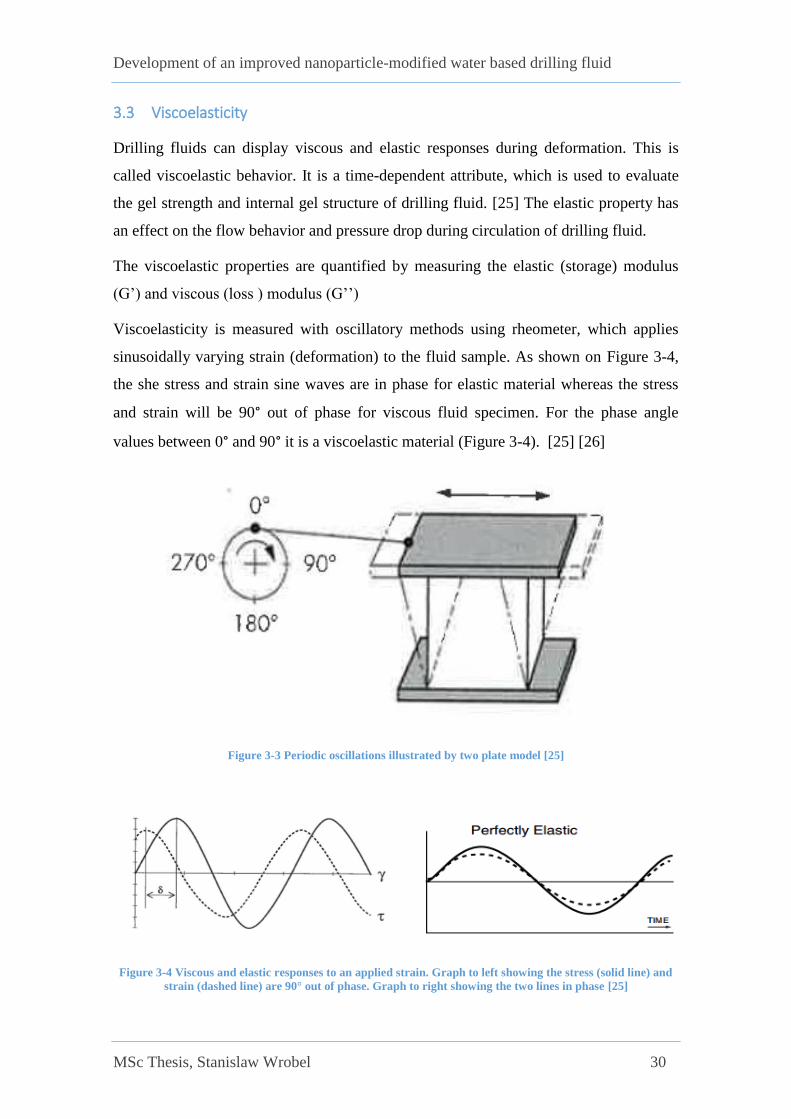
Viscoelasticity is measured with oscillatory methods using rheometer, which applies
sinusoidally varying strain (deformation) to the fluid sample. As shown on Figure 3-4,
the she stress and strain sine waves are in phase for elastic material whereas the stress
and strain will be 90° out of phase for viscous fluid specimen. For the phase angle
values between 0° and 90° it is a viscoelastic material (Figure 3-4). [25] [26]
Figure 3-3 Periodic oscillations illustrated by two plate model [25]
Figure 3-4 Viscous and elastic responses to an applied strain. Graph to left showing the stress (solid line) and
strain (dashed line) are 90° out of phase. Graph to right showing the two lines in phase [25]
Development of an improved nanoparticle-modified water based drilling fluid
MSc Thesis, Stanislaw Wrobel 31
During testing, the fluid sample is exposed to time varying sinusoidal shear force, which
causes deformation. The stress is written as:
( 20 )
( 21 )
The Storage Modulus describes energy stored per cycle. Whereas, loss modulus
describes the energy loss per cycle . These are given respectively as:
( 22 )
( 23 )
The ratio of the viscous and elastic deformation, one can compute the damping factor
tan as:
( 24 )
Where is the phase angle. The phase angle is equal to 90o for fluid which behaves
perfectly viscous. For perfectly elastic fluid, the phase angle is equal to 0o. when the
phase angle is between < 0o and 90o , the fluid behaves viscoelastic. [25] In this thesis
the 45° angle is evaluated. That point is called the flow point where the fluid is as
viscous as it is elastic.
)cos(sin)sin(cos)( ttt
o
o
o
oo
)cos()sin()( ''' tGtGt o
cos'
o
oG
sin''
o
oG
'
''
tanG
G
Development of an improved nanoparticle-modified water based drilling fluid
MSc Thesis, Stanislaw Wrobel 32
3.3.1 Oscillatory Test: Amplitude Sweep
During amplitude test the fluid specimen will be exposed to an oscillatory load that has
varying the amplitude of the shear force while keeping the frequency constant.
The deformation shows a linear and nonlinear deformation, which measures the storage
modulus and loss modules during the entire testing phase. For the analysis, we normally
are interested in the linear viscoelastic region (LVER). The LVER describes the
structure stability of the internal structure of the fluid systems can determine the
stability of a suspension. The longer the LVER is the better dispersed and stable is
structure of the fluid.
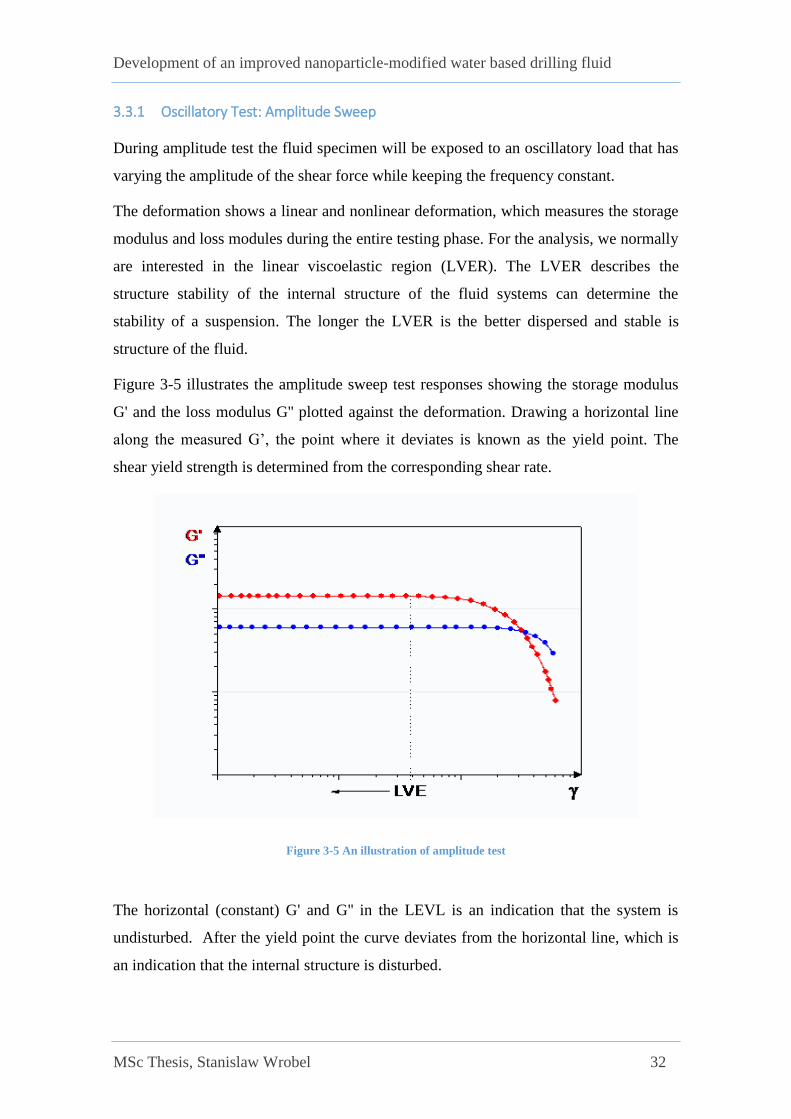
Figure 3-5 illustrates the amplitude sweep test responses showing the storage modulus
G' and the loss modulus G'' plotted against the deformation. Drawing a horizontal line
along the measured G’, the point where it deviates is known as the yield point. The
shear yield strength is determined from the corresponding shear rate.
Figure 3-5 An illustration of amplitude test
The horizontal (constant) G' and G'' in the LEVL is an indication that the system is
undisturbed. After the yield point the curve deviates from the horizontal line, which is
an indication that the internal structure is disturbed.
Development of an improved nanoparticle-modified water based drilling fluid
MSc Thesis, Stanislaw Wrobel 33
As shown on Figure 3-5, the point where the storage modulus and loss modulus cross
each other (G’=G’’), the fluid behavior starts to flow. This point is known as the flow
point of the fluid. This means that the fluid is behaves both viscous and elastic equally.
After the flow point the viscous behavior is more dominating than the elastic behavior.
At the flow point, the phase angle is 45°, but in the drilling industry yield point is a
more common
3.4 Drill string mechanics
Prior to drilling, during the design phase, the drill string mechanics simulation is study
is very important to conduct. This allow us to predict if one can drill and hit the desired
target formation. In addition, it yields an investigation of the sensitivity of important
parameters.
The torque drag simulation, hookload and stress in the drill string are the most
commonly encountered issues to be studied during simulation
3.4.1 Drag
As we drill or during a tripping operation, the drill string-formaton/casing interaction
generates a friction force. This force is in the direction of the self weight as tripping out
and in the opposite direction when tripping in.
There are several torque and drag models documented in literature (Aadnøy.
Johansickk)
In this thesis, the Johansic model is reviewed since the model is implemented in
WellPlanTM software.
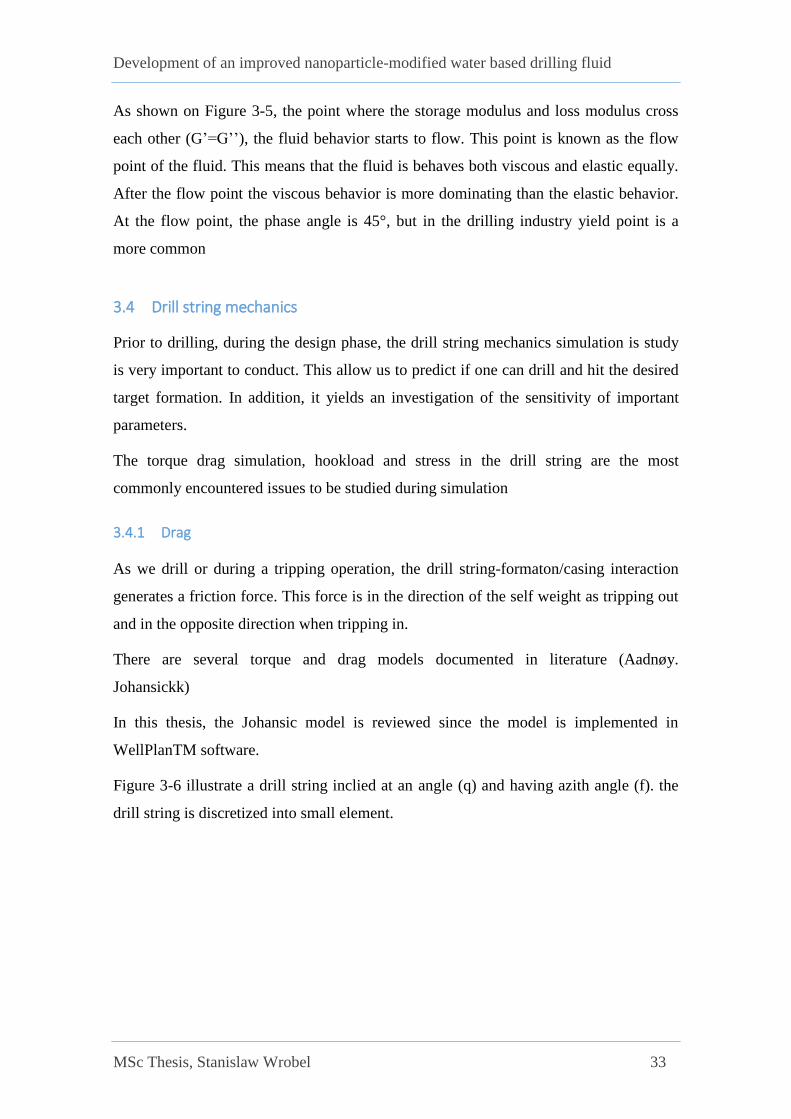
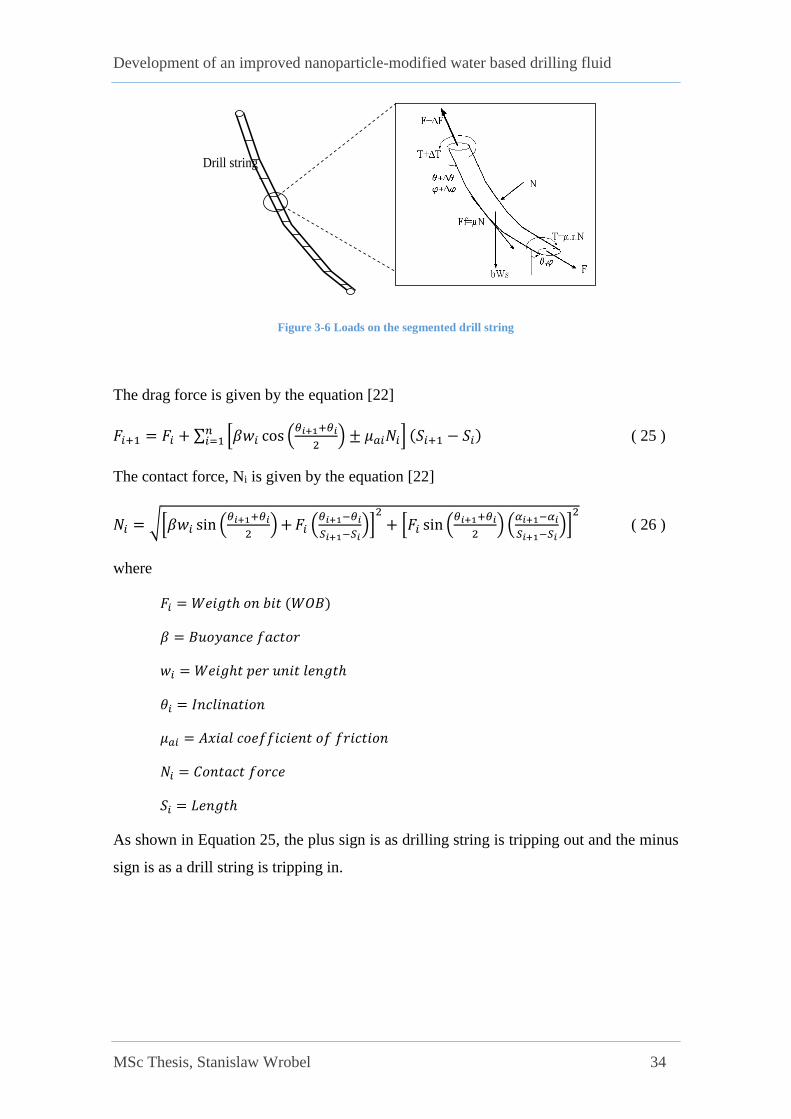
Figure 3-6 illustrate a drill string inclied at an angle (q) and having azith angle (f). the
drill string is discretized into small element.
Development of an improved nanoparticle-modified water based drilling fluid
MSc Thesis, Stanislaw Wrobel 34
Figure 3-6 Loads on the segmented drill string
The drag force is given by the equation [22]
𝐹𝑖+1 = 𝐹𝑖 + ∑ [𝛽𝑤𝑖 cos (𝜃𝑖+1+𝜃𝑖
2) ± 𝜇𝑎𝑖𝑁𝑖] (𝑆𝑖+1 − 𝑆𝑖)
𝑛𝑖=1 ( 25 )
The contact force, Ni is given by the equation [22]
𝑁𝑖 = √[𝛽𝑤𝑖 sin (𝜃𝑖+1+𝜃𝑖
2) + 𝐹𝑖 (
𝜃𝑖+1−𝜃𝑖
𝑆𝑖+1−𝑆𝑖)]
2
+ [𝐹𝑖 sin (𝜃𝑖+1+𝜃𝑖
2) (
𝛼𝑖+1−𝛼𝑖
𝑆𝑖+1−𝑆𝑖)]
2
( 26 )
where
𝐹𝑖 = 𝑊𝑒𝑖𝑔𝑡ℎ 𝑜𝑛 𝑏𝑖𝑡 (𝑊𝑂𝐵)
𝛽 = 𝐵𝑢𝑜𝑦𝑎𝑛𝑐𝑒 𝑓𝑎𝑐𝑡𝑜𝑟
𝑤𝑖 = 𝑊𝑒𝑖𝑔ℎ𝑡 𝑝𝑒𝑟 𝑢𝑛𝑖𝑡 𝑙𝑒𝑛𝑔𝑡ℎ
𝜃𝑖 = 𝐼𝑛𝑐𝑙𝑖𝑛𝑎𝑡𝑖𝑜𝑛
𝜇𝑎𝑖 = 𝐴𝑥𝑖𝑎𝑙 𝑐𝑜𝑒𝑓𝑓𝑖𝑐𝑖𝑒𝑛𝑡 𝑜𝑓 𝑓𝑟𝑖𝑐𝑡𝑖𝑜𝑛
𝑁𝑖 = 𝐶𝑜𝑛𝑡𝑎𝑐𝑡 𝑓𝑜𝑟𝑐𝑒
𝑆𝑖 = 𝐿𝑒𝑛𝑔𝑡ℎ
As shown in Equation 25, the plus sign is as drilling string is tripping out and the minus
sign is as a drill string is tripping in.
Drill string
Development of an improved nanoparticle-modified water based drilling fluid
MSc Thesis, Stanislaw Wrobel 35
3.4.2 Torque
As drill string is rotating, it experience torque due to friction. The applier toque should
overcome all the resistance toques due to string and formation induced frictional force.
It is important to note that applied surface torque should not overcome the maximum
allowable makeup torque. Therefore, during planning phase, simulation studies
delineates the allowable working window.
Referring to the force balance free body diagram shown in Figure 3-6, the toque for
simple geometry that string is varies in inclination only is given as: [22]
𝑇 = 𝜇𝑤∆𝑠𝑟 sin 𝛼 ( 27 )
where
𝜇 = 𝐹𝑟𝑖𝑐𝑡𝑖𝑜𝑛 𝑓𝑎𝑐𝑡𝑜𝑟
𝑤∆𝑠𝑟 = 𝑁𝑜𝑟𝑚𝑎𝑙 𝑚𝑜𝑚𝑒𝑛𝑡
𝛼 = 𝐴𝑛𝑔𝑙𝑒 𝑜𝑓 𝑑𝑒𝑣𝑖𝑎𝑡𝑖𝑜𝑛
Torque for any inclination and azimuth can be generalized as [22]
𝑇𝑖+1 = 𝑇𝑖 + ∑ 𝜇𝑡𝑟𝑖𝑁𝑖(𝑆𝑖+1 − 𝑆𝑖)𝑛𝑖=1 ( 28 )
where
𝑇𝑖 = 𝑇𝑜𝑟𝑞𝑢𝑒 𝑎𝑡 𝑏𝑖𝑡
𝜇𝑡 = 𝑇𝑎𝑛𝑔𝑒𝑛𝑡𝑖𝑎𝑙 𝑐𝑜𝑒𝑓𝑓𝑖𝑐𝑖𝑒𝑛𝑡 𝑜𝑓 𝑓𝑟𝑖𝑐𝑡𝑖𝑜𝑛
𝑟𝑖 = 𝑅𝑎𝑑𝑖𝑢𝑠 𝑜𝑓 𝑠𝑡𝑟𝑖𝑛𝑔
𝑁𝑖 = 𝐶𝑜𝑛𝑡𝑎𝑐𝑡 𝑓𝑜𝑟𝑐𝑒
𝑆𝑖 = 𝐿𝑒𝑛𝑔𝑡ℎ
Development of an improved nanoparticle-modified water based drilling fluid
MSc Thesis, Stanislaw Wrobel 36
4 Experimental evaluation of nano-modified bentonite
based drilling fluid
Several fluids systems were formulated and prepared to investigate the effect of nano,
polymers and salt in bentonite treated WBM systems. The effect of temperature was
also evaluated.
The primary objective of the research work is to design nano based drilling fluid
system, which improve the performance of a conventional nano-free water based
drilling fluid. The performance of the newly formulated fluid would be characterized in
terms of lower filtrate loss, suitable viscosity and reduce friction. Finally the fluid
system also used in a simulation well in order to evaluate its performance in terms of
torque and drag, hydraulics.
At first, screening tests were performed to establish the right amount of polymer to add
in the fluid system. Previous students [27] [28] [29] have established the concentration
ratios between polymers, bentonite and salt for optimal effect of mud by conducting
several screening tests. However, in this thesis work, a screening test for performed for
every nano in question with polymer, salt and bentonite concentrations kept constant.
The polymer varied between PAC, CMC and XG. The salt was at all times KCl.
4.1 Description of equipment
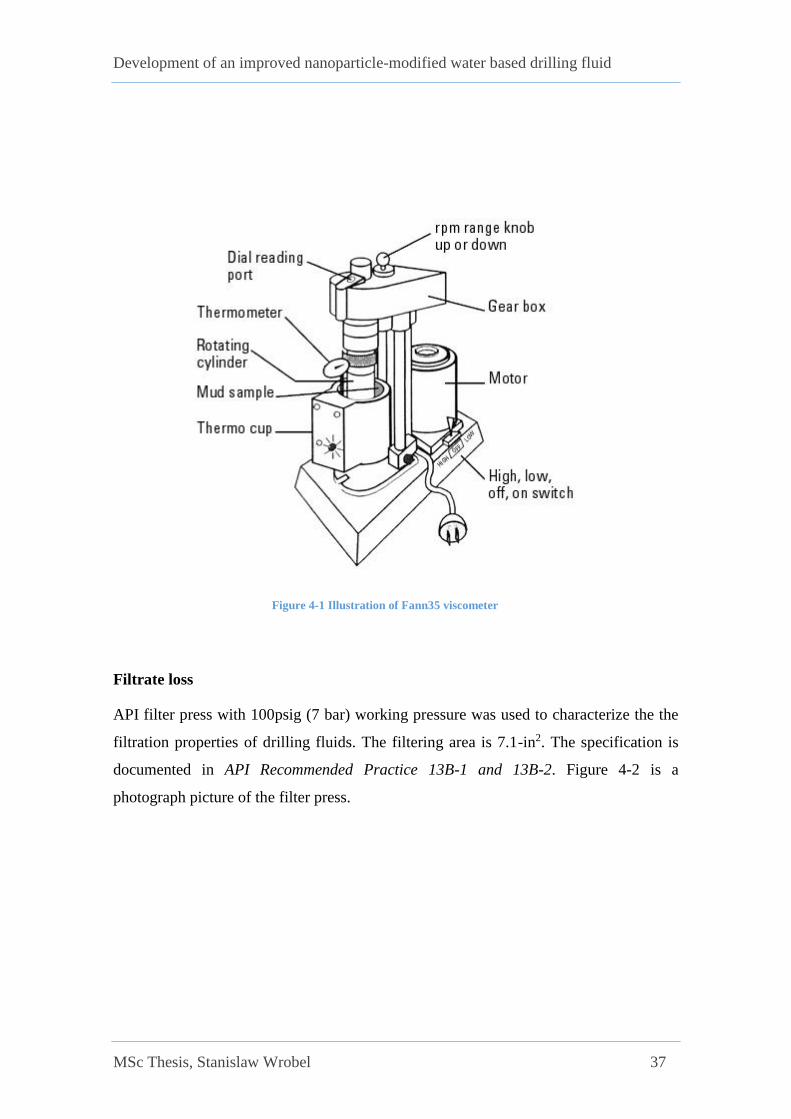
Fann35 viscometer
The drilling fluids were first measured with the Fann35 viscometer (Figure 4-1). For
rheology measurement and filter loss testing the temperature was kept at ambient
temperature, to not damage the polymer. Rheology models such as Bingham rheology
model was used to calculate plastic viscosity and yield strength, while Power Law
rheology model was used for consistency index (k) and flow behavior index (n).
Development of an improved nanoparticle-modified water based drilling fluid
MSc Thesis, Stanislaw Wrobel 37
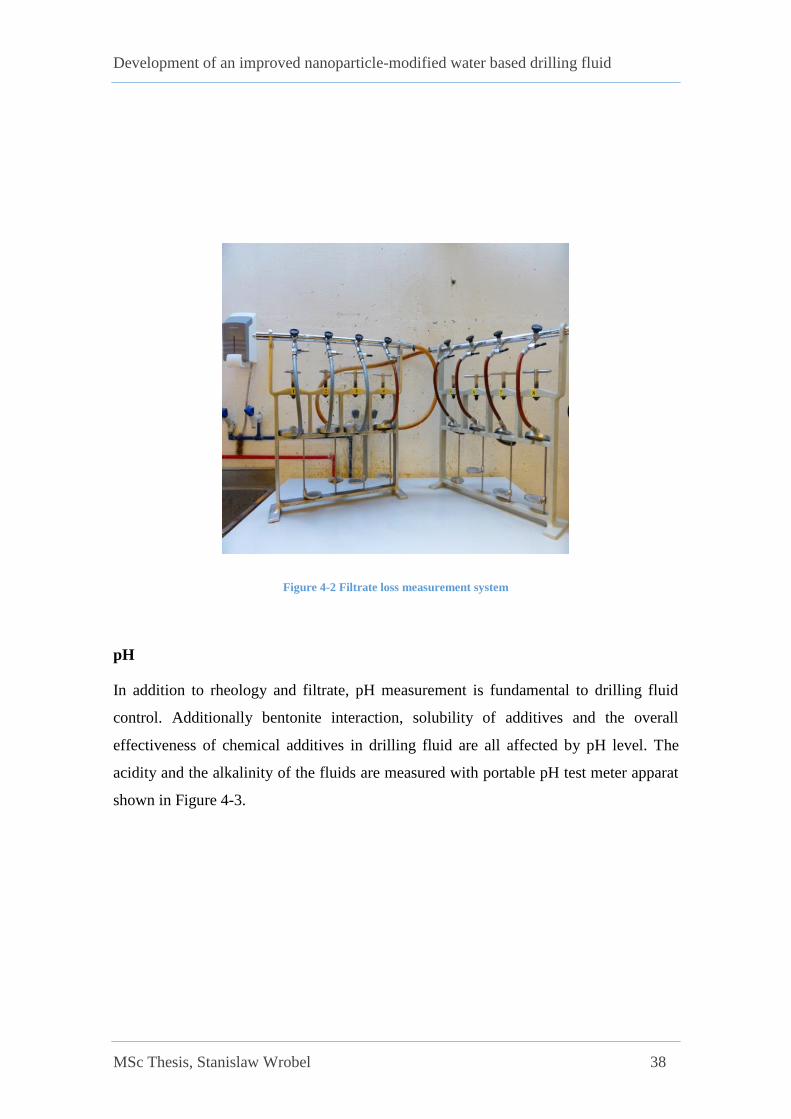
Filtrate loss
API filter press with 100psig (7 bar) working pressure was used to characterize the the
filtration properties of drilling fluids. The filtering area is 7.1-in2. The specification is
documented in API Recommended Practice 13B-1 and 13B-2. Figure 4-2 is a
photograph picture of the filter press.
Figure 4-1 Illustration of Fann35 viscometer
Development of an improved nanoparticle-modified water based drilling fluid
MSc Thesis, Stanislaw Wrobel 38
Figure 4-2 Filtrate loss measurement system
pH
In addition to rheology and filtrate, pH measurement is fundamental to drilling fluid
control. Additionally bentonite interaction, solubility of additives and the overall
effectiveness of chemical additives in drilling fluid are all affected by pH level. The
acidity and the alkalinity of the fluids are measured with portable pH test meter apparat
shown in Figure 4-3.

Development of an improved nanoparticle-modified water based drilling fluid
MSc Thesis, Stanislaw Wrobel 39
Figure 4-3 Picture of Orion pH meter model 201
Friction test
The friction test was performed on a CSM DIN 50324 Tribometer (Figure 4-4) at
different temperatures with 10N normal force at 4 cm/s for 8 minutes. Based on the
friction data, temperature dependent coefficient of friction were developed. The surface
of the pin-on-disk tribometer were cleaned properly before each measurement. More
details are mentioned in section 4.
Figure 4-4 CSM DIN 50324 Tribometer with nano-fluid lubricant
Development of an improved nanoparticle-modified water based drilling fluid
MSc Thesis, Stanislaw Wrobel 40
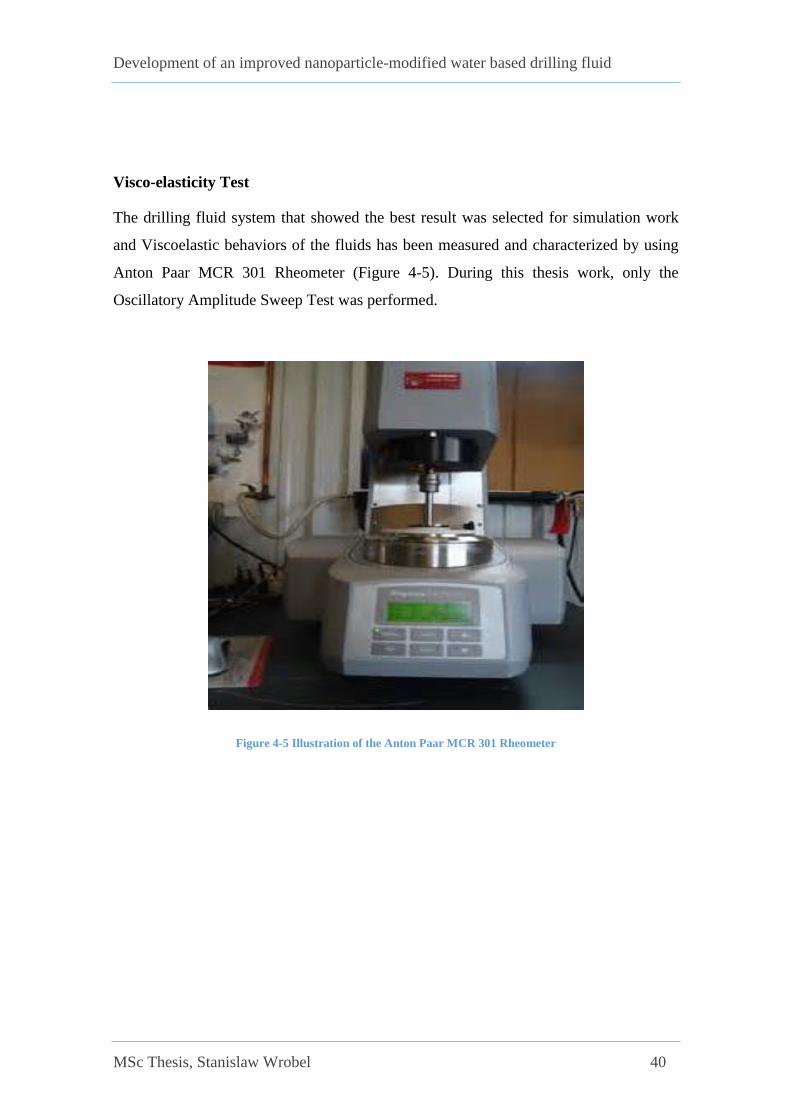
Visco-elasticity Test
The drilling fluid system that showed the best result was selected for simulation work
and Viscoelastic behaviors of the fluids has been measured and characterized by using
Anton Paar MCR 301 Rheometer (Figure 4-5). During this thesis work, only the
Oscillatory Amplitude Sweep Test was performed.
Figure 4-5 Illustration of the Anton Paar MCR 301 Rheometer

Development of an improved nanoparticle-modified water based drilling fluid
MSc Thesis, Stanislaw Wrobel 41
4.2 Description of the drilling fluid systems
Except for the chemical ingredients, all drilling fluids have the same mixing, aging and
testing procedure. The common additives are 500g H2O, 25g bentonite, 2.5g KCl and
0.5g Polymer. The fluid without nano-additiv is refered to as the reference/base fluid or
control fluid. The ingredients in a fluid system were mixed in a specific order as it
affects fluid behavior. After mixing the fluid system, it was aged for two days in order
to let the bentonite clay swell very well. Afterwards, viscometer responses, API static
filtrate and pH of the fluids were measured. Last the friction coefficient on the
tribometer and viscoelasticity on the Anton Paar rheometer were measured.
Four different fluid systems containing salt, polymer, nanoparticles and bentonite in
water-based fluid were prepared. These are:
Titanium Oxide TiO2 – Rutile structure fluid system
Molybdenum disulfide (MoS2) fluid system
Graphene fluid system
Titanium Nitride (TiN) fluid system
The thesis objective is to investigate the effect of various concentrations of the above
listed nanoparticles in water based drilling fluids.
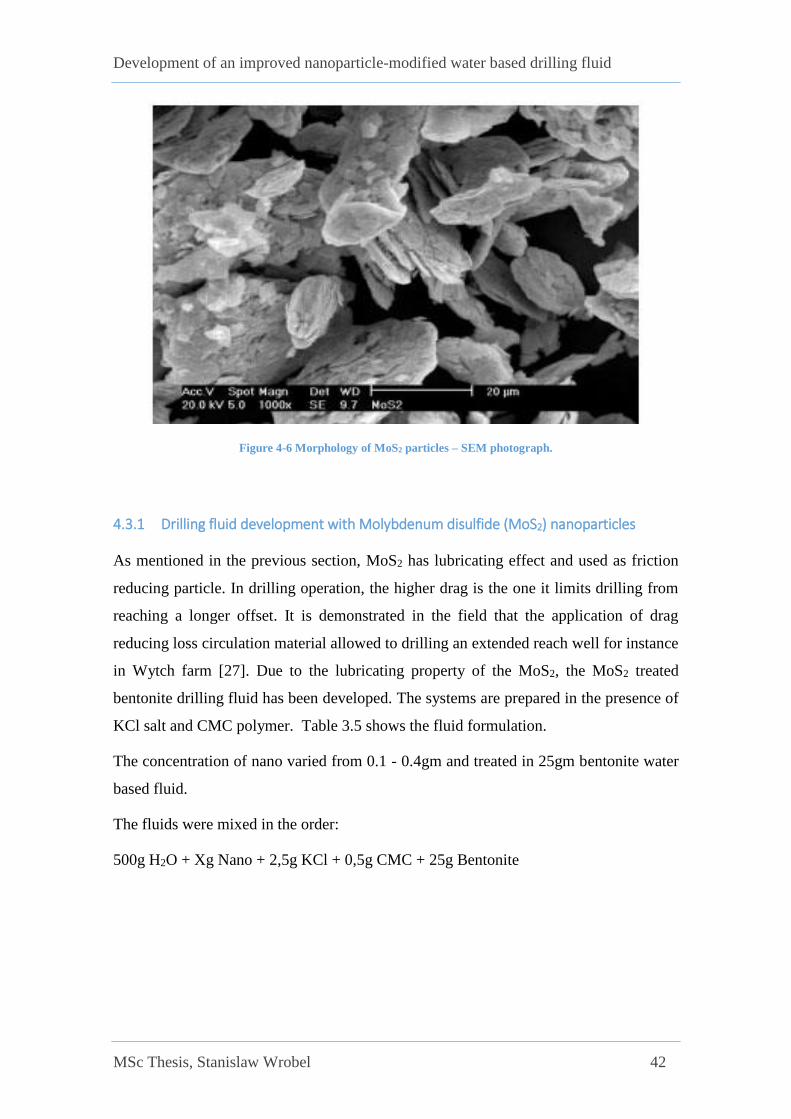
4.3 Effect of Molybdenum disulfide (MoS2) nanoparticles
Molybdenum disulfide (MoS2) is inorganic compound. It is composed of
molybdenum and sulfur elements. Dilute acids and oxygen do not affect MoS2 and it is
relatively chemically unreactive. In appearance, molybdenum disulfide is similar to
graphite. It is used a solid lubricant, since it has low friction properties. Therefore, in
this this, the performance of the particle is tested in drilling fluid. Figure 4-6 shows the
SEM photograph of MoS2.
Development of an improved nanoparticle-modified water based drilling fluid
MSc Thesis, Stanislaw Wrobel 42
Figure 4-6 Morphology of MoS2 particles – SEM photograph.
4.3.1 Drilling fluid development with Molybdenum disulfide (MoS2) nanoparticles
As mentioned in the previous section, MoS2 has lubricating effect and used as friction
reducing particle. In drilling operation, the higher drag is the one it limits drilling from
reaching a longer offset. It is demonstrated in the field that the application of drag
reducing loss circulation material allowed to drilling an extended reach well for instance
in Wytch farm [27]. Due to the lubricating property of the MoS2, the MoS2 treated
bentonite drilling fluid has been developed. The systems are prepared in the presence of
KCl salt and CMC polymer. Table 3.5 shows the fluid formulation.
The concentration of nano varied from 0.1 - 0.4gm and treated in 25gm bentonite water
based fluid.
The fluids were mixed in the order:
500g H2O + Xg Nano + 2,5g KCl + 0,5g CMC + 25g Bentonite
Development of an improved nanoparticle-modified water based drilling fluid
MSc Thesis, Stanislaw Wrobel 43
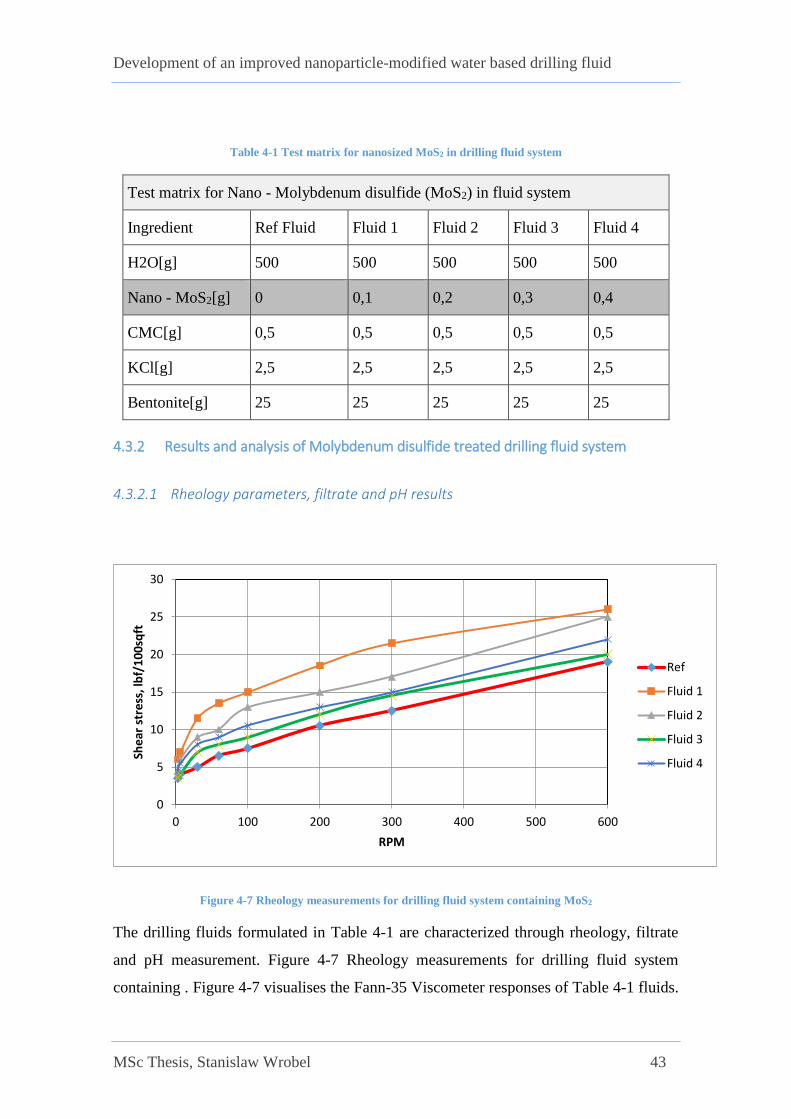
Table 4-1 Test matrix for nanosized MoS2 in drilling fluid system
Test matrix for Nano - Molybdenum disulfide (MoS2) in fluid system
Ingredient Ref Fluid Fluid 1 Fluid 2 Fluid 3 Fluid 4
H2O[g] 500 500 500 500 500
Nano - MoS2[g] 0 0,1 0,2 0,3 0,4
CMC[g] 0,5 0,5 0,5 0,5 0,5
KCl[g] 2,5 2,5 2,5 2,5 2,5
Bentonite[g] 25 25 25 25 25
4.3.2 Results and analysis of Molybdenum disulfide treated drilling fluid system
4.3.2.1 Rheology parameters, filtrate and pH results
Figure 4-7 Rheology measurements for drilling fluid system containing MoS2
The drilling fluids formulated in Table 4-1 are characterized through rheology, filtrate
and pH measurement. Figure 4-7 Rheology measurements for drilling fluid system
containing . Figure 4-7 visualises the Fann-35 Viscometer responses of Table 4-1 fluids.
0
5
10
15
20
25
30
0 100 200 300 400 500 600
She
ar s
tre
ss, l
bf/
10
0sq
ft
RPM
Ref
Fluid 1
Fluid 2
Fluid 3
Fluid 4

Development of an improved nanoparticle-modified water based drilling fluid
MSc Thesis, Stanislaw Wrobel 44
The addition of MoS2 shows a significant impact on the reference fluid. One can also
observe that as the nano concentration increases, viscosity changes. As shown on the
Figure 4-7, the addition 0.1g exhibits a higher impact, whereas increasing the
concentration results in a different change in viscometer result relative to the reference
fluid and Fluid 1. This shows that the effect of nano has not a non-linear effect on
rheology and there exhibits an optimum concentration that works best in the water
based drilling fluid. That has something to do with the disintegration/dispersed of the
bentonite system and agglomerate/aggregate.
The drilling fluid behaviors are characterized in terms of their gel straight, flow
resistance, filtrate and pH. The experimental results were applied in the Bingham- and
Power Law model. Their parameters are calculated and shown in Figure 4-8 and Figure
4-9 respectively.
As displayed on Figure 4-8, the addition of nanosized MoS2 has a great impact on the
plastic viscosity (PV) when compared with the nano-free fluid system (reference). All
MoS2 modified fluid indicates a significant effect indicate a significant effect in terms
of yield stress. The greatest improvement of YS, by 183%, is by the 0.1g MoS2
modified system. The other modified systems show an increase of up to 50%.
In literature, it is documented that lower shear yield strength (LSYS) of drilling fluid is
used to evaluate the barite sagging potential of a drilling fluid. Scott et al, [28] has
analyzed sagging management and control issues. The authors have presented three
field case studies in an attempt to investigate sag occurrence, suspected causes and
treatment. From the presented case studies, the authors indicated that insufficient lower
shear yield stress (LSYS) is the main cause for sagging. A very effective method to
reduce sag tendencies is treating the fluid system to obtain desired LSYS recommended
range [7-15lbf/100sqft]. The low shear yield stress (LSYS) is calculated from the lower
shear rate readings as (𝐿𝑆𝑌𝑆 = 2𝜃3 − 𝜃6).

Development of an improved nanoparticle-modified water based drilling fluid
MSc Thesis, Stanislaw Wrobel 45
Figure 4-8 Presentation of PV, YS and LSYS results based on rheology measurements for MoS2 drilling fluid
system
The shear yield stress parameter (LSYS) is low in general for fluids with CMC polymer,
compaired to Xanthan Gum effects. That is because it yields lower viscosity. That is not
very good for particle settling, which should be avoided during drilling. As seen in
Figure 4-8, the addition of very small increase in concentration of nanoparticles
changes LSYS from 3 in the reference to 5.0 in 0.1g added MoS2, to 3.0in 0.2g added
additive, to 3.0 with 0.3g added MoS2 and 3.5 for 0.4g added MoS2 to the reference
fluid formula. The addition of 0.1g seems to yield an optimum effect at this low
concentration range.
Figure 4-9 Consistency index(k) and n-value for MoS2 at different temperatures.
The Power Law model factors, n and k are shown in Figure 4-9. In all cases the n-value
is below 1.0. That is an indication that the fluids express pseudoplastic behaviour. Since
Ref Fluid 1 Fluid 2 Fluid 3 Fluid 4
PV (cP) 6,5 4,5 8 5,5 7
YS (lbf/100sqft) 6 17 9 9 8
LSYS (lbf/100sqft) 3 5 3 3 3,5
02468
1012141618
Par
ame
ters
RefRef + 0.1gm
MoS2Ref + 0.2gm
MoS2Ref + 0.3gm
MoS2Ref + 0.4gm
MoS2
n 0,60 0,27 0,56 0,46 0,55
k (lbf-s^n/100sqft) 0,29 3,89 0,53 0,80 0,48
0,00
0,50
1,00
1,50
2,00
2,50
3,00
3,50
4,00
4,50
Par
ame
ters

Development of an improved nanoparticle-modified water based drilling fluid
MSc Thesis, Stanislaw Wrobel 46
all pseudoplastic fluids are shear thinning, viscosity is decreases when shear rate is
increased. As we can see the n-value is fairly constant for set temperature and no effect
from added nanoparticles can be observed, for most of the fluid samples. The fluid with
+0.1g added MoS2 yields an n-value of 0.27 compaired to 0.60 from nano-free fluid,
meaning the fluid is more viscous, confirmed in Figure 4-7.
The Consistency Index, k, describes the average slope of the shear stress – shear rate
curve. It is sometimes called the viscosity index. A higher value of k implies that a fluid
has higher viscosity. The highest k value from the test of MoS2 added fluids is the one
with the least (+0.1g) added MoS2 nanoparticles.
Figure 4-10 Diagram and data for filtrate loss of drilling fluid system containing MoS2
As seen in Figure 4-10, the drilling fluid system containing CMC polymer for reduced
filtration loss sets a reference filtrate loss of 7.50mL. The addition of 0.1g and 0.2g
MoS2 into the reference system results in increased filtrate loss to 7.75mL and 8.00mL
respectively. Nonetheless, Fluid 3 and Fluid 4 with 0.3g and 0.4g added yield the same
filtrate loss as the base fluid. That shows that there is no linear relationship with
increasing filtrate loss with increased concentration of MoS2 nanoparticles, since the
filtrate loss is the same for fluid 3 and 4 as it is for the reference fluid.
As seen in Table 4-2 the pH is increased by 0.05 or 0.10 from the reference level of
8.95. The addition of MoS2 nanoparticles seems to have no significant effect on the pH
level of the base fluid, meaning that that the surface chemistry of the nanoparticles does
not react with water to change the H+ concentration of the fluid.
Ref Fluid 1 Fluid 2 Fluid 3 Fluid 4
Filtrate [mL] 7,50 7,75 8,00 7,50 7,50
6,00
6,50
7,00
7,50
8,00
8,50
9,00
7.5
min
Filt
rate
, ml

Development of an improved nanoparticle-modified water based drilling fluid
MSc Thesis, Stanislaw Wrobel 47
Table 4-2 pH measurements of MoS2
Measurement Ref fluid Fluid 1 Fluid 2 Fluid 3 Fluid 4
pH 8,95 9,05 9,05 9.0 9,05
4.3.2.2 Rheology modeling
Table 4-3 describes the models with their function and its input parameters based on the
MoS2 reference fluid. The %-deviation from the actual measurement relative to the
model predicted value is also given. With this, we can easily analyze which model
predicts the fluid behavior the best. Blank fields mean that the model does not have the
output parameter in question.
Table 4-3 Description of rheological models with MoS2-reference fluid output parameters and %-deviation
Parameters
Model Equation τo,τy, A k, C n, B μp, μ %-Dev cP
Herschel Bulkley
0.0733*0.92310+2.347 3,4226 0,1234 0,7090
2,04
Unified 2.347+0.0731*0.9235 3,2010 0,2144 0,6223
3,10
Power Law 0.9594*0.5227
2,1289 0,2966
9,47
Bingham 0.0417*+3.307 4,6456
0,0160 10,75 7,6608
Newtonian 0.0464*
0,0226 50,34 10,8209
Robertson and Stiff
0.1078*(35.5807+)0.867
3 0,3775 55,6794 0,5666
2,67
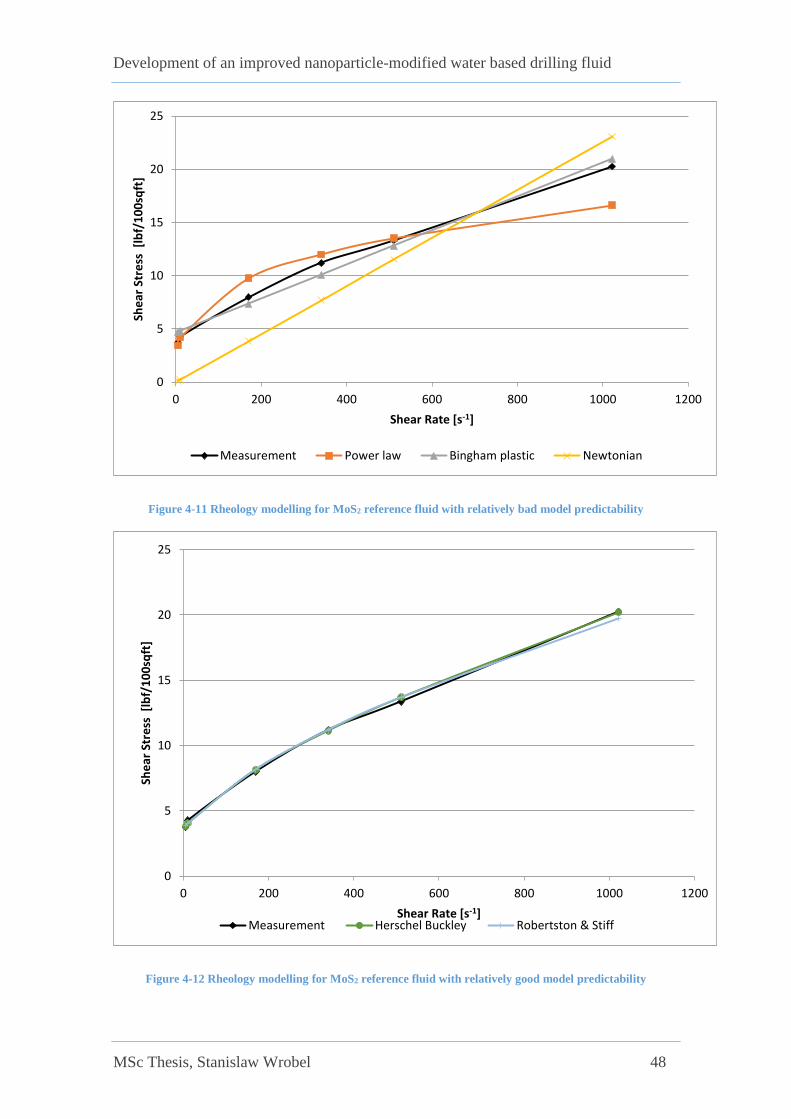
To get an idea about the relative accuracy of the models, Figure 4-11 and Figure 4-12
below display the models in practice. With the axes kept the same for both figures, it is
obvious to see that the models in Figure 4-11 are much less accurate relative to those in
Figure 4-12, seen below. The most accurate model for the reference fluid in this case is
the Herschel Bulkley model, as the percent-deviation is as low as 2.04% (see Table
4-3). The least accurate is the Newtonian Model, which deviates by 50.34% from the
original measurements. Figures and tables for all the other fluids with all models can be
found in the Appendix A
Development of an improved nanoparticle-modified water based drilling fluid
MSc Thesis, Stanislaw Wrobel 48
Figure 4-11 Rheology modelling for MoS2 reference fluid with relatively bad model predictability
Figure 4-12 Rheology modelling for MoS2 reference fluid with relatively good model predictability
0
5
10
15
20
25
0 200 400 600 800 1000 1200
She
ar S
tre
ss [
lbf/
10
0sq
ft]
Shear Rate [s-1]
Measurement Power law Bingham plastic Newtonian
0
5
10
15
20
25
0 200 400 600 800 1000 1200
She
ar S
tre
ss [
lbf/
10
0sq
ft]
Shear Rate [s-1]Measurement Herschel Buckley Robertston & Stiff
Development of an improved nanoparticle-modified water based drilling fluid
MSc Thesis, Stanislaw Wrobel 49
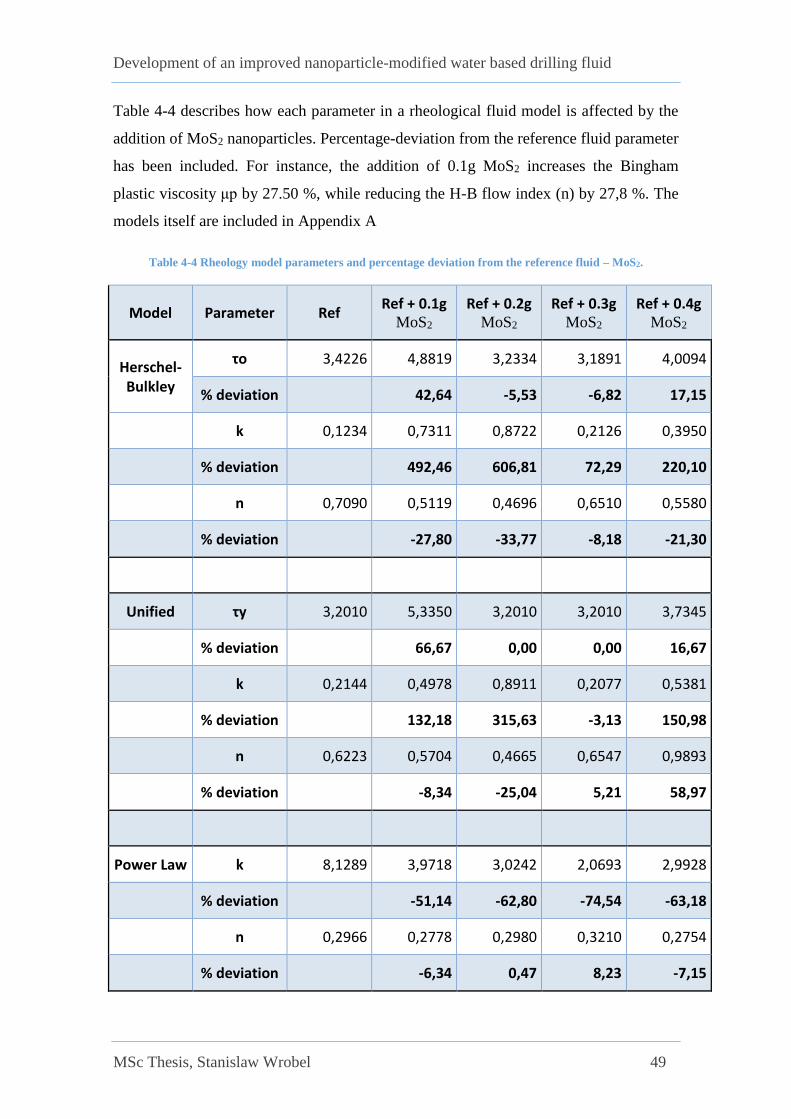
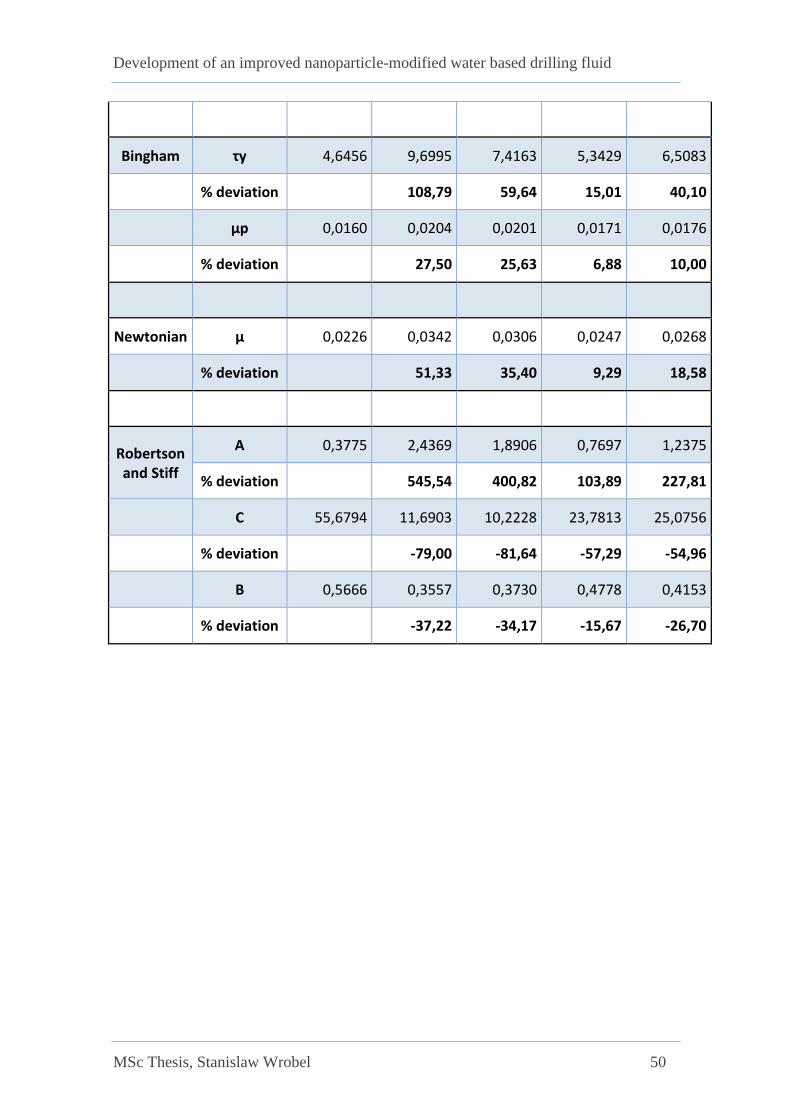
Table 4-4 describes how each parameter in a rheological fluid model is affected by the
addition of MoS2 nanoparticles. Percentage-deviation from the reference fluid parameter
has been included. For instance, the addition of 0.1g MoS2 increases the Bingham
plastic viscosity μp by 27.50 %, while reducing the H-B flow index (n) by 27,8 %. The
models itself are included in Appendix A
Table 4-4 Rheology model parameters and percentage deviation from the reference fluid – MoS2.
Model Parameter Ref Ref + 0.1g
MoS2 Ref + 0.2g
MoS2 Ref + 0.3g
MoS2 Ref + 0.4g
MoS2
Herschel-Bulkley
τo 3,4226 4,8819 3,2334 3,1891 4,0094
% deviation
42,64 -5,53 -6,82 17,15
k 0,1234 0,7311 0,8722 0,2126 0,3950
% deviation
492,46 606,81 72,29 220,10
n 0,7090 0,5119 0,4696 0,6510 0,5580
% deviation -27,80 -33,77 -8,18 -21,30
Unified τy 3,2010 5,3350 3,2010 3,2010 3,7345
% deviation
66,67 0,00 0,00 16,67
k 0,2144 0,4978 0,8911 0,2077 0,5381
% deviation
132,18 315,63 -3,13 150,98
n 0,6223 0,5704 0,4665 0,6547 0,9893
% deviation -8,34 -25,04 5,21 58,97
Power Law k 8,1289 3,9718 3,0242 2,0693 2,9928
% deviation
-51,14 -62,80 -74,54 -63,18
n 0,2966 0,2778 0,2980 0,3210 0,2754
% deviation -6,34 0,47 8,23 -7,15
Development of an improved nanoparticle-modified water based drilling fluid
MSc Thesis, Stanislaw Wrobel 50
Bingham τy 4,6456 9,6995 7,4163 5,3429 6,5083
% deviation
108,79 59,64 15,01 40,10
μp 0,0160 0,0204 0,0201 0,0171 0,0176
% deviation 27,50 25,63 6,88 10,00
Newtonian μ 0,0226 0,0342 0,0306 0,0247 0,0268
% deviation 51,33 35,40 9,29 18,58
Robertson and Stiff
A 0,3775 2,4369 1,8906 0,7697 1,2375
% deviation
545,54 400,82 103,89 227,81
C 55,6794 11,6903 10,2228 23,7813 25,0756
% deviation
-79,00 -81,64 -57,29 -54,96
B 0,5666 0,3557 0,3730 0,4778 0,4153
% deviation -37,22 -34,17 -15,67 -26,70

Development of an improved nanoparticle-modified water based drilling fluid
MSc Thesis, Stanislaw Wrobel 51
4.3.2.3 Coefficient of friction
The lubricity of the drilling fluids has been measured using the CSM tribometer, shown
in Figure 4-4 on p.39. The friction coefficient was measured on ball and plate surface
contact in the presence of water based drilling fluid. The steel ball is an alloy of 6
chromium and 6mm diameter. At first, several tests were carried out in order to calibrate
the test machine and get reliable results.
For all tests, a constant normal force of 10N was applied to the tribometer arm. The
heater was set to maintain a ambient temperature so that the fluid system is exposed to a
22oC. The testing was allowed to rotate for a linear distance of 20m and the test duration
was ~8,33min. The linear speed was set to be 4 cm/s. For each testing, we only vary the
surface radius. The test has been performed at three temperatures, namely 22°C, 50°C
and 70°C. The average value of the experiments is used to generate temperature
dependent coefficient of friction profile.
Figure 4-13 Testing panel of Tribometer
The testing interface panel is shown in Figure 4-13. The numbers shown on the figure
are: Sampling rate (1), Heating device (2), Normal load applied on Tribometer arm (3),
radius between the center and the tribometer ball pin (4) distance of testing (5), linear
speed of sample with respect to tribometer arm (6)
Development of an improved nanoparticle-modified water based drilling fluid
MSc Thesis, Stanislaw Wrobel 52
0,4550,355
0,252 0,237 0,202
0,000
0,200
0,400
0,600
µ
Mean Friction Coefficient for Friction Coefficient
at 22°C
Ref Fluid 1 Fluid 2 Fluid 3 Fluid 4
Figure 4-15 Mean Friction Coefficients for MoS2
at 22°C
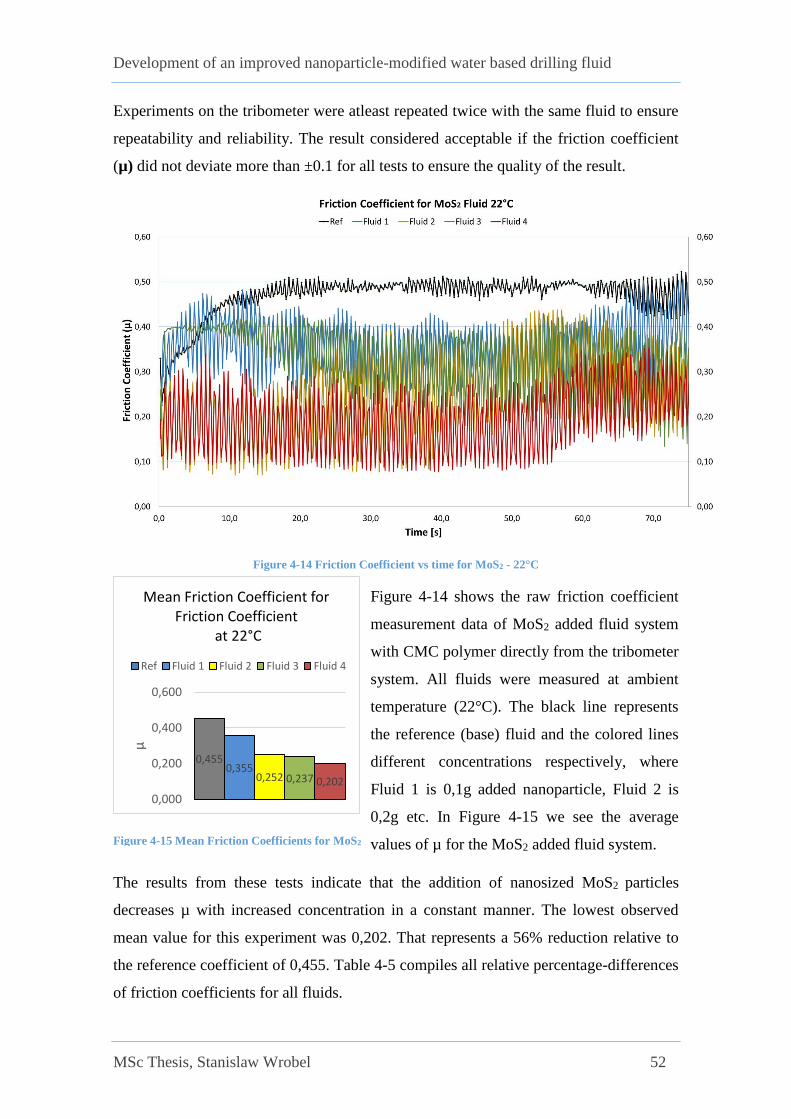
Experiments on the tribometer were atleast repeated twice with the same fluid to ensure
repeatability and reliability. The result considered acceptable if the friction coefficient
(µ) did not deviate more than ±0.1 for all tests to ensure the quality of the result.
Figure 4-14 Friction Coefficient vs time for MoS2 - 22°C
Figure 4-14 shows the raw friction coefficient
measurement data of MoS2 added fluid system
with CMC polymer directly from the tribometer
system. All fluids were measured at ambient
temperature (22°C). The black line represents
the reference (base) fluid and the colored lines
different concentrations respectively, where
Fluid 1 is 0,1g added nanoparticle, Fluid 2 is
0,2g etc. In Figure 4-15 we see the average
values of µ for the MoS2 added fluid system.
The results from these tests indicate that the addition of nanosized MoS2 particles
decreases µ with increased concentration in a constant manner. The lowest observed
mean value for this experiment was 0,202. That represents a 56% reduction relative to
the reference coefficient of 0,455. Table 4-5 compiles all relative percentage-differences
of friction coefficients for all fluids.

Development of an improved nanoparticle-modified water based drilling fluid
MSc Thesis, Stanislaw Wrobel 53
0,565
0,3720,268
0,4020,327
0,000
0,200
0,400
0,600
µ
Mean Friction Coefficients for Friction Coefficient
at 55°C
Ref Fluid 1 Fluid 2 Fluid 3 Fluid 4
Figure 4-17 Mean Friction Coefficients for
MoS2 at 55°C
Figure 4-16 Friction Coefficient vs time for MoS2 - 55°C
At 55°C (see Figure 4-16, Figure 4-17) the
friction coefficient is notably elevated for all
fluid samples. Yet the lubricating effect of
MoS2 nanoparticles can be clearly observed.
The constant reduction in friction coefficient by
increased concentration of nanoparitcles that
was observed at seems diminished as seen at
22°C, but the friction reduction is percentage
wise higher now for lower concentration of
added MoS2, where Fluid 1 reduces friction by
34% at 55°C while at 22° the reduction was only by 22%. This time 0.2g added nano
yields the most effect to decrease µ indicated as Fluid 2, resulting in a µ reduction by
53%.

Development of an improved nanoparticle-modified water based drilling fluid
MSc Thesis, Stanislaw Wrobel 54
0,5290,386 0,340 0,331 0,344
0,000
0,200
0,400
0,600
µ
Mean Friction Coefficient for Friction Coefficient
at 70°C
Ref Fluid 1 Fluid 2 Fluid 3 Fluid 4
Figure 4-19 Mean Friction Coefficients for
MoS2 at 70°C
Figure 4-18 Friction Coefficient vs time for MoS2 - 70°C
Increasing the temperature from 55°C to 70°C
the friction increases again for all fluid samples
except the reference fluid. This reduces the
maximum friction reduction obtained from
added MoS2. As seen in Figure 4-19 all fluids
with MoS2 nano-additive have reduced friction.
The lowest friction coefficient measured at
70°C is Fluid 3 has a reduced µ of 0.331(-38%)
relative to 0.529 in the base fluid, resulting in a
reduction by 38%.
As shown in those figures the addition of MoS2 nanoparticles yield a major decrease in
friction coefficient values for all concentrations and temperatures. Table 4-5 shows the
percentage reduction for all fluids relative to the reference fluid. The numbers are based
on the mean values shown in Figure 12, 14 and 16.
Development of an improved nanoparticle-modified water based drilling fluid
MSc Thesis, Stanislaw Wrobel 55
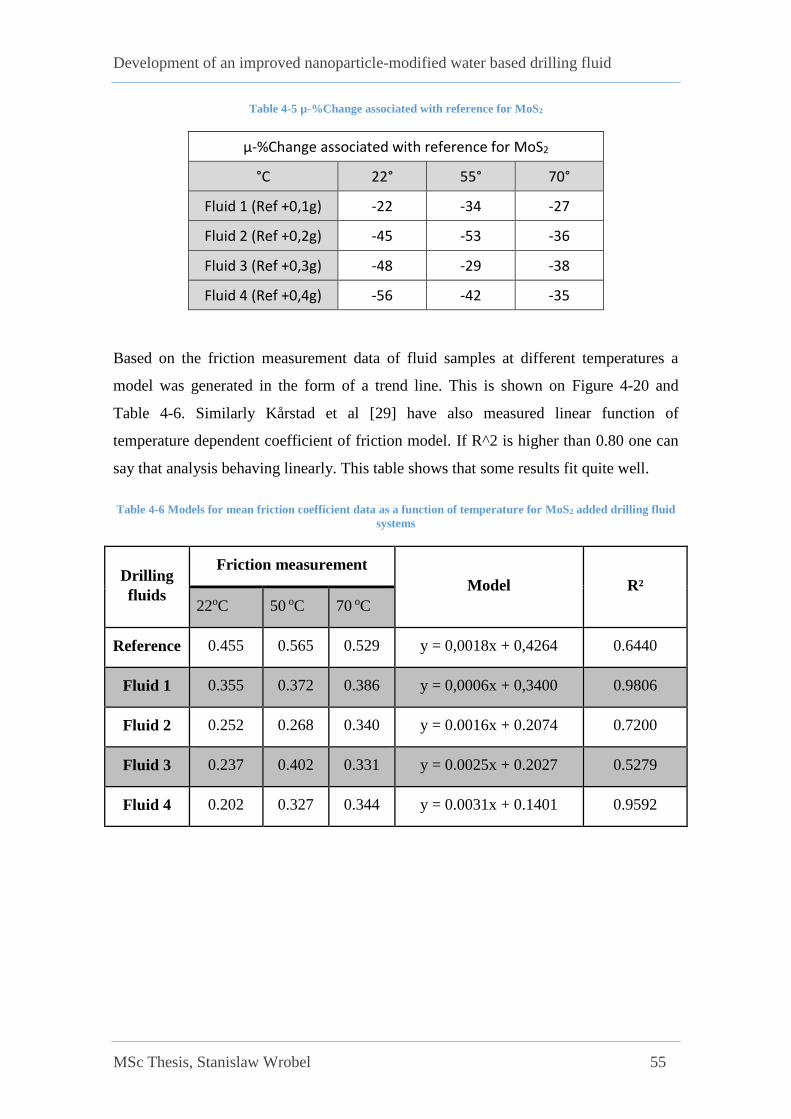
Table 4-5 µ-%Change associated with reference for MoS2
µ-%Change associated with reference for MoS2
°C 22° 55° 70°
Fluid 1 (Ref +0,1g) -22 -34 -27
Fluid 2 (Ref +0,2g) -45 -53 -36
Fluid 3 (Ref +0,3g) -48 -29 -38
Fluid 4 (Ref +0,4g) -56 -42 -35
Based on the friction measurement data of fluid samples at different temperatures a
model was generated in the form of a trend line. This is shown on Figure 4-20 and
Table 4-6. Similarly Kårstad et al [29] have also measured linear function of
temperature dependent coefficient of friction model. If R^2 is higher than 0.80 one can
say that analysis behaving linearly. This table shows that some results fit quite well.
Table 4-6 Models for mean friction coefficient data as a function of temperature for MoS2 added drilling fluid
systems
Drilling
fluids
Friction measurement
Model R²
22oC 50 oC 70 oC
Reference 0.455 0.565 0.529 y = 0,0018x + 0,4264 0.6440
Fluid 1 0.355 0.372 0.386 y = 0,0006x + 0,3400 0.9806
Fluid 2 0.252 0.268 0.340 y = 0.0016x + 0.2074 0.7200
Fluid 3 0.237 0.402 0.331 y = 0.0025x + 0.2027 0.5279
Fluid 4 0.202 0.327 0.344 y = 0.0031x + 0.1401 0.9592

Development of an improved nanoparticle-modified water based drilling fluid
MSc Thesis, Stanislaw Wrobel 56
Figure 4-20 Mean Friction Coefficiens vs temperature with trendline for MoS2
y = 0,0018x + 0,4264R² = 0,644
y = 0,0006x + 0,34R² = 0,9806
y = 0,0016x + 0,2074R² = 0,72
y = 0,0025x + 0,2027R² = 0,5279
y = 0,0031x + 0,1401R² = 0,9592
0,100
0,200
0,300
0,400
0,500
0,600
10 20 30 40 50 60 70 80
Fric
tio
n C
oe
ffic
ien
t
Temperature C°
Ref
Fluid 1
Fluid 2
Fluid 3
Fluid 4
Linear (Ref)
Linear (Fluid 1)
Linear (Fluid 2)
Linear (Fluid 3)
Linear (Fluid 4)
Development of an improved nanoparticle-modified water based drilling fluid
MSc Thesis, Stanislaw Wrobel 57
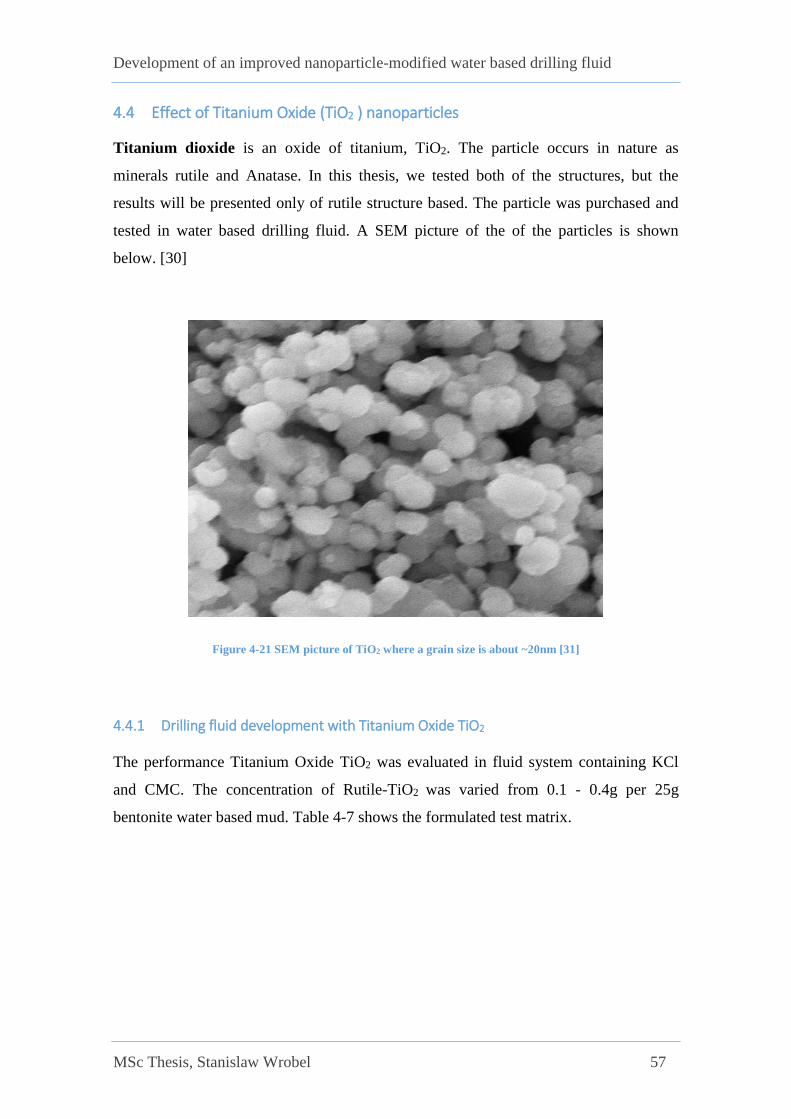
4.4 Effect of Titanium Oxide (TiO2 ) nanoparticles
Titanium dioxide is an oxide of titanium, TiO2. The particle occurs in nature as
minerals rutile and Anatase. In this thesis, we tested both of the structures, but the
results will be presented only of rutile structure based. The particle was purchased and
tested in water based drilling fluid. A SEM picture of the of the particles is shown
below. [30]
Figure 4-21 SEM picture of TiO2 where a grain size is about ~20nm [31]
4.4.1 Drilling fluid development with Titanium Oxide TiO2
The performance Titanium Oxide TiO2 was evaluated in fluid system containing KCl
and CMC. The concentration of Rutile-TiO2 was varied from 0.1 - 0.4g per 25g
bentonite water based mud. Table 4-7 shows the formulated test matrix.
Development of an improved nanoparticle-modified water based drilling fluid
MSc Thesis, Stanislaw Wrobel 58
The fluids were mixed in the order:
500g H2O + Xg Nano + 2,5g KCl + 0,5g CMC + 25g Bentonite
Table 4-7 Test matrix for nanosized Rutile-TiO2 drilling fluid system
Test matrix for nanosized Rutile-TiO2 in fluid system
Ingredient Ref Fluid Fluid 1 Fluid 2 Fluid 3 Fluid 4
H2O [g] 500 500 500 500 500
Rutile-TiO2[g] 0 0,1 0,2 0,3 0,4
KCl[g] 2,5 2,5 2,5 2,5 2,5
CMC[g] 0,5 0,5 0,5 0,5 0,5
Bentonite[g] 25 25 25 25 25
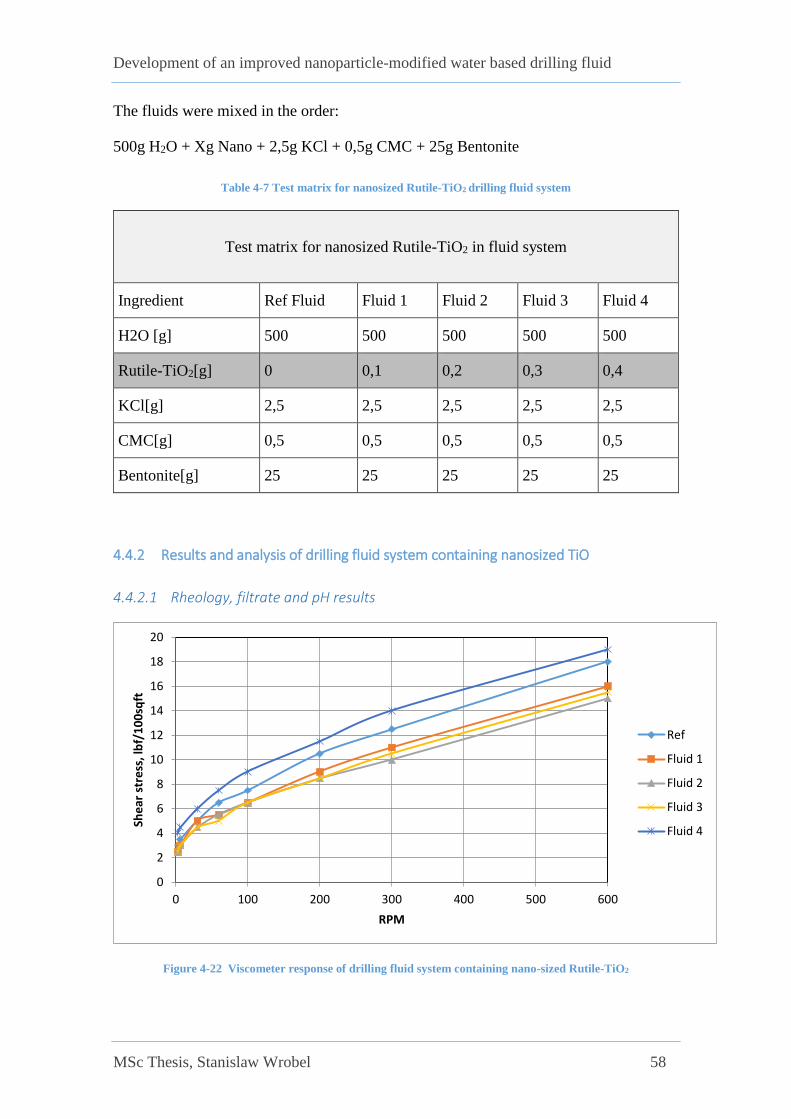
4.4.2 Results and analysis of drilling fluid system containing nanosized TiO
4.4.2.1 Rheology, filtrate and pH results
Figure 4-22 Viscometer response of drilling fluid system containing nano-sized Rutile-TiO2
0
2
4
6
8
10
12
14
16
18
20
0 100 200 300 400 500 600
She
ar s
tre
ss, l
bf/
10
0sq
ft
RPM
Ref
Fluid 1
Fluid 2
Fluid 3
Fluid 4

Development of an improved nanoparticle-modified water based drilling fluid
MSc Thesis, Stanislaw Wrobel 59
Figure 4-22 displays the Fann-35 Viscometer responses of fluids. The addition of TiO2
shows a significant impact on the reference fluid. One can also observe that as the
nanoparticles concentration increases, viscosity changes. We see that the addition 0.4g
exhibits a higher impact in the form of increased viscosity, whereas other concentration
result in a reduction in viscometer response compared to the reference fluid. This
implies that the effect of nanoparticle concentration has a non-linear effect on rheology.
Hence, the optimum concentration that works best in the water based drilling fluid has
to be found empirically. That has something to do with the disintegration/dispersed and
agglomeration/aggregation of the bentonite system.
The drilling fluid behaviors are characterized in terms of their gel straight, flow
resistance, filtrate and pH. From this, the commonly used rheology models, the
Bingham and Power law parameters are calculated and shown in Figure 4-23 and Figure
4-24 respectively.
Figure 4-23 Presentation of PV, YS and LSYS results based on rheology measurements of nanosized Rutile-
TiO2 fluid
Figure 4-23 shows that Bingham plastic viscosity generally is not affected by addition
of TiO2. Naturally the PV would increase for added solids, but perhaps the amount
added was not sufficient for this effect to be observed. Similarly, the yield stress (YS)
also is not influenced by the nano-additive. As described in the literature study part, the
electrostatic force among the charged particles causes yield stress. During this thesis
work, the electrical resistivity of the particles mixed with 500gm water and the results
shows no effect on the measurement.
Ref Fluid 1 Fluid 2 Fluid 3 Fluid 4
PV (cP) 4,5 5,5 4 5 5
YS (lbf/100sqft) 3 3 3 4 3
LSYS (lbf/100sqft) 1,5 1 0 1 0,5
0
1
2
3
4
5
6
Par
ame
ters

Development of an improved nanoparticle-modified water based drilling fluid
MSc Thesis, Stanislaw Wrobel 60
The lower shear yield stress parameter (LSYS) is low in general for fluids with CMC
polymer, because the viscosity is low. That is not very good for handling sagging
(settling of particles). As Figure 4-23 states, the addition of very small increase in
concentration of TiO2 nanoparticles changes LSYS keeps all fluids at an LSYS of about
1.0, which is essentially an insignificant change in fluid parameters from added
nanoparticles.
Figure 4-24 Consistency Index(k) and n-value for TiO2 at different temperatures.
The Power Law parameters in Figure 4-24 show that in all cases the n-value is below
1.0. Only fluid 4 indicates a difference with a lowered n-value. The Consistency Index,
k, is increased for fluid 4 resembling a higher viscosity, also proven in Figure 4-22 from
the actual measurements.
Figure 4-25 shows the measured filtrate loss of the drilling fluids. Here also the addition
of nano does not show any positive impact in improving the petro-physical property of
the filter cake. That might have something to do with the ball-like structure og rutile-
TiO2; perhaps more flat shaped or elongated crystal structures work better. Therefore,
all the fluid loss is almost equal to and even higher than the nano -free reference fluid
system. For Fluid 1 and Fluid 4, 0.1g and 0.4g added TiO2 nanoparticles increased the
filtration loss from 7.5mL to 8.25mL(+10%) and 8.3mL(+10.7%) respectively.
XG-ref+0.1ggraphene
CMC-RefCMC-ref+0.4g
MoS2
40 38 19 22
33 32 12,5 15
0
5
10
15
20
25
30
35
40
Par
ame
ters

Development of an improved nanoparticle-modified water based drilling fluid
MSc Thesis, Stanislaw Wrobel 61
Figure 4-25 Diagram and data for filtrate loss of drilling fluid system containing TiO2
As seen in Table 4-8, the addition of TiO2 to the base fluid system seems to effect on
the acidity/alkalinity on the reference fluid system, meaning that that the surface
chemistry of the particles do not react with water to change the H+ concentration of the
fluid.
Table 4-8 pH measurements for TiO2
Measurement Ref fluid Fluid 1 Fluid 2 Fluid 3 Fluid 4
pH 8,95 8,95 8,9 8,85 8,85
Ref Fluid 1 Fluid 2 Fluid 3 Fluid 4
Filtrate loss [mL] 7,50 8,25 7,50 7,50 8,30
0,00
2,00
4,00
6,00
8,00
10,007
.5m
in F
iltra
te, m
l
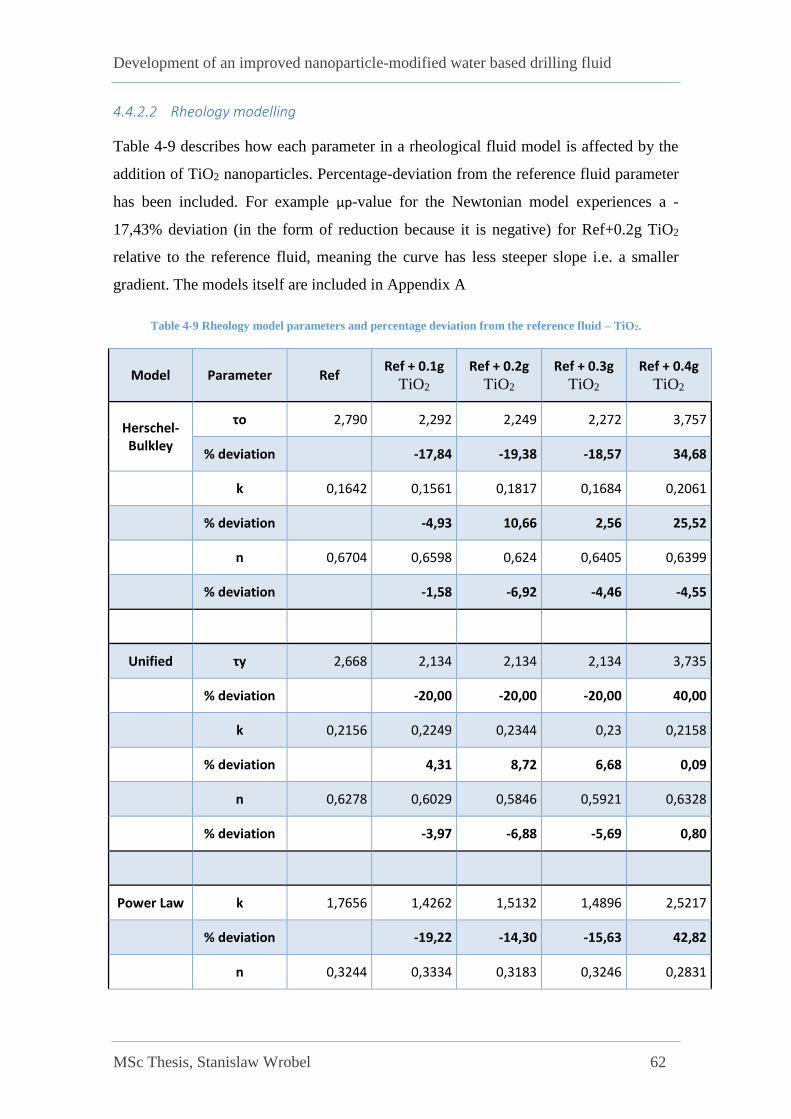
Development of an improved nanoparticle-modified water based drilling fluid
MSc Thesis, Stanislaw Wrobel 62
4.4.2.2 Rheology modelling
Table 4-9 describes how each parameter in a rheological fluid model is affected by the
addition of TiO2 nanoparticles. Percentage-deviation from the reference fluid parameter
has been included. For example μp-value for the Newtonian model experiences a -
17,43% deviation (in the form of reduction because it is negative) for Ref+0.2g TiO2
relative to the reference fluid, meaning the curve has less steeper slope i.e. a smaller
gradient. The models itself are included in Appendix A
Table 4-9 Rheology model parameters and percentage deviation from the reference fluid – TiO2.
Model Parameter Ref Ref + 0.1g
TiO2
Ref + 0.2g
TiO2
Ref + 0.3g
TiO2
Ref + 0.4g
TiO2
Herschel-Bulkley
τo 2,790 2,292 2,249 2,272 3,757
% deviation
-17,84 -19,38 -18,57 34,68
k 0,1642 0,1561 0,1817 0,1684 0,2061
% deviation
-4,93 10,66 2,56 25,52
n 0,6704 0,6598 0,624 0,6405 0,6399
% deviation -1,58 -6,92 -4,46 -4,55
Unified τy 2,668 2,134 2,134 2,134 3,735
% deviation
-20,00 -20,00 -20,00 40,00
k 0,2156 0,2249 0,2344 0,23 0,2158
% deviation
4,31 8,72 6,68 0,09
n 0,6278 0,6029 0,5846 0,5921 0,6328
% deviation -3,97 -6,88 -5,69 0,80
Power Law k 1,7656 1,4262 1,5132 1,4896 2,5217
% deviation
-19,22 -14,30 -15,63 42,82
n 0,3244 0,3334 0,3183 0,3246 0,2831
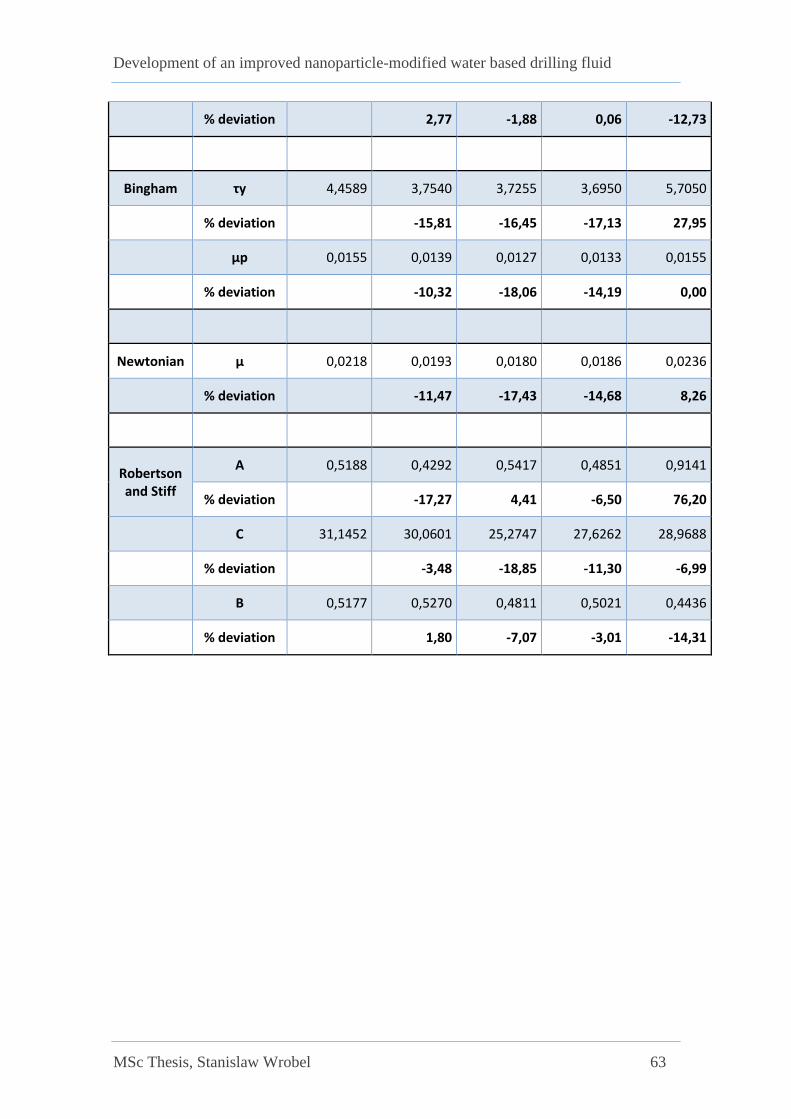
Development of an improved nanoparticle-modified water based drilling fluid
MSc Thesis, Stanislaw Wrobel 63
% deviation 2,77 -1,88 0,06 -12,73
Bingham τy 4,4589 3,7540 3,7255 3,6950 5,7050
% deviation
-15,81 -16,45 -17,13 27,95
μp 0,0155 0,0139 0,0127 0,0133 0,0155
% deviation -10,32 -18,06 -14,19 0,00
Newtonian μ 0,0218 0,0193 0,0180 0,0186 0,0236
% deviation -11,47 -17,43 -14,68 8,26
Robertson and Stiff
A 0,5188 0,4292 0,5417 0,4851 0,9141
% deviation
-17,27 4,41 -6,50 76,20
C 31,1452 30,0601 25,2747 27,6262 28,9688
% deviation
-3,48 -18,85 -11,30 -6,99
B 0,5177 0,5270 0,4811 0,5021 0,4436
% deviation 1,80 -7,07 -3,01 -14,31

Development of an improved nanoparticle-modified water based drilling fluid
MSc Thesis, Stanislaw Wrobel 64
4.4.2.3 Coefficient of friction result
Figure 4-26 Friction coefficient tribometer measurement as a function of time - TiO2 Rutile 22°C
One might notice that the reference here is
lower though the fluid is the same as for TiO2.
That’s because the experiments were done with
only 5N constant normal force for all TiO2
fluids. Whereas, all the other experiments
where done with 10N. Nonetheless the relative
change in friction reduction due to added
nanoparticles was expected to be visible if
there is any.
Figure 4-27 shows that the reference the
tribometer response yields a mean friction
coefficient of 0,268. The addition of TiO2
nanoparticles does not seems to affect the measurement in any positive way. Fluid 1 and
Fluid 3 yield almost the same result as the base fluid, whereas Fluid 2 and Fluid 4
increase the friction coefficient to 0.28 and 0.29 respectively.
0,268 0,2680,280
0,270
0,290
0,250
0,260
0,270
0,280
0,290
0,300
µ
Mean Friction Coefficient for Friction Coefficient
at 22°C
Ref Fluid 1 Fluid 2 Fluid 3 Fluid 4
Figure 4-27 Mean Friction Coefficients for TiO2
at 22°C
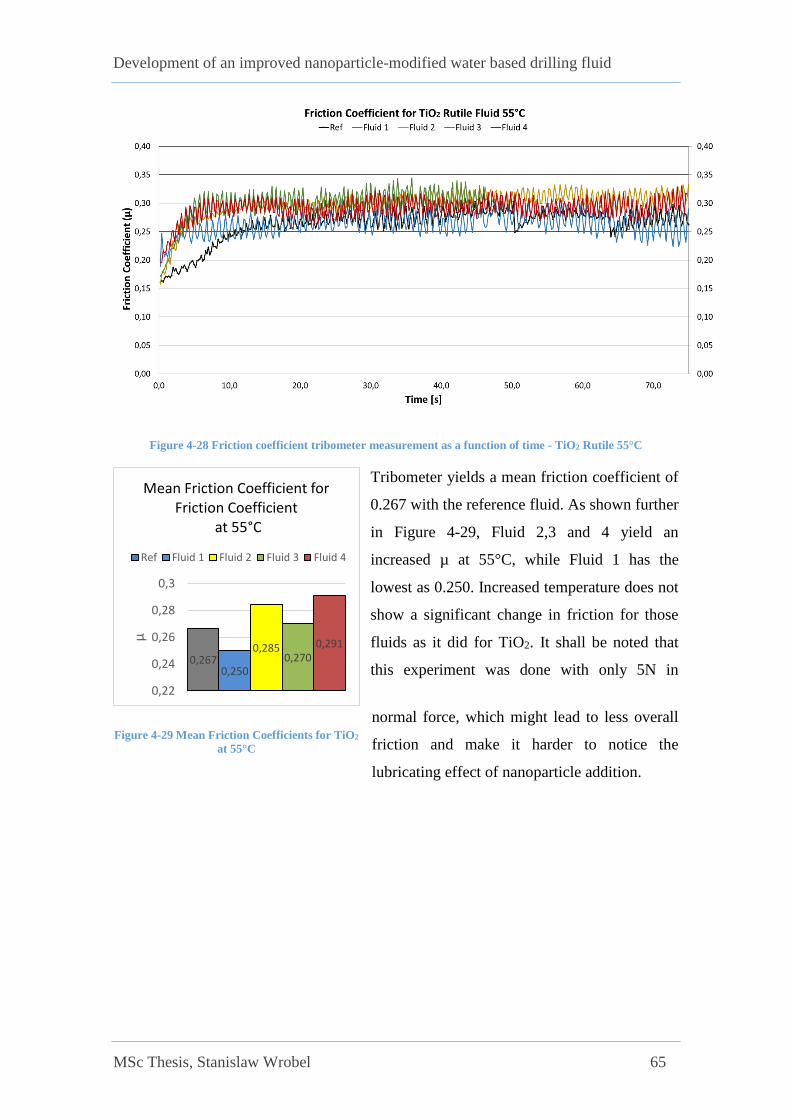
Development of an improved nanoparticle-modified water based drilling fluid
MSc Thesis, Stanislaw Wrobel 65
0,2670,250
0,2850,270
0,291
0,22
0,24
0,26
0,28
0,3
µ
Mean Friction Coefficient for Friction Coefficient
at 55°C
Ref Fluid 1 Fluid 2 Fluid 3 Fluid 4
Figure 4-29 Mean Friction Coefficients for TiO2
at 55°C
Figure 4-28 Friction coefficient tribometer measurement as a function of time - TiO2 Rutile 55°C
Tribometer yields a mean friction coefficient of
0.267 with the reference fluid. As shown further
in Figure 4-29, Fluid 2,3 and 4 yield an
increased µ at 55°C, while Fluid 1 has the
lowest as 0.250. Increased temperature does not
show a significant change in friction for those
fluids as it did for TiO2. It shall be noted that
this experiment was done with only 5N in
normal force, which might lead to less overall
friction and make it harder to notice the
lubricating effect of nanoparticle addition.
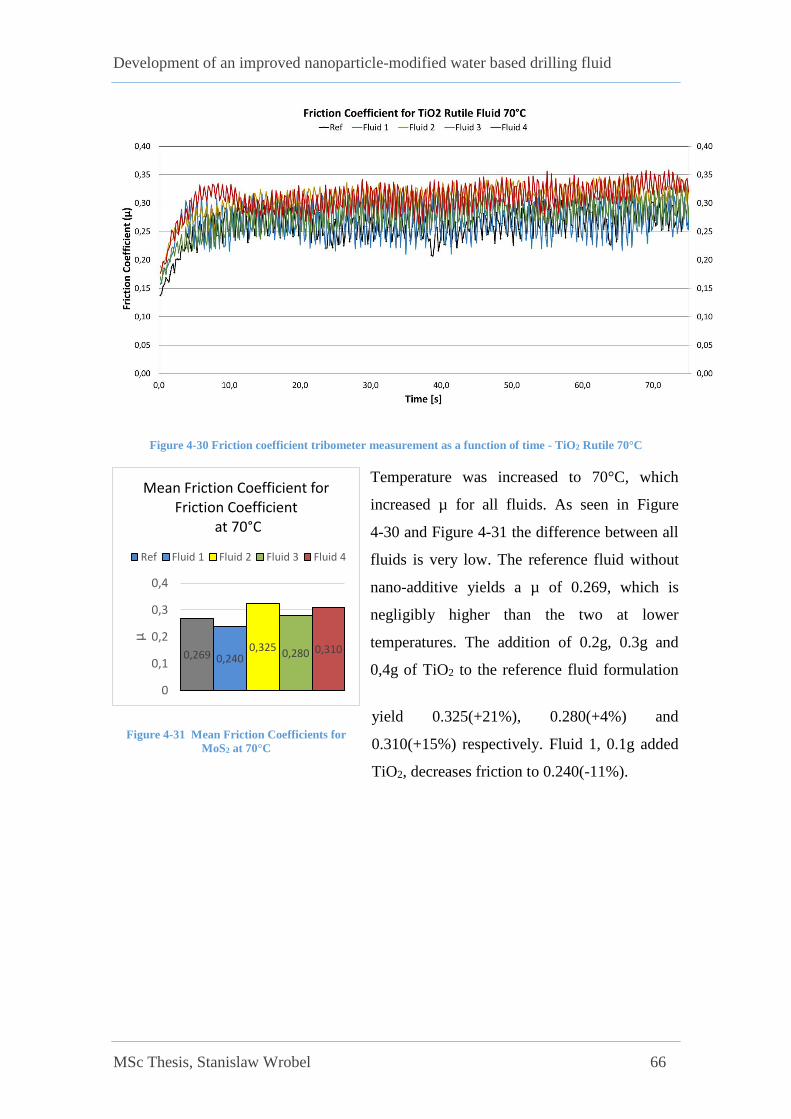
Development of an improved nanoparticle-modified water based drilling fluid
MSc Thesis, Stanislaw Wrobel 66
0,269 0,2400,325
0,280 0,310
0
0,1
0,2
0,3
0,4
µ
Mean Friction Coefficient for Friction Coefficient
at 70°C
Ref Fluid 1 Fluid 2 Fluid 3 Fluid 4
Figure 4-31 Mean Friction Coefficients for
MoS2 at 70°C
Figure 4-30 Friction coefficient tribometer measurement as a function of time - TiO2 Rutile 70°C
Temperature was increased to 70°C, which
increased µ for all fluids. As seen in Figure
4-30 and Figure 4-31 the difference between all
fluids is very low. The reference fluid without
nano-additive yields a µ of 0.269, which is
negligibly higher than the two at lower
temperatures. The addition of 0.2g, 0.3g and
0,4g of TiO2 to the reference fluid formulation
yield 0.325(+21%), 0.280(+4%) and
0.310(+15%) respectively. Fluid 1, 0.1g added
TiO2, decreases friction to 0.240(-11%).
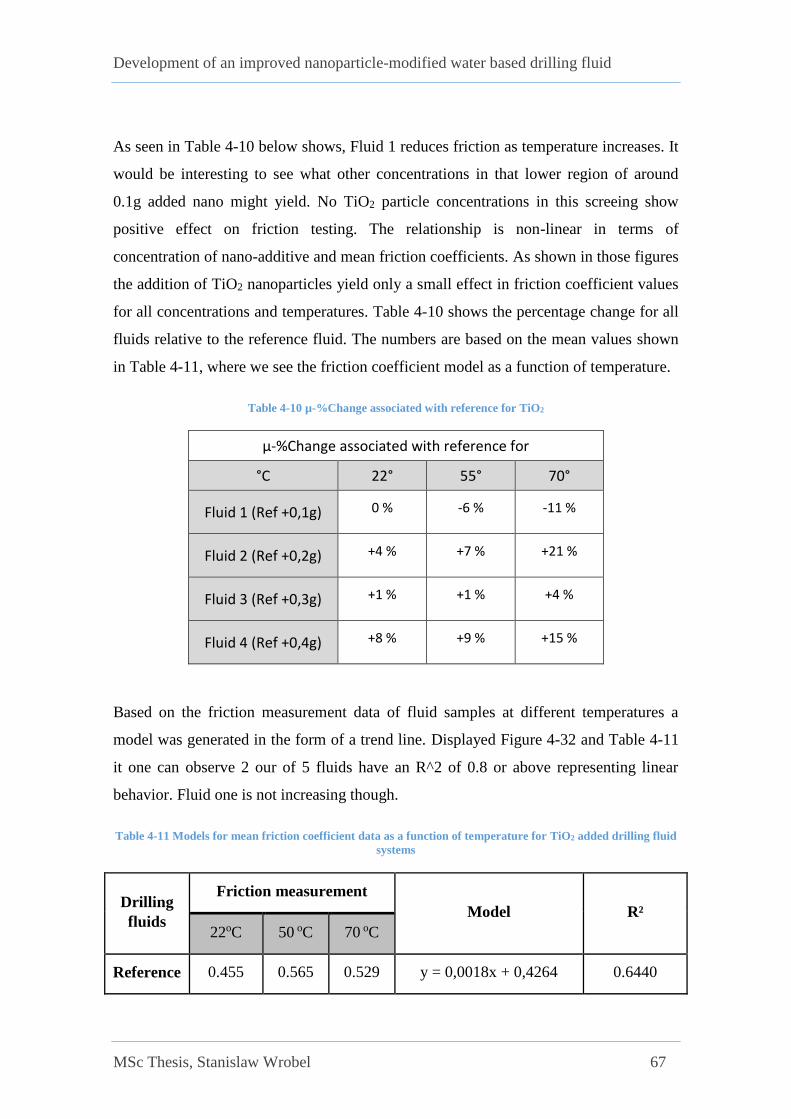
Development of an improved nanoparticle-modified water based drilling fluid
MSc Thesis, Stanislaw Wrobel 67
As seen in Table 4-10 below shows, Fluid 1 reduces friction as temperature increases. It
would be interesting to see what other concentrations in that lower region of around
0.1g added nano might yield. No TiO2 particle concentrations in this screeing show
positive effect on friction testing. The relationship is non-linear in terms of
concentration of nano-additive and mean friction coefficients. As shown in those figures
the addition of TiO2 nanoparticles yield only a small effect in friction coefficient values
for all concentrations and temperatures. Table 4-10 shows the percentage change for all
fluids relative to the reference fluid. The numbers are based on the mean values shown
in Table 4-11, where we see the friction coefficient model as a function of temperature.
Table 4-10 µ-%Change associated with reference for TiO2
µ-%Change associated with reference for
°C 22° 55° 70°
Fluid 1 (Ref +0,1g) 0 % -6 % -11 %
Fluid 2 (Ref +0,2g) +4 % +7 % +21 %
Fluid 3 (Ref +0,3g) +1 % +1 % +4 %
Fluid 4 (Ref +0,4g) +8 % +9 % +15 %
Based on the friction measurement data of fluid samples at different temperatures a
model was generated in the form of a trend line. Displayed Figure 4-32 and Table 4-11
it one can observe 2 our of 5 fluids have an R^2 of 0.8 or above representing linear
behavior. Fluid one is not increasing though.
Table 4-11 Models for mean friction coefficient data as a function of temperature for TiO2 added drilling fluid
systems
Drilling
fluids
Friction measurement
Model R²
22oC 50 oC 70 oC
Reference 0.455 0.565 0.529 y = 0,0018x + 0,4264 0.6440

Development of an improved nanoparticle-modified water based drilling fluid
MSc Thesis, Stanislaw Wrobel 68
Fluid 1 0.355 0.372 0.386 y = -0,0006x + 0,2805 0.9970
Fluid 2 0.252 0.268 0.340 y = 0.0016x + 0.2074 0.7200
Fluid 3 0.237 0.402 0.331 y = 0.0025x + 0.2027 0.5279
Fluid 4 0.202 0.327 0.344 y = 0.0031x + 0.1401 0.9592
Figure 4-32 Mean Friction Coefficiens vs temperature with trendline for TiO2
y = 0,0018x + 0,4264R² = 0,644y = -0,0006x + 0,2805
R² = 0,997
y = 0,0016x + 0,2074R² = 0,72
y = 0,0025x + 0,2027R² = 0,5279
y = 0,0031x + 0,1401R² = 0,9592
0,000
0,050
0,100
0,150
0,200
0,250
0,300
0,350
0,400
0,450
0,500
10 20 30 40 50 60 70 80
Fric
tio
n C
oe
ffic
ien
t
Temperature C°
Ref
Fluid 1
Fluid 2
Fluid 3
Fluid 4
Linear (Ref)
Linear (Fluid 1)
Linear (Fluid 2)
Linear (Fluid 3)
Linear (Fluid 4)

Development of an improved nanoparticle-modified water based drilling fluid
MSc Thesis, Stanislaw Wrobel 69
4.5 Effect of Graphene nanoparticles
Graphene is an allotrope of carbon. Figure 4-33 illustrate the two-dimensional form of
graphene. In atomic scale, graphene has a honey-comb lattice. At each vertex, carbon
atom forms.
Figure 4-33 Illustration of graphene lattice [32]
Graphene has many amazing properties. It is a strong material. Recently its application
in cement and drilling fluids has been documented. Figure 30 shows the SEM picture of
nano graphane plates. [33]
Figure 4-34 SEM picture of Graphene [33]
The performance of Graphene has been evaluated in the presence of Xanthan gum
polymer and KCL salt.
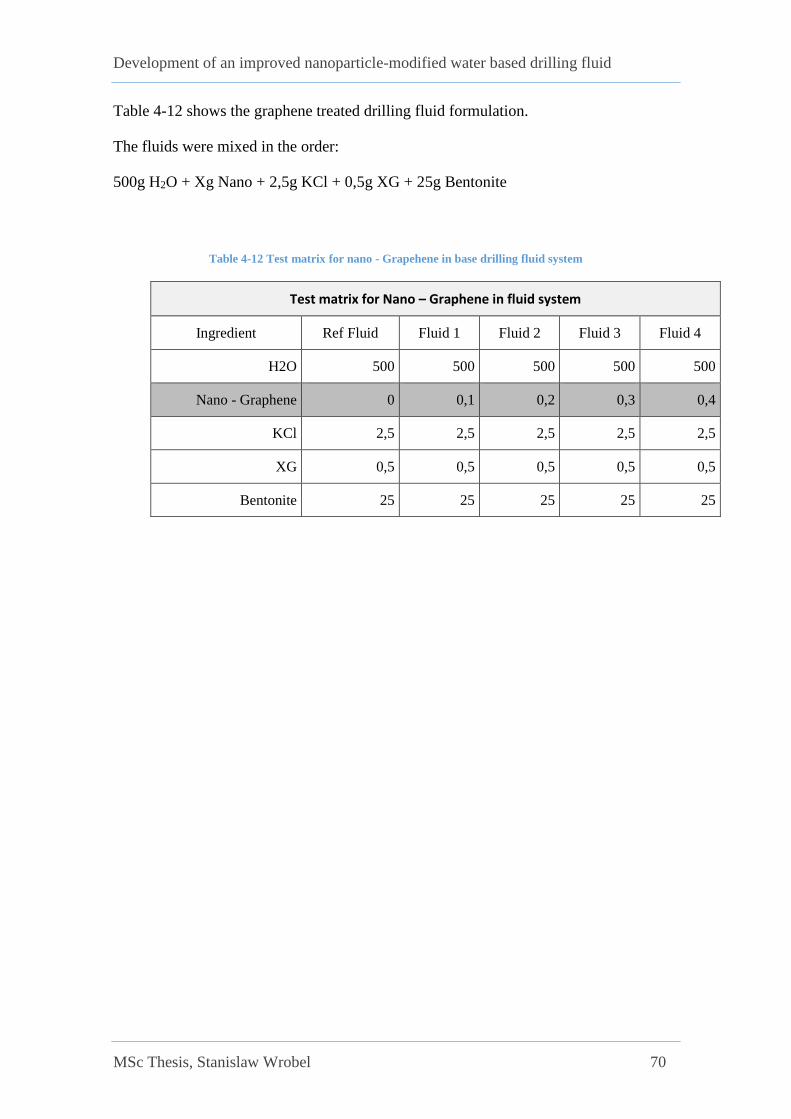
Development of an improved nanoparticle-modified water based drilling fluid
MSc Thesis, Stanislaw Wrobel 70
Table 4-12 shows the graphene treated drilling fluid formulation.
The fluids were mixed in the order:
500g H2O + Xg Nano + 2,5g KCl + 0,5g XG + 25g Bentonite
Table 4-12 Test matrix for nano - Grapehene in base drilling fluid system
Test matrix for Nano – Graphene in fluid system
Ingredient Ref Fluid Fluid 1 Fluid 2 Fluid 3 Fluid 4
H2O 500 500 500 500 500
Nano - Graphene 0 0,1 0,2 0,3 0,4
KCl 2,5 2,5 2,5 2,5 2,5
XG 0,5 0,5 0,5 0,5 0,5
Bentonite 25 25 25 25 25
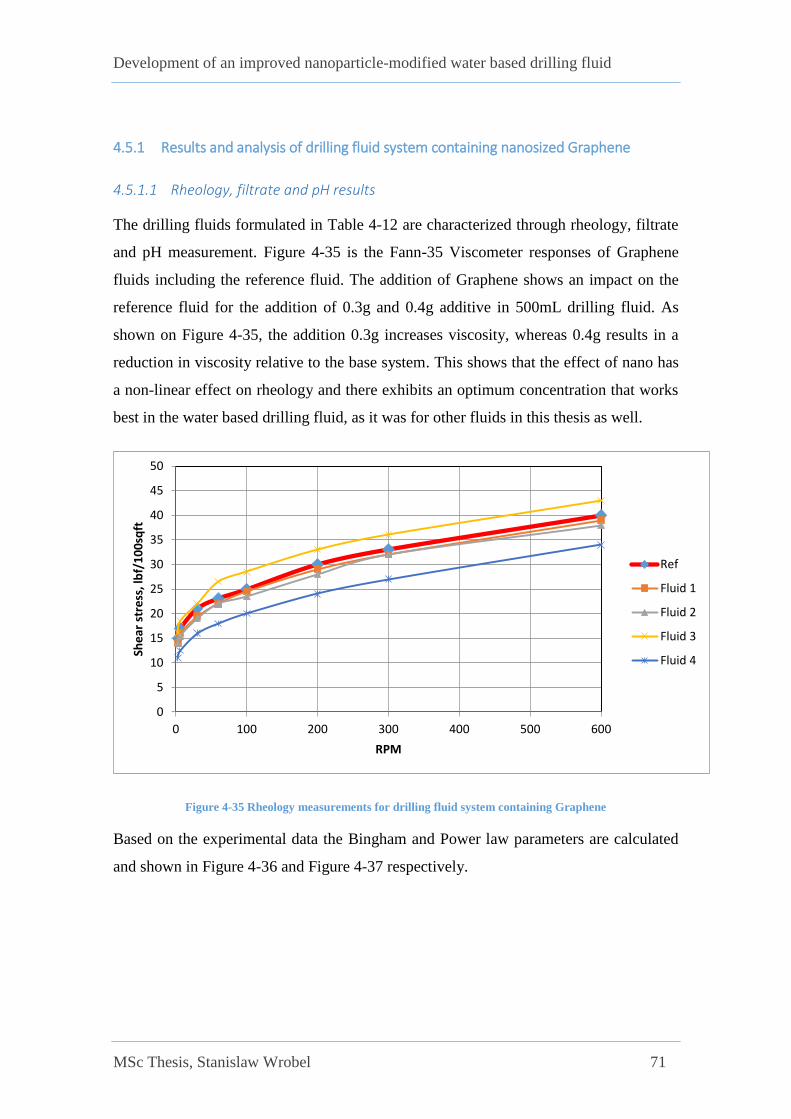
Development of an improved nanoparticle-modified water based drilling fluid
MSc Thesis, Stanislaw Wrobel 71
4.5.1 Results and analysis of drilling fluid system containing nanosized Graphene
4.5.1.1 Rheology, filtrate and pH results
The drilling fluids formulated in Table 4-12 are characterized through rheology, filtrate
and pH measurement. Figure 4-35 is the Fann-35 Viscometer responses of Graphene
fluids including the reference fluid. The addition of Graphene shows an impact on the
reference fluid for the addition of 0.3g and 0.4g additive in 500mL drilling fluid. As
shown on Figure 4-35, the addition 0.3g increases viscosity, whereas 0.4g results in a
reduction in viscosity relative to the base system. This shows that the effect of nano has
a non-linear effect on rheology and there exhibits an optimum concentration that works
best in the water based drilling fluid, as it was for other fluids in this thesis as well.
Figure 4-35 Rheology measurements for drilling fluid system containing Graphene
Based on the experimental data the Bingham and Power law parameters are calculated
and shown in Figure 4-36 and Figure 4-37 respectively.
0
5
10
15
20
25
30
35
40
45
50
0 100 200 300 400 500 600
She
ar s
tre
ss, l
bf/
10
0sq
ft
RPM
Ref
Fluid 1
Fluid 2
Fluid 3
Fluid 4
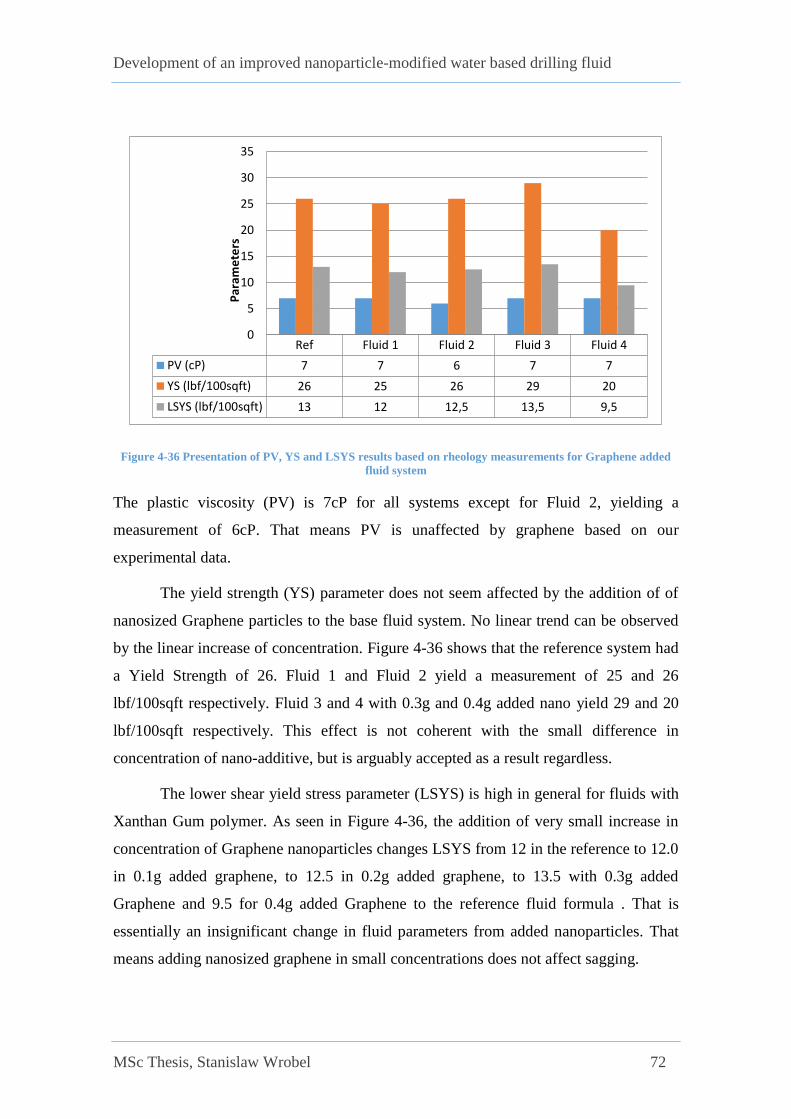
Development of an improved nanoparticle-modified water based drilling fluid
MSc Thesis, Stanislaw Wrobel 72
Figure 4-36 Presentation of PV, YS and LSYS results based on rheology measurements for Graphene added
fluid system
The plastic viscosity (PV) is 7cP for all systems except for Fluid 2, yielding a
measurement of 6cP. That means PV is unaffected by graphene based on our
experimental data.
The yield strength (YS) parameter does not seem affected by the addition of of
nanosized Graphene particles to the base fluid system. No linear trend can be observed
by the linear increase of concentration. Figure 4-36 shows that the reference system had
a Yield Strength of 26. Fluid 1 and Fluid 2 yield a measurement of 25 and 26
lbf/100sqft respectively. Fluid 3 and 4 with 0.3g and 0.4g added nano yield 29 and 20
lbf/100sqft respectively. This effect is not coherent with the small difference in
concentration of nano-additive, but is arguably accepted as a result regardless.
The lower shear yield stress parameter (LSYS) is high in general for fluids with
Xanthan Gum polymer. As seen in Figure 4-36, the addition of very small increase in
concentration of Graphene nanoparticles changes LSYS from 12 in the reference to 12.0
in 0.1g added graphene, to 12.5 in 0.2g added graphene, to 13.5 with 0.3g added
Graphene and 9.5 for 0.4g added Graphene to the reference fluid formula . That is
essentially an insignificant change in fluid parameters from added nanoparticles. That
means adding nanosized graphene in small concentrations does not affect sagging.
Ref Fluid 1 Fluid 2 Fluid 3 Fluid 4
PV (cP) 7 7 6 7 7
YS (lbf/100sqft) 26 25 26 29 20
LSYS (lbf/100sqft) 13 12 12,5 13,5 9,5
0
5
10
15
20
25
30
35
Par
ame
ters

Development of an improved nanoparticle-modified water based drilling fluid
MSc Thesis, Stanislaw Wrobel 73
Figure 4-37 Consistency index(k) and flow index n - Graphene fluid systems
The flow and consistency index is displayed in Figure 4-37. As we can see the n-value
is fairly constant for set temperature and no effect from added nanoparticles can be
observed, for most of the fluid.
The consistency Index for Fluid 1, 2, 3 and 4 is 5.40, 6.82, 7.28 and 3.40 lbf-s^n/100sqft
respectively. The reference fluid system yields 5.85 lbf-s^n/100sqft. The power law
model shows the difference in consistency index between Fluid 3 and Fluid 4 very
cleary.
Figure 4-38 Diagram and data for filtrate loss of drilling fluid system containing Graphene
The filtrate loss, shown in Figure 4-38, is slightly increased from 6.5 in the base fluid
system to 8.0 mL, 7.4 mL,7 mL and 8mL in Fluid 1,2,3 and 4 respectively. That
Ref Fluid 1 Fluid 2 Fluid 3 Fluid 4
n 0,28 0,29 0,25 0,26 0,33
k (lbf-s^n/100sqft) 5,85 5,40 6,82 7,28 3,40
0,00
1,00
2,00
3,00
4,00
5,00
6,00
7,00
8,00
Par
ame
ters
Filtrate [mL] 6,5 8 7,4 7 80
1
2
3
4
5
6
7
8
9
7.5
min
Filt
rate
, ml

Development of an improved nanoparticle-modified water based drilling fluid
MSc Thesis, Stanislaw Wrobel 74
indicates that small amounts of added nanoparticles of Graphene might disrupt the pore-
plugging bridging effect to reduce filtrate loss. Filtrate loss, like viscosity seems to
exhibit an optimum concentration behavior and not a linear trend in correlation with
concentration of nanoparticles in WBM.
Table 4-13 pH measurements for Graphene
Measurement Ref fluid Fluid 1 Fluid 2 Fluid 3 Fluid 4
pH 9.0 9.0 9.0 9.0 9.0
As seen in Table 4-13, the addition of Graphene to the base fluid system seems not to
effect on the acidity/alkalinity on the reference fluid system.

Development of an improved nanoparticle-modified water based drilling fluid
MSc Thesis, Stanislaw Wrobel 75
4.5.1.2 Rheology modeling
Table 4-14 describes how each parameter in a rheological fluid model is affected by the
addition of Graphene nanoparticles. Percentage deviation from the reference fluid
parameter has been included. E.g. μ-value for for the Newtonian model experiences a -
16.7% reduction for Ref+0.4g Graphene relative to the reference fluid, meaning the
curve has a less steep slope i.e a smaller gradient. The models itself are included in
Appendix A
Table 4-14 Rheology model parameters and percentage deviation from the reference fluid – Graphene.
Model Parameter Ref Ref + 0.1g Graphene
Ref + 0.2g Graphene
Ref + 0.3g Graphene
Ref + 0.4g Graphene
Herschel-Bulkley
τo 14,130 12,863 13,412 14,029 10,277
% deviation
-8,96 -5,08 -0,71 -27,27
k 1,0399 1,159 0,7712 1,8087 0,7563
% deviation
11,45 -25,84 73,93 -27,27
n 0,484 0,4692 0,5237 0,9856 0,5157
% deviation -3,06 8,20 103,64 6,55
Unified τy 13,8710 12,8040 13,3375 14,4045 10,1365
% deviation
-7,69 -3,85 3,85 -26,92
k 1,1899 1,1937 0,8111 1,5740 0,8327
% deviation
0,32 -31,83 32,28 -30,02
n 0,4641 0,4648 0,5161 0,4404 0,5012
% deviation 0,15 11,20 -5,11 7,99
Power Law k 11,8480 10,9440 10,7920 12,7730 8,2450
% deviation
-7,63 -8,91 7,81 -30,41
n 0,1746 0,1830 0,1812 0,1775 0,2012
% deviation 4,81 3,78 1,66 15,23
Bingham τy 19,8120 18,8760 18,4190 21,9430 14,8740
% deviation
-4,72 -7,03 10,76 -24,92
μp 0,0252 0,0251 0,0246 0,0267 0,0232
% deviation -0,40 -2,38 5,95 -7,94
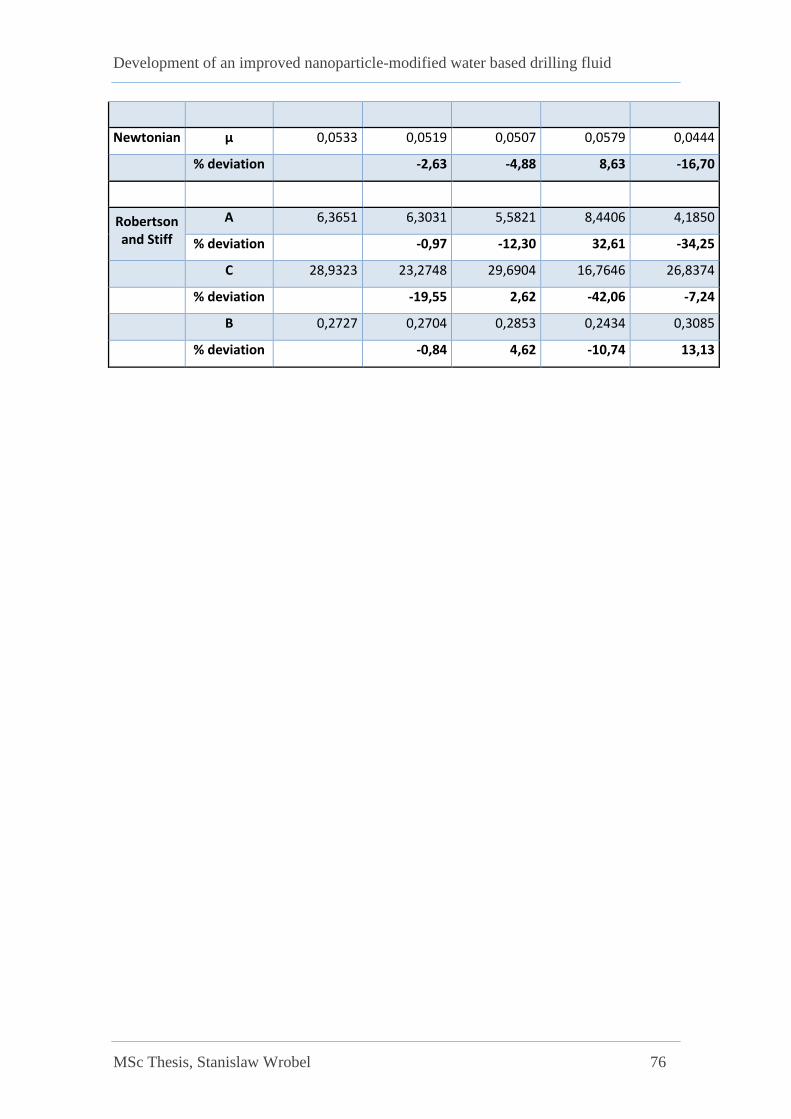
Development of an improved nanoparticle-modified water based drilling fluid
MSc Thesis, Stanislaw Wrobel 76
Newtonian μ 0,0533 0,0519 0,0507 0,0579 0,0444
% deviation -2,63 -4,88 8,63 -16,70
Robertson and Stiff
A 6,3651 6,3031 5,5821 8,4406 4,1850
% deviation
-0,97 -12,30 32,61 -34,25
C 28,9323 23,2748 29,6904 16,7646 26,8374
% deviation
-19,55 2,62 -42,06 -7,24
B 0,2727 0,2704 0,2853 0,2434 0,3085
% deviation -0,84 4,62 -10,74 13,13
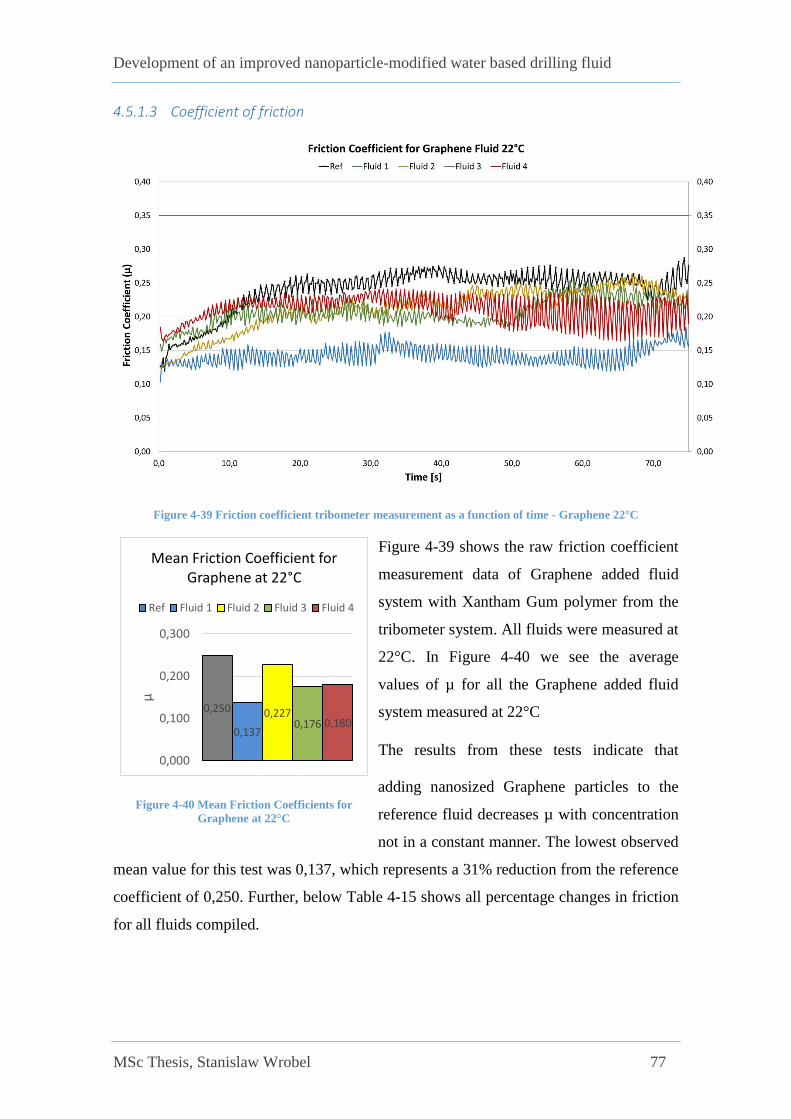
Development of an improved nanoparticle-modified water based drilling fluid
MSc Thesis, Stanislaw Wrobel 77
0,250
0,137
0,2270,176 0,180
0,000
0,100
0,200
0,300
µ
Mean Friction Coefficient for Graphene at 22°C
Ref Fluid 1 Fluid 2 Fluid 3 Fluid 4
Figure 4-40 Mean Friction Coefficients for
Graphene at 22°C
4.5.1.3 Coefficient of friction
Figure 4-39 Friction coefficient tribometer measurement as a function of time - Graphene 22°C
Figure 4-39 shows the raw friction coefficient
measurement data of Graphene added fluid
system with Xantham Gum polymer from the
tribometer system. All fluids were measured at
22°C. In Figure 4-40 we see the average
values of µ for all the Graphene added fluid
system measured at 22°C
The results from these tests indicate that
adding nanosized Graphene particles to the
reference fluid decreases µ with concentration
not in a constant manner. The lowest observed
mean value for this test was 0,137, which represents a 31% reduction from the reference
coefficient of 0,250. Further, below Table 4-15 shows all percentage changes in friction
for all fluids compiled.
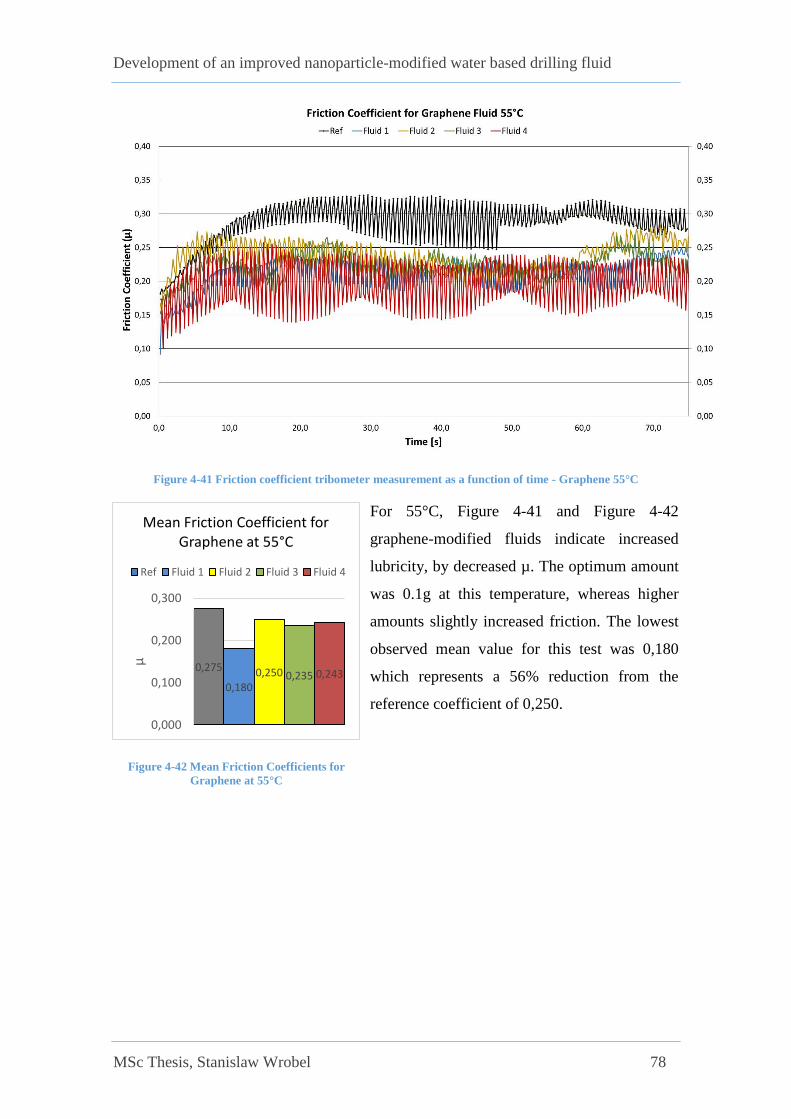
Development of an improved nanoparticle-modified water based drilling fluid
MSc Thesis, Stanislaw Wrobel 78
0,275
0,1800,250 0,235 0,243
0,000
0,100
0,200
0,300
µ
Mean Friction Coefficient for Graphene at 55°C
Ref Fluid 1 Fluid 2 Fluid 3 Fluid 4
Figure 4-42 Mean Friction Coefficients for
Graphene at 55°C
Figure 4-41 Friction coefficient tribometer measurement as a function of time - Graphene 55°C
For 55°C, Figure 4-41 and Figure 4-42
graphene-modified fluids indicate increased
lubricity, by decreased µ. The optimum amount
was 0.1g at this temperature, whereas higher
amounts slightly increased friction. The lowest
observed mean value for this test was 0,180
which represents a 56% reduction from the
reference coefficient of 0,250.

Development of an improved nanoparticle-modified water based drilling fluid
MSc Thesis, Stanislaw Wrobel 79
0,2650,200 0,224 0,239 0,245
0,000
0,100
0,200
0,300
µ
Mean Friction Coefficient for Graphene at 70°C
Ref Fluid 1 Fluid 2 Fluid 3 Fluid 4
Figure 4-44 Mean Friction Coefficients for
Graphene at 70°C
Figure 4-43 Friction coefficient tribometer measurement as a function of time - Graphene 70°C
Figure 4-43 shows the raw friction coefficient
measurement data of Graphene added fluid
system directly from the tribometer system. All
these fluids were measured at temperature of
70°C.
From Figure 4-44 displays that
graphene-modified fluids have higher lubricity
also at 70°C, relative to the reference system.
The lowest observed mean value for this test
was 0,200 for 0.1g added graphene which
represents a 27% reduction from the reference
friction coefficient of 0,250.
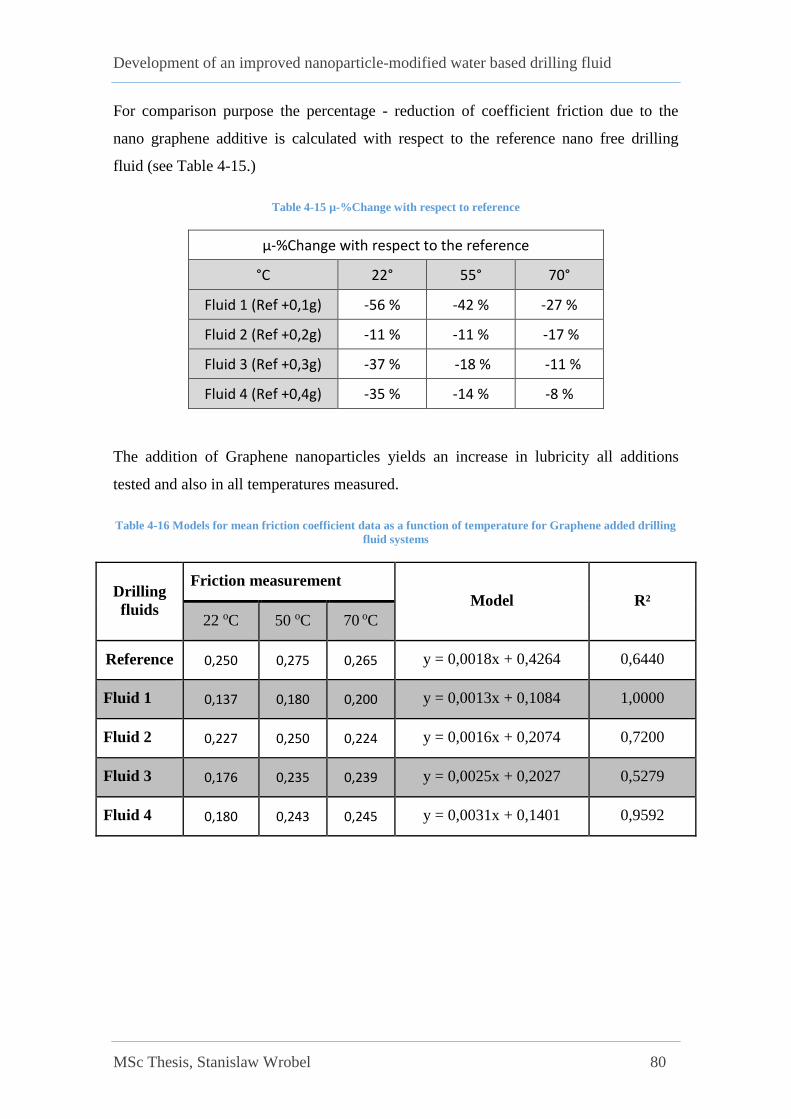
Development of an improved nanoparticle-modified water based drilling fluid
MSc Thesis, Stanislaw Wrobel 80
For comparison purpose the percentage - reduction of coefficient friction due to the
nano graphene additive is calculated with respect to the reference nano free drilling
fluid (see Table 4-15.)
Table 4-15 µ-%Change with respect to reference
µ-%Change with respect to the reference
°C 22° 55° 70°
Fluid 1 (Ref +0,1g) -56 % -42 % -27 %
Fluid 2 (Ref +0,2g) -11 % -11 % -17 %
Fluid 3 (Ref +0,3g) -37 % -18 % -11 %
Fluid 4 (Ref +0,4g) -35 % -14 % -8 %
The addition of Graphene nanoparticles yields an increase in lubricity all additions
tested and also in all temperatures measured.
Table 4-16 Models for mean friction coefficient data as a function of temperature for Graphene added drilling
fluid systems
Drilling
fluids
Friction measurement
Model R²
22 oC 50 oC 70 oC
Reference 0,250 0,275 0,265 y = 0,0018x + 0,4264 0,6440
Fluid 1 0,137 0,180 0,200 y = 0,0013x + 0,1084 1,0000
Fluid 2 0,227 0,250 0,224 y = 0,0016x + 0,2074 0,7200
Fluid 3 0,176 0,235 0,239 y = 0,0025x + 0,2027 0,5279
Fluid 4 0,180 0,243 0,245 y = 0,0031x + 0,1401 0,9592
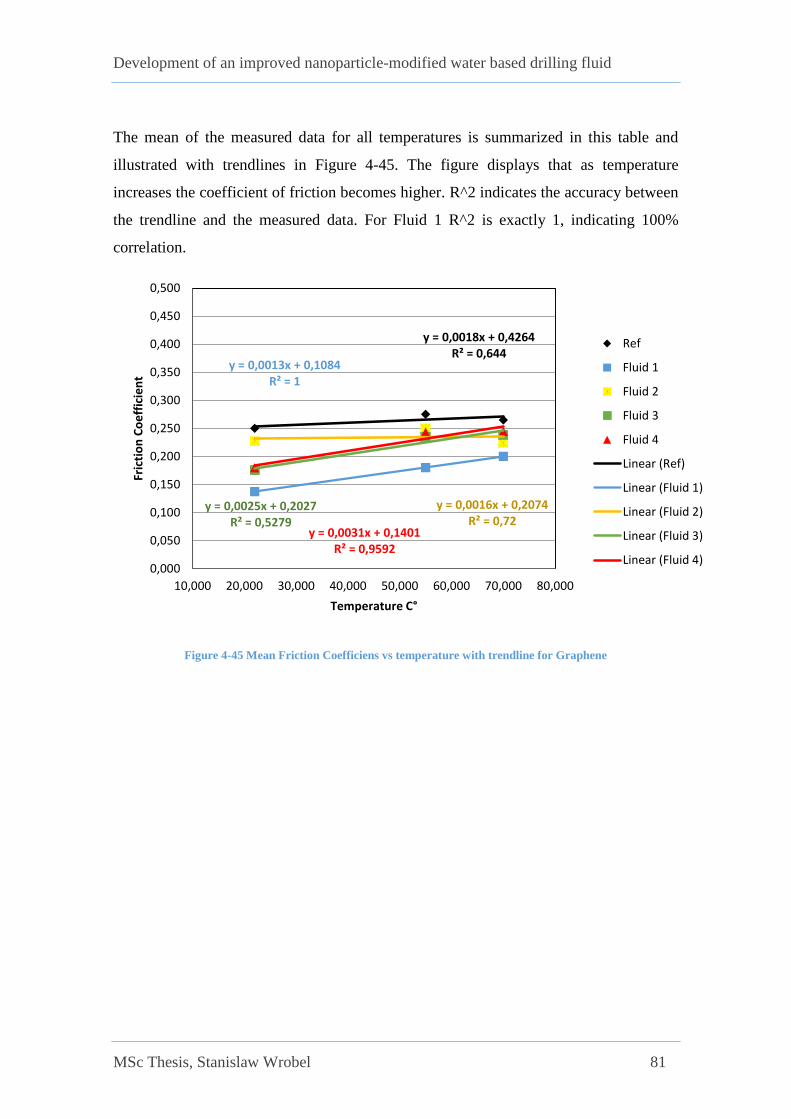
Development of an improved nanoparticle-modified water based drilling fluid
MSc Thesis, Stanislaw Wrobel 81
The mean of the measured data for all temperatures is summarized in this table and
illustrated with trendlines in Figure 4-45. The figure displays that as temperature
increases the coefficient of friction becomes higher. R^2 indicates the accuracy between
the trendline and the measured data. For Fluid 1 R^2 is exactly 1, indicating 100%
correlation.
Figure 4-45 Mean Friction Coefficiens vs temperature with trendline for Graphene
y = 0,0018x + 0,4264R² = 0,644
y = 0,0013x + 0,1084R² = 1
y = 0,0016x + 0,2074R² = 0,72
y = 0,0025x + 0,2027R² = 0,5279
y = 0,0031x + 0,1401R² = 0,9592
0,000
0,050
0,100
0,150
0,200
0,250
0,300
0,350
0,400
0,450
0,500
10,000 20,000 30,000 40,000 50,000 60,000 70,000 80,000
Fric
tio
n C
oe
ffic
ien
t
Temperature C°
Ref
Fluid 1
Fluid 2
Fluid 3
Fluid 4
Linear (Ref)
Linear (Fluid 1)
Linear (Fluid 2)
Linear (Fluid 3)
Linear (Fluid 4)
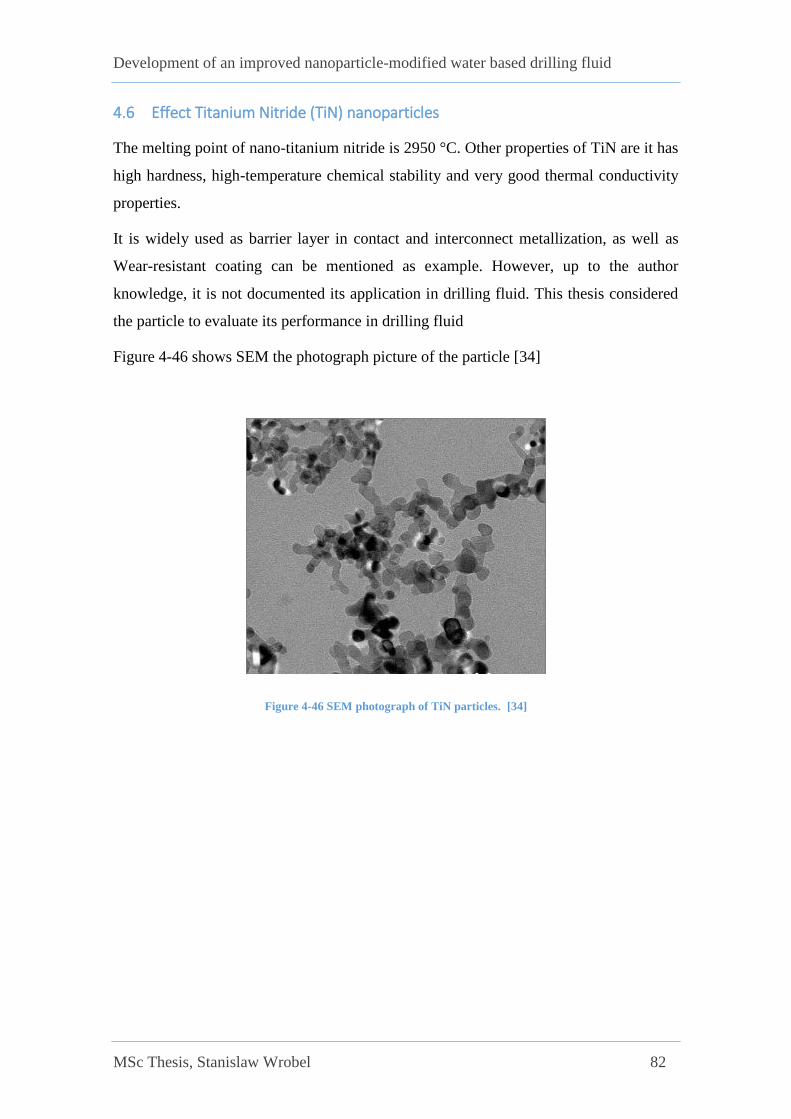
Development of an improved nanoparticle-modified water based drilling fluid
MSc Thesis, Stanislaw Wrobel 82
4.6 Effect Titanium Nitride (TiN) nanoparticles
The melting point of nano-titanium nitride is 2950 °C. Other properties of TiN are it has
high hardness, high-temperature chemical stability and very good thermal conductivity
properties.
It is widely used as barrier layer in contact and interconnect metallization, as well as
Wear-resistant coating can be mentioned as example. However, up to the author
knowledge, it is not documented its application in drilling fluid. This thesis considered
the particle to evaluate its performance in drilling fluid
Figure 4-46 shows SEM the photograph picture of the particle [34]
Figure 4-46 SEM photograph of TiN particles. [34]

Development of an improved nanoparticle-modified water based drilling fluid
MSc Thesis, Stanislaw Wrobel 83
4.6.1 Drilling fluid system containing TiN nanoparticles
The fluid system containing PAC was prepared and added nano - TiN in order to
evaluate the properties gained from nanoparticles combined with KCl and PAC. The
fluids are listed in Table 4-17.
The fluids were mixed in the order:
500g H2O + Xg Nano + 2,5g KCl + 0,5g PAC + 25g Bentonite
Table 4-17 Test matrix for drilling fluid system with added TiN
Test matrix for Nano – Titanium Nitride (TiN) in fluid system
Ingredient Ref Fluid Fluid 1 Fluid 2 Fluid 3 Fluid 4
H2O 500 500 500 500 500
Bentonite 25 25 25 25 25
PAC 0,5 0,5 0,5 0,5 0,5
KCl 2,5 2,5 2,5 2,5 2,5
Nano - TiN 0 0,1 0,2 0,3 0,4

Development of an improved nanoparticle-modified water based drilling fluid
MSc Thesis, Stanislaw Wrobel 84
4.6.2 Results and analysis of drilling fluid system containing TiN
4.6.2.1 Rheology, filtrate and pH results
Figure 4-47 Rheology measurements for drilling fluid system containing TiN
Figure 4-47 displays the Fann-35 Viscometer responses of the measured drilling fluids.
These experimental are further studied in the Bingham and Power law models. Their
plot and parameters are shown in Figure 44 and Figure 45 respectively.
0
2
4
6
8
10
12
14
16
0 100 200 300 400 500 600
She
ar s
tre
ss, l
bf/
10
0sq
ft
RPM
Ref
Fluid 1
Fluid 2
Fluid 3
Fluid 4
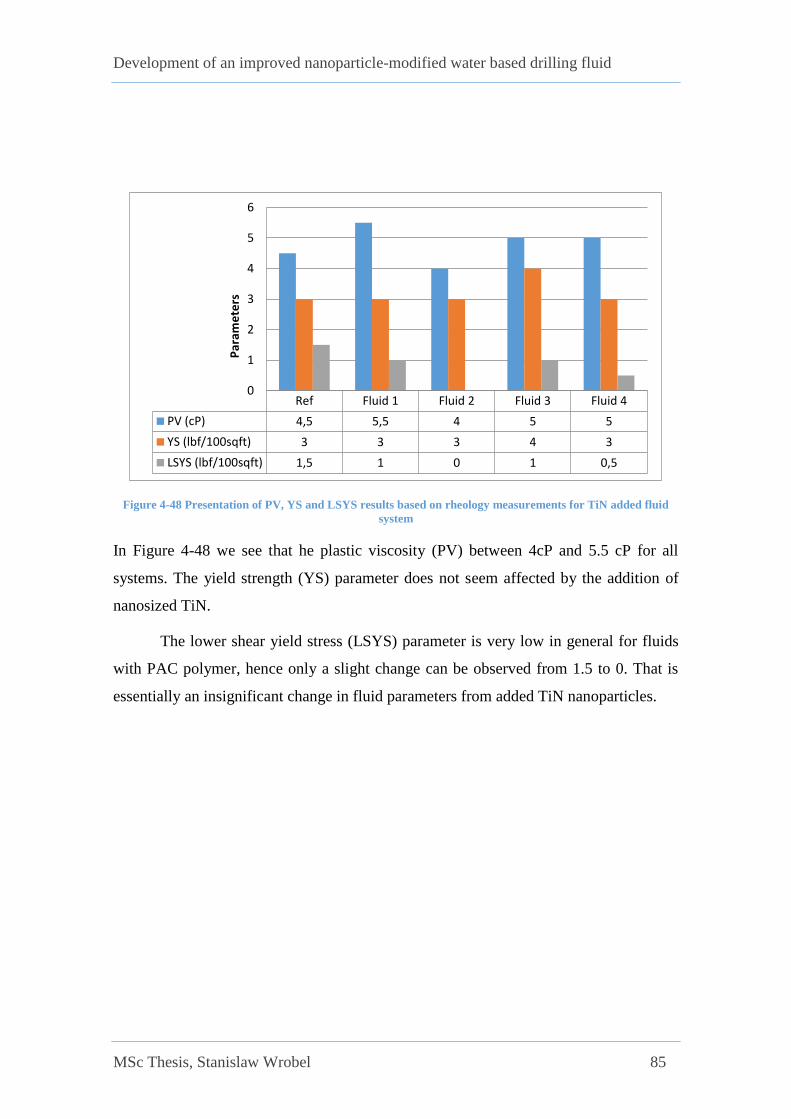
Development of an improved nanoparticle-modified water based drilling fluid
MSc Thesis, Stanislaw Wrobel 85
Figure 4-48 Presentation of PV, YS and LSYS results based on rheology measurements for TiN added fluid
system
In Figure 4-48 we see that he plastic viscosity (PV) between 4cP and 5.5 cP for all
systems. The yield strength (YS) parameter does not seem affected by the addition of
nanosized TiN.
The lower shear yield stress (LSYS) parameter is very low in general for fluids
with PAC polymer, hence only a slight change can be observed from 1.5 to 0. That is
essentially an insignificant change in fluid parameters from added TiN nanoparticles.
Ref Fluid 1 Fluid 2 Fluid 3 Fluid 4
PV (cP) 4,5 5,5 4 5 5
YS (lbf/100sqft) 3 3 3 4 3
LSYS (lbf/100sqft) 1,5 1 0 1 0,5
0
1
2
3
4
5
6
Par
ame
ters

Development of an improved nanoparticle-modified water based drilling fluid
MSc Thesis, Stanislaw Wrobel 86
Figure 4-49 Consistency index(k) and n-value for TiN fluid systems at different temperatures.
Figure 4-49 displays the consistency and flow index for the Power Law model. As we
can see the n-value is fairly constant and no effect from added nanoparticles can be
observed, ranging from 0.10 to 0.17, where the reference fluid system yields 0.11.
The Consistency Index, k, describes the average slope of the shear stress – shear
rate curve. The highest k value from the test of TiN added fluids is the one with the least
(+0.3g) added TiN nanoparticles. That is why that fluid has also the highest viscosity,
but the difference is very low.
Figure 4-50 Diagram and data for filtrate loss of drilling fluid system containing TiN2
XG-ref+0.1ggraphene
CMC-RefCMC-ref+0.4g
MoS2
40 38 19 22
33 32 12,5 15
0
5
10
15
20
25
30
35
40
Par
ame
ters
Filtrate [mL] 6,5 6 6,5 6 60
1
2
3
4
5
6
7
7.5
min
Filt
rate
, ml

Development of an improved nanoparticle-modified water based drilling fluid
MSc Thesis, Stanislaw Wrobel 87
As seen in Figure 4-50 the reference system is not affected by the addition of
nanoparticles in terms of filtrate loss, as they all respond with very little deviation from
the reference fluid. A slight reduction of -0.5mL can be observed for fluid 1, 3 and 4.
Table 4-18 pH measurements for TiN
Measurement Ref fluid Fluid 1 Fluid 2 Fluid 3 Fluid 4
pH 6,5 6.0 6,5 6.0 6.0
As seen in Table 4-18, the addition of TiN to the base fluid system seems to effect on
the acidity/alkalinity on the reference fluid system.
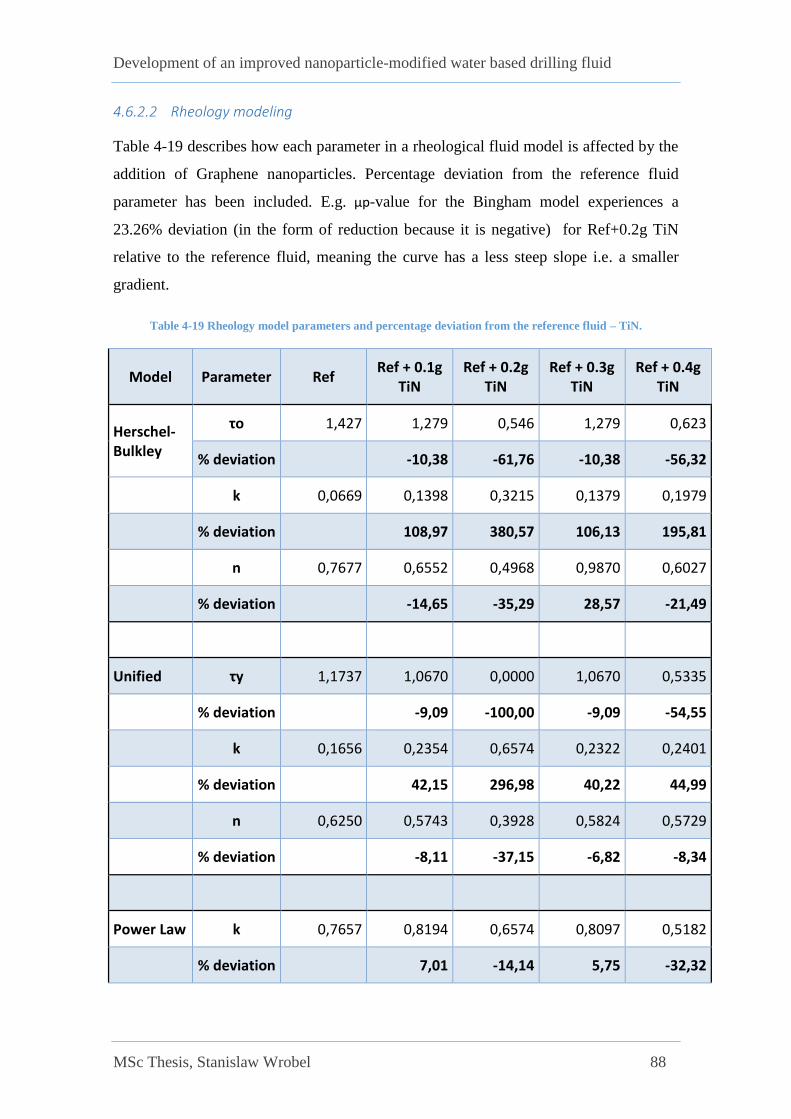
Development of an improved nanoparticle-modified water based drilling fluid
MSc Thesis, Stanislaw Wrobel 88
4.6.2.2 Rheology modeling
Table 4-19 describes how each parameter in a rheological fluid model is affected by the
addition of Graphene nanoparticles. Percentage deviation from the reference fluid
parameter has been included. E.g. μp-value for the Bingham model experiences a
23.26% deviation (in the form of reduction because it is negative) for Ref+0.2g TiN
relative to the reference fluid, meaning the curve has a less steep slope i.e. a smaller
gradient.
Table 4-19 Rheology model parameters and percentage deviation from the reference fluid – TiN.
Model Parameter Ref Ref + 0.1g
TiN Ref + 0.2g
TiN Ref + 0.3g
TiN Ref + 0.4g
TiN
Herschel-Bulkley
τo 1,427 1,279 0,546 1,279 0,623
% deviation
-10,38 -61,76 -10,38 -56,32
k 0,0669 0,1398 0,3215 0,1379 0,1979
% deviation
108,97 380,57 106,13 195,81
n 0,7677 0,6552 0,4968 0,9870 0,6027
% deviation -14,65 -35,29 28,57 -21,49
Unified τy 1,1737 1,0670 0,0000 1,0670 0,5335
% deviation
-9,09 -100,00 -9,09 -54,55
k 0,1656 0,2354 0,6574 0,2322 0,2401
% deviation
42,15 296,98 40,22 44,99
n 0,6250 0,5743 0,3928 0,5824 0,5729
% deviation -8,11 -37,15 -6,82 -8,34
Power Law k 0,7657 0,8194 0,6574 0,8097 0,5182
% deviation
7,01 -14,14 5,75 -32,32

Development of an improved nanoparticle-modified water based drilling fluid
MSc Thesis, Stanislaw Wrobel 89
n 0,4011 0,3922 0,3928 0,3993 0,4580
% deviation -2,22 -2,07 -0,45 14,19
Bingham τy 2,4033 2,3899 2,0121 2,5270 2,0660
% deviation
-0,56 -16,28 5,15 -14,03
μp 0,0129 0,0127 0,0099 0,0128 0,0121
% deviation -1,55 -23,26 -0,78 -6,20
Newtonian μ 0,0163 0,0161 0,0128 0,0164 0,0151
% deviation -1,23 -21,47 0,61 -7,36
Robertson and Stiff
A 0,0711 0,2543 0,3553 0,2467 0,2952
% deviation
257,67 399,72 246,98 315,19
C 57,1269 22,8380 10,2342 22,8380 7,5275
% deviation
-60,02 -82,09 -60,02 -86,82
B 0,7716 0,5778 0,4909 0,5877 0,5481
% deviation -25,12 -36,38 -23,83 -28,97
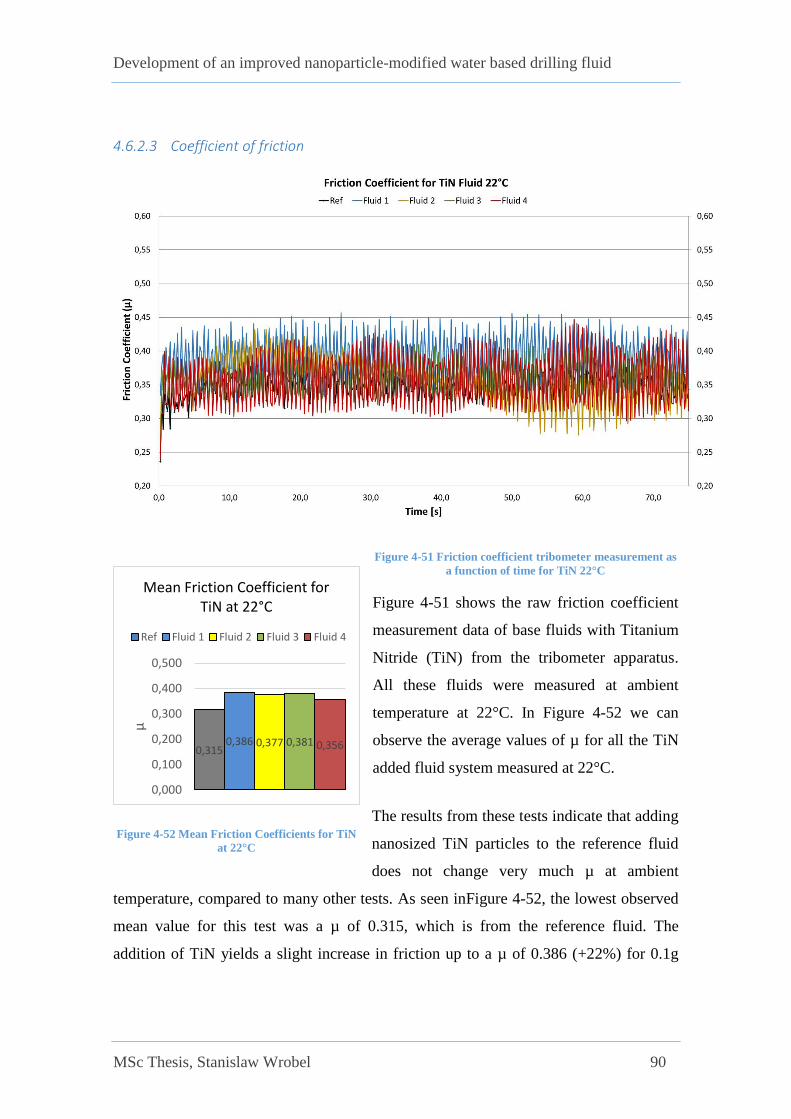
Development of an improved nanoparticle-modified water based drilling fluid
MSc Thesis, Stanislaw Wrobel 90
4.6.2.3 Coefficient of friction
Figure 4-51 Friction coefficient tribometer measurement as
a function of time for TiN 22°C
Figure 4-51 shows the raw friction coefficient
measurement data of base fluids with Titanium
Nitride (TiN) from the tribometer apparatus.
All these fluids were measured at ambient
temperature at 22°C. In Figure 4-52 we can
observe the average values of µ for all the TiN
added fluid system measured at 22°C.
The results from these tests indicate that adding
nanosized TiN particles to the reference fluid
does not change very much µ at ambient
temperature, compared to many other tests. As seen inFigure 4-52, the lowest observed
mean value for this test was a µ of 0.315, which is from the reference fluid. The
addition of TiN yields a slight increase in friction up to a µ of 0.386 (+22%) for 0.1g
0,3150,386 0,377 0,381 0,356
0,000
0,100
0,200
0,300
0,400
0,500
µ
Mean Friction Coefficient for TiN at 22°C
Ref Fluid 1 Fluid 2 Fluid 3 Fluid 4
Figure 4-52 Mean Friction Coefficients for TiN
at 22°C

Development of an improved nanoparticle-modified water based drilling fluid
MSc Thesis, Stanislaw Wrobel 91
0,3370,413 0,410 0,416 0,386
0,000
0,100
0,200
0,300
0,400
0,500
µ
Mean Friction Coefficient for TiN at 55°C
Ref Fluid 1 Fluid 2 Fluid 3 Fluid 4
Figure 4-54 Mean Friction Coefficients for TiN
at 55°C
added TiN nanoparticles. Table 4-20 on page 93 displays the other %-changes relative
to its reference fluids.
Figure 4-53 Friction coefficient tribometer measurement as a function of time for TiN 55°C
Figure 4-53 shows the raw friction coefficient
measurement data of base fluids with
Titanium Nitride (TiN) from the tribometer
apparatus. All these fluids were measured at
55°C. From Figure 4-54 it can be observed
that adding nanosized TiN particles to the
reference fluid does not affect the lubricity at
55°C. The lowest observed mean value for
this test was a µ of 0.337, which is from the
reference fluid. The addition of TiN yields a
slight increase in friction coefficient up to
0.416 (+23%) for 0.3g added TiN nanoparticles. Relatively the result is very similar to
the one taken at 22°C. Table 4-20 on page 93 displays the other %-changes relative to
its reference fluids.
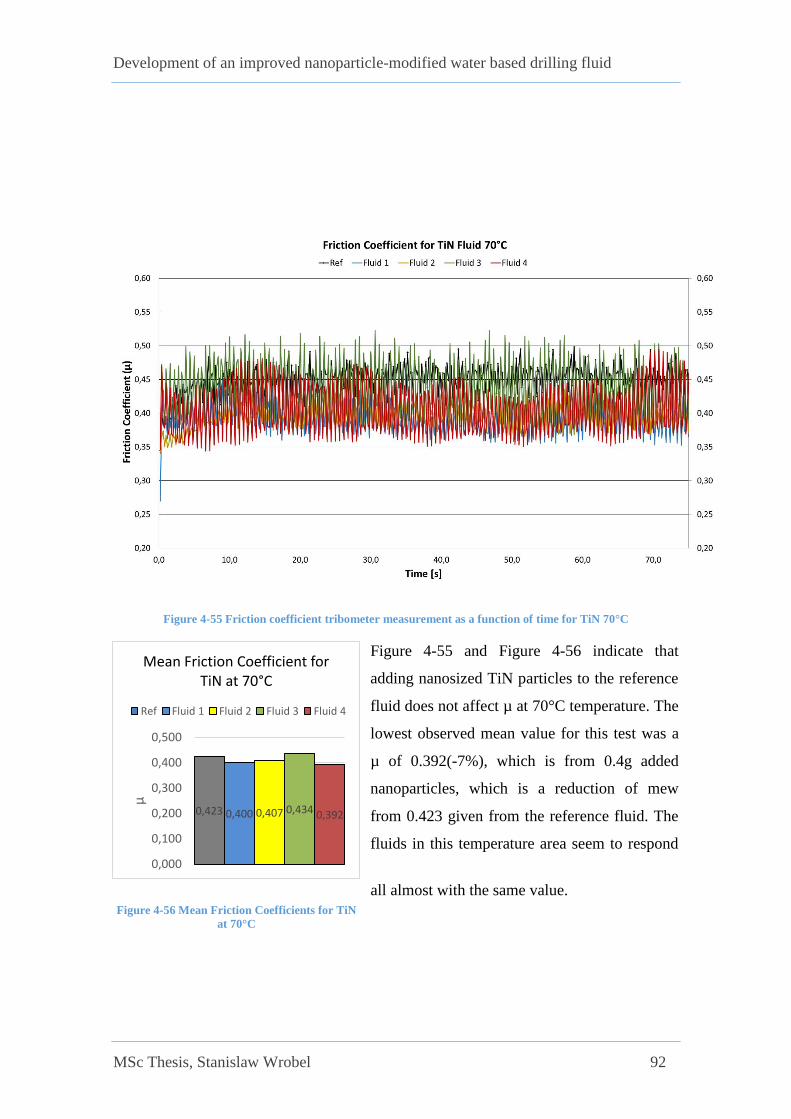
Development of an improved nanoparticle-modified water based drilling fluid
MSc Thesis, Stanislaw Wrobel 92
0,423 0,400 0,407 0,434 0,392
0,000
0,100
0,200
0,300
0,400
0,500
µ
Mean Friction Coefficient for TiN at 70°C
Ref Fluid 1 Fluid 2 Fluid 3 Fluid 4
Figure 4-56 Mean Friction Coefficients for TiN
at 70°C
Figure 4-55 Friction coefficient tribometer measurement as a function of time for TiN 70°C
Figure 4-55 and Figure 4-56 indicate that
adding nanosized TiN particles to the reference
fluid does not affect µ at 70°C temperature. The
lowest observed mean value for this test was a
µ of 0.392(-7%), which is from 0.4g added
nanoparticles, which is a reduction of mew
from 0.423 given from the reference fluid. The
fluids in this temperature area seem to respond
all almost with the same value.

Development of an improved nanoparticle-modified water based drilling fluid
MSc Thesis, Stanislaw Wrobel 93
Table 4-20 µ-%Change associated with reference for TiN
µ-%Change associated with reference for TiN
°C 22° 55° 70°
Fluid 1 (Ref +0,1g) +22 % +23 % -6 %
Fluid 2 (Ref +0,2g) +19 % +21 % -4 %
Fluid 3 (Ref +0,3g) +21 % +23 % +13 %
Fluid 4 (Ref +0,4g) +13 % +14 % -7 %
Based on experiments with TiN-modified drilling fluid system, no no lubricating effect
could be observed..
Table 4-21 Models for mean friction coefficient data as a function of temperature for TiN added drilling fluid
systems
Drilling
fluids
Friction measurement
Model R²
22 oC 50 oC 70 oC
Reference 0,315 0,337 0,423 y = 0,002x + 0,2612 0,7331
Fluid 1 0,386 0,413 0,400 y = 0,0004x + 0,3812 0,4655
Fluid 2 0,377 0,410 0,407 y = 0,0018x + 0,4264 0,8669
Fluid 3 0,381 0,416 0,434 y = 0,0011x + 0,3570 0,9981
Fluid 4 0,356 0,386 0,392 y = 0,0008x + 0,3400 0,9764
Figure 4-57 shows that as temperature increases the coefficient of friction becomes
higher as well. The addition of TiN nanoparticles does not reduce the coefficient of
friction profile below the nanofree system for our screening case. Still, R^2 is above 0.8
for 3 out of 5 fluid representing the linear relationship.
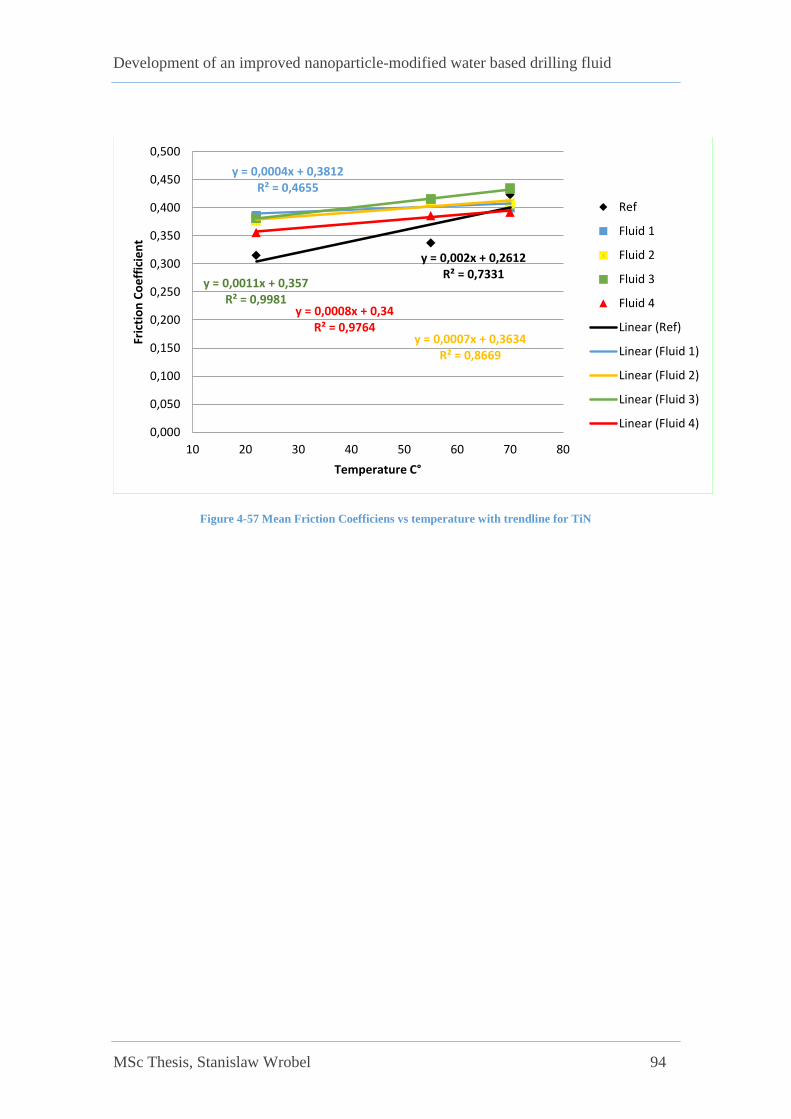
Development of an improved nanoparticle-modified water based drilling fluid
MSc Thesis, Stanislaw Wrobel 94
Figure 4-57 Mean Friction Coefficiens vs temperature with trendline for TiN
y = 0,002x + 0,2612R² = 0,7331
y = 0,0004x + 0,3812R² = 0,4655
y = 0,0007x + 0,3634R² = 0,8669
y = 0,0011x + 0,357R² = 0,9981
y = 0,0008x + 0,34R² = 0,9764
0,000
0,050
0,100
0,150
0,200
0,250
0,300
0,350
0,400
0,450
0,500
10 20 30 40 50 60 70 80
Fric
tio
n C
oe
ffic
ien
t
Temperature C°
Ref
Fluid 1
Fluid 2
Fluid 3
Fluid 4
Linear (Ref)
Linear (Fluid 1)
Linear (Fluid 2)
Linear (Fluid 3)
Linear (Fluid 4)

Development of an improved nanoparticle-modified water based drilling fluid
MSc Thesis, Stanislaw Wrobel 95
4.7 Viscoelasticity – Oscillatory test: Amplitude Sweep
Drilling fluids can display viscous and elastic responses during deformation. The elastic
property has an effect on the flow behavior and pressure drop during circulation of
drilling fluid. The measure of viscoelastic properties of drilling fluids allow for the
evaluation of the gel strength of drilling fluid. MoS2- modified systems showed great
effect on rheology and lubricity it have been selected for an amplitude sweep analysis.
Additionally, fluids containing graphene have been tested as well. To classify
viscoelastic behavior of fluids one can investigate the yield point or the flow point. In
this thesis, we use the flow point to evaluate viscoelastic properties.
Figure 4-58 shows the phase angle vs the shear stress obtained from the experiment.
The bar diagram in Figure 4-59 displays the results, where we clearly see energy
absorbed by the fluid is at least doubled for the MoS2 modified fluids. That indicates an
improvement in terms of hydraulics and barite sagging.
Figure 4-58 Shear stress absorbed vs phase angle – MoS2 fluids
0
15
30
45
60
75
90
105
0 0,5 1 1,5 2 2,5 3 3,5 4 4,5 5 5,5
Ph
ase
an
gle
, de
g
Shear stress, Pa
Ref [CMC]
Ref +0.3g MoS2
Ref +0.4g MoS2
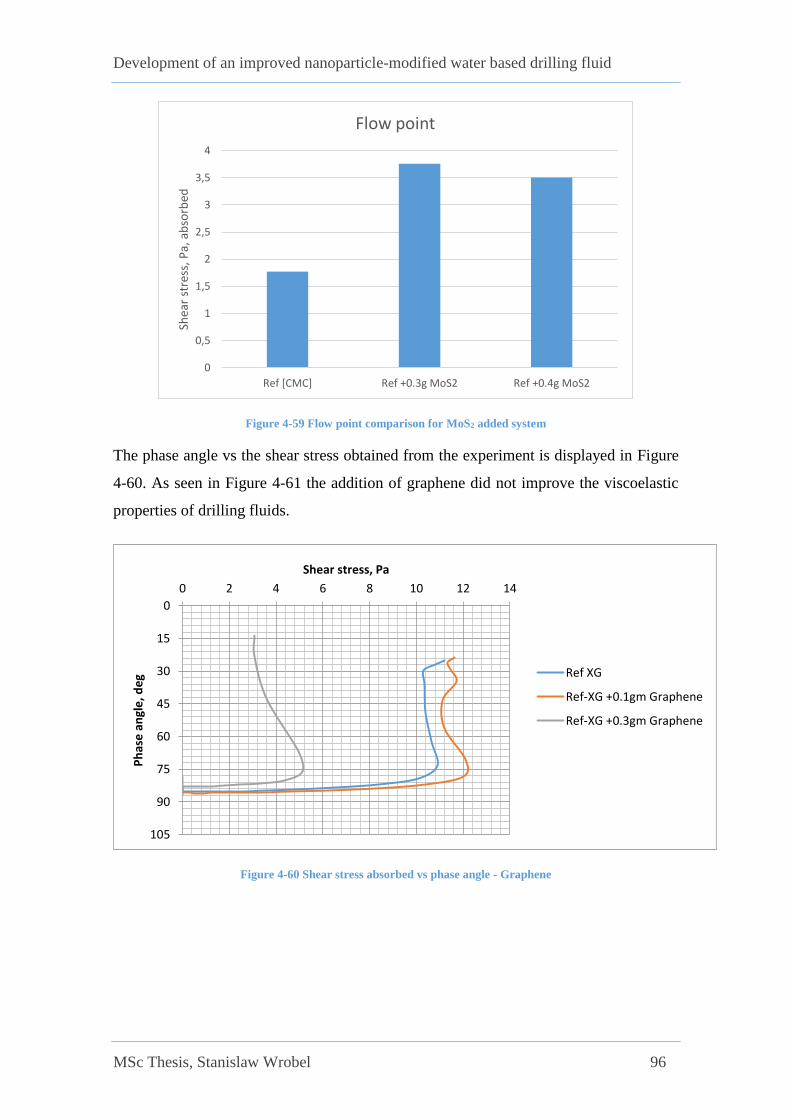
Development of an improved nanoparticle-modified water based drilling fluid
MSc Thesis, Stanislaw Wrobel 96
Figure 4-59 Flow point comparison for MoS2 added system
The phase angle vs the shear stress obtained from the experiment is displayed in Figure
4-60. As seen in Figure 4-61 the addition of graphene did not improve the viscoelastic
properties of drilling fluids.
Figure 4-60 Shear stress absorbed vs phase angle - Graphene
0
0,5
1
1,5
2
2,5
3
3,5
4
Ref [CMC] Ref +0.3g MoS2 Ref +0.4g MoS2
Shea
r st
ress
, P
a, a
bso
rbed
Flow point
0
15
30
45
60
75
90
105
0 2 4 6 8 10 12 14
Ph
ase
an
gle
, de
g
Shear stress, Pa
Ref XG
Ref-XG +0.1gm Graphene
Ref-XG +0.3gm Graphene
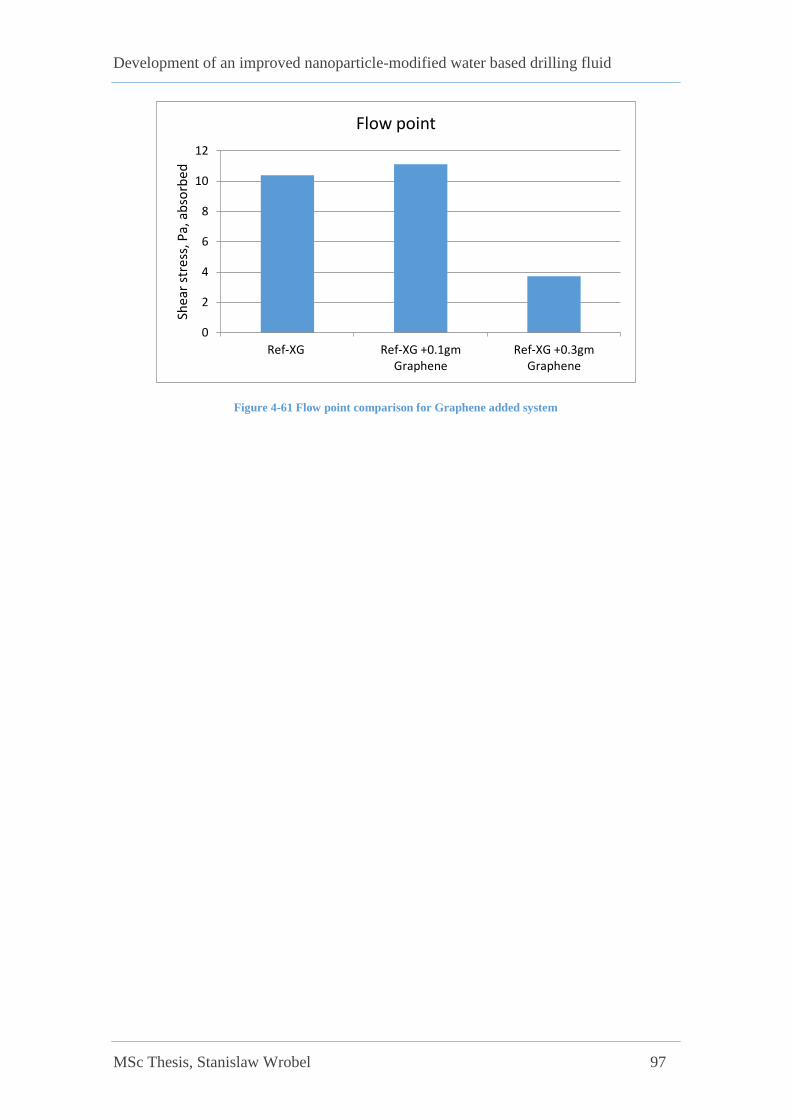
Development of an improved nanoparticle-modified water based drilling fluid
MSc Thesis, Stanislaw Wrobel 97
Figure 4-61 Flow point comparison for Graphene added system
0
2
4
6
8
10
12
Ref-XG Ref-XG +0.1gmGraphene
Ref-XG +0.3gmGraphene
Shea
r st
ress
, Pa,
ab
sorb
ed
Flow point
Development of an improved nanoparticle-modified water based drilling fluid
MSc Thesis, Stanislaw Wrobel 98
5 Performance simulation studies
This chapter presents the improved drilling fluid performance in a simulated well
scenario. The study evaluates the hydraulics, ECD of the selected nano-added fluid
comparing with its nano-free reference fluid system.
5.1 Hydraulic simulation
Drilling fluid is an integral part of the drilling operation. Among other functions,
drilling fluids main function is to maintain a stable bottomhole pressure to avoid well
instability. The pressure exerted by the drilling fluid is determined by flowrate and its
physical & rheological properties.
In this section, the hydraulic responses of the drilling fluids will be investigated by
simulation in a specific well. The evaluation is based on the ECD and the pump
pressures for various flow rates. Previous studies have shown that the Unified model
(eq. 13 p.26) predicts more accurately than the Herschel-Bulkley model, therefore it
used for the simulation. [24]
5.1.1 Simulation arrangement
Figure 5-1 illustrates a 10000ft deep experimental well considered for the simulation.
The inner diameter of the well is 8.75’’ casing and 8.5 ‘’ well. The inner and outer
diameter of the pipe is 5’’ and 4’’ respectively.
To simplify the experimental setup, the BHA is not considered. The drill string is
connected with a bit contain three 28/32-in sized nozzles.
The discharge line is connected with the top of the pipe and therefore, we assume that
we do not have surface pressure losses due to surface equipment.
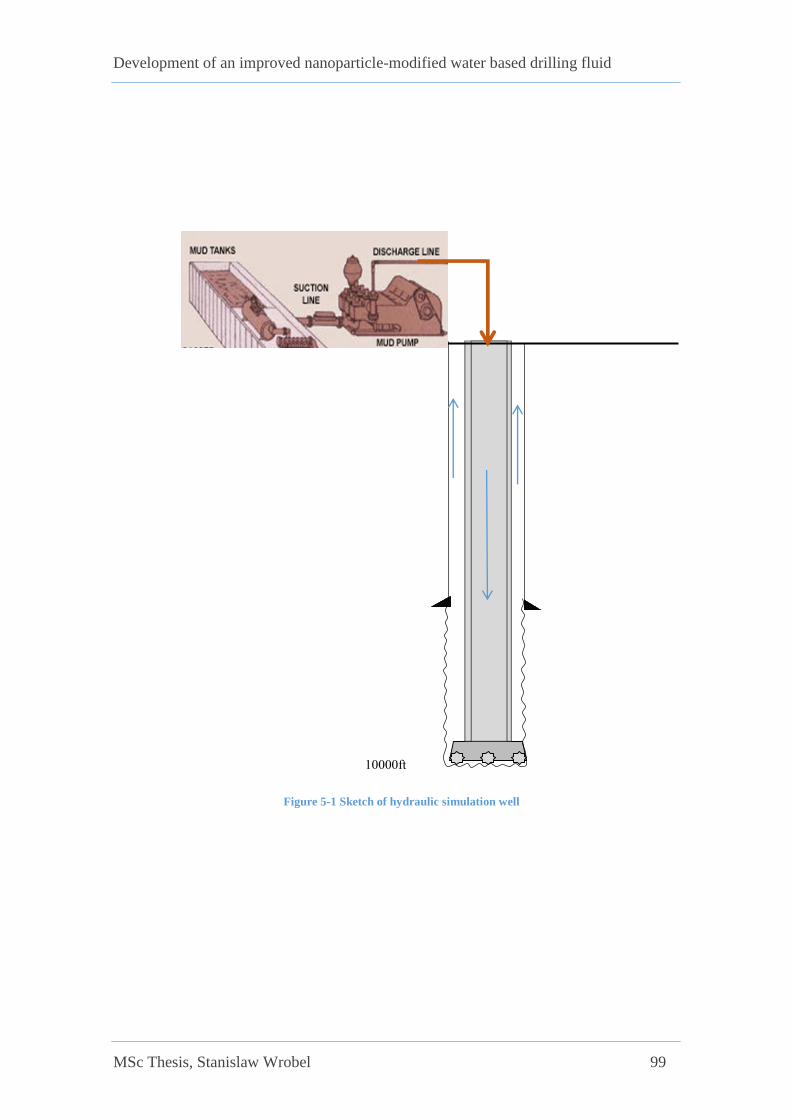
Development of an improved nanoparticle-modified water based drilling fluid
MSc Thesis, Stanislaw Wrobel 99
10000ft
Figure 5-1 Sketch of hydraulic simulation well

Development of an improved nanoparticle-modified water based drilling fluid
MSc Thesis, Stanislaw Wrobel 100
5.1.2 Effect of graphene-modified fluid on ECD and Pump Pressure simulation results
The viscometer data of nano-graphene-modified drilling fluid that were used for the
simulation, are given in Figure 4-35 on p.71. These fluids have been applied in the
simulation well at the rate of 5 gpm to 600 gpm.
Figure 5-2 shows the simulated ECD as a function of flow rates. Notice that as the flow
rate increases, the ECD increase as well. That is due to the increase in friction pressure
loss, i.e. the fluid experiences more resistance to flow. The fluid containing 0.3g nano-
graphene yields a higher ECD, while the 0.4g added nano-Graphene yields the lowest
ECD.
Figure 5-3 displays the total pressure loss for each fluid in the well. As seen in Figure
5-4 the difference between the reference fluid, the 0.1g and 0.2 graphene-modified fluid
is negligible. Depending on what is desired, adding 0.3g or 0.4g nano-sized graphene
particles can have a great impact on the fluid system. Figure 5-4 displays the %-
difference related to the reference fluid, pointing out the tremendous effects of graphene
nanoparticles on pump pressure loss.
Figure 5-2 ECD of the drilling fluid systems including Graphene from the Unified hydraulics model
8,80
8,90
9,00
9,10
9,20
9,30
9,40
9,50
9,60
0 100 200 300 400 500 600
ECD
, sg
Flow rate, gpm
Ref
Ref + 0.1g Graphene
Ref + 0.2g Graphene
Ref + 0.3g Graphene
Ref + 0.4g Graphene
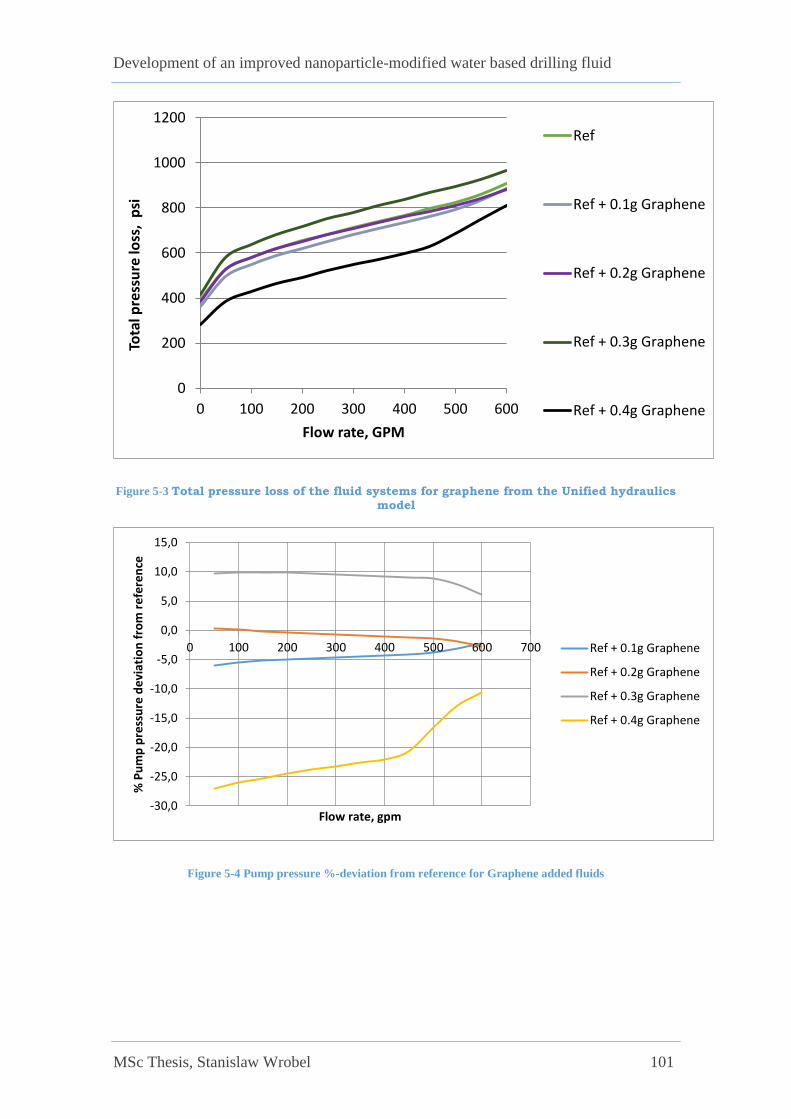
Development of an improved nanoparticle-modified water based drilling fluid
MSc Thesis, Stanislaw Wrobel 101
Figure 5-3 Total pressure loss of the fluid systems for graphene from the Unified hydraulics model
Figure 5-4 Pump pressure %-deviation from reference for Graphene added fluids
0
200
400
600
800
1000
1200
0 100 200 300 400 500 600
Tota
l pre
ssu
re lo
ss,
psi
Flow rate, GPM
Ref
Ref + 0.1g Graphene
Ref + 0.2g Graphene
Ref + 0.3g Graphene
Ref + 0.4g Graphene
-30,0
-25,0
-20,0
-15,0
-10,0
-5,0
0,0
5,0
10,0
15,0
0 100 200 300 400 500 600 700
% P
um
p p
ress
ure
de
viat
ion
fro
m r
efe
ren
ce
Flow rate, gpm
Ref + 0.1g Graphene
Ref + 0.2g Graphene
Ref + 0.3g Graphene
Ref + 0.4g Graphene

Development of an improved nanoparticle-modified water based drilling fluid
MSc Thesis, Stanislaw Wrobel 102
5.1.3 Effect of MoS2-modified fluid on ECD and Pump pressure simulation results
Similarly, the effect of MoS2 treated drilling fluids have been simulated. The viscometer
data of drilling fluids are given on p.43 in Figure 4-7. The fluids are pumped at the rate
ranging from 5 gpm to 600 gpm. Figure 5-6 and Figure 5-7 display that the 0.1gm MoS2
modified fluid yields a significant increment in ECD and pump pressure loss. The other
fluids do not differentiate a lot from each other, but all of them are slightly above the
reference fluid in terms of ECD and pump pressure loss.
Figure 5-5 ECD of fluid systems including MoS2 nanoparticles
8,6
8,7
8,8
8,9
9,0
9,1
9,2
0 100 200 300 400 500 600 700
ECD
, sg
Flow rate, gpm
Ref
Ref + 0.1gm MoS2
Ref + 0.2gm MoS2
Ref + 0.3gm MoS2
Ref + 0.4gm MoS2

Development of an improved nanoparticle-modified water based drilling fluid
MSc Thesis, Stanislaw Wrobel 103
Figure 5-6 Simulated pump pressure for MoS2 nanoparticles
5.2 Cuttings transport simulation
Hole cleaning is also an important issue during drilling operation. The cutting lifting
capacity of drilling fluids depends on its physical and rheological parameters. [35] [36]
The best nano-modified systems, in terms on lubricity developed in Section 4, were
further evaluated in a cutting transport efficiency simulation. As always, each nano-
modified fluid will be compared to its respective nano-free drilling fluid.
The higher flow rate is positive to lift cutting out of the well. However, the higher flow
rate increases ECD and stress in drilling string. if the flow rate is not optimized, in the
worst case scenario, it may case well instability and drill string damage. During
simulation the lower minimum flow rate to transport cutting is indirectly interpreted as
drilling fluid has good properties.
0
100
200
300
400
500
600
700
800
0 100 200 300 400 500 600 700
Pu
mp
pre
ssu
re, p
si
Flow rate, gpm
Ref
Ref + 0.1gm MoS2
Ref + 0.2gm MoS2
Ref + 0.3gm MoS2
Ref + 0.4gm MoS2

Development of an improved nanoparticle-modified water based drilling fluid
MSc Thesis, Stanislaw Wrobel 104
5.2.1 Simulation setup
The cutting transport property of the considered drilling fluid has been simulated in a
deviated well and 12000ft long well. The well has been drilled in 12.615’’ open hole
and on the top, it was cased with intermediate 13 3/8’’ casing.
During drilling a 5’’OD and 4.86’’ ID drilling pipe was used. The BHA components are
presented in Appendix B. The well is constructed in Landmark/WellplanTM software
[37]. The well structure is shown on Figure 5-1.
5.2.2 Drilling fluids
The data in Table 5-1 represent the Fann 35 viscometer data measured at the given set
RPM for the fluids. These data are used for the borehole cuttings transport simulation.
Table 5-1 Fann35 Rheometer data for Graphene and MoS2 with their reference fluids
RPM XG-Ref XG-ref+0.1g graphene CMC-Ref CMC-ref+0.4g MoS2
600 40 38 19 22
300 33 32 12,5 15
200 30 28 10,5 13
100 25 23,5 7,5 10,5
60 23 22 6,5 9
30 21 19 5 8
6 17 15,5 4 5,5
3 15 14 3,5 4,5
5.2.3 Transport parameters
The transport data consists of operational parameters and cutting parameter. The
transport efficient of the drilling fluid to lift 0.125in size and 2.5sg density of cutting
were analyzed by pumping at the rate of 450ppg.
Cuttings are generated while drilling a formation at the rate of 60ft/hr. In order to have
good borehole cleaning performance, i.e. avoid bedding of particles, the cutting
particles have to be at least kept in suspension in the drilling fluid and ultimately lifted
to surface. Therefore, the drill string is set to be rotating at the rate of 90 revolutions per
minute. A picture of the cuttings transport parameters is shown in Figure 5-7.

Development of an improved nanoparticle-modified water based drilling fluid
MSc Thesis, Stanislaw Wrobel 105
Figure 5-7 Cutting transport analysis data
5.2.4 Simulation result and discussion
The drilling fluids cutting carrying capacity were evaluated base on the simulation
parameters considered above. The analysis cutting bed height at the 450gpm, which is
the typical circulation rate. Cutting accumulation in wellbore deteriorate drilling
operation. Among others, it will cause drill string sticking, modify well pressure and
hence may cause desired wellbore instability and increase torque and drag [36]
As shown in Figure 5-8 and Figure 5-9, the in the vertical section up to 5000ft, has no
cutting deposition. Below that depth inclination of wellbore increases allowing cuttings
to settle and cause bedding. Increased inclination increases bedding troubles, i.e.
increasing bed height.
Figure 5-9 shows the simulation results obtained from using the MoS2 added fluid
system and its reference fluid. The results show that the addition of MoS2 nanoparticles
for the considered flow rate reduced the cutting bed height from 3.8in to 2.2in, about
42%. This is due to the impact of nano-additive on the rheology property of the drilling
fluid.
Figure 5-8 displays the hole cleaning performance of Graphene added fluid compared to
its reference fluid system. Figure 5-8 indicates that the 0.1 gram graphene-modification
does not have any impact on borehole cleaning. The main reason is shown on the
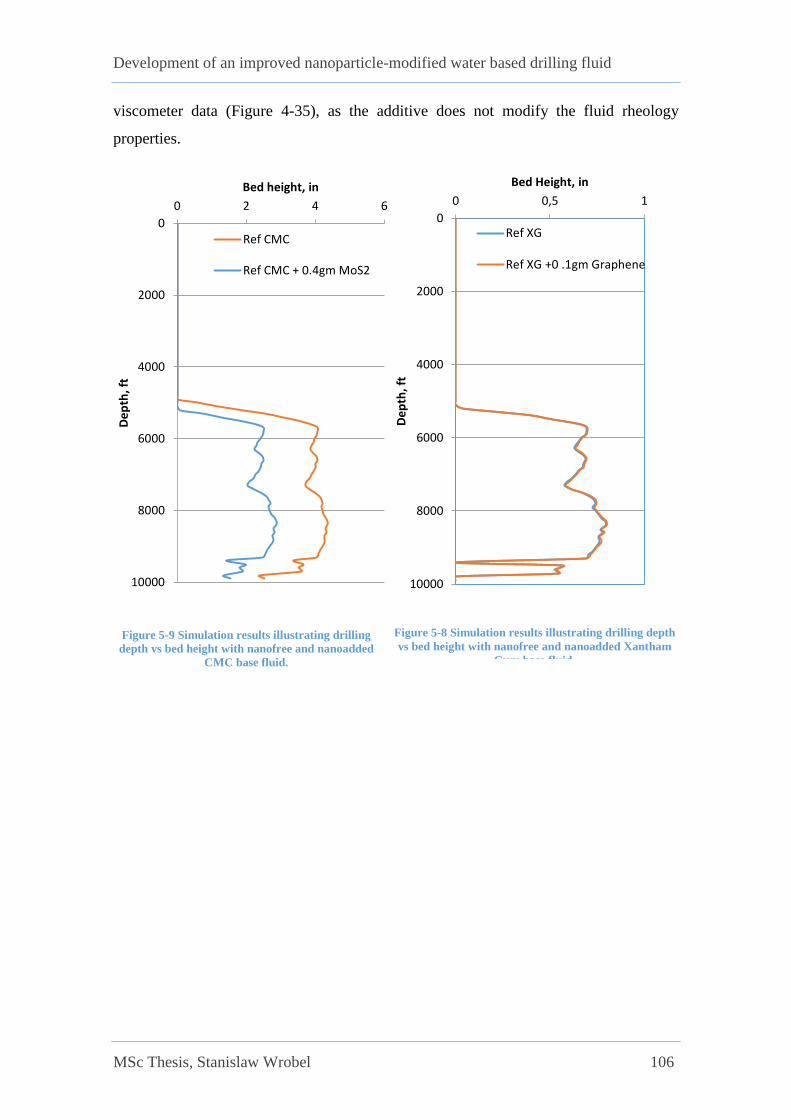
Development of an improved nanoparticle-modified water based drilling fluid
MSc Thesis, Stanislaw Wrobel 106
0
2000
4000
6000
8000
10000
0 2 4 6
De
pth
, ft
Bed height, in
Ref CMC
Ref CMC + 0.4gm MoS2
0
2000
4000
6000
8000
10000
0 0,5 1
De
pth
, ft
Bed Height, in
Ref XG
Ref XG +0 .1gm Graphene
Figure 5-8 Simulation results illustrating drilling depth
vs bed height with nanofree and nanoadded Xantham
Gum base fluid.
Figure 5-9 Simulation results illustrating drilling
depth vs bed height with nanofree and nanoadded
CMC base fluid.
viscometer data (Figure 4-35), as the additive does not modify the fluid rheology
properties.
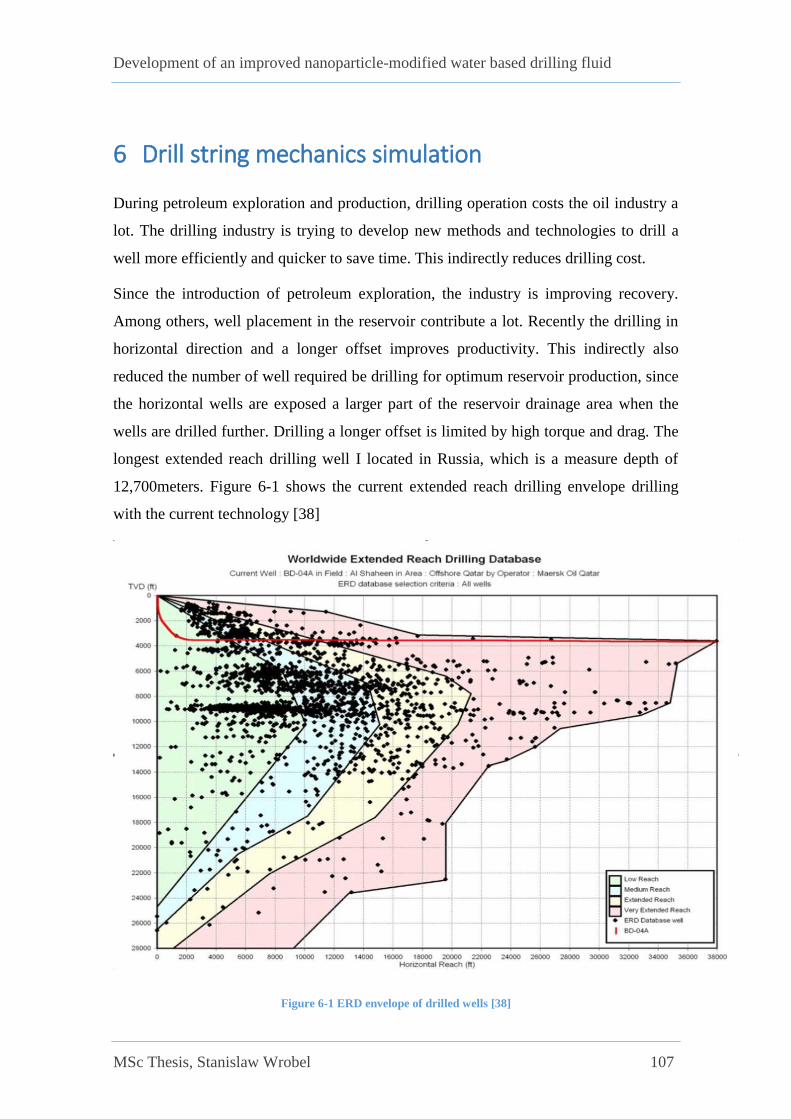
Development of an improved nanoparticle-modified water based drilling fluid
MSc Thesis, Stanislaw Wrobel 107
6 Drill string mechanics simulation
During petroleum exploration and production, drilling operation costs the oil industry a
lot. The drilling industry is trying to develop new methods and technologies to drill a
well more efficiently and quicker to save time. This indirectly reduces drilling cost.
Since the introduction of petroleum exploration, the industry is improving recovery.
Among others, well placement in the reservoir contribute a lot. Recently the drilling in
horizontal direction and a longer offset improves productivity. This indirectly also
reduced the number of well required be drilling for optimum reservoir production, since
the horizontal wells are exposed a larger part of the reservoir drainage area when the
wells are drilled further. Drilling a longer offset is limited by high torque and drag. The
longest extended reach drilling well I located in Russia, which is a measure depth of
12,700meters. Figure 6-1 shows the current extended reach drilling envelope drilling
with the current technology [38]
Figure 6-1 ERD envelope of drilled wells [38]
Development of an improved nanoparticle-modified water based drilling fluid
MSc Thesis, Stanislaw Wrobel 108
6.1 Description of fluids
As mentioned earlier, the current drilling envelope has been drilling the conventional
drilling fluid and method. To analyze the questions addressed in section 1.2, this part
will present the effect of nanoparticles by evaluating the potentially extended reach
drilling.
For torque and drag simulation studies, best nano-modifying fluids in terms of lubricity
were selected. The selection was based on the friction test results presented in section 4.
Table 6-1 and Table 6-2 are the fluid systems. The average coefficient of frictions are
calculated from measured friction at the three temperatures.

Development of an improved nanoparticle-modified water based drilling fluid
MSc Thesis, Stanislaw Wrobel 109
Table 6-1 Cofficients of frictions from experiments averaged for T&D simulation – MoS2
Drilling fluids Coefficient of frictions
200C 550C 700C Average
Ref CMC 0.455 0.565 0.529 0.5160
Ref CMC+0.4g MoS2 0.202 0.327 0.344 0.2910
Table 6-2 Cofficients of frictions from experiments averaged for T&D simulation – Graphene
Drilling fluids Coefficient of frictions
200C 550C 700C Average
Ref XG 0.2500 0.2750 0.2650 0.2630
Ref XG+0.1gm
Graphene 0.1372 0.1800 0.2000 0.1724
6.1.1 Torque and drag simulation setup
Rotating at bottom, drilling and two tripping operations, in and out were considered to
characterize the effect of nano-additive treated fluid. The drilling fluids have been
pumped in the simulation well at the rate of 500gpm. Figure 6-2 shows the operational
parameters.
Figure 6-2 Drilling and tripping simulation parameters
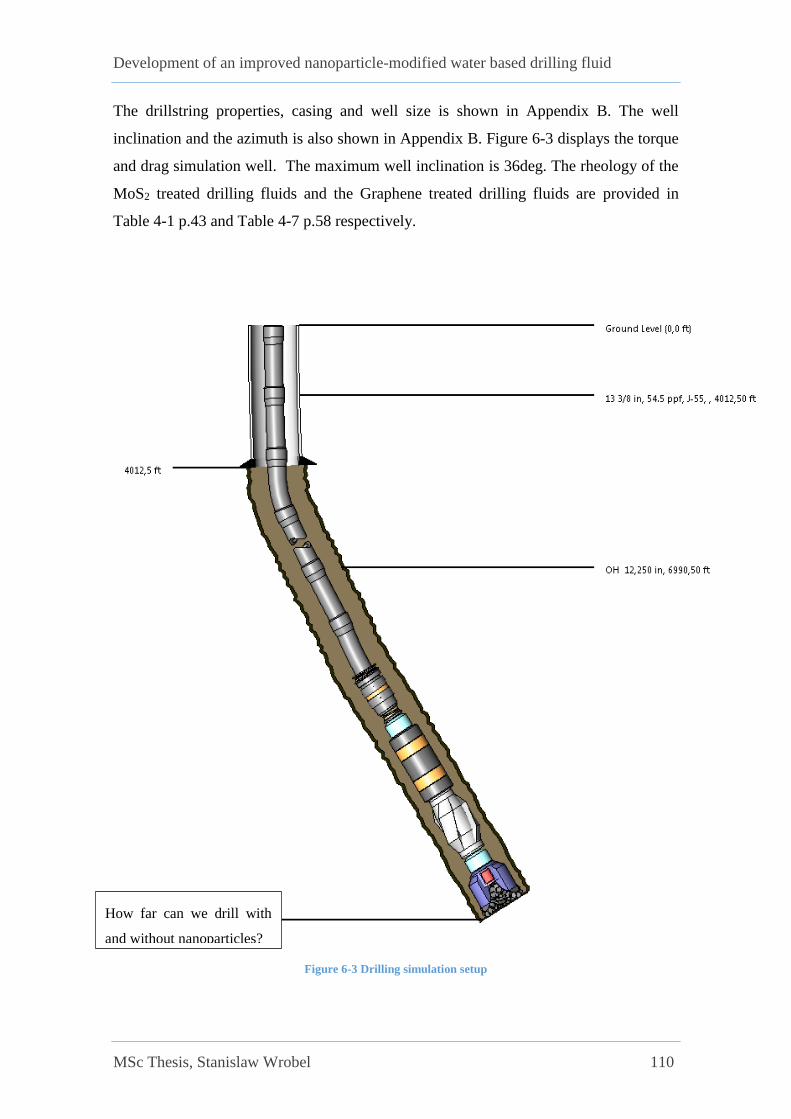
Development of an improved nanoparticle-modified water based drilling fluid
MSc Thesis, Stanislaw Wrobel 110
The drillstring properties, casing and well size is shown in Appendix B. The well
inclination and the azimuth is also shown in Appendix B. Figure 6-3 displays the torque
and drag simulation well. The maximum well inclination is 36deg. The rheology of the
MoS2 treated drilling fluids and the Graphene treated drilling fluids are provided in
Table 4-1 p.43 and Table 4-7 p.58 respectively.
Figure 6-3 Drilling simulation setup
How far can we drill with
and without nanoparticles?
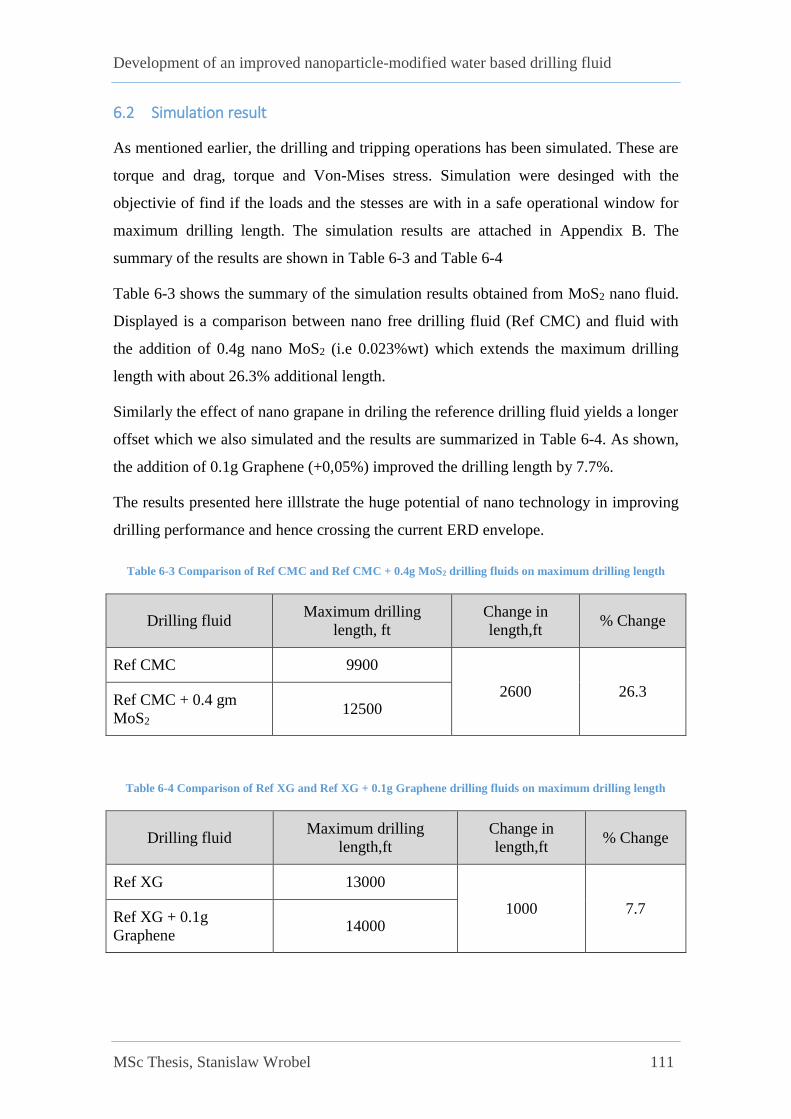
Development of an improved nanoparticle-modified water based drilling fluid
MSc Thesis, Stanislaw Wrobel 111
6.2 Simulation result
As mentioned earlier, the drilling and tripping operations has been simulated. These are
torque and drag, torque and Von-Mises stress. Simulation were desinged with the
objectivie of find if the loads and the stesses are with in a safe operational window for
maximum drilling length. The simulation results are attached in Appendix B. The
summary of the results are shown in Table 6-3 and Table 6-4
Table 6-3 shows the summary of the simulation results obtained from MoS2 nano fluid.
Displayed is a comparison between nano free drilling fluid (Ref CMC) and fluid with
the addition of 0.4g nano MoS2 (i.e 0.023%wt) which extends the maximum drilling
length with about 26.3% additional length.
Similarly the effect of nano grapane in driling the reference drilling fluid yields a longer
offset which we also simulated and the results are summarized in Table 6-4. As shown,
the addition of 0.1g Graphene (+0,05%) improved the drilling length by 7.7%.
The results presented here illlstrate the huge potential of nano technology in improving
drilling performance and hence crossing the current ERD envelope.
Table 6-3 Comparison of Ref CMC and Ref CMC + 0.4g MoS2 drilling fluids on maximum drilling length
Drilling fluid Maximum drilling
length, ft
Change in
length,ft % Change
Ref CMC 9900
2600 26.3 Ref CMC + 0.4 gm
MoS2 12500
Table 6-4 Comparison of Ref XG and Ref XG + 0.1g Graphene drilling fluids on maximum drilling length
Drilling fluid Maximum drilling
length,ft
Change in
length,ft % Change
Ref XG 13000
1000 7.7 Ref XG + 0.1g
Graphene 14000
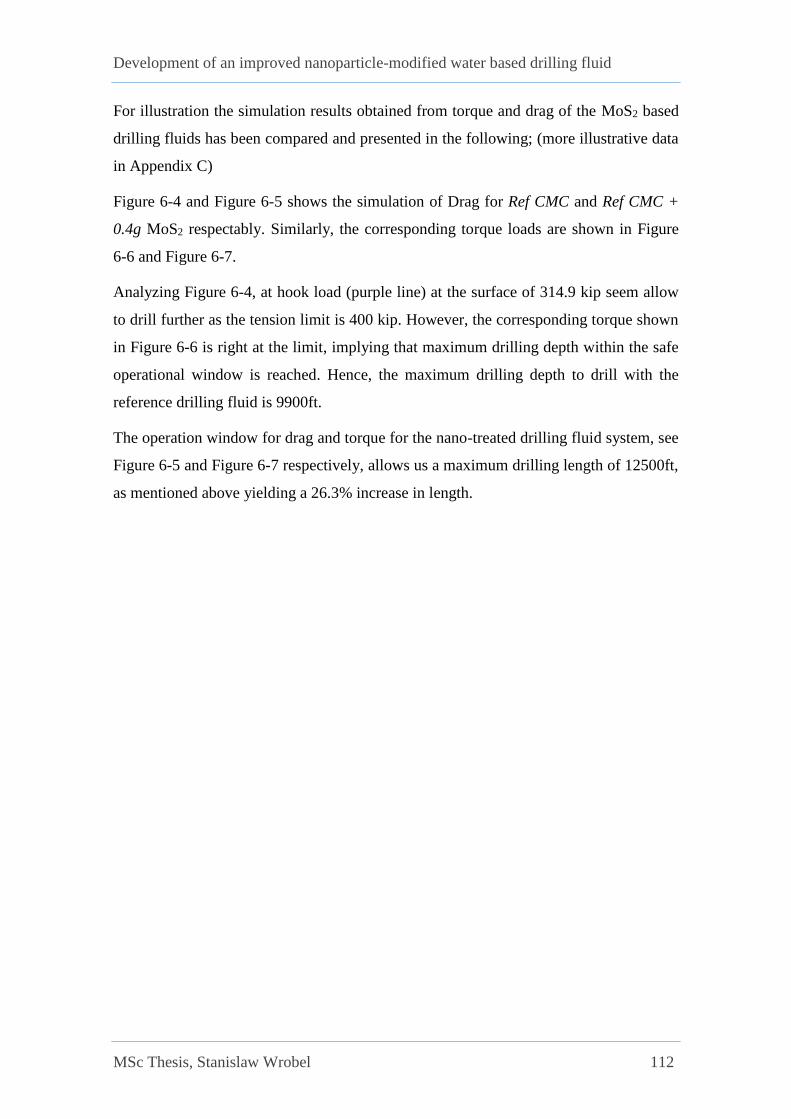
Development of an improved nanoparticle-modified water based drilling fluid
MSc Thesis, Stanislaw Wrobel 112
For illustration the simulation results obtained from torque and drag of the MoS2 based
drilling fluids has been compared and presented in the following; (more illustrative data
in Appendix C)
Figure 6-4 and Figure 6-5 shows the simulation of Drag for Ref CMC and Ref CMC +
0.4g MoS2 respectably. Similarly, the corresponding torque loads are shown in Figure
6-6 and Figure 6-7.
Analyzing Figure 6-4, at hook load (purple line) at the surface of 314.9 kip seem allow
to drill further as the tension limit is 400 kip. However, the corresponding torque shown
in Figure 6-6 is right at the limit, implying that maximum drilling depth within the safe
operational window is reached. Hence, the maximum drilling depth to drill with the
reference drilling fluid is 9900ft.
The operation window for drag and torque for the nano-treated drilling fluid system, see
Figure 6-5 and Figure 6-7 respectively, allows us a maximum drilling length of 12500ft,
as mentioned above yielding a 26.3% increase in length.
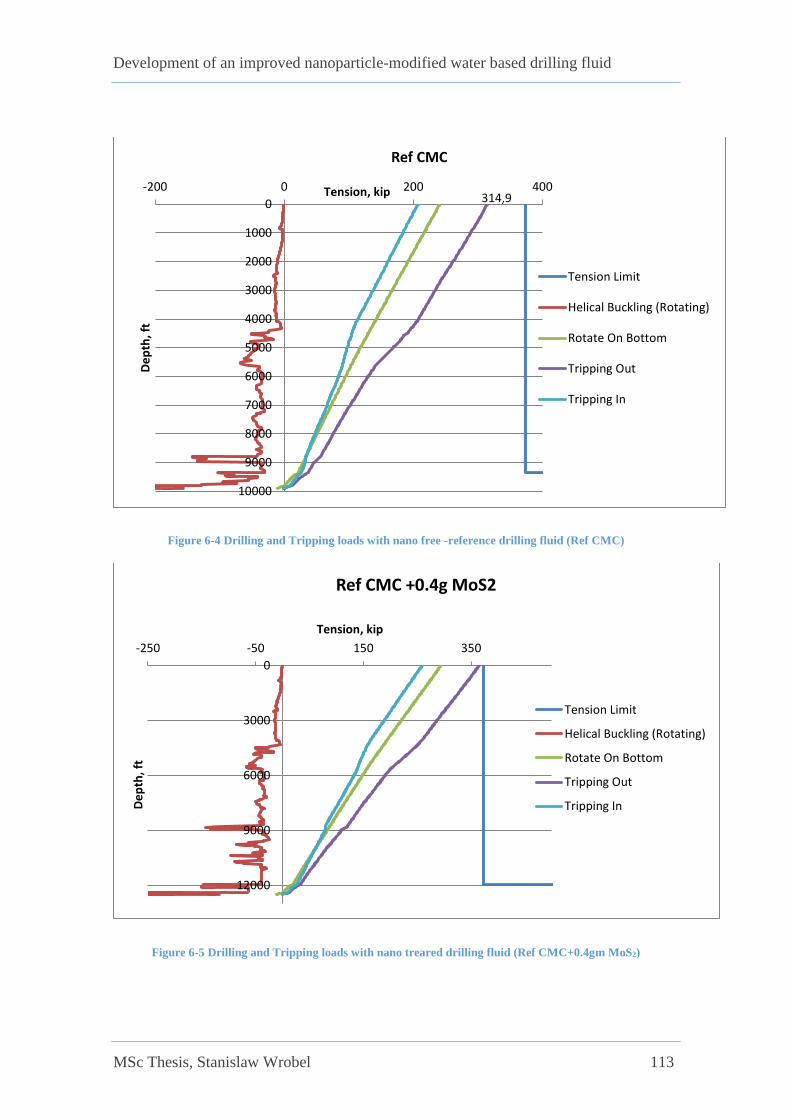
Development of an improved nanoparticle-modified water based drilling fluid
MSc Thesis, Stanislaw Wrobel 113
Figure 6-4 Drilling and Tripping loads with nano free -reference drilling fluid (Ref CMC)
Figure 6-5 Drilling and Tripping loads with nano treared drilling fluid (Ref CMC+0.4gm MoS2)
314,90
1000
2000
3000
4000
5000
6000
7000
8000
9000
10000
-200 0 200 400
De
pth
, ft
Tension, kip
Ref CMC
Tension Limit
Helical Buckling (Rotating)
Rotate On Bottom
Tripping Out
Tripping In
0
3000
6000
9000
12000
-250 -50 150 350
De
pth
, ft
Tension, kip
Ref CMC +0.4g MoS2
Tension Limit
Helical Buckling (Rotating)
Rotate On Bottom
Tripping Out
Tripping In

Development of an improved nanoparticle-modified water based drilling fluid
MSc Thesis, Stanislaw Wrobel 114
Figure 6-6 Torque loads with nano-free reference drilling fluid (Ref CMC)
Figure 6-7 Torque loads with nano treated drilling fluid (Ref CMC+0.4gm MoS2)
0
2000
4000
6000
8000
10000
12000
0 10000 20000
De
pth
, ft
Torque, ft-lbf
Ref CMC
Torque Limit
Rotate On Bottom
Tripping Out
Tripping In
0
2000
4000
6000
8000
10000
12000
14000
0 10000 20000
De
pth
, ft
Torque, ft-lbf
Ref CMC +0.4gm MoS2
Torque Limit
Rotate On Bottom
Tripping Out
Tripping In
Development of an improved nanoparticle-modified water based drilling fluid
MSc Thesis, Stanislaw Wrobel 115
7 Summary and Discussion
Experiments performed in the thesis conclude that the nano-additives can affect
physical, rheological and lubricating parameters. The crystalline structure of the
nanosized particles, their surface chemistry, their grain size distribution and synergy
with other ingredients in the water based drilling mud system can affect the fluid
properties in both positive and negative ways. Therefore each type of nanoparticles has
to be discussed by itself.
7.1 Effect of Molybdenum disulfide (MoS2) nanoparticles
Rheological measurements show that adding 0.1g MoS2 increased Bingham YS by
183%, while an additive range from 0.2g to 0.4g only yielded an increment of about
50% in yield strength compared to the base system. Additionally, the 0.1g MoS2 added
fluid displays an increased LSYS as it increased from 3 lbf/100sqft in the reference
system to 5 lbf/100sqft, while the other concentrations barely show an increment. In
addition, the filtrate loss slightly increased, suggesting that the addition of MoS2 may
turn the system into a more flocculated system. PV is unaffected.
Flow behavior index (n) indicates fluids tendency to shear thin. Consistency index (k)
serves as a viscosity index. The addition of MoS2 nanoparticles increases k and
decreases n. All fluids in this thesis display pseudoplastic behavior, i.e. all fluids are
shear thinning. The system with 0.1g additive stands out with a significantly increased
k, from 0.29 to 3.89, meaning that viscosity is significantly increased.
The pH value barely changes by the addition of MoS2 additive. Perhaps, the slight
increment can lead to a more dispersed/aggregated system, but nothing has been
observed.
Based ambient temperature experiments and model analysis, one can therefore conclude
that 0.1g additive gives the best improvement on fluid rheological properties at ambient
temperature.
For all fluid the tribological analysis was conducted at three different temperatures (20,
55, 70°C). A linear increase of friction was expected and satisfied based on work of
Kårstad et al. [29]

Development of an improved nanoparticle-modified water based drilling fluid
MSc Thesis, Stanislaw Wrobel 116
As MoS2 reduces friction at all temperatures and for all concentration by at least 22%
and maximum 53%. Hence, we can conclude that it increases the lubricity of the
developed water based drilling fluid. The most optimal addition for MoS2 was 0.2g
considered at elevated temperatures, as it yielded the highest reduction in friction
coefficient relative to the reference fluid system.
The measure of viscoelastic properties allow for the evaluation of gel strength of
drilling fluids. Since MoS2 showed great effect on rheology and friction it has been
selected for an amplitude sweep analysis. The only other fluid investigated is with
graphene additive discussed later. To classify viscoelastic behavior of fluids one can
either look for the yield point or the flow point. In this thesis we use the flow point to
evaluate and compare fluid viscoelasticity. As discussed in the results, the energy
absorbed is doubled for the additive treated fluids including MoS2. That means the
addition of MoS2 nanoparticles strengthens the gel structure, which enhances the fluids
ability to keep cuttings in suspension when fluid circulation is paused. In other words,
the fluid system is better dispersed and has improved stability. [39]
Development of an improved nanoparticle-modified water based drilling fluid
MSc Thesis, Stanislaw Wrobel 117
7.2 Effect of Titanium Oxide (TiO2 ) nanoparticles
Rheological measurements show that adding TiO2 barely affects the Bingham
properties.
The rheological Power law model indicates that the flow behavior indexes and
consistency indexes are positively affected by 0.4g added TiO2 nanoadditive, by
increasesing k from 0.47 to 0.90 and decreasing n 0.53 to 0.44. That indicates increased
viscosity for that fluid system. The other samples display reduced k and slightly
increased n values, hence the slightly reduced viscosity.
Filtrate loss is either unchanged or increased for these low concentrations. Perhaps
increasing the concentration of TiO2 beyond what is done in this thesis might create a
more flocculated system.
The pH value is unaffected by the addition of TiO2 additive.
The tribology measurements do not vary as much for TiO2 as it did for MoS2. The
friction coefficient change is between being at the most reduced by 11% or increased by
21%, representing a narrow change for difference concentrations and temperatures.
Unlike for the rheology evaluation, the lowest concentration improves the lubricity the
most. Making difficult to find an optimum concentration for an overall enhancement for
a water based drilling fluid system.

Development of an improved nanoparticle-modified water based drilling fluid
MSc Thesis, Stanislaw Wrobel 118
7.3 Effect of Graphene nanoparticles
Based on the rheology measurements, the Bingham PV and YS show that the fluids are
little affected by the addition of nanosized graphene particles. Whether the addition
flocculates or deflocculates the system is also unclear, because the addition of 0.3g
graphene yields maximum viscosity and gel while the addition of 0.4g generates the
minimum of both attributes.
The Power Law indexes display similar tendencies, where 0.3g additive slightly reduces
n and increases k, while the fluid with 0.4g additive generates the opposite.
Filtrate loss is increased for all tested samples, by 0.9 to 1.5mL, except for one sample.
Perhaps the most interesting find is that the best filter-cake next to the reference fluid is
the one with 0.3g additive. Rarely an additive can increase viscosity, while keeping the
filter-cake quality almost the same.
The pH value completely unaffected by the addition of graphene particles.
Graphene is interesting in terms of being a good lubricity agent. The friction coefficient
is reduced at all temperatures and for all concentration by at least 8% and maximum
56%. The highest lubricity gain is for 0.1g added nanoparticles. Perhaps when intending
to increase viscosity and lubricity of a fluid at the same time, the fluid with 0.3g
graphene additive seems to satisfy both wishes.
The flow point from the amplitude sweep measurement for graphene added fluids show
very different results compared to molybdenum disulfide. The addition of 0.1g graphene
slightly increases the flow point, while adding 0.3g reduces the shear stress absorbed to
reach the flow point by almost ca 60%. Therefore, 0.3g additive reduces the elastic
property (gel) and makes the fluid system more easily viscous than elastic.
Development of an improved nanoparticle-modified water based drilling fluid
MSc Thesis, Stanislaw Wrobel 119
7.4 Effect of Titanium Nitride (TiN) nanoparticles
Based on the rheology measurements, the Bingham and Power law Rheology Model it
seems that TiN has almost no effect at all on rheological properties.
Interestingly, the filtrate loss is slightly reduced for all added amounts of TiN, with the
exception of 0.2g added particles, which has the same 6.5mL filtrate loss as the base
fluid. The amount for the other fluids is not more reduced than 0.5mL in the 7.5min
filtration test, meaning only a minor filter-cake improvement.
The pH is decreased to from 6.5 in the base fluid to 6.0 in the other fluid samples. Fluid
2 is the only fluid resembling the reference fluid, as it was for the filtrate test.
TiN seems to be a bad lubricity agent, since the friction coefficient is increased, ranging
from +13% to +23%, for all concentrations at 22°C and 55°C. At 70°C a slightly
lubricating effect can be observed, thought it is below 7% for all fluids. The addition of
0.3g never displays increased lubricity.
Overall TiN in our PAC water based fluid system does not seem to show improvements
of significance at these low concentrations.
Development of an improved nanoparticle-modified water based drilling fluid
MSc Thesis, Stanislaw Wrobel 120
7.5 Simulation results
7.5.1 Hydraulic Simulation
Hydraulic simulations of drilling fluids are necessary for drilling operations. They yield
important information about fluid behavior for cutting transport efficiency and ECD
management. The Unified rheology model was selected to be used for these calculations
as it gives a very low error rate and based the evualtion of Jeyhun [24]
Simulation shows that the 0.4g graphene-modified fluid yields a 21% reduction in pump
pressure loss at 450 gpm, while 0.3g modification increases the pump pressure loss by
9%.
0.1g modified MoS2 system has greatly increased pump pressure loss and ECD for rates
below 450gpm. Simulation displays a 77% ECD and increased pump loss at 200gpm.
None of the other developed fluid systems show a significant effect ECD or pump
pressure loss at any flow rate.
7.5.2 Cuttings transport Simulation
Wellplan simulation software was applied to investigate the cutting transport quality of
nano-modified drilling fluids. The fluids were selected based on their enhanced
lubricity. The simulation well had an inclination where cuttings would accumulate,
leading to a build up of bed height. The analysis the drillings fluids affect on bed height
at the 450gpm, which is a typical circulation rate.
The results show that the addition of MoS2 nanoparticles for the considered flow rate
reduced the cutting bed height from 3.8in to 2.2in, about 42%. This is due to the impact
of nano-additive on the rheology property of the drilling fluid.
On the contrary, the 0.1 gram graphene nano-additive does not have impact on borehole
cleaning. That is because the 0.1g additive had no significant affect on rheological
properties either.

Development of an improved nanoparticle-modified water based drilling fluid
MSc Thesis, Stanislaw Wrobel 121
7.5.3 Torque and Drag Simulation
Torque and Drag simulations in Wellplan provide necessary information about the well
parameters to optimize the design of drilling fluid and drillstring. It calculates the limits
to drilling, allowing to see how far one can drill. One can use this information to
optimize well positioning for optimized drainage of a reservoir. The length of a well is
usually limited by either torque or drag. Torque and drag are friction dependent entities.
Since he application of nano-additives in water based drilling fluids can vastly increase
lubricity, T&D simulations were conducted. Nano-additives with their concentration
yielding the highest percentage reduction in coefficient of friction have been selected to
be applied in the simulation studies for T&D.
In the simulation, the reference fluid system allowed the maximum length of 9900ft,
while the addition of 0.4g MoS2 into the reference fluid increased the maximum drilling
length by 26.3%, to 12500ft.
In the simulation for the XG-reference fluid system, the reference drilling system yields
high lubricity to begin with. It allowed a drilling length of 13000ft. Although, the
coefficient of friction for the graphene modified fluid system is 34.5% lower, the
addition of 0.1g nanosized graphene increased the maximum drilling length only by
7.7% to 14000ft.

Development of an improved nanoparticle-modified water based drilling fluid
MSc Thesis, Stanislaw Wrobel 122
8 Conclusion
The objective of this thesis work was to test different nano-additives in conventional
water based drilling fluid systems, and find out whether drilling fluid performance could
be enhanced. The best fluids were selected based on rheology and friction parameters
and have been tested in different models and simulations to give a better understanding
of the impact nano-additives have on the overall drilling operation.
Rheological experiments can conclude that addition of 0.1 g MoS2 per 500 ml at
ambient temperature, improved the Bingham Yield Strength (YS) of the drilling fluid by
183 % relative to the reference fluid, while addition of Graphene, TiO2 and TiN did not
have a significant impact on the fluid rheological properties.
Viscoelastic experiments show up to 100% increased storage and loss modulus for
MoS2 nano-modified drilling fluid compared to nano-free fluid, which indicates
improved stability and a more dispersed fluid.
WellPlanTM and Unified hydraulic model simulations were carried out. Cuttings
transportation, total pressure drop across the well and ECD effects have been simulated
to evaluate the performance of nano-treated systems relative to the nano-free reference
systems. Simulations together with experiments in this thesis can conclude that effects
given by nanoparticles are;
Increased lubricity of drilling fluid by MoS2 and Graphene additives yielded up
to 26.3% extended drilling reach.
Improved borehole cleaning capacity by decreasing bed height due to reduced
flow behaviour index for 0.4g added MoS2 per 500mL drilling fluid.
That MoS2 additive could impact pumping ECD, potential increasing or
reducing the annular pressure compared to the reference system.
Improved hydraulic properties by decreasing pressure loss and ECD for 0.1g and
0.4g Graphene nano-additive per 500mL drilling fluid.
The results evaluating the impact of nanoparticles on filtrate loss were inconclusive,
suggesting that further analysis is required to evaluate the effect on filter-cake quality.
Development of an improved nanoparticle-modified water based drilling fluid
MSc Thesis, Stanislaw Wrobel 123
9 References
[1] S. Azar.J.J., Drilling Engineering”. PennWell Corporation. Tulsa, Oklahoma,
2007.]..
[2] J. Cook, “Stabilizing the Wellbore to Prevent Lost Circulation”. Oilfield Review
Winter 2011/2012: 23, no. 4., 2011.
[3] G. Stjern, Local rock mechanical knowledge proves drilling performance in
fractured formations at the Heidrun field." Journal of Petroleum Science and
Engineering 38(3-4): 83-96, 2003..
[4] Wang, Dr. Wei-Min Liu and Dr. Xiao-Bo, Nanoparticle-based lubricant additives.
Springer-Verlag Berlin Heidelberg 2012, 10, 2 April 2012.], 2012.
[5] H. R. Samuel, Friction factors: What are they for torque, drag, vibration, bottom
hole assembly and transient surge/swab analyses? IADC/SPE 128059, 11:11, 2010.
[6] Kutty, Kulliyev , Well Performance Improvement Using Complex Nano Fluids
SPE-177831-MS CESI chemical, Flotek company, SPE, 2015.
[7] Norazly Mohd Taha and Sean Lee,, Nano graphene application improving drilling
fluid performance IPTC-18539-MS, Scomi KMC, 2015.
[8] J. Messenger, “Lost Circulation”, Pennwell Publishing Company. Tulsa,
Oklahoma, 1981, ISBN: 978-0878141753, 1981.
[9] A. Kristensen, “Flow properties of water-based drilling fluids”. Norwegian
University of Science and Technology, 2013.
[10] M. X. Zhen Xiuhua, Drilling Fluids School of Engineering and Technology China
University of Geosciences (Beijing) 29 Xueyuan Road Beijing, 100083 P.R.China.

Development of an improved nanoparticle-modified water based drilling fluid
MSc Thesis, Stanislaw Wrobel 124
[11] Caenn, R., , Darley, H.C.H. and Gray. G, “Composition and Properties of drilling
and Completion Fluids”, 6th edition 2012.]., 2012.
[12] F. Outubuddin, Outubuddin and Fu 2002, Ray and Okamoto 2003.
[13] MiSwaco, Drilling Fluids Engineering Manual, Polymer chemistry and
Applications”. Chapter 6, 1998, 1198.
[14] K. B. Adel Benchabane, “Rheological properties of carboxymethyl cellulose
(CMC) solutions”. Colloid Polym Sci, 2008. DOI: 10.1007/s00396-008-1882-2]..
[15] Khaled. and Abdelbaki., Rheological and electrokinetic properties of
carboxymethylcellulose-water dispersions in the presence of salts”. International
Journal of Physical Sciences Vol. 7(11). DOI: 10.5897/IJPS11.1779. 9 March,
2012.]..
[16] M. Economides, L. Watters and S. Dunn-Norman, “Petroleum Well Construction”,
1998 ISBN 0-471-96938-9.].
[17] C. M. O'Brien D.E., Stabilizing Sensitive Shales with Inhibited Potassium-Based
Drilling Fluids," Journal of Petroleum Technology 25, no. 9 (September 1973):
1089-1100.]..
[18] G. Kolle and R. Mesel,, Brønnvæsker: for VK1 brønnteknikk, Vett & Viten,, 1998.
[19] Okafor, M.N. and J.F. Evers, Experimental Comparison of Rheology Models for
Drilling fluids SPE-24086-MS, 1992.
[20] S. Strand, Øvinger i bore- og brønnvæsker, Høgskolen i Stavanger, Stavanger.
1998.
[21] M. Ochoa, Analysis of Drilling Fluid Rheology and Tool Joint Effect to Reduce
Errors in Hydraulics Calculations, [PhD Thesis], Texas A&M University, p.99,
2006.
Development of an improved nanoparticle-modified water based drilling fluid
MSc Thesis, Stanislaw Wrobel 125
[22] O. Skjeggestad, Boreslamteknologi: teori og praksis, Bergen: Alma Mater forlag.,
1989.
[23] API RP 13-B1, Recommend Practice for Field Testing Water-Based Drilling
Fluids, third edition. 2003. Washington, DC: API..
[24] J. Sadigov, Comparisons of rheology and hydraulics prediction of mud systems in
concentric and eccentric well geometry / MSc thesis, UiS, 2013.
[25] Binh, B. , Saasen, A. and Maxey, J. et al., Viscoelastic Properties of Oil-Based
Drilling Fluids” Annual Transactions of the Nordic Rheology Society. Vol 20.,
2012.
[26] T. Mezger, The Rheology Handbook. Hanover: European, 2011.
[27] N. Robertson, Effective Torque Management of Wytch Farm Extended-Reach
Sidetrack Wells SPE-95430-MS, 2005.
[28] P. Z. M. Scott, Scott, P.D., Zamora, M // Barite-Sag Management: Challenges,
Strategies, Opportunities //SPE-87136-MS IADC/SPE Drilling Conference, 2-4
March, Dallas, Texas 2004.
[29] Eirik Kårstad, Bernt S. Adnøy and T. Fjelde, A study of temperature dependent
friction in wellbore fluids// SPE/IADC drilling conference and exhibition held in
Amsterdam , The Netherlands, 17-19 March 2009, 2009.
[30] "nanoshell," 2016. [Online]. Available:
https://www.nanoshel.com/product/degussa-p25-TiO2/.
[31] http://www.nanoshel.com/wp-content/uploads/2014/03/Titanium-Oxide-SEM.jpg,
2016.
[32] Wikipedia, https://en.wikipedia.org/wiki/Graphene ; Illustration of graphene lattice,
Wikipedia, 2016.

Development of an improved nanoparticle-modified water based drilling fluid
MSc Thesis, Stanislaw Wrobel 126
[33] us-nano, http://s.b5z.net/i/u/10091461/i/US1059-SEM-Graphene_Nanoplatelets.jpg
http://www.us-nano.com/inc/sdetail/28009, 2016.
[34] us-nano, http://www.us-nano.com/inc/sdetail/201), 2016.
[35] A. Bourgoyne, M. K. Jr., M. Chenevert and F. Young J, , “Applied Drilling
Engineering”, SPE Textbook Series Vol. 2, 1991. Richardson, Texas (ISBN: 978-
1-55563-001-0)., 1991.
[36] Nazari, Hareland and Azar, ,“Review of Cuttings Transport in Directional Well
Drilling: Systematic Approach”, SPE 132372, SPE Western Regional Meeting, 27-
29 May 2010, Anaheim, California, U.S.A., 2010.
[37] H. WellPlan (Landmark)TM Software, WellPlan (Landmark)TM Software,
Halliburton., 2016.
[38] M. &. M. R. Walker, Sakhalin-1: Technologies to Efficiently Drill and Develop
Resources While Expanding the ERD Envelope. Moscow, World Petroleum
Congress, p. 4., 2014.
[39] T. G. Mezger., “The Rheology Handbook”, 2002. ISBN 3-87870-745-2..

Development of an improved nanoparticle-modified water based drilling fluid
MSc Thesis, Stanislaw Wrobel 127
10 Appendix – A - Rheology Models with %-deviation
10.1 MoS2
10.1.1.1 Reference Fluid – +0.0g MoS2
Table 5 Description of rheological models with MoS2-reference fluid output parameters and %-deviation
Parameters
Model Equation τo,τy, A k, C n, B μp, μ %-Deviate cP
Herschel Bulkley
0.0733*0.92310+2.347 3,4226 0,1234 0,7090
2,04
Unified 2.347+0.0731*0.9235 3,2010 0,2144 0,6223 3,10
Power Law 0.9594*0.5227 2,1289 0,2966 9,47
Bingham 0.0417*+3.307 4,6456 0,0160 10,75 7,6608
Newtonian 0.0464* 0,0226 50,34 10,8209
Robertson and Stiff
0.1078*(35.5807+)0.8673 0,3775 55,6794 0,5666
2,67
0
5
10
15
20
25
30
0 200 400 600 800 1000 1200
She
ar S
tre
ss [
lbf/
10
0sq
ft]
Shear Rate [s^-1]
Ref
Measurement Herschel Buckley Robertston & Stiff
Power law Bingham plastic Newtonian

Development of an improved nanoparticle-modified water based drilling fluid
MSc Thesis, Stanislaw Wrobel 128
10.1.1.2 Reference Fluid +0.1g MoS2
Table 6 Description of rheological models with MoS2-reference fluid output parameters and %-deviation
Parameters
Model Equation τo,τy, A k, C n, B μp, μ %-Deviate cP
Herschel Bulkley
0.0733*0.92310+2.347 4,882 0,7311 0,51190 3,90
Unified 2.347+0.0731*0.9235 5,335 0,4978 0,5704 5,17
Power Law 0.9594*0.5227 3,9718 0,2778 2,14
Bingham 0.0417*+3.307 9,700 0,0204 23,59 9,76752
Newtonian 0.0464* 0,0342 57,83 16,375
Robertson and Stiff
0.1078*(35.5807+)0.8673 2,4369 11,6903 0,3557 2,50
0
5
10
15
20
25
30
35
40
0 200 400 600 800 1000 1200
She
ar S
tre
ss [
lbf/
10
0sq
ft]
Shear Rate [s^-1]
Ref+0.1g MoS2
70/30 OBM measured (T=72oF) Herschel Buckley
Robertston & Stiff Power law
Bingham plastic Newtonian
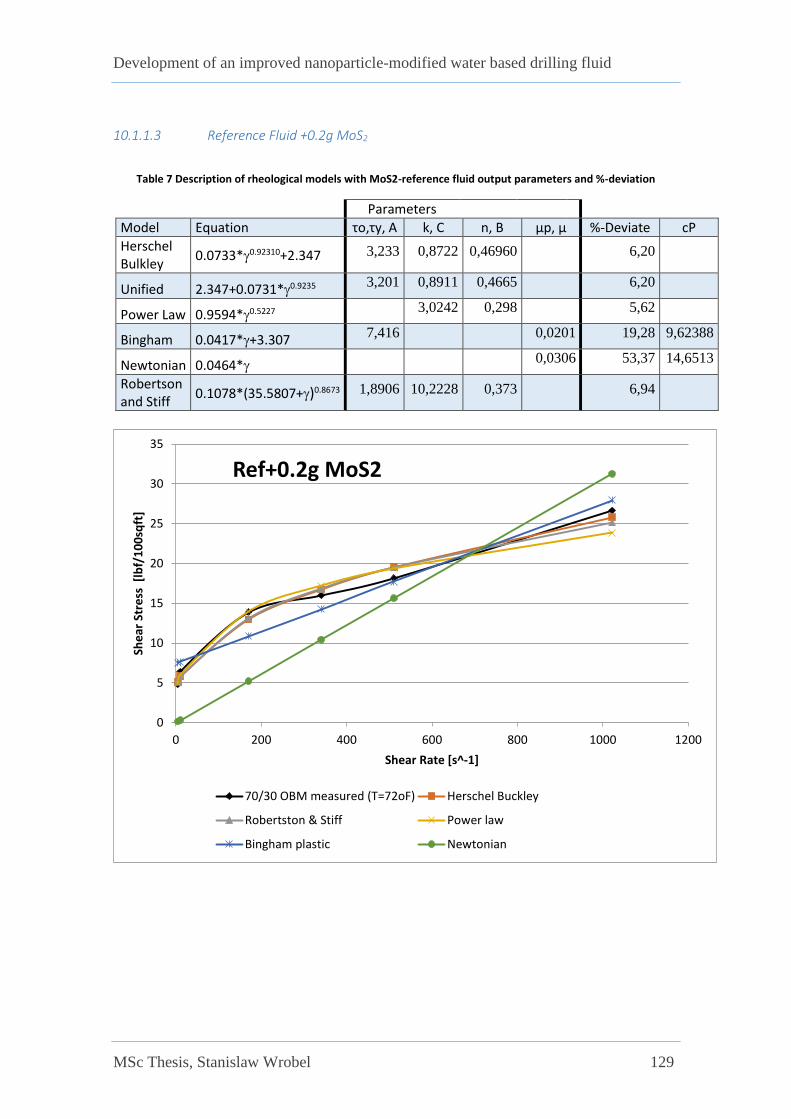
Development of an improved nanoparticle-modified water based drilling fluid
MSc Thesis, Stanislaw Wrobel 129
10.1.1.3 Reference Fluid +0.2g MoS2
Table 7 Description of rheological models with MoS2-reference fluid output parameters and %-deviation
Parameters
Model Equation τo,τy, A k, C n, B μp, μ %-Deviate cP
Herschel Bulkley
0.0733*0.92310+2.347 3,233 0,8722 0,46960
6,20
Unified 2.347+0.0731*0.9235 3,201 0,8911 0,4665
6,20
Power Law 0.9594*0.5227 3,0242 0,298
5,62
Bingham 0.0417*+3.307 7,416
0,0201 19,28 9,62388
Newtonian 0.0464* 0,0306 53,37 14,6513
Robertson and Stiff
0.1078*(35.5807+)0.8673 1,8906 10,2228 0,373
6,94
0
5
10
15
20
25
30
35
0 200 400 600 800 1000 1200
She
ar S
tre
ss [
lbf/
10
0sq
ft]
Shear Rate [s^-1]
Ref+0.2g MoS2
70/30 OBM measured (T=72oF) Herschel Buckley
Robertston & Stiff Power law
Bingham plastic Newtonian

Development of an improved nanoparticle-modified water based drilling fluid
MSc Thesis, Stanislaw Wrobel 130
10.1.1.4 Reference Fluid +0.3g MoS2
Table 8 Description of rheological models with MoS2-reference fluid output parameters and %-deviation
Parameters
Model Equation τo,τy, A k, C n, B μp, μ %-Deviate cP
Herschel Bulkley
0.0733*0.92310+2.347 3,189 0,2126 0,65100
2,60
Unified 2.347+0.0731*0.9235 3,201 0,2077 0,6547
2,70
Power Law 0.9594*0.5227 2,0693 0,321
6,19
Bingham 0.0417*+3.307 5,343
0,0171 19,57 8,18748
Newtonian 0.0464* 0,0247 52,98 11,8264
Robertson and Stiff
0.1078*(35.5807+)0.8673 0,7697 23,7813 0,4778
1,17
0
5
10
15
20
25
30
0 200 400 600 800 1000 1200
She
ar S
tre
ss [
lbf/
10
0sq
ft]
Shear Rate [s^-1]
Ref+0.3g MoS2
70/30 OBM measured (T=72oF) Herschel Buckley
Robertston & Stiff Power law
Bingham plastic Newtonian

Development of an improved nanoparticle-modified water based drilling fluid
MSc Thesis, Stanislaw Wrobel 131
10.1.1.5 Reference Fluid +0.4g MoS2
Table 9 Description of rheological models with MoS2-reference fluid output parameters and %-deviation
Parameters
Model Equation τo,τy, A k, C n, B μp, μ %-Deviate cP
Herschel Bulkley
0.0733*0.92310+2.347 4,009 0,395 0,55800
3,92
Unified 2.347+0.0731*0.9235 3,735 0,5381 0,5111
3,87
Power Law 0.9594*0.5227 2,9928 0,2754
6,87
Bingham 0.0417*+3.307 6,508
0,0176 13,98 8,42688
Newtonian 0.0464* 0,0268 52,84 12,8318
Robertson and Stiff
0.1078*(35.5807+)0.8673 1,2375 25,0756 0,4153
4,78
0
5
10
15
20
25
30
0 200 400 600 800 1000 1200
She
ar S
tre
ss [
lbf/
10
0sq
ft]
Shear Rate [s^-1]
Ref+0.4g MoS2
70/30 OBM measured (T=72oF) Herschel Buckley
Robertston & Stiff Power law
Bingham plastic Newtonian

Development of an improved nanoparticle-modified water based drilling fluid
MSc Thesis, Stanislaw Wrobel 132
10.2 TiO2
10.2.1.1 Reference Fluid
Table 10 Description of rheological models with MoS2-reference fluid output parameters and %-deviation
Parameters
Model Equation τo,τy, A k, C n, B μp, μ %-Deviate cP
Herschel Bulkley
0.0733*0.92310+2.347 2,790 0,1642 0,6704
2,46
Unified 2.347+0.0731*0.9235 2,668 0,2156 0,6278
1,71
Power Law 0.9594*0.5227 1,7656 0,3244
6,87
Bingham 0.0417*+3.307 4,459
0,0155 17,11 7,4214
Newtonian 0.0464* 0,0218 51,73 10,4378
Robertson and Stiff
0.1078*(35.5807+)0.8673 0,5188 31,145 0,5177
2,10
0
5
10
15
20
25
0 200 400 600 800 1000 1200
She
ar S
tre
ss [
lbf/
10
0sq
ft]
Shear Rate [s^-1]
Ref
Measurement Herschel Buckley Robertston & Stiff
Power law Bingham plastic Newtonian

Development of an improved nanoparticle-modified water based drilling fluid
MSc Thesis, Stanislaw Wrobel 133
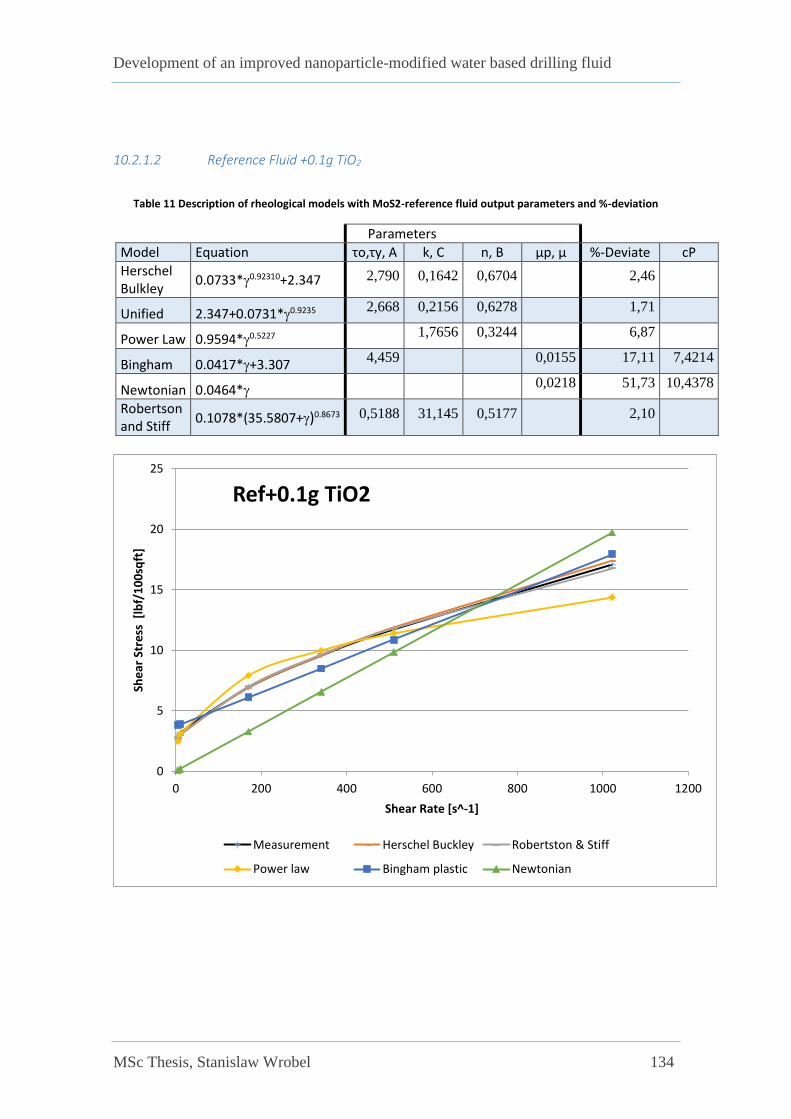
Development of an improved nanoparticle-modified water based drilling fluid
MSc Thesis, Stanislaw Wrobel 134
10.2.1.2 Reference Fluid +0.1g TiO2
Table 11 Description of rheological models with MoS2-reference fluid output parameters and %-deviation
Parameters
Model Equation τo,τy, A k, C n, B μp, μ %-Deviate cP
Herschel Bulkley
0.0733*0.92310+2.347 2,790 0,1642 0,6704
2,46
Unified 2.347+0.0731*0.9235 2,668 0,2156 0,6278
1,71
Power Law 0.9594*0.5227 1,7656 0,3244
6,87
Bingham 0.0417*+3.307 4,459
0,0155 17,11 7,4214
Newtonian 0.0464* 0,0218 51,73 10,4378
Robertson and Stiff
0.1078*(35.5807+)0.8673 0,5188 31,145 0,5177
2,10
0
5
10
15
20
25
0 200 400 600 800 1000 1200
She
ar S
tre
ss [
lbf/
10
0sq
ft]
Shear Rate [s^-1]
Ref+0.1g TiO2
Measurement Herschel Buckley Robertston & Stiff
Power law Bingham plastic Newtonian
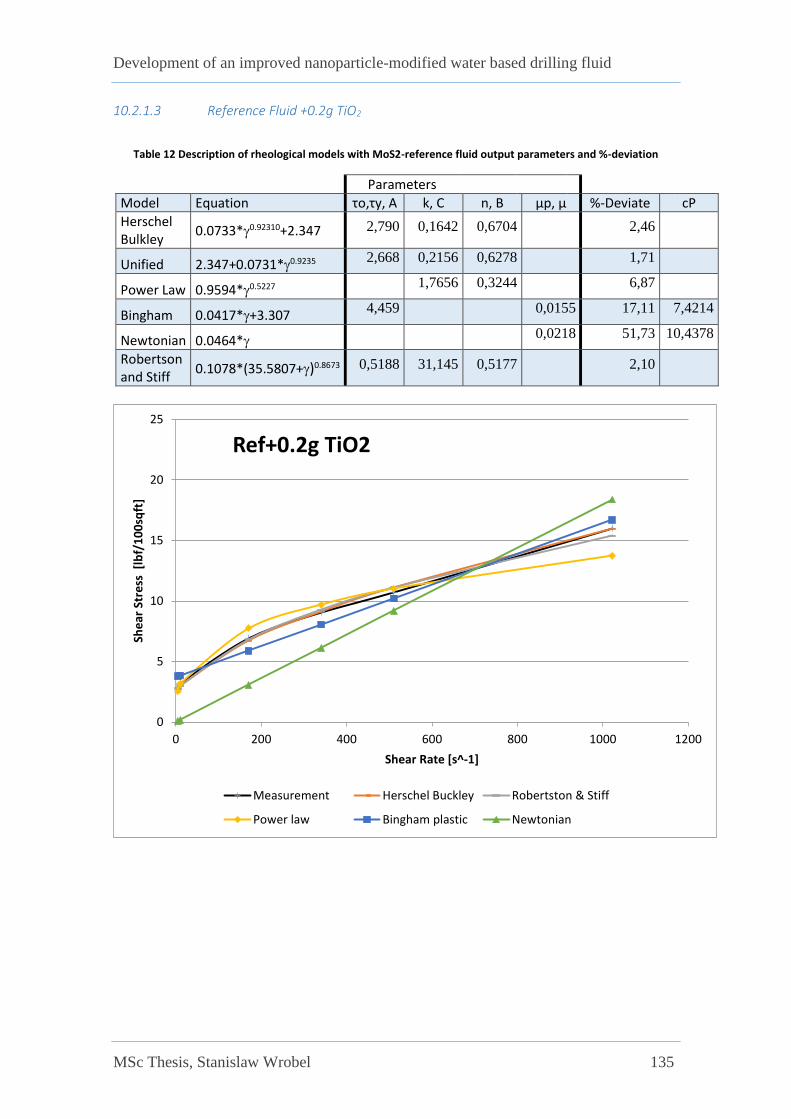
Development of an improved nanoparticle-modified water based drilling fluid
MSc Thesis, Stanislaw Wrobel 135
10.2.1.3 Reference Fluid +0.2g TiO2
Table 12 Description of rheological models with MoS2-reference fluid output parameters and %-deviation
Parameters
Model Equation τo,τy, A k, C n, B μp, μ %-Deviate cP
Herschel Bulkley
0.0733*0.92310+2.347 2,790 0,1642 0,6704
2,46
Unified 2.347+0.0731*0.9235 2,668 0,2156 0,6278
1,71
Power Law 0.9594*0.5227 1,7656 0,3244
6,87
Bingham 0.0417*+3.307 4,459
0,0155 17,11 7,4214
Newtonian 0.0464* 0,0218 51,73 10,4378
Robertson and Stiff
0.1078*(35.5807+)0.8673 0,5188 31,145 0,5177
2,10
0
5
10
15
20
25
0 200 400 600 800 1000 1200
She
ar S
tre
ss [
lbf/
10
0sq
ft]
Shear Rate [s^-1]
Ref+0.2g TiO2
Measurement Herschel Buckley Robertston & Stiff
Power law Bingham plastic Newtonian
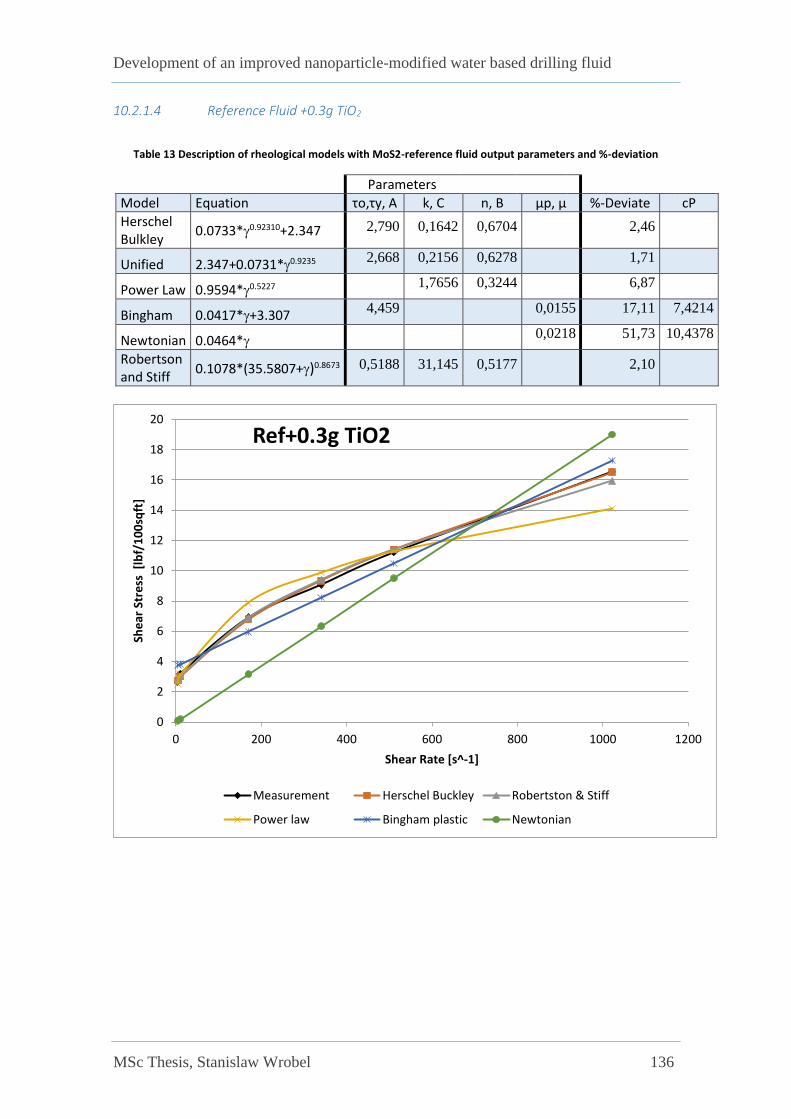
Development of an improved nanoparticle-modified water based drilling fluid
MSc Thesis, Stanislaw Wrobel 136
10.2.1.4 Reference Fluid +0.3g TiO2
Table 13 Description of rheological models with MoS2-reference fluid output parameters and %-deviation
Parameters
Model Equation τo,τy, A k, C n, B μp, μ %-Deviate cP
Herschel Bulkley
0.0733*0.92310+2.347 2,790 0,1642 0,6704
2,46
Unified 2.347+0.0731*0.9235 2,668 0,2156 0,6278
1,71
Power Law 0.9594*0.5227 1,7656 0,3244
6,87
Bingham 0.0417*+3.307 4,459
0,0155 17,11 7,4214
Newtonian 0.0464* 0,0218 51,73 10,4378
Robertson and Stiff
0.1078*(35.5807+)0.8673 0,5188 31,145 0,5177
2,10
0
2
4
6
8
10
12
14
16
18
20
0 200 400 600 800 1000 1200
She
ar S
tre
ss [
lbf/
10
0sq
ft]
Shear Rate [s^-1]
Ref+0.3g TiO2
Measurement Herschel Buckley Robertston & Stiff
Power law Bingham plastic Newtonian

Development of an improved nanoparticle-modified water based drilling fluid
MSc Thesis, Stanislaw Wrobel 137
10.2.1.5 Reference Fluid +0.4g TiO2
Table 14 Description of rheological models with MoS2-reference fluid output parameters and %-deviation
Parameters
Model Equation τo,τy, A k, C n, B μp, μ %-Deviate cP
Herschel Bulkley
0.0733*0.92310+2.347 2,790 0,1642 0,6704
2,46
Unified 2.347+0.0731*0.9235 2,668 0,2156 0,6278
1,71
Power Law 0.9594*0.5227 1,7656 0,3244
6,87
Bingham 0.0417*+3.307 4,459
0,0155 17,11 7,4214
Newtonian 0.0464* 0,0218 51,73 10,4378
Robertson and Stiff
0.1078*(35.5807+)0.8673 0,5188 31,145 0,5177
2,10
0
5
10
15
20
25
30
0 200 400 600 800 1000 1200
She
ar S
tre
ss [
lbf/
10
0sq
ft]
Shear Rate [s^-1]
Ref+0.4g TiO2
Measurement Herschel Buckley Robertston & Stiff
Power law Bingham plastic Newtonian
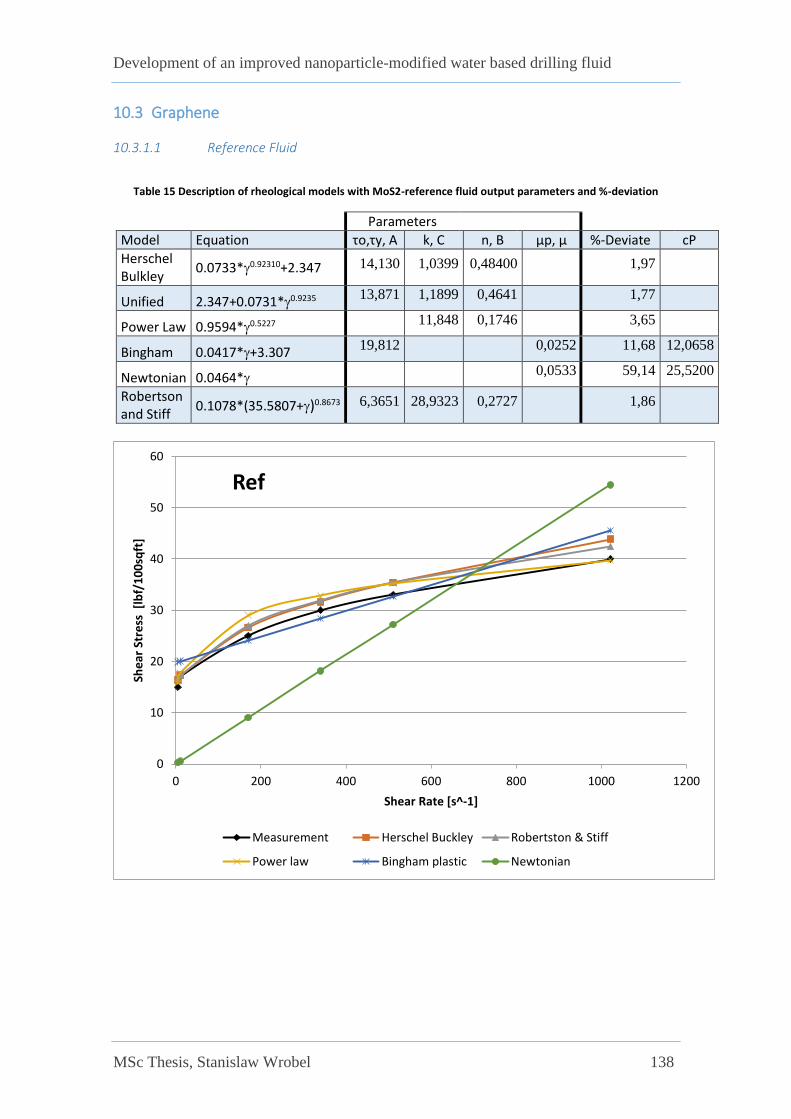
Development of an improved nanoparticle-modified water based drilling fluid
MSc Thesis, Stanislaw Wrobel 138
10.3 Graphene
10.3.1.1 Reference Fluid
Table 15 Description of rheological models with MoS2-reference fluid output parameters and %-deviation
Parameters
Model Equation τo,τy, A k, C n, B μp, μ %-Deviate cP
Herschel Bulkley
0.0733*0.92310+2.347 14,130 1,0399 0,48400
1,97
Unified 2.347+0.0731*0.9235 13,871 1,1899 0,4641
1,77
Power Law 0.9594*0.5227 11,848 0,1746
3,65
Bingham 0.0417*+3.307 19,812
0,0252 11,68 12,0658
Newtonian 0.0464* 0,0533 59,14 25,5200
Robertson and Stiff
0.1078*(35.5807+)0.8673 6,3651 28,9323 0,2727
1,86
0
10
20
30
40
50
60
0 200 400 600 800 1000 1200
She
ar S
tre
ss [
lbf/
10
0sq
ft]
Shear Rate [s^-1]
Ref
Measurement Herschel Buckley Robertston & Stiff
Power law Bingham plastic Newtonian
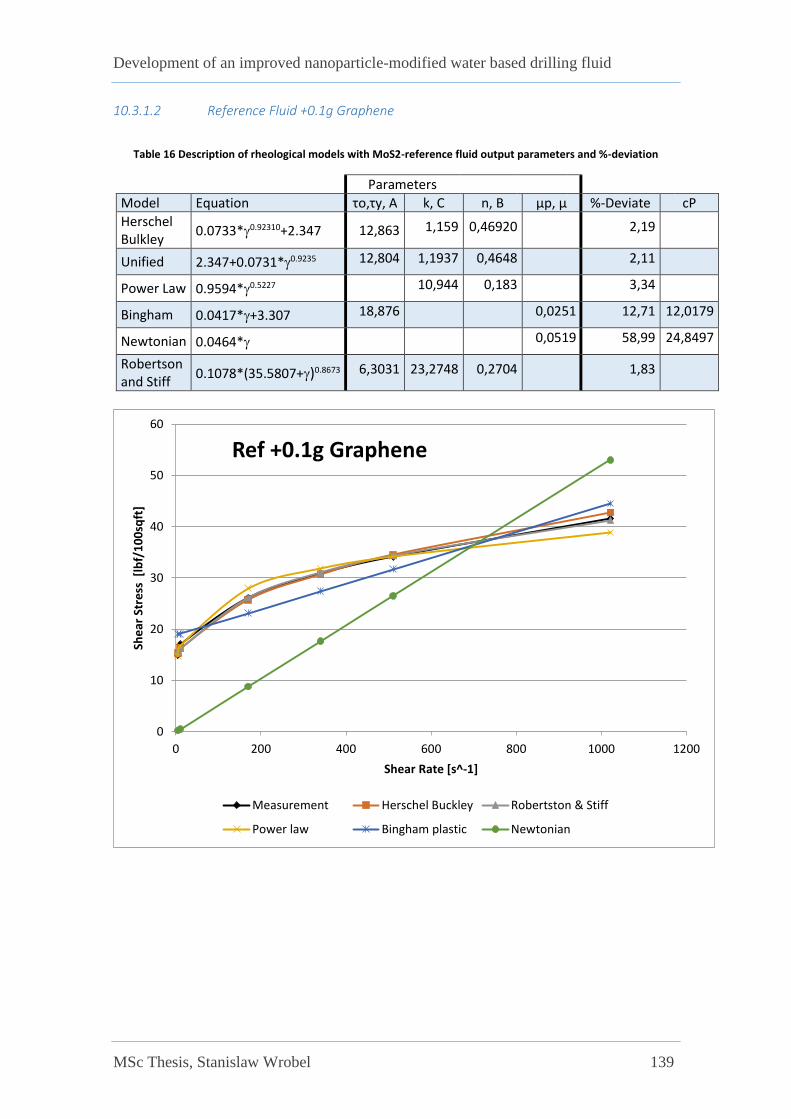
Development of an improved nanoparticle-modified water based drilling fluid
MSc Thesis, Stanislaw Wrobel 139
10.3.1.2 Reference Fluid +0.1g Graphene
Table 16 Description of rheological models with MoS2-reference fluid output parameters and %-deviation
Parameters
Model Equation τo,τy, A k, C n, B μp, μ %-Deviate cP
Herschel Bulkley
0.0733*0.92310+2.347 12,863 1,159 0,46920
2,19
Unified 2.347+0.0731*0.9235 12,804 1,1937 0,4648
2,11
Power Law 0.9594*0.5227
10,944 0,183
3,34
Bingham 0.0417*+3.307 18,876
0,0251 12,71 12,0179
Newtonian 0.0464*
0,0519 58,99 24,8497
Robertson and Stiff
0.1078*(35.5807+)0.8673 6,3031 23,2748 0,2704
1,83
0
10
20
30
40
50
60
0 200 400 600 800 1000 1200
She
ar S
tre
ss [
lbf/
10
0sq
ft]
Shear Rate [s^-1]
Ref +0.1g Graphene
Measurement Herschel Buckley Robertston & Stiff
Power law Bingham plastic Newtonian
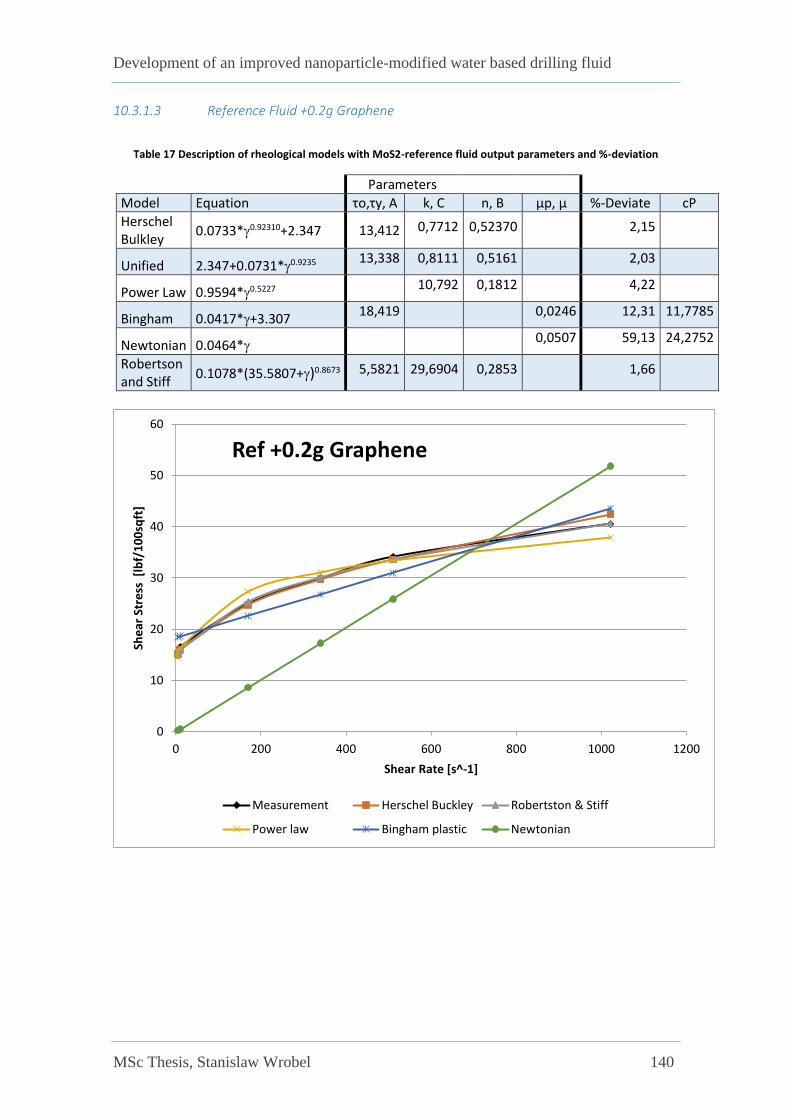
Development of an improved nanoparticle-modified water based drilling fluid
MSc Thesis, Stanislaw Wrobel 140
10.3.1.3 Reference Fluid +0.2g Graphene
Table 17 Description of rheological models with MoS2-reference fluid output parameters and %-deviation
Parameters
Model Equation τo,τy, A k, C n, B μp, μ %-Deviate cP
Herschel Bulkley
0.0733*0.92310+2.347 13,412 0,7712 0,52370 2,15
Unified 2.347+0.0731*0.9235 13,338 0,8111 0,5161 2,03
Power Law 0.9594*0.5227 10,792 0,1812 4,22
Bingham 0.0417*+3.307 18,419 0,0246 12,31 11,7785
Newtonian 0.0464* 0,0507 59,13 24,2752
Robertson and Stiff
0.1078*(35.5807+)0.8673 5,5821 29,6904 0,2853 1,66
0
10
20
30
40
50
60
0 200 400 600 800 1000 1200
She
ar S
tre
ss [
lbf/
10
0sq
ft]
Shear Rate [s^-1]
Ref +0.2g Graphene
Measurement Herschel Buckley Robertston & Stiff
Power law Bingham plastic Newtonian
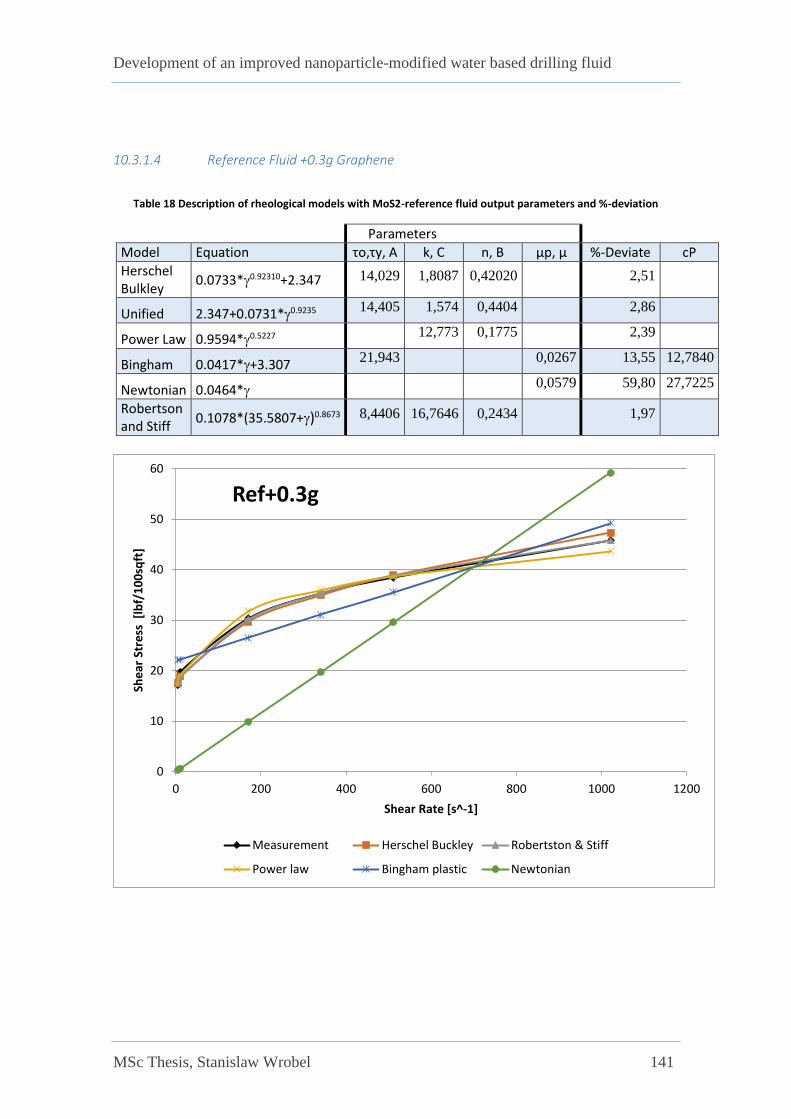
Development of an improved nanoparticle-modified water based drilling fluid
MSc Thesis, Stanislaw Wrobel 141
10.3.1.4 Reference Fluid +0.3g Graphene
Table 18 Description of rheological models with MoS2-reference fluid output parameters and %-deviation
Parameters
Model Equation τo,τy, A k, C n, B μp, μ %-Deviate cP
Herschel Bulkley
0.0733*0.92310+2.347 14,029 1,8087 0,42020
2,51
Unified 2.347+0.0731*0.9235 14,405 1,574 0,4404
2,86
Power Law 0.9594*0.5227 12,773 0,1775
2,39
Bingham 0.0417*+3.307 21,943
0,0267 13,55 12,7840
Newtonian 0.0464* 0,0579 59,80 27,7225
Robertson and Stiff
0.1078*(35.5807+)0.8673 8,4406 16,7646 0,2434
1,97
0
10
20
30
40
50
60
0 200 400 600 800 1000 1200
She
ar S
tre
ss [
lbf/
10
0sq
ft]
Shear Rate [s^-1]
Ref+0.3g
Measurement Herschel Buckley Robertston & Stiff
Power law Bingham plastic Newtonian
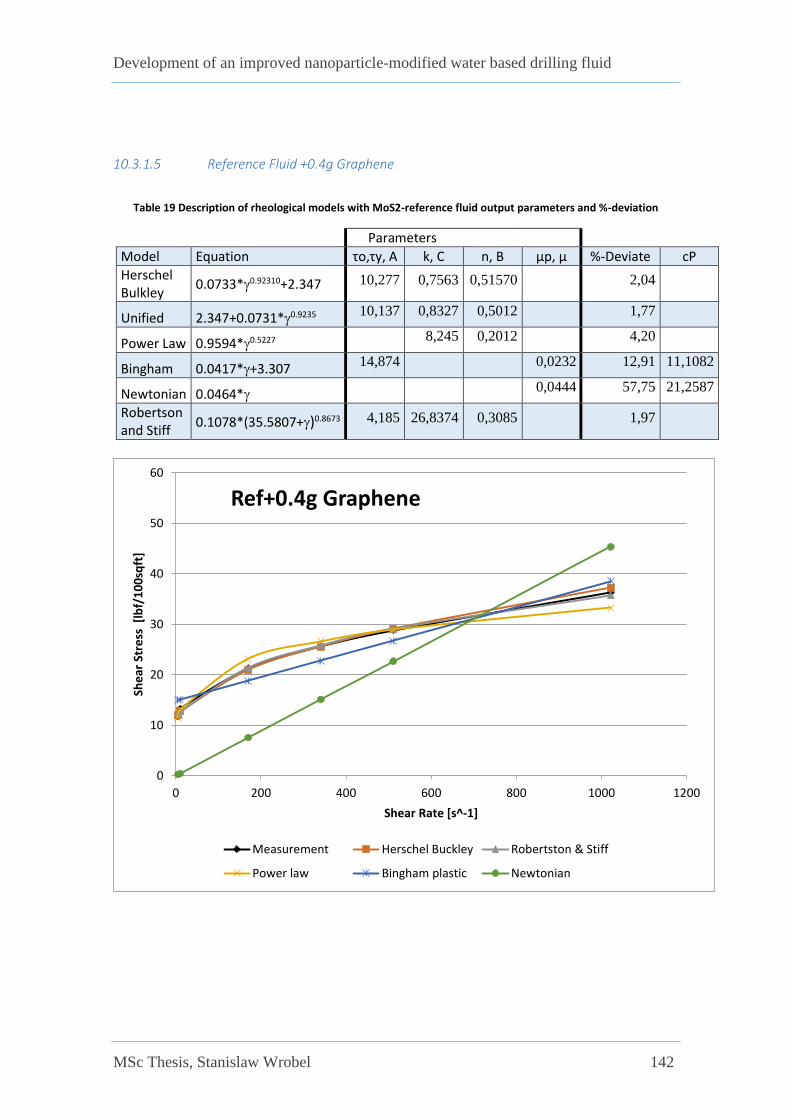
Development of an improved nanoparticle-modified water based drilling fluid
MSc Thesis, Stanislaw Wrobel 142
10.3.1.5 Reference Fluid +0.4g Graphene
Table 19 Description of rheological models with MoS2-reference fluid output parameters and %-deviation
Parameters
Model Equation τo,τy, A k, C n, B μp, μ %-Deviate cP
Herschel Bulkley
0.0733*0.92310+2.347 10,277 0,7563 0,51570
2,04
Unified 2.347+0.0731*0.9235 10,137 0,8327 0,5012
1,77
Power Law 0.9594*0.5227 8,245 0,2012
4,20
Bingham 0.0417*+3.307 14,874
0,0232 12,91 11,1082
Newtonian 0.0464* 0,0444 57,75 21,2587
Robertson and Stiff
0.1078*(35.5807+)0.8673 4,185 26,8374 0,3085
1,97
0
10
20
30
40
50
60
0 200 400 600 800 1000 1200
She
ar S
tre
ss [
lbf/
10
0sq
ft]
Shear Rate [s^-1]
Ref+0.4g Graphene
Measurement Herschel Buckley Robertston & Stiff
Power law Bingham plastic Newtonian
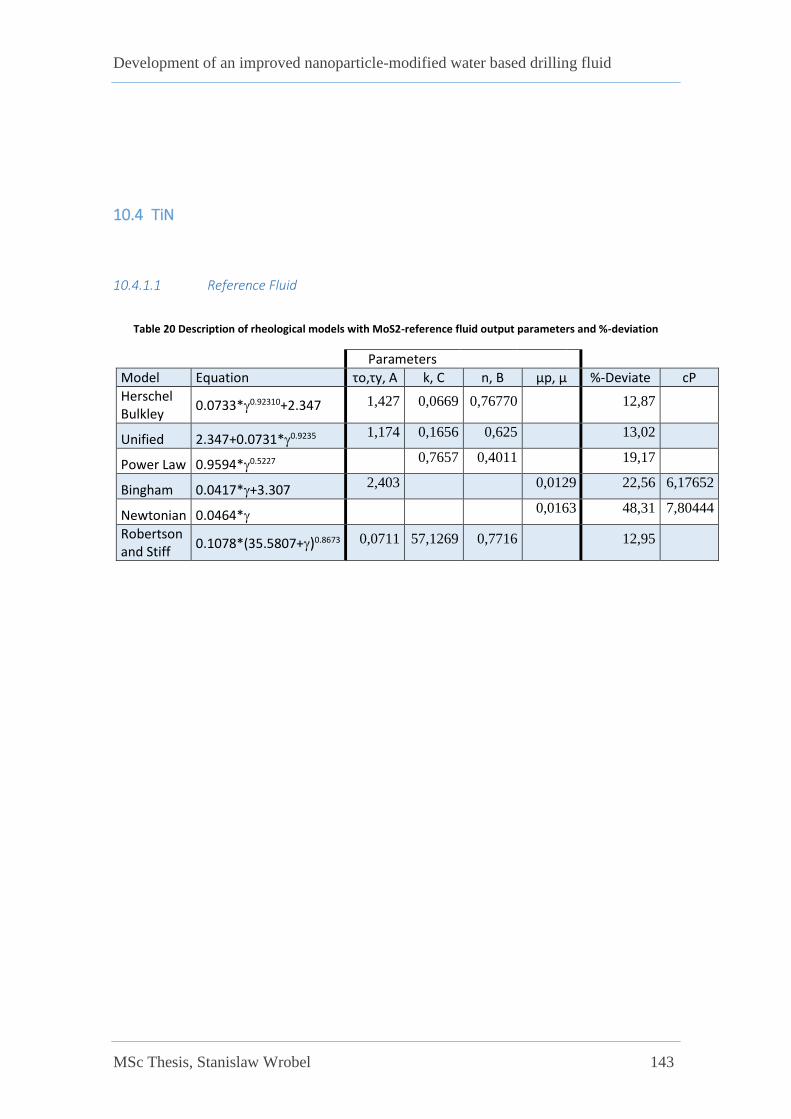
Development of an improved nanoparticle-modified water based drilling fluid
MSc Thesis, Stanislaw Wrobel 143
10.4 TiN
10.4.1.1 Reference Fluid
Table 20 Description of rheological models with MoS2-reference fluid output parameters and %-deviation
Parameters
Model Equation τo,τy, A k, C n, B μp, μ %-Deviate cP
Herschel Bulkley
0.0733*0.92310+2.347 1,427 0,0669 0,76770
12,87
Unified 2.347+0.0731*0.9235 1,174 0,1656 0,625
13,02
Power Law 0.9594*0.5227 0,7657 0,4011
19,17
Bingham 0.0417*+3.307 2,403
0,0129 22,56 6,17652
Newtonian 0.0464* 0,0163 48,31 7,80444
Robertson and Stiff
0.1078*(35.5807+)0.8673 0,0711 57,1269 0,7716
12,95
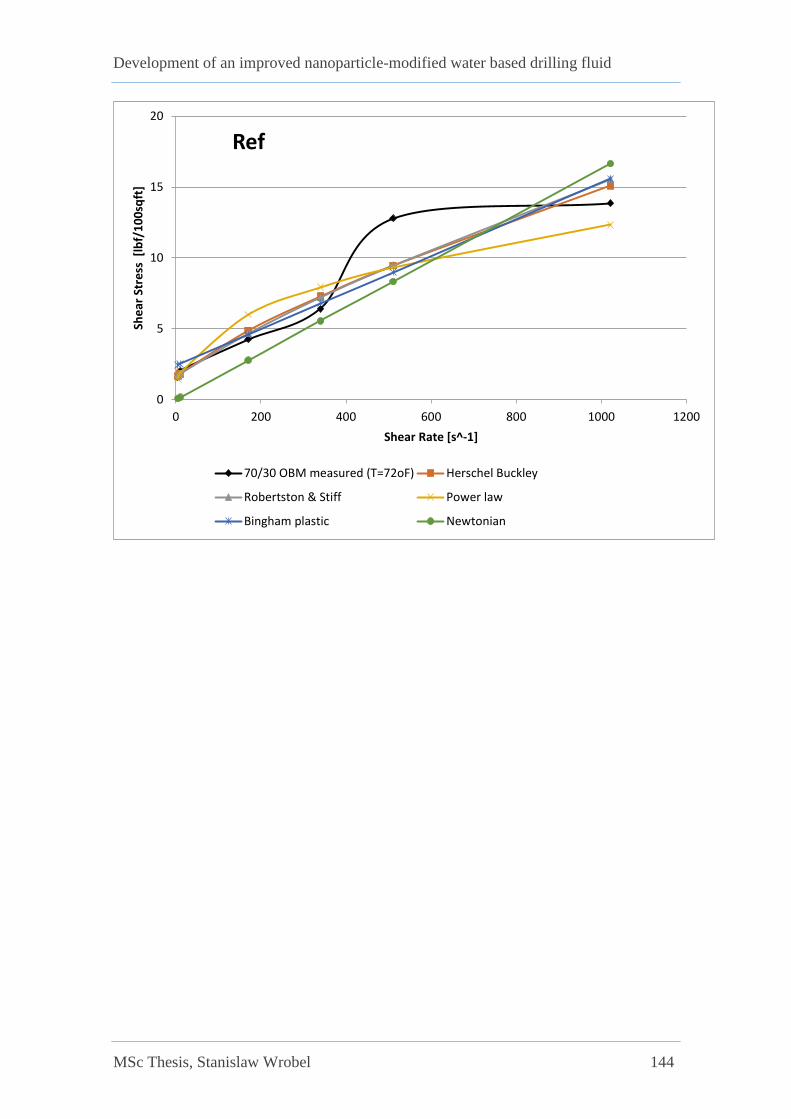
Development of an improved nanoparticle-modified water based drilling fluid
MSc Thesis, Stanislaw Wrobel 144
0
5
10
15
20
0 200 400 600 800 1000 1200
She
ar S
tre
ss [
lbf/
10
0sq
ft]
Shear Rate [s^-1]
Ref
70/30 OBM measured (T=72oF) Herschel Buckley
Robertston & Stiff Power law
Bingham plastic Newtonian

Development of an improved nanoparticle-modified water based drilling fluid
MSc Thesis, Stanislaw Wrobel 145
10.4.1.2 Reference Fluid +0.1g TiN
Table 21 Description of rheological models with MoS2-reference fluid output parameters and %-deviation
Parameters
Model Equation τo,τy, A k, C n, B μp, μ %-Deviate cP
Herschel Bulkley
0.0733*0.92310+2.347 1,279 0,1398 0,65520
4,59
Unified 2.347+0.0731*0.9235 1,067 0,2354 0,5743
5,70
Power Law 0.9594*0.5227 0,8194 0,3922
8,63
Bingham 0.0417*+3.307 2,390
0,0127 16,86 6,08076
Newtonian 0.0464* 0,0161 46,96 7,70868
Robertson and Stiff
0.1078*(35.5807+)0.8673 0,2543 22,8380 0,5778
5,48
0
5
10
15
20
0 200 400 600 800 1000 1200
She
ar S
tre
ss [
lbf/
10
0sq
ft]
Shear Rate [s^-1]
Ref+0.1g TiN
Measurement Herschel Buckley Robertston & Stiff
Power law Bingham plastic Newtonian
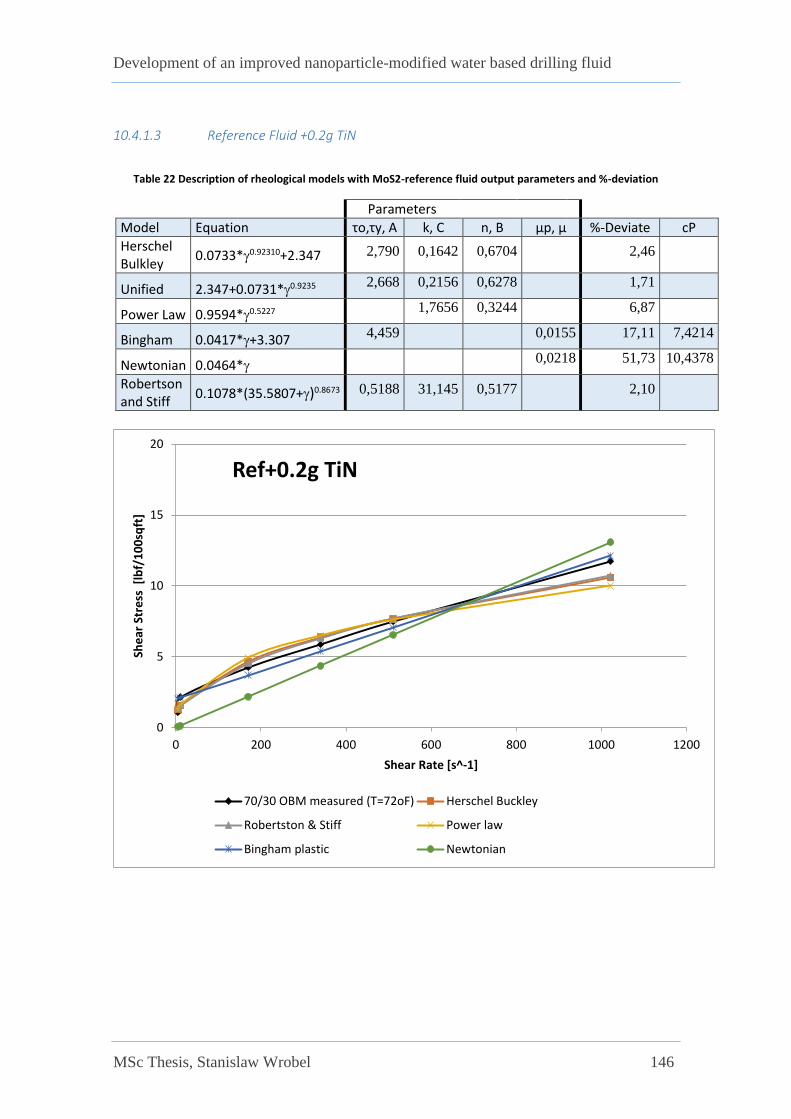
Development of an improved nanoparticle-modified water based drilling fluid
MSc Thesis, Stanislaw Wrobel 146
10.4.1.3 Reference Fluid +0.2g TiN
Table 22 Description of rheological models with MoS2-reference fluid output parameters and %-deviation
Parameters
Model Equation τo,τy, A k, C n, B μp, μ %-Deviate cP
Herschel Bulkley
0.0733*0.92310+2.347 2,790 0,1642 0,6704
2,46
Unified 2.347+0.0731*0.9235 2,668 0,2156 0,6278
1,71
Power Law 0.9594*0.5227 1,7656 0,3244
6,87
Bingham 0.0417*+3.307 4,459
0,0155 17,11 7,4214
Newtonian 0.0464* 0,0218 51,73 10,4378
Robertson and Stiff
0.1078*(35.5807+)0.8673 0,5188 31,145 0,5177
2,10
0
5
10
15
20
0 200 400 600 800 1000 1200
She
ar S
tre
ss [
lbf/
10
0sq
ft]
Shear Rate [s^-1]
Ref+0.2g TiN
70/30 OBM measured (T=72oF) Herschel Buckley
Robertston & Stiff Power law
Bingham plastic Newtonian

Development of an improved nanoparticle-modified water based drilling fluid
MSc Thesis, Stanislaw Wrobel 147
10.4.1.4 Reference Fluid +0.3g TiN
Table 23 Description of rheological models with MoS2-reference fluid output parameters and %-deviation
Parameters
Model Equation τo,τy, A k, C n, B μp, μ %-Deviate cP
Herschel Bulkley
0.0733*0.92310+2.347 1,279 0,1379 0,66350
3,72
Unified 2.347+0.0731*0.9235 1,067 0,2322 0,5824
4,38
Power Law 0.9594*0.5227 0,8097 0,3993
7,39
Bingham 0.0417*+3.307 2,527
0,0128 20,38 6,12864
Newtonian 0.0464* 0,0164 48,28 7,85232
Robertson and Stiff
0.1078*(35.5807+)0.8673 0,2467 22,8380 0,5877
4,49
0
5
10
15
20
0 200 400 600 800 1000 1200
She
ar S
tre
ss [
lbf/
10
0sq
ft]
Shear Rate [s^-1]
Ref+0.3g TiN
Measurement Herschel Buckley Robertston & Stiff
Power law Bingham plastic Newtonian
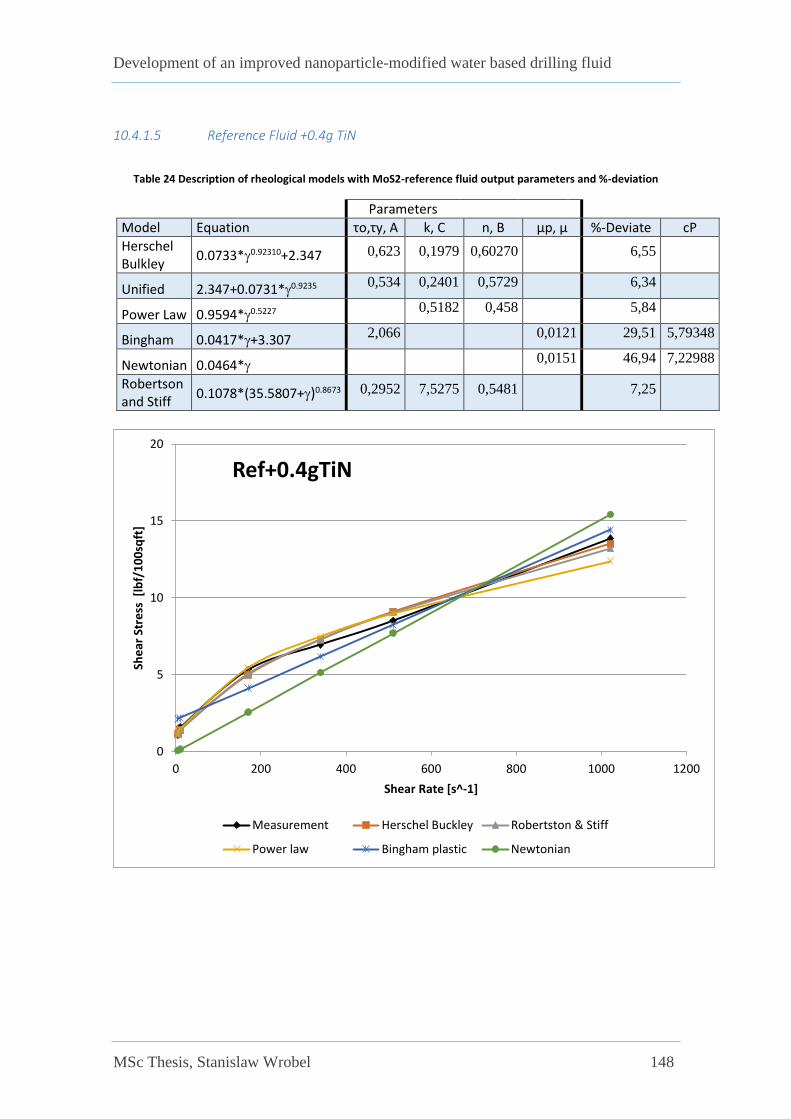
Development of an improved nanoparticle-modified water based drilling fluid
MSc Thesis, Stanislaw Wrobel 148
10.4.1.5 Reference Fluid +0.4g TiN
Table 24 Description of rheological models with MoS2-reference fluid output parameters and %-deviation
Parameters
Model Equation τo,τy, A k, C n, B μp, μ %-Deviate cP
Herschel Bulkley
0.0733*0.92310+2.347 0,623 0,1979 0,60270
6,55
Unified 2.347+0.0731*0.9235 0,534 0,2401 0,5729
6,34
Power Law 0.9594*0.5227 0,5182 0,458
5,84
Bingham 0.0417*+3.307 2,066
0,0121 29,51 5,79348
Newtonian 0.0464* 0,0151 46,94 7,22988
Robertson and Stiff
0.1078*(35.5807+)0.8673 0,2952 7,5275 0,5481
7,25
0
5
10
15
20
0 200 400 600 800 1000 1200
She
ar S
tre
ss [
lbf/
10
0sq
ft]
Shear Rate [s^-1]
Ref+0.4gTiN
Measurement Herschel Buckley Robertston & Stiff
Power law Bingham plastic Newtonian
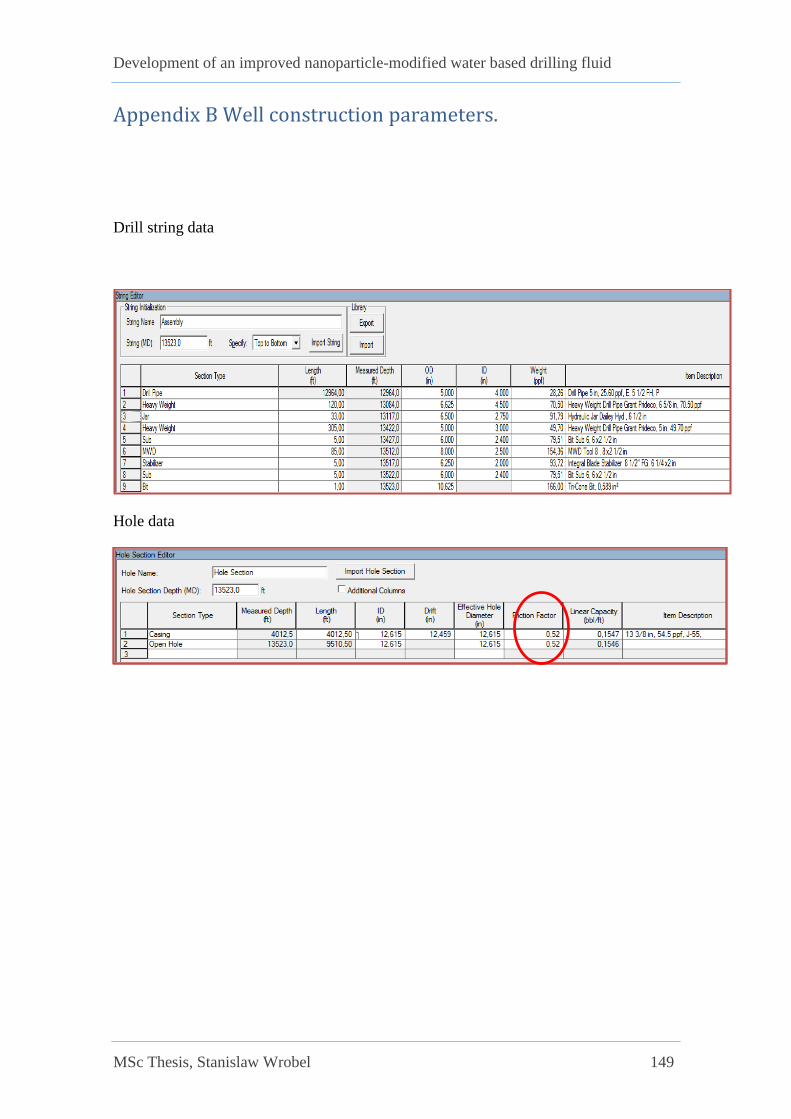
Development of an improved nanoparticle-modified water based drilling fluid
MSc Thesis, Stanislaw Wrobel 149
Appendix B Well construction parameters.
Drill string data
Hole data
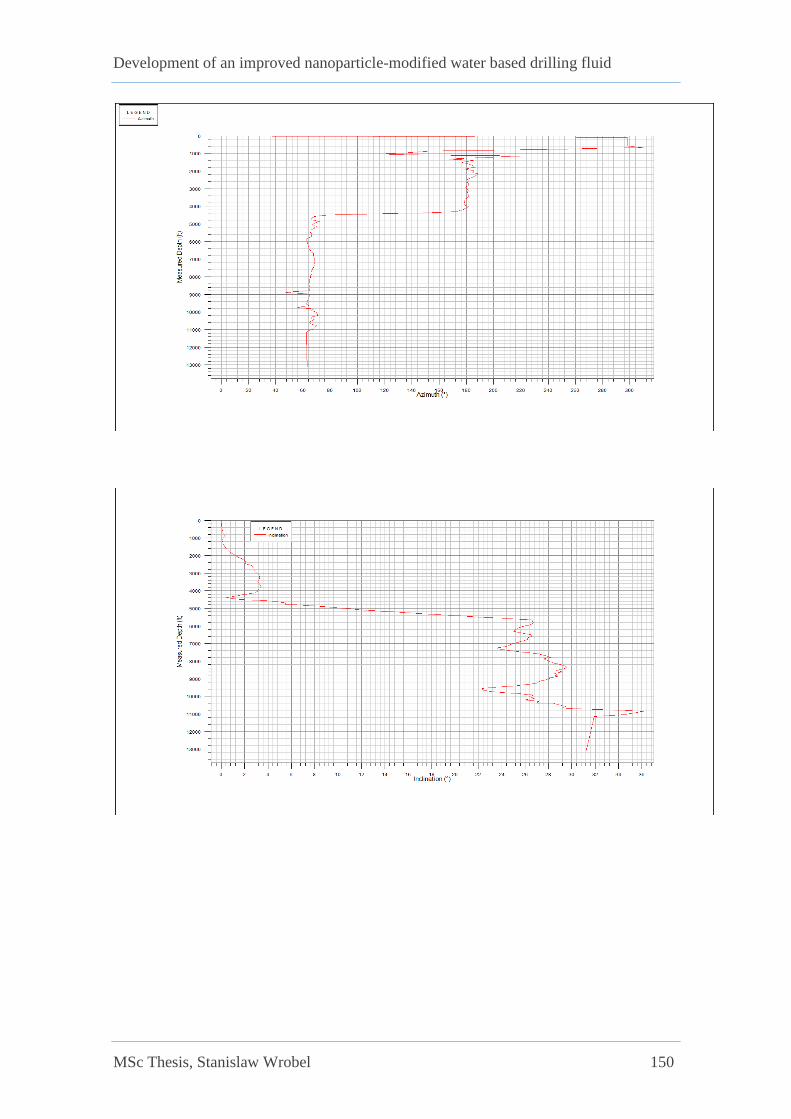
Development of an improved nanoparticle-modified water based drilling fluid
MSc Thesis, Stanislaw Wrobel 150

Development of an improved nanoparticle-modified water based drilling fluid
MSc Thesis, Stanislaw Wrobel 151
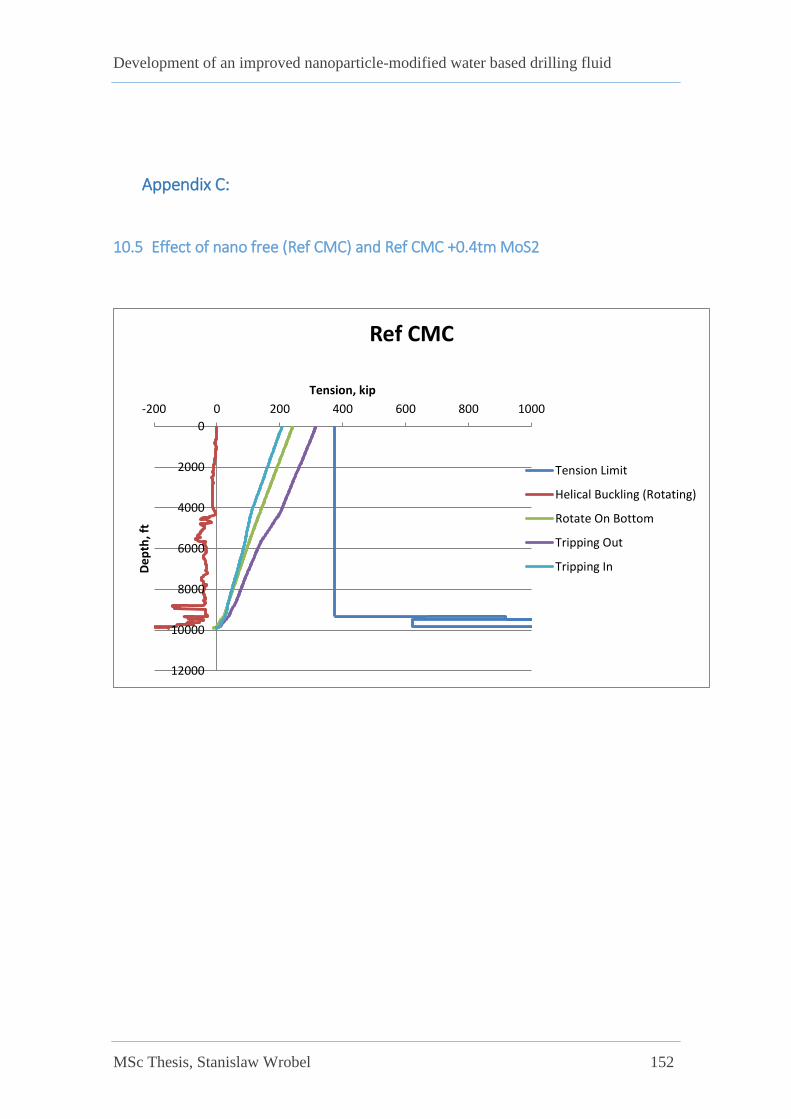
Development of an improved nanoparticle-modified water based drilling fluid
MSc Thesis, Stanislaw Wrobel 152
Appendix C:
10.5 Effect of nano free (Ref CMC) and Ref CMC +0.4tm MoS2
0
2000
4000
6000
8000
10000
12000
-200 0 200 400 600 800 1000
De
pth
, ft
Tension, kip
Ref CMC
Tension Limit
Helical Buckling (Rotating)
Rotate On Bottom
Tripping Out
Tripping In

Development of an improved nanoparticle-modified water based drilling fluid
MSc Thesis, Stanislaw Wrobel 153
0
2000
4000
6000
8000
10000
12000
0 10000 20000
De
pth
, ft
Torque, ft-lbf
Ref CMC
Torque Limit
Rotate On Bottom
Tripping Out
Tripping In
0
2000
4000
6000
8000
10000
12000
14000
0 10000 20000
De
pth
, ft
Torque, ft-lbf
Ref CMC +0.4gm MoS2
Torque Limit
Rotate On Bottom
Tripping Out
Tripping In

Development of an improved nanoparticle-modified water based drilling fluid
MSc Thesis, Stanislaw Wrobel 154
0
2000
4000
6000
8000
10000
12000
0 10000 20000 30000 40000 50000 60000 70000 80000
De
pth
, ft
Stress, psi
Ref CMC
Stress Limit
VonMises
0
3000
6000
9000
12000
-250 -50 150 350
De
pth
, ft
Tension, kip
Ref CMC +0.4gm MoS2
Tension Limit
Helical Buckling (Rotating)
Rotate On Bottom
Tripping Out
Tripping In

Development of an improved nanoparticle-modified water based drilling fluid
MSc Thesis, Stanislaw Wrobel 155
10.6 Effect of nano free (Ref XG) and Ref XG +0.1tm Graphene
0
2000
4000
6000
8000
10000
12000
14000
0 10000 20000
De
pth
, ft
Torque, ft-lbf
Ref CMC +0.4gm MoS2
Torque Limit
Rotate On Bottom
Tripping Out
Tripping In
0
2000
4000
6000
8000
10000
12000
14000
0 10000 20000 30000 40000 50000 60000 70000 80000
De
pth
, ft
Stress, psi
Ref CMC +0.4gm MoS2
Stress Limit
VonMises

Development of an improved nanoparticle-modified water based drilling fluid
MSc Thesis, Stanislaw Wrobel 156
0
2000
4000
6000
8000
10000
12000
14000
-200 0 200 400
De
pth
, ft
Tension, kip
Ref XG
Tension Limit
Helical Buckling (Rotating)
Rotate On Bottom
Tripping Out
Tripping In

Development of an improved nanoparticle-modified water based drilling fluid
MSc Thesis, Stanislaw Wrobel 157
0
2000
4000
6000
8000
10000
12000
14000
0 10000 20000
De
pth
, ft
Torque, ft-lbf
Ref XG
Torque Limit
Rotate On Bottom
Tripping Out
Tripping In
0
2000
4000
6000
8000
10000
12000
14000
0 20000 40000 60000 80000
De
pth
, ft
Stress, psi
Ref XG
Stress Limit
VonMises
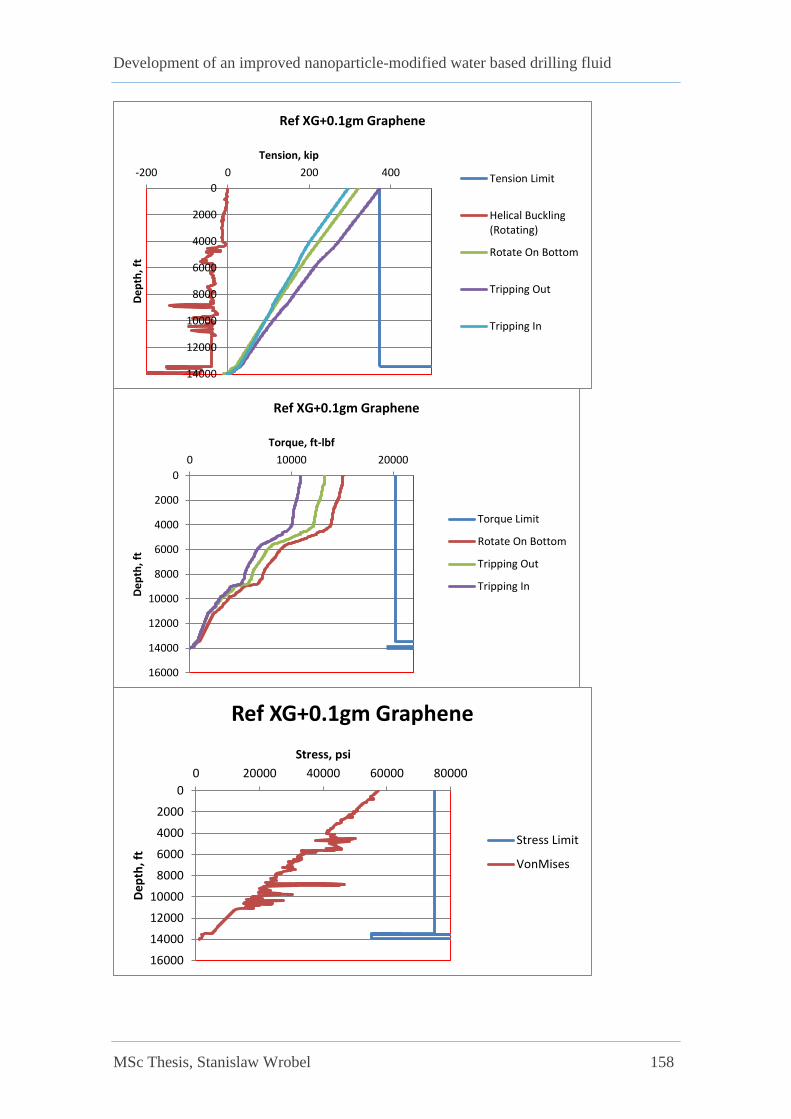
Development of an improved nanoparticle-modified water based drilling fluid
MSc Thesis, Stanislaw Wrobel 158
0
2000
4000
6000
8000
10000
12000
14000
-200 0 200 400
De
pth
, ft
Tension, kip
Ref XG+0.1gm Graphene
Tension Limit
Helical Buckling(Rotating)
Rotate On Bottom
Tripping Out
Tripping In
0
2000
4000
6000
8000
10000
12000
14000
16000
0 10000 20000
De
pth
, ft
Torque, ft-lbf
Ref XG+0.1gm Graphene
Torque Limit
Rotate On Bottom
Tripping Out
Tripping In
0
2000
4000
6000
8000
10000
12000
14000
16000
0 20000 40000 60000 80000
De
pth
, ft
Stress, psi
Ref XG+0.1gm Graphene
Stress Limit
VonMises

Development of an improved nanoparticle-modified water based drilling fluid
MSc Thesis, Stanislaw Wrobel 159
Ref CMCRef CMC +0.4g
MoS2% Increase
Series1 9900 12500 26,3
0
2000
4000
6000
8000
10000
12000
14000
Max
imu
m d
rilli
ng
de
pth
, ft
Ref XGRef XG +0.1gm
Graphene% Increase
Series1 13000 14000 7,7
0
2000
4000
6000
8000
10000
12000
14000
16000
Max
imu
m d
rilli
ng
de
pth
, ft
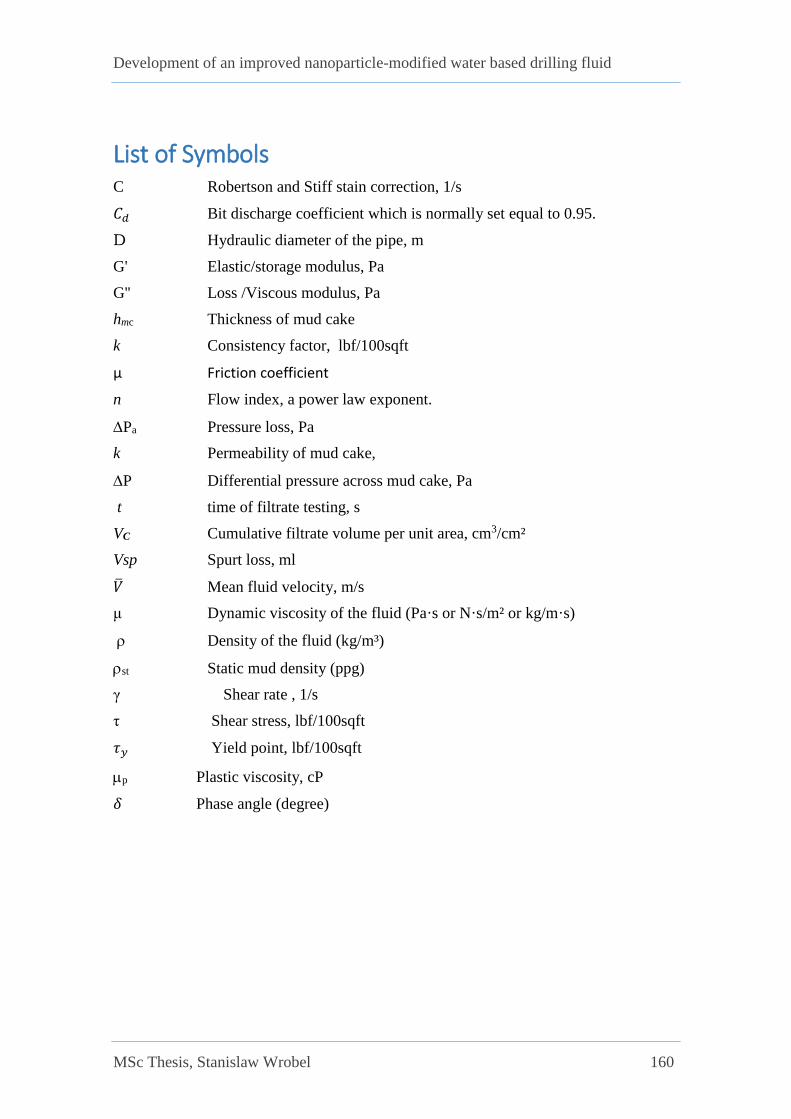
Development of an improved nanoparticle-modified water based drilling fluid
MSc Thesis, Stanislaw Wrobel 160
List of Symbols C Robertson and Stiff stain correction, 1/s
𝐶𝑑 Bit discharge coefficient which is normally set equal to 0.95.
D Hydraulic diameter of the pipe, m
G' Elastic/storage modulus, Pa
G'' Loss /Viscous modulus, Pa
hmc Thickness of mud cake
k Consistency factor, lbf/100sqft
µ Friction coefficient
n Flow index, a power law exponent.
Pa Pressure loss, Pa
k Permeability of mud cake,
P Differential pressure across mud cake, Pa
t time of filtrate testing, s
VC Cumulative filtrate volume per unit area, cm3/cm²
Vsp Spurt loss, ml
�̅� Mean fluid velocity, m/s
μ Dynamic viscosity of the fluid (Pa·s or N·s/m² or kg/m·s)
Density of the fluid (kg/m³)
st Static mud density (ppg)
γ Shear rate , 1/s
τ Shear stress, lbf/100sqft
𝜏𝑦 Yield point, lbf/100sqft
p Plastic viscosity, cP
𝛿 Phase angle (degree)
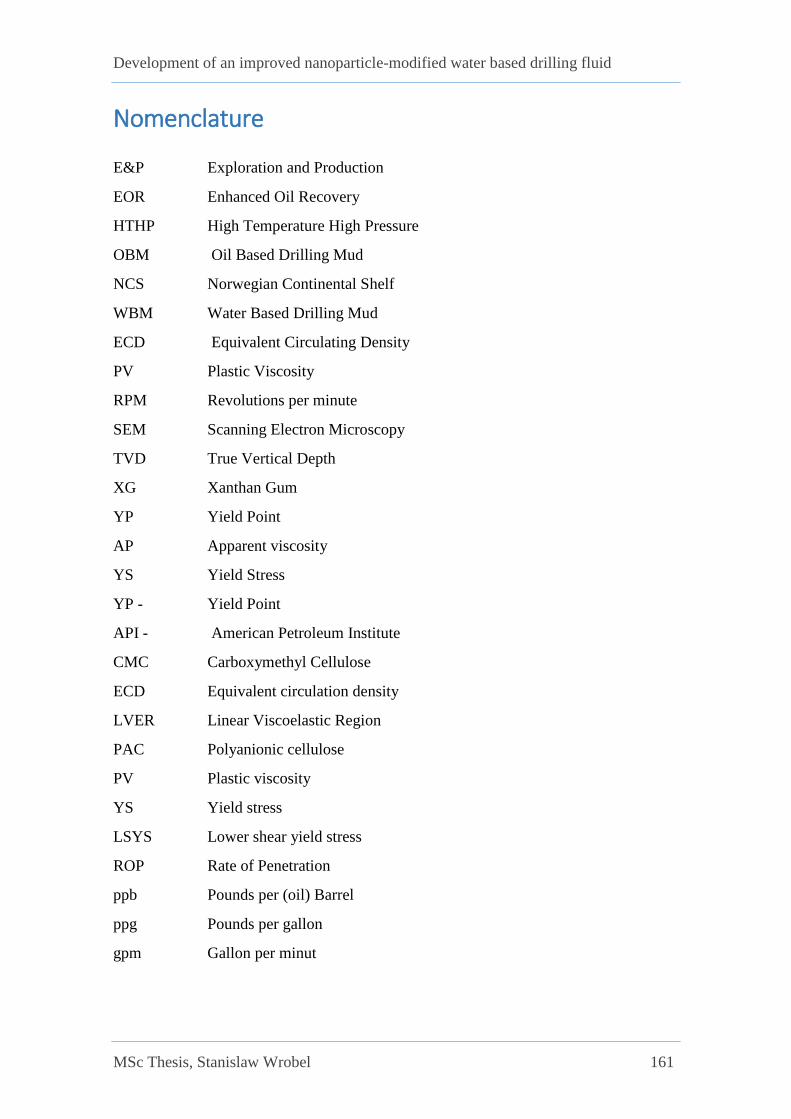
Development of an improved nanoparticle-modified water based drilling fluid
MSc Thesis, Stanislaw Wrobel 161
Nomenclature
E&P Exploration and Production
EOR Enhanced Oil Recovery
HTHP High Temperature High Pressure
OBM Oil Based Drilling Mud
NCS Norwegian Continental Shelf
WBM Water Based Drilling Mud
ECD Equivalent Circulating Density
PV Plastic Viscosity
RPM Revolutions per minute
SEM Scanning Electron Microscopy
TVD True Vertical Depth
XG Xanthan Gum
YP Yield Point
AP Apparent viscosity
YS Yield Stress
YP - Yield Point
API - American Petroleum Institute
CMC Carboxymethyl Cellulose
ECD Equivalent circulation density
LVER Linear Viscoelastic Region
PAC Polyanionic cellulose
PV Plastic viscosity
YS Yield stress
LSYS Lower shear yield stress
ROP Rate of Penetration
ppb Pounds per (oil) Barrel
ppg Pounds per gallon
gpm Gallon per minut
List of Figures
Figure 1-1 : Description of the ECD window [2] ............................................................. 8
Figure 1-2 Prognosis stability plot for a typical Heidrun TLP well [3] ........................... 9
Figure 1-3 Overview of thesis methodology .................................................................. 11
Figure 2-1 Lost circulation formations [18] ................................................................... 12
Figure 2-2 Four-tiered strategy consisting of both prevention and remediation measures
for lost circulation [2] ..................................................................................................... 13
Figure 2-3 Sketch of loose formation ............................................................................. 14
Figure 2-4 Sketch of reactive shale ................................................................................ 15
Figure 2-5 Mud cake formation and invasion of spurt loss through a permeable
formation [10] ................................................................................................................. 15
Figure 2-6 Illustration of montmorillonite layer structure [12] ...................................... 16
Figure 2-7 Arrangement of clay particles in drilling fluid ............................................. 18
Figure 2-8 Polymers structures: linear, branched and crosslinked ................................. 19
Figure 2-9 Structure of Sodium CMC [14] .................................................................... 20
Figure 2-10 Structure of PAC [16] ................................................................................. 20
Figure 2-11 Structure of CMC (a) Only CMC (b) CMC + Salt [ [15] ........................ 21
Figure 3-1 Rheological models illustrating typical behaviour for each model [20] ....... 23
Figure 3-2 Entities of fluid circulation system with different diameters ........................ 27
Figure 3-3 Periodic oscillations illustrated by two plate model [25] ............................. 30
Figure 3-4 Viscous and elastic responses to an applied strain. Graph to left showing the
stress (solid line) and strain (dashed line) are 90° out of phase. Graph to right showing
the two lines in phase [25] .............................................................................................. 30
Figure 3-5 An illustration of amplitude test ................................................................... 32
Figure 3-6 Loads on the segmented drill string .............................................................. 34
Figure 4-1 Illustration of Fann35 viscometer ................................................................. 37

Development of an improved nanoparticle-modified water based drilling fluid
MSc Thesis, Stanislaw Wrobel 2
Figure 4-2 Filtrate loss measurement system ................................................................. 38
Figure 4-3 Picture of Orion pH meter model 201 .......................................................... 39
Figure 4-4 CSM DIN 50324 Tribometer with nano-fluid lubricant ............................... 39
Figure 4-5 Illustration of the Anton Paar MCR 301 Rheometer .................................... 40
Figure 4-6 Morphology of MoS2 particles – SEM photograph. ..................................... 42
Figure 4-7 Rheology measurements for drilling fluid system containing MoS2 ............ 43
Figure 4-8 Presentation of PV, YS and LSYS results based on rheology measurements
for MoS2 drilling fluid system ........................................................................................ 45
Figure 4-9 Consistency index(k) and n-value for MoS2 at different temperatures. ....... 45
Figure 4-10 Diagram and data for filtrate loss of drilling fluid system containing MoS2
........................................................................................................................................ 46
Figure 4-11 Rheology modelling for MoS2 reference fluid with relatively bad model
predictability ................................................................................................................... 48
Figure 4-12 Rheology modelling for MoS2 reference fluid with relatively good model
predictability ................................................................................................................... 48
Figure 4-13 Testing panel of Tribometer ....................................................................... 51
Figure 4-14 Friction Coefficient vs time for MoS2 - 22°C ............................................. 52
Figure 4-15 Mean Friction Coefficients for MoS2 at 22°C ............................................ 52
Figure 4-16 Friction Coefficient vs time for MoS2 - 55°C ............................................. 53
Figure 4-17 Mean Friction Coefficients for MoS2 at 55°C ............................................ 53
Figure 4-18 Friction Coefficient vs time for MoS2 - 70°C ............................................. 54
Figure 4-19 Mean Friction Coefficients for MoS2 at 70°C ............................................ 54
Figure 4-20 Mean Friction Coefficiens vs temperature with trendline for MoS2 .......... 56
Figure 4-21 SEM picture of TiO2 where a grain size is about ~20nm [31] ................... 57
Figure 4-22 Viscometer response of drilling fluid system containing nano-sized Rutile-
TiO2 ................................................................................................................................ 58
Development of an improved nanoparticle-modified water based drilling fluid
MSc Thesis, Stanislaw Wrobel 3
Figure 4-23 Presentation of PV, YS and LSYS results based on rheology measurements
of nanosized Rutile-TiO2 fluid ....................................................................................... 59
Figure 4-24 Consistency Index(k) and n-value for TiO2 at different temperatures. ....... 60
Figure 4-25 Diagram and data for filtrate loss of drilling fluid system containing TiO2 61
Figure 4-26 Friction coefficient tribometer measurement as a function of time - TiO2
Rutile 22°C ..................................................................................................................... 64
Figure 4-27 Mean Friction Coefficients for TiO2 at 22°C ............................................. 64
Figure 4-28 Friction coefficient tribometer measurement as a function of time - TiO2
Rutile 55°C ..................................................................................................................... 65
Figure 4-29 Mean Friction Coefficients for TiO2 at 55°C ............................................. 65
Figure 4-30 Friction coefficient tribometer measurement as a function of time - TiO2
Rutile 70°C ..................................................................................................................... 66
Figure 4-31 Mean Friction Coefficients for MoS2 at 70°C ........................................... 66
Figure 4-32 Mean Friction Coefficiens vs temperature with trendline for TiO2 ............ 68
Figure 4-33 Illustration of graphene lattice [32] ............................................................ 69
Figure 4-34 SEM picture of Graphene [33] ................................................................... 69
Figure 4-35 Rheology measurements for drilling fluid system containing Graphene ... 71
Figure 4-36 Presentation of PV, YS and LSYS results based on rheology measurements
for Graphene added fluid system .................................................................................... 72
Figure 4-37 Consistency index(k) and flow index n - Graphene fluid systems ............. 73
Figure 4-38 Diagram and data for filtrate loss of drilling fluid system containing
Graphene ......................................................................................................................... 73
Figure 4-39 Friction coefficient tribometer measurement as a function of time -
Graphene 22°C ............................................................................................................... 77
Figure 4-40 Mean Friction Coefficients for Graphene at 22°C ...................................... 77
Figure 4-41 Friction coefficient tribometer measurement as a function of time -
Graphene 55°C ............................................................................................................... 78

Development of an improved nanoparticle-modified water based drilling fluid
MSc Thesis, Stanislaw Wrobel 4
Figure 4-42 Mean Friction Coefficients for Graphene at 55°C ...................................... 78
Figure 4-43 Friction coefficient tribometer measurement as a function of time -
Graphene 70°C ............................................................................................................... 79
Figure 4-44 Mean Friction Coefficients for Graphene at 70°C ...................................... 79
Figure 4-45 Mean Friction Coefficiens vs temperature with trendline for Graphene .... 81
Figure 4-46 SEM photograph of TiN particles. [34] ..................................................... 82
Figure 4-47 Rheology measurements for drilling fluid system containing TiN............. 84
Figure 4-48 Presentation of PV, YS and LSYS results based on rheology measurements
for TiN added fluid system ............................................................................................. 85
Figure 4-49 Consistency index(k) and n-value for TiN fluid systems at different
temperatures.................................................................................................................... 86
Figure 4-50 Diagram and data for filtrate loss of drilling fluid system containing TiN2 86
Figure 4-51 Friction coefficient tribometer measurement as a function of time for TiN
22°C ................................................................................................................................ 90
Figure 4-52 Mean Friction Coefficients for TiN at 22°C ............................................... 90
Figure 4-53 Friction coefficient tribometer measurement as a function of time for TiN
55°C ................................................................................................................................ 91
Figure 4-54 Mean Friction Coefficients for TiN at 55°C ............................................... 91
Figure 4-55 Friction coefficient tribometer measurement as a function of time for TiN
70°C ................................................................................................................................ 92
Figure 4-56 Mean Friction Coefficients for TiN at 70°C ............................................... 92
Figure 4-57 Mean Friction Coefficiens vs temperature with trendline for TiN ............. 94
Figure 4-58 Shear stress absorbed vs phase angle – MoS2 fluids .................................. 95
Figure 4-59 Flow point comparison for MoS2 added system ......................................... 96
Figure 4-60 Shear stress absorbed vs phase angle - Graphene ....................................... 96
Figure 4-61 Flow point comparison for Graphene added system .................................. 97
Figure 5-1 Sketch of hydraulic simulation well ............................................................. 99

Development of an improved nanoparticle-modified water based drilling fluid
MSc Thesis, Stanislaw Wrobel 5
Figure 5-2 ECD of the drilling fluid systems including Graphene from the
Unified hydraulics model ..................................................................................... 100
Figure 5-3 Total pressure loss of the fluid systems for graphene from the
Unified hydraulics model ..................................................................................... 101
Figure 5-4 Pump pressure %-deviation from reference for Graphene added fluids ..... 101
Figure 5-5 ECD of fluid systems including MoS2 nanoparticles ................ 102
Figure 5-6 Simulated pump pressure for MoS2 nanoparticles ..................... 103
Figure 5-7 Cutting transport analysis data .................................................................... 105
Figure 5-8 Simulation results illustrating drilling depth vs bed height with nanofree and
nanoadded Xantham Gum base fluid............................................................................ 106
Figure 5-9 Simulation results illustrating drilling depth vs bed height with nanofree and
nanoadded CMC base fluid. ......................................................................................... 106
Figure 6-1 ERD envelope of drilled wells [38] ............................................................ 107
Figure 6-2 Drilling and tripping simulation parameters ............................................... 109
Figure 6-3 Drilling simulation setup ............................................................................ 110
Figure 6-4 Drilling and Tripping loads with nano free -reference drilling fluid (Ref
CMC) ............................................................................................................................ 113
Figure 6-5 Drilling and Tripping loads with nano treared drilling fluid (Ref
CMC+0.4gm MoS2) ..................................................................................................... 113
Figure 6-6 Torque loads with nano-free reference drilling fluid (Ref CMC) .............. 114
Figure 6-7 Torque loads with nano treated drilling fluid (Ref CMC+0.4gm MoS2) ... 114

Development of an improved nanoparticle-modified water based drilling fluid
MSc Thesis, Stanislaw Wrobel 6
List of Tables
Table 3-1 Rheological and hydraulics equations for Unified model [21] ...................... 28
Table 4-1 Test matrix for nanosized MoS2 in drilling fluid system ............................... 43
Table 4-2 pH measurements of MoS2 ............................................................................ 47
Table 4-3 Description of rheological models with MoS2-reference fluid output
parameters and %-deviation ........................................................................................... 47
Table 4-4 Rheology model parameters and percentage deviation from the reference fluid
– MoS2. ........................................................................................................................... 49
Table 4-5 µ-%Change associated with reference for MoS2 ........................................... 55
Table 4-6 Models for mean friction coefficient data as a function of temperature for
MoS2 added drilling fluid systems ................................................................................. 55
Table 4-7 Test matrix for nanosized Rutile-TiO2 drilling fluid system .......................... 58
Table 4-8 pH measurements for TiO2 ............................................................................ 61
Table 4-9 Rheology model parameters and percentage deviation from the reference fluid
– TiO2. ............................................................................................................................ 62
Table 4-10 µ-%Change associated with reference for TiO2 ........................................... 67
Table 4-11 Models for mean friction coefficient data as a function of temperature for
TiO2 added drilling fluid systems ................................................................................... 67
Table 4-12 Test matrix for nano - Grapehene in base drilling fluid system ................... 70
Table 4-13 pH measurements for Graphene ................................................................... 74
Table 4-14 Rheology model parameters and percentage deviation from the reference
fluid – Graphene. ............................................................................................................ 75
Table 4-15 µ-%Change with respect to reference .......................................................... 80
Table 4-16 Models for mean friction coefficient data as a function of temperature for
Graphene added drilling fluid systems ........................................................................... 80
Table 4-17 Test matrix for drilling fluid system with added TiN .................................. 83
Development of an improved nanoparticle-modified water based drilling fluid
MSc Thesis, Stanislaw Wrobel 7
Table 4-18 pH measurements for TiN ............................................................................ 87
Table 4-19 Rheology model parameters and percentage deviation from the reference
fluid – TiN. ..................................................................................................................... 88
Table 4-20 µ-%Change associated with reference for TiN ............................................ 93
Table 4-21 Models for mean friction coefficient data as a function of temperature for
TiN added drilling fluid systems .................................................................................... 93
Table 5-1 Fann35 Rheometer data for Graphene and MoS2 with their reference fluids
...................................................................................................................................... 104
Table 6-1 Cofficients of frictions from experiments averaged for T&D simulation –
MoS2 ............................................................................................................................. 109
Table 6-2 Cofficients of frictions from experiments averaged for T&D simulation –
Graphene ....................................................................................................................... 109
Table 6-3 Comparison of Ref CMC and Ref CMC + 0.4g MoS2 drilling fluids on
maximum drilling length .............................................................................................. 111
Table 6-4 Comparison of Ref XG and Ref XG + 0.1g Graphene drilling fluids on
maximum drilling length .............................................................................................. 111
Table 5 Description of rheological models with MoS2-reference fluid output
parameters and %-deviation ....................................................................................... 127
Table 6 Description of rheological models with MoS2-reference fluid output
parameters and %-deviation ....................................................................................... 128
Table 7 Description of rheological models with MoS2-reference fluid output
parameters and %-deviation ....................................................................................... 129
Table 8 Description of rheological models with MoS2-reference fluid output
parameters and %-deviation ....................................................................................... 130
Table 9 Description of rheological models with MoS2-reference fluid output
parameters and %-deviation ....................................................................................... 131
Table 10 Description of rheological models with MoS2-reference fluid output
parameters and %-deviation ....................................................................................... 132

Development of an improved nanoparticle-modified water based drilling fluid
MSc Thesis, Stanislaw Wrobel 8
Table 11 Description of rheological models with MoS2-reference fluid output
parameters and %-deviation ....................................................................................... 134
Table 12 Description of rheological models with MoS2-reference fluid output
parameters and %-deviation ....................................................................................... 135
Table 13 Description of rheological models with MoS2-reference fluid output
parameters and %-deviation ....................................................................................... 136
Table 14 Description of rheological models with MoS2-reference fluid output
parameters and %-deviation ....................................................................................... 137
Table 15 Description of rheological models with MoS2-reference fluid output
parameters and %-deviation ....................................................................................... 138
Table 16 Description of rheological models with MoS2-reference fluid output
parameters and %-deviation ....................................................................................... 139
Table 17 Description of rheological models with MoS2-reference fluid output
parameters and %-deviation ....................................................................................... 140
Table 18 Description of rheological models with MoS2-reference fluid output
parameters and %-deviation ....................................................................................... 141
Table 19 Description of rheological models with MoS2-reference fluid output
parameters and %-deviation ....................................................................................... 142
Table 20 Description of rheological models with MoS2-reference fluid output
parameters and %-deviation ....................................................................................... 143
Table 21 Description of rheological models with MoS2-reference fluid output
parameters and %-deviation ....................................................................................... 145
Table 22 Description of rheological models with MoS2-reference fluid output
parameters and %-deviation ....................................................................................... 146
Table 23 Description of rheological models with MoS2-reference fluid output
parameters and %-deviation ....................................................................................... 147

Development of an improved nanoparticle-modified water based drilling fluid
MSc Thesis, Stanislaw Wrobel 9
Table 24 Description of rheological models with MoS2-reference fluid output
parameters and %-deviation ....................................................................................... 148


